christopher mcbride, v.p., trg - hfma...
TRANSCRIPT
1
“Bundled Payments—Getting it Right!”
Christopher McBride, V.P., TRG

2
TRG Overview
• Founded in 2001, Located in Denver, CO (Division
of Vizient)
• Clients include Physician Practices, Hospitals, and
Health Systems
• Key Focus is Physician-Hospital Alignment Higher Quality
Lower Cost
Better Patient Experience
• Have Been Involved in Every Medicare Bundled
Payment- Related Effort Since the “Participating
Centers of Excellence” in the 1990s
• Currently Working with Over 30 Hospitals and
60 Physician Groups in Models 2 and 4 of BPCI
as well as CJR

3
Today’s Topics
1. “Bundled Payments 101”
2. Payors and Bundled Payments—The 20+ Year Tango
3. BPCI—Bigger and Bolder than Anything Before
4. CJR—The Choice Isn’t Yours
5. The Future and Some Wise Words

4
• The Antithesis of “Per-Click”, “Fee-for-Service” Medicine
• A Method of Creating Transparency and Price Predictability
through Shifting Risk from Payer to Provider
Bundled Payments—Who, What, How?
Q: Average # of Claims
for a Total Joint
Surgery (MS DRG
#470) over a 90 day
episode?
Answer: 25

5
Air Travel in the Unbundled Age…
• Ticketing Fees
• Change Fees
• Checked Bag Fees
• Carry-On Fees
• Lavatory Fees (!!)
“What were once habits are now vices…”(with apologies to The Doobie Brothers)
“The study named United as the top
airline for producing ancillary revenue
in the world, estimating its annual haul
at $5.86 billion.”

6
Bundled Payment Success Story
“Fee Free”(40+ Years of Profitability—ONLY
Major US Airline to NEVER File for
Bankruptcy)
6

7
What’s the Magic Word?

8
At a Minimum, Bundled Payments Look to:
Create a Fixed and Predictable—Transparent— Reimbursement
per MS-DRG
Include all Hospital and Physician Services Rendered During an
MS-DRG LOS—including 72 Hours Prior for the Hospital and,
Increasingly, 90 Days Post-Discharge Inclusive of Many
Components
Eliminate Outlier Payments
Shift Risk for the Good, Bad, and Ugly to Providers
Payers
RISKProviders
Key Objectives of Bundled Payments

9
Volume to Value: CMS Announces Goals
Medicare move towards Alternate
Payment Models (ACO and
Bundles)
Year
30% 2016
50% 2018
Medicare payments tied to quality
or valueYear
85% 2016
90% 2018

10
What percent of system
revenue will be in value-
based agreements by 2020?
Source: 2015 Survey, MedAssets Healthcare Executive Forum
“Our first goal is for 30% of all Medicare provider
payments to be in alternative payment models that are
tied to how well providers care for their patients, instead
of how much care they provide – and to do it by 2016.
Our goal would then be to get to 50% by 2018.”
—Sylvia Mathews Burwell, HHS Secretary, January 26, 2015
>75%
<25%
26–49%
50–75%
Bye-Bye Fee-for-Service—It’s So ‘90s…
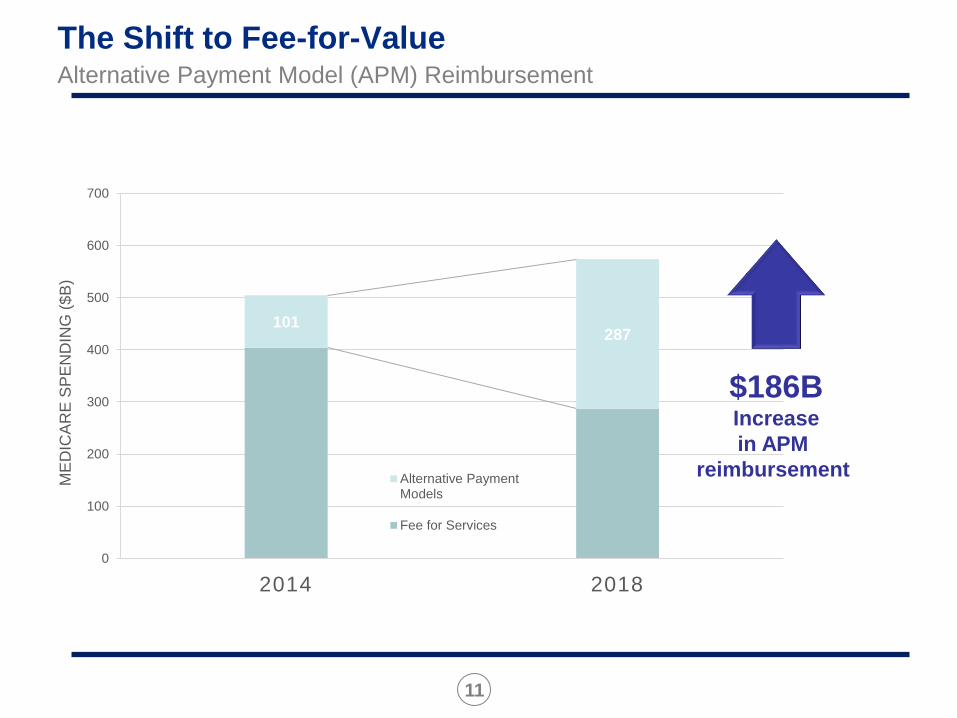
11
101287
0
100
200
300
400
500
600
700
2014 2018
ME
DIC
AR
E S
PE
ND
ING
($
B)
Alternative PaymentModels
Fee for Services
The Shift to Fee-for-ValueAlternative Payment Model (APM) Reimbursement
$186BIncrease
in APM
reimbursement

12
PAYORS AND BUNDLED PAYMENTS
The 20+ Year Tango
Then Why Haven’t
You Married Me?
Bundled
Payments…
¡Te Adoro!

13
The Father of Bundled Payments

14
“Of the many 'firsts' with which I have been involved at the Texas
Heart Institute —including the first successful human heart transplant
in the United States and the first total artificial heart transplant in the
world—the achievement that may have the greatest impact on health
care did not occur in the operating room or in the research
laboratory. It happened on a piece of paper... when we created the
first-ever packaged pricing plan for cardiovascular surgical
procedures.”
― Denton Cooley
You Heard It Here First

15
1991—Medicare Participating Heart Bypass Demonstration—Implemented
Medicare’s 20+ Years of Bundled Payment Demonstration Projects
“In the Beginning…”

16
St. Joseph’s Hospital of Atlanta
Methodist Hospital, Indianapolis
St. Luke’s Episcopal Hospital/THI, Houston
University Hospital, Boston
The Ohio State University Hospital, Columbus
St. Joseph Mercy Hospital, Ann Arbor
St. Vincent’s Hospital, Portland
Medicare’s 20+ Years of Bundled Payment Demonstration Projects
“In the Beginning…”
Medicare Participating Heart Bypass Demonstration Sites

17
Early Private Payor Bundled Initiatives
18
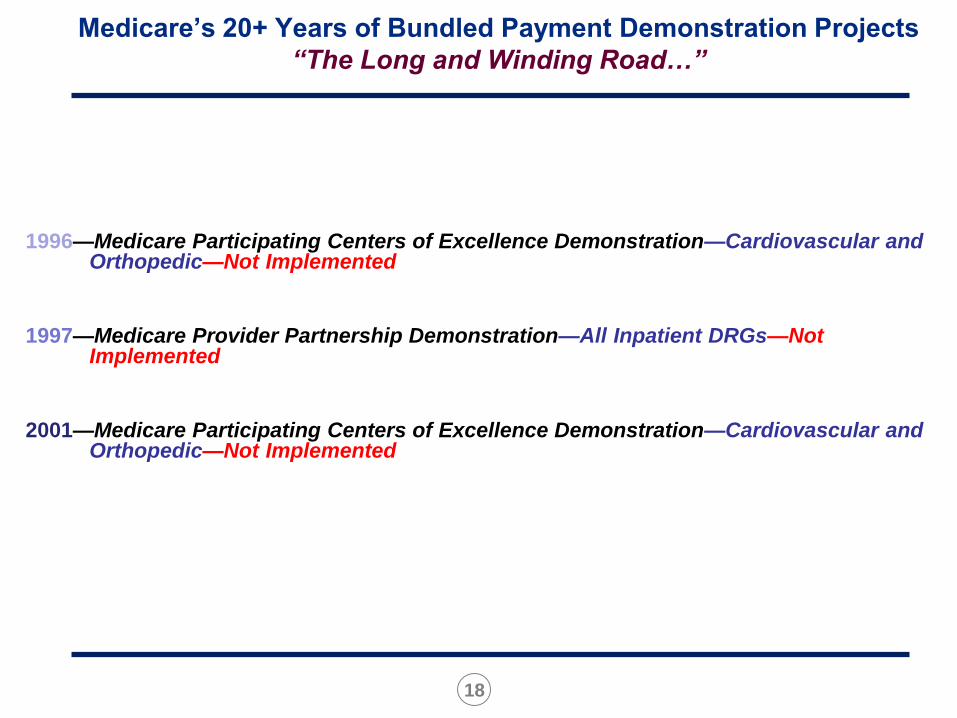
1996—Medicare Participating Centers of Excellence Demonstration—Cardiovascular and Orthopedic—Not Implemented
1997—Medicare Provider Partnership Demonstration—All Inpatient DRGs—Not Implemented
2001—Medicare Participating Centers of Excellence Demonstration—Cardiovascular and Orthopedic—Not Implemented
Medicare’s 20+ Years of Bundled Payment Demonstration Projects
“The Long and Winding Road…”

19
SOURCE: U.S. Department of Health and Human Services
“The Case for ACE”—National Health Expenditure Growth
Period of initial
demonstrations

20
2008—Acute Care Episode (“ACE”) Demonstration—Cardiovascular and Orthopedic—Implemented
• 4 State Focus: Colorado, New Mexico, Oklahoma and Texas
Ortho—90 Medicare Hip and Knee; 125 Total
Cardiac—100 Medicare CABG / VALVE; 200 Total All-Payor
200 Medicare PTCAs; 400 Total All-Payor
• Hospitals Submitted Bundled Pricing Bids for 28 Cardiovascular and/or 9 Orthopedic DRGs –
Inclusive of Medicare Discount (Discount not Prescribed)
• Bundled Bid was Inclusive of ALL Part A, Part B, Outliers, and Capital Pass-Through
Reimbursements for IP Episode
• Medicare Shared 50% of Savings with Medicare Beneficiaries
• Physicians Could Make Up to 25% Above Medicare FFS through Gainsharing
• All Claims Adjudication and Payment Facilitated by a Single Fiscal Intermediary (TrailBlazer)
Then Along Came ACE…

21
AlabamaAlabamaAlabamaAlabamaAlabama
ArizonaArizonaArizonaArizonaArizona
ArkansasArkansasArkansasArkansasArkansasCaliforniaCaliforniaCaliforniaCaliforniaCalifornia
ColoradoColoradoColoradoColoradoColorado
FloridaFloridaFloridaFloridaFlorida
IdahoIdahoIdahoIdahoIdaho
IllinoisIllinoisIllinoisIllinoisIllinois IndianaIndianaIndianaIndianaIndiana
IowaIowaIowaIowaIowa
KansasKansasKansasKansasKansas
KentuckyKentuckyKentuckyKentuckyKentucky
LouisianaLouisianaLouisianaLouisianaLouisiana
MichiganMichiganMichiganMichiganMichigan
MinnesotaMinnesotaMinnesotaMinnesotaMinnesota
MissouriMissouriMissouriMissouriMissouri
MontanaMontanaMontanaMontanaMontana
NebraskaNebraskaNebraskaNebraskaNebraska
Nev adaNev adaNev adaNev adaNev ada
New MexicoNew MexicoNew MexicoNew MexicoNew Mexico
OklahomaOklahomaOklahomaOklahomaOklahoma
OregonOregonOregonOregonOregonSouth DakotaSouth DakotaSouth DakotaSouth DakotaSouth Dakota
TennesseeTennesseeTennesseeTennesseeTennessee
TexasTexasTexasTexasTexas
UtahUtahUtahUtahUtah
WisconsinWisconsinWisconsinWisconsinWisconsin
WyomingWyomingWyomingWyomingWyoming
Exempla Saint Joseph Hospital, Denver
Lovelace Health System, Albuquerque
Oklahoma Heart Hospital, Oklahoma City
Hillcrest Medical Center, Tulsa
Baptist Health System, San Antonio
2008… Then Along Came “ACE”
22
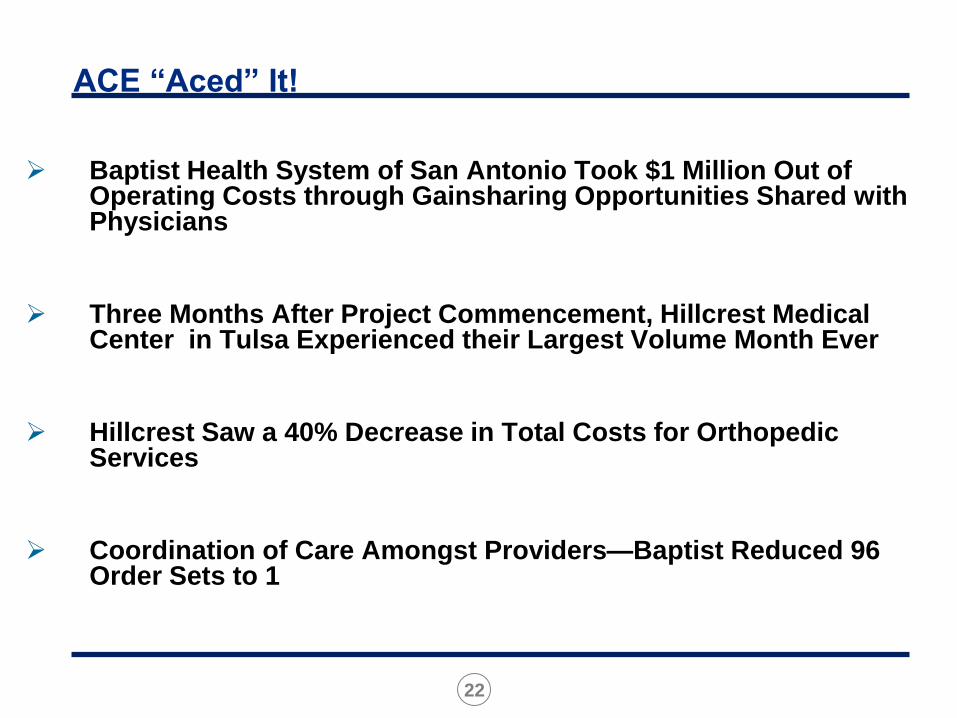
ACE “Aced” It!
Baptist Health System of San Antonio Took $1 Million Out of Operating Costs through Gainsharing Opportunities Shared with Physicians
Three Months After Project Commencement, Hillcrest Medical Center in Tulsa Experienced their Largest Volume Month Ever
Hillcrest Saw a 40% Decrease in Total Costs for Orthopedic Services
Coordination of Care Amongst Providers—Baptist Reduced 96 Order Sets to 1

23
Hospital
A
Hospital
B
Hospital
C
Hospital
D
CMS
Volume/Market
Share
Cost Reduction
Physician
Alignment
Quality
Would you do
it again?
Yes Yes Yes Yes Yes
23
Source: TRG interpretations of verbal and written surveys and CMS publications
Overall Positive ACE Results
24
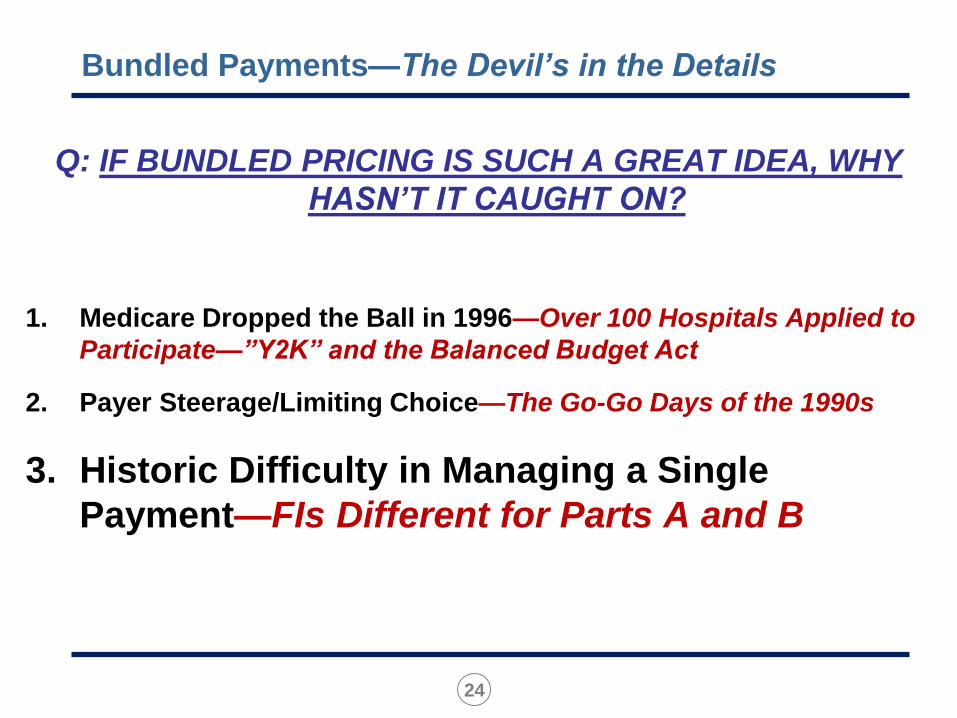
Q: IF BUNDLED PRICING IS SUCH A GREAT IDEA, WHY
HASN’T IT CAUGHT ON?
1. Medicare Dropped the Ball in 1996—Over 100 Hospitals Applied to
Participate—”Y2K” and the Balanced Budget Act
2. Payer Steerage/Limiting Choice—The Go-Go Days of the 1990s
3. Historic Difficulty in Managing a Single
Payment—FIs Different for Parts A and B
Bundled Payments—The Devil’s in the Details

25
BUNDLED PRICE
ALL“CONSULTING” PHYSICIAN
REIMBURSEMENT
$$$
HOSPITAL REIMBURSEMENT
$$$
“CORE” PHYSICIAN REIMBURSEMENT
$$$
Bundled Payments—Traditional “Prospective” Model
26
Medicare “Cracks the Code” on Bundled Payment Methodology

27
2011- Bundled Payments for Care Improvement (BPCI)
Open to ALL Hospitals Across the Country
Enabled Non-Hospital Entities to participate (e.g. Physicians, Remedy, naviHealth, etc.)
Select from 48 “Episodes” Consisting of 181 MS-DRGs
Four Possible Participation Models; 3 of Which Include Significant Post-Operative Care
Common Discount Percentage
No Market Exclusivity
No Savings Payment to Beneficiaries but Physicians Eligible to Earn 50% Above Medicare FFS through Gainsharing
3 of 4 Models are RETROSPECTIVE with Spend Reconciliation—i.e. All Providers Bill and Collect as Normal

28
2011- Bundled Payments for Care Improvement (BPCI)
3 Year Voluntary Program—4 Models; Over 1500 Participants
Model 2 is the Most Inclusive BPCI Model
Includes Acute A&B, 90-Day Post-Discharge “Related Readmissions” and Virtually All Post-Acute Expenditures Except Hospice
Participants Agree to Reduce Medicare’s Historical Spend by 2% Overall
If Successful in Reducing Below the 2% Discounted Target Price, Participants Retain Savings
If Unsuccessful, Participants Owe CMS the 2% Plus Any Overages
BPCI Model 2 Gave Impetus and Birth to CJR

29
Bundled Payments for Care Improvement (BPCI) Initiative
BPCI Initiative: Model 1
Total number of Participants:11
BPCI Initiative: Model 2
Total number of Participants: 628
BPCI Initiative: Model 3
Total number of Participants:859
BPCI Initiative: Model 4
Total number of Participants:9

30
BPCI Model 2 Target Pricing…The Black Box
31
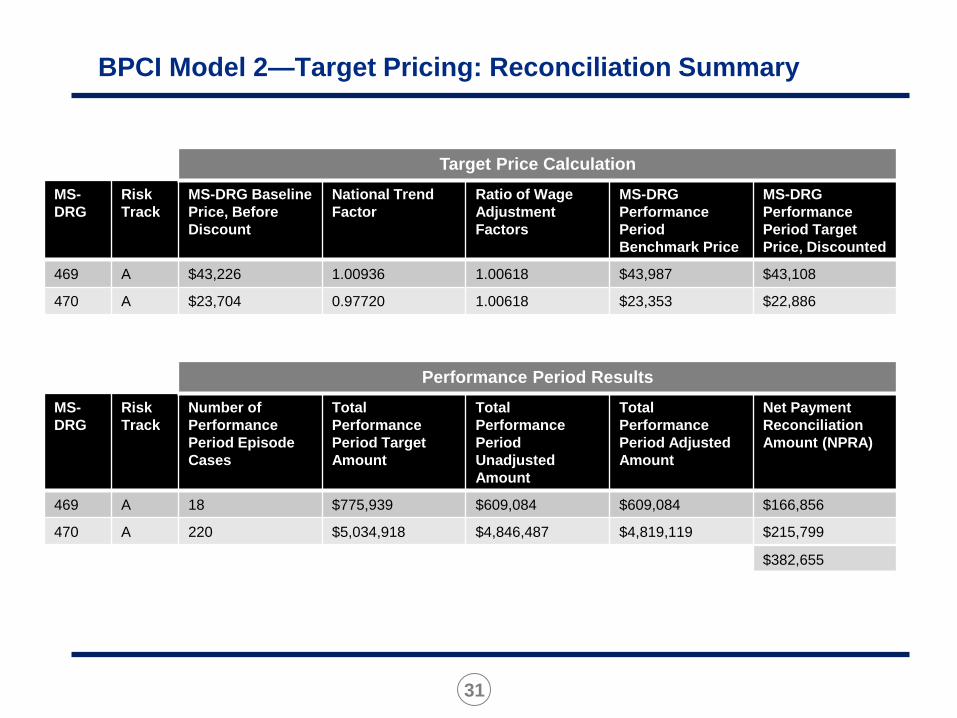
BPCI Model 2—Target Pricing: Reconciliation Summary
MS-
DRG
Risk
Track
MS-DRG Baseline
Price, Before
Discount
National Trend
Factor
Ratio of Wage
Adjustment
Factors
MS-DRG
Performance
Period
Benchmark Price
MS-DRG
Performance
Period Target
Price, Discounted
469 A $43,226 1.00936 1.00618 $43,987 $43,108
470 A $23,704 0.97720 1.00618 $23,353 $22,886
MS-
DRG
Risk
Track
Number of
Performance
Period Episode
Cases
Total
Performance
Period Target
Amount
Total
Performance
Period
Unadjusted
Amount
Total
Performance
Period Adjusted
Amount
Net Payment
Reconciliation
Amount (NPRA)
469 A 18 $775,939 $609,084 $609,084 $166,856
470 A 220 $5,034,918 $4,846,487 $4,819,119 $215,799
Target Price Calculation
Performance Period Results
$382,655

32
BPCI Model 2: Target Price Construction: Baseline Trending
• Historical claims data captures admissions from July 2009 – June
2012 for eligible* BPCI patients
Eligible BPCI patients are traditional Medicare Fee-for-service beneficiaries that must
be enrolled in both Parts A and B, must not be enrolled in a Medicare Advantage plan,
must not have End Stage Renal Disease, and must not have Medicare as a secondary
payer
• Trend earlier two years of data to be in terms of 2012 dollars
• Winsorize payments using trim points for the selected Risk Track
• Apply low volume adjustments
• Apply national case mix indices
MS-
DRG
Risk
Track
MS-DRG Baseline
Price, Before
Discount
National Trend
Factor
Ratio of Wage
Adjustment
Factors
MS-DRG
Performance
Period Benchmark
Price
MS-DRG
Performance
Period Target
Price, Discounted
469 A $43,226 1.00936 1.00618 $43,987 $43,108
470 A $23,704 0.97720 1.00618 $23,353 $22,886
Target Price Calculation

33
BPCI Model 2: Target Price Construction: National Trend Factor
• National Trend Factor, as defined by CMS:
“i.e. changes in MS-DRG mean episode payments for all episodes nationally between
the performance quarter and the baseline period, which capture health care market
basket changes1, policy changes2, and secular trends3 that affect service volume and
prices nationally”
For Example…
1. MS-DRG Payment Changes
2. Sequestration
3. National Utilization Changes
MS-
DRG
Risk
Track
MS-DRG Baseline
Price, Before
Discount
National Trend
Factor
Ratio of Wage
Adjustment
Factors
MS-DRG
Performance
Period Benchmark
Price
MS-DRG
Performance
Period Target
Price, Discounted
469 A $43,226 1.00936 1.00618 $43,987 $43,108
470 A $23,704 0.97720 1.00618 $23,353 $22,886
Target Price Calculation

34
BPCI Model 2: Target Price Construction: Wage Adjustment Factors
• Ratio of Wage Adjustment Factors
The baseline price gets adjusted either up or down depending on what has happened
to the wage indices at the hospitals that you practice at; CMS does not want to
artificially penalize/reward you for changes in area wages.
MS-
DRG
Risk
Track
MS-DRG Baseline
Price, Before
Discount
National Trend
Factor
Ratio of Wage
Adjustment
Factors
MS-DRG
Performance
Period Benchmark
Price
MS-DRG
Performance
Period Target
Price, Discounted
469 A $43,226 1.00936 1.00618 $43,987 $43,108
470 A $23,704 0.97720 1.00618 $23,353 $22,886
Target Price Calculation
Performance
Period Wage
Factor
0.99662
2012 Wage Factor
0.99050
Ratio of Wage
Adjustment
Factors
1.00618

35
BPCI Model 2: Target Price Calculation: Winsorization
How Medicare Adjusts for Risk
• Participants selected from three risk tracks, each having a unique lower and upper
threshold
• Threshold values are established utilizing the distribution of episode payments
nationally
• Payments below the lower threshold will be brought up to equal the lower threshold
for calculation purposes
• Payments above the upper threshold will be brought down to equal the upper
threshold, plus 20% of the difference between the threshold and the actual payment
• Both the baseline and the performance period episode payments are adjusted
1st %tile
99th %tile
5th %tile
95th %tile
5th %tile
75th %tile
Highest Risk/Opportunity ------------------------- Lowest Risk/Opportunity
A B C

36
BPCI Model 2: Target Price Construction: The True-Up Process
When does it occur?
• Each quarter is “trued-up” three times after the originally released
reconciliation; quarterly results are not considered final until the third true-up
What can change?
• Trend factors, winsorization trim points, and performance period total spend
are all recalculated
• Episodes can potentially fall out of the program (e.g. if a patient enrolls in a
Medicare Advantage plan)
• Additional claims can be processed
Performance
Period Quarter
Original
ReconciliationFirst True-Up
Second True-
UpFinal True-up
Q2 2015 January 2016 April 2016 July 2016 October 2016
Q3 2015 April 2016 July 2016 October 2016 January 2017
Q4 2015 July 2016 October 2016 January 2017 April 2017

37
• All IPPS hospitals within the 67
selected MSAs (approx. 800 hospitals)
• The selection process utilized a
stratified random sampling
methodology of all MSAs with the
following exclusions:
1. MSAs with less than 400 LEJR
episodes
2. MSAs with less than 400 non-BPCI
LEJR episodes
3. MSAs with greater than 50% of eligible
CJR episodes currently in Phase 2 of
BPCI
4. MSAs with greater than 50% of eligible
CJR episodes not paid under IPPS
2016: CJR: Required—i.e. MANDATED—Participants

38
The Basics of CJR
Defining CJR • CJR is a mandatory bundled payment program for
Lower Extremity Joint Replacement episodes, as
initiated by MS-DRGs 469-470 (unlike BPCI,
consideration is given for patients with fractures)
Program Timeframe • The program begins on April 1, 2016 and runs for
almost five years until December 31, 2020
Included Services • Services that occur during the anchor
hospitalization and spanning through 90 days
post-discharge
• Inpatient Hospital Services, Professional Services,
Readmissions, Skilled Nursing Facility, Inpatient
Rehab Facility, Long Term Care, Home Health,
Outpatient, Durable Medical Equipment, Hospice
Reconciliation • Annual retrospective reconciliation of Medicare’s
actual spend versus the target price
• Does not impact provider payments

39
The Basics of CJR
Target Price • Based on 3 year historical spend that blends
hospital-specific performance with a regional
average
• Discount between 1.5% - 3.0% depending on a
hospital’s quality composite score
• Hospitals will know the Target Price in advance—
unlike BPCI
Quality • Quality performance is required to be eligible for a
reconciliation payment
• Includes 2 mandatory metrics:
THA/TKA Complication Rate
HCAHPS
Risk Protection • CMS has implemented stop-loss and stop-gain
limits on aggregate NPRA to minimize risk
Stop Gain: 5%, 5%, 10%, 20%, 20%
Stop Loss: 0%, 5%, 10%, 20%, 20%
Waivers • Allow for gainsharing arrangements with
physicians and other providers

40
“We propose to calculate (CJR) episode target prices using a blend of hospital-specific and regional historical average (CJR) episode payments, including (CJR) episode payments for all (CJR) eligible hospitals in the same U.S. Census division…”
Page 119, CMS-5516-P
The Big Difference Between BPCI and CJR
If a hospital has historically been lower than the region, the hospital will be rewarded as they are measured against a target price that has been inflated by the regional experience.
If a hospital has historically been higher than the region, the hospital will be penalized as they are measured against a target price that has been deflated by the regional experience.
Years 1 and 2: 2/3 Hospital, 1/3 Regional
Year 3: 1/3 Hospital, 2/3 Regional
Years 4 and 5: 100% Regional
…and the Target Price baseline will be
updated every two years to a more recent
3-year period (i.e. 3 baselines throughout CJR)

41
Are Bundled Payments the Future?
COPD?
CHF?
CABG?Fee-for-
Service?

42
Are Bundled Payments the Future?
“Being an ally of the United States is like
living on the banks of an enormous river. The soil
is wonderfully fertile but every four or eight years
the river changes course and you may find yourself
alone in a desert.”
—Muhammad Zia-ul-Haq
President of Pakistan 1978-1988

43
Are Bundled Payments the Future?
CMS Pays the Bills for 1 out of Every 3 People in the United States

44
Providers Unable to Successfully Manage the Episode Will Be
Pushed Out of the Game
CMMI Initiatives Commercial Direct to Employer Future PredictionACE = Acute Care Episode; BCBS = Blue Cross and Blue Shield; CalPERS = California Public Employees’ Retirement System;
CJR = Comprehensive Care for Joint Replacement; CJRI = Connecticut Joint Replacement Institute; TJR = total joint replacement.
Kroger designates 19
hospitals for total joint
replacement
Walmart
partners with
hospitals for
spine surgery
General Electric
pursues direct
contracting
strategy. 4 Centers
designated for TJR
National
Orthopaedic &
Spine Alliance
CalPERS
reference pricing
Bundled
Payments
for Care
Improvement
initiative
CMS
proposes and
finalizes CJR rule
Bundles are
the default
reimbursement for
Medicare TJR.
ACE
demonstration
Anthem BCBS of MO
and SSM Health Care
Duke and
BCBS of NC
CJRI and
ConnectiCare
NC Specialty
Hospital and
BCBS of NC
Florida Ortho Institute
and Florida Blue
2011 2012 2013 2014 20192015 2016 2017 2018201020092008
Innovation Escalates
CCF Creates National Heart
Network. Targets 24 sites for
bundled pmt contracting
BPCI is extended for
2 add’l years
45
Current Private Payor Bundled Payment Initiatives

46
How to Prepare for a Bundled Future
• Begin Changing Mindset and Focus—No Longer Volume per se
• Participate in any Bundled Opportunities—Look Local!
• Look Beyond the Four Walls of the Hospital to Establish Relationships with
High Quality, Efficient Providers
• If You Have Employed or Contracted Physicians on a wRVU Model, Evaluate
Other Structures
• Begin Sharing Relevant Data with Physicians
• Determine Who Efficient, High Quality Physicians Are
• ENGAGE YOUR PHYSICIANS!!

47
CASE STUDY: BPCI Model 2: SIGNATURE MEDICAL GROUP
Awardee Convener CMS Bundled Payments for Care Improvement (BPCI)
Convener for Largest Orthopedic Bundled Payment Initiative

48
CASE STUDY: BPCI MODEL 2; SIGNATURE MEDICAL GROUP

49
CASE STUDY: BPCI MODEL 2; SIGNATURE MEDICAL GROUP
PARTICIPATING ORTHOPEDIC GROUPS IN 26 STATES & OVER 60 CITIES

50
CASE STUDY: BPCI MODEL 2; SIGNATURE MEDICAL GROUP—
RESULTS Q1 and Q2 of 2015
• Readmissions Reduced – 12 to 70%
• SNF Unnecessary Utilization Reduced – 10 to 50%
• IRF Unnecessary Utilization Reduced – 30 to 80%
• Average Patient Satisfaction Scores over 97%
• Selected Quality measures achieved and frequently surpassed
• Average ICS Savings (Implant Costs BPCI Cases Only) : $887 per
Case
– Note: Physician Gainsharing Maximum Approximately $700 per Case
• Top Performing SMG Groups Have Reduced Episode PAC
Spend Between $2750 and $3750 per Case
51
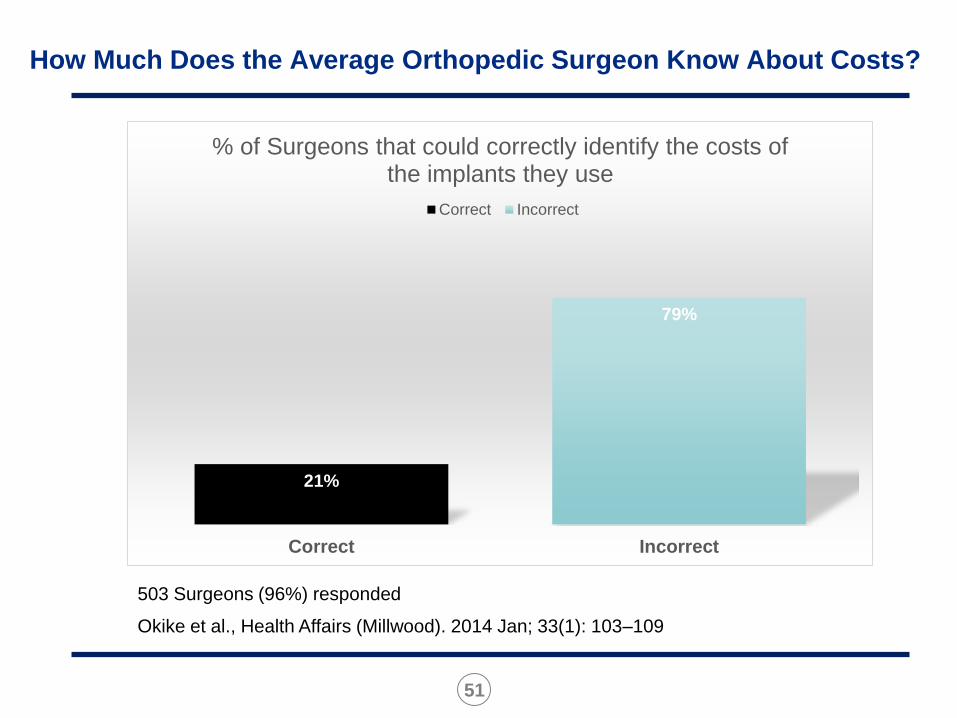
Okike et al., Health Affairs (Millwood). 2014 Jan; 33(1): 103–109
503 Surgeons (96%) responded
21%
79%
Correct Incorrect
% of Surgeons that could correctly identify the costs of the implants they use
Correct Incorrect
How Much Does the Average Orthopedic Surgeon Know About Costs?

52
The Art of Anticipation

53
“I skate to where the
puck is going to be,
not to where it is.”
--Wayne GretzkyAll-Time NHL Point Leader
The Art of Anticipation