choose your map - home - power bi user group
TRANSCRIPT


Sponsors

Lorenzo Vercellati
Power BI Solutions Architect @ SolidQ
SQL Saturday Speaker, Power BI Trainer
Working on Database since 2000, on SQL Server since 2007
PowerBI User Group Milan Administrator
Medieval History Graduate, Homebrewer
@supergimi
https://www.linkedin.com/in/lorenzovercellati/

Agenda

Coming Soon…
• Prepare Your Data• Build a Strong Geography Dimension
• Clean Your Data
• Categorize Your Data
• Maps! Maps! Maps!


Prepare Your Data

Build a Strong Geography Dimension
Use Codes:• ISTAT Codes (M052, F704 instead of Vimercate or Monza)
• State or Province Codes (AN, NY, IDF instead of Ancona, New York, Ile-de-France)
• Country Codes (ITA, USA, MEX instead of Italy, United States, Mexico)
Descriptions depends on too many factors
… and ERRORS!

Demo

Build a Strong Geography Dimension
Build a multi-level Hierarchy
Asia <continent>Africa <continent>Europe <continent>North America <continent>
Canada <country>Mexico <country>United States of America <country>
New England <region>Midwest <region>California <region>
Sacramento Valley <region>Sierra Nevada <region>Bay Area <region>
Berkeley <city>Palo Alto <city>San Francisco <city>
Mission <district>Golden Gate <district>Castro-Noe Valley <district>

Build a Strong Geography Dimension
Use Latitude and Longitude as soon as possible

Categorize Your Data
1
2
3
4
Help Bing doing its work!

Maps! Maps! Maps!


Out of the Box vs. Custom

Out of the Box

Out of the box
Filled Map Shape MapArcGIS MapsMap
Map with R

Map
• Categorize your data to help Bing Service
• Use combination of Location field and Longitude and Latitude with drill down for good results

Demo

Filled Map
• Great for US geographies
• Not so great outside of US

Shape Map
• A shape map is a visual built to show comparisons of regions on a map by applying different colors to each region.
• It is based on shapefile, a storage format developed by Esri, nowadays universally recognized as standard for storing geospatial information.
• A shapefile format spatially describes vector features: points, lines, polygons. It is therefore commonly used to represent geometric locations for data and its attributes

Shape Map
• Enabled in Preview Features
• Use mapshaper.org to convert to TopoJSON
• If necessary, update manually your TopoJSON
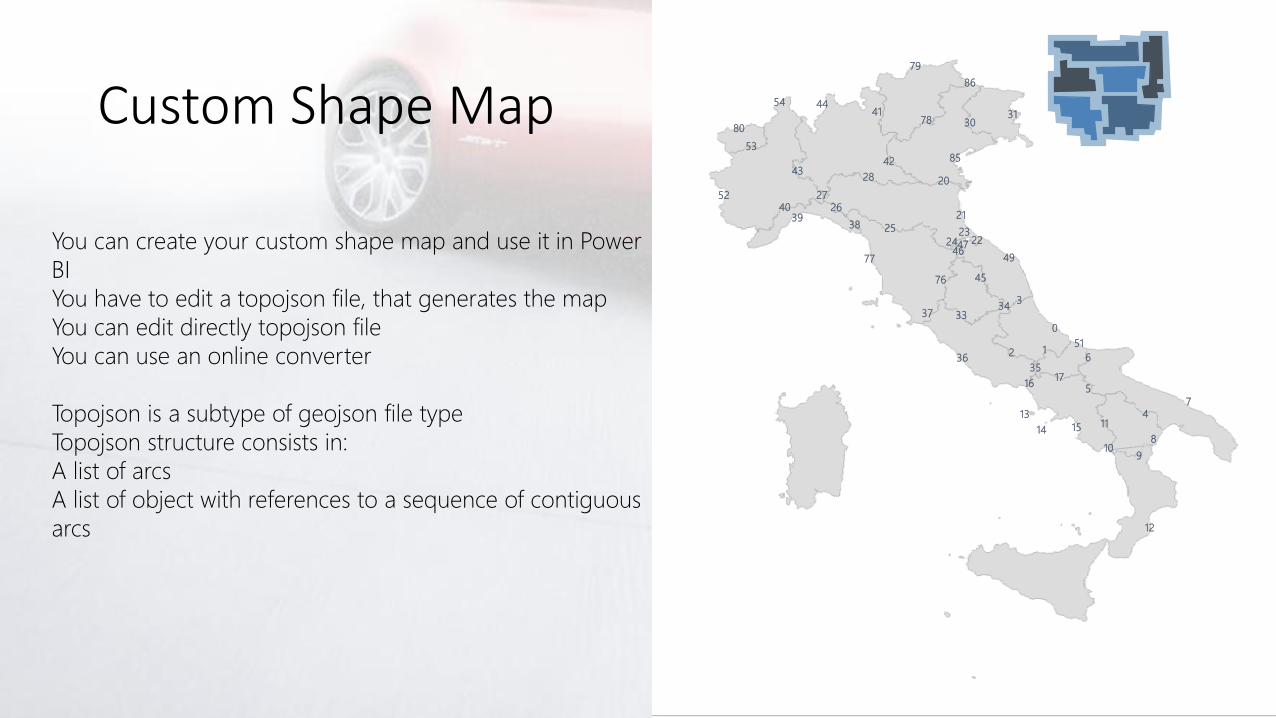
Custom Shape Map
0
12
3
4
5
6
7
8
910
11
12
13
14 15
1617
20
21
2223
24
25
2627
28
3031
3334
3536
37
3839
40
41
4243
44
45
4647
49
51
52
53
54
8078
79
85
76
77
86
You can create your custom shape map and use it in Power
BI
You have to edit a topojson file, that generates the map
You can edit directly topojson file
You can use an online converter
Topojson is a subtype of geojson file type
Topojson structure consists in:
A list of arcs
A list of object with references to a sequence of contiguous
arcs

Custom Shape MapArcs are defined by an entry point and a sequence of
point.
Arcs have a defined direction
Object defined by arcs with reverse direction are
referenced by –arcs + 1
76
-77
An object can be a Polygon or a MultiPolygon
Every Polygon is defined by a set of contiguous arcs.
0
12
3
4
5
6
7
8
910
11
12
13
14 15
1617
20
21
2223
24
25
2627
28
3031
3334
3536
37
3839
40
41
4243
44
45
4647
49
51
52
53
54
8078
79
85
76
77
86

Demo

ArcGIS Maps
• A GIS (Geographic Information System) is a computer-based tool that analyzes, stores, manipulates and visualizes geographic information on a map.
• ArcGIS is the software developed by Esri, for creating and using maps, performing spatial analysis, sharing and discovering geographic information.

ArcGIS Maps
• Circles, Cluster, Heatmap
• Limit on points
• No drilldown
• Built in reference layers and infographics for US only
• Premium subscription for additional features

Demo
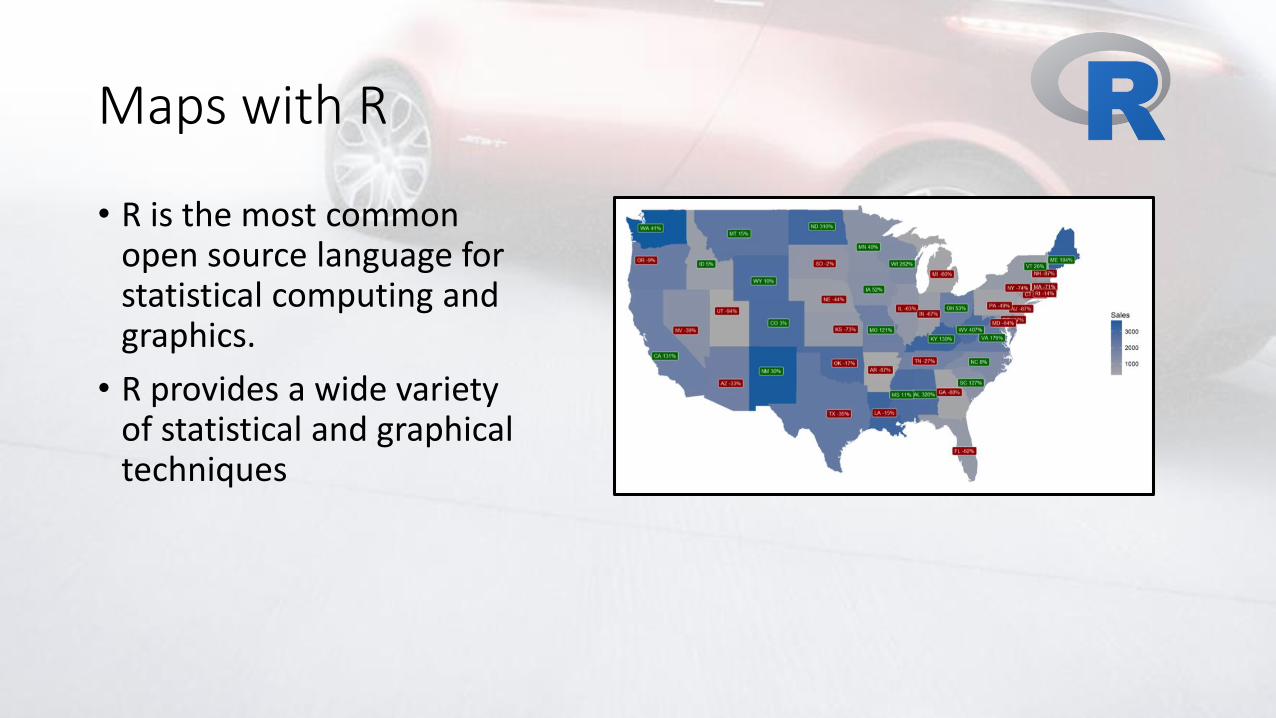
Maps with R
• R is the most common open source language for statistical computing and graphics.
• R provides a wide variety of statistical and graphical techniques

Maps with R
• R scripts are fully supported in Power BI, offering the way to perform analytical and statistical analysis and to create compelling visuals. The integration of R in PowerBI grants access to a rich array of data visualizations not present in the standard PowerBI set.
• R is shipped with a huge number of packages for spatial data analysis and plotting. Many sort of maps (choropleths, map projections, topological maps, animated maps, …) and sketch options are available with R.

Map with R
• R Engine
• R packages (ggplot2, maps)
• R knowledge

Demo

Is There Anybody Out There?

Custom Maps from Marketplace
Globe Data Bars Globe Map Drilldown Choropleth
Drilldown Cartogram
Mapbox Icon Map
…and Others more!
Flow Map

Mapbox
• Requires access token
• Shows large number of points
• Multiple background layers, including custom
• Cluster, Heatmap, Circles & Choropleth
• Need to aggregate data manually

Demo

Flow Map
• Shows routes or flows between points
• Straight lines, great circle or flows
• Longitude and latidude or geocoding
Demo

Icon Map
• Open Streetmap, Mapbox, Thunderforest & openweathermap layers
• Circles, lines and icons

Demo

Drilldown Choropleth
• Custom shapes required in TopoJSON and hosted externally

Drilldown Cartogram
• Custom shapes required in TopoJSON and hosted externally

Synoptic Panel
• https://synoptic.design/
• Time-intensive compared to other Power BI map options
• Some templates available in the Synoptic gallery
• Fully customized areas for any image

Globe Map
• Good for storytelling
• Not so good for analysis

Globe Data Bars
• No longer working

Links on the Road

Maps
• https://mapshaper.org/
• https://christopherfinlan.com/category/datazen/maps/
• http://dataveld.com/2016/09/12/topojson-map-files-for-power-bi-shape-map/
• https://powerbi.microsoft.com/en-us/blog/esri-plus-subscription-for-arcgis-maps-for-power-bi-is-now-available/?cdn=disable
• https://github.com/deldersveld/topojson
• http://dataveld.com/2016/09/01/overcoming-potential-power-bi-shape-map-rendering-issues/

TopoJson
• https://en.wikipedia.org/wiki/GeoJSON
• https://macwright.org/2015/03/23/geojson-second-bite.html
• http://geoexamples.com/d3/2015/09/25/d3-EUROSTAT-topojson.html
• https://blog.mapbox.com/the-fastest-maps-in-microsoft-power-bi-4fc81b7ef890
• https://docs.microsoft.com/en-us/power-bi/visuals/power-bi-map-tips-and-tricks
• https://www.esri.com/en-us/arcgis/products/arcgis-maps-for-power-bi/overview
…and more!

“To put a city in a book, to put the world on one sheet of paper: maps are the most condensed humanized spaces of all...They make the landscape fit indoors, make us masters of sights we can't see and spaces we can't cover.”
-Robert Harbison

Q&A

Grazie!