chool accountability report card · 2017-04-24 · san diego scpa (368) 3 spring 2017 school...
TRANSCRIPT

School Accountabi l i ty Report Card Issued Spring 2017 for Academic Year 2015–16
San Diego Unified School District • Cindy Marten, Superintendent • 4100 Normal Street, San Diego, CA 92103 • www.sandiegounified.org
What Is a SARC?
All California public schools are re-quired by state law to publish a School Accountability Report Card (SARC) by February 1 of each year. The SARC contains specific information about the condition and performance of the school from the previous school year.
Furthermore, under the Local Con-trol Funding Formula (LCFF), San Die-go Unified is required to prepare a Lo-cal Control Accountability Plan (LCAP), which describes how it intends to meet annual school-specific goals for all students, with specific activities to ad-dress state and local priorities. Data reported in the SARC are to be con-sistent with data reported in the LCAP.
More information about the re-quirements for the SARC is available on the state’s SARC website:
www.cde.ca.gov/ta/ac/sa/
Additional copies of this SARC may be obtained from the school office or from the district’s SARC website:
www.sandiegounified.org/sarc
For more information about the LCFF or LCAP, see the state’s LCFF website:
www.cde.ca.gov/fg/aa/lc/
Finally, for more information about this school, contact the principal or the district office.
Contents About This School ................................ 2 Data and Access .................................. 3 Conditions of Learning ......................... 3 Student Outcomes ............................... 5 Engagement ..................................... 11 Other Information ............................. 13
Federal Intervention Program .......... 13 Average Class Size and Class Size Distribution (Secondary) ................. 13 Academic Counselors and Other Support Staff Members ................... 14 Expenditures per Pupil and School- Site Teacher Salaries ...................... 14 Types of Services Funded ................ 14 Teacher and Administrative Salaries . 15 Advanced Placement Courses ........... 15 Professional Development ................ 15 Instruction and Curriculum .............. 15
Appendix: Adopted Texts and Instructional Materials ........................ 16
San Diego School of Creative and Performing Arts
2425 Dusk Dr, San Diego, CA 92139-2412 Phone: (619) 470-0555
E-mail: [email protected] Web: www.sandiegounified.org/schools
/school-creative-and-performing-arts CDS Code: 37-68338-3730371
Timothy Farson, Principal School Description and Mission Statement
The San Diego School of Creative and Performing Arts (SDSCPA) is an audition-only, dedicated public magnet school for passionate and talented young artists with the discipline and commitment to achieve in the arts and academics. Students develop and refine technique while discovering and enhancing their own individual style. Students audition for a program of study in the areas of dance, theatre (acting, musical theatre, and technical theatre and design), visual and media arts (2- and 3-dimensional, photography, and cinematic arts), or mu-sic (vocal and instrumental) and must follow a strict series of artistic courses in preparation for postsecondary study in the arts.
SDSCPA attracts students in grades 6 through 12 from across the county. The 40-acre campus is designed as a multilevel creative and performing arts center. Features include three performances spaces (the 2,000-seat Circle of the Sun Amphitheater, 400-seat Florence Johnson Grand Theatre, and 90-seat Ole Kittleson Little Theater); five dance studios; a visual arts complex with a photo lab, clay yard, visual, graphic, and state-of-the-art film production studio; a music complex with piano lab and four music rooms; a scene shop; costume and prop facilities; a media center with computer lab; 74 academic classrooms; and large grassy areas for creative inspiration.
San Diego SCPA (368) 2 Spring 2017 School Accountability Report Card
About This School
At a Glance: 2015–16 School type: Atypical Schedule: Traditional Grade levels: 6–12 Total enrollment: 1,422 Total teachers: 60 Per-pupil expenditure (fiscal year 14–15): $6,195
Student Enrollment by Grade Level
Grade Level Enrollment on
October 7, 2015 6 226 7 207 8 212 9 204
10 213 11 160 12 200
Total 1,422
Attendance
Year Attendance for Year (%)
11–12 96.15 12–13 95.92 13–14 93.82 14–15 96.53
15–16 96.52
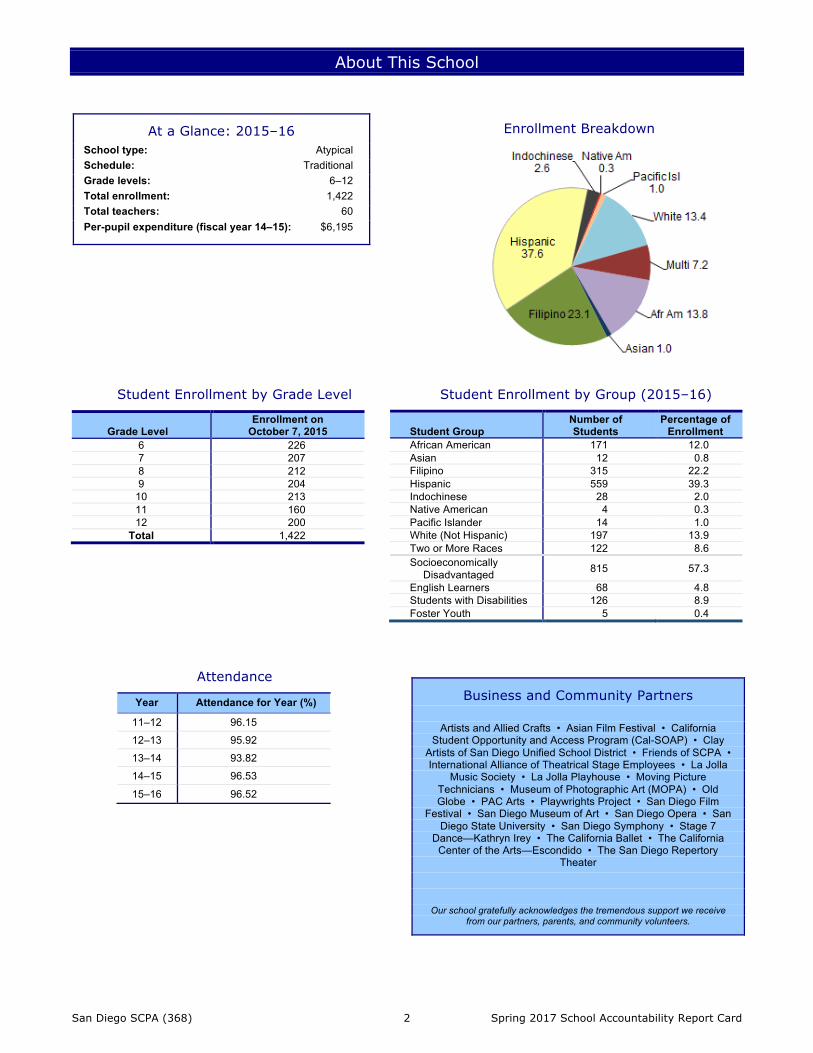
Enrollment Breakdown
Student Enrollment by Group (2015–16)
Student Group Number of Students
Percentage of Enrollment
African American 171 12.0 Asian 12 0.8 Filipino 315 22.2 Hispanic 559 39.3 Indochinese 28 2.0 Native American 4 0.3 Pacific Islander 14 1.0 White (Not Hispanic) 197 13.9 Two or More Races 122 8.6 Socioeconomically
Disadvantaged 815 57.3
English Learners 68 4.8 Students with Disabilities 126 8.9 Foster Youth 5 0.4
Business and Community Partners
Artists and Allied Crafts • Asian Film Festival • California Student Opportunity and Access Program (Cal-SOAP) • Clay
Artists of San Diego Unified School District • Friends of SCPA • International Alliance of Theatrical Stage Employees • La Jolla
Music Society • La Jolla Playhouse • Moving Picture Technicians • Museum of Photographic Art (MOPA) • Old Globe • PAC Arts • Playwrights Project • San Diego Film
Festival • San Diego Museum of Art • San Diego Opera • San Diego State University • San Diego Symphony • Stage 7
Dance—Kathryn Irey • The California Ballet • The California Center of the Arts—Escondido • The San Diego Repertory
Theater
Our school gratefully acknowledges the tremendous support we receive from our partners, parents, and community volunteers.
San Diego SCPA (368) 3 Spring 2017 School Accountability Report Card
Data and Access
Most of the data in this SARC are from the 2015–16 school year or the two preceding years (2013–14 and 2014–15). Gradua-tion, dropout, and fiscal data are from 2014–15. Contact information and data on facilities, curriculum and instructional mate-rials, and certain teacher information are from the 2016–17 school year. When no year is specified, data are from the most recent year available.
Data included in this SARC are consistent with State Board of Education guidelines, available at the California Depart-ment of Education website: www.cde.ca.gov/ta/ac/sa/. DataQuest DataQuest is an on-line data tool (dq.cde.ca.gov/dataquest/) that contains additional information about this school and com-parisons of the school to the district, the county, and the state. DataQuest is a dynamic system that provides reports for ac-countability, test results, enrollment, graduates, dropouts, course enrollments, staffing, and data regarding English learners. Internet Access Internet access is available at public libraries and other locations that are publicly accessible (e.g., the California State Li-brary). Access to the Internet at libraries and public locations is generally provided on a first-come, first-served basis. Other use restrictions include the hours of operation, the length of time that a workstation may be used (depending on availability), the types of software programs available on a workstation, and the ability to print documents.
Conditions of Learning
State Priority: Basic This section provides information relevant to the LCAP Basic State Priority (Priority 1): • Teacher Credentials: the degree to which teachers are assigned appropriately and are fully credentialed in the subject area and for the
students they are teaching. • Instruction Materials: whether students have access to standards-aligned instructional materials. • Facility Conditions: whether facilities are maintained in good repair. Teacher Credentials
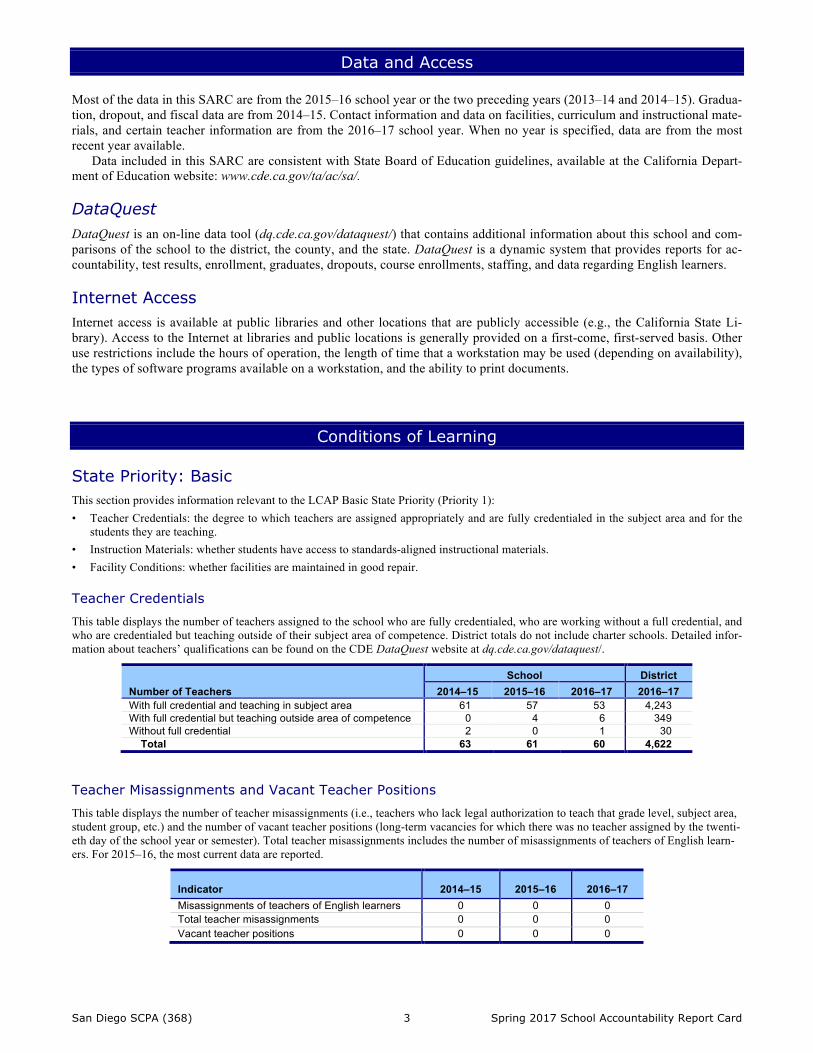
This table displays the number of teachers assigned to the school who are fully credentialed, who are working without a full credential, and who are credentialed but teaching outside of their subject area of competence. District totals do not include charter schools. Detailed infor-mation about teachers’ qualifications can be found on the CDE DataQuest website at dq.cde.ca.gov/dataquest/.
Number of Teachers School District
2014–15 2015–16 2016–17 2016–17 With full credential and teaching in subject area 61 57 53 4,243 With full credential but teaching outside area of competence 0 4 6 349 Without full credential 2 0 1 30 Total 63 61 60 4,622
Teacher Misassignments and Vacant Teacher Positions
This table displays the number of teacher misassignments (i.e., teachers who lack legal authorization to teach that grade level, subject area, student group, etc.) and the number of vacant teacher positions (long-term vacancies for which there was no teacher assigned by the twenti-eth day of the school year or semester). Total teacher misassignments includes the number of misassignments of teachers of English learn-ers. For 2015–16, the most current data are reported.
Indicator 2014–15 2015–16 2016–17 Misassignments of teachers of English learners 0 0 0 Total teacher misassignments 0 0 0 Vacant teacher positions 0 0 0

San Diego SCPA (368) 4 Spring 2017 School Accountability Report Card
Core Academic Courses Taught by Teachers in Compliance with the No Child Left Behind Act (2015–16) The federal Elementary and Secondary Education Act (ESEA), also known as the No Child Left Behind Act (NCLB), requires all teachers of core academic subjects to be “highly qualified.” In general, ESEA requires that each teacher must have: (1) a bachelor’s degree, (2) a state credential (or an Intern Certificate/Credential for no more than three years), and (3) demonstrated subject-matter competence for each core subject he or she will teach.
This table displays the percentage of classes in core academic subjects taught by teachers who are compliant with ESEA at this school, at all schools in the district, in high-poverty schools in the district, and in low-poverty schools in the district. (High-poverty schools are defined as those with student eligibility rates of approximately 40 percent or higher in the free and reduced-price meals program. Low-poverty schools are defined as those with student eligibility rates of 39 percent or lower in the program.) These data do not include inde-pendently reporting charter schools. More information on teacher qualifications required under ESEA can be found at the CDE website at www.cde.ca.gov/nclb/sr/tq/.
Location of Classes
Percentage of Classes in Core Academic Subjects Taught by Highly
Qualified Teachers Not Taught by Highly
Qualified Teachers This school 95.3 4.7 All schools in district 96.1 3.9 High-poverty schools in district 95.9 4.1 Low-poverty schools in district 97.3 2.7
Quality, Currency, and Availability of Textbooks and Instructional Materials (2016–17)
The district adopts textbooks and instructional materials based on the implementation cycle established by the state. It provides a sufficient number of standards-aligned textbooks and other instructional materials for all students in the subject areas of English language arts, health, history–social science, mathematics, science, and world languages. Science laboratory equipment is available to students enrolled in labora-tory science courses in grades 9–12. The following table displays information about the availability of the standards-aligned textbooks and other instructional materials used at the school. These data were collected in October 2016.
Core Curriculum Area
Are These Textbooks and Instructional Materials from the Most Recent Adoption?
Percentage of Pupils Who Lack Their Own Assigned
Textbooks and Instructional Materials
English Language Arts Yes 0 Health Yes 0 History–Social Science Yes 0 Mathematics Yes 0 Science Yes 0 Science Lab Equipment (grades 9–12) n/a 0 Visual and Performing Arts Yes 0 World Language Yes 0
List of Textbooks and Instructional Materials Used in Core Subject Areas (2016–17)
All textbooks and instructional materials come from state or district lists. A list of all textbooks and instructional materials used in the school in the core subjects (English language arts, mathematics, science, and history-social science), including the year of adoption, may be found at the end of this document in the appendix entitled Adopted Texts and Instructional Materials. Descriptions of the district’s courses, including current instructional materials, may be found in the Course of Study, TK–12, revised annually and available on-line at www .sandiegounified.org/course-study School Facility Conditions and Planned Improvements
SCPA’s cleanliness meets district standards in all areas. Lighting, heating, cooling, and noise negation also meet all standards. The school’s fire alarm system is in good working order and the school’s technology infrastructure is being upgraded continually. A state-of-the-art vid-eo surveillance system designed to ensure the safety of students allows for real-time remote monitoring and recording of activity on cam-pus. Our custodial staff consists of one part-time and four full-time members who maintain a clean campus at all times. The district’s Phys-ical Plant Operations department addresses minor maintenance needs.

San Diego SCPA (368) 5 Spring 2017 School Accountability Report Card
School Facility Good-Repair Status
This table displays the results of the most recently completed school-site inspection to determine the facility’s good-repair status.
Date of most recent inspection: 12/1/16
Item Inspected
Repair Status*
Repair Needed and Action Taken or Planned E G F P
Systems: Gas, mechanical, HVAC, sewer
ü Interior: Interior surfaces ü Cleanliness: Overall, pests/vermin ü Electrical: Interior/exterior ü lights out, missing diffusers - in progress Restrooms/fountains: sinks, plumbing ü loose toilets and faucets, low pressure - in progress Safety: Fire safety, hazardous materials ü Structural: Damage, roofs ü External: School grounds, playground, windows, gates, fences ü
Overall Rating: 93.92% ü
* Repair Status: E = exemplary, G = good, F = fair, P = poor
Student Outcomes
State Priority: Pupil Achievement This section provides information relevant to the Pupil Achievement State Priority (Priority 4): • Statewide Assessments: results of the California Assessment of Student Performance and Progress (CAASPP) and the Science Califor-
nia Standards Tests. • Preparation for College or Career: successful completion of courses that satisfy requirements for entrance to the University of Califor-
nia or the California State University, or career technical education sequences or programs of study. Statewide Assessments CAASPP Assessment Results
The California Assessment of Student Performance and Progress (CAASPP) tests students in English language arts/literacy and mathemat-ics in grades 3 through 8 and grade 11. The CAASPP was piloted in 2013–14 and first administered statewide in 2014–15. The CAASPP consists of the Smarter Balanced Summative Assessments for students in the general education population.
For eligible students, the CAASPP also consists the California Alternate Assessments (CAAs) in ELA and math, which replaced the Cali-fornia Alternate Performance Assessment (CAPA) in 2015 and are aligned with alternate achievement standards linked to the Common Core State Standards for students with significant cognitive disabilities.
CAASPP scores are ranked according to four “performance levels”: Level 1 indicates that the student has not met the standard tested; Level 2 indicates that the student has nearly met the standard; Level 3 indicates that the student has met the standard; Level 4 indicates that the student has exceeded the standard. Students scoring at Levels 3 and 4 have met state standards in that content area.
Note: In the tables that follow the number of students tested includes students who did not receive a valid test score; however, achieve-ment-level percentages have been calculated using only those students who did receive valid scores. CAASPP: All Students
The following table shows the percentage of all students tested in the last two years whose CAASPP scores indicate that they met or ex-ceeded the state standards for English language arts and mathematics.
Subject Area
Percentage of Students Meeting or Exceeding State Standards School District State
2014–15 2015–16 2014–15 2015–16 2014–15 2015–16 English Language Arts/Literacy (Grades 3–8, 11) 56 55 49 54 44 48 Mathematics (Grades 3–8, 11) 35 31 39 42 34 36
Note: A dash (—) indicates the number of students tested is 10 or less; percentages are not calculated either because the result is too small for statistical ac-curacy or to protect student privacy. An “n/a” indicates no data are available.

San Diego SCPA (368) 6 Spring 2017 School Accountability Report Card
The following tables show the 2015–16 CAASPP results of students in each grade tested, disaggregated by student group, for both English language arts/literacy (ELA) and mathematics.
CAASPP: 2015–16, ELA, Grade 6
Student Group Total
Enrollment Number Tested
Percentage Tested
Percentage Meeting or Exceeding Standard
All students at this school 221 215 97.29 46.98 Male 93 90 96.77 35.56 Female 128 125 97.66 55.20 African American 20 19 95.00 31.58 Asian — — — — Filipino 51 50 98.04 64.00 Hispanic 107 105 98.13 38.10 Native American — — — — Pacific Islander — — — — White (not Hispanic) 13 11 84.62 72.73 Two or More Races 23 23 100.00 56.52 Socioeconomically Disadvantaged 153 150 98.04 38.67 English Learners 28 27 96.43 11.11 Students with Disabilities 29 28 96.55 14.29 Receiving Migrant Education Services 0 0 0 0 Foster Youth — — — —
Note: A dash (—) indicates the number of students tested is 10 or less; percentages are not calculated either because the result is too small for statistical accuracy or to protect student privacy. An “n/a” indicates no data are available.
CAASPP: 2015–16, ELA, Grade 7
Student Group Total
Enrollment Number Tested
Percentage Tested
Percentage Meeting or Exceeding Standard
All students at this school 200 199 99.50 58.29 Male 73 72 98.63 44.44 Female 127 127 100.00 66.14 African American 22 22 100.00 27.27 Asian — — — — Filipino 57 57 100.00 71.93 Hispanic 85 85 100.00 45.88 Native American 0 0 0 0 Pacific Islander — — — — White (not Hispanic) 22 21 95.45 85.71 Two or More Races — — — — Socioeconomically Disadvantaged 128 127 99.22 49.61 English Learners 11 11 100.00 0 Students with Disabilities 30 29 96.67 17.24 Receiving Migrant Education Services 0 0 0 0 Foster Youth — — — —
Note: A dash (—) indicates the number of students tested is 10 or less; percentages are not calculated either because the result is too small for statistical accuracy or to protect student privacy. An “n/a” indicates no data are available.

San Diego SCPA (368) 7 Spring 2017 School Accountability Report Card
CAASPP: 2015–16, ELA, Grade 8
Student Group Total
Enrollment Number Tested
Percentage Tested
Percentage Meeting or Exceeding Standard
All students at this school 216 213 98.61 42.65 Male 76 76 100.00 30.26 Female 140 137 97.86 49.63 African American 34 34 100.00 24.24 Asian — — — — Filipino 51 51 100.00 52.94 Hispanic 85 84 98.82 33.33 Native American 0 0 0 0 Pacific Islander — — — — White (not Hispanic) 23 23 100.00 78.26 Two or More Races 16 15 93.75 28.57 Socioeconomically Disadvantaged 149 146 97.99 36.81 English Learners 16 16 100.00 6.25 Students with Disabilities 24 23 95.83 9.09 Receiving Migrant Education Services 0 0 0 0 Foster Youth — — — —
Note: A dash (—) indicates the number of students tested is 10 or less; percentages are not calculated either because the result is too small for statistical accuracy or to protect student privacy. An “n/a” indicates no data are available.
CAASPP: 2015–16, ELA, Grade 11
Student Group Total
Enrollment Number Tested
Percentage Tested
Percentage Meeting or Exceeding Standard
All students at this school 162 156 96.30 80.52 Male 60 58 96.67 75.86 Female 102 98 96.08 83.33 African American 24 23 95.83 69.57 Asian — — — — Filipino 40 40 100.00 92.50 Hispanic 42 42 100.00 62.50 Native American 0 0 0 0 Pacific Islander — — — — White (not Hispanic) 36 31 86.11 93.55 Two or More Races — — — — Socioeconomically Disadvantaged 77 77 100.00 71.05 English Learners — — — — Students with Disabilities 15 15 100.00 26.67 Receiving Migrant Education Services 0 0 0 0 Foster Youth — — — —
Note: A dash (—) indicates the number of students tested is 10 or less; percentages are not calculated either because the result is too small for statistical accuracy or to protect student privacy. An “n/a” indicates no data are available.

San Diego SCPA (368) 8 Spring 2017 School Accountability Report Card
CAASPP: 2015–16, Mathematics, Grade 6
Student Group Total
Enrollment Number Tested
Percentage Tested
Percentage Meeting or Exceeding Standard
All students at this school 221 214 96.83 24.30 Male 93 90 96.77 23.33 Female 128 124 96.88 25.00 African American 20 19 95.00 10.53 Asian — — — — Filipino 51 50 98.04 52.00 Hispanic 107 104 97.20 11.54 Native American — — — — Pacific Islander — — — — White (not Hispanic) 13 11 84.62 45.45 Two or More Races 23 23 100.00 21.74 Socioeconomically Disadvantaged 153 149 97.39 15.44 English Learners 28 27 96.43 0 Students with Disabilities 29 28 96.55 7.14 Receiving Migrant Education Services 0 0 0 0 Foster Youth — — — —
Note: A dash (—) indicates the number of students tested is 10 or less; percentages are not calculated either because the result is too small for statistical accuracy or to protect student privacy. An “n/a” indicates no data are available.
CAASPP: 2015–16, Mathematics, Grade 7
Student Group Total
Enrollment Number Tested
Percentage Tested
Percentage Meeting or Exceeding Standard
All students at this school 200 199 99.50 41.21 Male 73 72 98.63 31.94 Female 127 127 100.00 46.46 African American 22 22 100.00 27.27 Asian — — — — Filipino 57 57 100.00 52.63 Hispanic 85 85 100.00 30.59 Native American 0 0 0 0 Pacific Islander — — — — White (not Hispanic) 22 21 95.45 66.67 Two or More Races — — — — Socioeconomically Disadvantaged 128 127 99.22 35.43 English Learners 11 11 100.00 0 Students with Disabilities 30 29 96.67 6.90 Receiving Migrant Education Services 0 0 0 0 Foster Youth — — — —
Note: A dash (—) indicates the number of students tested is 10 or less; percentages are not calculated either because the result is too small for statistical accuracy or to protect student privacy. An “n/a” indicates no data are available.

San Diego SCPA (368) 9 Spring 2017 School Accountability Report Card
CAASPP: 2015–16, Mathematics, Grade 8
Student Group Total
Enrollment Number Tested
Percentage Tested
Percentage Meeting or Exceeding Standard
All students at this school 216 213 98.61 20.38 Male 76 76 100.00 26.32 Female 140 137 97.86 17.04 African American 34 34 100.00 3.03 Asian — — — — Filipino 51 51 100.00 39.22 Hispanic 85 84 98.82 10.71 Native American 0 0 0 0 Pacific Islander — — — — White (not Hispanic) 23 23 100.00 36.36 Two or More Races 16 15 93.75 6.67 Socioeconomically Disadvantaged 149 146 97.99 15.28 English Learners 16 16 100.00 0 Students with Disabilities 24 23 95.83 0 Receiving Migrant Education Services 0 0 0 0 Foster Youth — — — —
Note: A dash (—) indicates the number of students tested is 10 or less; percentages are not calculated either because the result is too small for statistical accuracy or to protect student privacy. An “n/a” indicates no data are available.
CAASPP: 2015–16, Mathematics, Grade 11
Student Group Total
Enrollment Number Tested
Percentage Tested
Percentage Meeting or Exceeding Standard
All students at this school 162 151 93.21 43.33 Male 60 57 95.00 47.37 Female 102 94 92.16 40.86 African American 24 23 95.83 17.39 Asian — — — — Filipino 40 40 100.00 55.00 Hispanic 42 41 97.62 25.00 Native American 0 0 0 0 Pacific Islander — — — — White (not Hispanic) 36 27 75.00 66.67 Two or More Races — — — — Socioeconomically Disadvantaged 77 77 100.00 34.21 English Learners — — — — Students with Disabilities 15 15 100.00 13.33 Receiving Migrant Education Services 0 0 0 0 Foster Youth — — — —
Note: A dash (—) indicates the number of students tested is 10 or less; percentages are not calculated either because the result is too small for statistical accuracy or to protect student privacy. An “n/a” indicates no data are available.
California Standards Test: Science—Three-Year Comparison
The following table shows the percentage of all students scoring at the Proficient or Advanced levels (that is, meeting or exceeding the state standards) in science over the most recent three-year period. Science assessments include California Standards Tests (CST), California Modified Assessment (CMA), and the California Alternate Performance Assessment (CAPA).
Grades School District State
2013–14 2014–15 2015–16 2013–14 2014–15 2015–16 2013–14 2014–15 2015–16 5, 8, 10 83 78 64 68 65 59 60 56 54
Note: A dash (—) indicates the number of students tested is 10 or less; percentages are not calculated either because the result is too small for statistical ac-curacy or to protect student privacy. An “n/a” indicates no data are available.

San Diego SCPA (368) 10 Spring 2017 School Accountability Report Card
CAASPP: Science—By Student Group, 2015–16
Science assessments include California Standards Tests (CSTs), California Modified Assessment (CMA), and the California Alternate Performance Assessment (CAPA) in grades 5, 8 and 10.
Student Group Total
Enrollment
Number of Valid Test
Scores
Percentage of Valid Test
Scores
Percentage of Proficient or
Advanced Scores
All students at this school 421 415 98.57 64.34 Male 143 142 99.30 64.08 Female 278 273 98.20 64.47 African American 59 58 98.31 58.62 Asian 11 11 100.00 72.73 Filipino 96 95 98.96 73.68 Hispanic 156 154 98.72 52.60 Native American 0 0 0 0 Pacific Islander — — — — White (not Hispanic) 61 60 98.36 78.33 Two or More Races 35 34 97.14 70.59 Socioeconomically Disadvantaged 247 242 97.98 58.26 English Learners 19 18 94.74 11.11 Students with Disabilities 41 39 95.12 28.21 Receiving Migrant Education Services 0 0 0 0 Foster Youth — — — —
Note: A dash (—) indicates the number of students tested is 10 or less; percentages are not calculated either because the result is too small for statistical accuracy or to protect student privacy. An “n/a” indicates no data are available.
Career Technical Education Programs (2015–16)
Career Technical Education (CTE) in San Diego Unified School District is a program of study involving a sequence of courses within an industry pathway that integrates core academic knowledge with technical skills. The program provides students with multiple pathways to college and careers. The career pathways are organized within 15 state-defined industry sectors, which have been identified as critical for the fiscal stability and prosperity of the State of California. Students complete a career pathway by (a) taking and passing three or more CTE courses in a single, defined field of study, (b) completing the pre- and co-requisite CTE and core curriculum courses, and (c) passing at least one CTE advanced-level course. Student internship opportunities are often available within the advanced-level CTE course curricu-lum. CTE programs of study often fulfill the “a–g” subject-area requirements of the University of California and the California State Uni-versity and may lead to community college credit, an industry-recognized credential, a certificate, or a degree at the postsecondary level.
San Diego SCPA offers CTE courses in the following industry sector: Arts, Media, and Entertainment. Career Technical Education Participation (2015–16)
Data reported in the following table are intended to measure the performance of the school’s career technical education (CTE) programs. “Number of pupils” is the total number of students in all grades at the school who took at least one CTE course during the most recent-
ly completed school year. “Pupils earning a high school diploma who also completed a CTE program” is the number of students who earned a high school di-
ploma during the most recently completed school year and who completed a CTE program at some time during their high school career, divided by the total number of students who earned a high school diploma during the most recently completed school year.
“CTE courses sequenced between the school and postsecondary institutions” is the number of CTE courses the school offers that are sequence or linked (through formal articulation agreements) to courses or programs offered by colleges, universities, or other institutions of postsecondary education, divided by the total number of all CTE courses offered by the school. Such articulation provides high school stu-dents the opportunity to transfer smoothly into postsecondary education and training programs without experiencing delay or duplication of learning.
Measure of CTE Program Participation Participation Students participating in CTE (number) 293 Students earning a high school diploma who also completed a CTE program (%) 0 CTE courses sequenced between the school and postsecondary institutions (%) n/a
Courses for University of California and/or California State University Admission
University of California
Admission requirements for the University of California (UC) follow guidelines set forth in the Master Plan, which requires that the top one-eighth of the state’s high school graduates, as well as those transfer students who have successfully completed specified college work, be eligible for admission to the UC. These requirements are designed to ensure that all eligible students are adequately prepared for univer-sity-level work. For general admissions requirements, please visit the University of California website at admission.universityofcalifornia .edu/

San Diego SCPA (368) 11 Spring 2017 School Accountability Report Card
California State University
Admission requirements for the California State University (CSU) include three factors to determine eligibility: specific high school cours-es; grades in specified courses and test scores; and graduation from high school. Some campuses have higher standards for particular ma-jors or students who live outside the local campus area. Because of the number of students who apply, a few campuses have higher stand-ards (supplementary admission criteria) for all applicants. Most CSU campuses utilize local admission guarantee policies for students who graduate or transfer from high schools and colleges that are historically served by a CSU campus in that region. For general admissions requirements please visit the California State University website at www.calstate.edu/admission/admission.shtml.
This table displays, for the most recent year for which data are available, two measures related to the school’s courses that are required for UC and/or CSU admission. Detailed information about student enrollment in and completion of courses required for UC/CSU admis-sion can be found at the CDE website at dq.cde.ca.gov/dataquest/.
Measure Percentage 2015–16 students enrolled in courses required for UC/CSU admission 1.0 2014–15 graduates who completed all courses required for UC/CSU admission 0.6
State Priority: Other Pupil Outcomes This section provides information relevant to the Other Pupil Outcomes Sate Priority (Priority 8): student outcomes in physical education. The California Physical Fitness Test provides the outcomes in physical education. California Physical Fitness Test Results (2015–16)
The California Physical Fitness Test is administered to students in grades 5, 7, and 9 only. This table displays by grade level the percentage of students tested who met the fitness standards for the most recent testing period. Data on students receiving migrant education services are not available. Detailed information regarding this test, and comparisons of a school’s test results to the district and state levels, may be found at the CDE website at www.cde.ca.gov/ta/tg/pf/.
Grade Level
Percentage of Students Tested Who Met Fitness Standards
Four of Six Standards Five of Six Standards Six of Six Standards 7 21.9 22.5 26.7 9 19.9 20.9 43.9
Note: A dash (—) indicates the number of students tested is 10 or less; percentages are not calculated either because the re-sult is too small for statistical accuracy or to protect student privacy. An “n/a” indicates no data are available.
Engagement
State Priority: Parental Involvement This section provides information relevant to the Parental Involvement State Priority (Priority 3): efforts the school district makes to seek parent input in making decisions for the school district and each school. Opportunities for Parent Involvement
Parents and other relatives are encouraged and welcomed to become involved in the formal education of their children. Educational re-search validates that support at home is critical to a child’s academic success. There are many opportunities to be involved at their chil-dren’s school site, including: governance committees, special events, fundraising events, parent organizations, and in classrooms, and at the district level by participating in cluster councils, district advisory councils/committees, Parent University, and special events. Parents are encouraged to support their children at home by making their expectations about school clear and creating a positive learning environment at home.
SDSCPA has many ways for parents and community members to be involved. The Site Governance Team, School Site Council, and English Language Advisory Committee (ELAC) meet monthly, and the public is welcome to attend these meetings. The Friends of SDSCPA Foundation provides essential financial support and volunteer service. Parent involvement at SDSCPA also includes frequent opportunities to visit classrooms, Bring Your Parent to School Day, parent workshops scheduled in the evening and on weekends, and par-ents who supervise field trips as well as schoolwide and classroom performances. Community partners enhance curriculum by providing performance and collaborative opportunities, financial support, internships, mentors, and more. SDSCPA welcomes involvement by all stakeholders—family, community, educational, business, and artistic.
If you want to get involved, please contact Donna Silva Garcia at (619) 470-0555, ext. 2402.

San Diego SCPA (368) 12 Spring 2017 School Accountability Report Card
State Priority: Pupil Engagement This section provides information relevant to the Pupil Engagement State Priority (Priority 5): • High school dropout rates • High school graduation rates Dropout Rate and Graduation Rate This table displays the school’s four-year “cohort” dropout rates and graduation rates for the most recent three-year period for which data are available. (A cohort is the group of first-time grade 9 students in a given school year, plus students who transfer in, less students who transfer out, emigrate, or die, during that and the following three school years. A graduate is a cohort member who earns a regular high school diploma by the end of the cohort’s fourth year.) For comparison purposes, data are also provided at the district and state levels. De-tailed information about dropout rates and graduation rates can be found on the DataQuest website at dq.cde.ca.gov/dataquest/.
Indicator School District State
2012–13 2013–14 2014–15 2012–13 2013–14 2014–15 2012–13 2013–14 2014–15 Dropout Rate (cohort) 0.0 0.7 0.0 5.2 4.5 3.5 11.4 11.5 10.7 Graduation Rate (cohort) 99.4 99.3 99.5 87.9 89.7 89.4 80.4 81.0 82.3
Completion of High School Graduation Requirements
This table displays, by student group, the percentage of students who began the 2014–15 school year in grade 12 and who met all state and local graduation requirements for grade 12 completion. Percentages may be greater than 100 due to changes in enrollment between the beginning of school and the date of graduation.
Graduating Class of 2015 Group School District State All Students 100+ 84.3 85.7 African American 100+ 76.2 76.9 Asian 100+ 93.9 92.8 Filipino 100+ 90.6 96.8 Hispanic 100+ 80.8 84.5 Native American — 85.7 74.9 Pacific Islander 100+ 79.1 84.9 White (not Hispanic) 87.50 89.8 87.2 Two or More Races 100+ 94.9 91.4 Socioeconomically Disadvantaged 100+ 83.4 76.6 English Learners 100+ 47.4 50.9 Students with Disabilities 100+ 51.1 68.4 Foster Youth — — —
Note: A dash (—) indicates the number of students is 10 or less; percentages are not calculated ei-ther because the result is too small for statistical accuracy or to protect student privacy. An “n/a” indi-cates no data are available.
State Priority: School Climate This section provides information relevant to the School Climate State Priority (Priority 6): • Student suspension rates • Student expulsion rates • Other local measures to ensure safety Suspensions and Expulsions The following table shows the rates of suspensions and expulsions. Rates per 100 students are the total number of incidents divided by the school’s enrollment for the given year, multiplied by 100. The district comparison rates are the expected rates for the school’s enrollment and grade-level composition, based on actual districtwide rates. Because suspension and expulsion rates vary greatly by grade level, and since any given two schools are not likely to have identical enrollment numbers per grade, schools will have different district comparison rates. District figures do not include charter schools.
Type of Action 2013–14 2014–15 2015–16
School District State School District State School District State Suspensions 0.94 4.68 4.36 0.84 3.48 3.80 0.67 3.43 3.65 Expulsions 0.00 0.11 0.10 0.00 0.07 0.09 0.00 0.07 0.09

San Diego SCPA (368) 13 Spring 2017 School Accountability Report Card
School Safety Plan (2016–17)
Last Review/Update: September 25, 2015 Last Discussed with Staff: September 16, 2016 Campus safety is the district’s top priority. Principals, teachers, support staff, school police services, and community organizations work together to prevent, prepare, and respond to emergency situations. To ensure safety and security, each school has a state-mandated individ-ual emergency response plan that is updated annually and posted on the school’s website. School staff members participate in regular emergency-preparedness drills and response training. Substance abuse prevention programs are presented to students regularly. Policies and procedures are in place to address safe entry and exit of students; serious disciplinary problems; discrimination, harassment and bully-ing; mandated child abuse reporting procedures; and school dress codes.
Adult supervision is provided in the classrooms and outside areas before and after school, during recess and lunch, and during passing time between classes. Under the direction of the principal or site administrator, school staff members implement specific school-building security procedures. In addition, district offices support schools by reviewing and disseminating safety requirements and information, coor-dinating safety-related services, and providing safety training and assistance.
SCPA’s reputation as a safe school is well known. Two vice principals and one campus security assistant deal with serious issues that affect school climate and student safety. San Diego Unified School Police Department officer is also on campus most days of the week to ensure student safety.
Other Information
This section provides information that is required by law to be included in the SARC but is not included in the state priorities for the LCFF. Federal Intervention Program (2016–17)
Schools that receive funding from the federal government under Title I must enter federal Program Improvement (PI) if they do not make AYP for two consecutive years in the same content area (English language arts or mathematics) or on the same indicator (API or gradua-tion rate). After entering PI, schools and districts advance to the next level of intervention with each additional year that they do not make AYP. Detailed information about PI identification and status can be found at the CDE website at www.cde.ca.gov/ta/ac/ay/tidetermine.asp.
Indicator School District Program Improvement Status In PI In PI First Year of Program Improvement 2009–10 2009–10 Year in PI* 5 3+ Number of Schools Currently in Program Improvement†
145
Percentage of Schools Currently in Program Improvement† 75.1 * A determination waiver (DW) indicates that the PI status of the school was carried over from the prior year in accordance with the flexibility granted through the federal waiver process. † Includes charter schools. Average Class Size and Class Size Distribution (Secondary)
This table displays the average class size for each subject area and the number of classrooms that fall into each class size category.
Subject
2013–14 2014–15 2015–16 Avg. Class Size
Number of Classrooms Avg. Class Size
Number of Classrooms Avg. Class Size
Number of Classrooms
1–22 23–32 33+ 1–22 23–32 33+ 1–22 23–32 33+ English 25 14 14 19 29 8 13 23 30 8 15 28 Mathematics 25 14 19 11 26 13 13 17 28 7 21 18 Science 31 4 14 17 29 6 14 18 30 5 16 23 History–Social Science 30 4 13 14 27 10 6 19 30 6 9 25

San Diego SCPA (368) 14 Spring 2017 School Accountability Report Card
Academic Counselors and Other Support Staff Members (2015–16)
This table displays, in units of full-time equivalents (FTE), the number of academic counselors and other support staff members who are assigned to the school. One FTE equals one staff member working full time; one FTE could also represent two staff members who each work 50 percent of full time. The table also displays the average number of students for each academic counselor.
Position Number of FTE Assigned
to the School Average Number of Students per
Academic Counselor Academic Counselor 4.0 355.50 Counselor (Social/Behavioral or Career Development) 0.0
Library Media Teacher (Librarian) 0.0 Library Media Services Staff (Paraprofessional) 1.0 Psychologist 2.0 Social Worker 1.0 Nurse 1.0 Speech/Language/Hearing Specialist 1.0 Resource Specialist (Non-Teaching) 0.0 Artistic Director 1.0 Community Arts Liaison 1.0 Other (Specify) 0.0
Expenditures per Pupil and School-Site Teacher Salaries (Fiscal Year 2014–15)
The following table displays this school’s expenditures per student from basic (unrestricted) sources, from any supplemental (restricted) sources, and its total per-pupil expenditures. The table also provides a comparison of the school’s per-pupil expenditures from basic sources with other schools in the district and throughout the state. Finally, it compares the average teacher salary at the school with average teacher salaries in the district and the state.
Basic or unrestricted sources are funds that, except for general guidelines, are not controlled by law or by a donor. Supplemental or re-stricted sources are funds whose use is controlled by law or by a donor. Money that is designated for specific purposes by the Board of Education is not considered restricted.
For detailed information on school expenditures for all districts in California, see the CDE Current Expense of Education and Per-pupil Spending webpage: www.cde.ca.gov/ds/fd/ec/. For information on teacher salaries for all districts in California, see the CDE Certificated Salaries and Benefits webpage: www.cde.ca.gov/ds/fd/cs/. To look up expenditures and salaries for a specific school district, see the Ed-Data website at: www.ed-data.org.
Level Total Expenditures
Per Pupil Expenditures Per
Pupil (Supplemental) Expenditures Per
Pupil (Basic) Average
Teacher Salary School Site $6,195 $899 $5,297 $71,132 District (excludes charter schools)
$5,671 $73,582 Difference: School Site and District (%) -6.6 -3.3 State $5,677 $75,837 Difference: School Site and State (%) -6.7 -6.2
Types of Services Funded (Fiscal Year 2015–16)
The district’s general fund includes monies for: • General operations—salaries, benefits, services, materials, and support to the general education • Special Education—programs offering appropriate, individualized instruction to students with special needs • Special projects—monies from agencies (federal or state) earmarked for specific programs/projects or services • Transportation • Maintenance and operations • District administration Each school in the district receives an instructional budget based on enrollment, programs, and formulas set by Board of Education pol-
icy, state law, agreements with employee bargaining units, and guidelines of outside funding sources.

San Diego SCPA (368) 15 Spring 2017 School Accountability Report Card
Teacher and Administrative Salaries (Fiscal Year 2014–15)
This table displays district-level salary information for teachers, principals, and the superintendent, and compares these figures to the state averages for districts of the same type and size. The table also displays teachers and administrative salaries as a percentage of a district’s budget, and compares these figures to the state averages for districts of the same type and size. Detailed information regarding salaries may be found at the CDE website at www.cde.ca.gov/ds/fd/cs/.
Position District Amount Statewide Average for
Districts in Same Category Beginning Teacher Salary $42,632 $45,092 Mid-Range Teacher Salary $64,780 $71,627 Highest Teacher Salary $88,049 $93,288 Average Principal Salary (Elementary School Level) $122,585 $115,631 Average Principal Salary (Middle School Level) $125,249 $120,915 Average Principal Salary (High School Level) $136,833 $132,029 Superintendent Salary $261,667 $249,537 Percentage of Budget for Teachers’ Salaries 37% 37% Percentage of Budget for Administrative Salaries 5% 5%
Advanced Placement Courses (2015–16) This table displays for the most recent year the number of Advanced Placement (AP) courses offered by the school, by subject, in which at least one student was enrolled, and the percentage of the school’s students enrolled in all AP courses. Detailed information about student enrollment in AP courses can be found at the CDE website at dq.cde.ca.gov/dataquest/.
Subject Number of
AP Courses Offered
Percentage of Students in AP Courses
Computer Science 0
English 2 History–Social Science 6 Mathematics 1 Science 3 Visual and Performing Arts 4 World Languages 0
Total 16 30.4 Professional Development The district and the Board of Education have set a high priority on professional development, with the goal of providing targeted profes-sional development to build teachers’ leadership capacity and knowledge to support student learning success. The Office of Leadership and Learning collaborates with other departments to provide teachers and administrators with ongoing professional development, including improving teaching and learning related to the Common Core State Standards, educational technology, advanced studies, and leadership development. Sessions offered at various times throughout the year focus on a wide variety of professional development aimed at strength-ening content knowledge to meet the needs of all learners, with an emphasis on targeting the needs of our English language learners, stu-dents with disabilities, and other struggling learners.
In addition to district-provided professional development, principals identify a schoolwide focus each year for professional develop-ment based on student needs and also to determine areas of individual growth and development. Throughout the year, teachers participate in school-based professional learning communities (PLCs) to encourage best practices and engage in shared problem solving. Teachers are provided with useful data systems that allow them to improve the learning of each student. Staff release for professional development is organized in a variety of ways on a site-by-site basis throughout the year.
All staff members engage in a data-driven professional inquiry process in order to set the national standard in academic and art instruc-tion through positive relationships, relevance, and rigor for all students. Instruction and Curriculum The San Diego Unified School District Board of Education has formally adopted academic standards and curriculum frameworks approved by the California State Board of Education for all subject areas. District curriculum materials, instructional strategies and supports, profes-sional development, and student assessments are aligned with state standards and focused on ensuring that every student has access to a high-quality, rigorous, and engaging instructional program. A range of support opportunities is available for students needing additional assistance.
SCPA encourages students to take the strongest possible academic program, balanced with a rich arts curriculum. Well-prepared stu-dents can go on to further education and/or training in whatever direction their talents and interests lead. Students are encouraged to enroll in advanced, honors, and Advanced Placement (AP) courses whenever they have met applicable prerequisites.
SCPA’s curriculum-improvement program focuses on purposeful planning with students’ needs in mind. We work diligently to pro-mote student achievement by improving and evolving instructional practices. Staff development activities, master classes, and workshops teach “best practices” and support student learning.

San Diego SCPA (368) 16 Spring 2017 School Accountability Report Card
Appendix: Adopted Texts and Instructional Materials
Subject Area
Grade Level
District Course (for secondary courses) Instructional Material or Textbook
Copyright Date
Adoption Year
Middle Level
ELA 5 English 5th (middle) Houghton Mifflin Reading: A Legacy of Literacy, Houghton Mifflin 2003 2002–03
ELA 6–8 English 6th–8th Prentice Hall Literature: Timeless Voices, Timeless Themes, Prentice Hall
2003 2002–03
ELD 6–8 ELD Level 1 Keys to Learning, Pearson Longman 2005 2008–09
ELD 6–8 ELD Level 2 Shining Star Level A, Pearson Longman 2004 2008–09
ELD 6–8 ELD Level 3 Prentice Hall Literature: Timeless Voices, Timeless Themes, Prentice Hall School Division
2002 2002–03
H-SS 6 Social Studies 6th Holt CA Social Studies: World History, Ancient Civilizations, Holt McDougal
2006 2007–08
H-SS 7 World History 7th Holt CA Social Studies: World History, Medieval to Early Modern Times, Holt McDougal
2006 2007–08
H-SS 8 U.S. History 8th Holt CA Social Studies: U.S. History, Independence to 1914, Holt McDougal
2006 2007–08
Math 6 Common Core Math 6th
Big Ideas Math Course 1: A Common Core Curriculum, CA, Big Ideas Learning
2015 2014–15
Math 6 Advanced Math 6th Big Ideas Math Course 1: A Common Core Curriculum, CA, Big Ideas Learning
2015 2014–15
Math 7 Common Core Math 7th
Big Ideas Math Course 2: A Common Core Curriculum, CA, Big Ideas Learning
2015 2014–15
Math 7 Advanced Math 7th Big Ideas Math Course 2: A Common Core Curriculum, CA, Big Ideas Learning
2015 2014–15
Math 8 Common Core Math 8th
Big Ideas Math Course 3: A Common Core Curriculum, CA, Big Ideas Learning
2015 2014–15
Math 8 Advanced Integrated Math I
Mathematics I: Integrated CME Project, Pearson. 2013 2014–15
Math 8 Advanced Integrated Math II
Mathematics II: Integrated CME Project, Pearson. 2013 2014–15
Science 6 Science 6th California Focus on Earth Science, Pearson Prentice Hall 2008 2008–09
Science 7 Science 7th Focus on Life Sciences, California Edition, McDougal Littell 2007 2008–09
Science 7 Science 7th - Computers & Technology 1,2
Focus on Life Sciences, California Edition, McDougal Littell 2007 2008–09
Science 8 Science 8th Interactions in Physical Science, California Edition, It’s About Time 2007 2008–09
Science 8 Science 8th 1,2 Advanced Interactions in Physical Science, California Edition, It’s About Time 2007 2008–09
High School Level
ELA 9 English 1,2 Literature for California, Grade 9, McDougal Littell 2009 2008–09 ELA 10 English 3,4 Literature for California, Grade 10, McDougal Littell 2009 2008–09 ELA 10 English 3,4 Advanced Prentice Hall Literature: World Masterpieces, Pearson Prentice Hall 2009 2008–09 ELA 11 American Literature 1,2 Language of Literature, American Literature, McDougal Littell 2006 2003–04 ELA 11 American Literature 1,2
Honors Language of Literature, American Literature, McDougal Littell 2006 2003–04
ELA 11–12 Contemporary Voices in Literature 1,2
Contemporary Reader, 7th ed., Prentice Hall –or– Legacies, 2nd ed., Thomson Learning
2004 2002
2003–04 2003–04
ELA 11–12 World Literature 1,2 The Language of Literature, World Literature, McDougal Littell 2003 2003–04
ELA 11 English Language & Composition AP 1,2
Readings for Writers, Thomson Learning Norton Reader, Norton
2004 2005
2004–05
ELA 12 English Literature 1,2 Timeless Voices, Timeless Themes—The British Tradition, Prentice Hall
2005 2004–05
ELA 11–12 English Literature & Composition AP 1,2
Reading Fiction, Poetry, and Drama, Glencoe/McGraw-Hill 2010 2009–10
ELA 12 Expository Reading and Writing
Teachers of this course receive instructional materials during specialized training.
— —
ELA 11–12 Writers Workshop 1,2 Steps to Writing Well, with Additional Readings, Thomson Learning Writers INC, Great Source
2002 2001
2003–04
ELD 9–12 ELD 1-2 Champion—Red Level, Ballard & Tighe Keys to Learning, Pearson Longman
2008 2005
2008–09 2008–09
ELD 9–12 ELD 3-4 Champion—Blue Level, Ballard & Tighe Quest: Introduction, McGraw-Hill ESL/ELT
2007 2007
2008–09 2008–09

San Diego SCPA (368) 17 Spring 2017 School Accountability Report Card
Subject Area
Grade Level
District Course (for secondary courses) Instructional Material or Textbook
Copyright Date
Adoption Year
ELD 9–12 ELD 5-6 Quest 1, McGraw-Hill ESL/ELT 2007 2008–09 H-SS 10 Modern World History &
Geography 1,2 Modern World History: Patterns of Interaction, California Edition, McDougal Littell
2006 2008–09
H-SS 10 World History 1,2 Ad-vanced
World History: Modern Times, California Edition, Glencoe 2006 2005–06
H-SS 10 World History 1-2 AP The Earth and Its Peoples, McDougal Littell 2008 2008–09 H-SS 10-12 European History 1,2 AP Western Civilization, Thomson 2003 2004–05 H-SS 10-12 Psychology 1,2 AP Myer’s Psychology for AP, 2nd ed., BFW/Worth 2015 2015–16 H-SS 11 U.S. History & Geography
1,2 The Americans: Reconstruction to the 21st Century, California Edi-tion, McDougal Littell
2006 2008–09
H-SS 11 U.S. History & Geography 1,2 Honors
A People and a Nation, McDougal Littell 2008 2008–09
H-SS 11 U.S. History 1,2 AP AP American History: Connecting with the Past, McGraw-Hill 2015 2015–16 H-SS 12 Principles of Economics 1 Economics: Principles In Action, Prentice Hall 2003 2003–04 H-SS 12 Government 1 United States Government: Democracy in Action, Glencoe 2003 2003–04 H-SS 12 American Government in
World Affairs World Politics in the 21st Century, Prentice Hall 2004 2004–05
H-SS 12 Government & Politics: United States AP
Government in America: People, Politics, and Policy, 16th AP ed., Pearson
2014 2015–16
H-SS 12 Microeconomics 1 AP Economics, Glencoe/McGraw-Hill 2005 2004–05 H-SS 12 Macroeconomics 2 AP Economics, Glencoe/McGraw-Hill 2005 2004–05 Math 9–12 Integrated Math I Mathematics I: Integrated CME Project, Pearson 2013 2014–15 Math 9 Advanced Integrated
Math I Mathematics I: Integrated CME Project, Pearson 2013 2014–15
Math 9–11 Integrated Math II Mathematics II: Integrated CME Project, Pearson 2013 2014–15 Math 9–10 Advanced Integrated
Math II Mathematics II: Integrated CME Project, Pearson 2013 2014–15
Math 10–12 Integrated Math III Mathematics III: Integrated CME Project, SE, Pearson 2014 2014–15 Math 10–11 Advanced Integrated
Math III Mathematics III: Integrated CME Project, SE, Pearson 2014 2014–15
Math 9–12 Algebra 1-2 Prentice Hall Mathematics: Algebra, California Edition, Prentice Hall 2009 2009–10 Math 9–12 Geometry 1-2 Prentice Hall Mathematics: Geometry, California Edition, Prentice
Hall 2008 2009–10
Math 10–12 Intermediate Algebra 1-2 Algebra 2, Holt 2004 2005–06 Math 10 Intermediate Algebra 1-2
Advanced Algebra 2, California Edition, Glencoe 2005 2005–06
Math 11–12 Precalculus 1-2 Honors Precalculus: Graphical, Numerical, Algebraic, Prentice Hall 2004 2004–05 Math 11–12 Precalculus 1-2 Precalculus, Prentice Hall 2004 2004–05 Math 11–12 Statistics and Data
Analysis 1-2 Workshop Statistics: Discovery with Data and the Graphing Calcula-tor, Key Curriculum Press
2002 2003–04
Math 11–12 Statistics 1-2 AP The Practice of Statistics for the AP Exam, 5th ed., BFW/Freeman 2015 2015–16 Math 11–12 Topics in Discrete
Mathematics 1,2 Finite Mathematics and Calculus with Applications, Prentice Hall 2002 2003–04
Math 12 Calculus AB 1,2 AP Calculus: Graphical, Numerical, Algebraic, AP 5th ed., Pearson 2016 2015–16 Science 9–12 Earth Science 1,2 Holt Earth Science, California Edition, Holt Rinehart Winston 2007 2007–08 Science 9–12 Physics 1,2 Conceptual Physics, Pearson Prentice Hall 2006 2007–08 Science 9–12 Physics 1,2 Advanced CA Physics: Principles and Problems, Glencoe/McGraw-Hill 2008 2007–08 Science 11–12 AP Physics 1 A,B Wilson and Buffa, Physics, Prentice Hall 2003 2005–06 Science 11–12 Physics C 1,2 AP Physics for Scientists and Engineers, Cengage 2008 2008–09 Science 9–12 Chemistry 1,2 Chemistry, California Edition, Prentice Hall 2007 2009–10 Science 9–12 Chemistry 1,2 Honors Principles of General Chemistry, Glencoe McGraw-Hill 2010 2009–10 Science 11–12 Chemistry 1,2 AP Chemistry: The Central Science, Prentice Hall 2009 2009–10 Science 9–12 Biology 1,2 BSCS Biology: A Human Approach, 2nd ed., Kendall Hunt 2003 2004–05 Science 9–12 Biology 1,2 Advanced Biology: Concepts and Connections, Pearson Prentice Hall 2003 2005–06 Science 11–12 Biology 1,2 AP Campbell Biology, 10th ed., Pearson 2014 2015–16 Science 11–12 Marine Science ,2 Oceanography: An Invitation to Marine Science, Thomson 2007 2007–08 Science 11–12 Physiology 1,2 Principles of Anatomy and Physiology, Wiley 2006 2005–06 Science 11–12 Environmental Science
1,2 AP Environment: The Science Behind the Stories, AP 5th ed., Pearson 2014 2015–16
Note: ELA = English Language Arts; ELD = English Language Development; H-SS = History–Social Studies.