choline metabolism · 2003-02-27 · choline metabolism i. the occurrence and prevention of...
TRANSCRIPT

CHOLINE METABOLISM
I. THE OCCURRENCE AND PREVENTION OF HEMORRHAGIC DEGENERATION IN YOUNG RATS ON A LOW CHOLINE DIET*
BY WENDELL H. GRIFFITH AND NELSON J. WADE
(Prom the Laboratories of Biological Chemistry and of Biology, St. Louis University School of Medicine, St. Louis)
(Received for publication, October 4, 1939)
The lipotropic action of choline and of related compounds has been extensively investigated since this effect was demonstrated in rats (2, 3). These studies on the relation of choline to the pro- tein, fat, carbohydrate, and cholesterol metabolism of the rat have recently been reviewed by Best and Ridout (4).
In this series of papers, evidence is presented for a hitherto unrecognized effect of choline deficiency in young rats. The deficiency was produced within 10 days on a low choline diet and was characterized by an extremely toxic state during which there occurred a marked hemorrhagic degeneration of the kidneys. The renal lesions could be prevented by amounts of choline which were insufficient for the prevention of fatty livers. Furthermore, the choline requirement for the prevention of the renal lesions was definitely related to the cystine and methionine content of the dietary protein (1, 5). Paper I of this series deals with the pro- duction of fatty livers in young rats and with the newly described effect of choline deficiency. Certain aspects of the relation of this deficiency to dietary protein, fat, and cholesterol and the interrelationship of choline, cystine, and methionine have been investigated and will be discussed in subsequent papers.
EXPERIMENTAL
Male rats, 38 to 42 gm. in weight and averaging 24 days of age, were placed in raised cages and fed the experimental diets ad
* Presented before the meeting of the Society for Experimental Biology and Medicine at St. Louis, April 12, 1939 (1).
567
by guest on February 25, 2020http://w
ww
.jbc.org/D
ownloaded from

568 Choline Metabolism. I
libitum. The food intake was determined although none of these data are included in this paper. At the end of the experimental period the rats were killed by decapitation. The liver and in later experiments the thymus, spleen, and kidneys (without the capsule) were removed at once and weighed. The latter three organs were then dried to constant weight in an oven at 105”. Total chloroform-soluble substances in the liver were determined by the method described by Channon, Platt, and Smith (6). The term “liver fat” in Tables I to V refers in every case to this fraction.
The composition of the various diets is indicated in Tables I to V. Commercial preparations of fibrin, egg albumin (dried egg white), agar, sucrose, and lard were used. Casein was purified by extraction with water which was changed twice daily for 10 days. The washed casein was allowed to stand in alcohol for sev- eral days and was then filtered and dried by exposure to air. The salt mixture of Hawk and Oser (7) was used but was modified by the addition of 0.016 per cent of copper sulfate. This mix- ture was further supplemented by the addition of 1 per cent of calcium carbonate to the diet. Vitamins A and D were supplied by cod liver oil or by the fortified fish liver oil, Nato1a.l Pow- dered brewers’ yeast was used as a source of the water-soluble vitamins. In certain experiments the yeast was replaced by sup- plements of thiamine chloride, riboflavin, nicotinic acid, and con- centrated extracts of rice polish and hog liver.2 The rice polish extract was a commercial product of known vitamin Be potency. The liver extract was prepared according to the directions of Lep- kovsky, Jukes, and Krause (8).
Liver fat is expressed in Tables II to V as the actual weight of chloroform-soluble substances, as its per cent in liver tissue, and as the ratio obtained by dividing the actual weight by the ex- pected weight of the chloroform-soluble fraction of the livers of normal control rats. The weight of the liver is expressed as the actual weight and as its “per cent of normal.” The latter value
1 We wish to thank Parke, Davis and Company for the generous supply of Natola used in these experiments.
2 We wish to thank Merck and Company, Inc., for the generous supplies of thiamine chloride and riboflavin used in these experiments.
by guest on February 25, 2020http://w
ww
.jbc.org/D
ownloaded from

W. H. Griffith and N. J. Wade 569
indicates the comparison between the weights of the livers of experimental and normal rats. Values for the liver fat and for the liver weight of the young normal male rats of this colony are shown in Table I. The data in Table I were used to calculate the ex- pected liver weight (4.31 per cent of the body weight) and the ex- pected liver fat (1.73 mg. X body weight in gm.) of normal rats having the same body weight as the experimental rats.
TABLE I
Relation of Body Weight, Liver Weight, and Liver Pat in Young Normal Male Rats on Stock Diet
Body weight
No. of rats
Range
gm.
24 34- 48 24 54- 84 20 80- 91 21 96-113 25 113-137 21 156-196
Average.
AW?l%ge AVSagf2
gm. gm. m3.
39.2 1.51 3.88 60 66.7 2.86 4.28 123 85.4 3.81 4.46 152
103.8 4.58 4.42 181 125.8 5.72 4.55 211 172.0 7.31 4.25 305
Liver weight
I / 4.31 (
Liver fat
3.98
4.30 3.99 3.95 3.69 4.17
mg.
1.53 1.84 1.78 1.75 1.68 1.77
4.01 1.73
Results
Production of Fatty Livers in-Young Male Rats-At the start of this investigation it was assumed that a low protein diet was essen- tial for the production of fatty livers in young rats. A source of protein which was low in choline and high in biological value appeared necessary if young rats were to grow normally on a diet of low protein content. A survey of the amino acid composition of fibrin, casein, and ovalbumin indicated that these were excellent supplementing proteins. Sixteen high fat diets were prepared containing these proteins, alone and in various combinations, in order to determine the minimum level of dietary protein which would permit a fair rate of growth. Both liver and yeast were added to the basal ration to be certain that the water-soluble vita- mins were supplied in adequate amounts although it was recog-
by guest on February 25, 2020http://w
ww
.jbc.org/D
ownloaded from

570 Choline Metabolism. I
nized that these supplements contained choline (9). Table II shows the rate of growth and the weights of liver tissue and of liver fat of groups of rats after a 30 day experimental period on nine of these sixteen diets. In spite of the fact that the diets were
TABLE II
Relation of Dietary Protein and of Choline to Deposition of Liver Fat and to Rate of Growth of 40 Gm. Male Rats during 30 Day Experimental
Period (Average Values per Group of Ten Rats)
The composition of the basal diet was, except as noted, protein as indi- cated, lard 35, salt mixture 4, calcium carbonate 1, agar 2, cod liver oil 5, dried hog liver 2, powdered yeast 5, sucrose to 100.
T Group No.
l-H18 2-H24 3-c4 4-C2 5-K31 6-N34 7-M33 8-G12 g-G14
lo-T40 11-B6 12-Bl 13-Fll 14-F13
Dietary protein
Fib- rin
Per Pm cent cent
6 6 6 6 4 4 4 4 0 0 2 5 0 7.5 0 10 0 10 5 0 2 2 2 2 0 5 0 5
-
( k&n
-
I ’
-
-
41bu- min
Per cent
3 3 2 2
10 3 2.5 0 0 0 1 1 0 0
0 9 $a ez
OE! .e M I+ 2% V
ml.
0 5 0 5 0 0 0 0 5 0 0 5 0 5
wk.
107 111
99 105
87 87 85 72 68 65 61 78 45 49
-
Liver
Yeight ave*-
age
t7m. mg.
7.58 164 2321 30.6 4.75 99 283 6.0 5.50 129 1501 27.3 4.50 99 213 4.7 5.15 137 1584 30.8 7.00 186 2364 33.8 5.60 153 1675 29.9 4.00 129 1076 26.9 2.85 97 174 6.1 4.55 162 1689 37.1 3.70 140 1019 27.5 3.35 100 182 5.4 2.40 124 431 18.0 2.33 110 192 8.2
Liver fat
Veight aver- w!e
Pi?I Ysnt 01 liver
12.5 1.5 8.8 1.2
10.5 15.7 11.4
8.6 1.5
15.0 9.7 1.3 5.5 2.3
* Weight of liver X 100 i 0.0431 X body weight (Table I). t Weight of liver fat t 1.73 X body weight (Table I).
by no means devoid of choline, fatty livers were produced in every case unless extra choline was supplied. The experiments demon- skated that young rats very readily developed a fatty liver on high fat diets only moderately low in choline. Contrary to the original assumption, a low protein diet, was not found to be a pre-
by guest on February 25, 2020http://w
ww
.jbc.org/D
ownloaded from

W. H. Griffith and N. J. Wade
requisite for the production of the fatty liver in young rats. This was illustrated by the results of feeding diets containing 15, 10, and 5 per cent of the same protein mixture (Groups 1, 3, and 11). The average increases in body weight for these three groups during the experimental period were 67, 59, and 21 gm. and the average weights of liver fat were 2321, 1501, and 1019 mg. respectively. Prevention of the fatty liver did not significantly improve the rate of growth (Groups 2,4, 9, 12, and 14).
It was generally true in these experiments that the deposition of liver fat was intensified on those diets permitting the better rates of growth. The liver fat in rats fed a ration containing 10 per cent of casein (Group 8) was much greater than that found if the ration contained only 5 per cent of casein (Group 13). This effect in young rats was the opposite of that reported for older rats in which casein has been observed to exhibit a lipotropic ac- tivity (10). Fibrin was more effective in producing fatty livers than either casein or albumin. This was illustrated by a com- parison of the results of Group 6 with those of Groups 5, 7, and 8 and of the results of Group 10 with those of Groups 11 and 13. Channon et al. (11) reported that fibrin was less lipotropic than casein.
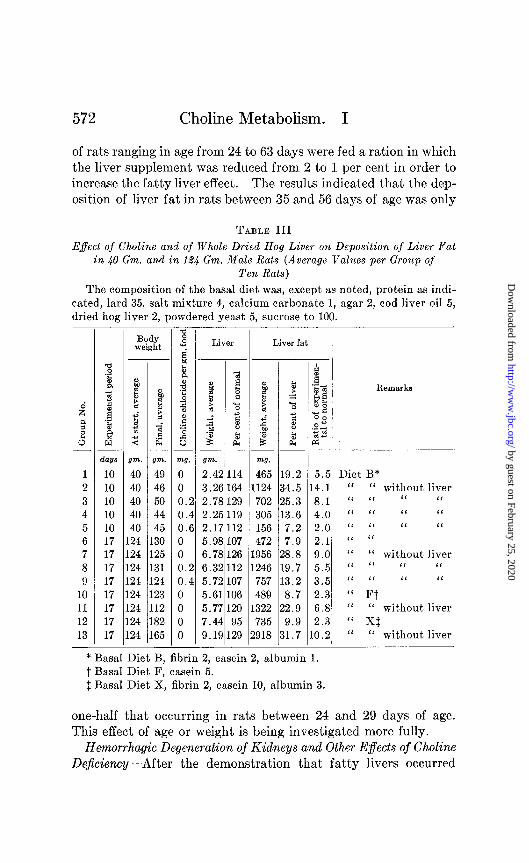
Table III shows the results of feeding three of these diets (basal Diets B, F, and X) to 124 gm. rats for 17 days (Groups 6, 10, and 12). The liver fat was increased only 2.1, 2.3, and 2.3 times, respectively, in these larger and older animals. Diets B and F, fed to 40 gm. rats for 30 days, resulted in increases of liver fat of 9.7 and 5.5 times respectively (Table II, Groups 11 and 13), and Diet B, fed to 40 gm. rats for 10 days, increased the liver fat 5.5 times (Table III, Group 1). It was evident from these results that the choline requirement of the 40 gm. rats was definitely greater t,han that of the 124 gm. rats. These older rats de- veloped markedly fatty livers if the 2 per cent hog liver supple- ment was omitted from the basal ration. Table III shows the results with and without the liver supplement (Groups 1 and 2, 6 and 7, 10 and 11, 12 and 13) and also the effect of choline in replacing the liver supplement (Groups 1 to 5 and 6 to 9).
The observation that 124 gm. rats developed only slightly fatty livers on diets which produced markedly fatty livers in 40 gm. rats was confirmed by the experiments recorded in Table IV. Groups
by guest on February 25, 2020http://w
ww
.jbc.org/D
ownloaded from
572 Choline Metabolism. I
of rats ranging in age from 24 to 63 days were fed a ration in which the liver supplement was reduced from 2 to 1 per cent in order to increase the fatty liver effect. The results indicated that the dep- osition of liver fat in rats between 35 and 56 days of age was only
TABLE III
Effect of Choline and of Whole Dried Hog Liver on Deposition of Liver Pat in 40 Gm. and in 124 Gm. Male Rats (Average Values per Group of
Ten Rats)
The composition of the basal diet was, except as noted, protein as indi- cated, lard 35, salt mixture 4, calcium carbonate 1, agar 2, cod liver oil 5, dried hog liver 2, powdered yeast 5, sucrose to 100.
days 1 10 2 10 3 10 4 10 5 10 6 17 7 17 8 17 9 17
10 17 11 17 12 17 13 17
Body weight
II
gm. 40 40 40 40 40 124 124 L24 L24 124 124 124 124
1: 1: 1: 1: 1: 1 1: l(
‘rn.
49 46 60 44 45 30 25 31 24 23 12 32 85
-
- a 8
s' I 2 & 0 2 4 3 z " 0 6
WI. 0 0 0.: 0.i 0.t 0 0 0.: 0.4 0 0 0 0
Liver
D E E ti E
gm. 2.4; 3.2E 2.76 2.2E 2.15 5.98 6.7E 6.39 5.72 5.61 5.77 7.44 9.15
14 64 29 19 12 07 26 12 07 06 20 95 29
Liver fat
m7. 465 19.2
1124 34.5 702 25.3 305 13.6 156 7.2 472 7.9
1956 28.8 1246 19.7 757 13.2 489 8.7
1322 22.9 735 9.9
1918 31.7
1
Remarks
5.5 Diet B* 4.1 “ “ without liver 8.1 ‘I I‘ I1 ‘I 4.9 ‘I ‘I ‘I I( 2.0 ‘I I‘ ‘I L‘
2.1 ‘I “ 9.0 “ “ without liver 5.5 “ I( I‘ ‘I 3.5 ‘I ‘I I‘ “
2.3 “ Ft 6.8 “ “ without liver 2.3 “ Xl 0.2 IL “ without liver
* Basal Diet B, fibrin 2, casein 2, albumin 1. t Basal Diet F, casein 5. $ Basal Diet X, fibrin 2, casein 10, albumin 3.
one-half that occurring in rats between 24 and 29 days of age. This effect of age or weight is being investigated more fully.
Hemorrhagic Degeneration of Kidneys and Other Efects of Choline Dejkiency-After the demonstration that fatty livers occurred
by guest on February 25, 2020http://w
ww
.jbc.org/D
ownloaded from

W. H. Griffith and N. J. Wade 573
in rapidly growing young rats even though some choline was pres- ent in the yeast and liver supplements, a similar diet was pre- pared in which these supplements were replaced by a mixture of pure vitamins and vitamin concentrates. The composition of this diet which was fed to forty 40 gm. male rats was as follows: fibrin 2, casein 10, albumin 3, lard 30, corn oil 5, sucrose 38, salt, mixture 4, calcium carbonate 1, agar 2, cod liver oil 5, and a daily supplement of 0.02 mg. of thiamine chloride, 0.02 mg. of ribo- flavin, 0.04 mg. of nicotinic acid, and 0.1 cc. each of concentrated
TABLE IV
Relation of Age of Young Male Rats to Deposition of Liver Fat during 10 Day Experimental Period (Average Values per Group of Ten Rats)
The diet consisted of fibrin 4, casein 8, albumin 3, lard 35, sucrose 31, salt mixture 4, calcium carbonate 1. cod liver oil 5, agar 2, powdered yeast 6, dried hog liver 1.
days gm. gm. gm.
24 40 66 4.12 27 53 82 5.15 29 64 95 5.57 32 78 112 6.00 35 91 111 5.38 42 112 141 6.74 49 124 160 7.77 56 153 189 7.97 63 170 209 8.63
Body weight
At start, average
_-
Liver
Weight, average
145 145 136 124 112 111 112 98 96
Weight, average
mg.
1100 1444 1344
927 731 828
1097 1046
684
Liver fat
26.7 9.6 28.1 10.2 24.1 8.2 15.4 4.8 13.6 3.8 12.3 3.4 14.1 4.0 13.1 3.2 7.9 1.9
Ratio of experi-
nental to normal
extracts of rice polish and hog liver. Autopsy of these rats after a 10 day experimental period brought to light an unexpected hemorrhagic degeneration of the kidneys in thirty-nine of the forty animals. This pathological condition was prevented in a group of ten rats by the addition of 0.4 mg. of choline chloride per gm. of food. The livers of these protected rats contained 8.8 times the normal liver fat, which demonstrated that the ad- ministered choline was inadequate as far as its lipotropic action was concerned. The fatty liver was prevented on this diet by the addition of 2.0 mg. of choline chloride per gm. of food.
by guest on February 25, 2020http://w
ww
.jbc.org/D
ownloaded from

574 Choline Metabolism. I
The kidneys of the rats on the low choline diet were greatly enlarged and purplish red in color. The capsule and the kidney were both grossly hemorrhagic. The histological examination showed massive tubular degeneration with hemorrhagic areas particularly in the cortex of the kidney. A decrease in the weight of the thymus and an increase in the weight of the spleen were
TABLE V
Relation of Choline to Deposition of Liver Fat and to Appearance of Renal Lesions in 40 Gm. Male Rats during 10 Day Experimental Period on
Low Choline Diet
The basal diet consisted of fibrin 5, casein 10, lard 8.9, sucrose 68, salt mixture 4, calcium carbonate 1, Natola 0.1, agar 2, corn oil fatty acids 1; daily supplement of 0.02 mg. of thiamine chloride, 0.02 mg. of riboflavin, 0.04 mg. of nicotinic acid. and 0.1 cc. each of concentrated extracts of rice polish and hog liver.
Choline chloride
Group No.* added
pefroopdm’
--
ml.
l-FC 2.00 2-FC 1.00 3-FC 0.50 4-FC 0.25 5-FC 0.13 6-FC 0.07 7-FC 0.00 3-FCt 0.00
1
%zf with P3llal lesions
0 0 0 4
10 8
10 9
-
T
Liver Final body
weight, aver- age
Weight, I aYerage
gm. gm. m7. 53 2.39 105 99 58 2.42 97 130 59 3.20 126 568 52 3.15 140 799 56 3.67 152 1005 52 3.59 160 861 46 3.05 154 609 54 3.58 153 964
- Liver fat
Rsdtfio experi- mental
to normal
4.1 1.1 5.4 1.3
17.8 5.6 25.3 8.9 27.4 10.4 24.0 9.6 20.0 7.7 26.9 10.3
* Ten rats per group. All survived the experimental period. t Lard omitted.
associated with the renal degeneration. In some of the more severely affected rats the thymus decreased to 10 per cent of its expected weight. The relation of this rapid regression of the thy- mus to its normal involution and to the “alarm reaction” of Selye (12) is being investigated. Hemorrhage into the eyeball occurred in the more severely affected animals. The detailed results of the examination of the tissues of these rats will be presented in later papers.
by guest on February 25, 2020http://w
ww
.jbc.org/D
ownloaded from

W. H. Griffith and N. J. Wade 575
These effects of a low choline intake were observed on a high fat ration. The inclusion of 5 per cent of corn oil indicated that a lack of unsaturated fatty acid was probably not involved in the
h @row1 3 5 7
Spleen I Kldnep
-looo
-mo
'600~
JJOO
a0
q \
.,\ 1
1
Choline chloride - III& per @I. of food 2 0.5 0.13 0 2 0.5 0.13 0 2 0.5 0.13 0
FIG. 1. The changes in the fresh and dry weights of the thymus, spleen, and kidneys (per pair) of 40 gm. male rats during a 10 day experimental period on diets with and without added choline. These are the average organ weights of the rats in Groups 1,3,5, and 7 of Table V. The composi- tion of the diet and other data are given in Table V. Dry weights are indicated on the chart by the cross-lined area.
production of the deficiency. The fact that a high fat diet was not necessary for the appearance of the pathological changes was demonstrated by the results shown in Table V. The diet, used in
by guest on February 25, 2020http://w
ww
.jbc.org/D
ownloaded from

576 Choline Metabolism. I
this experiment contained only 9 per cent of fat and in Group 8 the lard was omitted entirely. In this series of experiments 0.13 mg. of choline chloride per gm. of food was wholly ineffective (Group 5), 0.25 to 0.50 mg. was required for the prevention of the new deficiency (Groups 3 and 4), and 1.0 to 2.0 mg. were required to prevent the fatty liver (Groups 1 and 2).
The changes in the fresh and dry weight of the thymus, spleen, and kidneys of the rats in Groups 1, 3, 5, and 7 of Table V are shown in Fig. 1. In general the changes in the dry weight of these tissues paralleled the changes in fresh weight.
DISCUSSION
Previous studies by other investigators of the Ale of choline in metabolism have centered about its function in the regulation of the fat and cholesterol content of tissues, particularly of the liver. The present report has demonstrated that choline has a more fundamental riYe as a dietary essential, without which young rats develop a severely toxic deficiency. In unpublished ex- periments, rats which have survived the acute stage of the defi- ciency are being continued on various diets. The subsequent history of these rats will be reported later. Whether survival is dependent upon the use of stored choline which was not im- mediately available, whether the synthesis of choline becomes possible, or whether compensatory mechanisms come into play can only be conjectures at present.
Choline was not found to improve the rate of growth of young rats if the deficiency was limited to the fatty liver effect. Growth ceased or was subnormal if renal lesions were present. In such cases, a choline supplement permitted normal growth. Inasmuch as 40 gm. rats developed fatty livers on diets only moderately low in choline and 124 gm. rats failed to develop fatty livers on these same diets, it was concluded that the younger rats required larger amounts of choline for complete protection against the ef- fects of choline deficiency.
The demonstration that dietary choline is needed for the maintenance of such tissues as the thymus and kidneys as well as the liver has opened a new field of investigation with wide-spread implications. These studies on the rale of choline in metabolism are being continued.
by guest on February 25, 2020http://w
ww
.jbc.org/D
ownloaded from
W. H. Griffith and N. J. Wade 577
SUMMARY
1. A new effect of a deficiency of choline in young rats is de- scribed.
2. The deficiency is characterized by an extreme toxic state in which there is a marked hemorrhagic enlargement and degenera- tion of the kidneys, a regression of the thymus, and an enlarge- ment of the spleen.
3. The deficiency is prevented by amounts of choline too small to influence the deposition of liver fat.
4. The requirement for choline is greater in young than in older rats.
5. It is suggested that choline is essential for the maintenance of the normal structure of tissues as well as for its lipotropic action.
BIBLIOGRAPHY
1. Griffith, W. H., and Wade, N. J., Proc. Sot. Exp. Biol. and Med., 41, 188 (1939).
2. Best, C. H., Hershey, J. M., and Huntsman, M. E., J. Physiol., 76, 56 (1932); Am. J. Physiol., 101, 7 (1932).
3. Best, C. H., and Huntsman, M. E., J. Physiol., 76,405 (1932). 4. Best, C. H., and Ridout, J. H., in Luck, J. M., Annual review of bio-
chemistry, Stanford University, 8, 349 (1939). 5. Griffith, W. H., and Wade, N. J., Proc. Sot. Exp. Biol. and Med., 41,
333 (1939). 6. Channon, H. J., Platt, A. P., and Smith, J. A. B., Biochem. J., 31,
1736 (1937). 7. Hawk, P. B., and Oser, B. L., Science, 74, 369 (1931). 8. Lepkovsky, S., Jukes, T. H., arid Krause, M. E., J. Biol. Chem., 116,
557 (1936). 9. Fletcher, J. P., Best, C. H., and Solandt, 0. M., Biochem. J., 29, 2278
(1935). 10. Best, C. H., and Channon, H. J., Biochem. J., 29, 2651 (1935). 11. Channon, H. J., Loach, J. V., Laizides, P. A., Manifold, M. C., and
Soliman, G., Biochem. J., 32, 976 (1938). 12. Selye, H., Endocrinology, 21, 169 (1937).
by guest on February 25, 2020http://w
ww
.jbc.org/D
ownloaded from

Wendell H. Griffith and Nelson J. WadeDIET
YOUNG RATS ON A LOW CHOLINE HEMORRHAGIC DEGENERATION INOCCURRENCE AND PREVENTION OF
CHOLINE METABOLISM: I. THE
1939, 131:567-577.J. Biol. Chem.
http://www.jbc.org/content/131/2/567.citation
Access the most updated version of this article at
Alerts:
When a correction for this article is posted•
When this article is cited•
to choose from all of JBC's e-mail alertsClick here
ml#ref-list-1
http://www.jbc.org/content/131/2/567.citation.full.htaccessed free atThis article cites 0 references, 0 of which can be
by guest on February 25, 2020http://w
ww
.jbc.org/D
ownloaded from