cholera in zimbabwe: epidemiological bulletin number …€¦ · cholera in zimbabwe:...
TRANSCRIPT

Source: Ministry of Health and Child Welfare Rapid Disease Notification System 1
Cholera in Zimbabwe: Epidemiological Bulletin Number 16
Week 13 (22-28 March 2009)
Foreword This is the 16th epidemiological bulletin to be issued since the onset of a countrywide Zimbabwe cholera epidemic first reported in August 2008. Bulletins are to be published weekly to coincide with the end of an epidemiological week (Sunday to Saturday). Daily cumulative caseload updates are posted on the WHO website,http://www.who.int/hac/crises/zwe/en/index.html and http://www.who.int/hac/crises/zmb/sitreps/cholera_daily_updates/en/index.html
as well as on the OCHA website http://ochaonline.un.org/zimbabwe
The bulletin provides a weekly overview of the epidemic in Zimbabwe, including province by province data, to inform and improve the continuing public health response. It also provides guidance to agencies on issues relating to data collection, analysis and interpretation, and suggests operational strategies on the basis of epidemiological patterns so far.
The WHO Team welcomes feedback and data provided by individual agencies. Given the scope of this epidemic, errors and omissions are inevitable: we will be grateful for any information that helps to rectify these.
Acknowledgements
We are very grateful to MoHCW District Medical Officers, Provincial Surveillance Officers, Provincial Medical Directors, Environmental Heath Officers, and MoHCW's department of surveillance, who have helped to gather and share the bulk of the information presented here.
Likewise, we acknowledge agencies, including members of the Health and WASH clusters, who have kindly shared their data with our team.
MoHCW has recognized and thanked the efforts made by NGOs assisting in the response and providing support to MoHCW cholera treatment centres (MoHCW – 16/12/2008).
This document would not have been possible without the contributions of the WHO data management team, who are part of the C4 Cholera Command and Control Centre.
1. Figures
Please send any comments and feedback to the Cholera Control and Command Centre
Email: [email protected].
Toll free number for alert by district and province is 08089001 or 08089002 or 08089000
Mobile number for alerts is 0912 104 257

Source: Ministry of Health and Child Welfare Rapid Disease Notification System 2
See also summary tables (annex 1), maps (annex 2) and graphs (annex 3) The case definition can be found in appendix 1 and detail data by district are gathered in appendix 2 Since August 2008
• 57 districts (out of 62) have been affected. One additional district reported an imported case.
• 93,482 suspected cholera cases and 4,095 deaths were reported until 28 March 2009 to the World Health Organization (WHO) through the Ministry of Health and Child Welfare's (MoHCW) surveillance Department.
• The weekly Crude Case Fatality Ratio (CFR) dropped from 4.2% to 3.7% although 61.6% of all deaths were reported to have occurred at community level.
During week 13 (22-28 March 2009)
• 1,368 new suspected cases were reported (average 195/day) compared to 1,646 cases during week 12 (17% decrease).
• 51 new deaths (average 7/day) were also reported compared to 69 reported during week 12 (16% decrease).
• The institutional CFR (i-CFR) decreased from 2.1% to 1.6% (see interpretation section).
• One new district (Umzingwane in Matabeleland South) reported one case (a driver on transit from Harare) on 23rd March 2009. However, no other cases have been reported from this district subsequent to this.
At provincial level
• Less cases were reported during week 13 compared to week 12 in all provinces except Harare (which is having a real increase in cases) and Midlands where batch reporting on 25th March may have contributed to the increase.
• The highest (weekly) case loads were observed in Harare (504) and Mashonaland West (415). These two provinces contributed 67% of the week’s case reports.
• The highest weekly attack rates in cases per 100,000 inhabitants were observed in Mashonaland West (32), and Harare (27).
At district level
• 14 districts had an increased number of reported cases this week. However batch back reporting can not be ruled out in Gokwe North, Chipinge, Buhera and Hurungwe.
• The highest weekly attack rate was recorded in Kadoma (98/100,000 inhabitants). .
• 8 districts had a crude CFR above >5% although all of them had a low caseload except Mt Darwin, where 12 community deaths and 17 cases were reported.
• In Rushinga, no new cases were reported although 7 deaths were reported to have occurred in the community.
2. Reporting (annex 1)
• The percentage of daily reports received from the districts increased from 51% to 68%.
• Reporting was good in the two provinces with the highest case load (Harare and Mashonaland West).
• However, batch reporting might still have occurred in several districts this week as shown below
Province District Possible
batch reporting Date of report
Date of prior last report
Midlands Gokwe North 96 cases 25th March 20
th Mach
Mashonaland Central Rushinga 7 community deaths 24th March 19
th March
Buhera 51 Cases 27th March 25
th March Manicaland
Chipinge 61 cases 26th March 24
th March
MashWest Hurungwe 21 Cases 23rd March 20
th March
Source: Ministry of Health and Child Welfare Rapid Disease Notification System 3
3. Data interpretation This week again, the cholera trend has decreased at national level. Back batch reporting still occurred this week suggesting that the true incidence of cases in week 13 might even be lower than suggested by the reported data. Overall completeness and timeliness also improved compared to the previous week. However, the most affected districts, Harare and Kadoma reflected an actual high case load since their reports have been timely. The epidemic seems to be under control almost everywhere, except in Harare city, Chitungwiza, and Kadoma where a real resurgence has been noticeable.
4. Response An evaluation mission was carried out by the C4 in Mashonaland West Province/Kadoma district on 26th and 27th March. The team established that the resurgence in Kadoma was attributable to a case load from Kadoma Prison which became affected on 17th March 2009. An increase of cases had also been noted in the provincial headquarters after the town had gone for some 4-5 days without water. Need for further support was seen in case management, data management, laboratory surveillance and logistics support including supply chain improvement.
5. Recommendations
Although the epidemic appears to be coming to an end, certain hotspots still exist and there is still need for continued vigilance especially in such areas. These include Harare and Kadoma. In districts where no case was reported for more than two weeks,centralization of material, equipments and drugs from closing or closed CTC/CTUs should be done to allow their reconditioning and restocking for further redeployment where needed. In addition, where CTCs are closing, clinics should be provided with an emergency stock of ORS and Ringers lactate to allow them to cope with new case influx until new CTCs can be opened., In addition, areas where CTC have closed, public health structures such as the rumours verification procedure should be included into the daily cholera reporting system, at least until the epidemic has been declared over at national level.

Source: Ministry of Health and Child Welfare Rapid Disease Notification System 4
Annex 1: Summary tables
Table 1. Cholera cases reported during week 13 and since August 2008 and attack rate (AR) per 100,000 inhabitants by province in Zimbabwe as of 28
th March 2009 *
Affected Number of cases AR per 100,000
Province Populations(a) WEEK13 Cumulative WEEK 13 Cumulative
Harare(b) 1,891,700 504 17,522 27 926 Bulawayo 718,278 0 443 0 62 Manicaland 1,665,450 125 12,764 8 766 Mashonaland Central 1,056,665 111 9,856 11 933 Mashonaland East 1,317,856 63 6,241 5 474 Mashonaland West 1,300,012 415 20,426 32 1,571 Masvingo 1,401,672 38 11,451 3 817 Matabeleland North 351,260 8 1,128 2 321 Matabeleland South 331,096 1 5,245 0 1,584 Midlands 1,464,537 0 443 0 62 Total
(a) Cumulating population of affected district only; (b) Includes Harare city and Chitungwiza
Table 2. Proportion of deaths outside cholera treatment centers, from 21st -28
th March 2009
Province Number of deaths Number of community deaths Proportion of community death (%)
Harare city* 2 1 50%
Chitungwiza 0 0 100%
Bulawayo 0 0 -
Mashonaland Central 20 19 95%
Mashonaland East 4 3 75%
Mashonaland West 15 2 13%
Manicaland 3 0 0%
Masvingo 1 1 100%
Matebeleland North 3 0 0
Matebeleland South 0 0 -
Midlands 3 3 0%
Total 51 29 57%
*for Harare, deaths outside CTC are irregularly/not reported
Source: Ministry of Health and Child Welfare Rapid Disease Notification System 5
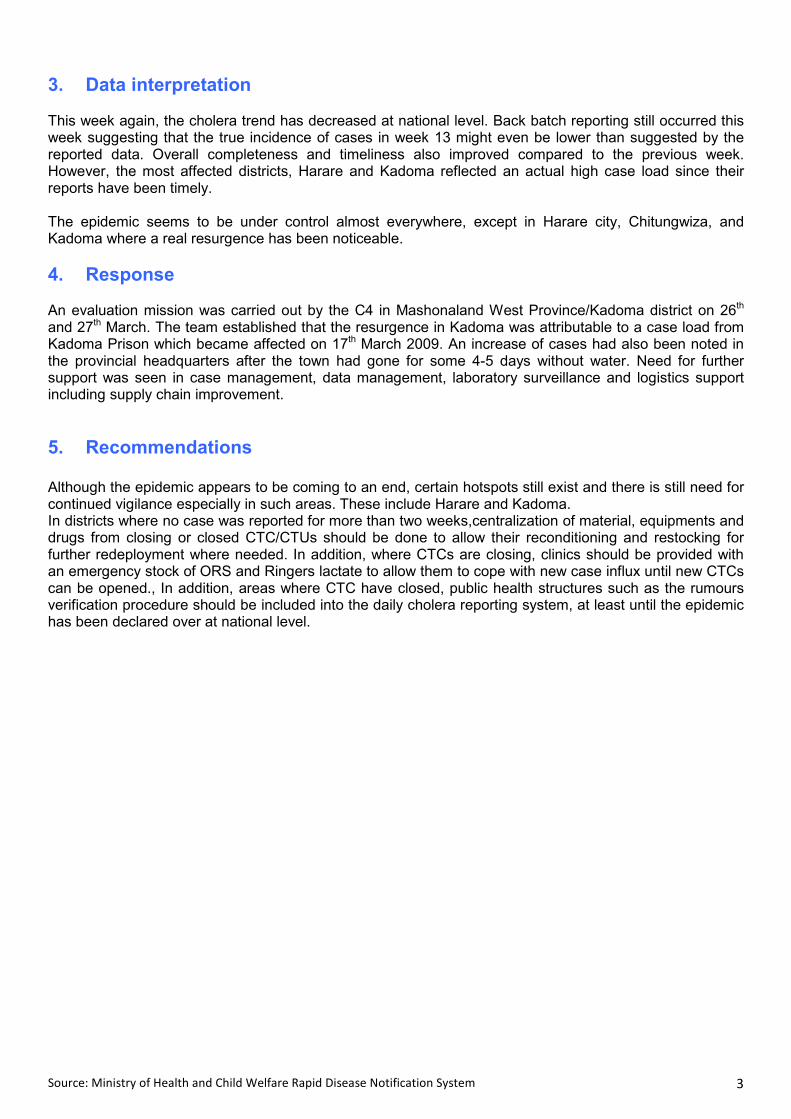
Annex 2: Maps
Map 1. New suspected cases by district, week 13 Map 2. New deaths by district, week 13
Map 3. Weekly attack rate for week 13 Map 4. Cumulative attack rate since start
Source: Ministry of Health and Child Welfare Rapid Disease Notification System 6
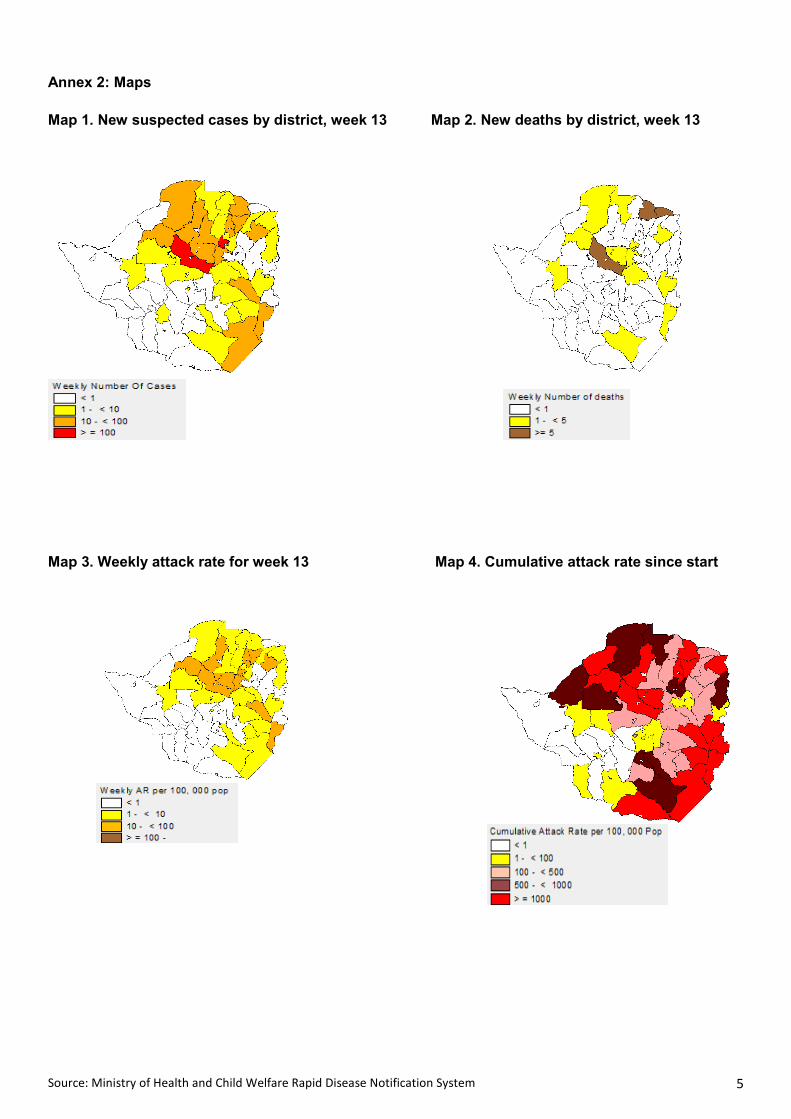
Annex 3: Graphs
Cholera in Zimbabwe from 16 Nov 08 to 28 Mar 09
Weekly crude and institutional case-fatality ratios
0
1
2
3
4
5
6
7
8
9
10
w48 w49 w50 w51 w52 w1 w2 w3 w4 w5 w6 w7 w8 w9 w10 w11 w12 w13
Epidemiological weeks
perc
ent
CFR
iCFR
Provinces with increasing trend (note the difference in scales)
Cholera in Harare province, Zimbabwe
17 Aug 08 to 28 Mar 09
0
500
1,000
1,500
2,000
2,500
w35
w36
w37
w38
w39
w40
w41
w42
w43
w44
w45
w46
w47
w48
w49
w50
w51
w52
w1
w2
w3
w4
w5
w6
w7
w8
w9
w10
w11
w12
w13
weeks
Num
ber
Cases
Deaths
Cholera in Midlands province, Zimbabwe
17 Aug 08 to 28 Mar 09
0
200
400
600
800
1,000
1,200
1,400
17-2
3 A
ug 0
8
24-3
0 A
ug 0
8
31 A
ug- 6 S
ep 0
8
7-1
3 S
ep 0
8
14-2
0 S
ep 0
8
21-2
7 S
ep 0
8
28 S
ep -4 O
ct 08
5-1
1 O
ct 08
12-1
8 O
ct 08
19-2
5 O
ct 08
26 O
ct-
1 N
ov 0
8
2-8
Nov 0
8
9-1
5 N
ov 0
8
16-2
2 N
ov 0
8
23-2
9 N
ov 0
8
30 N
ov-6
Dec 0
8
7-1
3 D
ec 0
8
14-2
0 D
ec 0
8
21-2
7 D
ec 0
8
28 D
ec 0
8-3
Jan
4-1
0 J
an 0
9
11-1
7 jan 0
9
18-2
4 J
an 0
9
25-3
1 J
an 0
9
01-0
7 F
eb 0
9
08-1
4 F
eb 0
9
15-2
1 F
eb 0
9
22-2
8 F
eb 0
9
01-0
7 M
ar
09
08-1
4 M
ar
09
15-2
1 M
ar
09
22-2
8 M
ar
09
Num
ber
Cases
Deaths
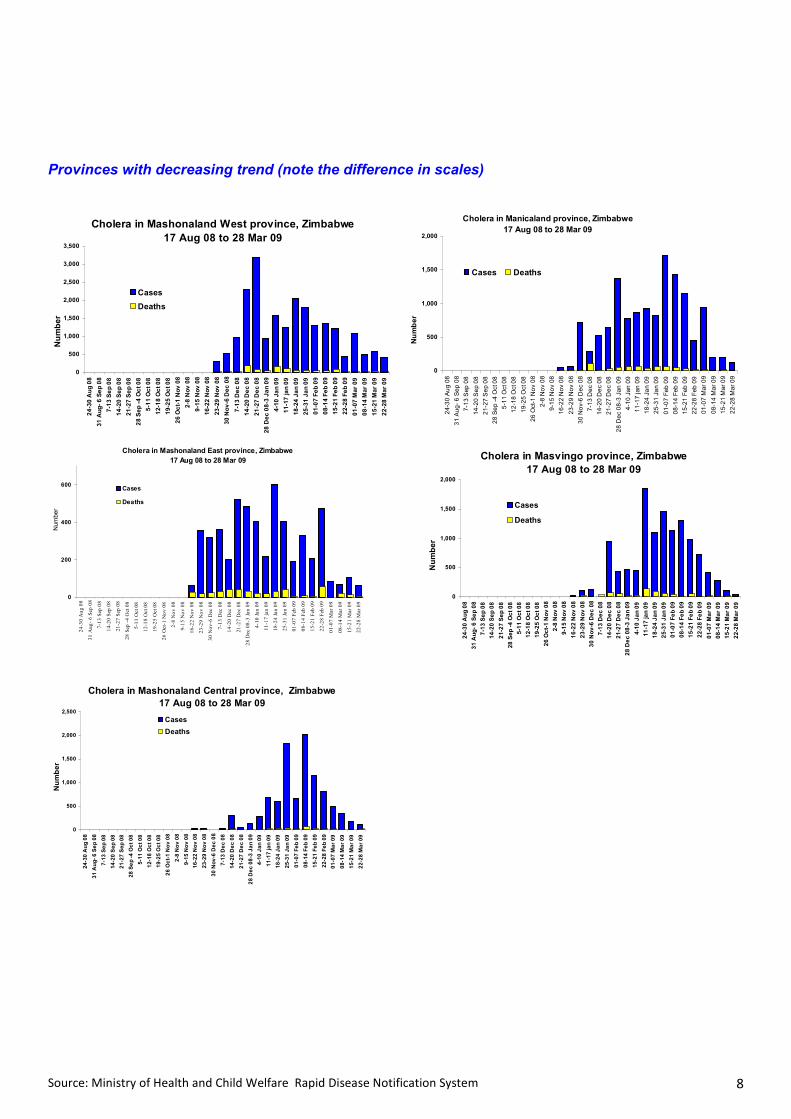
* Probable under reporting of cases and deaths during week 1 (28 Dec08-3Jan 09) during the holiday period
*
Source: Ministry of Health and Child Welfare Rapid Disease Notification System 7
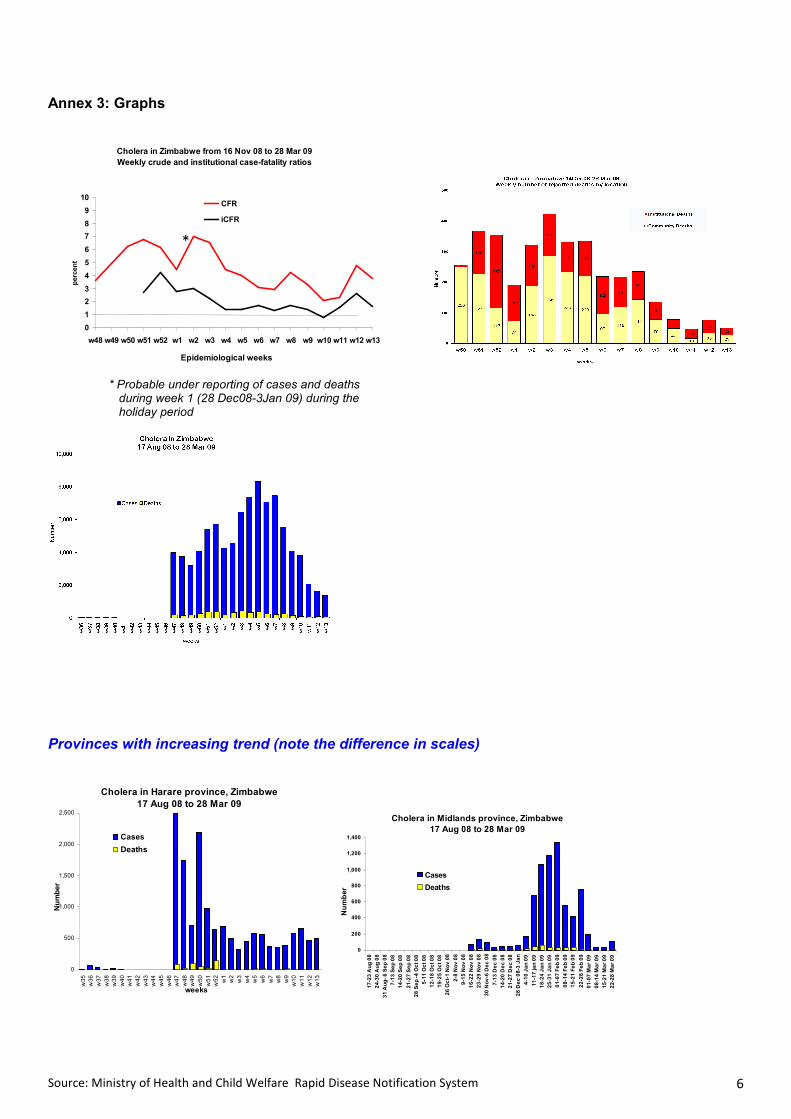
Districts of Harare province (note the difference in scales)
Cholera in Chitungwiza, Zimbabwe
17 Aug 08 to 28 Mar 09
0
50
100
150
200
250
300
24-3
0 A
ug 0
8
31 A
ug- 6 S
ep 0
8
7-1
3 S
ep 0
8
14-2
0 S
ep 0
8
21-2
7 S
ep 0
8
28 S
ep -4 O
ct 08
5-1
1 O
ct 08
12-1
8 O
ct 08
19-2
5 O
ct 08
26 O
ct-1 N
ov 0
8
2-8
Nov 0
8
9-1
5 N
ov 0
8
16-2
2 N
ov 0
8
23-2
9 N
ov 0
8
30 N
ov-6
Dec 0
8
7-1
3 D
ec 0
8
14-2
0 D
ec 0
8
21-2
7 D
ec 0
8
28 D
ec 0
8-3
Jan 0
9
4-1
0 J
an 0
9
11-1
7 jan 0
9
18-2
4 J
an 0
9
25-3
1 J
an 0
9
01-0
7 F
eb 0
9
08-1
4 F
eb 0
9
15-2
1 F
eb 0
9
22-2
8 F
eb 0
9
01-0
7 M
ar 09
08-1
4 M
ar 09
15-2
1 M
ar 09
22-2
8 M
ar 09
Num
ber
Cases
Deaths
Cholera in Harare City, Zimbabwe
17 Aug 08 to 28 Mar 09
0
500
1,000
1,500
2,000
2,500
24-3
0 A
ug 0
8
31 A
ug- 6 S
ep 0
8
7-1
3 S
ep 0
8
14-2
0 S
ep 0
8
21-2
7 S
ep 0
8
28 S
ep -4 O
ct 08
5-1
1 O
ct 08
12-1
8 O
ct 08
19-2
5 O
ct 08
26 O
ct-
1 N
ov 0
8
2-8
Nov 0
8
9-1
5 N
ov 0
8
16-2
2 N
ov 0
8
23-2
9 N
ov 0
8
30 N
ov-6
Dec 0
8
7-1
3 D
ec 0
8
14-2
0 D
ec 0
8
21-2
7 D
ec 0
8
28 D
ec 0
8-3
Jan 0
9
4-1
0 J
an 0
9
11-1
7 jan 0
9
18-2
4 J
an 0
9
25-3
1 J
an 0
9
01-0
7 F
eb 0
9
08-1
4 F
eb 0
9
15-2
1 F
eb 0
9
22-2
8 F
eb 0
9
01-0
7 M
ar 09
08-1
4 M
ar 09
15-2
1 M
ar 09
22-2
8 M
ar 09
Num
ber
Cases
Deaths
Source: Ministry of Health and Child Welfare Rapid Disease Notification System 8
Provinces with decreasing trend (note the difference in scales)
Cholera in Mashonaland West province, Zimbabwe
17 Aug 08 to 28 Mar 09
0
500
1,000
1,500
2,000
2,500
3,000
3,500
24-3
0 A
ug 0
8
31 A
ug- 6 S
ep 0
8
7-1
3 S
ep 0
8
14-2
0 S
ep 0
8
21-2
7 S
ep 0
8
28 S
ep -4 O
ct 08
5-1
1 O
ct 08
12-1
8 O
ct 08
19-2
5 O
ct 08
26 O
ct-1 N
ov 0
8
2-8
Nov 0
8
9-1
5 N
ov 0
8
16-2
2 N
ov 0
8
23-2
9 N
ov 0
8
30 N
ov-6
Dec 0
8
7-1
3 D
ec 0
8
14-2
0 D
ec 0
8
21-2
7 D
ec 0
8
28 D
ec 0
8-3
Jan 0
9
4-1
0 J
an 0
9
11-1
7 jan 0
9
18-2
4 J
an 0
9
25-3
1 J
an 0
9
01-0
7 F
eb 0
9
08-1
4 F
eb 0
9
15-2
1 F
eb 0
9
22-2
8 F
eb 0
9
01-0
7 M
ar
09
08-1
4 M
ar
09
15-2
1 M
ar
09
22-2
8 M
ar
09
Num
ber
Cases
Deaths
Cholera in Manicaland province, Zimbabwe
17 Aug 08 to 28 Mar 09
0
500
1,000
1,500
2,000
24-30 Aug 08
31 Aug- 6 Sep 08
7-13 Sep 08
14-20 Sep 08
21-27 Sep 08
28 Sep -4 Oct 08
5-11 Oct 08
12-18 Oct 08
19-25 Oct 08
26 Oct-1 Nov 08
2-8 Nov 08
9-15 Nov 08
16-22 Nov 08
23-29 Nov 08
30 Nov-6 Dec 08
7-13 D
ec 08
14-20 D
ec 08
21-27 D
ec 08
28 D
ec 08-3 Jan 09
4-10 Jan 09
11-17 jan 09
18-24 Jan 09
25-31 Jan 09
01-07 Feb 09
08-14 Feb 09
15-21 Feb 09
22-28 Feb 09
01-07 M
ar 09
08-14 M
ar 09
15-21 M
ar 09
22-28 M
ar 09
Num
ber
Cases Deaths
Cholera in Mashonaland East province, Zimbabwe
17 Aug 08 to 28 Mar 09
0
200
400
600
24-30 Aug 08
31 Aug- 6 Sep 08
7-13 Sep 08
14-20 Sep 08
21-27 Sep 08
28 Sep -4 Oct 08
5-11 Oct 08
12-18 Oct 08
19-25 Oct 08
26 Oct-1 Nov 08
2-8 Nov 08
9-15 Nov 08
16-22 Nov 08
23-29 Nov 08
30 Nov-6 Dec 08
7-13 Dec 08
14-20 Dec 08
21-27 Dec 08
28 Dec 08-3 Jan 09
4-10 Jan 09
11-17 jan 09
18-24 Jan 09
25-31 Jan 09
01-07 Feb 09
08-14 Feb 09
15-21 Feb 09
22-28 Feb 09
01-07 Mar 09
08-14 Mar 09
15-21 Mar 09
22-28 Mar 09
Number
Cases
Deaths
Cholera in Mashonaland Central province, Zimbabwe
17 Aug 08 to 28 Mar 09
0
500
1,000
1,500
2,000
2,500
24-3
0 A
ug 0
8
31 A
ug- 6 S
ep 0
8
7-1
3 S
ep 0
8
14-2
0 S
ep 0
8
21-2
7 S
ep 0
8
28 S
ep -4 O
ct 08
5-1
1 O
ct 08
12-1
8 O
ct 08
19-2
5 O
ct 08
26 O
ct-1 N
ov 0
8
2-8
Nov 0
8
9-1
5 N
ov 0
8
16-2
2 N
ov 0
8
23-2
9 N
ov 0
8
30 N
ov-6
Dec 0
8
7-1
3 D
ec 0
8
14-2
0 D
ec 0
8
21-2
7 D
ec 0
8
28 D
ec 0
8-3
Jan 0
9
4-1
0 J
an 0
9
11-1
7 jan 0
9
18-2
4 J
an 0
9
25-3
1 J
an 0
9
01-0
7 F
eb 0
9
08-1
4 F
eb 0
9
15-2
1 F
eb 0
9
22-2
8 F
eb 0
9
01-0
7 M
ar 09
08-1
4 M
ar 09
15-2
1 M
ar 09
22-2
8 M
ar 09
Num
ber
Cases
Deaths
Cholera in Masvingo province, Zimbabwe
17 Aug 08 to 28 Mar 09
0
500
1,000
1,500
2,000
24-3
0 A
ug 0
8
31 A
ug- 6 S
ep 0
8
7-1
3 S
ep 0
8
14-2
0 S
ep 0
8
21-2
7 S
ep 0
8
28 S
ep -4 O
ct 08
5-1
1 O
ct 08
12-1
8 O
ct 08
19-2
5 O
ct 08
26 O
ct-
1 N
ov 0
8
2-8
Nov 0
8
9-1
5 N
ov 0
8
16-2
2 N
ov 0
8
23-2
9 N
ov 0
8
30 N
ov-6
Dec 0
8
7-1
3 D
ec 0
8
14-2
0 D
ec 0
8
21-2
7 D
ec 0
8
28 D
ec 0
8-3
Jan 0
9
4-1
0 J
an 0
9
11-1
7 jan 0
9
18-2
4 J
an 0
9
25-3
1 J
an 0
9
01-0
7 F
eb 0
9
08-1
4 F
eb 0
9
15-2
1 F
eb 0
9
22-2
8 F
eb 0
9
01-0
7 M
ar
09
08-1
4 M
ar
09
15-2
1 M
ar
09
22-2
8 M
ar
09
Num
ber
Cases
Deaths

Source: Ministry of Health and Child Welfare Rapid Disease Notification System 9
Provinces with low caseload (note the difference in scales)
Cholera in Matabeleland North province, Zimbabwe
17 Aug 08 to 28 Mar 09
0
100
200
300
400
500
24-3
0 A
ug 0
8
31 A
ug- 6 S
ep 0
8
7-1
3 S
ep 0
8
14-2
0 S
ep 0
8
21-2
7 S
ep 0
8
28 S
ep -4 O
ct 08
5-1
1 O
ct 08
12-1
8 O
ct 08
19-2
5 O
ct 08
26 O
ct-1 N
ov 0
8
2-8
Nov 0
8
9-1
5 N
ov 0
8
16-2
2 N
ov 0
8
23-2
9 N
ov 0
8
30 N
ov-6
Dec 0
8
7-1
3 D
ec 0
8
14-2
0 D
ec 0
8
21-2
7 D
ec 0
8
28 D
ec 0
8-3
Jan 0
9
4-1
0 J
an 0
9
11-1
7 jan 0
9
18-2
4 J
an 0
9
25-3
1 J
an 0
9
01-0
7 F
eb 0
9
08-1
4 F
eb 0
9
15-2
1 F
eb 0
9
22-2
8 F
eb 0
9
01-0
7 M
ar
09
08-1
4 M
ar
09
15-2
1 M
ar
09
22-2
8 M
ar
09
Num
ber
Cases
Deaths
Cholera in Matabeleland South province, Zimbabwe
17 Aug 08 to 28 Mar 09
0
100
200
300
400
500
600
700
800
900
1,000
1,100
1,200
1,300
24-3
0 A
ug 0
8
31 A
ug- 6 S
ep 0
8
7-1
3 S
ep 0
8
14-2
0 S
ep 0
8
21-2
7 S
ep 0
8
28 S
ep -4 O
ct 08
5-1
1 O
ct 08
12-1
8 O
ct 08
19-2
5 O
ct 08
26 O
ct-1 N
ov 0
8
2-8
Nov 0
8
9-1
5 N
ov 0
8
16-2
2 N
ov 0
8
23-2
9 N
ov 0
8
30 N
ov-6
Dec 0
8
7-1
3 D
ec 0
8
14-2
0 D
ec 0
8
21-2
7 D
ec 0
8
28 D
ec 0
8-3
Jan 0
9
4-1
0 J
an 0
9
11-1
7 jan 0
9
18-2
4 J
an 0
9
25-3
1 J
an 0
9
01-0
7 F
eb 0
9
08-1
4 F
eb 0
9
15-2
1 F
eb 0
9
22-2
8 F
eb 0
9
01-0
7 M
ar
09
08-1
4 M
ar
09
15-2
1 M
ar
09
22-2
8 M
ar
09
Num
ber
Cases
Deaths
Cholera in Bulawayo province, Zimbabwe
17 Aug 08 to 28 Mar 09
0
20
40
60
80
100
120
140
24-3
0 A
ug 0
8
31 A
ug- 6 S
ep 0
8
7-1
3 S
ep 0
8
14-2
0 S
ep 0
8
21-2
7 S
ep 0
8
28 S
ep -4 O
ct 08
5-1
1 O
ct 08
12-1
8 O
ct 08
19-2
5 O
ct 08
26 O
ct-
1 N
ov 0
8
2-8
Nov 0
8
9-1
5 N
ov 0
8
16-2
2 N
ov 0
8
23-2
9 N
ov 0
8
30 N
ov-6
Dec 0
8
7-1
3 D
ec 0
8
14-2
0 D
ec 0
8
21-2
7 D
ec 0
8
28 D
ec 0
8-3
Jan 0
9
4-1
0 J
an 0
9
11-1
7 jan 0
9
18-2
4 J
an 0
9
25-3
1 J
an 0
9
01-0
7 F
eb 0
9
08-1
4 F
eb 0
9
15-2
1 F
eb 0
9
22-2
8 F
eb 0
9
01-0
7 M
ar 09
08-1
4 M
ar 09
15-2
1 M
ar 09
22-2
8 M
ar 09
Num
ber
Cases
Deaths

Source: Ministry of Health and Child Welfare Rapid Disease Notification System 10
6. Appendix 1: Case definition
The Zimbabwe cholera state definition states that
"in an area where there is a cholera epidemic, a patient aged 2 years or more develops acute watery diarrhoea, with or without vomiting".
‘’A confirmed cholera case is “when Vibrio cholerae is isolated from any patient with diarrhoea”.
This is adapted from the WHO case definition for cholera.
The inclusion of all ages in the case definition somewhat reduces specificity, that is, inclusion of more non-cholera childhood diarrhoea cases. It, however, does not impede meaningful interpretation of trends. Teams should monitor any shift in the age distribution of cases, which might indicate a changing proportion of non-cholera cases among patients seen.
Source: Ministry of Health and Child Welfare Rapid Disease Notification System 11
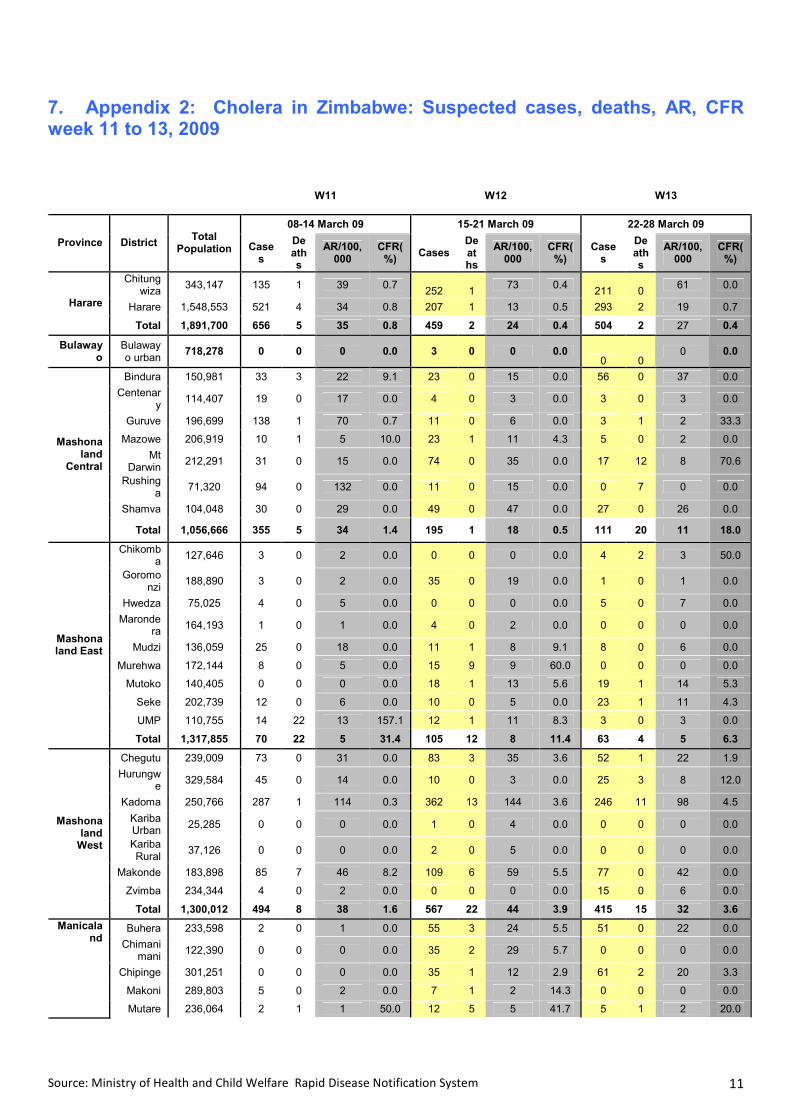
7. Appendix 2: Cholera in Zimbabwe: Suspected cases, deaths, AR, CFR week 11 to 13, 2009
W11
W12
W13
08-14 March 09 15-21 March 09 22-28 March 09
Province District Total
Population Cases
Deaths
AR/100,000
CFR(%)
Cases Deaths
AR/100,000
CFR(%)
Cases
Deaths
AR/100,000
CFR(%)
Chitungwiza
343,147 135 1 39 0.7 252 1
73 0.4 211 0
61 0.0
Harare 1,548,553 521 4 34 0.8 207 1 13 0.5 293 2 19 0.7 Harare
Total 1,891,700 656 5 35 0.8 459 2 24 0.4 504 2 27 0.4
Bulawayo
Bulawayo urban
718,278 0 0 0 0.0 3 0 0 0.0 0 0
0 0.0
Bindura 150,981 33 3 22 9.1 23 0 15 0.0 56 0 37 0.0
Centenary
114,407 19 0 17 0.0 4 0 3 0.0 3 0 3 0.0
Guruve 196,699 138 1 70 0.7 11 0 6 0.0 3 1 2 33.3
Mazowe 206,919 10 1 5 10.0 23 1 11 4.3 5 0 2 0.0
Mt Darwin
212,291 31 0 15 0.0 74 0 35 0.0 17 12 8 70.6
Rushinga
71,320 94 0 132 0.0 11 0 15 0.0 0 7 0 0.0
Shamva 104,048 30 0 29 0.0 49 0 47 0.0 27 0 26 0.0
Mashonaland
Central
Total 1,056,666 355 5 34 1.4 195 1 18 0.5 111 20 11 18.0
Chikomba
127,646 3 0 2 0.0 0 0 0 0.0 4 2 3 50.0
Goromonzi
188,890 3 0 2 0.0 35 0 19 0.0 1 0 1 0.0
Hwedza 75,025 4 0 5 0.0 0 0 0 0.0 5 0 7 0.0
Marondera
164,193 1 0 1 0.0 4 0 2 0.0 0 0 0 0.0
Mudzi 136,059 25 0 18 0.0 11 1 8 9.1 8 0 6 0.0
Murehwa 172,144 8 0 5 0.0 15 9 9 60.0 0 0 0 0.0
Mutoko 140,405 0 0 0 0.0 18 1 13 5.6 19 1 14 5.3
Seke 202,739 12 0 6 0.0 10 0 5 0.0 23 1 11 4.3
UMP 110,755 14 22 13 157.1 12 1 11 8.3 3 0 3 0.0
Mashonaland East
Total 1,317,855 70 22 5 31.4 105 12 8 11.4 63 4 5 6.3
Chegutu 239,009 73 0 31 0.0 83 3 35 3.6 52 1 22 1.9
Hurungwe
329,584 45 0 14 0.0 10 0 3 0.0 25 3 8 12.0
Kadoma 250,766 287 1 114 0.3 362 13 144 3.6 246 11 98 4.5
Kariba Urban
25,285 0 0 0 0.0 1 0 4 0.0 0 0 0 0.0
Kariba Rural
37,126 0 0 0 0.0 2 0 5 0.0 0 0 0 0.0
Makonde 183,898 85 7 46 8.2 109 6 59 5.5 77 0 42 0.0
Zvimba 234,344 4 0 2 0.0 0 0 0 0.0 15 0 6 0.0
Mashonaland West
Total 1,300,012 494 8 38 1.6 567 22 44 3.9 415 15 32 3.6
Buhera 233,598 2 0 1 0.0 55 3 24 5.5 51 0 22 0.0
Chimanimani
122,390 0 0 0 0.0 35 2 29 5.7 0 0 0 0.0
Chipinge 301,251 0 0 0 0.0 35 1 12 2.9 61 2 20 3.3
Makoni 289,803 5 0 2 0.0 7 1 2 14.3 0 0 0 0.0
Manicaland
Mutare 236,064 2 1 1 50.0 12 5 5 41.7 5 1 2 20.0

Source: Ministry of Health and Child Welfare Rapid Disease Notification System 12
W11
W12
W13
08-14 March 09 15-21 March 09 22-28 March 09
Province District Total
Population Cases
Deaths
AR/100,000
CFR(%)
Cases Deaths
AR/100,000
CFR(%)
Cases
Deaths
AR/100,000
CFR(%)
Mutare City
180,953 12 0 7 0.0 0 0 0 0.0 0 0 0 0.0
Mutasa 176,898 3 0 2 0.0 41 0 23 0.0 0 0 0 0.0
Nyanga 124,494 173 0 139 0.0 7 0 6 0.0 8 0 6 0.0
Total 1,665,451 197 1 12 0.5 192 12 12 6.3 125 3 8 2.4
Binga 127,391 2 0 2 0.0 0 0 0 0.0 8 3 0 37.5
Lupane 104,738 0 0 0 0.0 0 0 0 0.0 0 0 8 0
Nkayi 119,131 0 0 0 0.0 0 0 0 0.0 0 0 0 0.0
Matebeleland
North
Total 351,260 2 0 1 0.0 0 0 0 0.0 8 3 2 37.5
Beitbridge
110,105 0 0 0 0.0 1 0 1 0.0 0 0 0 0.0
Gwanda 138,020 0 0 0 0.0 2 0 1 0.0 0 0 0 0.0
Umzingwane
65,264
0 0 0 0.0 0 0 0 0.0 1 0
Plumtree 82,971 0 0 0 0.0 0 0 0 0.0 0 0 0 0.0
Matabeleland
South
Total 331,096 0 0 0 0.0 3 0 1 0.0 1 0 0 0.0
Bikita 166,595 61 0 37 0.0 27 10 16 37.0 4 0 2 0.0
Chiredzi 248,417 55 0 22 0.0 50 3 20 6.0 14 0 6 0.0
Chivi 165,215 125 4 76 3.2 0 0 0 0.0 3 0 2 0.0
Gutu 210,750 0 0 0 0.0 0 0 0 0.0 8 0 4 0.0
Masvingo
280,196 29 0 10 0.0 10 2 4 20.0 0 0 0 0.0
Mwenezi 134,004 4 1 3 25.0 4 3 3 75.0 3 1 2 33.3
Zaka 196,495 0 0 0 0.0 9 2 5 22.2 6 0 3 0.0
Masvingo
Total 1,401,672 274 5 20 1.8 100 20 7 20.0 38 1 3 2.6
Chirumhanzu
74,764 1 0 1 0.0 0 0 0 0.0 0 0 0 0.0
Gokwe North
227,546 0 0 0 0.0 0 0 0 0.0 96 3 42 3.1
Gokwe South
311,684 14 0 4 0.0 18 0 6 0.0 3 0 1 0.0
Gweru City
(Mkoba) 149,468 2 0 1 0.0 1 0 1 0.0 2 0 1 0.0
Kwekwe 303,094 11 2 4 18.2 2 0 1 0.0 2 0 1 0.0
Mberengwa
194,682 0 0 0 0.0 0 0 0 0.0 0 0 0 0.0
Shurugwi
93,828 0 0 0 0.0 0 0 0 0.0 0 0 0 0.0
Zvishavane
109,471 0 0 0 0.0 1 0 1 0.0 0 0 0 0.0
Midlands
Total 1,464,537 28 2 2 7.1 22 0 2 0.0 103 3 7 2.9
GD
TOTAL 11,498,526 2,076 48 18 2.3 1,646 69 14 4.2 1,368 51 12 3.7
Chegutu population including Norton population
Goromonzi population including Ruwa population
Guruve population including Mbire population
Hurungwe population including Karoi and Chimundu populations
Kwekwe population including Redcliff population
Makondé population including Chinoyi population
Makoni population including Rupase population
Seke population including Epworth population
Source: Ministry of Health and Child Welfare Rapid Disease Notification System 13
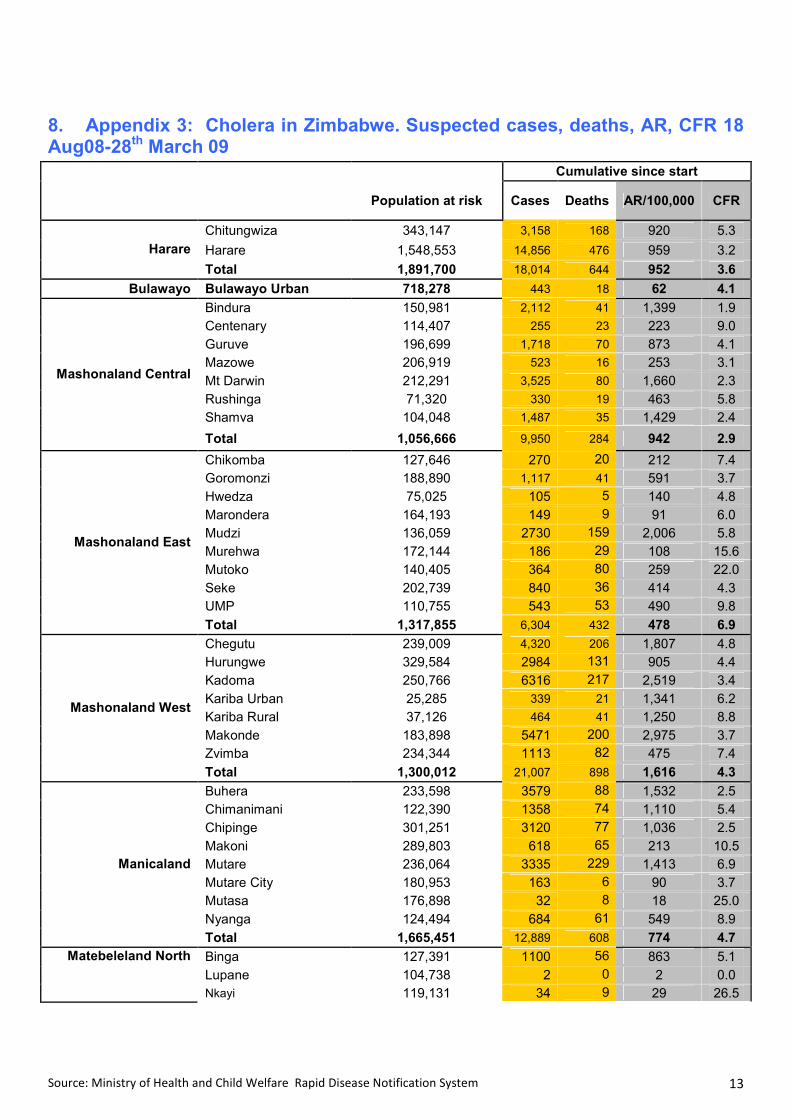
8. Appendix 3: Cholera in Zimbabwe. Suspected cases, deaths, AR, CFR 18 Aug08-28th March 09
Cumulative since start
Population at risk Cases Deaths AR/100,000 CFR
Chitungwiza 343,147 3,158 168 920 5.3
Harare 1,548,553 14,856 476 959 3.2 Harare
Total 1,891,700 18,014 644 952 3.6
Bulawayo Bulawayo Urban 718,278 443 18 62 4.1
Bindura 150,981 2,112 41 1,399 1.9
Centenary 114,407 255 23 223 9.0
Guruve 196,699 1,718 70 873 4.1
Mazowe 206,919 523 16 253 3.1
Mt Darwin 212,291 3,525 80 1,660 2.3
Rushinga 71,320 330 19 463 5.8
Shamva 104,048 1,487 35 1,429 2.4
Mashonaland Central
Total 1,056,666 9,950 284 942 2.9
Chikomba 127,646 270 20 212 7.4
Goromonzi 188,890 1,117 41 591 3.7
Hwedza 75,025 105 5 140 4.8
Marondera 164,193 149 9 91 6.0
Mudzi 136,059 2730 159 2,006 5.8
Murehwa 172,144 186 29 108 15.6
Mutoko 140,405 364 80 259 22.0
Seke 202,739 840 36 414 4.3
UMP 110,755 543 53 490 9.8
Mashonaland East
Total 1,317,855 6,304 432 478 6.9
Chegutu 239,009 4,320 206 1,807 4.8
Hurungwe 329,584 2984 131 905 4.4
Kadoma 250,766 6316 217 2,519 3.4
Kariba Urban 25,285 339 21 1,341 6.2
Kariba Rural 37,126 464 41 1,250 8.8
Makonde 183,898 5471 200 2,975 3.7
Zvimba 234,344 1113 82 475 7.4
Mashonaland West
Total 1,300,012 21,007 898 1,616 4.3
Buhera 233,598 3579 88 1,532 2.5
Chimanimani 122,390 1358 74 1,110 5.4
Chipinge 301,251 3120 77 1,036 2.5
Makoni 289,803 618 65 213 10.5
Mutare 236,064 3335 229 1,413 6.9
Mutare City 180,953 163 6 90 3.7
Mutasa 176,898 32 8 18 25.0
Nyanga 124,494 684 61 549 8.9
Manicaland
Total 1,665,451 12,889 608 774 4.7
Binga 127,391 1100 56 863 5.1
Lupane 104,738 2 0 2 0.0
Matebeleland North
Nkayi 119,131 34 9 29 26.5

Source: Ministry of Health and Child Welfare Rapid Disease Notification System 14
Cumulative since start
Population at risk Cases Deaths AR/100,000 CFR
Total 351,260 1,136 65 323 5.7
Beitbridge 110,105 5139 149 4,667 2.9
Gwanda 138,020 74 9 54 12.2
Umzingwane 65,264 1 0 0.0
Plumtree 82,971 32 1 39 3.1
Matabeleland South
Total 331,096 5,246 159 1,584 3.0
Bikita 166,595 2633 178 1,580 6.8
Chiredzi 248,417 4355 152 1,753 3.5
Chivi 165,215 1577 138 955 8.8
Gutu 210,750 326 14 155 4.3
Masvingo 280,196 936 64 334 6.8
Mwenezi 134,004 799 68 596 8.5
Zaka 196,495 853 62 434 7.3
Masvingo
Total 1,401,672 11,479 676 819 5.9
Chirumhanzu 74,764 57 2 76 3.5
Gokwe North 227,546 2627 124 1,154 4.7
Gokwe South 311,684 1755 65 563 3.7
Gweru City (Mkoba) 149,468 245 5 164 2.0
Kwekwe 303,094 932 46 307 4.9
Mberengwa 194,682 423 33 217 7.8
Shurugwi 93,828 34 8 36 23.5
Zvishavane 109,471 941 28 860 3.0
Midlands
Total 1,464,537 7,014 311 479 4.4
GD TOTAL 11,498,526 93,482 4,095 813 4.4
Chegutu population including Norton population
Goromonzi population including Ruwa population
Guruve population including Mbire population
Hurungwe population including Karoi and Chirundu populations
Kwekwe population including Redcliff population
Makondé population including Chinhoyi population
Makoni population including Rusape population
Seke population including Epworth population