chlorophyll a and phosphate data: group 3 analysis caitlin woolsey, jack lane, jaclyn phi, laura...
TRANSCRIPT

Chlorophyll a and Phosphate Data:
Group 3 AnalysisCaitlin Woolsey, Jack Lane, Jaclyn Phi, Laura Crews
Earth Systems 151/152April 30, 2015

Group 3 Data Analysis
1. Chlorophyll a a. Excluded Erroneous Datab. Comparison with Underway Fluorescence
Datac. Comparison with MBARI M1 Data
2. Phosphate Concentrations a. Comparison with Chlorophyll a Datab. Comparison with MBARI M1 Data

Comparison with MBARI M1http://www.mbari.org/bog/Projects/centralcal/summary/reports/Annual_Means_CHL_GFF_M1.htm
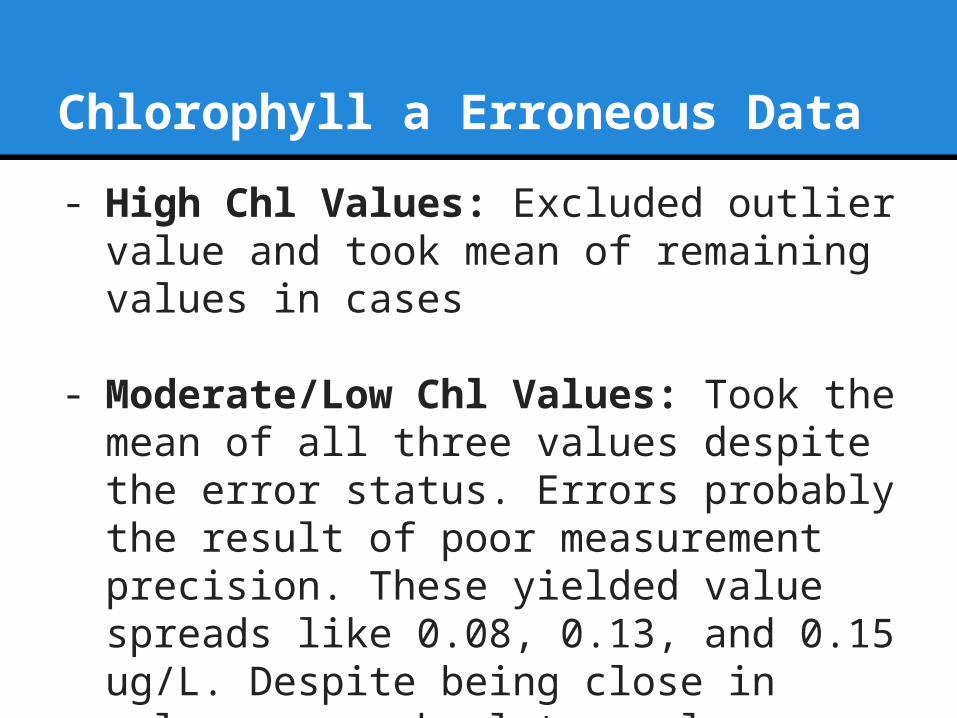
Chlorophyll a Erroneous Data
- High Chl Values: Excluded outlier value and took mean of remaining values in cases
- Moderate/Low Chl Values: Took the mean of all three values despite the error status. Errors probably the result of poor measurement precision. These yielded value spreads like 0.08, 0.13, and 0.15 ug/L. Despite being close in value on an absolute scale, relative to each other the standard deviation is large.

Chlorophyll a (ug/L) Depth Profile
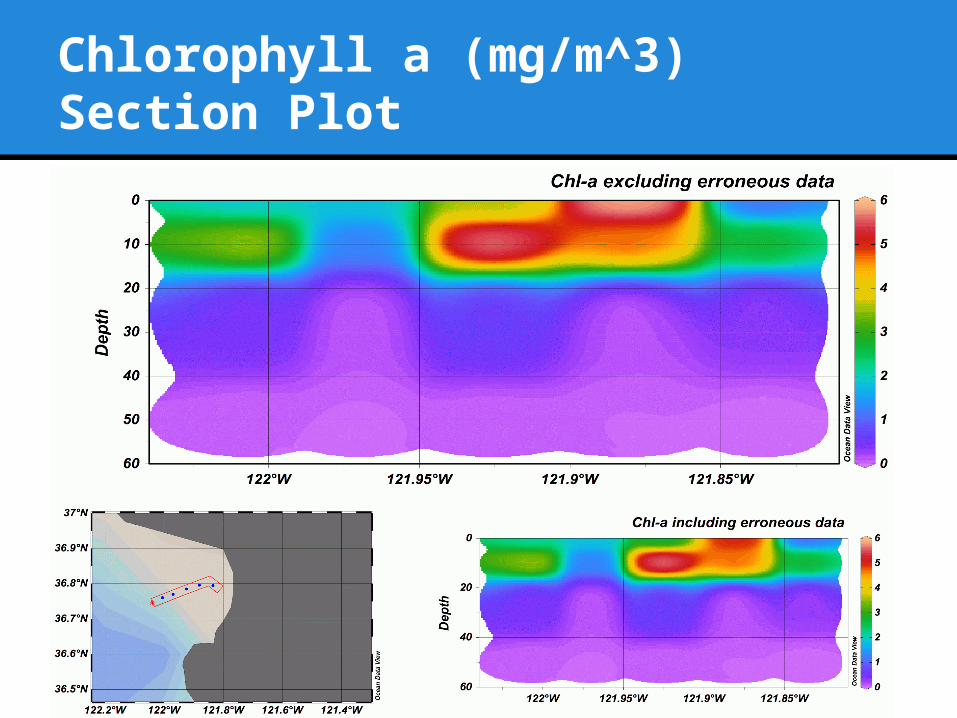
Chlorophyll a (mg/m^3) Section Plot

MBARI M1 Chlorophyll a Data Con.http://www.mbari.org/bog/Projects/centralcal/summary/ts_summary.htm
From 1989 to 2004Our average chl: 1.700 mg/m^3

Phosphate and Chl a Depth Profile

Phosphate (µM) Section Plot

Phosphate vs Chlorophyll a

MBARI M1 Phosphate Datahttp://www.mbari.org/bog/Projects/centralcal/summary/reports/Annual_Means_PO4_M1.htm
Depth range: <10 metersOur average concentration: 0.10 uM

Underway Chl-a μ/L Surface Map (converted from underway flouresence)

Underway Chl-a μ/L Surface Map zoom(converted from underway flouresence)

Group 3 Data Analysis
1. Chlorophyll a a. Excluded Erroneous Datab. Comparison with Underway Fluorescence
Datac. Comparison with MBARI M1 Data
2. Phosphate Concentrations a. Comparison with Chlorophyll a Datab. Comparison with MBARI M1 Data