chlorination of toxic cyanobacterial cells and their associated toxins
TRANSCRIPT

UNIVERSITÉ DE MONTRÉAL
CHLORINATION OF TOXIC CYANOBACTERIAL CELLS AND THEIR
ASSOCIATED TOXINS
YAN FAN
DÉPARTEMENT DES GÉNIES CIVIL, GÉOLOGIQUE ET DES MINES
ÉCOLE POLYTECHNIQUE DE MONTRÉAL
MÉMOIRE PRÉSENTÉ EN VUE DE L’OBTENTION
DU DIPLÔME DE MAÎTRISE ÈS SCIENCES APPLIQUÉES
(GÉNIE CIVIL)
SEPTEMBRE 2012
© Yan Fan, 2012.
UNIVERSITÉ DE MONTRÉAL
ÉCOLE POLYTECHNIQUE DE MONTRÉAL
Ce mémoire intitulé:
CHLORINATION OF TOXIC CYANOBACTERIAL CELLS
AND THEIR ASSOCIATED TOXINS
présenté par : FAN Yan
en vue de l’obtention du diplôme de : Maîtrise ès sciences appliquées
a été dûment accepté par le jury d’examen constitué de :
M. DESJARDINS Raymond, M. Ing., président
Mme PRÉVOST Michèle, Ph. D., membre et directrice de recherche
M. BARBEAU Benoit, Ph. D., membre et codirecteur de recherche
Mme DORNER Sarah, Ph. D., membre

iii
DEDICATION
To my family in China
For their unconditional love and support throughout my life

iv
ACKNOWLEDGEMENTS
It is a pleasure to thank the many people who made this thesis possible.
Firstly, I would like to express my appreciation to my supervisors Dr. Michèle Prévost and Dr.
Benoit Barbeau. Thanks for accepting me as a student and giving me the opportunity to be part of
the CREDEAU. I would have been lost without their teaching, guidance, and patient
encouragement.
I would also like to thank Dr. Arash Zamyadi for his time, his advices and his great efforts to
explain details clearly and simply. It has been a great honour to work with him.
My gratitude also goes to the secretaries and the whole laboratory in the Department of CGM for
helping me in many different ways. The assistance of Shokoufeh Nour, France Boisclair, Laura
Razafinjanahary, Manon Latour, Jacinthe Mailly, Julie Philibert, Marcelin Fosting, Yves
Fontaine, Mireille Blais, Sisi Zhao, Natasha McQuaid, and Yan Wang is gratefully
acknowledged.
This study was financially supported by Natural Sciences and Engineering Research Council
(NSERC) Canada and partners of Industrial Chair on Drinking Water Treatment at Ecole
Polyechnique of Montreal.

v
RÉSUMÉ
Les cyanobactéries (algues bleu-verts), sont des microorganismes photosynthétiques aérobies qui
sont présentes dans les milieux aquatiques situés partout sur le globe. L’eutrophisation croissante
des eaux et le changement climatique tendent à favoriser la prolifération de cyanobactéries et la
formation des fleurs d’eau (blooms). Les cyanobactéries sont généralement considérées comme
des sources de goût et d’odeur dans les systèmes d’approvisionnement en eau potable. En
particulier, les cyanotoxines produites par certaines espèces de cyanobactéries peuvent nuire à la
santé humaine et animale. Par conséquent, les cyanobactéries suscitent une grande inquiétude
dans le monde entier.
La pré-chloration est utilisée dans certaines usines de traitement des eaux en Amérique du Nord.
La chloration directe de cyanobactéries peut permettre d’enlever des cellules et des toxines.
Toutefois, elle peut aussi causer des problèmes de qualité de l’eau, telles que la lyse cellulaire, le
relargage des toxines et du COD (Carbone organique dissous), l’augmentation de la demande en
chlore et la formation des sous-produits de désinfection (SPD).
La présente étude vise à examiner les effets de la pré-chloration des cyanobactéries (Microcystis
aeruginosa cultivée et fleurs d’eau naturels) et leur toxines associées. Les objectifs spécifiques de
ce projet sont de : (1) déterminer et modéliser la lyse cellulaire de M. aeruginosa, le relargage des
toxines et du COD et l’oxydation des MCs (Microcystines) pendant la chloration de l’eau ultra-
pure et de l’eau naturelle dopée avec des cultures en laboratoire; (2) estimer la demande en chlore
pour chaque cellule de M. aeruginosa lorsque la lyse cellulaire survient suite à la chloration; (3)
étudier la formation de SPD associés avec la chloration des composés provenant de la cellule de
M. aeruginosa; (4) évaluer l’efficacité de la chloration des cellules des cyanobactéries toxiques
dans des échantillons naturels de fleurs d’eau toxiques.
Les valeurs de CT (l’exposition au chlore) de 110.7 mg.min/L (pour l’eau de Rivière Mille-Île
dopée avec des M. aeruginosa cultivée) et 130.3 mg.min/L (pour l’eau extra-pure dopée avec des
M. aeruginosa cultivée) sont requis pour obtenir 76% de la lyse cellulaire et à oxyder les toxines
libérées jusqu’à un niveau inférieur à la valeur spécifiée de 1.0 µg/L de MC-LR dans les
Directives de l’OMS (Organisation mondiale de la Santé). Dans l’eau ultra-pure, les taux
d’oxydation des toxines étaient similaire ou plus rapide que les taux de lyse cellulaire. Une valeur
constante de 5.6±0.2 pgCl2/cellule est estimée comme la demande en chlore de chaque cellule de

vi
M. aeruginosa lorsque la lyse cellulaire survient suite à la chloration. Il n’existe pas de formation
de SPD significative dans la chloration de suspension lysée de M. aeruginosa (500,000
cellules/L) dans l’eau ultra-pure. Les fleurs d’eau naturelle sont plus résistantes à la chloration
que la suspension cellulaire des cultures en laboratoire.
vii
ABSTRACT
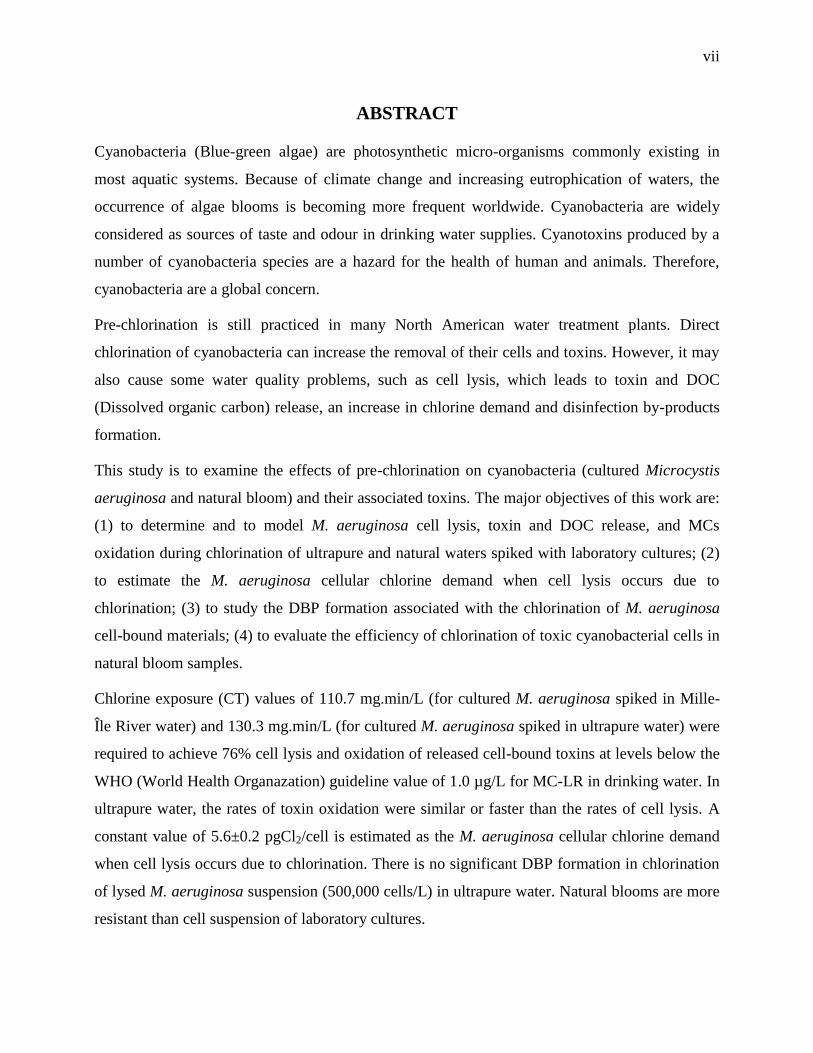
Cyanobacteria (Blue-green algae) are photosynthetic micro-organisms commonly existing in
most aquatic systems. Because of climate change and increasing eutrophication of waters, the
occurrence of algae blooms is becoming more frequent worldwide. Cyanobacteria are widely
considered as sources of taste and odour in drinking water supplies. Cyanotoxins produced by a
number of cyanobacteria species are a hazard for the health of human and animals. Therefore,
cyanobacteria are a global concern.
Pre-chlorination is still practiced in many North American water treatment plants. Direct
chlorination of cyanobacteria can increase the removal of their cells and toxins. However, it may
also cause some water quality problems, such as cell lysis, which leads to toxin and DOC
(Dissolved organic carbon) release, an increase in chlorine demand and disinfection by-products
formation.
This study is to examine the effects of pre-chlorination on cyanobacteria (cultured Microcystis
aeruginosa and natural bloom) and their associated toxins. The major objectives of this work are:
(1) to determine and to model M. aeruginosa cell lysis, toxin and DOC release, and MCs
oxidation during chlorination of ultrapure and natural waters spiked with laboratory cultures; (2)
to estimate the M. aeruginosa cellular chlorine demand when cell lysis occurs due to
chlorination; (3) to study the DBP formation associated with the chlorination of M. aeruginosa
cell-bound materials; (4) to evaluate the efficiency of chlorination of toxic cyanobacterial cells in
natural bloom samples.
Chlorine exposure (CT) values of 110.7 mg.min/L (for cultured M. aeruginosa spiked in Mille-
Île River water) and 130.3 mg.min/L (for cultured M. aeruginosa spiked in ultrapure water) were
required to achieve 76% cell lysis and oxidation of released cell-bound toxins at levels below the
WHO (World Health Organazation) guideline value of 1.0 µg/L for MC-LR in drinking water. In
ultrapure water, the rates of toxin oxidation were similar or faster than the rates of cell lysis. A
constant value of 5.6±0.2 pgCl2/cell is estimated as the M. aeruginosa cellular chlorine demand
when cell lysis occurs due to chlorination. There is no significant DBP formation in chlorination
of lysed M. aeruginosa suspension (500,000 cells/L) in ultrapure water. Natural blooms are more
resistant than cell suspension of laboratory cultures.

viii
TABLE OF CONTENTS
DEDICATION .............................................................................................................................. III
ACKNOWLEDGEMENTS .......................................................................................................... IV
RÉSUMÉ ........................................................................................................................................ V
ABSTRACT .................................................................................................................................VII
TABLE OF CONTENTS ........................................................................................................... VIII
LIST OF TABLES ......................................................................................................................... X
LIST OF FIGURES ....................................................................................................................... XI
LIST OF ABBREVIATIONS .................................................................................................... XIII
LIST OF APPENDICES ............................................................................................................. XV
INTRODUCTION ........................................................................................................................... 1
Background .................................................................................................................................. 1
Objectives ..................................................................................................................................... 3
Structure of the thesis ................................................................................................................... 3
CHAPTER 1 LITERATURE REVIEW .................................................................................... 4
1.1 Cyanobacteria ................................................................................................................... 4
1.2 Harmful effects and occurrence of cyanobacterial blooms and cyanotoxins ................... 5
1.3 Classification of toxins and principal toxins .................................................................... 6
1.4 Measurement methods for cyanotoxins ............................................................................ 9
1.5 Treatment methods of cyanobacteria ............................................................................... 9
1.5.1 Conventional treatment .............................................................................................. 12
1.5.2 Chemical oxidation / Chlorination ............................................................................. 12
CHAPTER 2 MATERIALS AND METHODS ...................................................................... 17
2.1 Materials / Chemicals and Reagents .............................................................................. 17
ix
2.2 Water Source .................................................................................................................. 17
2.3 Chlorination experiments ............................................................................................... 18
2.4 Taxonomic counts with species identification ............................................................... 22
2.5 Analysis of MCs and DBPs ............................................................................................ 22
2.6 Data analysis .................................................................................................................. 22
CHAPTER 3 RESULTS AND DISCUSSION ....................................................................... 24
3.1 Impact of cyanobacterial celluler compounds and water matrix on chlorine demand ... 25
3.2 Chlorination effect on cells lysis and estimation of chlorine demand per cell .............. 28
3.3 Impact of chlorination on release and oxidation on cell-bound cyanotoxins ................. 35
3.4 Chlorination effect on cellular organic carbon release and DBP formation .................. 39
CONCLUSION ............................................................................................................................. 42
REFERENCES .............................................................................................................................. 44
APPENDICES ............................................................................................................................... 51

x
LIST OF TABLES
Table 1.1: Techniques for treatment of cyanobacterial cells and their toxins ................................ 11
Table 1.2: Ratio of HOCl to OCl- and concentrations of the species at different pH. Initial
concentration 5.4 mg/L as Cl2 ................................................................................................ 13
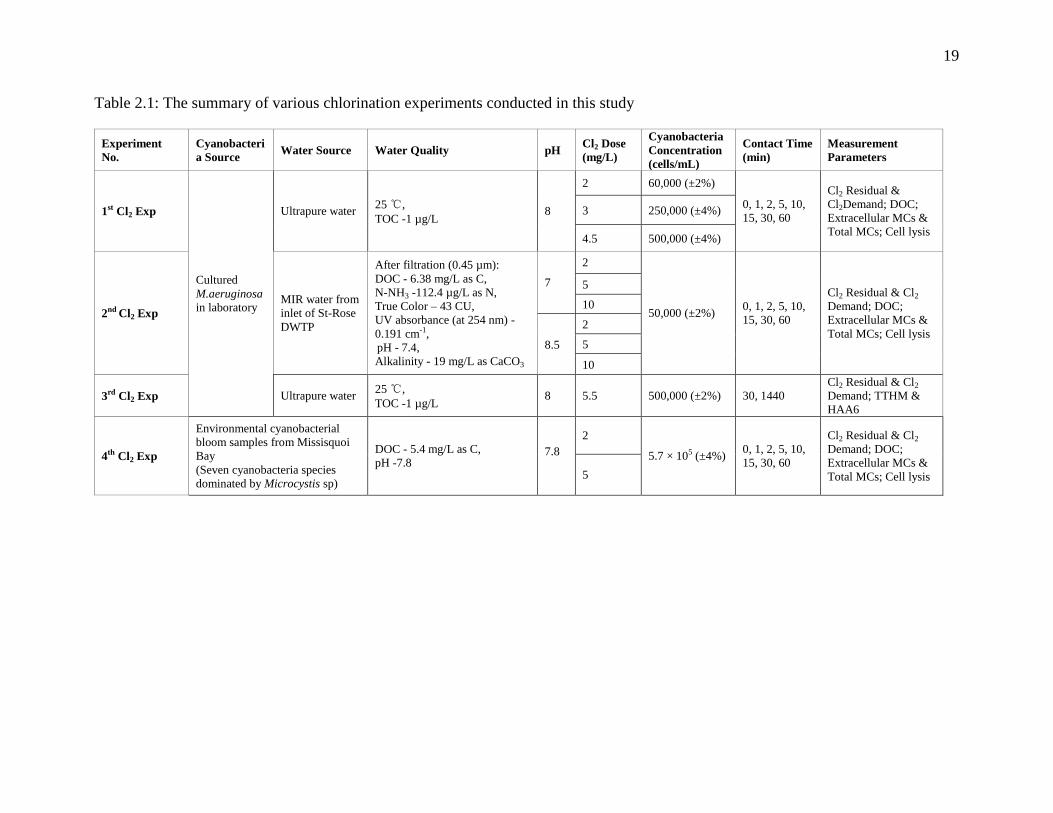
Table 2.1: The summary of various chlorination experiments conducted in this study ................ 19
Table 3.1: First-order apparent rate constants (kCl2) in s-1
for chlorine decay ................................ 27
Table 3.2: Apparent rate constants for cell lysis or reduction in total cell count (klysis - M-1
s-1
), for
loss of cell integrity or cell rupture (krelease - M-1
s-1
), for total toxins oxidation (ktotal - M-1
s-1
)
and for the oxidation of dissolved toxins released from damaged cells (kdissolved - M-1
s-1
)
derived from this study compared to published results. Comments in parenthesis describe
the origin of the CB cells (from laboratory cultures or environmental bloom samples) and
the toxins (from standard extracts or cell-bound) (* MC-LR equivalent) ............................. 32
Table 3.3: DBP formation in chlorination of lysed M. aeruginosa suspension of 500,000 cells/mL
in ultrapure water at pH 8 ....................................................................................................... 41
xi
LIST OF FIGURES
Figure 1-1: Chemical structures of different variants of microcystin (MC), 3-
desmethylmicrocystins (dmMC) .............................................................................................. 8
Figure 3-1: Chlorine demand of M. aeruginosa suspensions in (a) ultrapure water with 60,000,
250,000 and 500,000 cells/mL under 2, 3 and 4.5 mg/L Cl2 respectively at pH 8, and 50,000
cell/mL in MIR water under 2, 5 and 10 mg/L Cl2 (b) at pH 7, (c) pH 8.5, and (d) chlorine
demand in Missisquoi Bay (MB) bloom water samples with 5.7×10⁵ (±4%) cells/mL at
ambient pH (pH ambient before chlorination was 7.8; pH augmented to 8.1 and 8.3 after
chlorination with 2 and 5 mg/L Cl2 respectively, and remained constant for the rest of the
experiment) ............................................................................................................................. 26
Figure 3-2: Reduction in number of cells (cell lysis) during chlorination of M. aeruginosa
suspensions of (a) 60,000 cells/mL with 2 mg/L Cl2, (b) 250,000 cells/mL with 3 mg/L Cl2,
and (c) 500,000 cells/mL with 4.5 mg/L Cl2, in ultrapure water at pH 8 ............................... 29
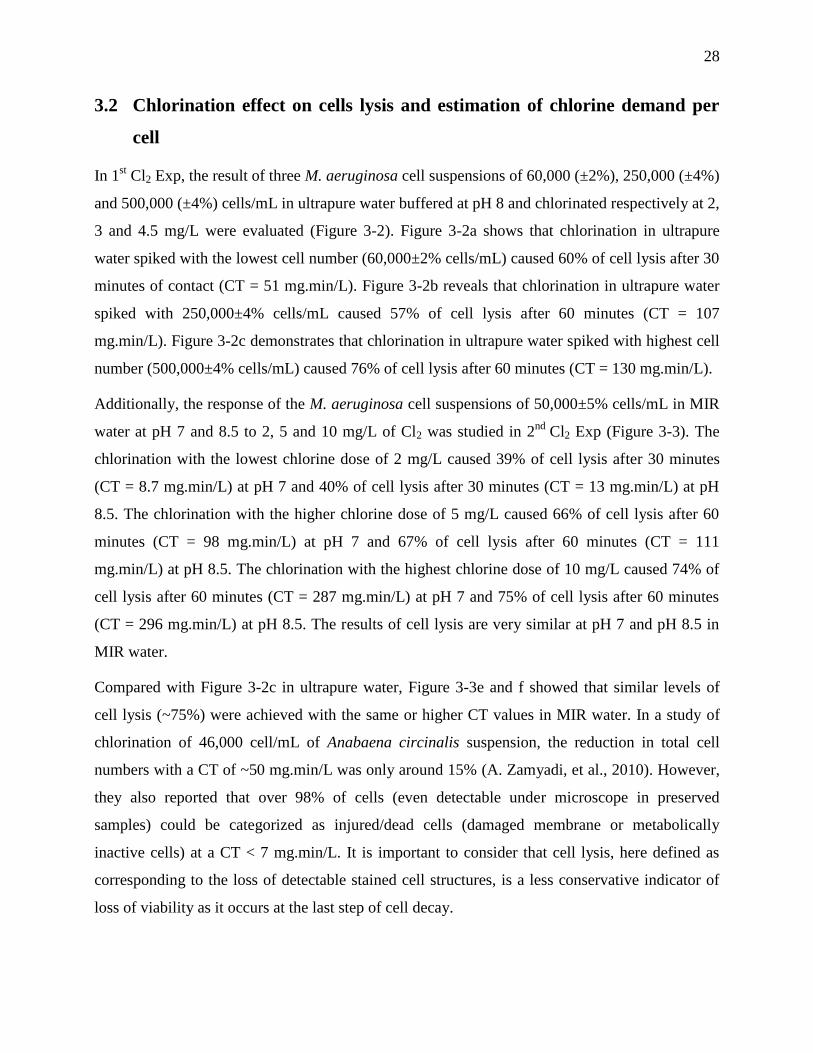
Figure 3-3: Reduction in number of cells (cell lysis) during chlorination of M. aeruginosa
suspensions (50,000 cells/mL) in MIR water (a) at pH 7 with 2 mg/L Cl2, (b) at pH 8.5 with
2 mg/L Cl2, (c) at pH 7 with 5 mg/L Cl2, (d) at pH 8.5 with 5 mg/L Cl2, (e) at pH 7 with 10
mg/L Cl2, and (f) at pH 8.5 with 10 mg/L Cl2 ........................................................................ 30
Figure 3-4: Cell numbers after chlorination of Missisquoi Bay bloom water samples using (a) 2
mg/L Cl2, and (b) 5 mg/L Cl2 ................................................................................................. 33
Figure 3-5: Proportion of seven cyanobacteria (CB) species out of total cyanobacteria cell in
Missisquoi Bay bloom sample (a) before chlorination (5.7×10⁵ (±4%) cells/mL), and (b)
after chlorination using a CT of 148 mg.min/L (2.7×10⁵ (±4%) cells/mL – 53% reduction of
total cell numbers) .................................................................................................................. 33
Figure 3-6: Toxins release and oxidation from M. aeruginosa suspensions in ultrapure water at
pH 8 with cell number and chlorine doses of (a) 60,000 cells/mL and 2 mg/L Cl2, (b)
250,000 cell/mL and 3 mg/L Cl2, and (c) 500,000 cells/mL and 4.5 mg/L Cl2, respectively 36
Figure 3-7: Toxins release and oxidation after chlorination of Missisquoi Bay bloom water
samples (approximately 5.7×10⁵ ±4% cells/mL) using 2 and 5 mg/L Cl2 ............................. 37
xii
Figure 3-8: DOC release from chlorination of M. aeruginosa suspensions in (a) ultrapure water at
pH 8 and (b) MIR water at pH 8.5 spiked with 50,000 cells/mL (results in MIR water at pH
7 were similar to those of pH 8.5) .......................................................................................... 39

xiii
LIST OF ABBREVIATIONS
ADN 3-amino-9-methoxy-2, 6, 8-trimethyl-10-phenyldeca-4, 6-dienoic acid
ANTXs Anatoxins
AOM Algogenic organic matter
CB Cyanobacteria
Cl2 Chlorine
CYL Cylindrospermopsin
DBP Disinfection by-products
DOC Dissolved organic carbon
ELISA Enzyme-linked immunosorbent assays
EOM Extracellular organic matter
GTXs Gonyautoxins
HPLC High performance liquid chromatography
IOM Intracellular organic matter
LD50 Lethal dose 50
LPS Lipopolysaccharides
MCs Micorystins
MC-LR Microcystin- leucine arginine
Mdha N-methyldehydroalanine
MMPB 3-menthoxy-2-methyl- 4-phenylbutyric acid
MS Mass spectrograph
NODs Nodularins
NOM Natural organic matter
PDA Photo-diode array

xiv
PPIA Protein phosphatise inhibition assays
TOC Total organic carbon
WHO World Health Organization
xv
LIST OF APPENDICES
APPENDIX 1: Cyanotoxin name, producer organisms and health effects .................................... 51
APPENDIX 2: Measurement methods for cyanotoxins ................................................................. 52
APPENDIX 3: Conventional treatments of cyanobacteria ............................................................ 54
APPENDIX 4: Chlorination of Microcystis aeruginosa: toxin release and oxidation, cellular
chlorine demend and disinfection by-products formation ...................................................... 56
APPENDIX 5: Toxic cyanobacterial breakthrough and accumulation in a drinking water plant: A
monitoring and treatment challenge ....................................................................................... 81
1
INTRODUCTION
Background
Nowadays, because of climate change (especially global warming) and increasing eutrophication
of waters, the occurrence of cyanobacteria blooms is becoming more and more frequent and has
been highlighted as a great concern worldwide. Cyanobacteria, as known as blue-green algae, are
oxygenic photosynthetic prokaryotes commonly existing in almost every conceivable freshwater,
marine and terrestrial environment and also can be found in some extreme habitats (Chorus &
Bartram, 1999). A number of them can produce lethal toxins (cyanotoxins) as well as taste and
odour substances, which are counted as severe problems in drinking water resources (Miao &
Tao, 2009).
Cyanotoxins have been responsible for death of animals and human illness in many countries.
Microcystins (MCs), which were first extracted from the genera of cyanobacteria Microcystis
aeruginosa, are hepatotoxins and the most frequently detected cyanotoxins in harmful
cyanobacteria blooms from fresh water (Chorus & Bartram, 1999). Because of liver damage
caused by microcystins, the symptoms of human illness are gastroenteritis and allergic or
irritation reactions (Brookes et al., 2008; Merel, Clément, & Thomas, 2010). Furthermore, MCs
have also been reported as potential tumour promoters in rats and mice (I. R. Falconer, 1991; Ho
et al., 2006). Thus, chronic exposure to even low concentrations of microcystins can result in a
serious health issue in humans (de Figueiredo, Azeiteiro, Esteves, Gonçalves, & Pereira, 2004).
Among MCs, microcystin-LR (MC-LR) is the most frequent and toxic MC with an LD50 of 50
µg/kg of body weight (E. M. Rodriguez, Acero, Spoof, & Meriluoto, 2008; Westrick, Szlag,
Southwell, & Sinclair, 2010). The World Health Organization (WHO) has set a provisional
guideline value of 1.0 µg/L for MC-LR in drinking water (World Health Organization (WHO),
1998). This value has been adopted and used as a basis in many countries; Canadian Guideline
for Drinking Water Quality for MC-LR is a proposed value of 1.5 µg/L which was established by
Health Canada (Health Canada, 2007).
In Canada, cyanobacteria and their toxins, mianly microcystins, have been detected commonly in
fresh water sources, especially during the seasons of summer and autumn (Jones, Gurney, &
Rocan, 1998; Kotak & Zurawell, 2007; McQuaid, Zamyadi, Prévost, Bird, & Dorner, 2011). In
2
Quebec, 30.9% of raw water samples collected in the supply of drinking water plants using high
risk sources dominated by potentially toxic cyanobacteria in 2004; this percentage increased to
82.6% in 2006 (Robert, 2008). In addition, the maximum concentration of cyanotoxins detected
in these samples of raw water was 5.35 μg/L equ. MC-LR (Carrière, Prévost, Zamyadi,
Chevalier, & Barbeau, 2010; Robert, 2008). Obviously, to minimize the threat of toxins, the
treatment for cyanobacteria and their toxins is necessary.
To choose proper treatment of cyanobacteria and cyanotoxins, it is important to consider both
cell-bound and dissolved components. In aquatic systems, most of cyanotoxins usually remain
contained within intact cells (cell-bound toxins), and the remaining are extracellular dissolved
toxins (Chorus & Bartram, 1999; Donati, Drikas, Hayes, & Newcombe, 1994). Conventional
treatment processes (coagulation, flocculation, sedimentation and filtration) is effective for
removal of cyanobacterial cells but inadequate for removing dissolved cyanotoxins (Chow,
Drikas, House, Burch, & Velzeboer, 1999; Svrcek & Smith, 2004). Chemical oxidation with
some common oxidants, such as chlorine, chloramines, ozone, chlorine dioxide and potassium
permanganate, is a promising option as a safe barrier against cyanobacteria and their toxins (Hou,
Hu, Jia, & Liu, 2008; E. M. Rodriguez, et al., 2008). Furthermore, the oxidation could be
considered as a pre-treatment function or a disinfection stage.
There are increasing interests regarding the pre-treatment by oxidation, because of a wide variety
of uses including: control of biological growth, tastes and odours and oxidizing organic matter to
improve the coagulation/flocculation (Chorus & Bartram, 1999). Also, pre-chlorination at the raw
water intake or intermediate chlorination ahead of the filters are still practiced in many water
treatment plants. In drinking water pre-treatment, the addition of oxidants such as chlorine (Cl2)
to untreated water prior to coagulation has been shown to increase the removal of cyanobacteria
cells and improve the following treatment processes (J. Plummer & Edzwald, 2002). However, it
can also cause several water quality problems by decomposing of cells, e.g. increased chlorine
demand, elevated chlorination by-products (DBP) formation, the release of DOC and cell-bound
toxin and consequent increase in dissolved toxin levels (Daly, Ho, & Brookes, 2007). Therefore,
pre-chlorination should be investigated to choose the suitable treatment conditions (i.e. dose, pH,
contact time), which can be more effective on killing cyanobacteria cell, oxidizing released toxins
to non toxic materials, controlling the DOC release and avoiding the DBP formation. Otherwise,

3
it would cause cell lysis and released toxins might end up in treatment station even in treated
water.
Objectives
This study is to examine the effects of chlorine pre-treatment on cyanobacterial cells (cultured
Microcystis aeruginasa and natural bloom) and their associated toxins. The specific objectives of
this research are to:
1. Determine and to model the M. aeruginosa cells lysis, toxins and DOC release, and MCs
oxidation during chlorination of ultrapure and natural water spiked with laboratory
cultures;
2. Estimate the M. aeruginosa cellular chlorine demand when cell lysis occurs due to
chlorination;
3. Study the DBP formation associated with the chlorination of M. aeruginosa cell-bound
materials;
4. Evaluate the efficiency of chlorination of toxic cyanobacterial cells in natural bloom
samples.
Structure of the thesis
Chapter 1 will present the literature review by providing an in-depth review of the current
knowledge of cyanobacteria and their toxins, the measurement methods of cyanotoxins and the
treatment by chlorination. Chapter 2 will provide the materials and methods used for the
laboratory testing. The results and discussions will be then presented in Chapter 3. Finally, the
conclusions and recommendations will be given at the end in the Conclusion chapter.

4
CHAPTER 1 LITERATURE REVIEW
1.1 Cyanobacteria
Cyanobacteria, also known as blue-green algae, are a large and heterogeneous group of asexual
photosynthetic micro-organisms that possess the ability to synthesize chlorophyll a (Hou, et al.,
2008). They commonly exist in a wide variety of freshwater, marine and terrestrial environments
and also can be found in some extreme habitats, such as hypersaline, hot springs (at temperature
up to 72 oC), and deserts (Chorus & Bartram, 1999).
Cyanobacteria had been classified with the algae because of their mechanism of photosynthesis;
however, they are unicellular or multicelluar prokaryotes (i.e. whose cells lack a cell nucleus and
have no membrane-bound sub-cellular organelles) with gram-negative cell walls (Hou, et al.,
2008); whereas the cells of algae and plants are eukaryotic. They are classified within Eubacteria
due to their cell structure and consist of more than 120 genera and 2000 species (Gerrath, Wehr,
& Sheath, 2003). Most cyanobacteria can grow with light as an energy source through CO2-
dependent oxygen-evolving photosynthesis (Chorus & Bartram, 1999). The photosynthetic
pigments of cyanobacteria, which contribute to the variety of cell colors from blue-green to
violet-red, are chlorophyll a and accessory light-harvesting pigments such as phycocyanin,
allophycocyanin and phycoerythrin (Chorus & Bartram, 1999). Many species of cyanobacteria
have the ability of nitrogen-fixing (convert atmospheric N2 to NH3) which contribute greatly to
the nitrogen economy of aquatic and terrestrial habitats (Fay, 1992; Oliver & Ganf, 2000; Svrcek
& Smith, 2004).
Cyanobacteria have been found as fossils in early Archaean rocks of Western Australia dated 3.3-
3.5 billion year ago (Hudnell, 2008; Sedmak & Kosi, 1998). Cyanobacteria are thought to be one
of the pioneer oxygen-producing photosynthetic organisms on the early Earth and likely
responsible for the conversion of the atmosphere from anaerobic to aerobic (Chorus & Bartram,
1999; Svrcek & Smith, 2004). Today, they still remain important as primary producers in marine
environment.
5
1.2 Harmful effects and occurrence of cyanobacterial blooms and
cyanotoxins
As known to all, cyanobacteria are integral parts of many ecosystems. However, there has been
an increasing occurrence of cyanobacterial blooms and cyanotoxins (Paul, 2008; Svrcek & Smith,
2004). Cyanobacterial bloom, which is a rapid enlarge or dense accumulation of numerous
buoyant cyanobacterial cells or colonies in an aquatic systems, occur when a combination of
favourable conditions such as nutrient enrichment (particularly phosphorus and nitrogen), warm
temperature (15 o
C to 30 o
C), neutral to alkaline pH (pH 6 to 9), and calm stable waters (W.W.
Carmichael, 1994; Hitzfeld, Höger, & Dietrich, 2000; Newcombe, House, Ho, Baker, & Burch,
2010). Therefore, the increased eutrophication and climate change (especially global warming)
caused by human actions and activities, are majorly responsible for the formation of bloom
(Anderson, Glibert, & Burkholder, 2002; El-Shehawy, Gorokhova, Fernández-Piñas, & del
Campo, 2012; Paerl & Paul, 2012).
Cyanobacterial blooms are undesirable. They hinder drinking, recreational and agricultural use of
water bodies by producing offensive taste and odour compounds (such as geosmin and 2-
methylisoborneol) and contributing to total organic carbon (TOC) and turbidity (Nguyen et al.,
2005; Taylor et al., 2006). More importantly, 60 to 70% of observed cyanobacterial bloom
includes toxin-producing strains of cyanobacteria (Fawell, Hart, James, & Parr, 1993); and the
substaintial amounts of harmful cyanotoxins can be released into watershed during the death and
lysis of cells in a cyanobacterial bloom (W.W. Carmichael, 1994; W. W. Carmichael, 2001;
Svrcek & Smith, 2004). Cyanotoxins, as secondary metabolites produced by a small group of
cyanobacteria mainly include Anabaena, Aphanizomenon, Cylindrospermopsis, Lyngbya,
Microcystis, Nodularia, Nostoc, Oscillatoria, and Planktothrix. They are accountable for animal
poisoning, human gastroenteritis, dermal contact irritations, allergic response and primary liver
and kidney damage in humans (W. W. Carmichael, 2001; Codd, 2000; Duy, Lam, Shaw, &
Connell, 2000; I.R. Falconer & Humpage, 2005). The main toxins are microcystins, anatoxins,
cylindrospermopsins and saxitoxins (Duy, et al., 2000).
The harmful cyanobacterial events due to the presence of cyanobacterial blooms and cyanotoxins
have been found worldwide since the first report of animal deaths after livestock ingested water
during a cyanobacterial bloom in Australia in 1878 (Codd, Lindsay, Young, Morrison, &
6
Metcalf, 2005). In May 2007, a harmful cyanobacterial bloom event occurred in a large area of
China’s third largest freshwater lake-Taihu of Wuxi which threatened the supply of drinking
water and fisheries-related food supplies for more than 8 million people (Cong, Shi-xin, Yi, &
Fu-li, 2009; Liu, Chen, Li, Huang, & Shen, 2011). In Scotland, Ireland and New Zealand, dog
deaths have occurred after eating fragments of anatoxin-a- producing cyanobacteria and drinking
the water nearby (Codd, et al., 2005). A study has shown that anatoxin-a- and microcystin-
containing cyanobacterial blooms have resulted in numerous cattle deaths in small lakes at alpine
summer pastures in Switzerland (Mez et al., 1997). Although many reports of cyanobacteria
poisonings involve the death of animals, some publications have proven that it could also be fatal
to humans (Svrcek & Smith, 2004). In Brazil, 52 deaths of dialysis patients from water
contaminated with cyanotoxins were reported (Jochimsen et al., 1998).
Cyanobacteria associated with the production of microcystins were detected in 539 of 677 (80%)
raw water sources in 45 North American cities (W.W. Carmichael, 2000). Another study showed
that the microcystins have been found in the majority of raw water samples from 33 American
water supplies; but only 7% of samples had more than 1 μg/L of microcystin (Haddix, Hughley,
& Lechevallier, 2007). In Canada, cyanobacteria and their toxins, especially microcystins, have
been detected in multiple lakes, some of which are drinking water sources (Jones, et al., 1998). In
Alberta, cyanotoxins have been found in 67% of samples of raw water from drinking water
facilities, with a maximum total microcystin concentration of 14.8 μg/L (Kotak & Zurawell,
2007; Zurawell, 2002). In Québec, 78.2% of raw water samples collected in the supply of plants
using high risk sources contained one or more species of toxic cyanobacteria in 2004; this
percentage increased to 87% in 2006. In addition, the maximum concentration of microcystins (in
all forms) measured in raw water was 5.35 μg/L (Carrière, et al., 2010; Robert, 2008).
1.3 Classification of toxins and principal toxins
At least a third of the 50 known genera of cyanobacteria can produce toxins as secondary
metabolites (Yoo, Carmichael, Hoehn, & Hrudey, 1995). The toxins are generated in all
cyanobacteria growth cycle and remain mostly in the cell (cell-bound toxin) until age or stress
result in their release into the surrounding water to form dissolved toxin during cell lysis (Svrcek
& Smith, 2004). Cyanotoxins usually fall into three groups based on their chemical structure:
cyclic peptides, alkaloids, and lipopolysaccharides (LPS) (Chorus & Bartram, 1999). They can

7
also be classified into four classes according to the mechanisms of toxicity: hepatotoxins,
neurotoxins, general cytoxins, and endotoxins (Newcombe, Cook, Brooke, Ho, & Slyman, 2003;
Yoo, et al., 1995). The cyanotoxins produced by the specific species of cyanobacteria and their
health effects are listed in Appendix 1.
Hepatotoxins
Hepatotoxins are natural products with molecular weight of 800-1,100 Daltons that demage the
liver. They contain either five (nodularins) or seven (microcystins) amino acids, with two
terminal amino acids being joined to form cyclic compounds. The most frequently detected
cyanotoxins in harmful cyanobacteria blooms from fresh water is the microcystin family
(Brookes, et al., 2008; Chorus & Bartram, 1999).
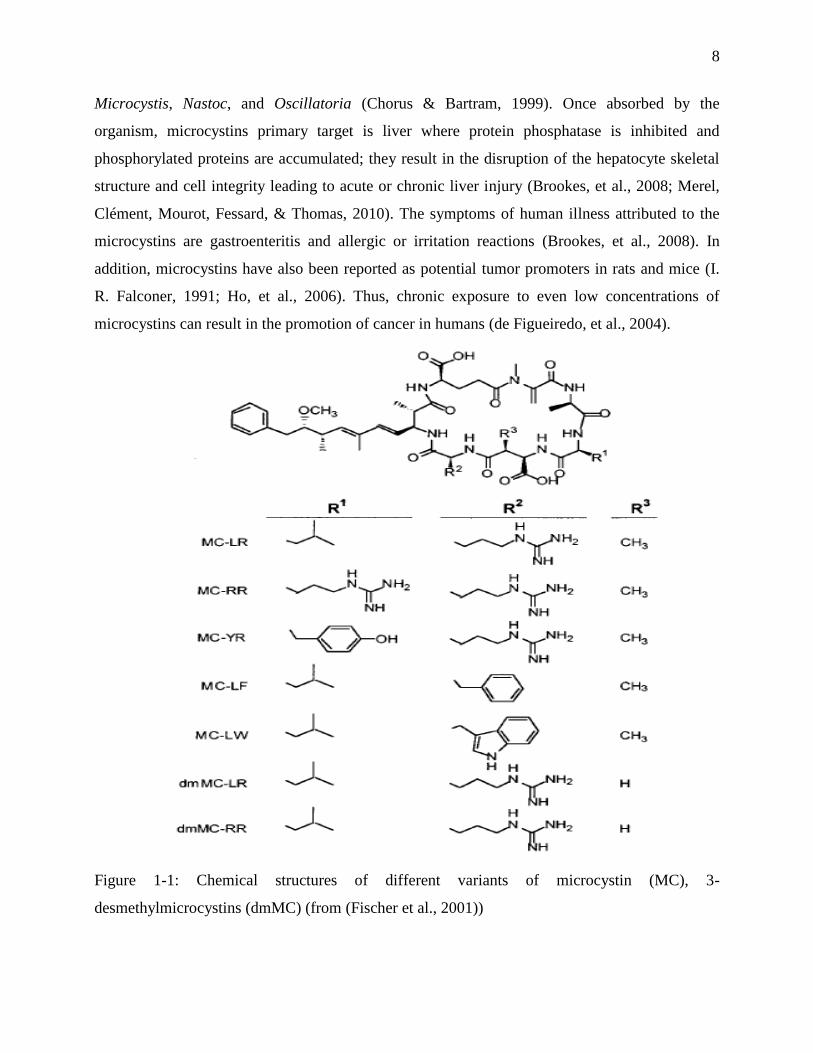
Microcystin
Figure 1-1 shows the chemical structures of different variants of microcystins. Structurally,
microcystins (MCs) are monocyclic heptapeptide made from seven amino acids with medium
molecular masses around 1,000 Daltons (Westrick, et al., 2010). The conserved toxic moiety is 3-
amino-9-methoxy-2, 6, 8-trimethyl-10-phenyldeca-4, 6-dienoic acid (Adda) and the other mostly
conserved unit is N-methyldehydroalanine (Mdha) (Chorus & Bartram, 1999; Westrick, et al.,
2010). They consist of more than 60 reported variants; however, microcystin-LR (MC-LR) with
the variable amino acids leucine (L) and arginine (R) is the most frequent and toxic MC, with an
LD50 value of 50 µg/kg (E. M. Rodriguez, et al., 2008; Westrick, et al., 2010). MC-RR, MC-YR
and MC-LA also occur more frequently in freshwaters (de Figueiredo, et al., 2004). Based on
animals studies of MC-LR toxicity, the World Health Organization (WHO) has set a provisional
guideline value of 1.0 µg/L for MC-LR in drinking water (World Health Organization (WHO),
1998). This value has been adopted and used as a basis in many countries such as Brazil, New
Zealand, and UK. Canadian Guideline for Drinking Water Quality for MC-LR is at the approval
stage with a proposed value of 1.5 µg/L which was established by Health Canada (Health
Canada, 2007). The Institut national de Santé publique du Québec also suggested a provisional
value of 3.7 µg/L for anatoxin-a currently ((INSPQ), 2004).
Microcystins were first extracted from the genera of cyanobacteria Microcystis aeruginosa and
have been found frequently in genera Anabaena, Anabaenopsis, Aphanicapsa, Hapalosiphon,
8
Microcystis, Nastoc, and Oscillatoria (Chorus & Bartram, 1999). Once absorbed by the
organism, microcystins primary target is liver where protein phosphatase is inhibited and
phosphorylated proteins are accumulated; they result in the disruption of the hepatocyte skeletal
structure and cell integrity leading to acute or chronic liver injury (Brookes, et al., 2008; Merel,
Clément, Mourot, Fessard, & Thomas, 2010). The symptoms of human illness attributed to the
microcystins are gastroenteritis and allergic or irritation reactions (Brookes, et al., 2008). In
addition, microcystins have also been reported as potential tumor promoters in rats and mice (I.
R. Falconer, 1991; Ho, et al., 2006). Thus, chronic exposure to even low concentrations of
microcystins can result in the promotion of cancer in humans (de Figueiredo, et al., 2004).
Figure 1-1: Chemical structures of different variants of microcystin (MC), 3-
desmethylmicrocystins (dmMC) (from (Fischer et al., 2001))

9
1.4 Measurement methods for cyanotoxins
In order to monitor cyanotoxins in water systems and assess their behavior during water
treatment, some robust and sensitive analytical measurement methods are required and have been
developed (B. Nicholson & Shaw, 2011). The common analytical methods available for
cyanotoxin range from immunological or biochemical screening techniques based on enzyme-
linked immunosorbent assays (ELISA) and enzyme activity (protein phosphatase inhibition
assays, PPIA ) respectively, to quantitative chromatographic techniques based on high
performance liquid chromatography (HPLC) with various detections (ultraviolet, UV; photo-
diode array, PDA; mass spectrograph, MS or fluorescence detection) and more sophisticated
liquid chromatography-mass spectrometry (LC-MS) (Newcombe, et al., 2010; B. C. Nicholson &
Burch, 2001).
Capillary electrophoresis (CE) and 3-menthoxy-2-methyl-4-phenylbutyric acid (MMPB) method
are less common analytical techniques and have been evaluated in some laboratories (B.
Nicholson & Shaw, 2011; B. C. Nicholson & Burch, 2001). Animal bioassays (mouse tests) are
also available for screening all toxic substances of cyanobacteria. A table comparing common
methods of measuring cyanotoxins and general considerations for optimum measurement is
presented in Appendix 2.
1.5 Treatment methods of cyanobacteria
As the final option to minimize the threat of cyanobacteria and cyanotoxins in water supplies, a
number of physical, chemical and biological treatment technologies have been investigated in
many reports. As mentioned previously, a normal cyanobacteria cell can contain high
concentrations of toxin and/or taste and odour compounds confined within its wall (Chorus &
Bartram, 1999; Newcombe, et al., 2010). In addition, cyanotoxins can be either found inside of
cells (called intracellular/cell-bound cyanotoxins which can be released by cell lysis) or outside
of cells (called extracellular/dissolved cyanotoxins) (Westrick, 2008). Especially under bloom
conditions, a substantial proportion of cell-bound toxins would be released to the water column
(Chorus & Bartram, 1999). Therefore, the efficiency of a treatment method depends on the form
of the cyanobacteria (i.e. individual cells, filamentous etc), the total concentration of toxins, and
whether it is dissolved or cell-bound. It is also important to consider whether the method causes

10
lysis of cells and oxidize dissolved toxins (Donati, et al., 1994; Hart, Fawell, & Croll, 1998;
Svrcek & Smith, 2004).
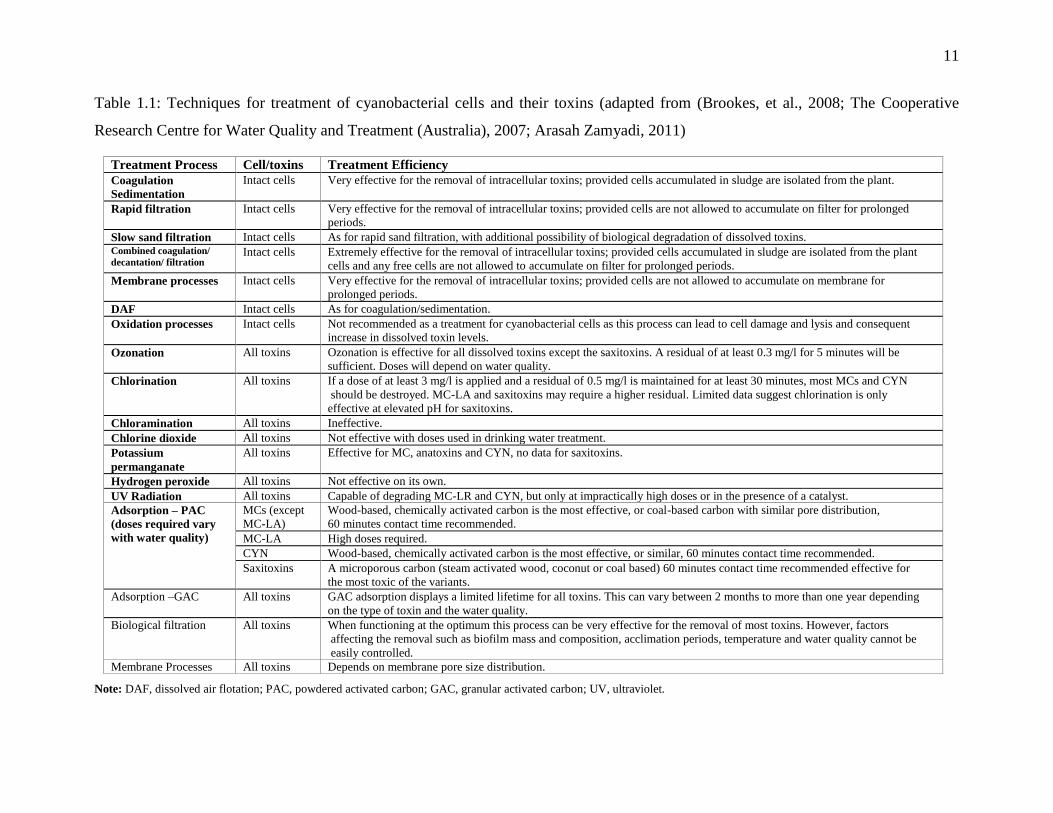
Table 1.1 summarizes the water treatment techniques for cyanobacteria and their toxins.
11
Table 1.1: Techniques for treatment of cyanobacterial cells and their toxins (adapted from (Brookes, et al., 2008; The Cooperative
Research Centre for Water Quality and Treatment (Australia), 2007; Arasah Zamyadi, 2011)
Treatment Process Cell/toxins Treatment Efficiency
Coagulation
Sedimentation
Intact cells Very effective for the removal of intracellular toxins; provided cells accumulated in sludge are isolated from the plant.
Rapid filtration Intact cells Very effective for the removal of intracellular toxins; provided cells are not allowed to accumulate on filter for prolonged
periods.
Slow sand filtration Intact cells As for rapid sand filtration, with additional possibility of biological degradation of dissolved toxins. Combined coagulation/
decantation/ filtration Intact cells Extremely effective for the removal of intracellular toxins; provided cells accumulated in sludge are isolated from the plant
cells and any free cells are not allowed to accumulate on filter for prolonged periods.
Membrane processes Intact cells Very effective for the removal of intracellular toxins; provided cells are not allowed to accumulate on membrane for
prolonged periods.
DAF Intact cells As for coagulation/sedimentation.
Oxidation processes Intact cells Not recommended as a treatment for cyanobacterial cells as this process can lead to cell damage and lysis and consequent
increase in dissolved toxin levels.
Ozonation All toxins Ozonation is effective for all dissolved toxins except the saxitoxins. A residual of at least 0.3 mg/l for 5 minutes will be
sufficient. Doses will depend on water quality.
Chlorination All toxins If a dose of at least 3 mg/l is applied and a residual of 0.5 mg/l is maintained for at least 30 minutes, most MCs and CYN
should be destroyed. MC-LA and saxitoxins may require a higher residual. Limited data suggest chlorination is only
effective at elevated pH for saxitoxins.
Chloramination All toxins Ineffective.
Chlorine dioxide All toxins Not effective with doses used in drinking water treatment.
Potassium
permanganate
All toxins Effective for MC, anatoxins and CYN, no data for saxitoxins.
Hydrogen peroxide All toxins Not effective on its own.
UV Radiation All toxins Capable of degrading MC-LR and CYN, but only at impractically high doses or in the presence of a catalyst.
Adsorption – PAC
(doses required vary
with water quality)
MCs (except
MC-LA)
Wood-based, chemically activated carbon is the most effective, or coal-based carbon with similar pore distribution,
60 minutes contact time recommended.
MC-LA High doses required.
CYN Wood-based, chemically activated carbon is the most effective, or similar, 60 minutes contact time recommended.
Saxitoxins A microporous carbon (steam activated wood, coconut or coal based) 60 minutes contact time recommended effective for
the most toxic of the variants.
Adsorption –GAC All toxins GAC adsorption displays a limited lifetime for all toxins. This can vary between 2 months to more than one year depending
on the type of toxin and the water quality.
Biological filtration All toxins When functioning at the optimum this process can be very effective for the removal of most toxins. However, factors
affecting the removal such as biofilm mass and composition, acclimation periods, temperature and water quality cannot be
easily controlled.
Membrane Processes All toxins Depends on membrane pore size distribution.
Note: DAF, dissolved air flotation; PAC, powdered activated carbon; GAC, granular activated carbon; UV, ultraviolet.

12
1.5.1 Conventional treatment
Conventional treatment for the removal of cyanobacteria and cyanotoxins consist of coagulation,
flocculation, separation (sedimentation/flotation), and filtration processes (Svrcek & Smith,
2004). Many studies have reported that the application of conventional treatment is effective for
the removal of cyanobacterial cells but ineffective for the removal of dissolved cyanotoxins
(Chorus & Bartram, 1999; Chow, et al., 1999; Himberg, Keijola, Hiisvirta, Pyysalo, & Sivonen,
1989; Svrcek & Smith, 2004).
The specific performances of unit process of conventional treatment are shown in Appendix 3.
1.5.2 Chemical oxidation / Chlorination
Chemical oxidation processes in drinking water treatment can control colour and odour, reduce
COD/BOD, remove both organic and oxdisable inorganic components, enhance
coagulation/flocculation and iron or manganese oxidation (Chorus & Bartram, 1999). Many
studies have reported that chemical oxidation is an effective method and a safe barrier against
cyanobacteria and their toxins in order to decrease public health risk (Miao & Tao, 2009; E.
Rodriguez, Majado, Meriluoto, & Acero, 2007). The oxidants investigated most commonly for
cyanobacteria and cyanotoxin treatment are chlorine, chlorine dioxide, chloramine, ozone, and
potassium permanganate (E. Rodriguez, Majado, et al., 2007). Meanwhile, the removal effects of
these oxidants could be examined in post-oxidation and also in pre-oxidation (before cell
removal).
High concentration cyanobacteria blooms in drinking water sources can cause serious problems
in various stages of conventional water treatment, including poor coagulation/flocculation and
separation, filter clogging, increased disinfectants demand, and unpleasant odors and tastes (Yun,
Lim, Cho, & Park, 1997). Pre-oxidation is used for untreated water to reduce the biological
growth of cyanobacteria in treatment plant and improve coagulation/flocculation and filtration
processes (Chorus & Bartram, 1999; Petrusevski, van Breeman, & Alaerts, 1995). Nevertheless,
it may also cause cell death or lysis to release toxins and odour/taste compounds. Therefore, in
the presence of cyanobacteria cells, the dosage of oxidant in pre-treatment should be sufficient to
meet the demand of the water including cells, and a residual required for oxidize both cell-bound

13
and dissolved toxins to non toxic materials (Chorus & Bartram, 1999; Miao & Tao, 2009;
Newcombe, et al., 2010).
Chlorination
Chlorine is the chemical oxidant most frequently used for disinfection in water treatment in North
America (Svrcek & Smith, 2004). The most reactive form of chlorine is hypochlorous acid
(HOCl) which is in equilibrium with hypochlorite ion (OCl-) in solution. The chemical equation
is given below:
HOCl <=> H+ + OCl
-
The concentration of hypochlorous acid is dependent on the pH of water (Newcombe, et al.,
2010). Table 1.2 shows the relative concentrations of the two major forms of chlorine over a
moderate range of pH.
Table 1.2: Ratio of HOCl to OCl- and concentrations of the species at different pH. Initial
concentration 5.4 mg/L as Cl2 (from (Newcombe, et al., 2010))
pH 6.0 6.5 7.0 7.5 8.0 8.5 9.0 HOCl : OCl
- 32 :1 10 :1 3.2 :1 1 :1 0.32 :1 0.1 :1 0.03 :1 HOCl (mg/L) 3.9 3.6 2.9 2.0 1.1 0.4 0.1 OCl
-(mg/L) 0.1 0.4 1.1 2.0 2.9 3.6 3.9
Early studies reported that chlorine was ineffective to destroy the microcystins, even at a
substantial dosage of 5 mg/L (Himberg, et al., 1989). In these studies, chlorine may have been
consumed by organic matter reported to be present, leaving no chlorine residual for the removal
of microcystins; or chlorination may have carried out at a pH of relative low concentration of
hypochlorous acid (Chorus & Bartram, 1999). Contrarily, some other studies demonstrated that
chlorine has a potential capacity to remove cyanobacteria cells and some cyanotoxins under
proper treatment conditions (Acero, Rodriguez, & Meriluoto, 2005; B. C. Nicholson, Rositano, &
Burch, 1994; Tsuji et al., 1997). The post-oxidation during treatment, most often chlorination, is
an essential barrier against dissolved and cell-bound cyanotoxins to prevent cells and toxins
breakthrough (Pietsch, Bornmann, & Schmidt, 2002; A. Zamyadi et al., 2012). Direct
chlorination of raw water or inter-chlorination is still very common in many North American
water treatment plants. As known, there are many concerns regarding the pre-chlorination,
especially in water containing significant cyanobacteria bloom, such as: cell damage and the
14
subsequent release of cell-bound cyanotoxins, increased chlorine demand, dissolved organic
carbon (DOC) release and elevated harmful chlorination by-products (DBP) formation (Merel,
Clément, Mourot, et al., 2010). However, it also may constitute a practical temporary treatment
choice if it is proven to be efficient against both cell-bound and dissolved toxins, while still
acceptable at short term in terms of other water quality parameters. Thus, it is very necessary to
understand the conditions or limitations of post- and pre-chlorination of cyanobacteria cells and
their toxins as used during drinking water treatment plant (DWTP) operation.
A study conducted by Nicholson et al. demonstrated that chlorine could be very effective to
oxidize both microcystin and nodularin if a free chlorine residual of 0.5 mg/L were maintained
after 30 min of contact time with pH value under 8 (B. C. Nicholson, et al., 1994). Other studies
also showed that the efficiency of chlorination with cyanobacteria and their toxins depends on
various experimental conditions (Merel, Clément, Mourot, et al., 2010; Newcombe & Nicholson,
2004; Xagoraraki et al., 2006).
For an efficient chlorination, the key parameters are the concentration of residual chlorine and the
contact time. The appropriate degree of chlorination is estimated using the concept of
concentration multiplied by time, chlorine exposure, or CT (Carrière, et al., 2010). The CT value
is calculated by determining the area under a graph of chlorine concentration versus time (Ho, et
al., 2006). The rates of cell lysis, MCs release, and MCs oxidation can present the degree of cell-
bound and dissolved MCs chlorination under given water quality conditions (Daly, et al., 2007).
The effect of pH on chlorination of cyanotoxins, especially for MCs, was commonly investigated,
and a correlation on destruction efficiency was observed in many researches (Acero, et al., 2005;
B. C. Nicholson, et al., 1994; E. Rodriguez et al., 2007; E. Rodriguez, Sordo, Metcalf, & Acero,
2007; Svrcek & Smith, 2004). The reaction between microcystins and HOCl mainly occurred in
the range of pH 6 to 9; the reduction of toxin removal was examined with increasing pH above 8
because of the decreasing concentration of HOCl (Svrcek & Smith, 2004). Xagoraraki, et al.,
2006 (Xagoraraki, et al., 2006) showed that microcystin-LR inactivation rate constant (k) by free
chlorine was estimated to be the highest at 0.065±0.007 L/ (mg min) at pH 6 and the lowest at
0.005±0.001 L/ (mg min) pH 9 at 11 °C. Acero et al., 2005 (Acero, et al., 2005) also determined
that the apparent second-order rate constant for the chlorination of microcystin-LR varied from
475 M-1
s-1
at pH 4.8 to 9.8 M-1
s-1
at pH 8.8. Therefore, chlorine is very efficient for oxidizing
15
dissolved MCs under various water quality conditions and the degradation of MCs is favoured at
low pHs (Chorus & Bartram, 1999). For other cyanotoxins, cylindrospermopsin (CYN)
degradation via chlorination with a free chlorine residual of 0.5 mg/L within a pH 6 to 9 could
achieve > 99% (Senogles et al., 2000). A study found that the maximum apparent second-order
rate constant for the reactivity of CYN with chlorine was 1265 M-1
s-1
at pH 7 (E. Rodriguez,
Onstad, et al., 2007). Saxitoxins (STX) are not as reactive with chlorine as microcystins
(Newcombe, et al., 2010). A significant removal of STX by chlorine was shown only at high pH
8 to 9; STX degradation augmented from 20% to 98% when pH increased form 4 to 9 with a free
chlorine residual of 0.5 mg/L after 30 min of contact time (Newcombe, et al., 2010; B. C.
Nicholson et al., 2003).
Chlorination was also found to be efficient to oxidize M. aeruginosa cells and subsequently cell-
bound MCs using elevated concentrations of laboratory cultured cells (3×10⁵–1×10
6 cells/mL) in
natural water (Daly, et al., 2007; Merel, Clément, Mourot, et al., 2010). In a recent study of Lin et
al., 2009 (Lin et al., 2009), results of cell integrity of high concentration have shown that
laboratory grown M.aeruginosa in nature water may be more resistant to cell demage by
chlorination than Anabaena circinalis and the small M.aeruginosa colonies from natural blooms
were more resistant than cell suspension of laboratory cultures. Finally, there is very limited
information about the chlorination of the low concentration of dissolved and cell-bound MC-
LReq from a natural bloom.
The predictable rapid cell rupture and subsequent release and oxidation of both dissolved and
cell-bound cyanotoxins can be described by first-order apparent rate constant in most laboratory
testing. A study showed that the rate constants of MCs oxidation calculated from spiked
dissolved toxins in Myponga Reservoir Water are 2 to 24 times higher than those estimated from
the chlorination of released cell-bound toxins from cell suspension (Daly, et al., 2007). More
modest differences (1.2-1.5×) constant rates have been reported using lower cell densities of
Anabaena circinalis for cell bound saxitoxin and of M. aeruginosa for cell-bound MCs (A.
Zamyadi, Ho, Newcombe, Bustamante, & Prévost, 2012; A. Zamyadi et al., 2010). Due to
limited study showing higher cyanobacteria cell resistance and poor oxidation of dissolved toxins
in the presence of cell rupture, the efficiency of the oxidation of released cell-bound toxins from
natural blooms has been more frently concerned (A. Zamyadi, MacLeod, et al., 2012). Besides,
the knowledge of M. aeruginosa cellular chlorine demand which is required for optimal operation
16
of chlorination in DWTP is still undetermined. This information is important to ensure that
sufficient chlorine capacity is present during peak cell concentration events.
The chlorination of drinking water can produce trihalomethanes (THMs) and other chlorinated
by-products. Cyanobacteria cell and their excreted metabolic products may potentially contribute
to the DBP formation (Bond, Henriet, Goslan, Parsons, & Jefferson, 2009; Huang et al., 2009; J.
D. Plummer & Edzwald, 2001). Release of cell-bound compounds due to autolysis of
cyanobacteria cells is classified as extracellular organic matter (EOM) and due to compromised
lysis is categorised as internal organic matter (IOM) (Huang, et al., 2009). Both EOM and IOM
could promote THMs and haloacetic acids (HAAs) production, due to the chlorination of released
compouds (Bond, et al., 2009; Huang, et al., 2009). Some studies have reported the significant
DBP formation (e.g. total THM yields from 67 to 269 µg/L) in connection to reactive carbon
associated with high cell numbers and EOM (Huang, et al., 2009; A. Zamyadi, Ho, et al., 2012).
However, chlorination of approximately 46,000 cells/mL of Anabaena circinalis in natural water
(complete cell damage and below detection limit oxidation of produced saxitoxins) with a CT of
50.3 mg.min/L only increased 9 µg/L of total THM (TTHM) and 3 µg/L of HAA9 compared to
the control assay (chlorination of natural water without cyanobacteria cells)(A. Zamyadi, et al.,
2010).
The DBP formation potentials of IOM and EOM in chlorination depend on the various conditions
especially chlorine doses, growth phase, species and culture conditions (Huang, et al., 2009).

17
CHAPTER 2 MATERIALS AND METHODS
2.1 Materials / Chemicals and Reagents
A toxic strain of M. aeruginosa, isolated from Pretzlaff Pond, Alberta, Canada, was cultured in
the laboratory in artificial seawater medium (ASM-1) according to the method of Gorham,
McLachlan, Hammer, & Kim, 1964 (Gorham, McLachlan, Hammer, & Kim, 1964). Distilled
water (20 L) was fortified with nutrients according to the ASM-1 preparation, sterilized at 120oC,
and then pH adjusted using NaOH 1M solution, inoculated with an ASM-1 grown culture in
stationary phase. The culture was incubated at 26oC under 6 hours rotating light-darkness flux at
light intensity of 70 µmol s-1
m-2
. All chemicals and reagents used were of the purest available
quality to analytical grade in laboratory from various suppliers. Solutions of chlorine, phosphate
buffers, quench solution and analytical reagents were prepared with ultrapure water.
2.2 Water Source
Natural water and ultrapure water were both used for chlorination experiments with the
laboratory cultured M. aeruginosa. The experimental plan also included chlorination of
Missisquoi Bay bloom water samples prior to any treatment (without filtration).
MIR Water: Natural water was sourced from Mille-îles River (MIR) in Laval, Quebec, Canada.
Samples were taken from the inlet of St-Rose drinking water treatment plant (DWTP) in Laval
prior to any treatment on June 26, 2009. Untreated MIR water was filtered over 0.45 µm filters
(HA 14250, Millipore) to remove suspended materials and then stored at 4 o
C. The water had a
dissolved organic carbon (DOC) of 6.3 mg/L as C, N-NH3 of 112.4 µg/L as N, true color of 43
CU (Color Units), and UV absorbance at 254 nm of 0.191 cm-1
, pH of 7.4 and an alkalinity of 19
mg/L as CaCO3. True color and UV were measured on spectrophotometer (Milton Roy 1001
Plus). Before the chlorination experiments, the temperature of filtered MIR water should be
adjusted from 4 oC to 20±2
oC (ambient temperature).
Ultrapure water: Ultrapure Milli-Q water (Millipore Pty Ltd, USA, 18.2 MΩ.cm @25 oC, TOC
of 1 µg/L) was used for selected experiments.
Missisquoi Bay bloom water samples: Environmental cyanobacterial bloom samples were
collected from a bloom event in Missisquoi Bay of Lake Champlain in southern Quebec, in close

18
proximity of the water intake. In this water, the dissolved organic carbon (DOC) was 5.4 mg/L as
C and the ambient pH was 7.8. The samples at cell number of approximately 5.7 × 10⁵ (±4%)
cells/mL incorporated seven different cyanobacteria species dominated by Microcystis sp (A.
Zamyadi, MacLeod, et al., 2012).
Before all DOC analyses, samples were filtered through pre-rinsed (1 L ultrapure water) 0.45 µm
cellulose nitrate Supor®-450 membrane filters (PALL Life Sciences, USA). DOC measurements
were measured using a 5310C total organic carbon analyzer (Sievers Instruments Inc., USA). pH
values were measured using a Fisher Scientific pH meter (Accumet, Fisher Scientific
Instruments, USA) which was calibrated with pH 4, 7 and 10 standard buffers (Fisher, USA).
2.3 Chlorination experiments
In this study, the chlorination experiments were conducted in different series with various
experimental conditions. Table 2.1 shows the summary of various chlorination experiments
conducted in this study. The first set of chlorination experiments (1st to 3
rd Cl2 Exp) were
conducted using cultured M. aeruginosa. The second set of chlorination experiments were
conducted directly on (4th
Cl2 Exp) natural cyanobacteria bloom samples from Missisquoi Bay.
Sous-section additionnelle.
19
Table 2.1: The summary of various chlorination experiments conducted in this study
Experiment
No.
Cyanobacteri
a Source Water Source Water Quality pH
Cl2 Dose
(mg/L)
Cyanobacteria
Concentration
(cells/mL)
Contact Time
(min)
Measurement
Parameters
1st Cl2 Exp
Cultured
M.aeruginosa
in laboratory
Ultrapure water 25 ℃,
TOC -1 µg/L 8
2 60,000 (±2%)
0, 1, 2, 5, 10,
15, 30, 60
Cl2 Residual &
Cl2Demand; DOC;
Extracellular MCs &
Total MCs; Cell lysis
3 250,000 (±4%)
4.5 500,000 (±4%)
2nd Cl2 Exp
MIR water from
inlet of St-Rose
DWTP
After filtration (0.45 µm):
DOC - 6.38 mg/L as C,
N-NH3 -112.4 µg/L as N,
True Color – 43 CU,
UV absorbance (at 254 nm) -
0.191 cm-1,
pH - 7.4,
Alkalinity - 19 mg/L as CaCO3
7
2
50,000 (±2%) 0, 1, 2, 5, 10,
15, 30, 60
Cl2 Residual & Cl2
Demand; DOC;
Extracellular MCs &
Total MCs; Cell lysis
5
10
8.5
2
5
10
3rd Cl2 Exp Ultrapure water 25 ℃,
TOC -1 µg/L 8 5.5 500,000 (±2%) 30, 1440
Cl2 Residual & Cl2
Demand; TTHM &
HAA6
4th Cl2 Exp
Environmental cyanobacterial
bloom samples from Missisquoi
Bay
(Seven cyanobacteria species
dominated by Microcystis sp)
DOC - 5.4 mg/L as C,
pH -7.8
7.8
2
5.7 × 10⁵ (±4%) 0, 1, 2, 5, 10,
15, 30, 60
Cl2 Residual & Cl2
Demand; DOC;
Extracellular MCs &
Total MCs; Cell lysis 5
20
Chlorine stock concentrations and free chlorine residuals were determined using the DPD-FAS
titration method (4500Cl-F. DPD Ferrous Titrimetric Method) described in Standard Methods
(American Public Health Association (APHA), American Water Works Association (AWWA), &
Water Environment Federation (WEF), 2005). Four chlorination experiments were conducted
separately on: (1st Cl2 Exp) M. aeruginosa suspensions in ultrapure water; (2
nd Cl2 Exp) M.
aeruginosa suspensions in MIR water; (3rd
Cl2 Exp) cell-bound M. aeruginosa cellular material
in ultrapure water; and (4th
Cl2 Exp) natural cyanobacteria bloom samples from Missisquoi Bay.
Each chlorination experiment was preceded by a chlorine decay experiment. For chlorine decay
experiments, water samples were dosed with the desired chlorine concentration and triplicate
samples were taken at specified contact times for free chlorine residual mesurements using the
titration method. All chlorination experiments were conducted in triplicate in brown amber
bottles at room temperature (20 ± 2oC).
Cultured M. aeruginosa samples were taken for preservation in Lugol’s iodine solution before the
enumeration of cells using a compound microscope (Nikon, Labophot-2, Phase contrast) in a
Sedgewick-Rafter counting. Required volume of stationary phase culture to be spiked in ultrapure
and MIR water to obtain the desired cell suspension was adjusted based on the culture cell
number. The number of cells in water samples after inoculation was confirmed by microscopic
enumeration. Control (non-chlorinated) water samples showed no sign of cell integrity loss due to
direct addition of cells to ultrapure and MIR water. Detection of cells auto-fluorescence using the
fluorescence microscopy method was used to assess the cells integrity. All chlorination
experiments regardless of water quality parameters were conducted with a chlorine residual after
60 minutes of contact.
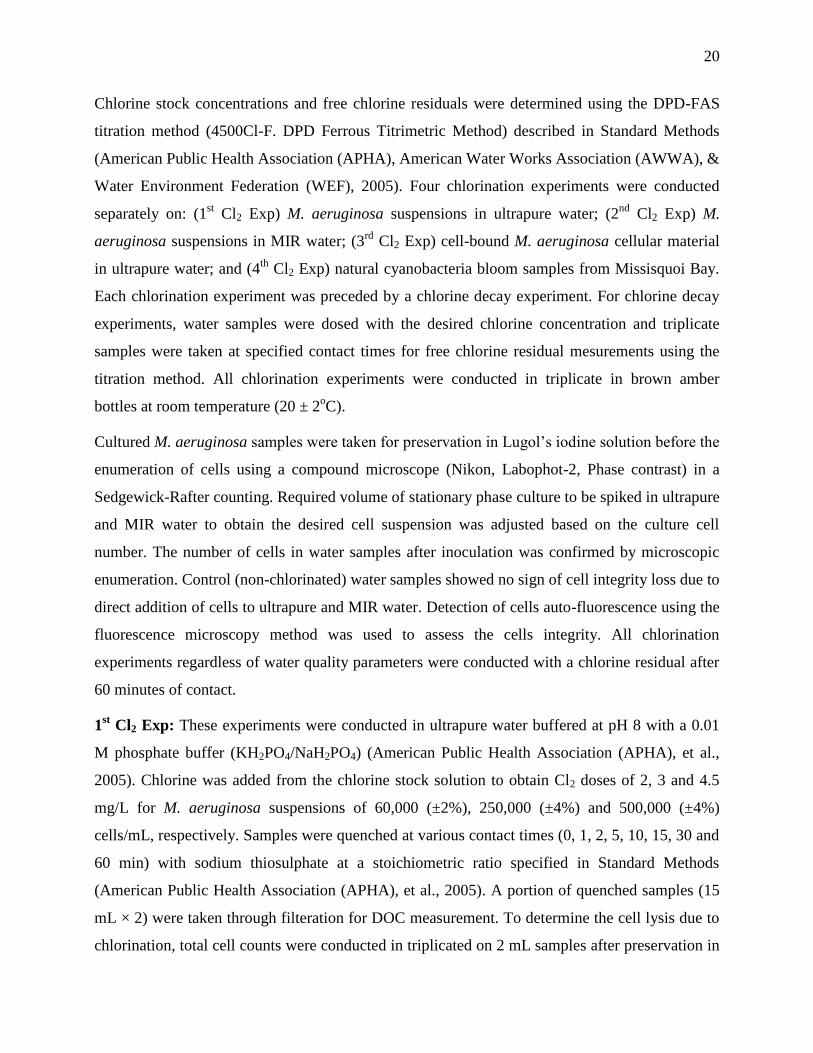
1st Cl2 Exp: These experiments were conducted in ultrapure water buffered at pH 8 with a 0.01
M phosphate buffer (KH2PO4/NaH2PO4) (American Public Health Association (APHA), et al.,
2005). Chlorine was added from the chlorine stock solution to obtain Cl2 doses of 2, 3 and 4.5
mg/L for M. aeruginosa suspensions of 60,000 (±2%), 250,000 (±4%) and 500,000 (±4%)
cells/mL, respectively. Samples were quenched at various contact times (0, 1, 2, 5, 10, 15, 30 and
60 min) with sodium thiosulphate at a stoichiometric ratio specified in Standard Methods
(American Public Health Association (APHA), et al., 2005). A portion of quenched samples (15
mL × 2) were taken through filteration for DOC measurement. To determine the cell lysis due to
chlorination, total cell counts were conducted in triplicated on 2 mL samples after preservation in

21
Lugol’s iodine (Wetzel & Likens, 2000). Remaining quenched water samples were divided into
two subsamples of 250 mL: the first subsample was immediately filtered through 0.45 µm filter
and then analyzed for extracellular MCs; the second subsample was taken to three freeze–thaw
cycles before the filtration to analyze for total MCs (both the cell-bound and extracellular
compounds). For all MCs analysis, confidence limits were calculated using the standard
deviations of triplicate measurements. For all experiments, the extracellular concentrations of
MCs were always within or below the confidence limit of total concentration. The differences
between total and extracellular levels of MCs were estimated as cell-bound.
2nd
Cl2 Exp: These experiments were conducted in buffered MIR water with pH 7 and 8.5.
Chlorine was added from the chlorine stock solution to achieve the Cl2 doses of 2, 5 and 10 mg/L
for M. aeruginosa suspension of 50,000 (±2%) cells/mL. Similar to “1st Cl2 Exp” quenched
samples were taken for DOC, extracellular MCs and total MCs measurements and cell lysis
determination. . Cell densities (50,000 cells/mL corresponding to 0.12 mg/L DOC) were constant
(±2%) and background MIR water DOC varied by less than 10%.
3rd
Cl2 Exp: These experiments were conducted on M. aeruginosa suspension of 500,000 (±2%)
cells/mL in ultrapure water buffered at pH 8. Cultured cells were filtered and re-suspended in
ultrapure water to eliminate the contribution of EOM. No sign of cell integrity loss was observed
due to separation of cells from the culture media (data not shown). The M. aeruginosa suspension
was subjected to three freeze–thaw cycles to release intracellular compounds before chlorination
(McQuaid, et al., 2011). Chlorine was added from the chlorine stock solution to obtain the Cl2
dose of 5.5 mg/L. Residual chlorine concentrations were determined after 30 and 1440 minutes of
contact times and then samples were quenched with sodium thiosulphate. Quenched samples
were taken for DOC and DBP measurements.
4th
Cl2 Exp: These experiments were conducted in Missisquoi Bay bloom water samples with 5.7
× 105 (±4%) cells/mL at ambient pH 7.8. Chlorine was added from the chlorine stock solution to
obtain the Cl2 doses of 2 and 5 mg/L. Similar to “1st Cl2 Exp” quenched samples were taken for
DOC, extracellular toxins and total toxins measurements and cell lysis determination.

22
2.4 Taxonomic counts with species identification
Taxonomic counts with species identification were performed using inverse microscopy (Lund,
Kipling, & Le Cren, 1958; Wetzel & Likens, 2000) by the Centre d’Expertise en Analyse
Environmentale du Québec (CEAEQ) at MDDEP. Temperature, pH, turbidity, as well as the
initial and residual chlorine dosage values were collected from the records of the DWTP for the
time period of concern.
2.5 Analysis of MCs and DBPs
A commercial Abraxis Microcystins ADDA ELISA Plate (an enzyme-linked immunosorbent
assay – Abraxis LLC, Pennsylvania, USA) was used for MCs measurements. The analyses of
MCs concentrations were measured as μg/L of MC-LR equivalent (MC-LR eq.). The detection
limit for this assay is 0.1 µg/L as MC-LR.
DBP analyses were conducted by the laboratory of NSERC Industrial Chair on Drinking Water at
Ecole Polytechnique de Montreal (Canada) using modified United States Environmental
Protection Agency (USEPA) method 501.2 as described by Koch, Crofts, Schimpff, & Davis,
1988 (Koch, Crofts, Schimpff, & Davis, 1988) for THM analysis and USEPA method 552.2 for
HAA. These samples were analyzed for four THMs (bromoform, chloroform,
bromodichloromethane, and dibromochloromethane) as total THM (TTHM) and six HAA
(bromoacetic acid, bromochloroacetic acid, chloroacetic acid, dibromoacetic acid, dichloroacetic
acid, and trichloroacetic acid) as HAA6. They were measured using a Varian CP-3800 Gas
Chromatograph (GC-ZCDs) with an electron capture detector (GC/ECD).
2.6 Data analysis
Chlorine exposure, CT, which is simplified by multiplying the residual concentration of chlorine
by the exposure time as intermediate chlorine concentrations are not known (Equation 1)
(Carrière, et al., 2010). The CT value is calculated by determining the area under a graph of
chlorine concentration versus time (Ho, et al., 2006).
CT = Cl tdtt
0 Equation 1
Where CT equals the chlorine exposure; t equals contact time; [Cl] t equals the chlorine residual
at specified contact time.
23
The first-order rate constans (kCl2) for chlorine decay were determined using Equation 2.
Cl t
Cl 0
= - kCl2t Equation 2
Where Cl t equals the concentration of free chlorine residual at specified contact time t;
Cl 0 equals the concentration of free chlorine at contact time = 0; kCl2 equals the first order
constants for chlorine decay; t equals contact time.
Reactions between chlorine and the M. aeruginosa cells and MCs are of second order, can also be
described as first order to CT (Daly, et al., 2007; Lin, et al., 2009; A. Zamyadi, MacLeod, et al.,
2012). In this study, cell lysis is defined by the reduction of cells resulting from sufficient cell
damage to render undetectable under the microscope in a preserved sample. Equation 3 was used
to calculate the toxin degradation or cell lysis apparent rate constants for these chlorination
experiments (Daly, et al., 2007).
CTkX
XLn CT
0
Equation 3
where CT equals the chlorine exposure; XCT equals the number of lysed cells or MC-LR eq.
concentration after a given chlorine exposure; X0 equals the number of lysed cells or MC-LR eq.
concentration at CT=0; and k equals the rate at which M. aeruginosa cells (klysis) or MC-LR eq
(kappt) oxidation occurs.

24
CHAPTER 3 RESULTS AND DISCUSSION
Results presented in this chapter include results that were included in the publication submitted to
Water Research “Chlorination of Microcystis aeruginosa: Toxin release and oxidation, cellular
chlorine demand and disinfection by-products formation” by authors Arash Zamyadi, Yan Fan,
Rob I. Daly and Michèle Prévost. This publication uses the results produced by this experimental
work. The results of this study are also included in a modelling effect which is not in the fram
work of this thesis. The importance of my contribution is recognized by the fact that I am
positioned as one of the authors. The article which has been accepted for publication in Water
Research is presented in Appendix 4.
Also included in this chapter are results used for the publication Zamyadi et al 2012 (A. Zamyadi,
MacLeod, et al., 2012). My results are specifically presented in the figures 4, 5, 6 and 7 in which
I am a co-author of this publication “Toxic cyanobacterial breakthrough and accumulation in a
drinking water plant: a monitoring and treatment challenge” which is presented in Appendix 5.
25
3.1 Impact of cyanobacterial celluler compounds and water matrix on
chlorine demand
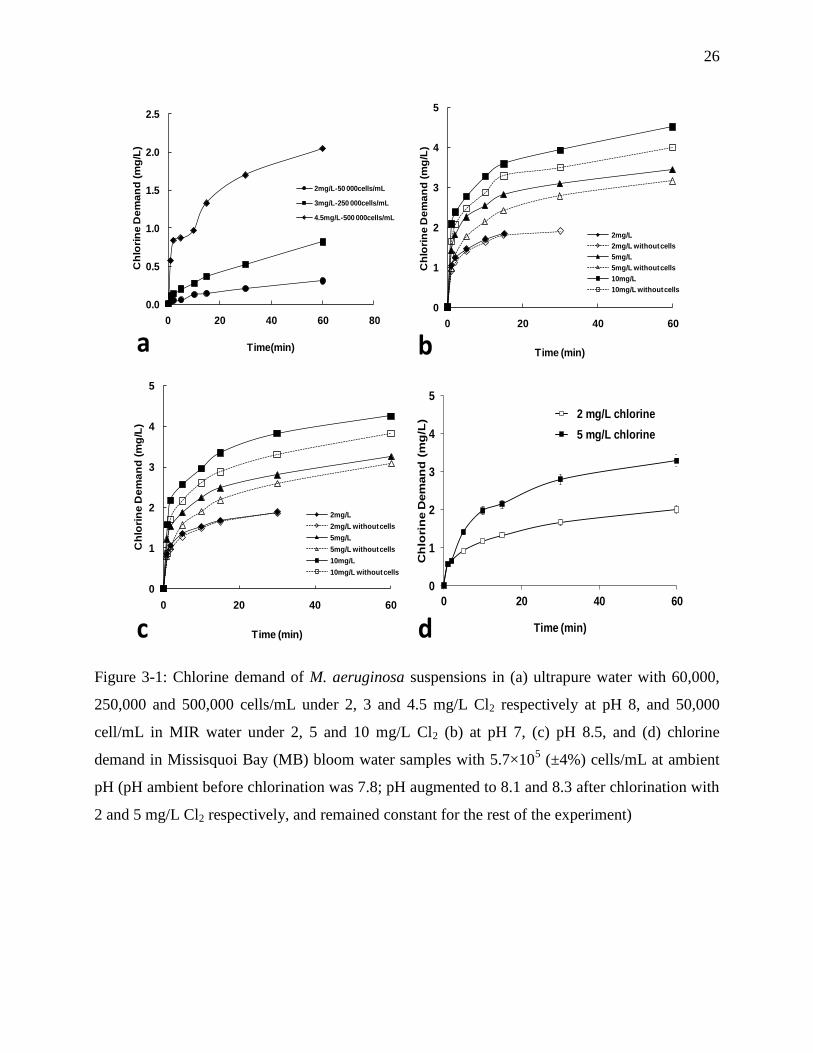
Free chlorine decay and cell lysis experiments were performed: (1) using cultured M. aeruginosa
spiked in ultrapure water (60,000±2%, 250,000±4% and 500,000±4% cells/mL with 2, 3 and 4.5
mg/L of Cl2 at pH 8, respectively) and natural MIR water (50,000±5% cells/mL with 2, 5 and 10
mg/L of Cl2 at both pH 7 and 8.5); (2) using the Missisquoi Bay (MB) bloom water samples
(approximately 5.7×10⁵ (±4%) cells/mL with 2 and 5 mg/L of Cl2 at ambient pH 7.8, pH
augmented to 8.1 and 8.3 after chlorination with 2 and 5 mg/L Cl2 respectively, and remained
constant for the rest of the experiment) (Figure 3-1). Standard deviation of these cell
enumerations (triplicate enumeration/sample) fit within the confidence limit of cell count method
(Hurst, 2007; Laslett, Clark, & Jones, 1997; Lund, et al., 1958). Figure 3-1 presents the results of
chlorine demand by time in these experiments. Chlorine demand in ultrapure water is obviously
related to the M. aeruginosa cell numbers and the chlorine dose (Figure 3-1a). For the
experiments with the same concentration of the M. aeruginosa cells in MIR water, chlorine
demand in the absence of cells is lower than in the presence of cells with similar trends for both
pH 7 and 8.5 (Figures 1b & 1c). In the MB bloom water samples at ambient pH, chlorine demand
is directly related to the chlorine dose (Figure 3-1d). With the low chlorine dose of 2 mg/L, the
MIR water (with and without the M. aeruginosa cells) consumed all chlorine after 30 minutes for
both pH values (Figures 1b & 1c); the same result was observed in MB bloom water samples
after 60 minutes (Figure 3-1d).
26
Figure 3-1: Chlorine demand of M. aeruginosa suspensions in (a) ultrapure water with 60,000,
250,000 and 500,000 cells/mL under 2, 3 and 4.5 mg/L Cl2 respectively at pH 8, and 50,000
cell/mL in MIR water under 2, 5 and 10 mg/L Cl2 (b) at pH 7, (c) pH 8.5, and (d) chlorine
demand in Missisquoi Bay (MB) bloom water samples with 5.7×10⁵ (±4%) cells/mL at ambient
pH (pH ambient before chlorination was 7.8; pH augmented to 8.1 and 8.3 after chlorination with
2 and 5 mg/L Cl2 respectively, and remained constant for the rest of the experiment)
0.0
0.5
1.0
1.5
2.0
2.5
0 20 40 60 80
Ch
lori
ne
De
ma
nd
(m
g/L
)
Time(min)
2mg/L-50 000cells/mL
3mg/L-250 000cells/mL
4.5mg/L-500 000cells/mL
0
1
2
3
4
5
0 20 40 60
Ch
lori
ne
De
ma
nd
(m
g/L
)
Time (min)
2mg/L
2mg/L without cells
5mg/L
5mg/L without cells
10mg/L
10mg/L without cells
0
1
2
3
4
5
0 20 40 60
Ch
lori
ne
De
ma
nd
(m
g/L
)
Time (min)
2mg/L
2mg/L without cells
5mg/L
5mg/L without cells
10mg/L
10mg/L without cells
a b
c
0
1
2
3
4
5
0 20 40 60
Ch
lori
ne D
em
an
d (
mg
/L)
Time (min)
2 mg/L chlorine
5 mg/L chlorine
d

27
Chlorine exposure (CT) value is the area under a plot of chlorine residual v.s. time, and describes
the amount of free chlorine to which the solution has been exposed (Newcombe, et al., 2010).
Chlorine decay data were used to calculate the CT values by fitting a two pathway integration
model to a two phase decay curve: fast (< 1min) and slow route (Daly, et al., 2007; Sohn, Amy,
Cho, Lee, & Yoon, 2004; A. Zamyadi, et al., 2010). The instant chlorine consumption observed
within the first minute is described as the fast route; while the slow route represents the slower
chlorine decay observed during the remaining chlorination. As shown in Figure 3-1, the free
chlorine residual at 1minute showed almost a liner relationship to the initial free chlorine during
the fast route.
Table 3.1 presents the resulting first order rate constants for chlorine decay. The slow apparent
rate constants (kCl2) in ultrapure water without cells are very stable with all chlorine doses at pH 8
(Table 3.1). The addition of cyanobacteria cells to the ultrapure water raises the apparent rate
constant values (Table 3.1). The kCl2 values also augment with increasing cell numbers and
chlorine doses. Besides, greater cell numbers were associated with higher DOC release (See
section 3.4) coherent with the observed faster chlorine decay. In natural MIR water the apparent
rate constants are very similar at the pH 7 and 8.5 but increase with the addition of cells and
higher chlorine doses (Table 3.1). In MB bloom water samples, the first order rate constants for 2
and 5 mg/L of chlorine decay are 1.1×10⁻³
(r2
= 0.92) and 1.0×10⁻³
(r2
= 0.97), respectively.
Table 3.1: First-order apparent rate constants (kCl2) in s-1
for chlorine decay. All correlation
coefficients (R2) exceeded 0.85
Type of
water
Cell nb.
(Cells/mL)
2 mg/L Cl2 3 mg/L Cl2 4.5 mg/L Cl2
pH 8 pH 8 pH 8
Ultrapure
No cells 1.7 × 10⁻⁵
1.6 × 10⁻⁵
1.7 × 10⁻⁵
60,000 6.4 × 10⁻⁵
- -
250,000 - 9.7 × 10⁻⁵
-
500,000 - - 1.5 × 10⁻⁴
Cell nb.
(Cells/mL)
2 mg/L Cl2 5 mg/L Cl2 10 mg/L Cl2
pH 7 pH 8.5 pH 7 pH 8.5 pH 7 pH 8.5
MIR
No cells 8.4 × 10⁻⁵
8.1 × 10⁻⁵
1.8 × 10⁻⁴
1.8 × 10⁻⁴
1.1 × 10
-
3
1.1 × 10-
3
50,000 8.4 × 10⁻⁵
8.2 × 10⁻⁵
1.9 × 10⁻⁴
1.9 × 10⁻⁴
1.9 × 10
-
3
1.9 × 10-
3
Cell nb.
(Cells/mL)
2 mg/L Cl2 5 mg/L Cl2
pH 8.1 pH 8.3
MB 5.7×10⁵ 1.1×10
-3 1.0×10
-3
28
3.2 Chlorination effect on cells lysis and estimation of chlorine demand per
cell
In 1st Cl2 Exp, the result of three M. aeruginosa cell suspensions of 60,000 (±2%), 250,000 (±4%)
and 500,000 (±4%) cells/mL in ultrapure water buffered at pH 8 and chlorinated respectively at 2,
3 and 4.5 mg/L were evaluated (Figure 3-2). Figure 3-2a shows that chlorination in ultrapure
water spiked with the lowest cell number (60,000±2% cells/mL) caused 60% of cell lysis after 30
minutes of contact (CT = 51 mg.min/L). Figure 3-2b reveals that chlorination in ultrapure water
spiked with 250,000±4% cells/mL caused 57% of cell lysis after 60 minutes (CT = 107
mg.min/L). Figure 3-2c demonstrates that chlorination in ultrapure water spiked with highest cell
number (500,000±4% cells/mL) caused 76% of cell lysis after 60 minutes (CT = 130 mg.min/L).
Additionally, the response of the M. aeruginosa cell suspensions of 50,000±5% cells/mL in MIR
water at pH 7 and 8.5 to 2, 5 and 10 mg/L of Cl2 was studied in 2nd
Cl2 Exp (Figure 3-3). The
chlorination with the lowest chlorine dose of 2 mg/L caused 39% of cell lysis after 30 minutes
(CT = 8.7 mg.min/L) at pH 7 and 40% of cell lysis after 30 minutes (CT = 13 mg.min/L) at pH
8.5. The chlorination with the higher chlorine dose of 5 mg/L caused 66% of cell lysis after 60
minutes (CT = 98 mg.min/L) at pH 7 and 67% of cell lysis after 60 minutes (CT = 111
mg.min/L) at pH 8.5. The chlorination with the highest chlorine dose of 10 mg/L caused 74% of
cell lysis after 60 minutes (CT = 287 mg.min/L) at pH 7 and 75% of cell lysis after 60 minutes
(CT = 296 mg.min/L) at pH 8.5. The results of cell lysis are very similar at pH 7 and pH 8.5 in
MIR water.
Compared with Figure 3-2c in ultrapure water, Figure 3-3e and f showed that similar levels of
cell lysis (~75%) were achieved with the same or higher CT values in MIR water. In a study of
chlorination of 46,000 cell/mL of Anabaena circinalis suspension, the reduction in total cell
numbers with a CT of ~50 mg.min/L was only around 15% (A. Zamyadi, et al., 2010). However,
they also reported that over 98% of cells (even detectable under microscope in preserved
samples) could be categorized as injured/dead cells (damaged membrane or metabolically
inactive cells) at a CT < 7 mg.min/L. It is important to consider that cell lysis, here defined as
corresponding to the loss of detectable stained cell structures, is a less conservative indicator of
loss of viability as it occurs at the last step of cell decay.

29
Figure 3-2: Reduction in number of cells (cell lysis) during chlorination of M. aeruginosa
suspensions of (a) 60,000 cells/mL with 2 mg/L Cl2, (b) 250,000 cells/mL with 3 mg/L Cl2, and
(c) 500,000 cells/mL with 4.5 mg/L Cl2, in ultrapure water at pH 8
0
10
20
30
40
50
60
70
80
90
100
0.00 27.30
%
CT (mg.min/L)
0
10
20
30
40
50
60
70
80
90
100
0.00 40.37
%
CT (mg.min/L)
0
10
20
30
40
50
60
70
80
90
100
0.00 53.40
%
CT (mg.min/L)
a
b
0.0 4.2 7.9 18.5 35.7 51.6 93.7 130.3
c
0.0 2.9 5.7 13.9 26.9 39.5 75.3 107.3
0.0 1.9 3.8 9.4 18.2 26.7 51.4
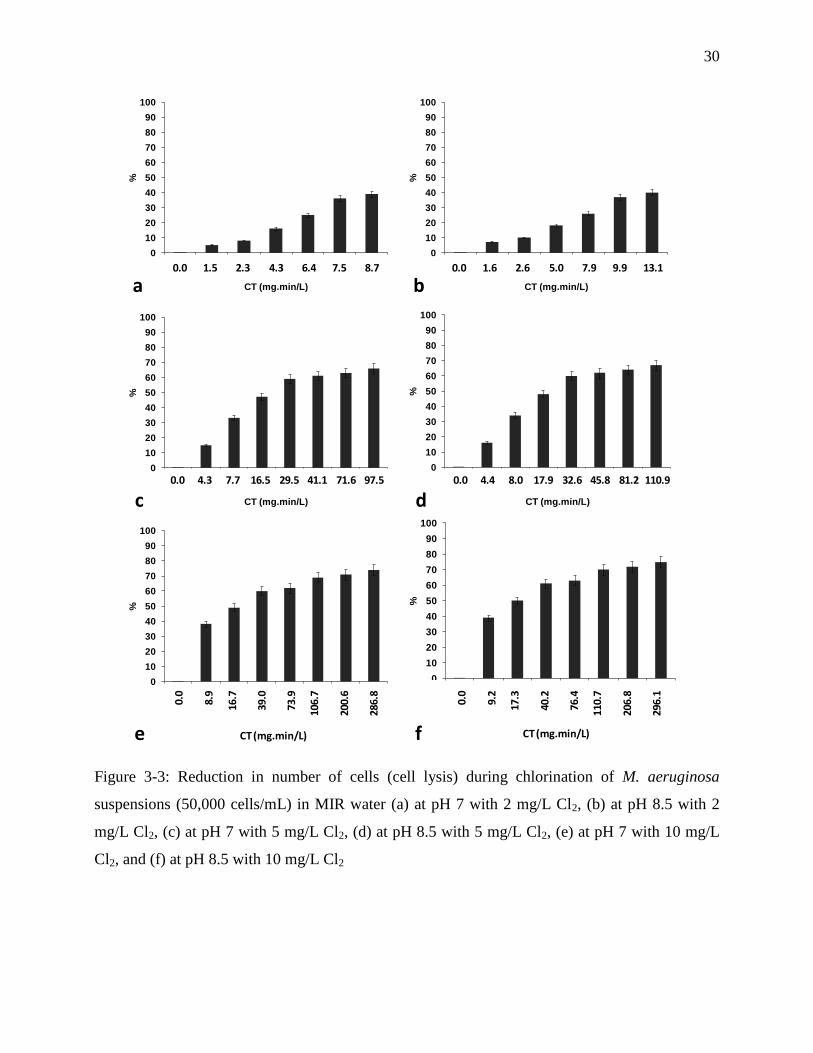
30
Figure 3-3: Reduction in number of cells (cell lysis) during chlorination of M. aeruginosa
suspensions (50,000 cells/mL) in MIR water (a) at pH 7 with 2 mg/L Cl2, (b) at pH 8.5 with 2
mg/L Cl2, (c) at pH 7 with 5 mg/L Cl2, (d) at pH 8.5 with 5 mg/L Cl2, (e) at pH 7 with 10 mg/L
Cl2, and (f) at pH 8.5 with 10 mg/L Cl2
0
10
20
30
40
50
60
70
80
90
100
0.00 111.81
%
CT (mg.min/L)
0
10
20
30
40
50
60
70
80
90
100
0.00 107.68
%
CT (mg.min/L)
0
10
20
30
40
50
60
70
80
90
100
0.00 47.15
%
CT (mg.min/L)
0
10
20
30
40
50
60
70
80
90
100
0.00 42.59
%
CT (mg.min/L)
0
10
20
30
40
50
60
70
80
90
100
0.00 10.12
%
CT (mg.min/L)
0
10
20
30
40
50
60
70
80
90
100
0.00 7.69
%
CT (mg.min/L)a b0.0 1.5 2.3 4.3 6.4 7.5 8.7 0.0 1.6 2.6 5.0 7.9 9.9 13.1
c d0.0 4.3 7.7 16.5 29.5 41.1 71.6 97.5 0.0 4.4 8.0 17.9 32.6 45.8 81.2 110.9
e f
0.0
8.9
16.7
39.0
73.9
106.
7
200.
6
286.
8
0.0
9.2
17.3
40.2
76.4
110.
7
206.
8
296.
1
CT (mg.min/L) CT (mg.min/L)

31
The assumption of a first-order reaction with respect to chlorine reaction and the M. aeruginosa
cells lysis is valid (Daly, et al., 2007; Lin, et al., 2009). Hence, the reaction between chlorine and
the cells is of second-order and the constant rate at which cell lysis occurs (klysis) can be evaluated
using Equation 3. The klysis calculated for chlorination of M. aeruginosa cells are presented in
Table 3.2. These klysis values were similar in both experiments conducted in ultrapure and natural
MIR water.
The klysis values in MIR water are close to chlorination lysis rates estimated for laboratory
cultures of M. aeruginosa (A. Zamyadi, Ho, et al., 2012) (Table 3.2). In other studies, the rates of
cell membrane damage, also referred to as the loss of cell integrity after chlorination (krelease) are
estimated using cell integrity tests. krelease represents the release of cell bound material even if the
cells are still present in water and is not for directly compare with klysis in this study. krelease from
cultured cells in chlorination assays have been found to be higher compared to those measured
for cells from natural blooms (Lin, et al., 2009; A. Zamyadi, Ho, et al., 2012). In other cases,
krelease values for cultured cells fall within the range of klysis values estimated in this work. Many
factors, such as the physiological state of the cyanobacterial cells, the cell densities, the water
matrices and the chlorination conditions, could cause different response in susceptibility during
chlorination (Lin, et al., 2009; Pietsch, et al., 2002).
M. aeruginosa cellular chlorine demand per cell was calculated from the lysis of M. aeruginosa
suspensions in ultrapure water in the presence of chlorine residual (Figure 3-1a) (Figure 3-2). The
cumulative chlorine demand after 60 minutes of contact per number of lysed cells is almost a
constant value of 5.6±0.2 pgCl2/cell for the three experiments conducted in buffered ultrapure
water. This novel information about the value of unit cellular chlorine demand should be very
useful and practical for DWTP operators. It can help to estimate if the chlorination capacity is
sufficient to satisfy the total chlorine demand associated with the presence of cyanobacteria.

32
Table 3.2: Apparent rate constants for cell lysis or reduction in total cell count (klysis - M-1
s-1
), for loss of cell integrity or cell rupture
(krelease - M-1
s-1
), for total toxins oxidation (ktotal - M-1
s-1
) and for the oxidation of dissolved toxins released from damaged cells (kdissolved
- M-1
s-1
) derived from this study compared to published results. Comments in parenthesis describe the origin of the CB cells (from
laboratory cultures or environmental bloom samples) and the toxins (from standard extracts or cell-bound) (* MC-LR equivalent)
This study Published studies
60,0
00
cel
ls/m
L,
Ult
rapu
re w
ater
,
2 m
g/L
Cl 2
, p
H 8
250
,00
0 c
ells
/mL
, U
ltra
pu
re w
ater
,
3 m
g/L
Cl 2
, p
H 8
500
,00
0 c
ells
/mL
, U
ltra
pu
re w
ater
,
4.5
mg
/L C
l 2, p
H 8
50,0
00
cel
ls/m
L, M
IR w
ater
,
2 m
g/L
Cl 2
, p
H 7
50,0
00
cel
ls/m
L, M
IR w
ater
,
2 m
g/L
Cl 2
, p
H 8
.5
50,0
00
cel
ls/m
L, M
IR w
ater
,
5 m
g/L
Cl 2
, p
H 7
50,0
00
cel
ls/m
L, M
IR w
ater
,
5 m
g/L
Cl 2
, p
H 8
.5
50,0
00
cel
ls/m
L, M
IR w
ater
,
10 m
g/L
Cl 2
, p
H 7
50,0
00
cel
ls/m
L, M
IR w
ater
,
10 m
g/L
Cl 2
, p
H 8
.5
5.7
×1
05 c
ells
/mL
, M
B b
loo
m s
ample
,
2 &
5 m
g/L
Cl 2
, p
H 8
.3
(Ace
ro, et
al.
, 200
5).
pH
7.9
-8
(Ho
, et
al.
, 2
006
). p
H 7
.9
(E.
Rod
rig
uez
, O
nst
ad, et
al.
, 200
7).
pH
8
(Dal
y,
et a
l., 2
007
).p
H 6
.8-7
.6
(Lin
, et
al.
, 2
009
),p
H 8
.3-8
.6
(Din
g,
Sh
i, T
imm
on
s, &
Ad
ams,
2010
).201
0.p
H 7
.6
(A.
Zam
yad
i, H
o, et
al.
, 20
12
).p
H 8
M. aeruginosa
klysis (M-1s-1)
27.9 17.9 11.6 234.1 170.2 73.1 33.3 30.6 11.5 3.8-16
bloom - - - - - -
37
(culture)
M. aeruginosa
krelease (M-1s-1)
- - - - - - - - - - - - - 670±77
790-1100
(culture),
70-590 (bloom)
43.6
(culture)
756-1030
(culture)
ktotal MC-LR 33.5
*
49.6
*
88.7
* - - - - - -
2.1-
17.9* bloom
- - -
10-96
(cell- bound)
- -
21-23.3
(cell- bound)
kdissolved MC-LR - - 20.2
* - - - - - - -
33.1-
38.0 110-170 33 242 - 55.9 -
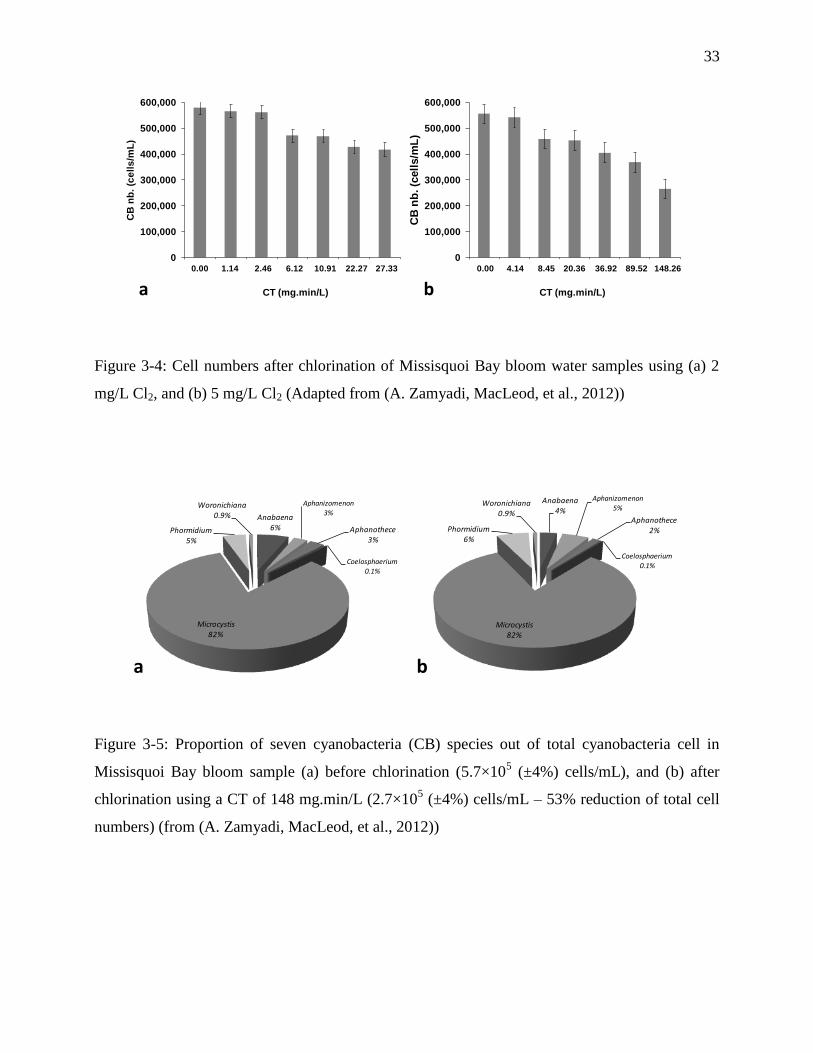
33
Figure 3-4: Cell numbers after chlorination of Missisquoi Bay bloom water samples using (a) 2
mg/L Cl2, and (b) 5 mg/L Cl2 (Adapted from (A. Zamyadi, MacLeod, et al., 2012))
Figure 3-5: Proportion of seven cyanobacteria (CB) species out of total cyanobacteria cell in
Missisquoi Bay bloom sample (a) before chlorination (5.7×10⁵ (±4%) cells/mL), and (b) after
chlorination using a CT of 148 mg.min/L (2.7×10⁵ (±4%) cells/mL – 53% reduction of total cell
numbers) (from (A. Zamyadi, MacLeod, et al., 2012))
0
100,000
200,000
300,000
400,000
500,000
600,000
0 22.27
CB
nb
. (c
ell
s/m
L)
CT (mg.min/L)
0
100,000
200,000
300,000
400,000
500,000
600,000
0 89.52
CB
nb
. (c
ell
s/m
L)
CT (mg.min/L)
0.00 4.14 8.45 20.36 36.92 89.52 148.260.00 1.14 2.46 6.12 10.91 22.27 27.33
a b
Anabaena4%
Aphanizomenon5%
Aphanothece2%
Coelosphaerium
0.1%
Microcystis82%
Phormidium6%
Woronichiana0.9%Anabaena
6%
Aphanizomenon
3%
Aphanothece3%
Coelosphaerium0.1%
Microcystis82%
Phormidium5%
Woronichiana0.9%
a b
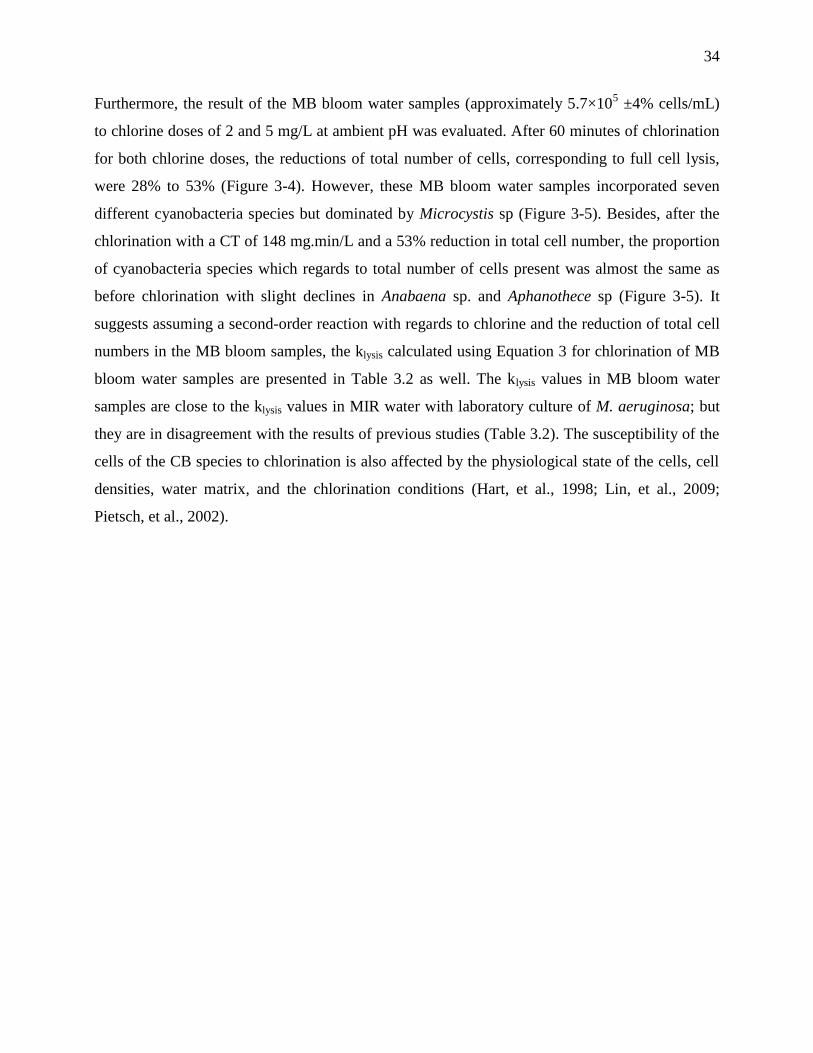
34
Furthermore, the result of the MB bloom water samples (approximately 5.7×10⁵ ±4% cells/mL)
to chlorine doses of 2 and 5 mg/L at ambient pH was evaluated. After 60 minutes of chlorination
for both chlorine doses, the reductions of total number of cells, corresponding to full cell lysis,
were 28% to 53% (Figure 3-4). However, these MB bloom water samples incorporated seven
different cyanobacteria species but dominated by Microcystis sp (Figure 3-5). Besides, after the
chlorination with a CT of 148 mg.min/L and a 53% reduction in total cell number, the proportion
of cyanobacteria species which regards to total number of cells present was almost the same as
before chlorination with slight declines in Anabaena sp. and Aphanothece sp (Figure 3-5). It
suggests assuming a second-order reaction with regards to chlorine and the reduction of total cell
numbers in the MB bloom samples, the klysis calculated using Equation 3 for chlorination of MB
bloom water samples are presented in Table 3.2 as well. The klysis values in MB bloom water
samples are close to the klysis values in MIR water with laboratory culture of M. aeruginosa; but
they are in disagreement with the results of previous studies (Table 3.2). The susceptibility of the
cells of the CB species to chlorination is also affected by the physiological state of the cells, cell
densities, water matrix, and the chlorination conditions (Hart, et al., 1998; Lin, et al., 2009;
Pietsch, et al., 2002).

35
3.3 Impact of chlorination on release and oxidation on cell-bound
cyanotoxins
In previous studies (Daly, et al., 2007; Lin, et al., 2009; A. Zamyadi, et al., 2010), fast release of
cell-bound compounds, especially cell-bound toxins, have been observed when pre-chlorinating
(with low chlorine doses as 1-5 mg/L Cl2) natural water loaded with Anabaena sp. and
Microcystis sp. In this study, Figure 3-6 presents the release and oxidation of cell-bound MCs
(MC-LR eq.) in buffered ultrapure water at pH 8 for the M. aeruginosa suspensions of 60,000
(±2%), 250,000 (±4%) and 500,000 (±4%) cells/mL. There is a strong relationship between
chlorine exposure and the total toxins degradation, and also with a quick release of cell-bound
toxins in Figure 3-6b and Figure 3-6c. With a CT value of 100 mg.min/L, Figure 3-6 presents a
complete toxin release and reduction below the WHO guideline value (1 µg/L MC-LR for
drinking water) oxidation of the toxins. The observed toxins release and oxidation (Figure 3-6)
agree well with cell lysis (Figure 3-2).
Furthermore, Figure 3-7 shows the toxins release and oxidation after chlorination of MB bloom
water samples (approximately 5.7×10⁵ ±4% cells/) using 2 and 5 mg/L Cl2. The cell-bound toxins
are still observed and are much higher than the WHO guideline value even after the highest CT
value of 148 mg.min/L. DOC variations before and after chlorination were <0.2 mg/L C.

36
Figure 3-6: Toxins release and oxidation from M. aeruginosa suspensions in ultrapure water at
pH 8 with cell number and chlorine doses of (a) 60,000 cells/mL and 2 mg/L Cl2, (b) 250,000
cell/mL and 3 mg/L Cl2, and (c) 500,000 cells/mL and 4.5 mg/L Cl2, respectively
0
1
2
3
0 20 40 60 80
MC
-LR
eq
. (µ
g/L
)
CT ( mg.min/L )
Total MC-LR eq.
Dissolved MC-LR eq.
0
5
10
15
0 20 40 60 80 100 120
MC
-LR
eq
. (µ
g/L
)
CT ( mg.min/L )
0
10
20
30
40
50
60
70
0 50 100 150
MC
-LR
eq
. (µ
g/L
)
CT ( mg.min/L )
a
b
c
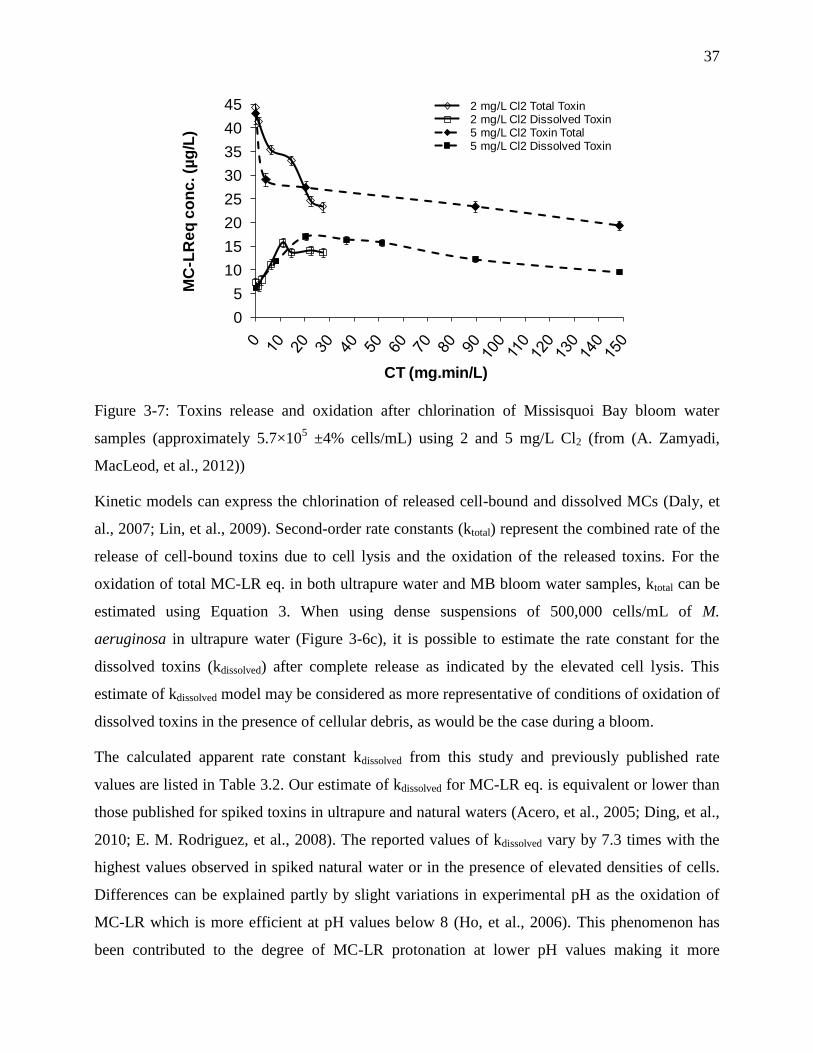
37
Figure 3-7: Toxins release and oxidation after chlorination of Missisquoi Bay bloom water
samples (approximately 5.7×10⁵ ±4% cells/mL) using 2 and 5 mg/L Cl2 (from (A. Zamyadi,
MacLeod, et al., 2012))
Kinetic models can express the chlorination of released cell-bound and dissolved MCs (Daly, et
al., 2007; Lin, et al., 2009). Second-order rate constants (ktotal) represent the combined rate of the
release of cell-bound toxins due to cell lysis and the oxidation of the released toxins. For the
oxidation of total MC-LR eq. in both ultrapure water and MB bloom water samples, ktotal can be
estimated using Equation 3. When using dense suspensions of 500,000 cells/mL of M.
aeruginosa in ultrapure water (Figure 3-6c), it is possible to estimate the rate constant for the
dissolved toxins (kdissolved) after complete release as indicated by the elevated cell lysis. This
estimate of kdissolved model may be considered as more representative of conditions of oxidation of
dissolved toxins in the presence of cellular debris, as would be the case during a bloom.
The calculated apparent rate constant kdissolved from this study and previously published rate
values are listed in Table 3.2. Our estimate of kdissolved for MC-LR eq. is equivalent or lower than
those published for spiked toxins in ultrapure and natural waters (Acero, et al., 2005; Ding, et al.,
2010; E. M. Rodriguez, et al., 2008). The reported values of kdissolved vary by 7.3 times with the
highest values observed in spiked natural water or in the presence of elevated densities of cells.
Differences can be explained partly by slight variations in experimental pH as the oxidation of
MC-LR which is more efficient at pH values below 8 (Ho, et al., 2006). This phenomenon has
been contributed to the degree of MC-LR protonation at lower pH values making it more
0
5
10
15
20
25
30
35
40
45
MC
-LR
eq
co
nc
. (µ
g/L
)
CT (mg.min/L)
2 mg/L Cl2 Total Toxin2 mg/L Cl2 Dissolved Toxin5 mg/L Cl2 Toxin Total5 mg/L Cl2 Dissolved Toxin

38
susceptible to chlorination (Ho, et al., 2006). The impact of NOM can also be significant because
of organic matter-MC interactions or the action of highly reactive quaternary chloramines on OM
moieties (Ho, et al., 2006).
Our observations support previous observations of rapid oxidation of cell-bound toxins upon
released from damaged or lysed cells. In most cases, chlorination causes a fast release of cell-
bound toxins as shown by the krelease values. Overall, the oxidation of toxins, whether (ktotal) or
dissolved (kdissolved) occurs somewhat more quickly than cell lysis (klysis), suggesting that released
cell-bound toxins react faster with chlorine the damaged cells and debris. In some cases, the
differences are notable, while in others insignificant. However, larger differences have been
reported for MC-LW, MC-LF, MC-RR, MC-YR and MC-LA chlorination rates (3320, 204, 136,
94 and 89.5 M-1
s-1
respectively) as compared to cell inactivation rate (43.6 M-1
s-1
) (Ding, et al.,
2010). Greater differences are expected when comparing toxin oxidation rates with cell lysis
rates, as cell lysis is a more conservative indicator than gradual cell membrane damage and loss
of cell viability as previously observed by A. Zamyadi et al., 2010. (A. Zamyadi, et al., 2010).
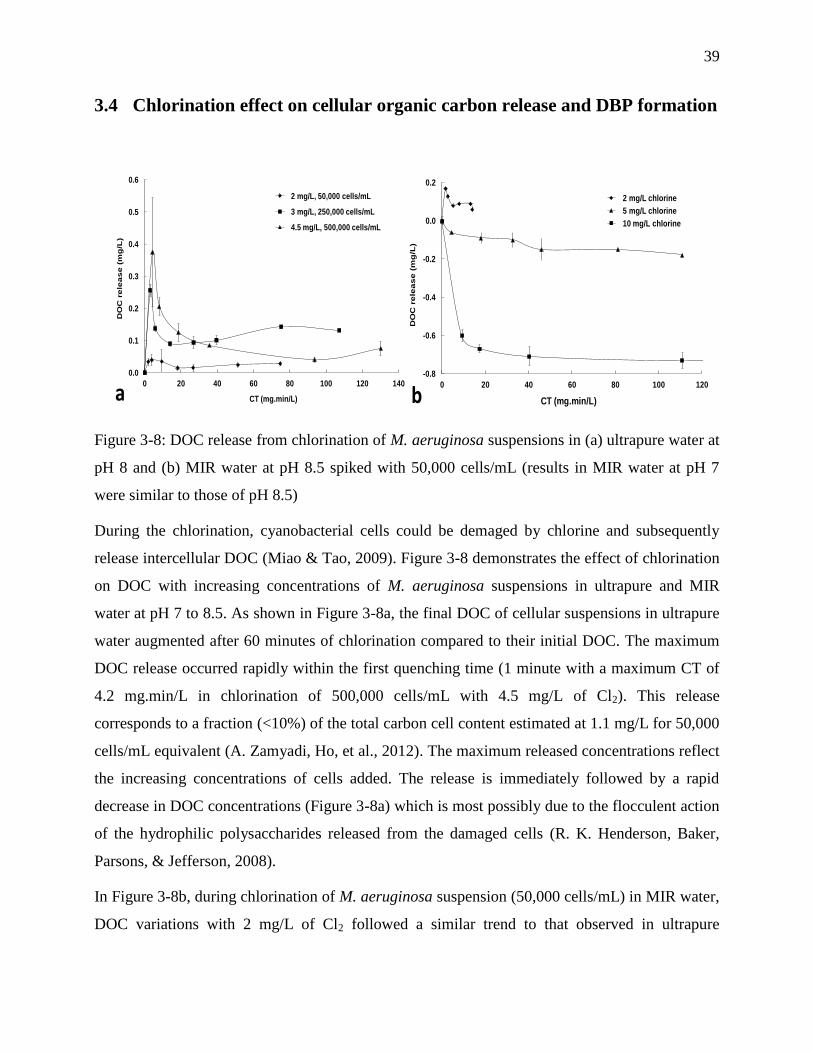
39
3.4 Chlorination effect on cellular organic carbon release and DBP formation
Figure 3-8: DOC release from chlorination of M. aeruginosa suspensions in (a) ultrapure water at
pH 8 and (b) MIR water at pH 8.5 spiked with 50,000 cells/mL (results in MIR water at pH 7
were similar to those of pH 8.5)
During the chlorination, cyanobacterial cells could be demaged by chlorine and subsequently
release intercellular DOC (Miao & Tao, 2009). Figure 3-8 demonstrates the effect of chlorination
on DOC with increasing concentrations of M. aeruginosa suspensions in ultrapure and MIR
water at pH 7 to 8.5. As shown in Figure 3-8a, the final DOC of cellular suspensions in ultrapure
water augmented after 60 minutes of chlorination compared to their initial DOC. The maximum
DOC release occurred rapidly within the first quenching time (1 minute with a maximum CT of
4.2 mg.min/L in chlorination of 500,000 cells/mL with 4.5 mg/L of Cl2). This release
corresponds to a fraction (<10%) of the total carbon cell content estimated at 1.1 mg/L for 50,000
cells/mL equivalent (A. Zamyadi, Ho, et al., 2012). The maximum released concentrations reflect
the increasing concentrations of cells added. The release is immediately followed by a rapid
decrease in DOC concentrations (Figure 3-8a) which is most possibly due to the flocculent action
of the hydrophilic polysaccharides released from the damaged cells (R. K. Henderson, Baker,
Parsons, & Jefferson, 2008).
In Figure 3-8b, during chlorination of M. aeruginosa suspension (50,000 cells/mL) in MIR water,
DOC variations with 2 mg/L of Cl2 followed a similar trend to that observed in ultrapure
-0.8
-0.6
-0.4
-0.2
0.0
0.2
0 20 40 60 80 100 120
DO
C r
ele
as
e (
mg
/L)
CT (mg.min/L)
2 mg/L chlorine
5 mg/L chlorine
10 mg/L chlorine
0.0
0.1
0.2
0.3
0.4
0.5
0.6
0 20 40 60 80 100 120 140
DO
C r
ele
as
e (
mg
/L)
CT (mg.min/L)
2 mg/L, 50,000 cells/mL
3 mg/L, 250,000 cells/mL
4.5 mg/L, 500,000 cells/mL
a b
40
experiments. On the other hand, this trend is greatly enhanced when applying a higher dosage of
chlorine (as 5 and 10 mg/L) to the cellular suspensions of 50,000 cells/mL in natural MIR water.
There was a net decrease of DOC up to 0.73 mg/L C from the background DOC values of 6.3
mg/L of the MIR water (Figure 3-8b). Similar trends were observed at a buffered pH of 7. This
further proves the hypothesis that increasing dosages is in favor of the formation of
polysaccharides based compounds that shift AOM and humic acids from the natural water to
particulate NOM. Unfortunately, total organic carbon measurements have not been conducted
which would have reconsolidated the data by showing the organic matter change to particulate
fraction.
The DBP formation is a negative consequence for chlorination of cyanobacteria, especially
THMs from the reaction of chlorine with NOM present in the nature water (Acero, Rodriguez,
Majado, Sordo, & Meriluoto, 2008). Furthermore, some studies have shown that cell-bound DOC
can be a significant source of DBP precursors (Huang, et al., 2009; Nguyen, et al., 2005; J. D.
Plummer & Edzwald, 2001; Wardlaw, Perry, & Graham, 1991).
In 3rd
Cl2 Exp, the reactivity of cyanobacterial organic matter, whether dissolved or particulate,
was further eveluated. To specifically investigate the contribution of M. aeruginosa cells to DBP
formation during chlorination, the cells were filtered and re-suspended in ultrapure water, thus
eliminating the contribution of EOM. Depending on the cell growth phase and culture conditions,
the concentration of EOM release and accumulation can vary broadly, which can reach up to of
40 mg/L C in extremely dense suspensions (Hoyer, Lusse, & Bernhardt, 1985; Nguyen, et al.,
2005). In order to release IOM, a dense suspension of 500,000 cells/mL was subjected to three
freeze–thaw cycles prior to chlorination with 5.5 mg/L Cl2 at pH 8. Table 3.3 presents the TTHM
and HAA6 formation in the compromised M. aeruginosa suspension after 24 hours. The
measured concentrations of TTHM and HAA6 after the maximum CT of 3051 mg.min/L are still
under the current reference standard of 80 µg/L for TTHM and 60 µg/L for HAA5 (United States
Environmental Protection Agency (USEPA), 2006).
The results of this study are contrasting with those from Huang et al., 2009 (Huang, et al., 2009)
which reported high yields of THM and HAA precursors from high density suspensions of
cultured Microcystis sp. with a very high DOC during a chlorination experiments (pH 7 with over
0.5 mg/L Cl2 residual from 1 to 7 days of contact). The estimated biovolume of M. aeruginosa is

41
53 µm3/cell and its maximum estimated dry weight is 44 pg/cell (Reynolds, 1984). Optimum
content of carbon (C) in a M. aeruginosa cell is approximately 50% of the cell dry weight
(Reynolds, 1984). Thus, the carbon content of our suspension of 500,000 cells/mL of M.
aeruginosa (suspension with highest cell number) is around 11 mg/L as C. The highest published
chloroform yield for chlorination of Microcystis sp. is 61 µg CHCl3/mg C (Huang, et al., 2009).
Hence, 671 µg/L is the maximum potential THM formation for our M. aeruginosa suspension of
500,000 cells/mL. In this study, the measured DOC of the suspension of 500,000 cells/mL of M.
aeruginosa is only 1.3 mg/L as C. Actual THM yield from the chlorination of IOM and EOM of
this cell suspension within a contact time of 24 hours (Table 3.3) is below the maximum THM
potential formation values. The published maximum potential yield of HAA precursor for intense
Microcystis sp. culture is smaller than the published values for chloroform (Huang, et al., 2009).
However, the actual HAA6 measured in chlorination of IOM and EOM of 500,000 cells/mL of
M. aeruginosa after 24 hours was below detection limit (Table 3.3).
Table 3.3: DBP formation in chlorination of lysed M. aeruginosa suspension of 500,000 cells/mL
in ultrapure water at pH 8
Time Cl2 residual Cl2 demand CT TTHM HAA6
(min) (mg/L) (mg/L) (mg.min/L) (µg/L) (µg/L)
0 5.5 - 0.00 BDL* BDL
30 2.9 2.6 125.4 BDL BDL
1440 1.3 4.2 3051.2 12.87 BDL
* Below Detection Limits (BDL)
The M. aeruginosa cells used for this study were harvested only at stationary phase of growth.
The growth phase can influence the types of protein and carbohydrate associated with
cyanobacterial cells (R. Henderson, Parsons, & Jefferson, 2008; R. K. Henderson, et al., 2008);
thus varying the reactivity of these compounds with chlorine and their DBP formation potentials.
However, the results of 3rd
Cl2 Exp showed that the chlorination of 500,000 cells/mL and less of
M. aeruginosa cells did not contribute importantly to the DBP formation.

42
CONCLUSION
Results of this research show that chlorine demand is directly related to cyanobacteria (M.
aeruginosa) cell numbers and the chlorine doses when chlorination in ultrapure water, in MIR
water and even in the natural MB bloom water samples. The first-order rate constant for chlorine
decay (kCl2) also increased with increasing cyanobacteria cell numbers and chlorine doses.
Furthermore, greater cell numbers are associated with higher release of DOC coherent with faster
chlorine decay. The results of chlorine demand with M. aeruginosa in MIR water under different
pH 7 and 8.5 are similar and keep the same trends.
This research also demonstrates that chlorine doses of 2 to 10 mg/L cause the fast release and
subsequent oxidation of dissolved and cell-bound MCs from M. aeruginosa. Additionally, a
maximum of 76% reduction in total cell numbers (cell lysis) was observed with a CT of 296
mg/min/L. A rather constant value of of 5.6±0.2 pgCl2/cell is estimated as the M. aeruginosa
cellular chlorine demand when cell lysis occurs due to chlorination. The cellular chlorine demand
in the presence of cellular debris is the key information provided in this paper to the operators of
DWTPs to adjust their chlorination practice. This information will be directly relevant to water
authorities and DWTP operators to validate the efficiency of chlorination barrier.
There is DOC release during the chlorination and the maximum DOC release occurs very quickly
within the first minutes. For the study of DBP formation, these results show that chlorination of
500,000 cells/mL and less of M. aeruginosa cells do not contribute significantly to the DBP
precursor’s pool. However, the background NOM and its DBP formation potential will determine
whether the chlorination of M. aeruginosa cells can be considered without the formation of
excessive chlorination by-products.
The results about the MB bloom samples show that 28% to 53% reductions of total number of
cells, corresponding to full cell lysis, were observed after 60 minutes of chlorination. Comparing
the results of cell lysis of laboratory M. aeruginosa culture, natural blooms are more resistant
than cell suspension of laboratory cultures. Low chlorine doses of 2 and 5 mg/L Cl2 were not
enough to oxidize the toxins of the MB bloom sample and to achieve the WHO guideline value
even after 60 minutes. DOC variation before and after chlorination were below 0.2 mg/L C.
Furthermore, these results demonstrate that breakthrough of cyanotoxins at concentration

43
exceeding the health-based exposure alert levels can occur, even for toxins considered to be
readily oxidized by chlorine.
Even though pre-chlorination is a promising barrier against cyanobacteria and their toxins
accumulation and breakthrough in drinking water treatment process, it is essential to be cautions
with the exposition of experimental results and the application in the practical application.
44
REFERENCES
(INSPQ), I. n. d. s. p. d. q. (2004). Cyanobactéries et Cyanotoxines (eau potable et eaux
récréatives) (pp. 20). Québec, Canada: Groupe Scientifique sur l'Eau.
Acero, J. L., Rodriguez, E., Majado, M. E., Sordo, A., & Meriluoto, J. (2008). Oxidation of
microcystin-LR with chlorine and permanganate during drinking water treatment. Water
Supply: Research and Technology-Aqua, 57(6), 371-380.
Acero, J. L., Rodriguez, E., & Meriluoto, J. (2005). Kinetics of reactions between chlorine and
the cyanobacterial toxins microcystins. Water Research, 39(8), 1628-1638.
American Public Health Association (APHA), American Water Works Association (AWWA), &
Water Environment Federation (WEF). (2005). Standard methods for the examination of
water and wastewater (21th
Edition). Washington, DC, USA.
Anderson, D., Glibert, P., & Burkholder, J. (2002). Harmful algal blooms and eutrophication:
nutrient sources, composition, and consequences. Estuaries and Coasts, 25(4), 704-726.
Bond, T., Henriet, O., Goslan, E. H., Parsons, S. A., & Jefferson, B. (2009). Disinfection
byproduct formation and fractionation behavior of natural organic matter surrogates.
Environmental Science and Technology, 43(15), 5982-5989.
Brookes, J. D., Daly, R., Regel, R. H., Burch, M., Ho, L., Newcombe, G., et al. (2008). Reservoir
management strategies for control and degradation of algal toxins (pp. 243). Denver,
Colorado, USA: American Water Works Association Research Foundation.
Carmichael, W. W. (1994). The toxins of Cyanobacteria. Scientific American, 270(1), 78-86.
Carmichael, W. W. (2000). Assessment of blue-green algal toxins in raw and finished drinking
water (pp. 179). Denver, Colorado, USA: American Water Works Association Research
Foundation.
Carmichael, W. W. (2001). Health effects of toxin-producing cyanobacteria:“The cyanoHABs”.
Human and Ecological Risk Assessment: An International Journal, 7(5), 1393-1407.
Carrière, A., Prévost, M., Zamyadi, A., Chevalier, P., & Barbeau, B. (2010). Vulnerability of
Quebec drinking water treatment plants to cyanotoxins in a climate change context.
Journal of Water and Health, 8(3), 455-465.
Chorus, I., & Bartram, J. (1999). Toxic cyanobacteria in water : a guide to their public health
consequences, monitoring, and management. London; New York: E & FN Spon.
Chow, C. W. K., Drikas, M., House, J., Burch, M. D., & Velzeboer, R. M. A. (1999). The impact
of conventional water treatment processes on cells of the cyanobacterium microcystis
aeruginosa. Water Research, 33(15), 3253-3262.
Codd, G. A. (2000). Cyanobacterial toxins, the perception of water quality, and the prioritisation
of eutrophication control. Ecological Engineering, 16(1), 51-60.
Codd, G. A., Lindsay, J., Young, F. M., Morrison, L. F., & Metcalf, J. S. (2005). Harmful
Cyanobacteria: from mass mortalities to management measures (Chaper 1). In J.
Huisman, H. C. P. Matthijs & P. M. Visser (Eds.), Harmful cyanobacteria (pp. 1-23).
Dordrecht, The Netherlands: Springer.
45
Cong, D., Shi-xin, W., Yi, Z., & Fu-li, Y. (2009). Impact assessment of cyanobacteria bloom on
water intakes in Taihu Lake using remote sensing data. China Environmental Science, 29,
1041-1046.
Daly, R. I., Ho, L., & Brookes, J. D. (2007). Effect of chlorination on microcystis aeruginosa cell
integrity and subsequent microcystin release and degradation. Environmental Science and
Technology, 41(12), 4447-4453.
de Figueiredo, D., Azeiteiro, U., Esteves, S., Gonçalves, F., & Pereira, M. (2004). Microcystin-
producing blooms--a serious global public health issue* 1. Ecotoxicology and
Environmental Safety, 59(2), 151-163.
De Julio, M., Fioravante, D. A., De Julio, T. S., Oroski, F. I., & Graham, N. J. D. (2010). A
methodology for optimising the removal of cyanobacteria cells from a brazilian eutrophic
water. Brazilian Journal of Chemical Engineering, 27, 113-126.
Ding, J., Shi, H., Timmons, T., & Adams, C. (2010). Release and removal of microcystins from
microcystis during oxidative-, physical-, and UV-based disinfection. Journal of
Environmental Engineering, 136, 2-11.
Donati, C., Drikas, M., Hayes, R., & Newcombe, G. (1994). Microcystin-LR adsorption by
powdered activated carbon. Water Research, 28(8), 1735-1742.
Drikas, M., Newcombe, G., & Nicholson, B. (2001, November 11-15, 2001). Water treatment
options for cyanobacteria and their toxins. Paper presented at the American Water Works
Association-Water Quality Technology Conference Nashville, Tennessee, USA.
Duy, T. N., Lam, P. K. S., Shaw, G. R., & Connell, D. W. (2000). Toxicology and risk
assessment of freshwater Cyanobacterial (blue-green algal) toxins in water. Reviews of
Environmental Contamination Toxicology, 163, 113-186.
El-Shehawy, R., Gorokhova, E., Fernández-Piñas, F., & del Campo, F. F. (2012). Global
warming and hepatotoxin production by cyanobacteria: What can we learn from
experiments? Water Research, 46(5), 1420-1429. doi: 10.1016/j.watres.2011.11.021
Falconer, I. R. (1991). Tumor promotion and liver injury caused by oral consumption of
cyanobacteria. Environmental toxicology and water quality, 6(2), 177-184.
Falconer, I. R., & Humpage, A. R. (2005). Health risk assessment of cyanobacterial (blue-green
algal) toxins in drinking water. International journal of environmental research and
public health, 2(1), 43-50.
Fawell, J. K., Hart, J., James, H. A., & Parr, W. (1993). Blue-green algae and their toxins-
analysis, toxicity, treatment and environmental control. Water Supply, 11(3-4), 109-121.
Fay, P. (1992). Oxygen relations of nitrogen fixation in cyanobacteria. Microbiology and
Molecular Biology Reviews, 56(2).
Fischer, W. J., Garthwaite, I., Miles, C. O., Ross, K. M., Aggen, J. B., Chamberlin, A. R., et al.
(2001). Congener-independent immunoassay for microcystins and nodularins.
Environmental Science and Technology, 35(24), 4849-4856.
Gerrath, J., Wehr, J., & Sheath, R. (2003). Freshwater Algae of North America. Ecology and
Classification.

46
Gorham, P. R., McLachlan, J., Hammer, U. T., & Kim, W. K. (1964). Isolation and culture of
toxic strains of Anabaena flos-aquae (Lyngb.) deBréb. International Association of
Theoretical and Applied Limnology, 15, 796-804.
Grützmacher, G., Wessel, G., Klitzke, S., & Chorus, I. (2010). Microcystin elimination during
sediment contact. Environmental Science and Technology, 44(2), 657-662.
Haddix, P. L., Hughley, C. J., & Lechevallier, M. W. (2007). Occurrence of microcystins in 33
US water supplies. Journal of the American Water Works Association, 99(9), 118-125.
Hart, J., Fawell, J. K., & Croll, B. (1998). The fate of both intra- and extracellular toxins during
drinking water treatment. 16(1-2), 611-616.
Health Canada. (2007). Guidelines for Canadian drinking water quality: summary table (pp. 15).
Ottawa, Ontario, Canada: Federal-Provincial-Territorial Committee on Drinking Water of
the Federal-Provincial-Territorial Committee on Health and the Environment.
Henderson, R., Parsons, S. A., & Jefferson, B. (2008). The impact of algal properties and pre-
oxidation on solid-liquid separation of algae. Water Research, 42(8-9), 1827-1845.
Henderson, R. K., Baker, A., Parsons, S. A., & Jefferson, B. (2008). Characterisation of
algogenic organic matter extracted from cyanobacteria, green algae and diatoms. Water
Research, 42(13), 3435-3445.
Himberg, K., Keijola, A.-M., Hiisvirta, L., Pyysalo, H., & Sivonen, K. (1989). The effect of
water treatment processes on the removal of hepatotoxins from Microcystis and
Oscillatoria Cyanobacteria: a laboratory study. Water Research, 23(8), 979-984.
Hitzfeld, B. C., Höger, S. J., & Dietrich, D. R. (2000). Cyanobacterial toxins: removal during
drinking water treatment, and human risk assessment. Environmental Health
Perspectives, 108(Suppl. 1), 113-122.
Ho, L., Onstad, G., von Gunten, U., Rinck-Pfeiffer, S., Craig, K., & Newcombe, G. (2006).
Differences in the chlorine reactivity of four microcystin analogues. Water Research,
40(6), 1200-1209.
Hou, C.-R., Hu, W., Jia, R.-B., & Liu, P.-Q. (2008). The mechanism of cyanobacterium
(M.aeruginosa) microcystins releasing by chemical oxidation in drinking water treatment.
Bioinformatics and Biomedical Engineering, 3734-3737.
Hoyer, O., Lusse, B., & Bernhardt, H. (1985). Isolation and characterization of extracellular
organic matter (EOM) from algae. Zeitschrift für Wasser - und Abwasser-Forschung,
18(2), 76-90.
Huang, J., Graham, N., Templeton, M. R., Zhang, Y., Collins, C., & Nieuwenhuijsen, M. (2009).
A comparison of the role of two blue-green algae in THM and HAA formation. Water
Research, 43(12), 3009-3018.
Hudnell, H. K. (2008). Cyanobacterial harmful algal blooms: state of the science and research
needs. New York, USA: Springer Science.
Hurst, C. J. (2007). Modeling the fate of microorganisms in water, wastewater, and soil (Chapter
28) Manual of environmental Microbiology (Third Edition) (pp. 355-364). Washington,
DC, USA: American Society for Microbiology Press.

47
Jochimsen, E. M., Carmichael, W. W., An, J. S., Cardo, D. M., Cookson, S. T., Holmes, C. E., et
al. (1998). Liver failure and death after exposure to microcystins at a hemodialysis center
in Brazil. The New England Journal of Medicine, 338(13), 873-878.
Jones, G., Gurney, S., & Rocan, D. (1998). Blue-green algae and microcystin-LR in surface water
supplies of southwestern Manitoba (pp. 82). Manitoba, Canada: Manitoba Environment.
Knappe, D. R. U., Belk, R. C., Briley, D. S., Gandy, S. R., Rastogi, N., Rike, A. H., et al. (2004).
Algae detection and removal strategies for drinking water treatment plants (pp. 466):
American Water Works Association Research Foundation (AWWARF).
Koch, B., Crofts, E. W., Schimpff, W. K., & Davis, M. K. (1988, November 13-17, 1988).
Analysis of halogenated disinfection by-products by capilary chloramotography. Paper
presented at the American Water Works Association-Water Quality Technology
Conference, St. Louis, Missouri, USA.
Kotak, B., & Zurawell, R. (2007). Cyanobacterial toxins in Canadian freshwaters: a review. Lake
and Reservoir Management, 23(2), 109-122.
Laslett, G. M., Clark, R. M., & Jones, G. J. (1997). Estimating the precision of filamentous blue-
green algae cell concentration from a single sample. Environmetrics, 8(4), 313-339.
Lin, T. F., Chang, D. W., Lien, S. K., Tseng, Y. S., Chiu, Y. T., & Wang, Y. S. (2009). Effect of
chlorination on the cell integrity of two noxious cyanobacteria and their releases of
odorants. Journal of Water Supply Research and Technology-Aqua, 58(8), 539-551.
Liu, Y., Chen, W., Li, D., Huang, Z., & Shen, Y. (2011). Cyanobacteria-/cyanotoxin-
contaminations and eutrophication status before Wuxi Drinking Water Crisis in Lake
Taihu, China. Journal of Environmental Sciences, 23(4), 575-581.
Lund, J. W. G., Kipling, C., & Le Cren, E. D. (1958). The inverted microscope method of
estimating algal number and the statistical basis of estimations by counting.
Hydrobiologia, 11(2), 143-170.
McQuaid, N., Zamyadi, A., Prévost, M., Bird, D. F., & Dorner, S. (2011). Use of in vivo
phycocyanin fluorescence to monitor potential microcystin-producing cyanobacterial
biovolume in a drinking water source. Journal of Environmental Monitoring, 13(2), 455-
463.
Merel, S., Clément, M., Mourot, A., Fessard, V., & Thomas, O. (2010). Characterization of
cylindrospermopsin chlorination. Science of the Total Environment, 408(16), 3433-3442.
Merel, S., Clément, M., & Thomas, O. (2010). State of the art on cyanotoxins in water and their
behaviour towards chlorine. Toxicon, 55(4), 677-691.
Mez, K., BEATTIE, K. A., CODD, G. A., Hanselmann, K., Hauser, B., Naegeli, H., et al. (1997).
Identification of a microcystin in benthic cyanobacteria linked to cattle deaths on alpine
pastures in Switzerland. European Journal of Phycology, 32(02), 111-117.
Miao, H., & Tao, W. (2009). The mechanisms of ozonation on cyanobacteria and its toxins
removal. Separation and Purification Technology, 66(1), 187-193.
Mouchet, P., & Bonnelye, V. (1998). Solving algae problems: french expertise and world-wide
applications. Water Supply: Research and Technology-Aqua, 47(3), 125-141.
48
Newcombe, G., Cook, D., Brooke, S., Ho, L., & Slyman, N. (2003). Treatment options for
microcystin toxins: similarities and differences between variants. Environmental
Technology, 24(3), 299-308.
Newcombe, G., House, J., Ho, L., Baker, P., & Burch, M. (2010). Management strategies for
cyanobacteria (blue-green algae): a guide for water utilities (pp. 112). Adelaïde, South
Australia: The Cooperative Research Centre for Water Quality and Treatment.
Newcombe, G., & Nicholson, B. (2004). Water treatment options for dissolved cyanotoxins.
Water Supply: Research and Technology-Aqua, 53(4), 227-239.
Nguyen, M.-L., Westerhoff, P., Baker, L., Hu, Q., Esparza-Soto, M., & Sommerfeld, M. (2005).
Characteristics and reactivity of algae-produced dissolved organic carbon. Journal of
Environmental Engineering, 131(11), 1574-1582.
Nicholson, B., & Shaw, G. (2011). Instrumental methods for the determination of cyanobacterial
toxins. Water Quality and Treatment, 1, 61-73.
Nicholson, B. C., & Burch, M. D. (2001). Evaluation of analytical methods for detection and
quantification of cyanotoxins in relation to Australian drinking water guidelines (pp. 64).
Commonwealth, Australia: National Research Council of Australia, the Water Services
Association of Australia, and the Cooperative Research Centre for Water Quality and
Treatment.
Nicholson, B. C., Rositano, J., & Burch, M. D. (1994). Destruction of cyanobacterial peptide
hepatotoxins by chlorine and chloramine. Water Research, 28(6), 1297-1303.
Nicholson, B. C., Shaw, G. R., Morrall, J., Senogles, P. J., Woods, T. A., Papageorgiou, J., et al.
(2003). Chlorination for degrading saxitoxins (paralytic shellfish poisons) in water.
Environmental Technology, 24(11), 1341-1348.
Oliver, R., & Ganf, G. (2000). Freshwater blooms (Chapter 6). In B. Whitton & M. Potts (Eds.),
The ecology of cyanobacteria: their diversity in time and space (pp. 149-194).
Amsterdam, The Netherlands: Kluwer Academic Publishers.
Paerl, H. W., & Paul, V. J. (2012). Climate change: Links to global expansion of harmful
cyanobacteria. Water Research, 46(5), 1349-1363. doi: 10.1016/j.watres.2011.08.002
Paul, V. J. (2008). Global warming and cyanobacterial harmful algal blooms (Chapter 11). New
York, USA: Springer-Verlag Inc.
Petrusevski, B., van Breeman, A. N., & Alaerts, G. J. (1995). Optimisation of coagulation
conditions for direct filtration of impounded surface water. Water Supply: Research and
Technology-Aqua, 44(2), 93-102.
Pietsch, J., Bornmann, K., & Schmidt, W. (2002). Relevance of intra- and extracellular
cyanotoxins for drinking water treatment. Acta Hydrochimica and Hydrobiologica, 30(1),
7-15.
Plummer, J., & Edzwald, J. (2002). Effects of chlorine and ozone on algal cell properties and
removal of algae by coagulation. Aqua, 51, 307-318.
Plummer, J. D., & Edzwald, J. K. (2001). Effect of ozone on algae as precursors for
trihalomethane and haloacetic acid production. Environmental Science and Technology,
35(18), 3661-3668.
49
Reynolds, C. S. (1984). The ecology of freshwater phytoplankton. New York, USA: Cambridge
University Press.
Robert, C. (2008). Résultats de cyanobactéries et cyanotoxines à sept stations de production
d’eau potable (2004-2006) (pp. 39). Canada: Ministère du Développement Durable, de
l'Environnement et des Parcs (MDDEP).
Rodriguez, E., Majado, M. E., Meriluoto, J., & Acero, J. L. (2007). Oxidation of microcystins by
permanganate: reaction kinetics and implications for water treatment. Water Research,
41(1), 102-110.
Rodriguez, E., Onstad, G. D., Kull, T. P. J., Metcalf, J. S., Acero, J. L., & von Gunten, U. (2007).
Oxidative elimination of cyanotoxins: comparison of ozone, chlorine, chlorine dioxide
and permanganate. Water Research, 41(15), 3381-3393.
Rodriguez, E., Sordo, A., Metcalf, J. S., & Acero, J. L. (2007). Kinetics of the oxidation of
cylindrospermopsin and anatoxin-a with chlorine, monochloramine and permanganate.
Water Research, 41(9), 2048-2056.
Rodriguez, E. M., Acero, J. L., Spoof, L., & Meriluoto, J. (2008). Oxidation of MC-LR and -RR
with chlorine and potassium permanganate: toxicity of the reaction products. Water
Research, 42(6-7), 1744-1752.
Sedmak, B., & Kosi, G. (1998). The role of microcystins in heavy cyanobacterial bloom
formation. Journal of Plankton Research, 20(4).
Senogles, P., Shaw, G., Smith, M., Norris, R., Chiswell, R., Mueller, J., et al. (2000).
Degradation of the cyanobacterial toxin Cylindrospermopsin, from Cylindrospermopsis
raciborskii, by chlorination. Toxicon, 38(9), 1203-1213.
Sohn, J., Amy, G., Cho, J., Lee, Y., & Yoon, Y. (2004). Disinfectant decay and disinfection by-
products formation model development: chlorination and ozonation by-products. Water
Research, 38(10), 2461-2478.
Svrcek, C., & Smith, D. W. (2004). Cyanobacteria toxins and the current state of knowledge on
water treatment options: a review. Environmental Engineering and Science, 3(3), 155-
185.
Taylor, W. D., Losee, R. F., Torobin, M., Izaguirre, G., Sass, D., Khiari, D., et al. (2006). Early
warning and management of surface water taste-and-odor events (pp. 408). Denver,
Colorado, USA: American Water Works Association Research Foundation (AWWARF).
The Cooperative Research Centre for Water Quality and Treatment (Australia). (2007).
Cyanobacteria: management and implications for water quality (pp. 36).
Tsuji, K., Watanuki, T., Kondo, F., Watanabe, M. F., Nakazawa, H., Suzuki, M., et al. (1997).
Stability of microcystins from Cyanobacteria. IV. Effect of chlorination on
decomposition. Toxicon, 35(7), 1033-1041.
United States Environmental Protection Agency (USEPA). (2006). Federal Register. Part II.
National primary drinking water regulations: Long Term 2 Enhanced Surface Water
Treatment Rule; final rule (Vol. 40 CFR Parts 9, 141 and 142, pp. 136). Washington, DC,
USA: Office of Science and Technology, Office of Water.
50
Wardlaw, V. E., Perry, R., & Graham, N. J. D. (1991). the role of algae as trihalomethane
precursors: a review. Water Science and Technology: Water Supply, 40(6), 335-335.
Westrick, J. A. (2008). Cyanobacterial toxin removal in drinking water treatment processes and
recreational waters (Chapter 13) (pp. 275-290). New York, USA: Springer-Verlag Inc.
Westrick, J. A., Szlag, D. C., Southwell, B. J., & Sinclair, J. (2010). A review of cyanobacteria
and cyanotoxins removal/inactivation in drinking water treatment. Analytical and
Bioanalytical Chemistry, 397(5), 1705-1714.
Wetzel, R. G., & Likens, G. E. (2000). Limnological analysis (Third Edition): Springer-Sciences,
Business Media, Inc.
World Health Organization (WHO). (1998). Cyanobacterial toxins: microcystin-LR in drinking-
water (background document for development of WHO guidelines for drinking water
quality) (pp. 18). Geneva: 2nd
Edition Addendum to Vol. 2. Health Critiria and Other
Supporting Information.
Xagoraraki, I., Harrington, G. W., Zulliger, K., Zeier, B., Krick, W., Karner, D. A., et al. (2006).
Inactivation kinetics of the cyanobacterial toxin microcystin-LR by free chlorine. Journal
of Environmental Engineering, 132(7), 818-823.
Yoo, R. S., Carmichael, W. W., Hoehn, R. C., & Hrudey, S. E. (1995). Cyanobacterial (blue-
green algal) toxins: a ressource guide (pp. 229). Denver, Colorado, USA: American Water
Works Association Research Foundation and American Water Works Association.
Yun, Y., Lim, S., Cho, K., & Park, J. (1997). Variations of photosynthetic activity and growth of
freshwater algae according to ozone contact time in ozone treatment. Biotechnology
Letters, 19(9), 831-833.
Zamyadi, A. (2011). The value of in vivo monitoring and chlorination for the control of toxic
cyanobacteria in drinking water production (Thesis). Doctor of Philosophy Ph.D.,
NSERC Industrial Chair in Drinking Water, Ecole Polytechnique de Montréal, Montreal,
Quebec.
Zamyadi, A., Ho, L., Newcombe, G., Bustamante, H., & Prévost, M. (2012). Fate of toxic
cyanobacterial cells and disinfection by-products formation after chlorination Water
Research 46(5), 1 5 2 4 -1 5 3 5.
Zamyadi, A., Ho, L., Newcombe, G., Daly, R. I., Burch, M., Baker, P., et al. (2010). Release and
oxidation of cell-bound saxitoxins during chlorination of Anabaena circinalis cells.
Environmental Science and Technology, 44(23), 9055-9061.
Zamyadi, A., MacLeod, S., Fan, Y., McQuaid, N., Dorner, S., Sauvé, S., et al. (2012). Toxic
cyanobacterial breakthrough and accumulation in a drinking water plant: a monitoring and
treatment challenge Water Research 46(5), 1511-1523.
Zurawell, R. (2002). An initial assessment of microcystin in raw and treated municipal drinking
water derived from eutrophic surface waters in Alberta (pp. 46). Canada: Alberta
Environment.
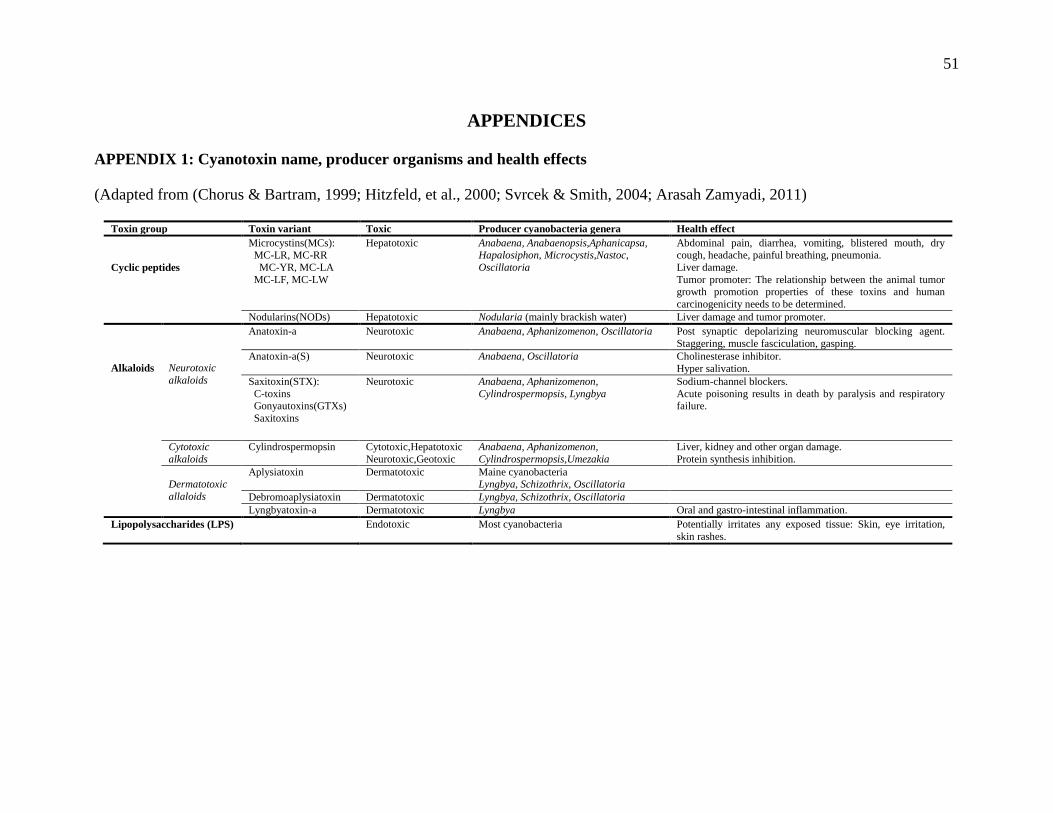
51
APPENDICES
APPENDIX 1: Cyanotoxin name, producer organisms and health effects
(Adapted from (Chorus & Bartram, 1999; Hitzfeld, et al., 2000; Svrcek & Smith, 2004; Arasah Zamyadi, 2011)
Toxin group Toxin variant Toxic Producer cyanobacteria genera Health effect
Cyclic peptides
Microcystins(MCs): MC-LR, MC-RR
MC-YR, MC-LA
MC-LF, MC-LW
Hepatotoxic Anabaena, Anabaenopsis,Aphanicapsa, Hapalosiphon, Microcystis,Nastoc,
Oscillatoria
Abdominal pain, diarrhea, vomiting, blistered mouth, dry cough, headache, painful breathing, pneumonia.
Liver damage.
Tumor promoter: The relationship between the animal tumor growth promotion properties of these toxins and human
carcinogenicity needs to be determined.
Nodularins(NODs) Hepatotoxic Nodularia (mainly brackish water) Liver damage and tumor promoter.
Alkaloids
Neurotoxic
alkaloids
Anatoxin-a Neurotoxic Anabaena, Aphanizomenon, Oscillatoria Post synaptic depolarizing neuromuscular blocking agent.
Staggering, muscle fasciculation, gasping.
Anatoxin-a(S) Neurotoxic Anabaena, Oscillatoria Cholinesterase inhibitor.
Hyper salivation.
Saxitoxin(STX):
C-toxins Gonyautoxins(GTXs)
Saxitoxins
Neurotoxic Anabaena, Aphanizomenon,
Cylindrospermopsis, Lyngbya
Sodium-channel blockers.
Acute poisoning results in death by paralysis and respiratory failure.
Cytotoxic
alkaloids
Cylindrospermopsin Cytotoxic,Hepatotoxic
Neurotoxic,Geotoxic
Anabaena, Aphanizomenon,
Cylindrospermopsis,Umezakia
Liver, kidney and other organ damage.
Protein synthesis inhibition.
Dermatotoxic
allaloids
Aplysiatoxin Dermatotoxic Maine cyanobacteria Lyngbya, Schizothrix, Oscillatoria
Debromoaplysiatoxin Dermatotoxic Lyngbya, Schizothrix, Oscillatoria
Lyngbyatoxin-a Dermatotoxic Lyngbya Oral and gastro-intestinal inflammation.
Lipopolysaccharides (LPS) Endotoxic Most cyanobacteria Potentially irritates any exposed tissue: Skin, eye irritation,
skin rashes.

52
APPENDIX 2: Measurement methods for cyanotoxins
There are some general considerations for optimum measurement method of cyanotoxins. In
water bodies, bloom-forming cyanobacteria will present their toxins in both the water as
dissolved extracellular toxins and the cyanobacterial cells as intracellular toxins at the same time
(Chorus & Bartram, 1999; Pietsch, et al., 2002). These current analytical techniques only can
measure the toxins in the free or dissolved state (B. Nicholson & Shaw, 2011). To measure the
total levels of toxins in the samples containing healthy blooms, cyanobacterial cells must be lysed
to release intracellular toxins, usually by freeze-drying followed by sonication in solution, or
repeated freeze-thawing and/or sonication of whole cell material (Svrcek & Smith, 2004).
Therefore the extraction of intracellular toxins should be considered firstly, as the basis of any
measurement procedure. The concentrations, stability of cyanotoxins and the goal of sampling
program must also be considered for choosing the method (B. C. Nicholson & Burch, 2001).
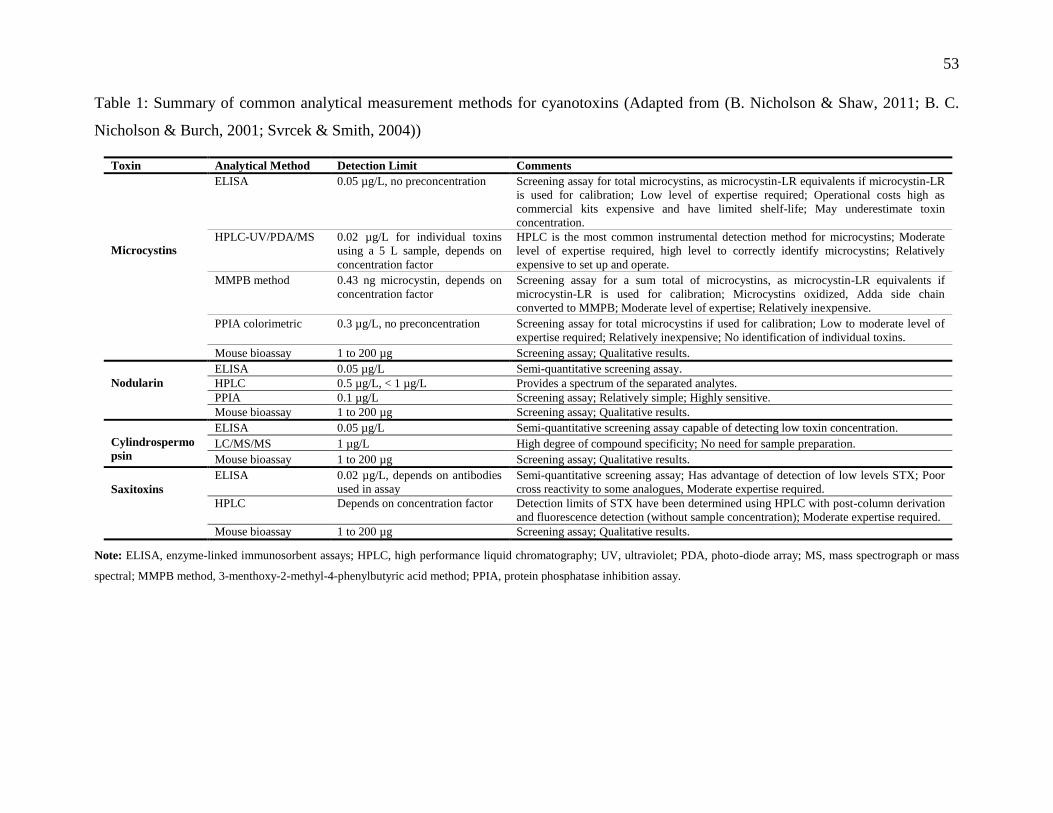
53
Table 1: Summary of common analytical measurement methods for cyanotoxins (Adapted from (B. Nicholson & Shaw, 2011; B. C.
Nicholson & Burch, 2001; Svrcek & Smith, 2004))
Toxin Analytical Method Detection Limit Comments
Microcystins
ELISA 0.05 µg/L, no preconcentration Screening assay for total microcystins, as microcystin-LR equivalents if microcystin-LR
is used for calibration; Low level of expertise required; Operational costs high as
commercial kits expensive and have limited shelf-life; May underestimate toxin
concentration.
HPLC-UV/PDA/MS 0.02 µg/L for individual toxins
using a 5 L sample, depends on
concentration factor
HPLC is the most common instrumental detection method for microcystins; Moderate
level of expertise required, high level to correctly identify microcystins; Relatively
expensive to set up and operate.
MMPB method 0.43 ng microcystin, depends on
concentration factor
Screening assay for a sum total of microcystins, as microcystin-LR equivalents if
microcystin-LR is used for calibration; Microcystins oxidized, Adda side chain
converted to MMPB; Moderate level of expertise; Relatively inexpensive.
PPIA colorimetric 0.3 µg/L, no preconcentration Screening assay for total microcystins if used for calibration; Low to moderate level of
expertise required; Relatively inexpensive; No identification of individual toxins.
Mouse bioassay 1 to 200 µg Screening assay; Qualitative results.
Nodularin
ELISA 0.05 µg/L Semi-quantitative screening assay.
HPLC 0.5 µg/L, < 1 µg/L Provides a spectrum of the separated analytes.
PPIA 0.1 µg/L Screening assay; Relatively simple; Highly sensitive.
Mouse bioassay 1 to 200 µg Screening assay; Qualitative results.
Cylindrospermo
psin
ELISA 0.05 µg/L Semi-quantitative screening assay capable of detecting low toxin concentration.
LC/MS/MS 1 µg/L High degree of compound specificity; No need for sample preparation.
Mouse bioassay 1 to 200 µg Screening assay; Qualitative results.
Saxitoxins
ELISA 0.02 µg/L, depends on antibodies
used in assay
Semi-quantitative screening assay; Has advantage of detection of low levels STX; Poor
cross reactivity to some analogues, Moderate expertise required.
HPLC Depends on concentration factor Detection limits of STX have been determined using HPLC with post-column derivation
and fluorescence detection (without sample concentration); Moderate expertise required.
Mouse bioassay 1 to 200 µg Screening assay; Qualitative results.
Note: ELISA, enzyme-linked immunosorbent assays; HPLC, high performance liquid chromatography; UV, ultraviolet; PDA, photo-diode array; MS, mass spectrograph or mass
spectral; MMPB method, 3-menthoxy-2-methyl-4-phenylbutyric acid method; PPIA, protein phosphatase inhibition assay.

54
APPENDIX 3: Conventional treatments of cyanobacteria
Under suitable conditions, coagulation and flocculation can promote the aggregation of small,
dispersed cyanobacterial particles into larger ones for further removal by separation and filtration
(Svrcek & Smith, 2004). Efficient removal is dependent on optimization of applicable chemicals
(i.e. various aluminum, ferric iron salts and synthetic polymers), chemical doses, and pH (Chorus
& Bartram, 1999; De Julio, Fioravante, De Julio, Oroski, & Graham, 2010). In many literatures,
coagulation and flocculation were effective at 3-log removal of cyanobacterial cells without
significant damage to membrane integrity (Drikas, Newcombe, & Nicholson, 2001). A study
reported that chemical treatment and mechanical agitation did not damage the cultured M.
aeruginosa cells and, more importantly, did not result in additional release of cell metabolites
above background concentrations (Chow, et al., 1999). Some studies found that coagulation and
flocculation removed intracellular toxins via the removal of the cells themselves; however they
did not effectively remove dissolved toxins (Chorus & Bartram, 1999). Another study used three
coagulants: ferric sulphate, alum and polyaluminium chloride to remove dissolved microcystins;
in all cases there was virtually no toxin removal (B. C. Nicholson, et al., 1994).
Although coagulation/flocculation is normally followed by a sedimentation, in cyanobacteria-rich
waters, flotation such as dissolved air flotation (DAF) is more effective than sedimentation
(Knappe et al., 2004). DAF gives better results for the removal of intact cyanobacterial cells,
particularly for those low-density species with gas vacuoles that may render them more difficult
to settle: 40 to 80% removal of Microcystis, 90 to 100% removal of Anabaena but only 30% for
Planktothrix (syn Oscillatoria) (Mouchet & Bonnelye, 1998; Newcombe, et al., 2010). However,
it’s questionable that DAF process is more active than sedimentation for removing extracellular
toxins. Toxins release and sludge treatment need to be evaluated further.
Filtration which requires regular backwashing to maintain performance, is effective for the
removal of intracellular toxins (Chorus & Bartram, 1999). Direct rapid filtration without prior
chemical treatment (no clarification) obtained poor removal rates of 10 to 75%, depending on
phytoplankton species (Mouchet & Bonnelye, 1998). Conventional rapid sand filtration
(clarified) should theoretically be more active than direct filtration (Svrcek & Smith, 2004). Slow
sand filtration has lower loading rates; but it’s also effective for eliminating cell-bound
microcystins from drinking water, because of the additional possibility of biodegradation of

55
extracellular toxins on or inside the filter bed (Grützmacher, Wessel, Klitzke, & Chorus, 2010).
As always an important concern during the process of filtration, death and lysis of cyanobacterial
cells retained on filters could lead to toxins release (Chorus & Bartram, 1999).
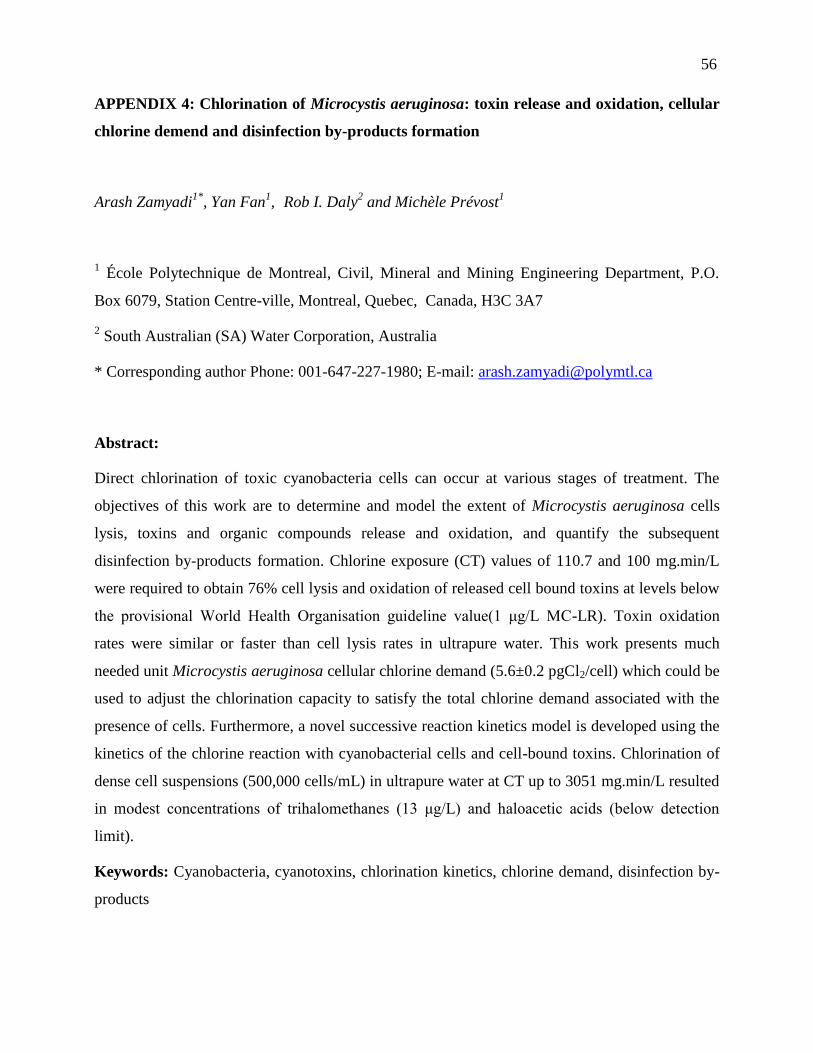
56
APPENDIX 4: Chlorination of Microcystis aeruginosa: toxin release and oxidation, cellular
chlorine demend and disinfection by-products formation
Arash Zamyadi1*
, Yan Fan1, Rob I. Daly
2 and Michèle Prévost
1
1 École Polytechnique de Montreal, Civil, Mineral and Mining Engineering Department, P.O.
Box 6079, Station Centre-ville, Montreal, Quebec, Canada, H3C 3A7
2 South Australian (SA) Water Corporation, Australia
* Corresponding author Phone: 001-647-227-1980; E-mail: [email protected]
Abstract:
Direct chlorination of toxic cyanobacteria cells can occur at various stages of treatment. The
objectives of this work are to determine and model the extent of Microcystis aeruginosa cells
lysis, toxins and organic compounds release and oxidation, and quantify the subsequent
disinfection by-products formation. Chlorine exposure (CT) values of 110.7 and 100 mg.min/L
were required to obtain 76% cell lysis and oxidation of released cell bound toxins at levels below
the provisional World Health Organisation guideline value(1 μg/L MC-LR). Toxin oxidation
rates were similar or faster than cell lysis rates in ultrapure water. This work presents much
needed unit Microcystis aeruginosa cellular chlorine demand (5.6±0.2 pgCl2/cell) which could be
used to adjust the chlorination capacity to satisfy the total chlorine demand associated with the
presence of cells. Furthermore, a novel successive reaction kinetics model is developed using the
kinetics of the chlorine reaction with cyanobacterial cells and cell-bound toxins. Chlorination of
dense cell suspensions (500,000 cells/mL) in ultrapure water at CT up to 3051 mg.min/L resulted
in modest concentrations of trihalomethanes (13 μg/L) and haloacetic acids (below detection
limit).
Keywords: Cyanobacteria, cyanotoxins, chlorination kinetics, chlorine demand, disinfection by-
products

57
1. Introduction
Toxic cyanobacteria have been increasingly detected in drinking water sources and treated water
(Lahti et al. 2001; Zamyadi, MacLeod et al. 2012). Microcystins (MCs) are a commonly found
cyanotoxin with over 60 known analogous including Microcystin-LR (MC-LR) (Fischer et al.
2001; Svrcek and Smith 2004; Merel et al. 2009) (Supporting information Table SI-S1, Figure
SI-S2 and Table SI-S3). Microcystis aeruginosa is one of the main cyanobacteria species
producing these hepatotoxins and freshwater M. aeruginosa proliferation events have been
observed worldwide (Svrcek and Smith 2004). The concentration of MCs in drinking water is
regulated by different water authorities across the globe (Newcombe et al. 2010) including
provisional World Health Organization (WHO) guideline limit of 1 µg/L of MC-LR for safe
drinking water (Chorus and Bartram 1999). WHO recommends that in water containing MCs
producing cyanobacteria, the MC-LR guideline value should be applied to the total cell-bound
and extracellular MCs.
Recent intensive monitoring of cyanobacterial cells inside drinking water treatment plants
(DWTPs) in Quebec (Canada) has evidenced the breakthrough and accumulation of toxic cells,
with a dominance of MCs producing M. aeruginosa (McQuaid et al. 2011; Zamyadi, MacLeod et
al. 2012; Zamyadi, McQuaid et al. 2012). Release of cyanotoxins can occur during conventional
clarification by sedimentation and filtration over sand/anthracite processes and post-oxidation,
most often chlorination, constitute an essential barrier against dissolved and cell-bound
cyanotoxins to prevent cell and toxin breakthrough into drinking water (Pietsch et al. 2002;
Schmidt et al. 2002; Schmidt and Konopka 2009; Schmidt, Petzoldt et al. 2009; Janjaroen et al.
2010; Zamyadi, MacLeod et al. 2012). Furthermore, direct chlorination of raw water or inter-
chlorination are still practiced in many North American water treatment plants. If (pre-, inter-
and/or post-) chlorination is conducted on water containing significant concentrations of
cyanobacteria, it can lead to several water quality problems, e.g. cell damage and the subsequent
release of cell-bound toxins, increased chlorine demand, dissolved organic carbon (DOC) release
and elevated chlorination by-products (DBP) formation (Merel et al. 2010; Zamyadi et al. 2010).
However, it may constitute a viable temporary treatment option if it is proven to be effective for
removal of cell-bound and dissolved toxins, while not adversely affecting other water quality
parameters. Therefore, operators of DWTP need to understand the limitations of pre-and post
chlorination of M. aeruginosa cells and their associated toxins.

58
Chlorination is highly efficient for the oxidation of major dissolved MCs analogues under various
water quality conditions and its kinetics can be predicted (Acero et al. 2005; Ho, et al. 2006;
Acero et al. 2008; Merel et al. 2010; Zamyadi et al. 2012). Chlorine concentration and the contact
time are the key factors in the confident application of chlorine for oxidation. The appropriate
degree of oxidation is obtained using the concept of concentration multiplied by time, chlorine
exposure, or CT. The CT value is calculated by determining the area under a graph of chlorine
concentration versus time (Ho et al. 2006). The degree of cell-bound and extracellular MCs
chlorination can be predicted by quantifying the rates of cell lysis, MCs release, and MCs
oxidation under given water quality conditions (Daly et al. 2007).
Early laboratory testing suggested that doses required to maintain a residual in the distribution
system (0.5 mg/L after 30 minutes of contact) at water temperatures ~20 ℃ with pH values under
8, resulted in the oxidation of total MCs below detection limits (Newcombe and Nicholson 2004).
Chlorination was also found to be highly efficient to oxidize M. aeruginosa cells and
subsequently cell-bound MCs using elevated concentrations of laboratory cultured cells (3×10⁵–
1×10⁶ cells/mL) in natural water. Although cell bound toxin release was generally rapid and
overall total toxin removal exceeded 90%, residual toxin concentrations ranging from 0.5 to 33
µg/L remained after CT exposures varying from ~0.7 to ~33.4 mg.min/L Cl2 (Daly et al. 2007;
Merel et al. 2010). More recently, the cell integrity of high concentrations (1.9×10⁵–4.3×10
6
cells/mL) of laboratory grown cyanobacteria and natural blooms subjected to chlorination was
investigated (Lin et al. 2009). These results suggest that laboratory grown M. aeruginosa in
natural water may be more resistant to cell damage by chlorination than Anabaena circinalis and
that small M. aeruginosa colonies from natural blooms were more resistant than single cell
suspensions from laboratory cultures. Finally these authors also report limited oxidation of the
low concentration of dissolved and cell-bound MC-LRequi from a natural bloom.
Most laboratory based results converge in support of a predictable 92 rapid loss of cell integrity
and subsequent release and oxidation of dissolved and cell-bound toxins that can be described by
first-order apparent rate constants with respect to chlorine exposure. The toxin oxidation rate
constants calculated from spiked dissolved conditions in ultrapure water are significantly higher
(2-24×) than those estimated from the chlorination of released cell-bound toxins from cells
suspensions (Daly et al. 2007). More modest differences (1.2-1.5×) in rates have been reported
using lower cell densities of Anabaena circinalis for cell bound saxitoxin and of M.

59
aeruginosafor cell-bound MCs (Zamyadi et al. 2010; Zamyadi, Ho et al. 2012). However, the
efficacy of the oxidation of released cell-bound toxins from natural blooms has been recently
questioned in light of limited reports showing higher cyanobacteria cell resistance and poor
oxidation of dissolved toxins in the presence of damaged cells (Zamyadi, MacLeod et al. 2012).
Furthermore, prudent operation of the chlorination process in DWTP requires the knowledge of
M. aeruginosa cellular chlorine demand, which is currently undetermined. This information is
essential to ensure that sufficient chlorine capacity is present during peak cell concentration
events.
It has been suggested that the chlorine demand of cyanobacteria cell-bound compounds and the
consequent DBP formation potentials varies (Bond et al. 2009). Release of cell-bound
compounds due to autolysis of cells is classified as extracellular organic matter (EOM) while
those released from compromised cells is categorized as internal organic matter (IOM) (Fang et
al. 2011). EOM and/or IOM could contribute to the formation of DBPs, e.g. trihalomethanes
(THM) and haloacetic acids (HAA), due to the reaction of released material with chlorine
(Hureiki al. 1994; Bond et al. 2009). Published results on the DBP formation potentials of IOM
and EOM from cellular suspensions under chlorination are contradictory, reflecting differences in
testing conditions especially chlorine dosage, growth phase, species and culture conditions.
Significant DBP formation (e.g. total THM yields of 67-269 μg/L) has been reported in
connection to reactive carbon associated with high cell numbers and their EOM (Graham et al.
1998; Huang et al. 2009; Zamyadi, Ho et al. 2012). However, chlorination of approximately
46,000 cells/mL of Anabaena circinalis cells in natural water (complete cell damage and
oxidation of produced saxitoxins to below detection limit) with a CT of 50.3 mg.min/L only
caused a modest increase of 9 μg/L of total THM (TTHM) and 3 μg/L of HAA9 compared to the
control assay (chlorination of natural water without cyanobacteria cells) (Zamyadi et al. 2010).
Systematic studies are needed to better quantify the chlorine demand per cell and DBP formation
associated with cell materials in conditions representative of DWTP operation. The objectives of
this research were: (1) to determine and to model the M. aeruginosa cells lysis, toxins and DOC
release, and MCs oxidation during chlorination of ultrapure and natural water spiked with
laboratory cultures; (2) to estimate the M. aeruginosa cellular chlorine demand when cell lysis
occur due to chlorination; and (3) to study the DBP formation associated with the chlorination of
M. aeruginosa cell-bound materials.

60
2. Material and Methods
2.1. Materials and Reagents
A toxic strain of M. aeruginosa, isolated from Pretzlaff Pond, Alberta, Canada, was cultured in
the laboratory in artificial seawater medium (ASM-1 – Table SI-S4) (Gorhamet al. 1964). ASM-1
media (20 L) was sterilized at 120oC, and then after pH adjustment, inoculated with an ASM-1
grown culture in stationary phase. The culture was incubated at 26oC under 6 hours rotating
light-darkness flux at light intensity of 70 μmol s-1 m-2. All chemicals and reagents used for
analytical methods calibration were laboratory analytical grade from various suppliers.
2.2. Water Source and Quality
Water was sourced from the Mille-Île River (MIR) in Quebec, Canada. Samples were collected
from the St-Rose DWTP intake prior to any treatment. Untreated MIR water was filtered over
pre-rinsed Binder-free glass microfiber 1.2 μm filter (GF/C - Whatman, UK) prior to inoculation
with the culture. The water had a DOC concentration of 6.3 mg/L, UV absorbance (at 254 nm) of
0.191 cm-1, specific UV absorbance of 3.0 L/mg/m, pH of 7.4, and an alkalinity of 19 mg/L as
CaCO3. Ultrapure water (Millipore Pty Ltd, USA) was also used for selected experiments. Prior
to DOC analyses, samples were passed through pre-rinsed (1L ultrapure water) 0.45μm cellulose
nitrate Supor®-450 membrane filters (PALL Life Sciences, USA). DOC measurements were
made using a 5310C total organic carbon analyzer (Sievers Instruments Inc., USA). pH was
measuredusing a Fisher Scientific pH meter (Accumet, Fisher Scientific Instruments, USA)
which was calibrated with pH 4, 7 and 10 standard buffers (Fisher, USA).
2.3. Chlorination experiments
Chlorine stock and chlorine residual concentrations were determined using the DPD-FAS
titration method described in Standard Methods (American Public Health Association Three
separate chlorination experiments were conducted as: (1st
Cl2 Exp) MCs producing M.
aeruginosa suspensions in ultrapure water; (2nd
Cl2 Exp) M. aeruginosa suspensions in MIR
water; and (3rd
Cl2 Exp) cell-bound M. aeruginosa cellular material in ultrapure water. Each
chlorination experiment was preceded by a chlorine decay experiment. For chlorine decay
experiments, water samples were dosed with desired chlorine concentration and triplicate
samples were taken at specified contact times for free chlorine residual determinations using the

61
titration method. All chlorination experiments were conducted in triplicate in brown amber
bottles at room temperature (20±2 ℃).
Cultured M. aeruginosa cells were enumerated on a compound microscope in a Sedgewick-
Rafter counting chamber after preservation in Lugol’s iodine (Cooperative Research Centre for
Freshwater Ecology (CRCFE) 1999). Required volume of stationary phase culture to be spiked in
ultrapure and MIR water to achieve desired cell suspension was adjusted based on the culture cell
number. The number of cells in water samples after inoculation was confirmed by microscopic
enumeration. Detection of cell auto fluorescence using fluorescence microscopy was used to
assess cell integrity. Healthy cells will emit bright red fluorescence when irradiated with green
excitation light (Nancharaih et al. 2007). Control (non-chlorinated) water samples showed no
sign of cell integrity loss due to direct addition of cells to ultrapure and MIR water (data not
shown) similar to results from Zamyadi et al. (2010). All chlorination experiments regardless of
water quality parameters were conducted with a chlorine residual after 60 minutes of contact.
1st
Cl2 Exp: These experiments were conducted in ultrapure water buffered 183 at pH 8 with
phosphate (0.01M) (American Public Health Association 2005). Chlorine was added from the
chlorine stock solution to obtain the Cl2 doses of 2, 3 and 4.5 mg/L for M. aeruginosa
suspensions of 60,000 (±2%), 250,000 (±4%) and 500,000 (±4%) cells/mL, respectively. Samples
were quenched at specified contact times with sodium thiosulphate at a stoichiometric ratio
specified in Standard Methods (American Public Health Association 2005). Quenched samples
were taken for DOC measurement. To determine the cell lysis due to chlorination total cell
counts (microscopic counts in triplicate) were conducted on 2 mL samples preserved with
Lugol’s iodine (Cooperative Research Centre for Freshwater Ecology (CRCFE) 1999).
Remaining quenched water samples were divided in two subsamples of 250mL: the first
subsample was immediately filtered through 0.45 μm filter (Whatman, UK) to remove cellular
material, and then analyzed for extracellular MCs. The second subsample was subjected to three
freeze–thaw cycles before filtration over 0.45 μm filters to analyze for total MCs (both the cell-
bound and extracellular compounds). During each freeze-thaw cycle, samples were frozen at -25
and then they were thawed by exposing the well sealed sample containers to 5oC water. Samples
were always kept in the dark. Pre-tests were conducted to confirm the efficiency of freeze-thaw
procedure to release cell-bound toxins. The entire cell-bound toxins were released after the
second cycle and the third cycle was conducted to be on the safe side. For all MCs analysis,
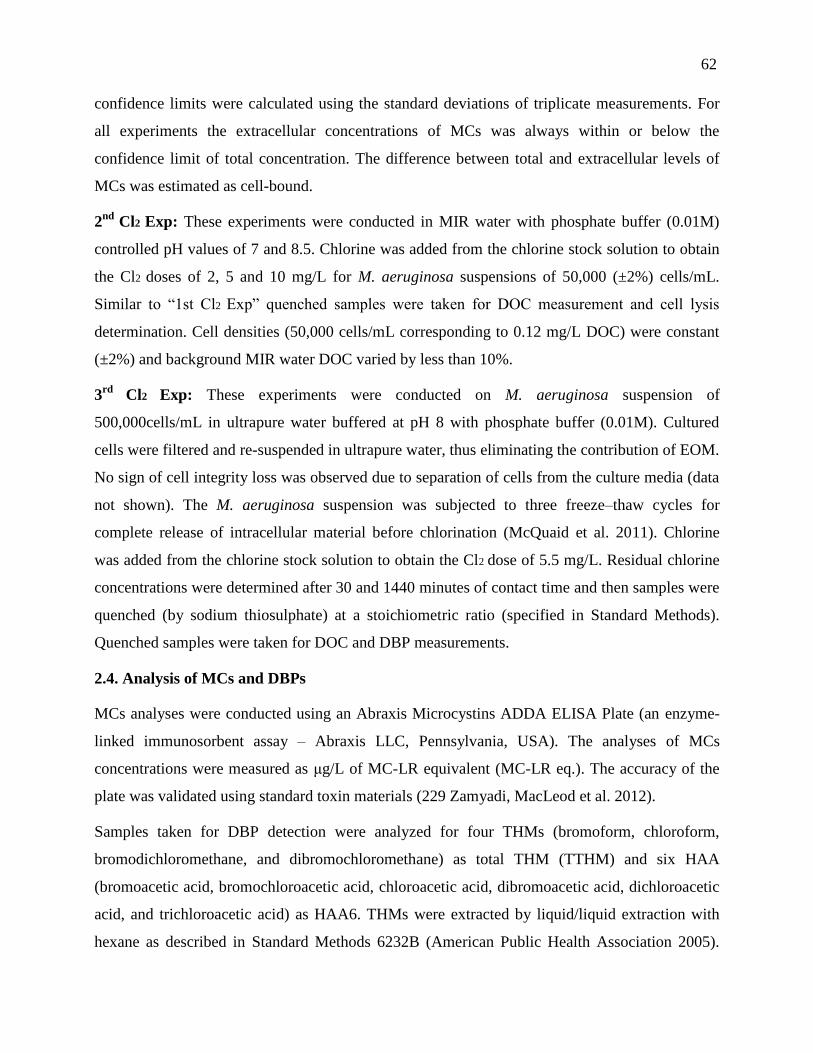
62
confidence limits were calculated using the standard deviations of triplicate measurements. For
all experiments the extracellular concentrations of MCs was always within or below the
confidence limit of total concentration. The difference between total and extracellular levels of
MCs was estimated as cell-bound.
2nd
Cl2 Exp: These experiments were conducted in MIR water with phosphate buffer (0.01M)
controlled pH values of 7 and 8.5. Chlorine was added from the chlorine stock solution to obtain
the Cl2 doses of 2, 5 and 10 mg/L for M. aeruginosa suspensions of 50,000 (±2%) cells/mL.
Similar to “1st Cl2 Exp” quenched samples were taken for DOC measurement and cell lysis
determination. Cell densities (50,000 cells/mL corresponding to 0.12 mg/L DOC) were constant
(±2%) and background MIR water DOC varied by less than 10%.
3rd
Cl2 Exp: These experiments were conducted on M. aeruginosa suspension of
500,000cells/mL in ultrapure water buffered at pH 8 with phosphate buffer (0.01M). Cultured
cells were filtered and re-suspended in ultrapure water, thus eliminating the contribution of EOM.
No sign of cell integrity loss was observed due to separation of cells from the culture media (data
not shown). The M. aeruginosa suspension was subjected to three freeze–thaw cycles for
complete release of intracellular material before chlorination (McQuaid et al. 2011). Chlorine
was added from the chlorine stock solution to obtain the Cl2 dose of 5.5 mg/L. Residual chlorine
concentrations were determined after 30 and 1440 minutes of contact time and then samples were
quenched (by sodium thiosulphate) at a stoichiometric ratio (specified in Standard Methods).
Quenched samples were taken for DOC and DBP measurements.
2.4. Analysis of MCs and DBPs
MCs analyses were conducted using an Abraxis Microcystins ADDA ELISA Plate (an enzyme-
linked immunosorbent assay – Abraxis LLC, Pennsylvania, USA). The analyses of MCs
concentrations were measured as μg/L of MC-LR equivalent (MC-LR eq.). The accuracy of the
plate was validated using standard toxin materials (229 Zamyadi, MacLeod et al. 2012).
Samples taken for DBP detection were analyzed for four THMs (bromoform, chloroform,
bromodichloromethane, and dibromochloromethane) as total THM (TTHM) and six HAA
(bromoacetic acid, bromochloroacetic acid, chloroacetic acid, dibromoacetic acid, dichloroacetic
acid, and trichloroacetic acid) as HAA6. THMs were extracted by liquid/liquid extraction with
hexane as described in Standard Methods 6232B (American Public Health Association 2005).
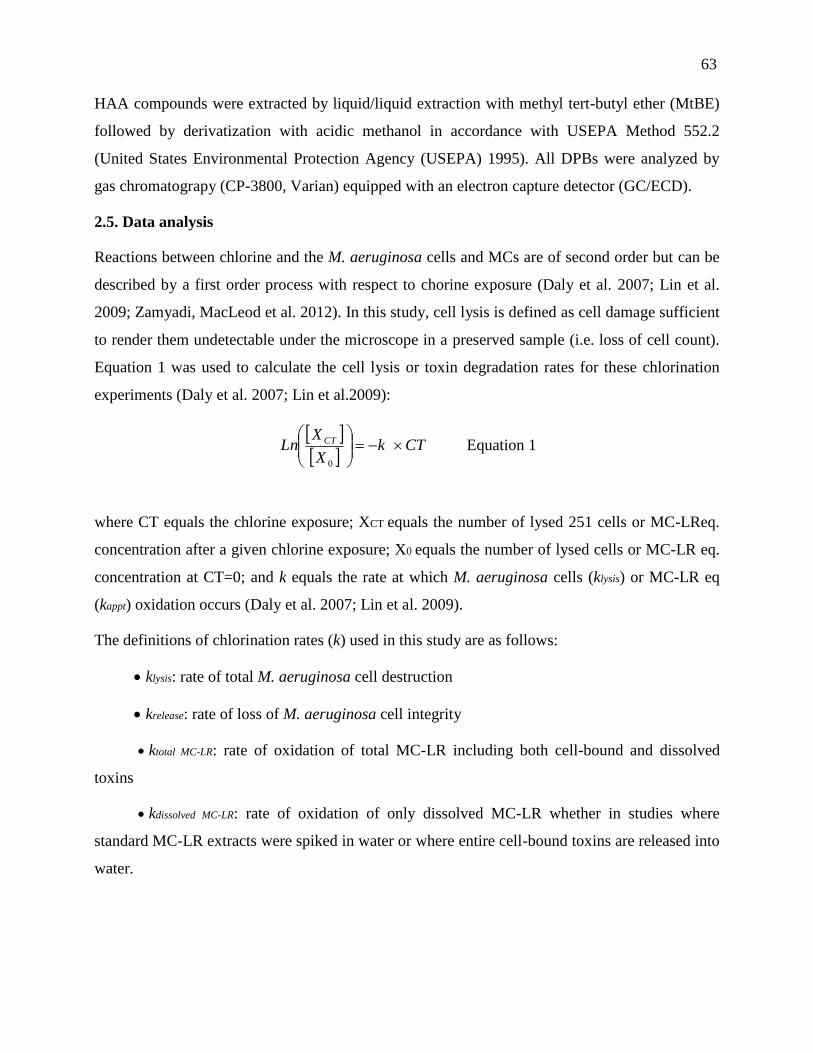
63
HAA compounds were extracted by liquid/liquid extraction with methyl tert-butyl ether (MtBE)
followed by derivatization with acidic methanol in accordance with USEPA Method 552.2
(United States Environmental Protection Agency (USEPA) 1995). All DPBs were analyzed by
gas chromatograpy (CP-3800, Varian) equipped with an electron capture detector (GC/ECD).
2.5. Data analysis
Reactions between chlorine and the M. aeruginosa cells and MCs are of second order but can be
described by a first order process with respect to chorine exposure (Daly et al. 2007; Lin et al.
2009; Zamyadi, MacLeod et al. 2012). In this study, cell lysis is defined as cell damage sufficient
to render them undetectable under the microscope in a preserved sample (i.e. loss of cell count).
Equation 1 was used to calculate the cell lysis or toxin degradation rates for these chlorination
experiments (Daly et al. 2007; Lin et al.2009):
CTkX
XLn CT
0
Equation 1
where CT equals the chlorine exposure; XCT equals the number of lysed 251 cells or MC-LReq.
concentration after a given chlorine exposure; X0 equals the number of lysed cells or MC-LR eq.
concentration at CT=0; and k equals the rate at which M. aeruginosa cells (klysis) or MC-LR eq
(kappt) oxidation occurs (Daly et al. 2007; Lin et al. 2009).
The definitions of chlorination rates (k) used in this study are as follows:
klysis: rate of total M. aeruginosa cell destruction
krelease: rate of loss of M. aeruginosa cell integrity
ktotal MC-LR: rate of oxidation of total MC-LR including both cell-bound and dissolved
toxins
kdissolved MC-LR: rate of oxidation of only dissolved MC-LR whether in studies where
standard MC-LR extracts were spiked in water or where entire cell-bound toxins are released into
water.
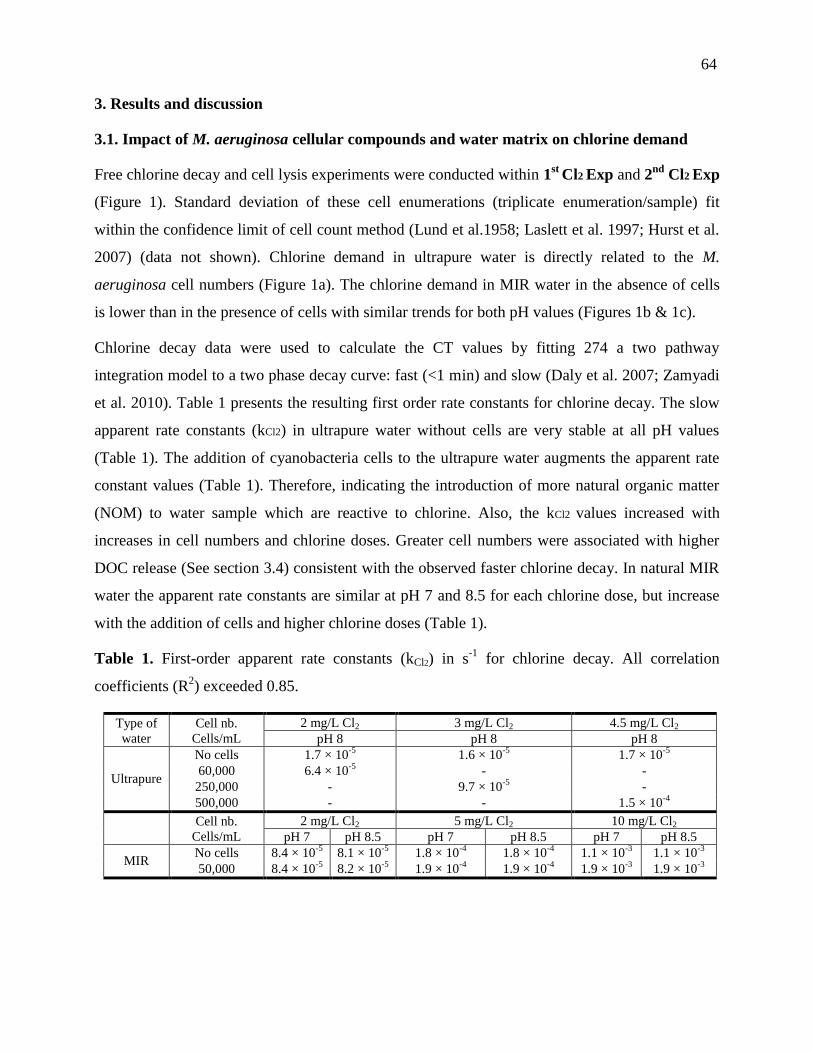
64
3. Results and discussion
3.1. Impact of M. aeruginosa cellular compounds and water matrix on chlorine demand
Free chlorine decay and cell lysis experiments were conducted within 1st
Cl2 Exp and 2nd
Cl2 Exp
(Figure 1). Standard deviation of these cell enumerations (triplicate enumeration/sample) fit
within the confidence limit of cell count method (Lund et al.1958; Laslett et al. 1997; Hurst et al.
2007) (data not shown). Chlorine demand in ultrapure water is directly related to the M.
aeruginosa cell numbers (Figure 1a). The chlorine demand in MIR water in the absence of cells
is lower than in the presence of cells with similar trends for both pH values (Figures 1b & 1c).
Chlorine decay data were used to calculate the CT values by fitting 274 a two pathway
integration model to a two phase decay curve: fast (<1 min) and slow (Daly et al. 2007; Zamyadi
et al. 2010). Table 1 presents the resulting first order rate constants for chlorine decay. The slow
apparent rate constants (kCl2) in ultrapure water without cells are very stable at all pH values
(Table 1). The addition of cyanobacteria cells to the ultrapure water augments the apparent rate
constant values (Table 1). Therefore, indicating the introduction of more natural organic matter
(NOM) to water sample which are reactive to chlorine. Also, the kCl2 values increased with
increases in cell numbers and chlorine doses. Greater cell numbers were associated with higher
DOC release (See section 3.4) consistent with the observed faster chlorine decay. In natural MIR
water the apparent rate constants are similar at pH 7 and 8.5 for each chlorine dose, but increase
with the addition of cells and higher chlorine doses (Table 1).
Table 1. First-order apparent rate constants (kCl2) in s-1
for chlorine decay. All correlation
coefficients (R2) exceeded 0.85.
Type of
water
Cell nb.
Cells/mL
2 mg/L Cl2 3 mg/L Cl2 4.5 mg/L Cl2
pH 8 pH 8 pH 8
Ultrapure
No cells 1.7 × 10⁻⁵
1.6 × 10⁻⁵
1.7 × 10⁻⁵
60,000 6.4 × 10⁻⁵
- -
250,000 - 9.7 × 10⁻⁵
-
500,000 - - 1.5 × 10⁻⁴
Cell nb.
Cells/mL
2 mg/L Cl2 5 mg/L Cl2 10 mg/L Cl2
pH 7 pH 8.5 pH 7 pH 8.5 pH 7 pH 8.5
MIR No cells 8.4 × 10
-5 8.1 × 10
-5 1.8 × 10
-4 1.8 × 10
-4 1.1 × 10
-3 1.1 × 10
-3
50,000 8.4 × 10⁻⁵
8.2 × 10⁻⁵
1.9 × 10⁻⁴
1.9 × 10⁻⁴
1.9 × 10⁻³
1.9 × 10⁻³
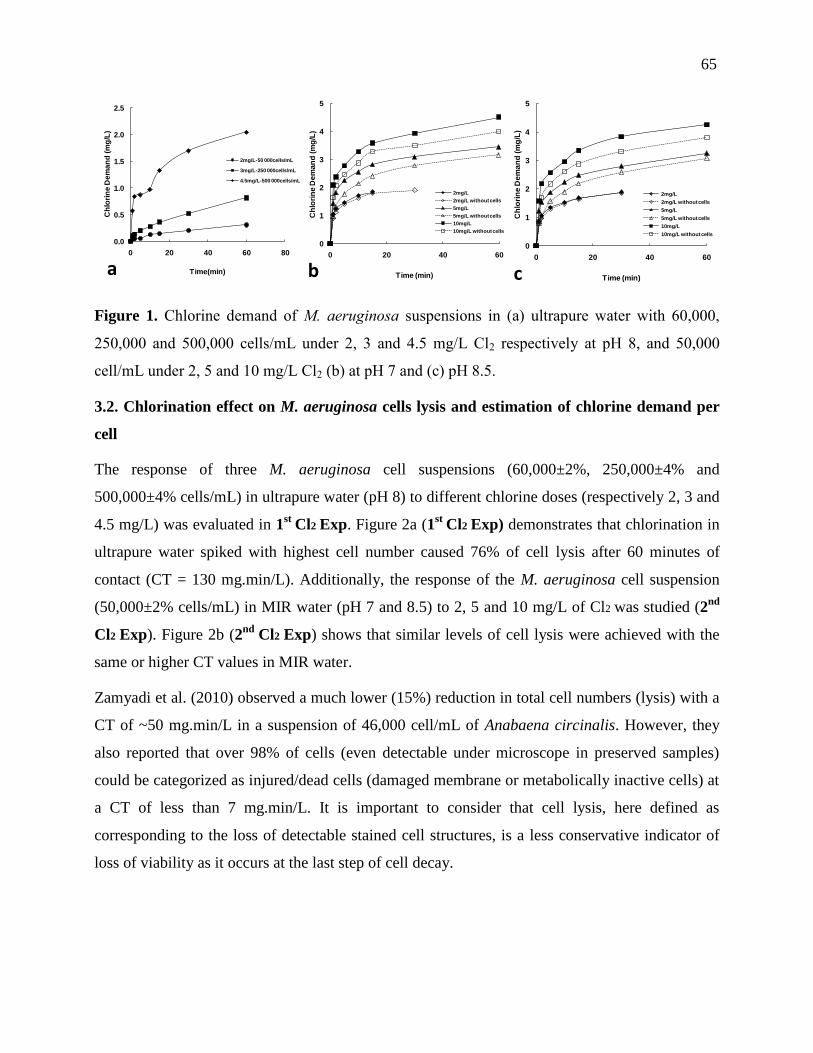
65
Figure 1. Chlorine demand of M. aeruginosa suspensions in (a) ultrapure water with 60,000,
250,000 and 500,000 cells/mL under 2, 3 and 4.5 mg/L Cl2 respectively at pH 8, and 50,000
cell/mL under 2, 5 and 10 mg/L Cl2 (b) at pH 7 and (c) pH 8.5.
3.2. Chlorination effect on M. aeruginosa cells lysis and estimation of chlorine demand per
cell
The response of three M. aeruginosa cell suspensions (60,000±2%, 250,000±4% and
500,000±4% cells/mL) in ultrapure water (pH 8) to different chlorine doses (respectively 2, 3 and
4.5 mg/L) was evaluated in 1st
Cl2 Exp. Figure 2a (1st
Cl2 Exp) demonstrates that chlorination in
ultrapure water spiked with highest cell number caused 76% of cell lysis after 60 minutes of
contact (CT = 130 mg.min/L). Additionally, the response of the M. aeruginosa cell suspension
(50,000±2% cells/mL) in MIR water (pH 7 and 8.5) to 2, 5 and 10 mg/L of Cl2 was studied (2nd
Cl2 Exp). Figure 2b (2nd
Cl2 Exp) shows that similar levels of cell lysis were achieved with the
same or higher CT values in MIR water.
Zamyadi et al. (2010) observed a much lower (15%) reduction in total cell numbers (lysis) with a
CT of ~50 mg.min/L in a suspension of 46,000 cell/mL of Anabaena circinalis. However, they
also reported that over 98% of cells (even detectable under microscope in preserved samples)
could be categorized as injured/dead cells (damaged membrane or metabolically inactive cells) at
a CT of less than 7 mg.min/L. It is important to consider that cell lysis, here defined as
corresponding to the loss of detectable stained cell structures, is a less conservative indicator of
loss of viability as it occurs at the last step of cell decay.
0.0
0.5
1.0
1.5
2.0
2.5
0 20 40 60 80
Ch
lori
ne
De
ma
nd
(m
g/L
)
Time(min)
2mg/L-50 000cells/mL
3mg/L-250 000cells/mL
4.5mg/L-500 000cells/mL
0
1
2
3
4
5
0 20 40 60
Ch
lori
ne
De
ma
nd
(m
g/L
)
Time (min)
2mg/L
2mg/L without cells
5mg/L
5mg/L without cells
10mg/L
10mg/L without cells
0
1
2
3
4
5
0 20 40 60
Ch
lori
ne
De
ma
nd
(m
g/L
)
Time (min)
2mg/L
2mg/L without cells
5mg/L
5mg/L without cells
10mg/L
10mg/L without cells
a b c
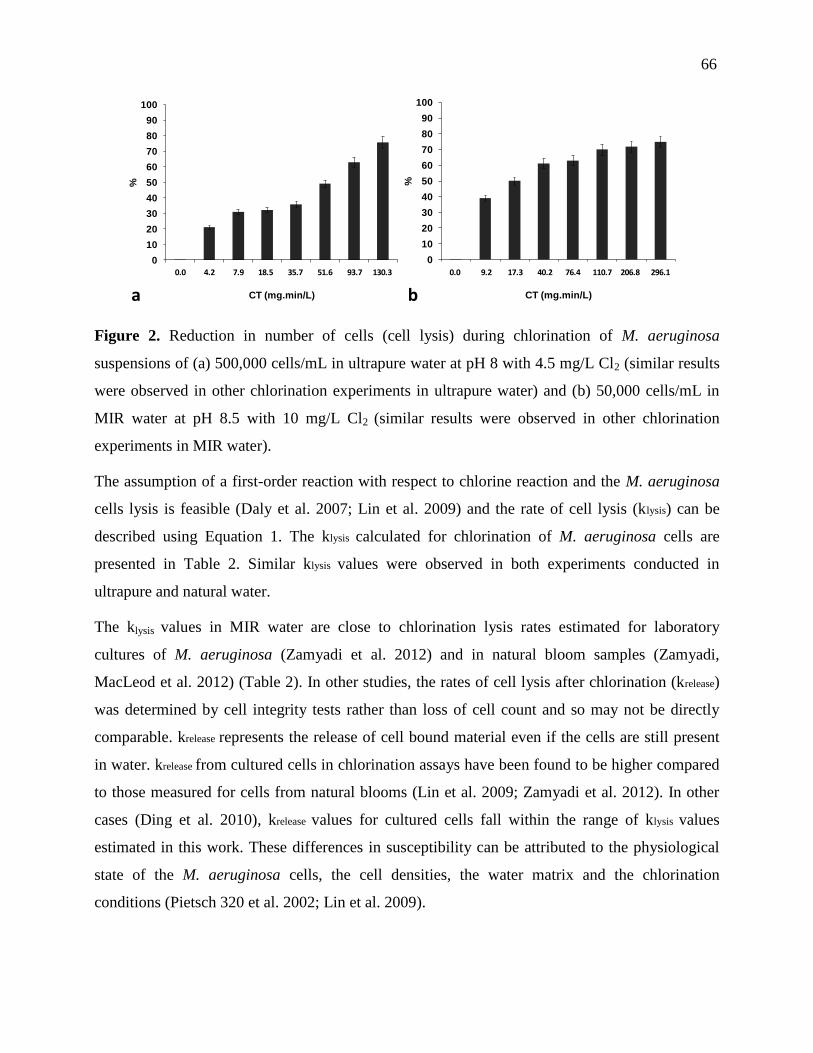
66
Figure 2. Reduction in number of cells (cell lysis) during chlorination of M. aeruginosa
suspensions of (a) 500,000 cells/mL in ultrapure water at pH 8 with 4.5 mg/L Cl2 (similar results
were observed in other chlorination experiments in ultrapure water) and (b) 50,000 cells/mL in
MIR water at pH 8.5 with 10 mg/L Cl2 (similar results were observed in other chlorination
experiments in MIR water).
The assumption of a first-order reaction with respect to chlorine reaction and the M. aeruginosa
cells lysis is feasible (Daly et al. 2007; Lin et al. 2009) and the rate of cell lysis (klysis) can be
described using Equation 1. The klysis calculated for chlorination of M. aeruginosa cells are
presented in Table 2. Similar klysis values were observed in both experiments conducted in
ultrapure and natural water.
The klysis values in MIR water are close to chlorination lysis rates estimated for laboratory
cultures of M. aeruginosa (Zamyadi et al. 2012) and in natural bloom samples (Zamyadi,
MacLeod et al. 2012) (Table 2). In other studies, the rates of cell lysis after chlorination (krelease)
was determined by cell integrity tests rather than loss of cell count and so may not be directly
comparable. krelease represents the release of cell bound material even if the cells are still present
in water. krelease from cultured cells in chlorination assays have been found to be higher compared
to those measured for cells from natural blooms (Lin et al. 2009; Zamyadi et al. 2012). In other
cases (Ding et al. 2010), krelease values for cultured cells fall within the range of klysis values
estimated in this work. These differences in susceptibility can be attributed to the physiological
state of the M. aeruginosa cells, the cell densities, the water matrix and the chlorination
conditions (Pietsch 320 et al. 2002; Lin et al. 2009).
0
10
20
30
40
50
60
70
80
90
100
0.00 53.40
%
CT (mg.min/L)
0
10
20
30
40
50
60
70
80
90
100
0.00 111.81
%
CT (mg.min/L)a b
0.0 4.2 7.9 18.5 35.7 51.6 93.7 130.3 0.0 9.2 17.3 40.2 76.4 110.7 206.8 296.1

67
M. aeruginosa cellular chlorine demand per cell can be estimated from the lysis of M. aeruginosa
suspensions in ultrapure water in the presence of chlorine residual (Figures 1 and 2a). The
cumulative chlorine demand after 60 minutes of contact per number of lysed cells is similar
(5.6±0.2 pgCl2/cell) for each of the three experiments conducted in ultrapure water, suggesting
that cell numbers can be used to estimate the cellular chorine demand. This novel information of
unit cellular chlorine demand can help DWTP operators estimate if their chlorination capacity is
sufficient to satisfy the total chlorine demand associated with the presence of cyanobacteria.
However, since these estimations were obtained on unicellular laboratory cultures, validation of
these observations in the presence of cyanobacterial colonies appears desirable.
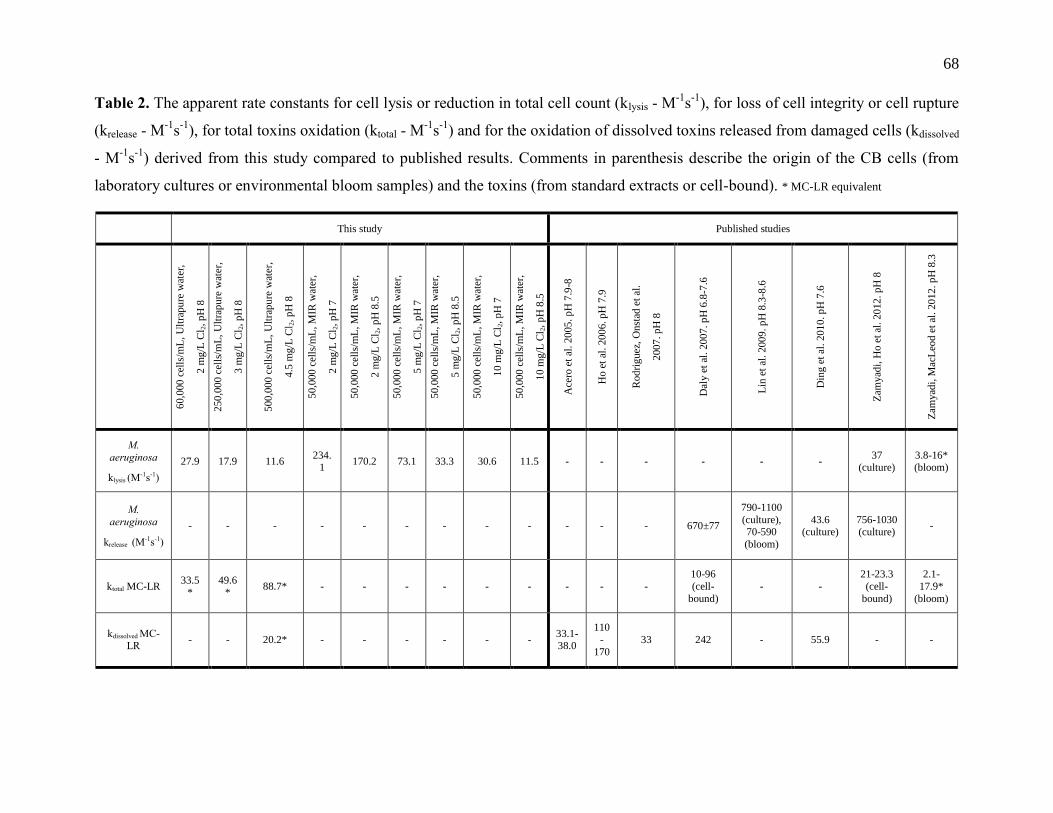
68
Table 2. The apparent rate constants for cell lysis or reduction in total cell count (klysis - M-1
s-1
), for loss of cell integrity or cell rupture
(krelease - M-1
s-1
), for total toxins oxidation (ktotal - M-1
s-1
) and for the oxidation of dissolved toxins released from damaged cells (kdissolved
- M-1
s-1
) derived from this study compared to published results. Comments in parenthesis describe the origin of the CB cells (from
laboratory cultures or environmental bloom samples) and the toxins (from standard extracts or cell-bound). * MC-LR equivalent
This study Published studies
60,0
00
cel
ls/m
L,
Ult
rapu
re w
ater
,
2 m
g/L
Cl 2
, p
H 8
250
,00
0 c
ells
/mL
, U
ltra
pu
re w
ater
,
3 m
g/L
Cl 2
, p
H 8
500
,00
0 c
ells
/mL
, U
ltra
pu
re w
ater
,
4.5
mg
/L C
l 2, p
H 8
50,0
00
cel
ls/m
L, M
IR w
ater
,
2 m
g/L
Cl 2
, p
H 7
50,0
00
cel
ls/m
L, M
IR w
ater
,
2 m
g/L
Cl 2
, p
H 8
.5
50,0
00
cel
ls/m
L, M
IR w
ater
,
5 m
g/L
Cl 2
, p
H 7
50,0
00
cel
ls/m
L, M
IR w
ater
,
5 m
g/L
Cl 2
, p
H 8
.5
50,0
00
cel
ls/m
L, M
IR w
ater
,
10 m
g/L
Cl 2
, p
H 7
50,0
00
cel
ls/m
L, M
IR w
ater
,
10 m
g/L
Cl 2
, p
H 8
.5
Ace
ro e
t al
. 20
05
. p
H 7
.9-8
Ho
et
al. 200
6. p
H 7
.9
Rod
rig
uez
, O
nst
ad e
t al
.
2007
. p
H 8
Dal
y e
t al
. 20
07
. p
H 6
.8-7
.6
Lin
et
al. 200
9. p
H 8
.3-8
.6
Din
g e
t al
. 201
0. p
H 7
.6
Zam
yad
i, H
o e
t al
. 20
12
. p
H 8
Zam
yad
i, M
acL
eod e
t al
. 20
12
. p
H 8
.3
M.
aeruginosa
klysis (M-1s-1)
27.9 17.9 11.6 234.
1 170.2 73.1 33.3 30.6 11.5 - - - - - -
37 (culture)
3.8-16* (bloom)
M.
aeruginosa
krelease (M-1s-1)
- - - - - - - - - - - - 670±77
790-1100
(culture), 70-590
(bloom)
43.6 (culture)
756-1030 (culture)
-
ktotal MC-LR 33.5
* 49.6
* 88.7* - - - - - - - - -
10-96
(cell-
bound)
- -
21-23.3
(cell-
bound)
2.1-
17.9*
(bloom)
kdissolved MC-LR
- - 20.2* - - - - - - 33.1- 38.0
110
-
170
33 242 - 55.9 - -
69
3.3. Impact of chlorination on cell-bound MCs release and oxidation and modeling
Figure 3 shows the release and oxidation of cell-bound MCs (MC-LR eq.) in ultrapure water for
the M. aeruginosa suspensions of 60,000, 250,000 and 500,000 cells/mL. Complete toxin release
and oxidation of toxins to below the WHO guideline value (1 μg/L MC-LR for DW) was
observed with a CT of 100 mg.min/L (Figure 3). The observed toxins release and oxidation
(Figure 3) also agree with cell lysis (Figure 2a). Kinetics models can express the chlorination of
released cell-bound and dissolved MCs (Daly et al. 2007; Rodriguez et al. 2007; Lin et al. 2009).
Rate constants (ktotal) for the oxidation of total MC-LR eq. in ultrapure water can be derived using
Equation 1. ktotal represents the combined rate of the release of cell-bound toxins due to 342 cell
lysis and the oxidation of the released toxins.
When using dense suspensions of 500,000 cells/mL of M. aeruginosa in ultrapure water (Figure
3c), it is possible to estimate the rate constant for the degradation of dissolved toxins (kdissolved)
after complete release as indicated by the elevated cell lysis. This estimate of kdissolved model may
be considered as more representative of conditions of oxidation of dissolved toxins in the
presence of cellular debris, as would be the case during a bloom.
The observed apparent rate constant kdissolved from this study and previously published rate values
are listed in Table 2. Our estimate of kdissolved for MC-LR eq. is equivalent or lower than those
published for spiked toxins in ultrapure and natural waters (Acero, et al. 2005; Rodriguez et al.
2008; Ding et al. 2010). The reported values of kdissolved vary by 7.3 times with the highest values
observed in spiked natural water or in the presence of elevated densities of cells. Differences can
be explained partly by slight variations in experimental pH as the oxidation of MC-LR is more
efficient at pH values below 8 (Ho et al. 2006). This phenomenon has been attributed to the
degree of MC-LR protonation at lower pH values making it more susceptible to chlorination (Ho
et al. 2006). The impact of NOM can also be significant because of organic matter-MC
interactions or the action of highly reactive quaternary chloramines on organic matter moieties
(Ho et al. 2006).
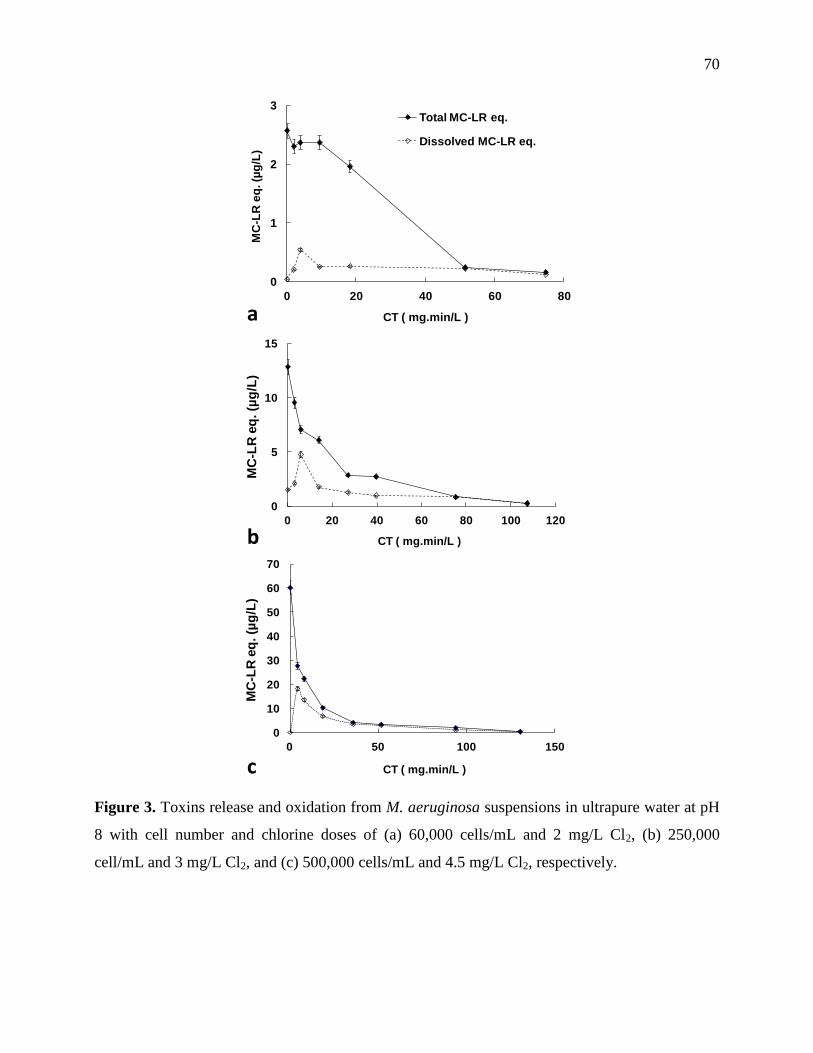
70
Figure 3. Toxins release and oxidation from M. aeruginosa suspensions in ultrapure water at pH
8 with cell number and chlorine doses of (a) 60,000 cells/mL and 2 mg/L Cl2, (b) 250,000
cell/mL and 3 mg/L Cl2, and (c) 500,000 cells/mL and 4.5 mg/L Cl2, respectively.
0
1
2
3
0 20 40 60 80
MC
-LR
eq
. (µ
g/L
)
CT ( mg.min/L )
Total MC-LR eq.
Dissolved MC-LR eq.
0
5
10
15
0 20 40 60 80 100 120
MC
-LR
eq
. (µ
g/L
)
CT ( mg.min/L )
0
10
20
30
40
50
60
70
0 50 100 150
MC
-LR
eq
. (µ
g/L
)
CT ( mg.min/L )
a
b
c
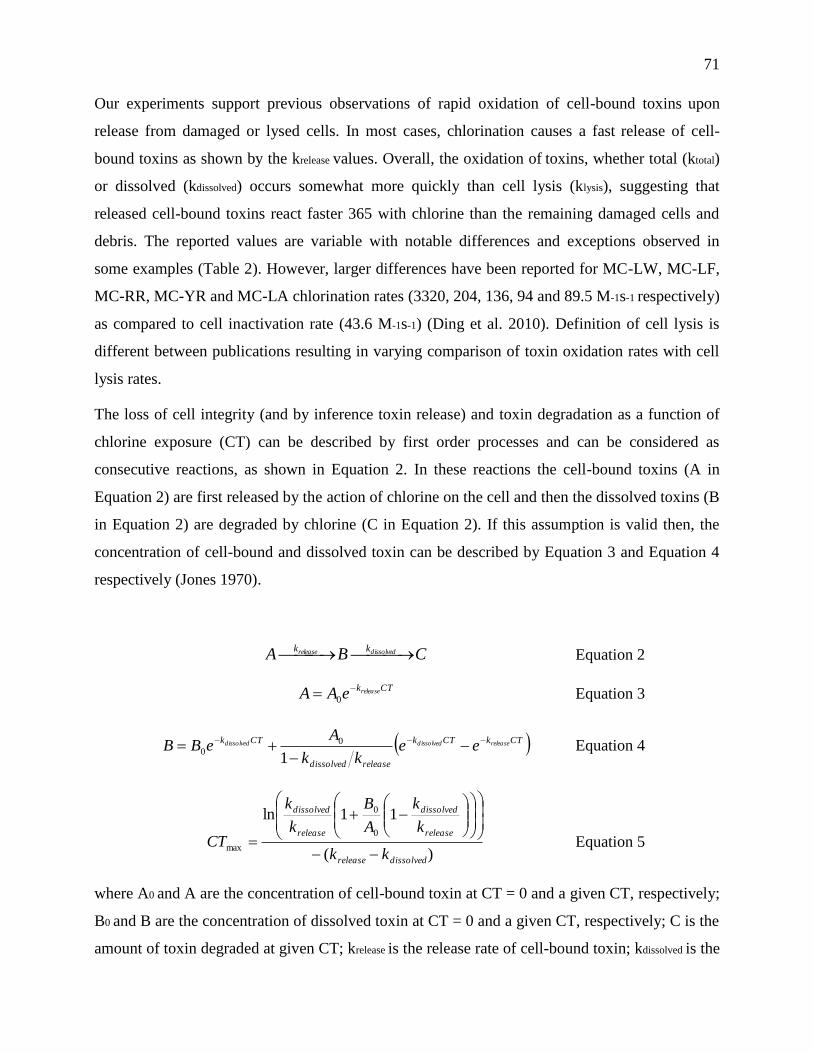
71
Our experiments support previous observations of rapid oxidation of cell-bound toxins upon
release from damaged or lysed cells. In most cases, chlorination causes a fast release of cell-
bound toxins as shown by the krelease values. Overall, the oxidation of toxins, whether total (ktotal)
or dissolved (kdissolved) occurs somewhat more quickly than cell lysis (klysis), suggesting that
released cell-bound toxins react faster 365 with chlorine than the remaining damaged cells and
debris. The reported values are variable with notable differences and exceptions observed in
some examples (Table 2). However, larger differences have been reported for MC-LW, MC-LF,
MC-RR, MC-YR and MC-LA chlorination rates (3320, 204, 136, 94 and 89.5 M-1s-1 respectively)
as compared to cell inactivation rate (43.6 M-1s-1) (Ding et al. 2010). Definition of cell lysis is
different between publications resulting in varying comparison of toxin oxidation rates with cell
lysis rates.
The loss of cell integrity (and by inference toxin release) and toxin degradation as a function of
chlorine exposure (CT) can be described by first order processes and can be considered as
consecutive reactions, as shown in Equation 2. In these reactions the cell-bound toxins (A in
Equation 2) are first released by the action of chlorine on the cell and then the dissolved toxins (B
in Equation 2) are degraded by chlorine (C in Equation 2). If this assumption is valid then, the
concentration of cell-bound and dissolved toxin can be described by Equation 3 and Equation 4
respectively (Jones 1970).
CBA dissolvedrelease kk Equation 2
CTkreleaseeAA
0 Equation 3
CTkCTk
releasedissolved
CTk releasedissolveddissolved eekk
AeBB
1
0
0 Equation 4
)(
11ln0
0
max
dissolvedrelease
release
dissolved
release
dissolved
kk
k
k
A
B
k
k
CT
Equation 5
where A0 and A are the concentration of cell-bound toxin at CT = 0 and a given CT, respectively;
B0 and B are the concentration of dissolved toxin at CT = 0 and a given CT, respectively; C is the
amount of toxin degraded at given CT; krelease is the release rate of cell-bound toxin; kdissolved is the
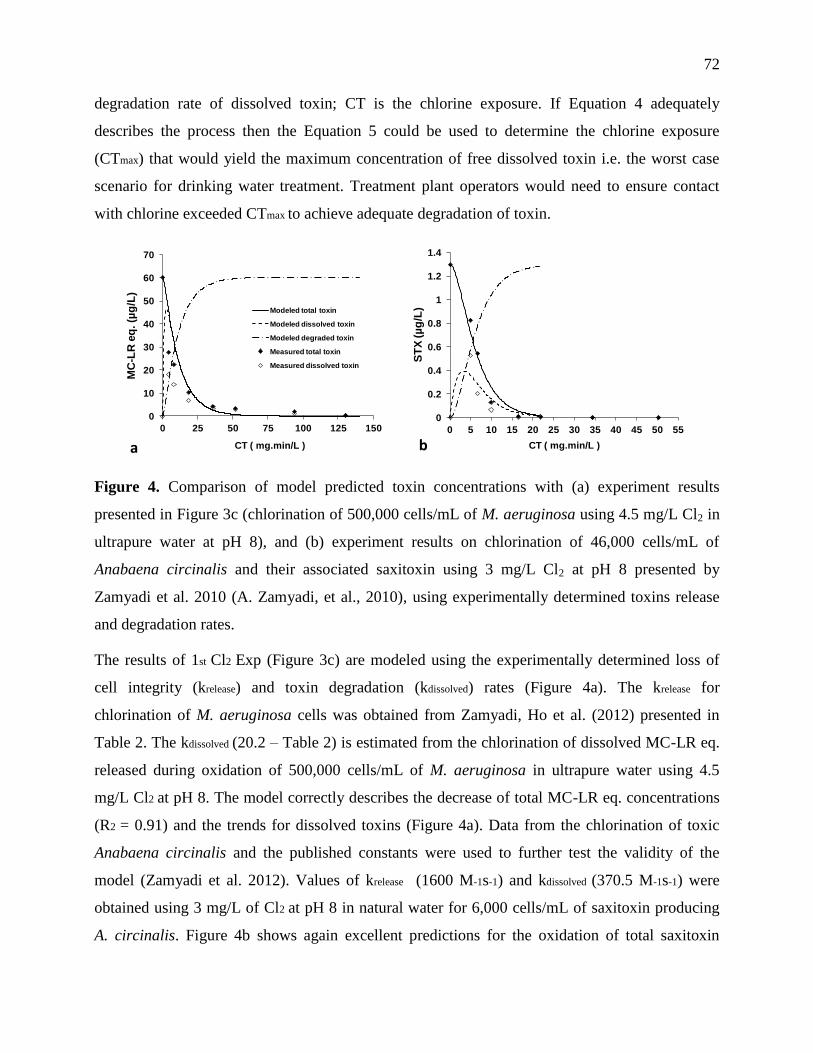
72
degradation rate of dissolved toxin; CT is the chlorine exposure. If Equation 4 adequately
describes the process then the Equation 5 could be used to determine the chlorine exposure
(CTmax) that would yield the maximum concentration of free dissolved toxin i.e. the worst case
scenario for drinking water treatment. Treatment plant operators would need to ensure contact
with chlorine exceeded CTmax to achieve adequate degradation of toxin.
Figure 4. Comparison of model predicted toxin concentrations with (a) experiment results
presented in Figure 3c (chlorination of 500,000 cells/mL of M. aeruginosa using 4.5 mg/L Cl2 in
ultrapure water at pH 8), and (b) experiment results on chlorination of 46,000 cells/mL of
Anabaena circinalis and their associated saxitoxin using 3 mg/L Cl2 at pH 8 presented by
Zamyadi et al. 2010 (A. Zamyadi, et al., 2010), using experimentally determined toxins release
and degradation rates.
The results of 1st Cl2 Exp (Figure 3c) are modeled using the experimentally determined loss of
cell integrity (krelease) and toxin degradation (kdissolved) rates (Figure 4a). The krelease for
chlorination of M. aeruginosa cells was obtained from Zamyadi, Ho et al. (2012) presented in
Table 2. The kdissolved (20.2 – Table 2) is estimated from the chlorination of dissolved MC-LR eq.
released during oxidation of 500,000 cells/mL of M. aeruginosa in ultrapure water using 4.5
mg/L Cl2 at pH 8. The model correctly describes the decrease of total MC-LR eq. concentrations
(R2 = 0.91) and the trends for dissolved toxins (Figure 4a). Data from the chlorination of toxic
Anabaena circinalis and the published constants were used to further test the validity of the
model (Zamyadi et al. 2012). Values of krelease (1600 M-1s-1) and kdissolved (370.5 M-1s-1) were
obtained using 3 mg/L of Cl2 at pH 8 in natural water for 6,000 cells/mL of saxitoxin producing
A. circinalis. Figure 4b shows again excellent predictions for the oxidation of total saxitoxin
0
10
20
30
40
50
60
70
0 25 50 75 100 125 150
MC
-LR
eq
. (µ
g/L
)
CT ( mg.min/L )
Modeled total toxin
Modeled dissolved toxin
Modeled degraded toxin
Measured total toxin
Measured dissolved toxin
0
0.2
0.4
0.6
0.8
1
1.2
1.4
0 5 10 15 20 25 30 35 40 45 50 55
ST
X (µ
g/L
)
CT ( mg.min/L )a b
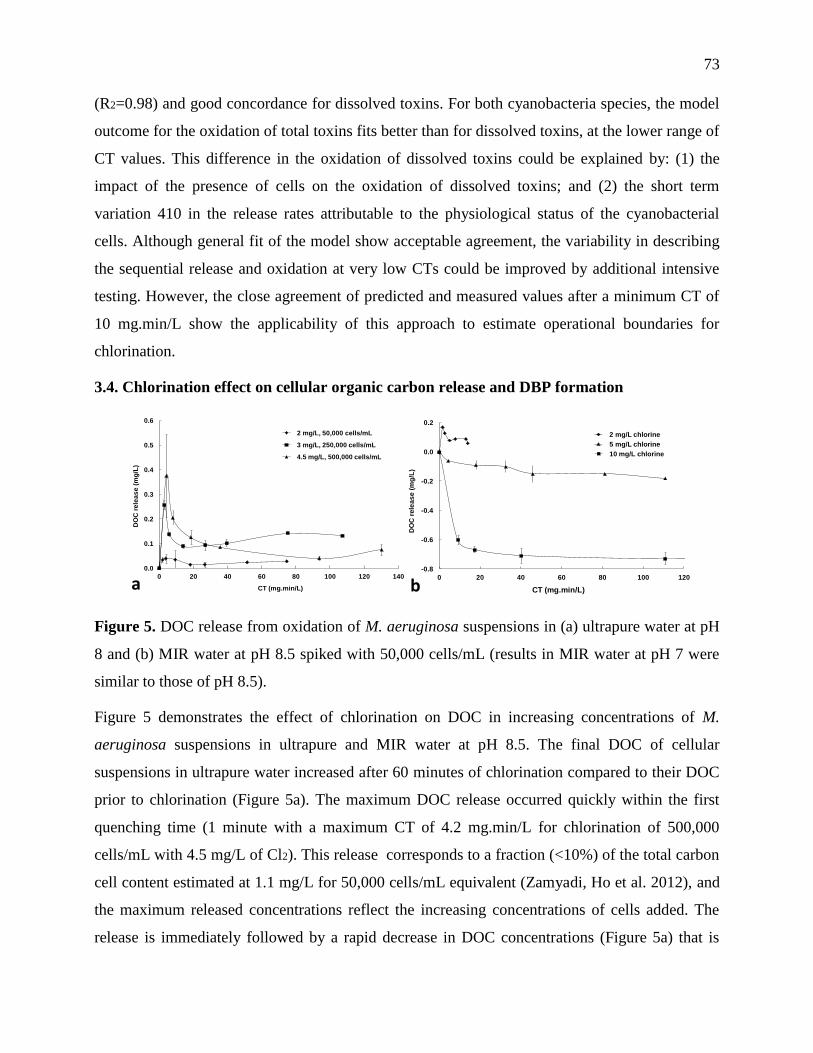
73
(R2=0.98) and good concordance for dissolved toxins. For both cyanobacteria species, the model
outcome for the oxidation of total toxins fits better than for dissolved toxins, at the lower range of
CT values. This difference in the oxidation of dissolved toxins could be explained by: (1) the
impact of the presence of cells on the oxidation of dissolved toxins; and (2) the short term
variation 410 in the release rates attributable to the physiological status of the cyanobacterial
cells. Although general fit of the model show acceptable agreement, the variability in describing
the sequential release and oxidation at very low CTs could be improved by additional intensive
testing. However, the close agreement of predicted and measured values after a minimum CT of
10 mg.min/L show the applicability of this approach to estimate operational boundaries for
chlorination.
3.4. Chlorination effect on cellular organic carbon release and DBP formation
Figure 5. DOC release from oxidation of M. aeruginosa suspensions in (a) ultrapure water at pH
8 and (b) MIR water at pH 8.5 spiked with 50,000 cells/mL (results in MIR water at pH 7 were
similar to those of pH 8.5).
Figure 5 demonstrates the effect of chlorination on DOC in increasing concentrations of M.
aeruginosa suspensions in ultrapure and MIR water at pH 8.5. The final DOC of cellular
suspensions in ultrapure water increased after 60 minutes of chlorination compared to their DOC
prior to chlorination (Figure 5a). The maximum DOC release occurred quickly within the first
quenching time (1 minute with a maximum CT of 4.2 mg.min/L for chlorination of 500,000
cells/mL with 4.5 mg/L of Cl2). This release corresponds to a fraction (<10%) of the total carbon
cell content estimated at 1.1 mg/L for 50,000 cells/mL equivalent (Zamyadi, Ho et al. 2012), and
the maximum released concentrations reflect the increasing concentrations of cells added. The
release is immediately followed by a rapid decrease in DOC concentrations (Figure 5a) that is
-0.8
-0.6
-0.4
-0.2
0.0
0.2
0 20 40 60 80 100 120
DO
C r
ele
as
e (
mg
/L)
CT (mg.min/L)
2 mg/L chlorine
5 mg/L chlorine
10 mg/L chlorine
0.0
0.1
0.2
0.3
0.4
0.5
0.6
0 20 40 60 80 100 120 140
DO
C r
ele
as
e (
mg
/L)
CT (mg.min/L)
2 mg/L, 50,000 cells/mL
3 mg/L, 250,000 cells/mL
4.5 mg/L, 500,000 cells/mL
a b
74
most probably attributable to the flocculent action of the hydrophilic polysaccharides released
from the damaged cells (Henderson, Baker et al. 2008).
DOC variations after chlorination of M. aeruginosa suspension (50,000 cells/mL) in MIR water
with 2 mg/L of Cl2 follow a similar trend to that observed in ultrapure experiments Figure 5b). In
contrast, this trend is greatly enhanced when applying a higher dosage of chlorine (5 and 10
mg/L) to the cellular suspensions (50,000 cells/mL) in natural water. In that case, a net decrease
of DOC up to 0.73 mg/L C is observed from the background DOC values of 6.3 mg/L of the MIR
water (Figure 5b). Similar trends were observed at a buffered pH of 7 (data not shown). This
further substantiates the hypothesis that increasing dosages favors the formation of
polysaccharides based compounds that transform algogenic organic matter (AOM) and humic
acids from the natural water to particulate NOM.
The potential contribution of cyanobacterial cells to the formation of chlorination by products has
been quantified as minor compared with that of background NOM in surface water (Zamyadi, Ho
et al. 2012). However, DBP yields have shown that cyanobacterial cell-bound DOC can be a
significant source of DBP precursors (Wardlaw et al. 1991; Plummer and Edzwald 2001; Nguyen
et al. 2005; Huang et al. 2009) and more recent evidence shows that carbohydrates can contribute
to the long term (72-400h) formation of THMs in the presence of bromide and 10 mg/L Cl2
(Navalon et al. 2008).
The third chlorination experiment (3rd
Cl2 Exp) was conducted to further investigate the reactivity
of cyanobacterial organic matter, whether dissolved or particulate and specifically to investigate
the contribution of M. aeruginosa cells to DBP formation during chlorination. The cells were
filtered and re-suspended in ultrapure water, thus eliminating the contribution of EOM which can
vary broadly depending on the cell growth phase and culture conditions, and can reach up to of
40 mg/L C in extremely dense suspensions (Hoyer et al. 1985; Nguyen et al. 2005). A very dense
suspension of 500,000 cells/mL was subjected to three freeze–thaw cycles to release internal
organic matter prior to chlorination with 5.5 mg/L Cl2 at pH 8. Table 3 presents 456 the TTHM
and HAA6 formation in the compromised M. aeruginosa suspension after 24 hours. The
measured concentrations of TTHM and HAA6 after the maximum CT of 3051.2 mg.min/L still
fall well below the current reference standard of 80 μg/L for TTHM and 60 μg/L for HAA5
(United States Environmental Protection Agency (USEPA) 2006).

75
Table 3. DBP formation in chlorination of lysed M. aeruginosa suspension (DOC of 1.30) of
500,000 cells/mL in ultrapure water at pH 8.
Time Cl2
residual
Cl2
demand CT TTHM HAA6
Min mg/L mg/L mg.min/L µg/L µg/L
0 5.5 - 0.00 BDL* BDL
30 2.9 2.6 125.4 BDL BDL
1440 1.3 4.2 3051.2 12.87 BDL
* Below Detection Limits (BDL)
The results of this study contrast those from Huang et al. (2009) who reported high yields of
THM and HAA precursors from high density suspensions of cultured Microcystis sp. (high DOC)
during a chlorination experiments (pH 7 with over 0.5 mg/L Cl2 residual from 1 to 7 days of
contact). The measured DOC of the suspension of 500,000 cells/mL of M. aeruginosa
(suspension with highest cell number and completely released cell bound material) is 1.3 mg/L.
The highest published chloroform yield for chlorination of Microcystis sp. is 61 μg CHCl3/mg C
(Huang et al. 2009). Hence, 39.7μg/L is the maximum potential THM formation for the M.
aeruginosa suspension of 500,000 cells/mL. Actual THM yield from the chlorination of IOM and
EOM of this cell suspension within a contact time of 24 hours (Table 3) is below the maximum
THM potential formation values. The published maximum potential yield of HAA precursor for
concentrated Microcystis sp. culture is smaller than the published values for chloroform (Huang
et al. 2009). However, the actual HAA6 measured in chlorination of total organic matter of
500,000 cells/mL of M. aeruginosa after 24 hours was below detection limit (Table 3).
The M. aeruginosa cells used for this study were harvested only at stationary phase of growth.
Types of protein and carbohydrate associated with cyanobacterial cells vary with their growth
phase (Henderson, Parsons et al. 2008; Henderson, Baker et al. 2008) and may vary the reactivity
of these compounds with chlorine and their DBP formation potentials. During the exponential
growth phase of cyanobacteria cells low molecular weight intermediate products (e.g. glycolic
76
and amino acids) with high reactivity to chlorine are dominant in cellular organic matter, while in
aged cells (late stationary phase) high molecular weight products (e.g. polysaccharides) are
abundant (Nguyen et al. 2005; Huang et al. 2009).
4. Conclusion
Results of this research demonstrate that chlorine doses of 2 to 10 mg/L cause the rapid release
and subsequent oxidation of dissolved and cell-bound MCs from M. aeruginosa. Additionally, a
maximum 76% reduction in total cell numbers (cell lysis) was observed with a CT of 296
mg.min/L. Kinetic analysis of cell-bound MCs oxidation in the presence of cellular debris
highlights the differences with previous studies conducted using only dissolved toxin materials.
These data provide novel information on chlorine demand per M. aeruginosa cell to obtain cell
lysis and toxin release.
The cellular chlorine demand in addition to the toxin chlorination kinetics in the presence of
cellular debris are key parameters to allow the operators of DWTPs to adjust the chlorination
practice to maximize cell lysis and toxin oxidation. It is possible to model the fate of total toxins
during chlorination of toxic cyanobacterial cells using both cells and toxin chlorination kinetics.
This paper provides a simple model to predict the release of cell-bound toxins by the action of
chlorine on the cells, and the subsequent degradation of dissolved toxins by chlorine. This
information is relevant to water authorities and DWTPs operators to validate the efficiency of
chlorination barrier. It can be used to assess potential responses to toxic cyanobacterial
breakthrough events based on historic and climate change scenarios.
Our results show that chlorination of 500,000 cells/mL and less of M. aeruginosa cells do not
contribute significantly to the pool of DBP precursors. However, the background NOM and its
DBP formation potential will determine whether the chlorination of M. aeruginosa cells can be
considered without the formation of excessive chlorination by-products.
Acknowledgment
This study was financially supported by Natural Sciences and Engineering Research Council
(NSERC) Canada Industrial Chair on Drinking Water Treatment at Ecole Polytechnique de
Montreal, Canada. The assistance of Dr. Benoit Barbeau, Jacinthe Mailly, Julie Philibert,
Marcelin Fosting, Yves Fontaine, Mireille Blais, Yan Wang and Lila Azouz is gratefully
acknowledged.
77
References
Acero, J.L., Rodriguez, E., Majado, M.E., Sordo, A. and Meriluoto, J. (2008) Oxidation of
microcystin-LR with chlorine and permanganate during drinking water treatment. Water
Supply: Research and Technology-Aqua 57(6), 371-380.
Acero, J. L., Rodriguez, E. and Meriluoto, J. (2005) Kinetics of reactions between chlorine and
the cyanobacterial toxins microcystins. Water Research 39(8), 1628-1638.
American Public Health Association (2005) Standard methods for the examination of water and
wastewater (21th Edition). American Water Works Association (AWWA) and the Water
Environment Federation, Washington, DC, USA.
Bond, T., Henriet, O., Goslan, E. H., Parsons, S. A.and Jefferson, B. (2009) Disinfection by-
product formation and fractionation behavior of natural organic matter surrogates.
Environmental Science and Technology 43(15), 5982-5989.
Chorus, I. and J. Bartram (1999) Toxic cyanobacteria in water: a guide 530 to their public health
consequences, monitoring and management. World Organizaton Health (WHO), London,
United Kingdom.
Cooperative Research Centre for Freshwater Ecology (CRCFE) (1999) A guide to the
identification of common Blue-green algae (Cyanoprokaryotes) in Australian freshwaters.
CRCFE, Australia.
Daly, R. I., Ho, L. and Brookes, J. D. (2007) Effect of chlorination on Microcystisaeruginosa cell
integrity and subsequent microcystin release and degradation.Environmental Science and
Technology 41(12), 4447-4453.
Ding, J., Shi, H., Timmons, T. and Adams, C. (2010) Release and removal of microcystins from
Microcystis during oxidative-, physical-, and UV-based disinfection. Journal of
Environmental Engineering 136, 2-11.
Fang, J., Yang, X., Ma, J., Shang, C. and Zhao, Q. (2010) Characterization of algal organic
matter and formation of DBPs from chlor(am)ination. Water Research 44, 5897-5906.
Towers, N.R. and Dietrich, D.R. (2001) Congener-independent immunoassay for microcystins
and nodularins. Environmental Science and Technology 35(24), 4849-4856.
Gorham, P. R., McLachlan, J., Hammer, U.T. and Kim, W.K. (1964). Isolation and culture of
toxic strains of Anabaena flos-aquae (Lyngb.) deBréb. International Association of
Theoretical and Applied Limnology 15, 796-804.
Graham, N. J. D., Wardlaw, V. E., Perry, R. and Jiang, J. Q. (1998) The significance of algae as
trihalomethane precursors. Water Science and Technology 37(2), 39-83. Henderson, R.,
Parsons, S. A. and Jefferson, B. (2008) The impact of algal properties and pre-oxidation
on solid-liquid separation of algae. Water Research 42(8-9), 1827-1845.
Henderson, R.K., Baker, A., Parsons, S.A. and Jefferson, B. (2008) Characterisation of algogenic
organic matter (13), 3435-3445. extracted from cyanobacteria, green algae and diatoms.
Water Research 42

78
Ho, L., Onstad, G., von Gunten, U., Rinck-Pfeiffer, S., Craig, K. and Newcombe, G. (2006)
Differences in the chlorine reactivity of four microcystin analogues. Water Research
40(6), 1200-1209.
Hoyer, O., Lusse, B. and Bernhardt, H. (1985) Isolation and characterization of extracellular
organic matter (EOM) from algae. Zeitschrift für Wasser – und Abwasser-Forschung
18(2), 76-90.
Huang, J., Graham, N., Templeton, M. R., Zhang, Y., Collins, C. and Nieuwenhuijsen, M. (2009)
A Comparison of the Role of Two Blue-green Algae in THM and HAA Formation. Water
Research, 43(12), 3009-3018.
Hureiki, L., Croue, J. P. and Legube, B. (1994) Chlorination studies of free and combined amino-
acids. Water Research 28(12), 2521-2531.
Hurst, C.J., Crawford, R.L., Mills, A.L., Garland, J.L., Stetzenbach, L.D. and Lipson, D.A.
(2007) Manual of environmental Microbiology (Third Edition). American Society for
Microbiology Press, Washington, DC, USA.
Janjaroen, D., Liu, Y.Y., Kuhlenschmidt, M.S., Kuhlenschmidt, T.B. and Nguyen, T.H. (2010)
Role of divalent cations on deposition of Cryptosporidium parvum oocysts on natural
organic matter surfaces. Environmental Science 576 and Technology 44(12), 4519-4524.
Jones, C. T. (1970) Determination of the Kinetic Constants of Two Consecutive First-Order
Reactions. Biochemical Journal 118(5), 810-812.
Lahti, K., Rapala,, J., Kivimäki, A-L., Kukkonen, J., Niemelä, M. and Sivonen, K. (2001)
Occurrence of microcystins in raw water sources and treated drinking water of Finnish
waterworks. Water Science and Technology 43, 225-228.
Laslett, G. M., Clark, R. M. and Jones, G. J. (1997) Estimating the precision of filamentous blue-
green algae cell concentration from a single sample. Environmetrics 8(4): 313-339.
Lin, T-F., Chang, D-W., Lien, S-K., Tseng, Y-S., Chiu Y-T, and Wang Y-S. (2009) Effect of
chlorination on the cell integrity of two noxious cyanobacteria and their releases of
odorants. Journal of Water Supply: Research and Technology—AQUA 58(8), 539-551.
Lund, J. W., Kipling, C. and LeCren, E. D. (1958) The inverted microscope method of estimating
algal number and the statistical basis of estimations by counting. Hydrobiologia 11(2),
143-170.
McQuaid, N., Zamyadi, A., Prévost, M., Bird, D. F. and Dorner, S. (2011) Use of in vivo
phycocyanin fluorescence to monitor potential microcystin-producing cyanobacterial
biovolume in a drinking water source. Journal of Environmental Monitoring 13, 455–463.
Merel, S., Clément, M. and Thomas, O. (2010) Review State of the art on cyanotoxins in water
and their behaviour towards chlorine. Toxicon 55, 677–691.
Merel, S., LeBot, B., Clément, M., Seux, R. and Thomas, O. (2009) Ms identification of
microcystin-LR chlorination by-products. Chemosphere 74(6), 832-839.
Nancharaiah, Y. V., Rajadurai, M. and Venugopala, V. P. (2007) Single cell level microalgal
ecotoxicity assessment by confocal microscopy and digital image analysis. Environmental
Science and Technology 41(7), 2617-2621.
79
Navalon, S., Alvaro, M. and Garcia, H. (2008) Carbohydrates as trihalomethanes precursors.
Influence of pH and the presence of Cl− and Br− on trihalomethane formation potential.
Water Research 42(14), 3990-4000.
Newcombe, G., House, J., Ho, L., Baker, P. and Burch, M. (2010) Management Strategies for
Cyanobacteria (Blue-Green Algae): A Guide for Water Utilities. Research Report No 74.
Adelaide, SA, Australia.
Newcombe, G. and Nicholson, B. (2004) Water treatment options for dissolved cyanotoxins.
Water Supply: Research and Technology-Aqua 53(4), 227-239.
Nguyen, M.L., Westerhoff, P., Baker, L., Hu, Q., Esparza-Soto, M. and Sommerfeld, M. (2005)
Characteristics and reactivity of algae-produced dissolved organic carbon. Journal of
Environmental Engineering 131(11), 1574-1582.
Pietsch, J., Bornmann, K. and Schmidt, W. (2002) Relevance of intra- and extracellular
cyanotoxins for drinking water treatment. Acta Hydrochimica and Hydrobiologica 30(1),
7-15.
Plummer, J. D. and Edzwald, J. K. (2001) Effect of ozone on algae as precursors for
trihalomethane and haloacetic acid production. Environmental Science & Technology
35(18), 3661-3668
Rodriguez, E., Onstad, G. D., Kull, T. P. J., Metcalf, J. S., Acero, J. 621 L. and von Gunten, U.
(2007) Oxidative elimination of cyanotoxins: comparison of ozone, chlorine, chlorine
dioxide and permanganate. Water Research 41(15), 3381-3393.
Rodriguez, E.M., Acero, J.L., Spoof, L. and Meriluoto, J. (2008) Oxidation of MC-LR and -RR
with chlorine and potassium permanganate: toxicity of the reaction products. Water
Research 42(6-7), 1744-1752.
Schmidt, T. and Konopka, A. (2009) Physiological and ecological adaptations of slow628
growing, heterotrophic microbes and consequences for cultivation. Microbiology
Monographs 10, 101-120.
Schmidt, W., Petzoldt, H., Bornmann, K., Imhof, L. and Moldaenke, C. (2009). Use of
cyanopigment determination as an indicator of cyanotoxins in drinking water. Water
Science and Technology 59(8), 1531-1540.
Schmidt, W., Willmitzer, H., Bornmann, K. and Pietsch, J. (2002). Production of drinking water
from raw water containing cyanobacteria. Pilot plant studies for assessing the risk of
microcystin breakthrough. Environmental Toxicology 17(4): 375-385.
Svrcek, C. and Smith, D. W. (2004) Cyanobacteria toxins and the current state of knowledge on
water treatment options: a review. Environmental Engineering and Science 3(3), 155-185.
United States Environmental Protection Agency (USEPA) (2006) National primary drinking
water regulations: stage 2 disinfectants and disinfection byproducts rule; final rule.
Federal Register, Part II, Office of Science and Technology, Office of Water, p: 107,
Washington, DC, USA.
United States Environmental Protection Agency (USEPA) (1995) Method 552.2 - Determination
of haloacetic acids and dalapon in drinking water by liquid-liquid extraction,
80
derivatization and gas chromatography with electron capture detection, p: 1-32,
Cincinnatti, Ohio, USA.
Wardlaw, V. E., Perry, R. and Graham, N. J. D. (1991) The role of algae as trihalomethane
precursors - a review. Journal of Water Supply Research and Technology-Aqua 40(6),
335-345.
Zamyadi, A., Ho, L., Newcombe, G., Bustamante, H. and Prévost, M. (2012) Fate of toxic
cyanobacterial cells and disinfection by-products formation after chlorination. Water
Research 46(5), 1524-1535.
Zamyadi, A., Ho, L., Newcombe, G., Daly, R. I., Burch, M., Baker, P. and Prévost, M. (2010)
Release and oxidation of cell-bound saxitoxins during chlorination of Anabaena circinalis
cells. Environmental Science and Technology 44(23), 9055-9061.
Zamyadi, A., MacLeod, S., Fan, Y., McQuaid, N., Dorner, S., Sauvé, S. and Prévost, M. (2012)
Toxic cyanobacterial breakthrough and accumulation in a drinking water plant: a
monitoring and treatment challenge. Water Research 46(5), 1511-1523.
Zamyadi, A., McQuaid, N., Prévost, M. and Dorner, S. (2012) Monitoring of potentially toxic
cyanobacteria using an online multi-probe in drinking water sources. Journal of
Environmental Monitoring 14, 579-588.
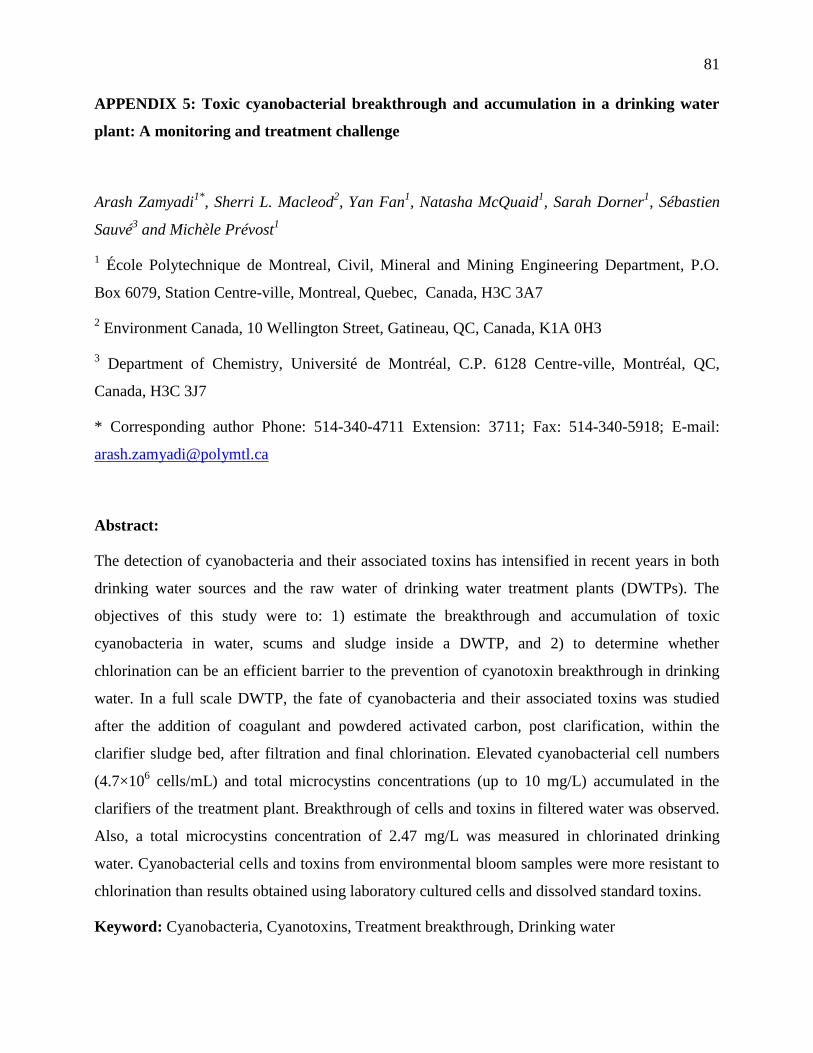
81
APPENDIX 5: Toxic cyanobacterial breakthrough and accumulation in a drinking water
plant: A monitoring and treatment challenge
Arash Zamyadi1*
, Sherri L. Macleod2, Yan Fan
1, Natasha McQuaid
1, Sarah Dorner
1, Sébastien
Sauvé3 and Michèle Prévost
1
1 École Polytechnique de Montreal, Civil, Mineral and Mining Engineering Department, P.O.
Box 6079, Station Centre-ville, Montreal, Quebec, Canada, H3C 3A7
2 Environment Canada, 10 Wellington Street, Gatineau, QC, Canada, K1A 0H3
3 Department of Chemistry, Université de Montréal, C.P. 6128 Centre-ville, Montréal, QC,
Canada, H3C 3J7
* Corresponding author Phone: 514-340-4711 Extension: 3711; Fax: 514-340-5918; E-mail:
Abstract:
The detection of cyanobacteria and their associated toxins has intensified in recent years in both
drinking water sources and the raw water of drinking water treatment plants (DWTPs). The
objectives of this study were to: 1) estimate the breakthrough and accumulation of toxic
cyanobacteria in water, scums and sludge inside a DWTP, and 2) to determine whether
chlorination can be an efficient barrier to the prevention of cyanotoxin breakthrough in drinking
water. In a full scale DWTP, the fate of cyanobacteria and their associated toxins was studied
after the addition of coagulant and powdered activated carbon, post clarification, within the
clarifier sludge bed, after filtration and final chlorination. Elevated cyanobacterial cell numbers
(4.7×10⁶ cells/mL) and total microcystins concentrations (up to 10 mg/L) accumulated in the
clarifiers of the treatment plant. Breakthrough of cells and toxins in filtered water was observed.
Also, a total microcystins concentration of 2.47 mg/L was measured in chlorinated drinking
water. Cyanobacterial cells and toxins from environmental bloom samples were more resistant to
chlorination than results obtained using laboratory cultured cells and dissolved standard toxins.
Keyword: Cyanobacteria, Cyanotoxins, Treatment breakthrough, Drinking water
82
1. Introduction
Climate change and population growth contribute to increasing water temperature and nutrient
loads and may intensify the proliferation of potentially toxic cyanobacteria in drinking water
sources (Dale et al., 2006; Elliott et al., 2006; Jo¨hnk et al., 2008; Paul, 2008), even in temperate
climates (Wiedner et al., 2007). Several cyanobacteria species are potent producers of a variety of
toxins responsible for intermittent but repeated widespread poisoning of wild and domestic
animals, fish from aquaculture, and humans (Carmichael et al., 2001). The increasing frequency
and intensity of cyanobacterial proliferation leading to neurotoxin and hepatotoxin production is
a universal problem (Chorus and Bartram, 1999; Svrcek and Smith, 2004; Merel et al., 2010).
Reported human health effects of cyanotoxins include gastroenteritis, liver damage, neurotoxic
effects and liver cancer. Microcystins (MCs) and cylindrospermopsin (CYN) are the most
frequently identified toxins but toxins associated with bloom events have not always been
identified (Svrcek and Smith, 2004; The Cooperative Research Centre for Water Quality and
Treatment (Australia), 2007).
Several studies have documented the presence of toxic CB blooms in surface water and at water
intakes of drinking water treatment plants (DWTPs) (Carmichael et al., 2001; Lahti et al., 2001;
Svrcek and Smith, 2004; MDDEP, 2008; Merel et al., 2010; McQuaid et al., 2011). In a
comprehensive national survey including 26 sampling sites over 24 months, maximum
concentrations of w1000 mg/L of microcystin-LR (MC-LR) have been reported in French surface
water (Agence Franc¸aise de Se´curite´ Sanitaire des Aliments (AFSSA) and Agence Franc¸aise
de Se´curite´ Sanitaire de l’Environnement et du Travail (AFSSET), 2006). MCs have been
detected in 33 American drinking water sources but MCs concentrations exceeded 1 mg/L in only
7% of samples (Haddix et al., 2007). Robert et al. (2005) monitored CB and cyanotoxins
(Anatoxin, MC-LR, MCRR and MC-YR) every two weeks in the water intakes of six DWTPs
located in southeast of Quebec (Canada), including a plant located on Missisquoi Bay on the
Canadian side of the Lake Champlain 24 times over 3 years. MC-LR was found to be the
dominant toxin present with maximum concentration of 3.5 mg/L in raw and 0.04 mg/L in treated
water (Robert et al., 2005). The Missisquoi Bay is prone to cyanobacterial proliferations because
of its high nutrient loadings (Simomeau, 2007). Using event-based sampling specifically
targeting blooms, McQuaid et al. (2011) reported much higher values of cyanobcateria and MCs
at this water intake with concentration of total intracellular and dissolved MCs up to 127 mg/L
83
MC-LR equivalents (MC-LR eq.). During the 2004 Wuxi drinking water crisis in Lake Taihu
(China) maximum dissolved MCs concentrations of 35 mg/L were detected in the Meiliang Bay
in Lake Taihu (Liu et al., 2011).
The impact of various treatment processes on dissolved cyanotoxins has been thoroughly
reviewed and the limitations of various treatment processes are mostly established (Svrcek and
Smith, 2004; Westrick, 2008; Lin et al., 2009; Merel et al., 2010; Zamyadi et al., 2010).
However, cyanotoxins are most often cell-bound and it is essential to verify the fate of
cyanobacteria cells and their associated toxins from real bloom events inside the DWTPs (Park et
al., 1998; McQuaidet al., 2011). The impact of treatment of cyanobacterial cells is summarized in
the Supplementary Data (SD) section Table SD-I1.
The physical removal and potential accumulation of cyanobacteria cells and their aggregates in
treatment processes are affected by their size, charge, motility, morphology, and resistance to
sheer stress and pressure, and these factors vary widely among species (Drikas et al., 2001;
Dickens and Graham, 1995; Bernhardt and Clasen, 1991). Bacterial flocs of CB are smaller than
100 mm (American Water Works Association (AWWA), 2010). Pumping, coarse screening
(>1mm), grit removal and forced air stripping are not efficient to remove cyanobacteria but may
lead to cell damage. Micro-screening can be efficient depending on mesh size; a 35 mm screen
can retain from 40 to 70% of phytoplankton and 10% or less of specific CB, including
Microcystis aeruginosa, with no impact on dissolved toxins (Chorus and Bartram, 1999). The
impact of cell surface and species-specific coagulant demand on the efficacy of clarification
processes has been studied at various scales of experimentation and recently reviewed
(Henderson et al., 2008). Reported efficiencies of cyanobacteria removal by
coagulation/flocculation and sedimentation vary from 62% to 98.9% (Jiang et al., 1993; Vlaski et
al., 1996; Jiang and Graham, 1998; Drikas et al., 2001) and are attributed to low cell density
(Henderson et al., 2008). The accumulation of cyanobacteria and cell bound toxins in water
treatment processes is expected and can cause toxin accumulation and subsequent modest toxin
release into the treatment plant (Pietsch et al., 2002). Significant accumulation of cell bound MC-
LR in gravity filters has been documented at pilot scale using native blooms dominated by
Planktothrix rubescens (Pietsch et al., 2002; Schmidt et al., 2009). Rapid sludge removal from
sedimentation basins is recommended to ensure that few additional dissolved toxins are released
84
from the sludge beds. Additionally, recycling of sludge drying beds should not be conducted until
all toxins have degraded (European Commission, 2005).
Various oxidants including ozone, chlorine, potassium permanganate, chlorine dioxide have been
used for the oxidation of cyanobacteria resulting in cell damage and oxidation of cell contents
(SD section Table SD-I1). The susceptibility of cyanobacteria cells to oxidation is influenced by
the species present, the physiological state of the cells, i.e. the growth phase (Pietsch et al., 2002),
and the conditions of oxidation. It has been documented that during oxidation (e.g. chlorination)
of a cyanobacterial suspension, the rate of toxin release is determined by the rate of the loss of
membrane integrity (Daly et al., 2007; Zamyadi et al., 2010). The efficiency of the oxidative
agent in released cyanotoxins oxidation depends on: the toxins present, the concentration of
released toxins, the water quality and the contact time (Rodriguez et al., 2007; Ho et al., 2010;
Zamyadi et al., 2010).
It must be noted that most studies on the elimination of cyanobacterial cells and toxins have been
conducted at laboratory and pilot scale, allowing for the quantification of the impact of water
quality and cyanobacterial speciation. Few research projects have confirmed the anticipated
performances at pilot scale and full scale under typical plant operational conditions (Pietsch et al.,
2002; Schmidt et al., 2002; Lin et al., 2009). Data available on the fate of cyanobacteria cells and
their associated toxins from real bloom events inside the DWTPs are scarce, and preliminary
evidence shows their potential breakthrough and accumulation during blooms (Lepisto et al.,
1994; Suthaker and Drachenberg, 2007).
Elements of cyanotoxin management plans for drinking water plants include: (a) mandatory
guidelines and standards for cyanotoxins in drinking water, (b) establishment of a plan to monitor
cyanobacteria and their associated toxins, and (c) treatment methods for removing cyanotoxins
(Chorus and Bartram, 1999; Newcombe, 2009). The recommended toxins alert levels are
presented in the SD section Table SD-I2. The routine detection of relevant toxins for health and
water treatment in source water raises several challenges: (1) toxin production is transitory in
nature and difficult to predict; (2) the types of toxin(s) produced vary in time and space; (3) the
relationship between the number of cyanobacteria present in water and the probability of the
presence of cyanotoxins is complex; and (4) tedious and expensive analytical methods must be
used to detect several types of toxins (Codd et al., 2005; Gregor et al., 2007). Based on
85
cyanobacterial cell enumeration and potential cyanotoxin concentration, monitoring strategies for
drinking water (e.g. weekly counts and toxin analysis in DW supplies if 100,000 cells/mL are
detected) are applied by different public health organizations (SI section Table SD-I3). In vivo
measurement of cyanobacterial presence using high frequency monitoring probes can be used to
monitor cyanobacteria in source waters (Ahn et al., 2007; Gregor et al., 2007; McQuaid et al.,
2011). McQuaid et al. (2011) proposed a biomass alert level for in vivo cyanobacterial
monitoring at the water intake of the DWTP situated in the Missisquoi Bay.
The overall objective of this study was to document the accumulation and fate of cyanobacterial
cells and their associated toxins in a full scale DWTP coupled with online in vivo monitoring of
cyanobacteria at the water intake. The purpose was to quantify the vulnerability of DWTPs to
peaks of cyanotoxin concentrations resulting from breakthrough and accumulation of toxic
cyanobacteria under realistic operational conditions. This demonstration will help define the scale
of monitoring and treatment challenges. The specific objectives of this study were to 1) estimate
the accumulation and breakthrough of toxic cyanobacteria in water, scums and sludge inside a
DWTP, and to 2) study if pre- and/or postchlorination is an efficient barrier to prevent the
breakthrough of cyanotoxins into drinking water.
2. Material and Methods
2.1. Water source and site description
The water intake of a the water treatment plant located on the Missisquoi Bay of Lake Champlain
in southern Quebec (Canada) was monitored over three bloom seasons from June to October,
2008, 2009 and 2010. The body of water serves as a source of drinking water for the surrounding
municipalities and as a recreational site for boating, fishing, and swimming. Characteristics of the
treatment processes are presented in Table 1. The cyanobacteria bloom water samples for
chlorination experiments were sourced from a bloom event in Missisquoi Bay in close proximity
of the water intake. In this water the dissolved organic carbon (DOC) concentration was 5.4
mg/L. Prior to DOC analyses, samples were passed through pre-rinsed (1 L ultrapure water) 0.45
mm cellulose nitrate Supor_-450 membrane filters (PALL Life Sciences, USA). DOC
measurements were made on a 5310C total organic carbon analyzer (Sievers Instruments Inc.,
USA).
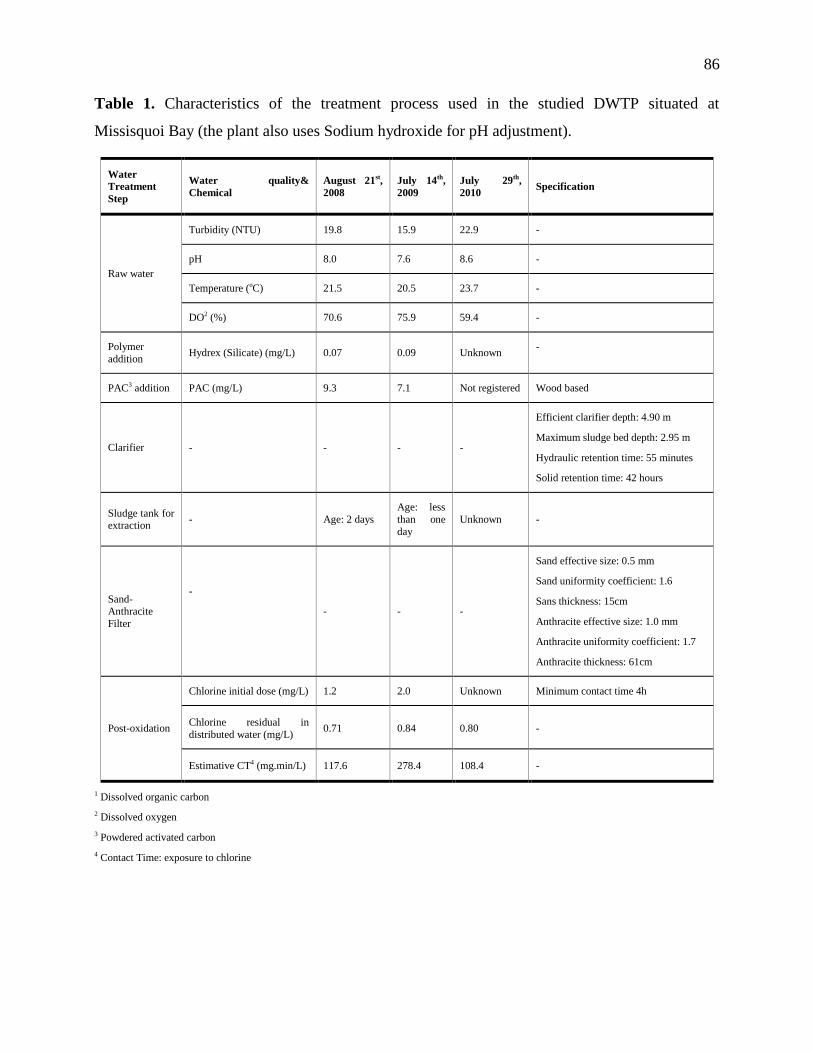
86
Table 1. Characteristics of the treatment process used in the studied DWTP situated at
Missisquoi Bay (the plant also uses Sodium hydroxide for pH adjustment).
Water
Treatment
Step
Water quality&
Chemical
August 21st,
2008
July 14th,
2009
July 29th,
2010 Specification
Raw water
Turbidity (NTU) 19.8 15.9 22.9 -
pH 8.0 7.6 8.6 -
Temperature (oC) 21.5 20.5 23.7 -
DO2 (%) 70.6 75.9 59.4 -
Polymer
addition Hydrex (Silicate) (mg/L) 0.07 0.09 Unknown
-
PAC3 addition PAC (mg/L) 9.3 7.1 Not registered Wood based
Clarifier - - - -
Efficient clarifier depth: 4.90 m
Maximum sludge bed depth: 2.95 m
Hydraulic retention time: 55 minutes
Solid retention time: 42 hours
Sludge tank for extraction
- Age: 2 days
Age: less
than one
day
Unknown -
Sand-Anthracite
Filter
-
- - -
Sand effective size: 0.5 mm
Sand uniformity coefficient: 1.6
Sans thickness: 15cm
Anthracite effective size: 1.0 mm
Anthracite uniformity coefficient: 1.7
Anthracite thickness: 61cm
Post-oxidation
Chlorine initial dose (mg/L) 1.2 2.0 Unknown Minimum contact time 4h
Chlorine residual in
distributed water (mg/L) 0.71 0.84 0.80 -
Estimative CT4 (mg.min/L) 117.6 278.4 108.4 -
1 Dissolved organic carbon
2 Dissolved oxygen
3 Powdered activated carbon
4 Contact Time: exposure to chlorine
87
2.2. In vivo phycocyanin monitoring
An online YSI 6600 V2-4 water-qualitymulti-probe (YSI, Yellow Springs, Ohio, USA) fitted
with an in vivo phycocyanin fluorescence (YSI6131 Blue Green Algae) self cleaning “wiped”
probe was used in this study (YSI Incorporated, 2006; Zamyadi, 2011). The phycocyanin
probewas installed inside theDWTP at the raw water intake prior to any treatment and
measurements recorded every 30min. The phycocyanin probe excites the cyanobacterial
phycocyanin at 590 nm (with a pass-band of 565–605 nm) and measures the pigment’s emission
at 660 nm. The probe detects light emitted in the range of 640–680 nm. The probe raw readings
are presented in ratio fluorescent units (RFU). The probe resolution, detection limit and limit of
quantification is 0.1 RFU over its range of 0–100 RFU, 0.2 RFU) and 0.7 RFU, respectively
(McQuaid et al. 2011).
2.3. Sampling procedure
Weekly field visits were conducted on a fixed day to collect probe records and water samples
were taken from the water intake only for microscopic taxonomy and toxin analysis. If RFU
augmentations were observed in the probe readings within 24 hours prior to the sampling day or
the presence of cyanobacteria was detected inside the DWTP, triplicate water samples were
taken across the treatment processes from raw to treated water: raw water from the pipeline
conducting raw water to the treatment facility prior to any treatment; surface of the reactive
addition and flash mix tank; scum at the surface of the clarifier/sedimentation tank; sludge from
the sludge bed of the clarifier using the sampling valve; concentrated sludge in the concentration
cone using the sampling valve; scum over the filter; and treated water at the outlet of the reservoir
(complete Cl2 contact time). Sampling taps were fully flushed before taking samples. Samples
for taxonomic counts were preserved using Lugol’s iodine and samples for total toxins analysis
were stored in -25℃.
2.4. Field samples pre-treatment
Cells from all field samples were submitted to three freeze/thaw cycles before any analysis for
total toxins. In 2010, field samples (5mL) were vortexed in conical centrifuge tubes (BD Falcon,
50mL, Fisher Scientific) at 3000 rpm for 2 minutes, treated with internal standard (25µL of
100µg/L nodularin (in methanol, providing final nodularin concentration of 500ng/L) and passed
through syringe filter (10mL polypropylene syringes and 25mm diameter Whatman GD/X GMF,

88
0.45µm pore size filters) then divided into 3 separate 2mL amber autosampler vials. For this set
of samples (an initial first test of the method with real samples) extracts were first analyzed as
described. If concentrations exceeded the highest concentration in the calibration standard curve,
subsequent dilutions were completed with appropriate addition of internal standard before
analysis.
2.5. Chlorination experiments
Liquid chlorine stock solution was purchased from Fisher (USA). Chlorine stock and chlorine
residual concentrations were determined using the DPD-FAS titration method described in
Standard Methods (American Public Health Association (APHA) 1998). Typical chlorine stock
solutions concentration is 50,000 mg/L as free chlorine. The experimental plan included
chlorination of a sample of cyanobacteria bloom from Missisquoi Bay. A chlorine decay
experiment was conducted prior to each experiment. For chlorine decay experiments, water
samples were dosed with the desired chlorine concentrations (2 and 5 mg/L) and triplicate
samples taken at specified contact times (0, 1, 2, 5, 10, 15, 30 and 60 min) for free chlorine
residual determinations using the DPD-FAS titration method. Cyanobacteria cells exposure to
chlorine is in CT (Contact Time), the residual concentration of the chlorine multiplied by time
(Ho et al., 2006). The CT value is calculated by determining the area under a graph of chlorine
concentration versus time. All chlorination experiments were conducted in triplicate in brown
amber bottles at room temperature (20 ±2 ℃).
Environmental cyanobacterial bloom samples were taken from Missisquoi Bay (5.7×10⁵ (±4%)
cells/mL) where the speciation of the cyanobacterial population was conducted. Chlorine was
added from the chlorine stock solution (2 and 5mg/L). Samples were quenched at specified
contact times with sodium thiosulphate at a stoichiometric ratio specified in Standard Methods
(American Public Health Association (APHA), 1998). Subsamples of the quenched samples were
taken for DOC measurement. To determine cell lysis total cell microscopic counts were
conducted in triplicate on 2-mL samples after preservation in Lugol’s iodine (Lund et al., 1958;
Wetzel, 2000). Remaining quenched water samples were divided in two subsamples of 250 mL:
the first subsample was immediately filtered through 0.45 µm cellulose filter (Whatman, UK) to
remove cellular material, and then analyzed for extracellular toxins. The second subsample was
subjected to three freeze/thaw cycles before filtration over 0.45 µm filter to analyze for total

89
toxins (both the cell-bound and extracellular). For all experiments the extracellular concentrations
of toxins analysis were always below their total concentration. The difference between total and
extracellular levels of toxins was estimated as the cell-bound concentration.
2.6. Chemicals and reagents
Standard solutions of MC-LR, cylindrospermopsin, MC-RR, nodularin, dm MC-LR were
purchased from National Research Council (Halifax, NS). Anatoxin-a was purchased as anatoxin-
a fumarate from Cedarlane (Burlington, ON) and MC-LF, MC-LW, MC-LY, MC-YR were all
purchased from DHI (Hørsholm, Denmark). Individual toxins were diluted to 1 mg/L with
HPLC-grade MeOH and kept in amber vials at -20°C. Working solutions with all toxins for
external calibration (10, 50, 100, 250, 500, 1000, 5000, 10000ng/L each with 500ng/L internal
standard) were prepared via appropriate dilutions with HPLC grade H2O and were kept at 4°C
prior to and during analysis. All chemicals and reagents were analytical grade from various
suppliers.
2.7. Analysis of toxins
For the 2008, 2009 and chlorination experiment samples MC-LR analyses were conducted using
an Abraxis Microcystin ELISA Plate (an enzyme-linked immunosorbent assay – Abraxis LLC,
Pennsylvania, USA). The analyses of MC-LR concentrations were measured as mg/L of MC-LR
eq.. The accuracy of the Plate was validated using standard toxin materials and the average
standard deviation of triplicate measurements was 3% (SD section Table SD-I4).
The 2010 toxin analysis was carried out via online solid phase extraction-liquid chromatography
coupled to tandem mass spectrometry (online SPE-LC-MS/MS) consisting of a CTC
Autosampler (from Thermo by Leap Technologies), a Thermo Fisher (Waltham, MA, USA)
HPLC system (with Accela 1250/analytical and 600/loading pumps), one 6- and one 10-port
switching valve (VICI), a HotPocket column heater (Thermo Fisher) and a TSQ Quantum Ultra
AM Mass Spectrometer (Thermo Fisher) with an Ion Max atmospheric pressure ionization (API)
source (Thermo Fisher). The method, adapted from published multi-toxin (Dell'Aversano et al.
2004; Spoof et al. 2010; Oehrle et al. 2010) and online SPE-LC-MS/MS methods (Stoob et al.
2005; Segura et al. 2007), allowed for determination of ng/L toxin concentrations in 1 mL
samples without arduous pre-concentration. The runtime was 6.8 minutes/sample with recoveries
ranging from 97-109%. Hypersil GOLD (Thermo Fisher, Waltham MA USA) LC columns were

90
employed in online extraction (12µm, 20 × 2.1mm) and analyte separation (1.9µm, 50 x 2.1mm)
with a stepped gradient of formic acid and acetonitrile as the mobile phase. MC-LR, MC-YR,
MC-LY, MCLF, MC-RR, MC-LW, 3-desmethylMC-LR (dm-MC-LR), and CYN toxins were
analyzed by this method.
3. Results and discussion
3.1. Breakthrough and accumulation of toxic cyanobacteria inside a DWTP
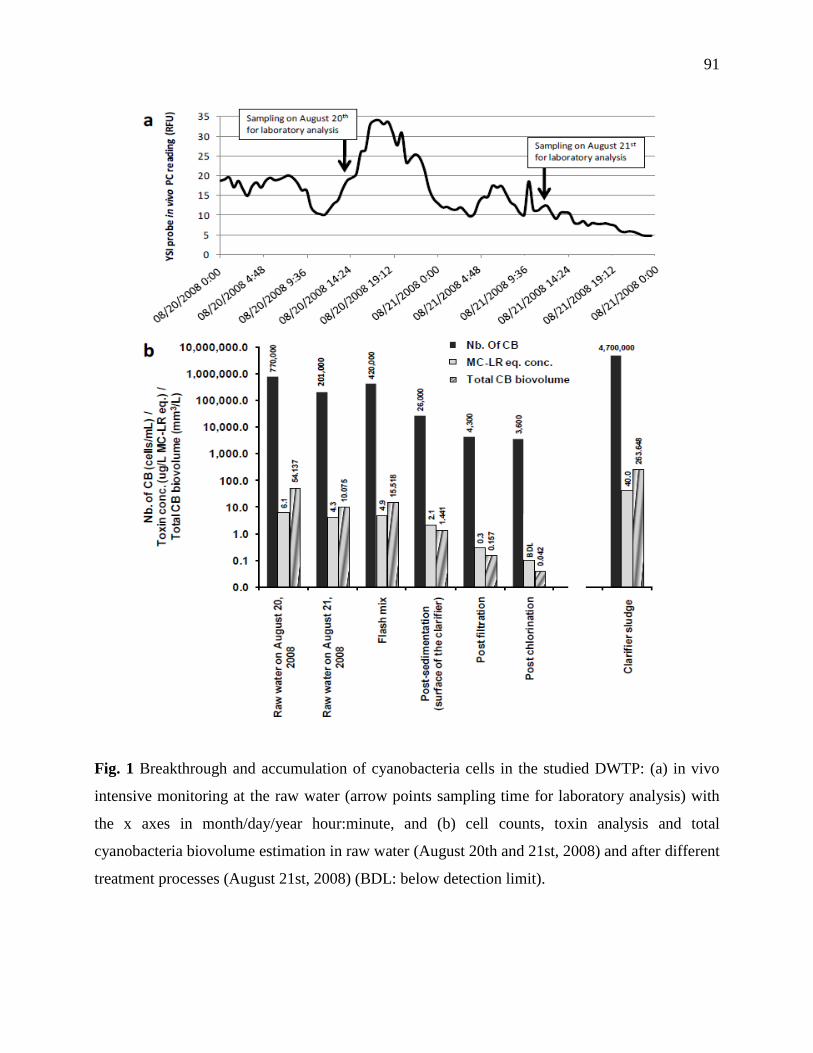
91
Fig. 1 Breakthrough and accumulation of cyanobacteria cells in the studied DWTP: (a) in vivo
intensive monitoring at the raw water (arrow points sampling time for laboratory analysis) with
the x axes in month/day/year hour:minute, and (b) cell counts, toxin analysis and total
cyanobacteria biovolume estimation in raw water (August 20th and 21st, 2008) and after different
treatment processes (August 21st, 2008) (BDL: below detection limit).

92
On the afternoon of August 20th, 2008 a notable increase of cyanobacteria was recorded by the in
vivo phycocyanin probe (Fig. 1a). Raw water at the water intake of the DWTP contained
7.70×10⁵ cells/mL of cyanobacteria and 6.1 µg/L of MC-LR eq.. Microcystis sp., Anabaena sp.,
Pseudanabaena sp., Aphanothece sp., Aphanocapsa sp., Glaucospira sp., Planktolyngbya sp.
And Aphanizomenon sp. were identified in this sample with M. aeruginosa being the dominant
species representing 61% and Anabaena representing 33% of the total cyanobacterial biovolume.
The flux of cyanobacterial cells into the DWTP decreased on August 21st, 2008 as shown by
probe readings and a cyanobacteria count of 2.01 ×10⁵ cells/mL with M. aeruginosa species
representing 74.5% and Anabaena sp.. Approximately 16% of the total cyanobacterial biovolume
(Fig. 1b). McQuaid et al. (2011) proposed an alert level of 2.4 RFU (equivalent of 1mm3/L total
cyanobacterial biovolume and maximum potential of 13 mg/L MC-LR) for YSI in vivo
phycocyanin probe measurements at this water source. For these two days, the in vivo
fluorescence measurements in raw water exceeded the proposed alert level while total cell-bound
actual dissolved toxins remained much lower than the calculated maximum production potential.
During both days, the cumulative flux of coagulated cyanobacterial cells to the clarifier resulted
in multi-fold accumulation (4.70×10⁶ cell/mL) of toxic cyanobacteria corresponding to a
significant mass of 4.92 g MC-LR eq. present in the total volume of the sludge bed of the clarifier
(Fig. 1b). As the solids retention time is estimated at about 42 h (2% purge) the accumulation of
cells in the sludge should reflect the composition and toxin content of the incoming
cyanobacteria, unless selective removal of certain species occurs. Interestingly, the cell speciation
in the sludge bed did remain similar with a dominance of Microcystis sp. (82% of biovolume)
and Anabaena sp. (14% of biovolume) and a relatively constant toxin cell content of 0.08 pg MC-
LR eq./cell. The sludge blanket clarifier removed 86% of the total cyanobacterial cell number
present in the raw water and reduced total toxins to 2.1 mg/L of MC-LR eq.. Although the same
cyanobacteria species were identified in post-clarifier water, a shift in the most abundant species
was observed with a dominance of Aphanizomenon sp. (1.2×10⁴ cells/mL, 76.3% of biovolume)
and Aphanothece sp. (4.7×10³ cells/mL, 2.4% of biovolume). Table 2 shows that clarifier
efficiency in removal of cyanobacteria total biovolume is species dependent. Dual media
filtration further reduced the cyanobacteria cells to 4.3×10³ cells/mL (0.157mm3/L) with
Anabaena flos-aquae and Aphanothece minutissima remaining the most abundant species.
However, in filtered water, small concentrations of 7.3×10² cells/mL of Microcystis sp. still
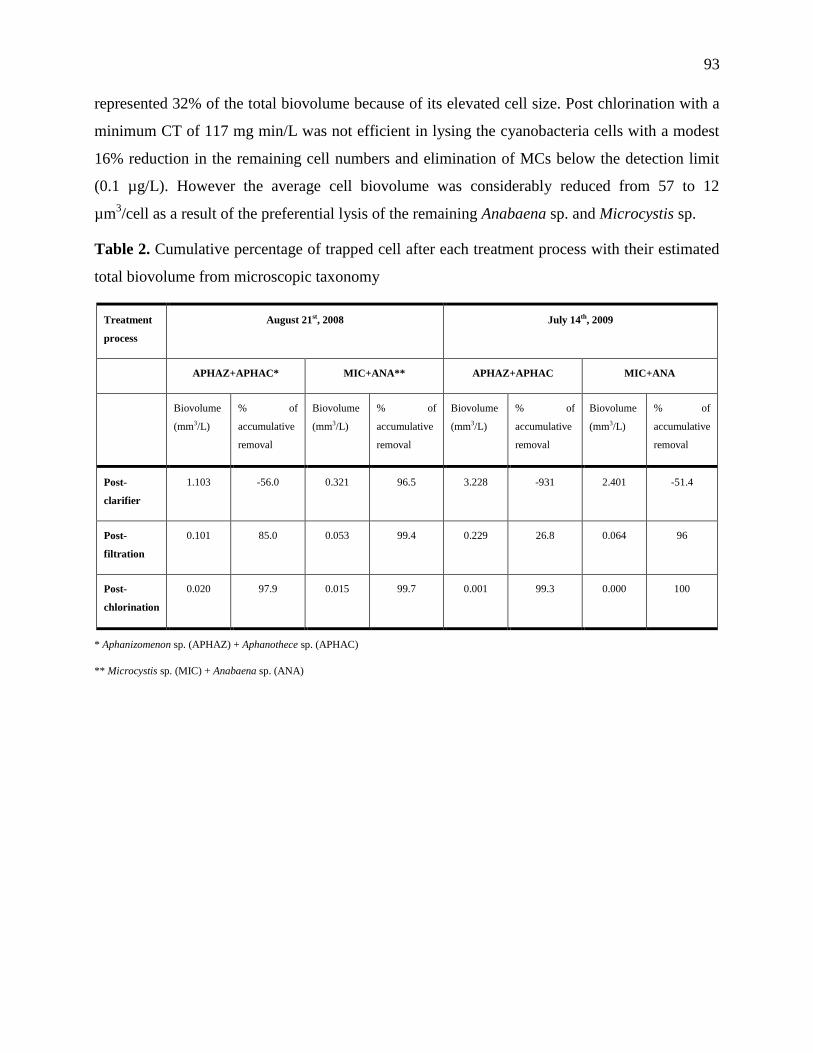
93
represented 32% of the total biovolume because of its elevated cell size. Post chlorination with a
minimum CT of 117 mg min/L was not efficient in lysing the cyanobacteria cells with a modest
16% reduction in the remaining cell numbers and elimination of MCs below the detection limit
(0.1 µg/L). However the average cell biovolume was considerably reduced from 57 to 12
µm3/cell as a result of the preferential lysis of the remaining Anabaena sp. and Microcystis sp.
Table 2. Cumulative percentage of trapped cell after each treatment process with their estimated
total biovolume from microscopic taxonomy
Treatment
process
August 21st, 2008 July 14th, 2009
APHAZ+APHAC* MIC+ANA** APHAZ+APHAC MIC+ANA
Biovolume
(mm3/L)
% of
accumulative
removal
Biovolume
(mm3/L)
% of
accumulative
removal
Biovolume
(mm3/L)
% of
accumulative
removal
Biovolume
(mm3/L)
% of
accumulative
removal
Post-
clarifier
1.103 -56.0 0.321 96.5 3.228 -931 2.401 -51.4
Post-
filtration
0.101 85.0 0.053 99.4 0.229 26.8 0.064 96
Post-
chlorination
0.020 97.9 0.015 99.7 0.001 99.3 0.000 100
* Aphanizomenon sp. (APHAZ) + Aphanothece sp. (APHAC)
** Microcystis sp. (MIC) + Anabaena sp. (ANA)
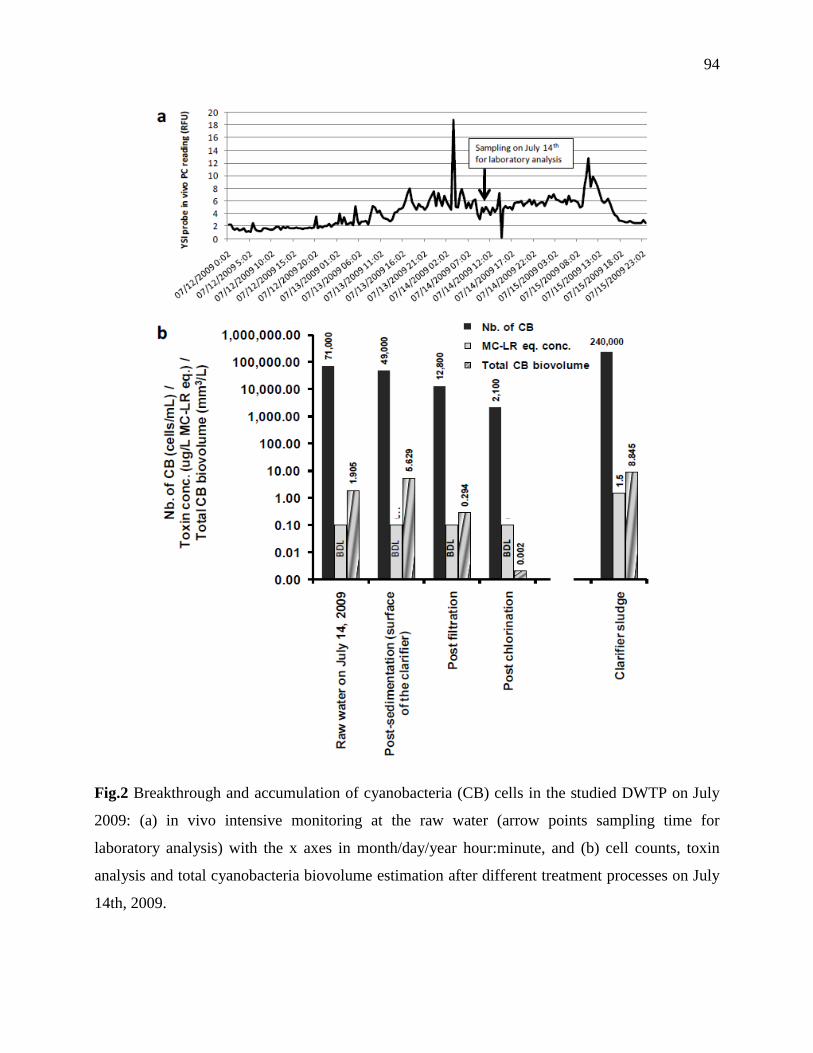
94
Fig.2 Breakthrough and accumulation of cyanobacteria (CB) cells in the studied DWTP on July
2009: (a) in vivo intensive monitoring at the raw water (arrow points sampling time for
laboratory analysis) with the x axes in month/day/year hour:minute, and (b) cell counts, toxin
analysis and total cyanobacteria biovolume estimation after different treatment processes on July
14th, 2009.
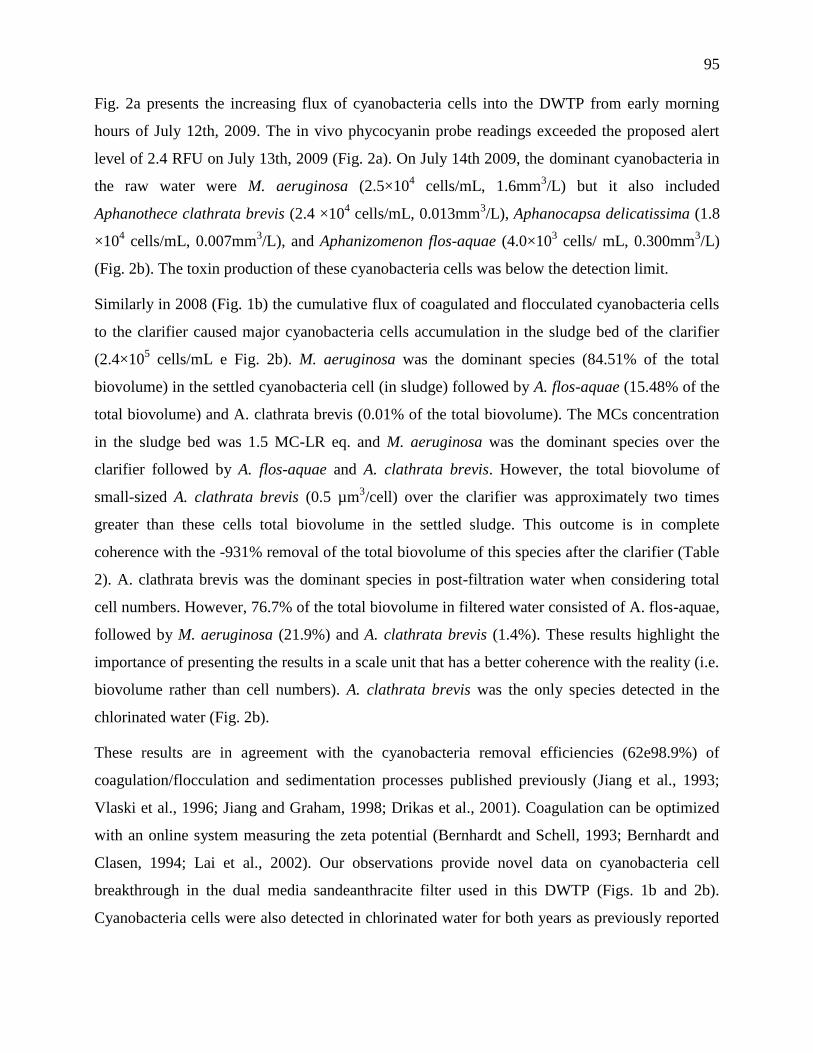
95
Fig. 2a presents the increasing flux of cyanobacteria cells into the DWTP from early morning
hours of July 12th, 2009. The in vivo phycocyanin probe readings exceeded the proposed alert
level of 2.4 RFU on July 13th, 2009 (Fig. 2a). On July 14th 2009, the dominant cyanobacteria in
the raw water were M. aeruginosa (2.5×10⁴ cells/mL, 1.6mm
3/L) but it also included
Aphanothece clathrata brevis (2.4 ×10⁴ cells/mL, 0.013mm
3/L), Aphanocapsa delicatissima (1.8
×104 cells/mL, 0.007mm
3/L), and Aphanizomenon flos-aquae (4.0×10
3 cells/ mL, 0.300mm
3/L)
(Fig. 2b). The toxin production of these cyanobacteria cells was below the detection limit.
Similarly in 2008 (Fig. 1b) the cumulative flux of coagulated and flocculated cyanobacteria cells
to the clarifier caused major cyanobacteria cells accumulation in the sludge bed of the clarifier
(2.4×10⁵ cells/mL e Fig. 2b). M. aeruginosa was the dominant species (84.51% of the total
biovolume) in the settled cyanobacteria cell (in sludge) followed by A. flos-aquae (15.48% of the
total biovolume) and A. clathrata brevis (0.01% of the total biovolume). The MCs concentration
in the sludge bed was 1.5 MC-LR eq. and M. aeruginosa was the dominant species over the
clarifier followed by A. flos-aquae and A. clathrata brevis. However, the total biovolume of
small-sized A. clathrata brevis (0.5 µm3/cell) over the clarifier was approximately two times
greater than these cells total biovolume in the settled sludge. This outcome is in complete
coherence with the -931% removal of the total biovolume of this species after the clarifier (Table
2). A. clathrata brevis was the dominant species in post-filtration water when considering total
cell numbers. However, 76.7% of the total biovolume in filtered water consisted of A. flos-aquae,
followed by M. aeruginosa (21.9%) and A. clathrata brevis (1.4%). These results highlight the
importance of presenting the results in a scale unit that has a better coherence with the reality (i.e.
biovolume rather than cell numbers). A. clathrata brevis was the only species detected in the
chlorinated water (Fig. 2b).
These results are in agreement with the cyanobacteria removal efficiencies (62e98.9%) of
coagulation/flocculation and sedimentation processes published previously (Jiang et al., 1993;
Vlaski et al., 1996; Jiang and Graham, 1998; Drikas et al., 2001). Coagulation can be optimized
with an online system measuring the zeta potential (Bernhardt and Schell, 1993; Bernhardt and
Clasen, 1994; Lai et al., 2002). Our observations provide novel data on cyanobacteria cell
breakthrough in the dual media sandeanthracite filter used in this DWTP (Figs. 1b and 2b).
Cyanobacteria cells were also detected in chlorinated water for both years as previously reported
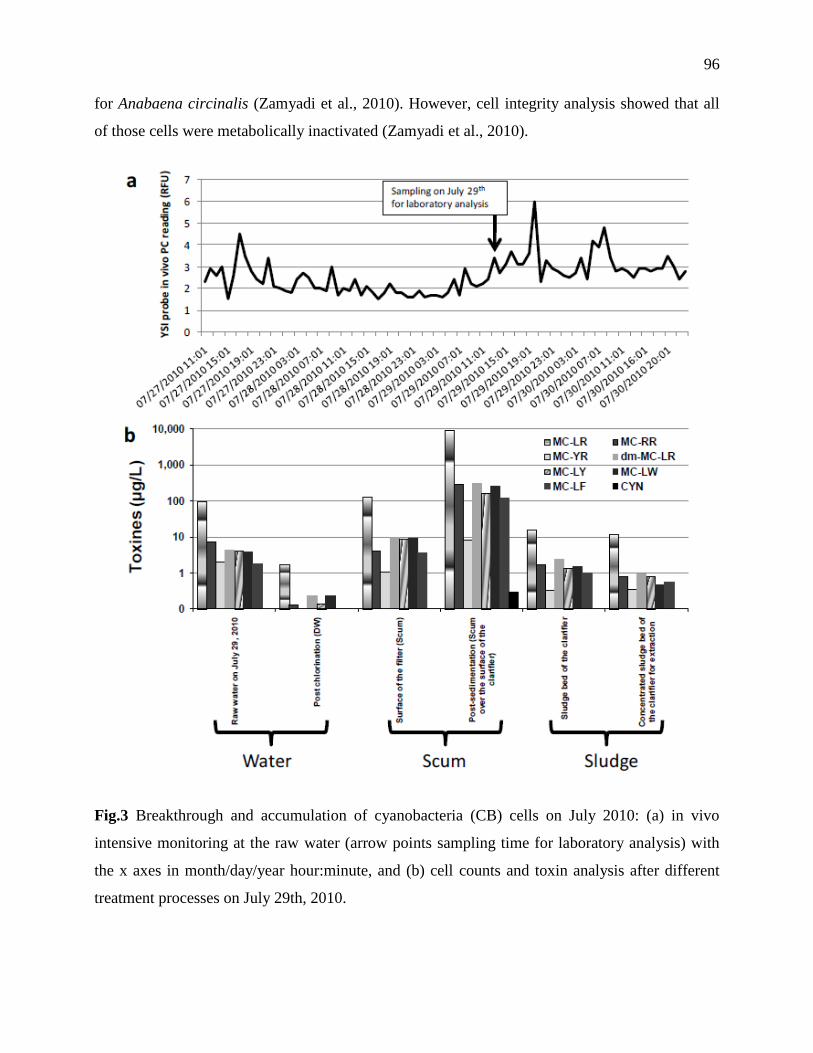
96
for Anabaena circinalis (Zamyadi et al., 2010). However, cell integrity analysis showed that all
of those cells were metabolically inactivated (Zamyadi et al., 2010).
Fig.3 Breakthrough and accumulation of cyanobacteria (CB) cells on July 2010: (a) in vivo
intensive monitoring at the raw water (arrow points sampling time for laboratory analysis) with
the x axes in month/day/year hour:minute, and (b) cell counts and toxin analysis after different
treatment processes on July 29th, 2010.
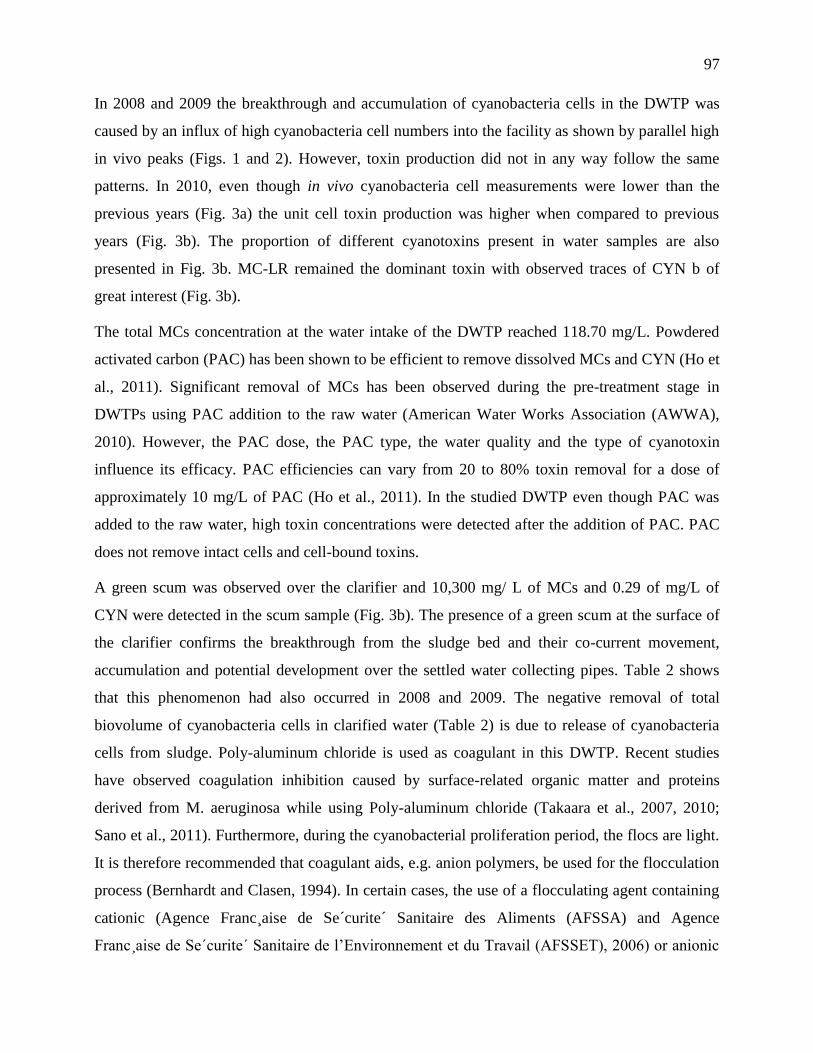
97
In 2008 and 2009 the breakthrough and accumulation of cyanobacteria cells in the DWTP was
caused by an influx of high cyanobacteria cell numbers into the facility as shown by parallel high
in vivo peaks (Figs. 1 and 2). However, toxin production did not in any way follow the same
patterns. In 2010, even though in vivo cyanobacteria cell measurements were lower than the
previous years (Fig. 3a) the unit cell toxin production was higher when compared to previous
years (Fig. 3b). The proportion of different cyanotoxins present in water samples are also
presented in Fig. 3b. MC-LR remained the dominant toxin with observed traces of CYN b of
great interest (Fig. 3b).
The total MCs concentration at the water intake of the DWTP reached 118.70 mg/L. Powdered
activated carbon (PAC) has been shown to be efficient to remove dissolved MCs and CYN (Ho et
al., 2011). Significant removal of MCs has been observed during the pre-treatment stage in
DWTPs using PAC addition to the raw water (American Water Works Association (AWWA),
2010). However, the PAC dose, the PAC type, the water quality and the type of cyanotoxin
influence its efficacy. PAC efficiencies can vary from 20 to 80% toxin removal for a dose of
approximately 10 mg/L of PAC (Ho et al., 2011). In the studied DWTP even though PAC was
added to the raw water, high toxin concentrations were detected after the addition of PAC. PAC
does not remove intact cells and cell-bound toxins.
A green scum was observed over the clarifier and 10,300 mg/ L of MCs and 0.29 of mg/L of
CYN were detected in the scum sample (Fig. 3b). The presence of a green scum at the surface of
the clarifier confirms the breakthrough from the sludge bed and their co-current movement,
accumulation and potential development over the settled water collecting pipes. Table 2 shows
that this phenomenon had also occurred in 2008 and 2009. The negative removal of total
biovolume of cyanobacteria cells in clarified water (Table 2) is due to release of cyanobacteria
cells from sludge. Poly-aluminum chloride is used as coagulant in this DWTP. Recent studies
have observed coagulation inhibition caused by surface-related organic matter and proteins
derived from M. aeruginosa while using Poly-aluminum chloride (Takaara et al., 2007, 2010;
Sano et al., 2011). Furthermore, during the cyanobacterial proliferation period, the flocs are light.
It is therefore recommended that coagulant aids, e.g. anion polymers, be used for the flocculation
process (Bernhardt and Clasen, 1994). In certain cases, the use of a flocculating agent containing
cationic (Agence Franc¸aise de Se´curite´ Sanitaire des Aliments (AFSSA) and Agence
Franc¸aise de Se´curite´ Sanitaire de l’Environnement et du Travail (AFSSET), 2006) or anionic

98
(Bernhardt and Clasen, 1993) polymers would allow a better elimination of the cyanobacteria.
Furthermore, aluminum sulfate can be a more efficient flocculating agent than iron salts (Pietsch
et al., 2002). Significant cyanotoxin release during flocculation/filtration has been reported
(Pietsch et al., 2002). Hydraulic stress (turbulence) caused by flocculation/filtration and pressure
gradients in pipes and filters have a destabilizing effect on the integrity of the cyanobacterial
cells. However, the stability of cyanobacterial cells varies according to their growth phase, thus,
depending on their growth phase; flocculation/filtration may lead to the release of toxins (Pietsch
et al., 2002). Pietsch et al. (2002) showed that cells captured in the clarifiers can release all
cyanotoxins within the first 48 h in clarifiers with solid retention time of over 48 h. The estimated
sludge retention time in the clarifiers in this study was approximately 42 h (Table 1).
Cyanobacteria lysis retained on the filters can occur after 24e48 h of retention and good
management of the filters maintenance process is paramount (Lepisto et al., 1994; Chorus and
Bartram, 1999).
Total MCs concentration in chlorinated drinking water reached 2.47 µg/L (Fig. 3b) exceeding the
recommended MCs alert levels for drinking water (SD section Table SD-I2). MC-LR was the
dominant analog with the highest concentration (1.74 µg/L). Results from laboratory scale
chlorination experiments are contradictory. While chlorination of dissolved MCs in ultrapure and
natural water was efficient (Rodriguez et al., 2007; Ho et al., 2010), Daly et al. (2007) observed
14.1e94.1% removal of total MCs produced by M. aeruginosa cells. Thus, 2010 toxins
monitoring demonstrates that it is essential to verify the chlorination efficiency in the presence of
high concentrations of toxins and cellular materials, and questions the strength of chlorination as
a barrier as predicted by laboratory kinetic oxidation trials.
A total MCs concentration of 15.5 µg/L was measured in the concentrated sludge of the clarifier
(in the sludge concentrator for extraction). Toxic cyanobacteria management in the DWTP must
also consider the permanent elimination and/or reuse of the sludge. Sludge treatment needs
particular attention as intracellular toxins might be released during sludge handling and
supernatant recycling could increase the loads of toxins for treatment.
The recent published guidelines recommend cyanobacteria biweekly monitoring at alert level 3
(65,000 cells/mL) (Newcombe, 2009; Newcombe et al., 2010). Our observations suggest that low
frequency sampling may lead to the underestimation of significant peak of toxic cyanobacteria
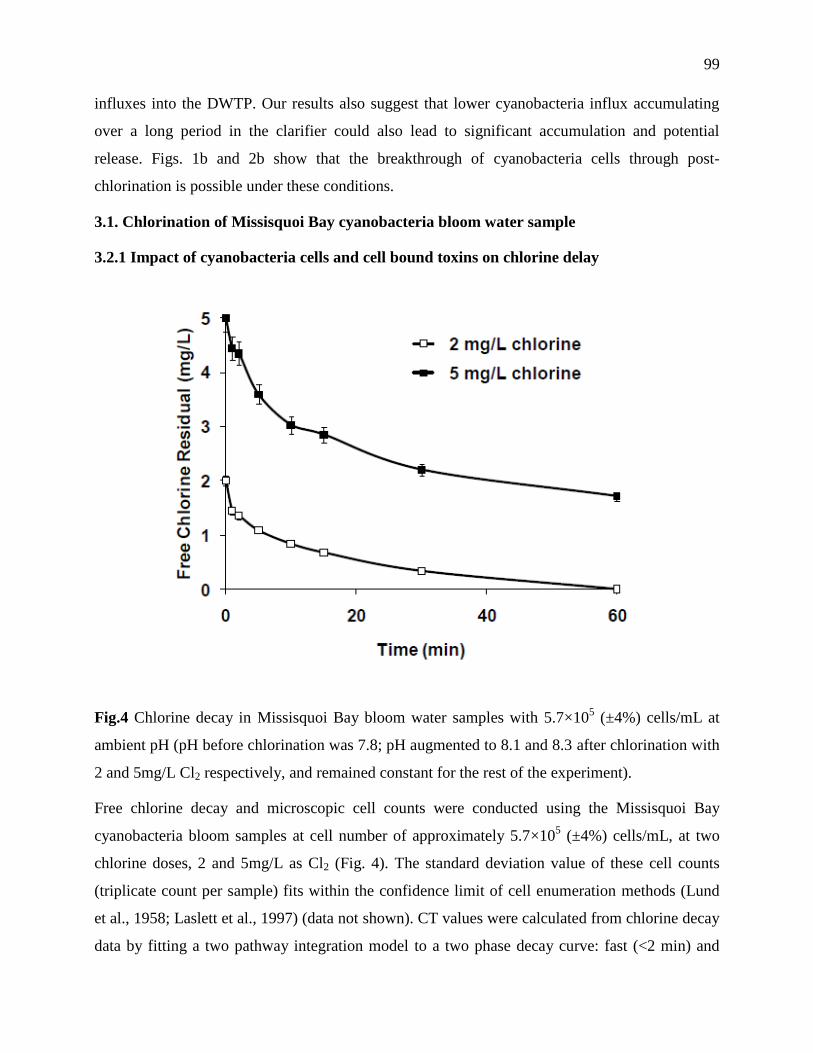
99
influxes into the DWTP. Our results also suggest that lower cyanobacteria influx accumulating
over a long period in the clarifier could also lead to significant accumulation and potential
release. Figs. 1b and 2b show that the breakthrough of cyanobacteria cells through post-
chlorination is possible under these conditions.
3.1. Chlorination of Missisquoi Bay cyanobacteria bloom water sample
3.2.1 Impact of cyanobacteria cells and cell bound toxins on chlorine delay
Fig.4 Chlorine decay in Missisquoi Bay bloom water samples with 5.7×10⁵ (±4%) cells/mL at
ambient pH (pH before chlorination was 7.8; pH augmented to 8.1 and 8.3 after chlorination with
2 and 5mg/L Cl2 respectively, and remained constant for the rest of the experiment).
Free chlorine decay and microscopic cell counts were conducted using the Missisquoi Bay
cyanobacteria bloom samples at cell number of approximately 5.7×10⁵ (±4%) cells/mL, at two
chlorine doses, 2 and 5mg/L as Cl2 (Fig. 4). The standard deviation value of these cell counts
(triplicate count per sample) fits within the confidence limit of cell enumeration methods (Lund
et al., 1958; Laslett et al., 1997) (data not shown). CT values were calculated from chlorine decay
data by fitting a two pathway integration model to a two phase decay curve: fast (<2 min) and
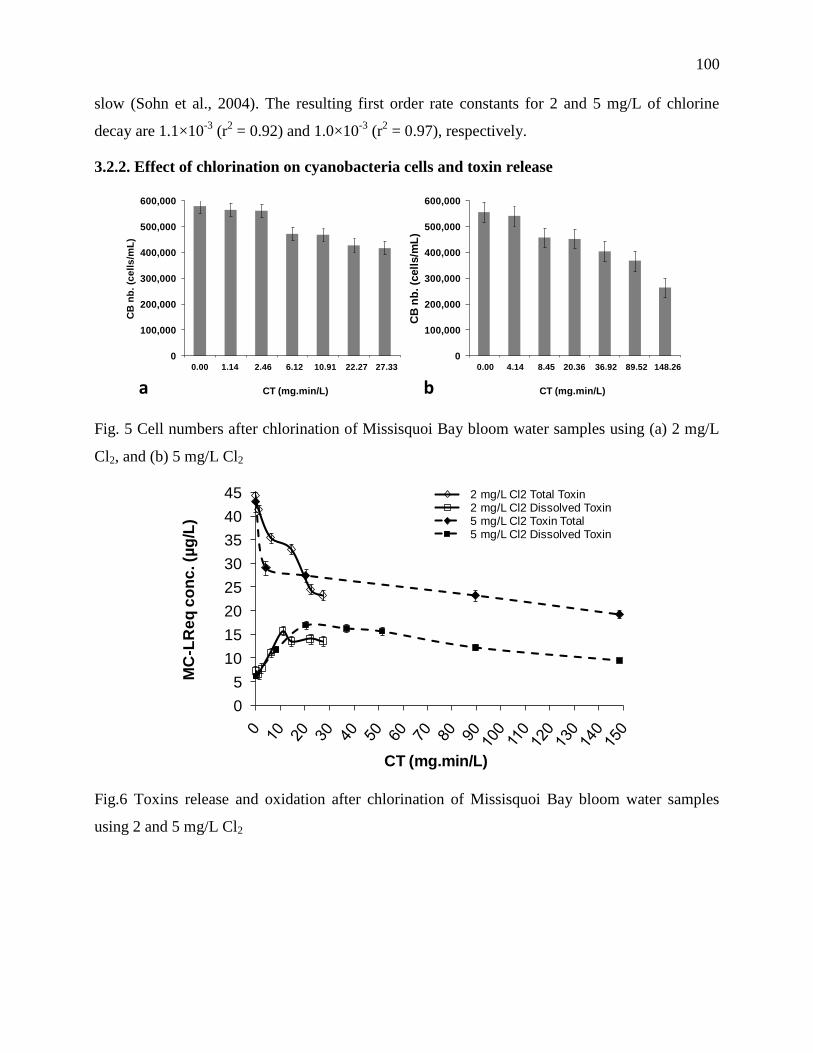
100
slow (Sohn et al., 2004). The resulting first order rate constants for 2 and 5 mg/L of chlorine
decay are 1.1×10⁻³
(r2 = 0.92) and 1.0×10
-3 (r
2 = 0.97), respectively.
3.2.2. Effect of chlorination on cyanobacteria cells and toxin release
Fig. 5 Cell numbers after chlorination of Missisquoi Bay bloom water samples using (a) 2 mg/L
Cl2, and (b) 5 mg/L Cl2
Fig.6 Toxins release and oxidation after chlorination of Missisquoi Bay bloom water samples
using 2 and 5 mg/L Cl2
0
100,000
200,000
300,000
400,000
500,000
600,000
0 22.27
CB
nb
. (c
ell
s/m
L)
CT (mg.min/L)
0
100,000
200,000
300,000
400,000
500,000
600,000
0 89.52
CB
nb
. (c
ell
s/m
L)
CT (mg.min/L)
0.00 4.14 8.45 20.36 36.92 89.52 148.260.00 1.14 2.46 6.12 10.91 22.27 27.33
a b
0
5
10
15
20
25
30
35
40
45
MC
-LR
eq
co
nc
. (µ
g/L
)
CT (mg.min/L)
2 mg/L Cl2 Total Toxin2 mg/L Cl2 Dissolved Toxin5 mg/L Cl2 Toxin Total5 mg/L Cl2 Dissolved Toxin

101
Fig.7 Proportion of seven cyanobacteria (CB) species out of total cyanobacteria cell in
Missisquoi Bay bloom sample (a) before chlorination (5.7×10⁵ (±4%) cells/mL), and (b) after
chlorination using a CT of 148 mg.min/L (2.7×10⁵ (±4%) cells/mL – 53% reduction of total cell
numbers)
The response of a cyanobacteria bloom sample from Missisquoi Bay of approximately 5.7×10⁵
(±4%) cells/mL to chlorine doses of 2 and 5 mg/L at ambient pH (8.3) was evaluated. For these
bloom samples, 28% to 53% reductions of total number of cells, corresponding to full cell lysis,
were observed at the end of the chlorination period for both chlorine doses (Fig. 5). However it is
not possible to categorize the remaining cells as damaged membrane or metabolically inactive
cells as cell-bound toxin are still observed even after the highest CT (148.26 mg.min/L) (Fig. 6).
In previous studies (Daly et al. 2007; Lin et al. 2009; Zamyadi et al. 2010), fast release of cell-
bound compounds have been observed when pre-chlorinating (with low chlorine doses, 1-5 mg/L
Cl2) natural water loaded with Anabaena sp. and Microcystis sp. However this study presents the
first set of experiments using natural bloom samples incorporating seven different cyanobacteria
species present but dominated by Microcystis sp (Fig. 7). Furthermore, after the chlorination with
a CT of 148 mg.min/L and a 53% reduction in total cell number the proportion of cyanobacteria
species with regards to total number of cells present was almost the same as before chlorination
with slight declines in Anabaena sp. and Aphanothece sp (Fig. 7). DOC variations before and
after chlorination were <0.2 mg/L. Similar results were observed in chlorination of natural bloom
samples in a recent study (Zamyadi et al., in press).
It is possible to assume a first-order reaction with regards to chlorine reaction and the reduction
of total cell numbers (Daly et al. 2007; Lin et al. 2009). Thus the reaction between chlorine and
Anabaena4%
Aphanizomenon5%
Aphanothece2%
Coelosphaerium
0.1%
Microcystis82%
Phormidium6%
Woronichiana0.9%Anabaena
6%
Aphanizomenon
3%
Aphanothece3%
Coelosphaerium0.1%
Microcystis82%
Phormidium5%
Woronichiana0.9%
a b
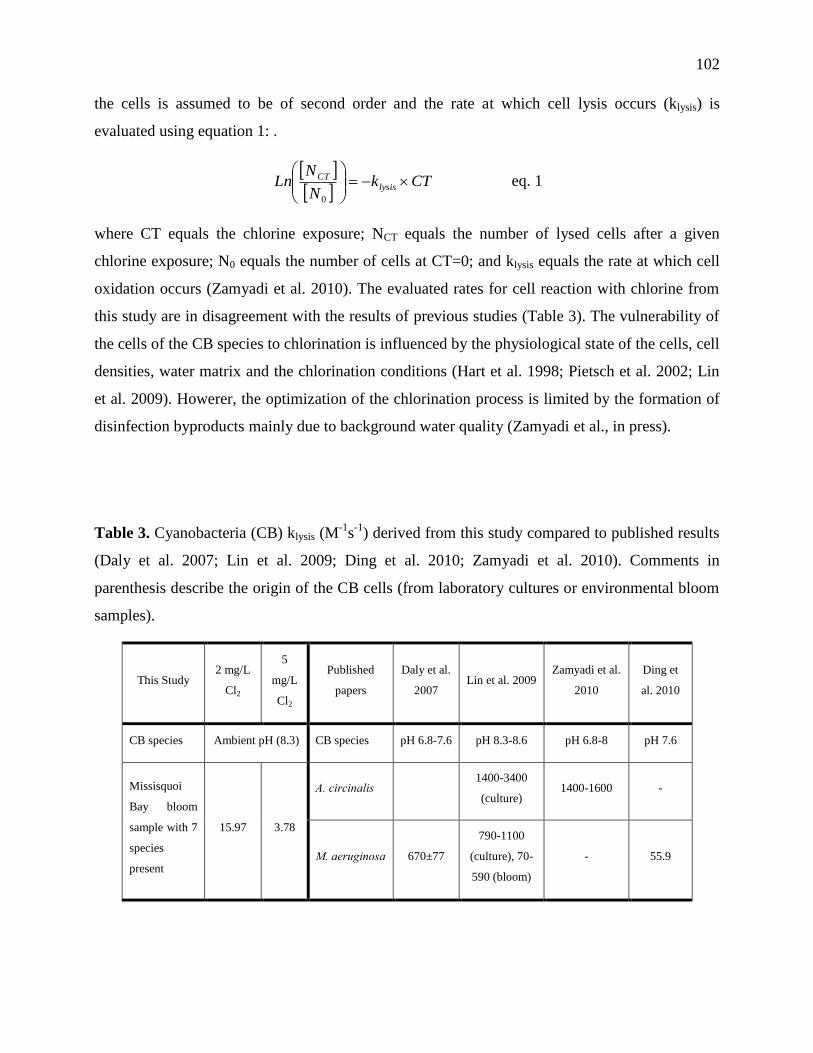
102
the cells is assumed to be of second order and the rate at which cell lysis occurs (klysis) is
evaluated using equation 1: .
CTkN
NLn lysis
CT
0
eq. 1
where CT equals the chlorine exposure; NCT equals the number of lysed cells after a given
chlorine exposure; N0 equals the number of cells at CT=0; and klysis equals the rate at which cell
oxidation occurs (Zamyadi et al. 2010). The evaluated rates for cell reaction with chlorine from
this study are in disagreement with the results of previous studies (Table 3). The vulnerability of
the cells of the CB species to chlorination is influenced by the physiological state of the cells, cell
densities, water matrix and the chlorination conditions (Hart et al. 1998; Pietsch et al. 2002; Lin
et al. 2009). Howerer, the optimization of the chlorination process is limited by the formation of
disinfection byproducts mainly due to background water quality (Zamyadi et al., in press).
Table 3. Cyanobacteria (CB) klysis (M-1
s-1
) derived from this study compared to published results
(Daly et al. 2007; Lin et al. 2009; Ding et al. 2010; Zamyadi et al. 2010). Comments in
parenthesis describe the origin of the CB cells (from laboratory cultures or environmental bloom
samples).
This Study 2 mg/L
Cl2
5
mg/L
Cl2
Published
papers
Daly et al.
2007 Lin et al. 2009
Zamyadi et al.
2010
Ding et
al. 2010
CB species Ambient pH (8.3) CB species pH 6.8-7.6 pH 8.3-8.6 pH 6.8-8 pH 7.6
Missisquoi
Bay bloom
sample with 7
species
present
15.97 3.78
A. circinalis 1400-3400
(culture) 1400-1600 -
M. aeruginosa 670±77
790-1100
(culture), 70-
590 (bloom)
- 55.9

103
4. Conclusion
Sampling once or twice a week on fixed day fails to spot the highly temporal variability of
cyanobacteria bloom presence at the water intake of the DWTP. Non-event based sampling
causes an underestimation of the transitory cyanobacteria bloom events and the accumulation and
breakthrough of toxic cyanobacteria in the DWTP. A monitoring strategy including intensive in
vivo fluorescence measurements and event-based sampling would help to prevent the
documented event of 2008-2010. DWTP operators should consider the details of the operational
facilities before interpreting laboratory derived data for real environmental conditions. This paper
provides the novel information on accumulation of potentially toxic cyanobacteria cells inside
DWTPs, particularly the clarification and filtration processes. Future systematic studies of these
phenomena in full scale operational DWTPs are required to establish the key factors for
cyanobacteria accumulation and removal, and prepare efficient management plans.
Furthermore, our findings demonstrate that breakthrough of cyanotoxins at concentration
exceeding the health-based exposure alert levels can occur, even for toxins considered to be
readily oxidized by chlorine. Finally, the extrapolation of laboratory scale chlorination
experiments based on dissolved toxins and cultured cyanobacteria species to the operational
conditions requires further investigation.
Acknowledgment
This study was financially supported by Natural Sciences and Engineering Research Council of
Canada (NSERC) Industrial Chair on Drinking Water at École Polytechnique de Montréal. The
authors acknowledge the support of the operators at the MB DWTP, Yves Fontaine, Julie
Philibert, Mouhamed Ndong, and Serge Paquet for their technical help.
104
References
Agence Française de Sécurité Sanitaire des Aliments (AFSSA) and Agence Française de Sécurité
Sanitaire de l'Environnement et du Travail (AFSSET) (2006) Avis de relatif à l'évaluation
des risques liés à la présence de cyanobactéries dans les cours d'eau destinés à la baignade
et/ou à d'autres usages. AFSSA-AFSSET, p: 232, France.
Ahn, C.-Y., Joung, S.-H., Yoon, S.-K. and Oh, H.-M. (2007) Alternative alert system for
cyanobacterial bloom, using phycocyanin as a level determinant. The Journal of
Microbiology 45(2), 98-104.
American Public Health Association (APHA) (1998) Standard methods for the examination of
water and wastewater (20th
Edition). American Water Works Association (AWWA) and
the Water Environment Federation, Washington, DC, USA.
American Water Works Association (AWWA) (2010). M57-Algae source to treatment. Denver,
Colorado, USA.
Bernhardt, H. and Clasen, J. (1993) Eutrophication control as an essential condition for an
optimum disinfection. Water Supply: International Water Supply Association 11(3-4), 89-
108.
Bernhardt, H. and Clasen, J. (1991) Flloculation of micro-organisms. Water Supply: Research
and Technology-Aqua 40(2), 76-87.
Bernhardt, H. and Clasen, J. (1994) Investigations into the flocculation mechanisms of small
algal cells. Water Supply: Research and Technology-Aqua 43(5), 222-232.
Bernhardt, H. and Schell, H. (1993) Control of flocculants by use of a streaming current detector
(SCD). Water Supply: Research and Technology-Aqua 42(4), 239-2581.
Carmichael, W.W., Azevedo, S., An, J.S., Molica, R.J.R., Jochimsen, E.M., Lau, S., Rinehart,
K.L., Shaw, G.R. and Eaglesham, G.K. (2001) Human fatalities from Cyanobacteria:
chemical and biological evidence for Cyanotoxins. Environmental Health Perspectives
109(7), 663-668.
Chorus, I. and J. Bartram (1999) Toxic cyanobacteria in water: a guide to their public health
consequences, monitoring and management. World Organizaton Health (WHO), London,
United Kingdom.
Codd, G.A., Morrison, L.F. and Metcalf, J.S. (2005) Cyanobacterial toxins: risk management for
health protection. Toxicology and Applied Pharmacology 203(3), 264-272.
Dale, B., Edwards, M., Reid, P.C., In: Granéli, E. and Turner, J.T. (Eds), Ecology of Harmful
Algae., Ed. (2006). Climate change and harmful algal blooms. New Yrok, Springer.
Daly, R. I., Ho, L. and Brookes, J. D. (2007) Effect of chlorination on microcystis aeruginosa
cell integrity and subsequent microcystin release and degradation. Environmental Science
and Technology 41(12), 4447-4453.
Dell'Aversano, C., Eaglesham, G. K. and Quilliam, M.A. (2004) Analysis of cyanobacterial
toxins by hydrophilic interaction liquid chromatography-mass spectrometry. Journal of
Chromatography A 1028(1), 155-164.

105
Dickens, C. W. S. and Graham, P. M. (1995) The rupture of algae during abstraction from a
reservoir and the effects on water-quality. Water Supply Research and Technology-Aqua
44(1), 29-37.
Ding, J., Shi, H., Timmons, T. and Adams, C. (2010) Release and removal of microcystins from
microcystis during oxidative-, physical-, and UV-based disinfection. Journal of
Environmental Engineering 136, 2-11.
Drikas, M., Chow, C.W.K., House, J. and Burch, M.D. (2001) Using coagulation, flocculation
and settling to remove toxic cyanobacteria. Journal of American Water Works
Association 93 (2), 100–111.
Elliott, J. A., Jones, I. D. and Thackeray, S. J. (2006) Testing the sensitivity of phytoplankton
communities to changes in water temperature and nutrient load, in a temperate lake.
Hydrobiologia 559, 401-411.
European Commission (2005). European Commission under the Fifth Framework Programme
and contributing to the implementation of the Key Action "Sustainable Management and
Quality of Water": Best practice guidance for management of cyanotoxins in water
supplies (Annexe 1): 143.
Gregor, J., Marsalek, B. and Sipkova, H. (2007) Detection and estimation of potentially toxic
cyanobacteria in raw water at the drinking water treatment plant by in vivo fluorescence
method. Water Research 41(1), 228-234.
Haddix, P.L., Hughley, C.J. and Lechevallier, M.W. (2007) Occurrence of microcystins in 33 US
water supplies. Journal of the American Water Works Association 99(9), 118-125.
Hart, J., Fawell, J.K., Croll, B., Marsalek, B., Dolej, F., Stadeckova, A., Bruchet, A., Bernazeau,
F., Baudin, I. and Pieronne, P. (1998) Algal toxins in surface water: origins and removal
during drinking water treatment processes. Special Topic 18, Water Supply 18, 611-616.
Henderson, R., Parsons, S. A. and Jefferson, B. (2008) The impact of algal properties and pre-
oxidation on solid-liquid separation of algae. Water Research 42(8-9), 1827-1845.
Ho, L., Kayal, N., Trolio, R. and Newcombe, G. (2010) Determining the fate of Microcystis
aeruginosa cells and microcystin toxins following chlorimination. Water Science and
Technology 62(2),442-450.
Ho, L., Lambling, P., Bustamante, H., Duker P. and Newcombe G. (2011) Application of
powdered activated carbon for the adsorption of cylindrospermopsin and microcystin
toxins from drinking water supplies. Water Research 45, 2954-2964.
Ho, L., Onstad, G., von Gunten, U., Rinck-Pfeiffer, S., Craig, K. and Newcombe, G. (2006)
Differences in the chlorine reactivity of four microcystin analogues. Water Research
40(6), 1200-1209.
Jiang, J., Graham, N.J.D. and Harward, C. (1993) Comparison of polyferric sulphate with other
coagulants for the removal of algae-derived organic matter. Water Science and
Technology 27 (11), 221–230.
Jiang, J. and Graham, N.J.D. (1998) Preliminary evaluation of the performance of new pre-
polymerised inorganic coagulants for lowland surface water treatment. Water Science and
Technology 37 (2), 121–128.
106
Jöhnk, K.D., Huisman, J., Sharples, J., Sommeijer, B., Visser, P.M. and Strom, J.M. (2008)
Summer heatwaves promote blooms of harmful cyanobacteria. Global Change Biology
14(3), 495-512.
Lahti, K., Rapala,, J., Kivimäki, A-L., Kukkonen, J., Niemelä, M. and Sivonen, K. (2001)
Occurrence of microcystins in raw water sources and treated drinking water of Finnish
waterworks. Water Science and Technology 43, 225-228.
Lai, W.-L., Yeh, H.-H., Tseng, I.-C., Lin, T.-F., Chen, J.-J. and Wang, G.T. (2002) Conventional
versus advanced treatment for eutrophic source water. Journal of the American Water
Works Association 94(12), 96-108.
Laslett, G. M., Clark, R. M. and Jones, G. J. (1997 ) Estimating the precision of filamentous blue-
green algae cell concentration from a single sample. Environmetrics 8(4): 313-339.
Lepisto, L., Lahti, K., Niemi, J. and Fardig, M. (1994) Removal of cyanobacteria and other
phytoplankton in four finnish waterworks. Hydrobiology 75, 167-181.
Lin, T-F., Chang, D-W., Lien, S-K., Tseng, Y-S., Chiu Y-T, and Wang Y-S. (2009) Effect of
chlorination on the cell integrity of two noxious cyanobacteria and their releases of
odorants. Journal of Water Supply: Research and Technology—AQUA 58(8), 539-551.
Liu, Y., Chen, W., Li, D., Huang, Z., Shen Y. and Liu, Y. (2011). Cyanobacteria-/cyanotoxin-
contaminations and eutrophication status before Wuxi Drinking Water Crisis in Lake
Taihu, China. Journal of Environmental Sciences 23(4), 575–581.
Lund, J. W., Kipling, C. and LeCren, E. D. (1958) The inverted microscope method of estimating
algal number and the statistical basis of estimations by counting. Hydrobiologia 11(2),
143-170.
McQuaid, N., Zamyadi, A., Prévost, M., Bird, D. F. and Dorner, S. (2011) Use of in vivo
phycocyanin fluorescence to monitor potential microcystin-producing cyanobacterial
biovolume in a drinking water source. Journal of Environmental Monitoring 13, 455–463.
Merel, S., Clément, M. and Thomas, O. (2010). Review State of the art on cyanotoxins in water
and their behaviour towards chlorine. Toxicon 55, 677–691.
MDDEP (Ministère du Développement durable, Environnement et Parcs) (2008) Résultats de
cyanobactéries et cyanotoxines à sept stations de production d’eau potable (2004-2006).
Quebec Government, Canada.
Newcombe, G., House, J., Ho, L., Baker P. and Burch M. (2010). Management Strategies for
Cyanobacteria (Blue-Green Algae): A Guide for Water Utilities. Research Report No 74.
Adelaide, SA, Australia.
Newcombe, G. (2009). International Guidance Manual for the Management of Toxic
Cyanobacteria. London, Global Water Research Coalition and Water Quality Research
Australia.
Park, H. D., Iwami, C., Watanabe, M. F., Harada, K. I., Okino T. and Hayashi, H. (1998)
Temporal variabilities of the concentrations of intra-and extra-cellular microcystin and
toxic Microcystis species in a hypertrophic lake, Lake Suwa, Japan (1991–1994).
Environmental Toxicology 13(1), 61–72.

107
Paul, V. J. (228) Global warming and cyanobacterial harmful algal blooms (Chapter 11) In
Cyanobacterial HarmfulAlgal Blooms: State of the Science and Research Needs. Hudnell,
H. K., Ed, Springer Science+Business Media, LLC, p 383-416, New York, USA.
Pietsch, J., Bornmann, K. and Schmidt, W. (2002) Relevance of intra- and extracellular
cyanotoxins for drinking water treatment. Acta Hydrochimica and Hydrobiologica 30(1),
7-15.
Robert, C., Tremblay, H. and DeBlois, C. (2005). Cyanobactéries et cyanotoxines au Québec:
suivi à six stations de production d'eau potable (2001-2003). Québec, Canada, Ministère
du développement durable, environnement et des parcs (MDDEP). Gouvernement du
Québec, Quebec, Canada.
Rodriguez, E., Onstad, G. D., Kull, T. P. J., Metcalf, J. S., Acero, J. L. and von Gunten, U. (2007)
Oxidative elimination of cyanotoxins: comparison of ozone, chlorine, chlorine dioxide
and permanganate. Water Research 41(15), 3381-3393.
Sano, D., Ishifuji, S., Sato, Y., Imae, Y., Takaara, T., Masago, Y. and Omura, T. (2011)
Identification and characterization of coagulation inhibitor proteins derived from
cyanobacterium Microcystis aeruginosa. Chemosphere 82(8), 1096-1102.
Schmidt, W., Petzoldt, H., Bornmann, K., Imhof, L. and Moldaenke, C. (2009). Use of
cyanopigment determination as an indicator of cyanotoxins in drinking water. Water
Science and Technology 59(8), 1531-1540.
Schmidt, W., Willmitzer, H., Bornmann, K. and Pietsch, J. (2002). Production of drinking water
from raw water containing cyanobacteria. Pilot plant studies for assessing the risk of
microcystin breakthrough. Environmental Toxicology 17(4): 375-385.
Segura, P.A., Gagnon, C. and Sauvé, S. (2007) A fully automated on-line preconcentration and
liquid chromatography-tandem mass spectrometry method for the analysis of anti-
infectives in wastewaters. Analytica Chimica Acta 604, 147-157.
Simomeau, M. (2007). État de l’écosystème aquatique du bassin versant de la baie Missisquoi:
faits saillants 2001-2004. Ministère du Développement Durable, de l’Environnement et
des Parcs, Direction du suivi de l’état de l’environnement, Québec, Canada.
Sohn, J., Amy, G., Cho, J., Lee, Y. and Yoon, Y. (2004) Disinfectant decay and disinfection by-
products formation model development: chlorination and ozonation by-products. Water
Research 38(10), 2461-2478.
Spoof, L., Neffling M-R. and Meriluoto J. (2010) Fast separation of microcystins and nodularins
on narrow-bore reversed-phase columns coupled to a conventional HPLC system.
Toxicon 55(5), 954-964.
Stoob, K., Singer, H.P., Goetz, C.W., Ruff, M. and Mueller, S.R. (2005) Fully automated online
solid phase extraction coupled directly to liquid chromatography-tandem mass
spectrometry Quantification of sulfonamide antibiotics, neutral and acidic pesticides at
low concentrations in surface waters. J. Chromatogr. A. A. 1097, 138-147.
Stuart, A., Oehrle, B. S., and Westrick J. (2010) Detection of various freshwater cyanobacterial
toxins using ultra-performance liquid chromatography tandem mass spectrometry.
Toxicon 55(5), 965-972.
108
Suthaker, S. S. and G. E. Drachenberg (2007). When the water stops flowing: cyanobacteria
related emergency situations and troubleshooting water treatment operations. American
Water Works Association-Annual Conference Toronto, Ontario, Canada.
Svrcek, C. and Smith, D. W. (2004) Cyanobacteria toxins and the current state of knowledge on
water treatment options: a review. Environmental Engineering and Science 3(3), 155-185.
Takaara, T., Sano, D., Konno, H. and Omura, T. (2007) Cellular proteins of Microcystis
aeruginosa inhibiting coagulation with polyaluminum chloride. Water Research 41(8),
1653-1658.
Takaara T, Sano., D., Masago Y. and Omura T. (2010) Surface-retained organic matter of
Microcystis aeruginosa inhibiting coagulation with polyaluminum chloride in drinking
water treatment. Water Research 44(13), 3781-3786.
The Cooperative Research Centre for Water Quality and Treatment (Australia) (2007)
Cyanobacteria: management and implications for water quality: 36. Adelaide,
Australia.Vlaski, A., van Breemen, A. N. and Alaerts, G.J. (1996) Optimisation of
coagulation conditions for the removal of cyanobacteria by dissolved air flotation or
sedimentation. of micro-organisms. Water Supply: Research and Technology-Aqua 45
(5), 253–261.Westrick, J. A. (2008). Cyanobacterial toxin removal in drinking water
treatment processes and recreational waters (Chapter 13). Springer-Verlag Inc.: 16, New
York, USA.
Wetzel, R. G. (2000). Limnological analysis. Springer, New York, USA.
Wiedner, C., Rucker, J., Bruggemann, R. and Nixdorf, B. (2007) Climate change affects timing
and size of populations of an invasive cyanobacterium in temperate regions. Oecologia
152(3), 473-484.
YSI Incorporated (2006) 6-Series. Multiparameter water quality sondes (user manual). Yellow
Springs, Ohio, USA.
Zamyadi, A., Ho, L., Newcombe, G., Daly, R. I., Burch, M., Baker, P. and Prévost, M. (2010)
Release and oxidation of cell-bound saxitoxins during chlorination of Anabaena circinalis
cells. Environmental Science and Technology 44(23): 9055-9061.Zamyadi, A. (2011) The
value of in vivo monitoring and chlorination for the control of toxic cyanobacteria in
drinking water production. Ph.D. dissertation. Université de Montréal, École
polytechnique de Montréal. Montreal, Qc., Canada.
Zamyadi, A., Ho, L., Newcombe, G., Bustamante, H. and Prévost, M. (2011) Fate of toxic
cyanobacterial cells and disinfection by-products formation after chlorination. Water
Reserach in press doi:10.1016/j.watres.2011.06.029.