chinook salmon creel survey and inriver gillnetting …fishery data series no. 15-46 chinook salmon...
TRANSCRIPT

Fishery Data Series No. 15-46
Chinook Salmon Creel Survey and Inriver Gillnetting Study, Lower Kenai River, Alaska, 2013
by
Jeff Perschbacher
January 2016
Alaska Department of Fish and Game Divisions of Sport Fish and Commercial Fisheries
Symbols and Abbreviations The following symbols and abbreviations, and others approved for the Système International d'Unités (SI), are used without definition in the following reports by the Divisions of Sport Fish and of Commercial Fisheries: Fishery Manuscripts, Fishery Data Series Reports, Fishery Management Reports, and Special Publications. All others, including deviations from definitions listed below, are noted in the text at first mention, as well as in the titles or footnotes of tables, and in figure or figure captions. Weights and measures (metric) centimeter cm deciliter dL gram g hectare ha kilogram kg kilometer km liter L meter m milliliter mL millimeter mm Weights and measures (English) cubic feet per second ft3/s foot ft gallon gal inch in mile mi nautical mile nmi ounce oz pound lb quart qt yard yd Time and temperature day d degrees Celsius °C degrees Fahrenheit °F degrees kelvin K hour h minute min second s Physics and chemistry all atomic symbols alternating current AC ampere A calorie cal direct current DC hertz Hz horsepower hp hydrogen ion activity pH (negative log of) parts per million ppm parts per thousand ppt, ‰ volts V watts W
General Alaska Administrative Code AAC all commonly accepted abbreviations e.g., Mr., Mrs.,
AM, PM, etc. all commonly accepted professional titles e.g., Dr., Ph.D., R.N., etc. at @ compass directions:
east E north N south S west W
copyright corporate suffixes:
Company Co. Corporation Corp. Incorporated Inc. Limited Ltd.
District of Columbia D.C. et alii (and others) et al. et cetera (and so forth) etc. exempli gratia (for example) e.g. Federal Information Code FIC id est (that is) i.e. latitude or longitude lat or long monetary symbols (U.S.) $, ¢ months (tables and figures): first three letters Jan,...,Dec registered trademark trademark United States (adjective) U.S. United States of America (noun) USA U.S.C. United States
Code U.S. state use two-letter
abbreviations (e.g., AK, WA)
Mathematics, statistics all standard mathematical signs, symbols and abbreviations alternate hypothesis HA base of natural logarithm e catch per unit effort CPUE coefficient of variation CV common test statistics (F, t, χ2, etc.) confidence interval CI correlation coefficient (multiple) R correlation coefficient (simple) r covariance cov degree (angular ) ° degrees of freedom df expected value E greater than > greater than or equal to ≥ harvest per unit effort HPUE less than < less than or equal to ≤ logarithm (natural) ln logarithm (base 10) log logarithm (specify base) log2, etc. minute (angular) ' not significant NS null hypothesis HO percent % probability P probability of a type I error (rejection of the null hypothesis when true) α probability of a type II error (acceptance of the null hypothesis when false) β second (angular) " standard deviation SD standard error SE variance population Var sample var

FISHERY DATA SERIES NO. 15-46
CHINOOK SALMON CREEL SURVEY AND INRIVER GILLNETTING STUDY, LOWER KENAI RIVER, ALASKA, 2013
by
Jeff Perschbacher
This investigation was partially financed by the Federal Aid in Sport Fish Restoration Act (16 U.S.C. 777-777K) under Project F-10-28 and 29, Job No. S-2-5a
Alaska Department of Fish and Game Division of Sport Fish, Research and Technical Services 333 Raspberry Road, Anchorage, Alaska, 99518-1565
January 2016

ADF&G Fishery Data Series was established in 1987 for the publication of Division of Sport Fish technically oriented results for a single project or group of closely related projects, and in 2004 became a joint divisional series with the Division of Commercial Fisheries. Fishery Data Series reports are intended for fishery and other technical professionals and are available through the Alaska State Library and on the Internet: http://www.adfg.alaska.gov/sf/publications/. This publication has undergone editorial and peer review.
Jeff Perschbacher Alaska Department of Fish and Game, Division of Sport Fish,
43961 Kalifornsky Beach Road, Suite B, Soldotna, AK 99669-8367, USA This document should be cited as follows: Perschbacher, J. 2015. Chinook salmon creel survey and inriver gillnetting study, lower Kenai River, Alaska, 2013.
Alaska Department of Fish and Game, Fishery Data Series No. 15-46, Anchorage.
The Alaska Department of Fish and Game (ADF&G) administers all programs and activities free from discrimination based on race, color, national origin, age, sex, religion, marital status, pregnancy, parenthood, or disability. The department administers all programs and activities in compliance with Title VI of the Civil Rights Act of 1964, Section 504 of the Rehabilitation Act of 1973, Title II of the Americans with Disabilities Act (ADA) of 1990, the Age Discrimination Act of 1975, and Title IX of the Education Amendments of 1972.
If you believe you have been discriminated against in any program, activity, or facility please write: ADF&G ADA Coordinator, P.O. Box 115526, Juneau, AK 99811-5526
U.S. Fish and Wildlife Service, 4401 N. Fairfax Drive, MS 2042, Arlington, VA 22203 Office of Equal Opportunity, U.S. Department of the Interior, 1849 C Street NW MS 5230, Washington DC 20240
The department’s ADA Coordinator can be reached via phone at the following numbers: (VOICE) 907-465-6077, (Statewide Telecommunication Device for the Deaf) 1-800-478-3648,
(Juneau TDD) 907-465-3646, or (FAX) 907-465-6078 For information on alternative formats and questions on this publication, please contact:
ADF&G, Division of Sport Fish, Research and Technical Services, 333 Raspberry Rd, Anchorage AK 99518 (907) 267-2375

TABLE OF CONTENTS
Page LIST OF TABLES......................................................................................................................................................... ii
LIST OF FIGURES ....................................................................................................................................................... ii
LIST OF APPENDICES ..............................................................................................................................................iii
ABSTRACT .................................................................................................................................................................. 1
INTRODUCTION ......................................................................................................................................................... 1
Creel Survey .................................................................................................................................................................. 4 Inriver Gillnetting .......................................................................................................................................................... 4 Management Plans ......................................................................................................................................................... 7 OBJECTIVES ................................................................................................................................................................ 8
METHODS .................................................................................................................................................................... 9
Creel Survey .................................................................................................................................................................. 9 Angler Counts ......................................................................................................................................................... 10 Angler Interviews ................................................................................................................................................... 11 Age, Sex, and Length of the Sport Harvest............................................................................................................. 12
Inriver Gillnetting ........................................................................................................................................................ 12 Age, Sex, and Length of the Inriver Run ................................................................................................................ 13 Nearshore Gillnetting Pilot Study ........................................................................................................................... 13 Radio Transmitter Deployment............................................................................................................................... 13
Genetic Sampling ........................................................................................................................................................ 14 Data Analysis ............................................................................................................................................................... 14
Angler Effort ........................................................................................................................................................... 14 Catch and Harvest ................................................................................................................................................... 15 Angler Effort, Catch, and Harvest on Mondays ...................................................................................................... 17 CPUE of Inriver Gillnetting .................................................................................................................................... 17 Proportion of Chinook Salmon Captured by Inriver Gillnetting ............................................................................. 18 Age and Sex Composition ...................................................................................................................................... 18 Nearshore and Midriver Chinook salmon Size ....................................................................................................... 20
RESULTS .................................................................................................................................................................... 20
Creel Survey ................................................................................................................................................................ 20 Effort, Catch, and Harvest ...................................................................................................................................... 20
Inriver Gillnetting Species Composition and CPUE.................................................................................................... 24 Midriver Gillnetting ................................................................................................................................................ 24 Nearshore Gillnetting .............................................................................................................................................. 24
Age, Sex, and Length .................................................................................................................................................. 27 Creel Survey ........................................................................................................................................................... 27 Midriver Gillnetting ................................................................................................................................................ 28 Size of Chinook Salmon Midriver and Nearshore .................................................................................................. 30
Length-At-Age Comparisons ....................................................................................................................................... 30 Other Results ............................................................................................................................................................... 35 DISCUSSION AND RECOMMENDATIONS ........................................................................................................... 37
Creel Survey ................................................................................................................................................................ 37 Inriver Gillnetting ........................................................................................................................................................ 37
i

TABLE OF CONTENTS (Continued) Page
ACKNOWLEDGEMENTS ......................................................................................................................................... 38
REFERENCES CITED ............................................................................................................................................... 39
APPENDIX A: GUIDED AND UNGUIDED BOAT ANGLER COUNTS ............................................................... 43
APPENDIX B: DAILY ESTIMATES OF GUIDED AND UNGUIDED BOAT ANGLER EFFORT, CATCH, AND HARVEST ......................................................................................................................................................... 47
APPENDIX C: ESTIMATED EFFORT, CATCH, AND HARVEST ABOVE AND BELOW RM 8.6.................... 53
APPENDIX D: NUMBER OF CHINOOK AND SOCKEYE SALMON CAUGHT IN INRIVER GILLNETS ....... 59
LIST OF TABLES Table Page 1. Sampling strata used for conducting Kenai River Chinook salmon angler counts and estimating creel
statistics, 2013. .............................................................................................................................................. 10 2. Estimated early-run Kenai River Chinook salmon sport fishery, effort, catch, and harvest between the
Soldotna Bridge and the Warren Ames Bridge, 16 May–19 June 2013. ....................................................... 21 3. Estimated late-run Kenai River Chinook salmon sport fishery effort, catch, and harvest between
Soldotna Bridge and Warren Ames Bridge, 1–27 July 2013. ........................................................................ 22 4. Kenai River Chinook salmon reported to be released during the slot-limit sport fishery between Warren
Ames Bridge and Soldotna Bridge, 2003–2013. ........................................................................................... 23 5. Age composition and estimated sport harvest by age class and geographic strata for late-run Kenai
River Chinook salmon between the Soldotna Bridge and the Warren Ames Bridge, 1–27 July 2013. ......... 27 6. Age composition and estimated midriver run by age class for early-run Kenai River Chinook salmon
16 May–30 June 2013. .................................................................................................................................. 28 7. Age composition and estimated midriver run by age class for late-run Kenai River Chinook salmon, 1
July–17 August 2013. .................................................................................................................................... 28 8. Early-run Kenai River Chinook salmon lengths by sex and age from midriver gillnet samples, 16 May–
30 June 2013.................................................................................................................................................. 32 9. Late-run Kenai River Chinook salmon lengths by sex and age from 1–27 July creel survey and 1 July–
17 August midriver gillnet samples, 2013. .................................................................................................... 33
LIST OF FIGURES Figure Page 1. Kenai River drainage on the Kenai Peninsula in Southcentral Alaska. ........................................................... 2 2. Lower Kenai River from Warren Ames Bridge to Soldotna Bridge ............................................................... 3 3. Guided sport harvest, catch, and angler effort; unguided sport harvest, catch, and angler effort; and
percent of guided anglers from ADF&G creel surveys for the early-run Kenai River Chinook salmon fishery between Soldotna Bridge and Warren Ames Bridge, 1981–2013. ...................................................... 5
4. Guided sport harvest, catch, and angler effort; unguided sport harvest, catch, and angler effort; and percent of guided anglers from ADF&G creel surveys for the late-run Kenai River Chinook salmon fishery between Soldotna Bridge and Warren Ames Bridge, 1981–2013. ...................................................... 6
5. Cumulative CPUE for early-run and late-run Kenai River Chinook and sockeye salmon midriver gillnet catches, 2002–2013. ........................................................................................................................... 25
6. Chinook and sockeye salmon CPUE for midriver gillnets and nearshore gillnets by run during hours of the tide ranging from 2 hours before high tide to 8 hours after high tide, 2013. ........................................... 26
ii

LIST OF FIGURES (Continued) Figure Page 7. Age composition of early-run harvest versus early-run midriver gillnets between the Soldotna Bridge
and the Warren Ames Bridge for age-1.2, age-1.3, age-1.4, and age-1.5 Chinook salmon, Kenai River, 1986–2013. .................................................................................................................................................... 29
8. Cumulative length distributions and K–S test results for Chinook salmon sampled in early-run nearshore versus midriver netting, midriver netting versus Funny and Killey River weirs, and late-run nearshore versus midriver netting, 2013........................................................................................................ 31
9. Box plots of METF length distribution by sex and age of early- and late-run Kenai River Chinook salmon males and females from creel survey and midriver gillnetting. ........................................................ 34
10. Kenai River discharge and water clarity, 16 May–17 August, 2013. ............................................................ 35 11. Estimated number of fish and percent of late-run Kenai River Chinook salmon sport harvest between
the lower Chinook salmon sonar site and Warren Ames Bridge, 1996–2013. .............................................. 36
LIST OF APPENDICES Appendix Page A1. Guided and unguided boat angler counts by geographic strata during the early-run Kenai River
Chinook salmon fishery, 17 May–19 June 2013. .......................................................................................... 44 A2. Guided and unguided boat angler counts by geographic strata during the late-run Kenai River Chinook
salmon fishery, 1–27 July 2013. .................................................................................................................... 45 B1. Daily estimates of unguided boat angler effort, catch, harvest, CPUE, and HPUE by geographic strata
during the early-run Kenai River Chinook salmon fishery, 17 May–19 June 2013. ..................................... 48 B2. Daily estimates of guided boat angler effort, catch, harvest, CPUE, and HPUE by geographic strata
during the early-run Kenai River Chinook salmon fishery, 17 May–19 June 2013. ..................................... 49 B3. Daily estimates of unguided boat angler effort, catch, harvest, CPUE, and HPUE by geographic strata
during the late-run Kenai River Chinook salmon fishery, 1–27 July 2013. .................................................. 50 B4. Daily estimates of guided boat angler effort, catch, harvest, CPUE, and HPUE by geographic strata
during the late-run Kenai River Chinook salmon fishery, 1–27 July 2013. .................................................. 51 C1. Estimated effort, catch, and harvest above and below RM 8.6 during the early-run Kenai River
Chinook salmon fishery, 16 May–19 June 2013. .......................................................................................... 54 C2. Estimated effort, catch, and harvest above and below RM 8.6 during the late-run Kenai River Chinook
salmon fishery, 1–27 July 2013. .................................................................................................................... 56 D1. Number of Chinook and sockeye salmon caught midriver in 5.0-inch and 7.5-inch mesh gillnets during
the early-run Kenai River Chinook salmon sport fishery, 16 May–30 June 2013. ........................................ 60 D2. Catch and CPUE of Chinook and sockeye salmon and proportion of Chinook salmon caught midriver
in 5.0-inch and 7.5-inch mesh gillnets for replicates with at least 1 drift from each mesh size during the early-run Kenai River Chinook salmon sport fishery, 16 May–30 June 2013. ............................................. 62
D3. Number of Chinook, sockeye, coho, and pink salmon caught inriver in 5.0-inch and 7.5-inch mesh gillnets during the late-run Kenai River Chinook salmon sport fishery, 1 July–17 August 2013. ................ 64
D4. Catch and CPUE of Chinook, sockeye, coho, and pink salmon and proportion of Chinook salmon caught midriver in 5.0-inch and 7.5-inch mesh gillnets for replicates with at least 1 drift from each mesh size during the late-run Kenai River Chinook salmon sport fishery, 1 July–17 August 2013. ............ 66
D5. Catch and CPUE of Chinook, sockeye, coho, and pink salmon caught nearshore in 5.0-inch and 7.5-inch mesh gillnets during the early-run Kenai River Chinook salmon sport fisheries, 20 May–28 June 2013. .............................................................................................................................................................. 68
D6. Catch and CPUE of Chinook, sockeye, coho, and pink salmon caught nearshore in 5.0-inch and 7.5-inch mesh gillnets during the late-run Kenai River Chinook salmon sport fisheries, 1 July–16 August 2013. .............................................................................................................................................................. 69
iii

iv

ABSTRACT Sport-angler effort, catch, and harvest of early- and late-run Chinook salmon (Oncorhynchus tshawytscha) were estimated from a creel survey conducted on the lower Kenai River in 2013. During the early- and late-run Chinook salmon sport fisheries, catch-and-release fishing restrictions and closures of the Chinook salmon sport fisheries were imposed to achieve escapement goals. During the early run, anglers caught 39 (SE 16) Chinook salmon with 3,054 (SE 275) angler-hours of effort. Guided anglers accounted for 62% of effort and 59% of catch. During the late run, anglers caught 2,554 (SE 386) and harvested 1,577 (SE 297) Chinook salmon with 59,910 (SE 2,387) angler-hours of effort. Guided anglers accounted for 64% of effort and 79% of harvest. The age composition of harvested late-run Chinook salmon was 10% age-1.1 fish, 32% age-1.2 fish, 24% age-1.3 fish, and 34% age-1.4 fish. A standardized gillnetting program estimated catch rates and species composition in the midriver insonified area at the RM 8.6 sonar site 16 May–17 August 2013. In addition, a pilot study sampled the nearshore areas behind the sonars. During the early run, midriver gillnets caught 55 Chinook salmon and 555 sockeye salmon. The estimated age composition of early-run Chinook salmon was 7% age-1.1 fish, 20% age-1.2 fish, 27% age-1.3 fish, 44% age-1.4 fish, and 2% age-1.5 fish. During the late run, midriver gillnets caught 200 Chinook, 2,066 sockeye, 403 coho, and 5 pink salmon. The estimated age composition of late-run Chinook salmon was 2% age-1.1 fish, 28% age-1.2 fish, 24% age-1.3 fish, 43% age-1.4 fish, and 3% age-1.5 fish. There was a significant difference in the length distributions of Chinook salmon netted nearshore (not insonified) vs. midriver (insonified) during the early run (P = 0.03) but not the late run (P = 0.18).
Key words: Kenai River, Oncorhynchus tshawytscha, Chinook salmon, creel survey, effort, harvest, gillnet, CPUE, age composition
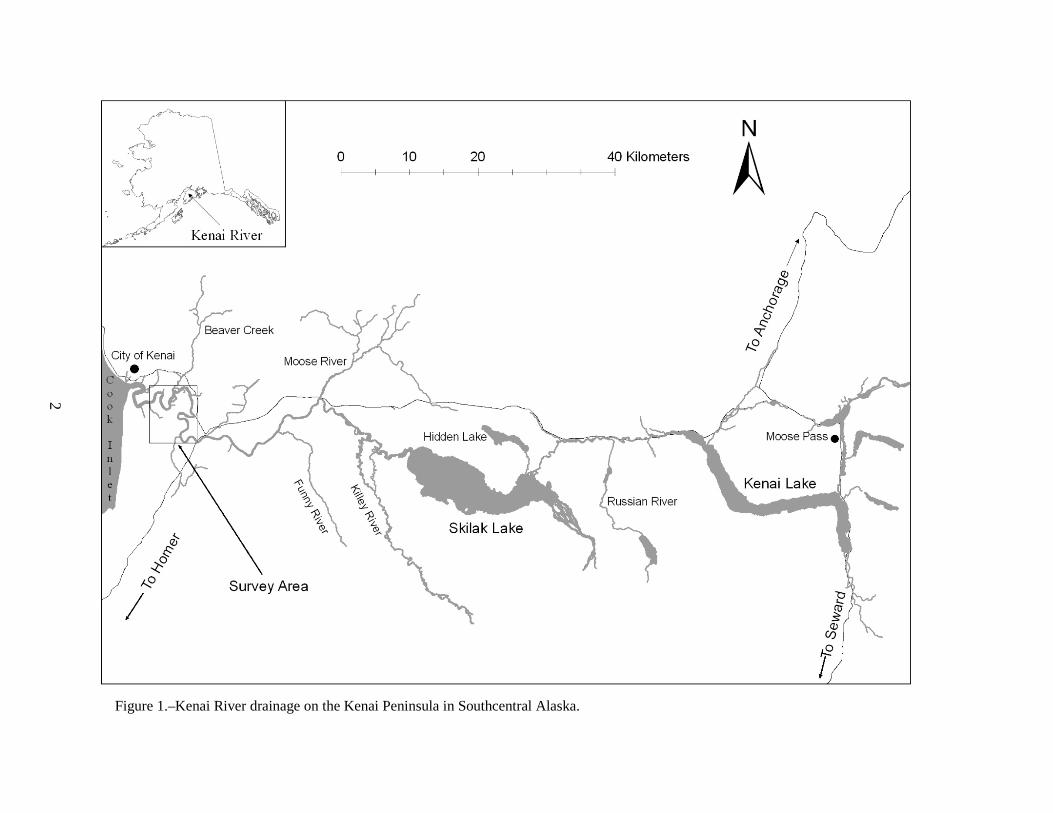
INTRODUCTION The Kenai River (Figure 1) supports the largest freshwater sport fishery in Alaska. Anglers fish for Chinook salmon (Oncorhynchus tshawytscha), coho salmon (O. kisutch), sockeye salmon (O. nerka), pink salmon (O. gorbuscha), Dolly Varden (Salvelinus malma), and rainbow trout (O. mykiss). The Chinook salmon fishery is one of the largest and most intensively managed sport fisheries in Alaska (Jennings et al. 2011b). The Kenai River Chinook salmon sport fishery between the Warren Ames Bridge (river mile [RM] 5.2) and Soldotna Bridge (RM 21.1), and a standardized inriver gillnetting study (approximately RM 8.6) are the subject of this report (Figure 2).
Chinook salmon returning to the Kenai River exhibit 2 distinct run timing patterns: an early run and a late run. Telemetry studies have shown Chinook salmon that spawn in tributaries of the Kenai River (early run) enter the river from late April through early July, whereas Chinook salmon that spawn in the Kenai River mainstem (late run) enter the river from mid-June through mid-August (Bendock and Alexandersdottir 1992; Burger et al. 1985; Reimer 2013b). For management purposes, the early run is composed of all Chinook salmon entering the river before 1 July and the late run is composed of all fish entering on or after 1 July. Sport fish anglers value fish from both runs because of their large size relative to other Chinook salmon stocks (Roni and Quinn 1995). The world record sport-caught Chinook salmon (44.1 kg; 97 lb 4 oz) was harvested from the Kenai River in May 1985.
1
2
Figure 1.–Kenai River drainage on the Kenai Peninsula in Southcentral Alaska.

Figure 2.–Lower Kenai River from Warren Ames Bridge (RM 5.2) to Soldotna Bridge (RM 21.1).
3

The Kenai River Inriver Gillnetting Study and Inriver Creel Survey provide critical information for inseason management of Kenai River Chinook salmon runs. The Inriver Gillnetting Study provides species composition and length information necessary for the RM 8.6 sonar to estimate the number of Chinook salmon passing the sonar. Daily sonar passage estimates of abundance in conjunction with Creel Survey estimates of daily harvest provide fishery managers with inseason estimates of escapement. In addition to inseason management, these projects provide data used postseason to inform sonar passage estimates and a stock-specific abundance and run timing model (SSART), as well as to develop management plans and escapement goals for Kenai River Chinook salmon.
CREEL SURVEY The Alaska Department of Fish and Game (ADF&G) implemented a creel survey in 1974 in response to an increase in the number of boat anglers targeting Chinook salmon and to monitor the age, sex, and length (ASL) composition of harvested Chinook salmon. The Inriver Creel Survey monitors sport harvest of Chinook salmon between the Warren Ames Bridge and the Soldotna Bridge and through the Statewide Harvest Survey between the Soldotna Bridge and Skilak Lake (RM 50). A majority of the Chinook salmon sport harvest occurs below the Soldotna Bridge (Jennings et al. 2009a, 2009b, 2010a, 2010b, 2011a, 2011b). Beginning in 1981, separate effort and harvest estimates have been produced for guided and unguided anglers (Figures 3 and 4). The late-run sport fishery is more popular than the early-run fishery, and angler effort and harvest in both runs has declined significantly since 2007 due to low Chinook salmon runs and fishery restrictions.
INRIVER GILLNETTING The Inriver Gillnetting Program began in 1979 and was originally designed to estimate the ASL composition of Chinook salmon returning to the Kenai River (Marsh 2000). The Gillnetting Program was standardized in 1998 to include catch rates (CPUE) and further standardized in 2002 to include species composition of fish passing through the insonified (midriver) area of the RM 8.6 Chinook salmon sonar site (Reimer 2004b). Although the Gillnetting Program has provided an estimate of the ASL composition of fish passing through the midriver insonified area, recent studies suggest the ASL composition estimate through the sonar may not always be representative of the Chinook salmon runs. In 2012, weirs operated by the United States Fish and Wildlife Service (USFWS) on the Killey River (Gates and Boersma 2013) and the Funny River (Boersma and Gates 2013) sampled relatively large numbers of small Chinook salmon that the gillnetting program could not account for. Furthermore, evidence of size-selective sampling in the late run was observed in the Eastside setnet (ESSN) commercial fishery, which in some years has captured large numbers of small Chinook salmon that were not reflected in the netting program (Tobias and Willette 2012). During 2013, the netting program was supplemented with a small auxiliary pilot study (netting nearshore 2 days per week) to investigate the size of Chinook salmon passing behind the sonar transducers where smaller Chinook salmon migrating closer to shore would be consistent with “the wave-drag hypothesis” (Hughes 2004). A representative sample of Chinook salmon captured with the nets would prevent biased sonar passage estimates and SSART estimates of abundance (Steve Fleischman, ADF&G, Anchorage, personal communication).
4

Figure 3.–Guided sport harvest, catch, and angler effort (top); unguided sport harvest, catch, and
angler effort (middle); and percent of guided anglers (bottom) from ADF&G creel surveys for the early-run Kenai River Chinook salmon fishery between Soldotna Bridge and Warren Ames Bridge, 1981–2013. Sources: Hammarstrom and Larson (1982-1984, 1986); Hammarstrom et al. (1985); Conrad and Hammarstrom (1987);
Hammarstrom (1988-1994); Schwager-King (1995); King (1996-1997); Marsh (1999, 2000); Reimer et al. (2002); Reimer (2003, 2004a, 2004b, 2007); Eskelin (2007, 2009-2010); and Perschbacher (2012a, 2012b, 2012c, 2012d, 2014).
Note: Prior to 1994, catch was not estimated. The 2013 early-run sport fishery was closed to the harvest of Chinook salmon 20–55 inches total length 16 May–19 June and closed to all Chinook salmon fishing 20–30 June. “Catch” means fish harvested plus fish released; “harvest” means fish kept.
10,00020,00030,00040,00050,00060,00070,00080,00090,000100,000
1,0002,0003,0004,0005,0006,0007,0008,0009,000
10,000
Effo
rt (a
ngle
r-ho
urs)
Har
vest
and
Cat
ch (#
of f
ish)
Early-run GuidedCatch Harvest Effort
25%
50%
75%
100%
Perc
enta
ge o
f tot
al
Year
Percent Guided
Harvest Catch Effort
20,000
40,000
60,000
80,000
100,000
120,000
140,000
1,000
2,000
3,000
4,000
5,000
6,000
7,000
8,000
9,000
10,000
Effo
rt (a
ngle
r-ho
urs)
Har
vest
and
Cat
ch (#
of f
ish)
Early-run UnguidedCatch Harvest Effort
5

Figure 4.–Guided sport harvest, catch, and angler effort (top); unguided sport harvest, catch, and
angler effort (middle); and percent of guided anglers (bottom) from ADF&G creel surveys for the late-run Kenai River Chinook salmon fishery between Soldotna Bridge and Warren Ames Bridge, 1981–2013. Sources: Conrad and Hammarstrom (1987); Eskelin (2007, 2009-2010); Hammarstrom (1977-1981, 1988-1994); Hammarstrom
et al. (1985); Hammarstrom and Larson (1982-1984, 1986); King (1996-1997); Marsh (1999, 2000); Perschbacher (2012a, 2012b, 2012c, 2012d); Reimer (2003, 2004a, 2004b, 2004c, 2004d, 2007); Reimer et al. (2002); and Schwager-King (1995).
Note: Prior to 1994, catch was not estimated. The 2013 late-run sport fishery was closed to the harvest of Chinook salmon 20–55 inches total length on 25 July and closed to all Chinook salmon fishing 28–31 July. “Catch” means fish harvested plus fish released; “harvest” means fish kept.
20,000
40,000
60,000
80,000
100,000
120,000
140,000
2,000
4,000
6,000
8,000
10,000
12,000
14,000
16,000
18,000
20,000
Effo
rt (a
ngle
r-ho
urs)
Har
vest
and
Cat
ch (#
of f
ish)
Late-run GuidedCatch Harvest Effort
50,000
100,000
150,000
200,000
250,000
2,000
4,000
6,000
8,000
10,000
12,000
14,000
16,000
Effo
rt (a
ngle
r-ho
urs)
Har
vest
and
Cat
ch (#
of f
ish)
Late-run UnguidedCatch Harvest Effort
25%
50%
75%
100%
Perc
enta
ge o
f tot
al
Year
Percent Guided
Harvest Catch Effort
6
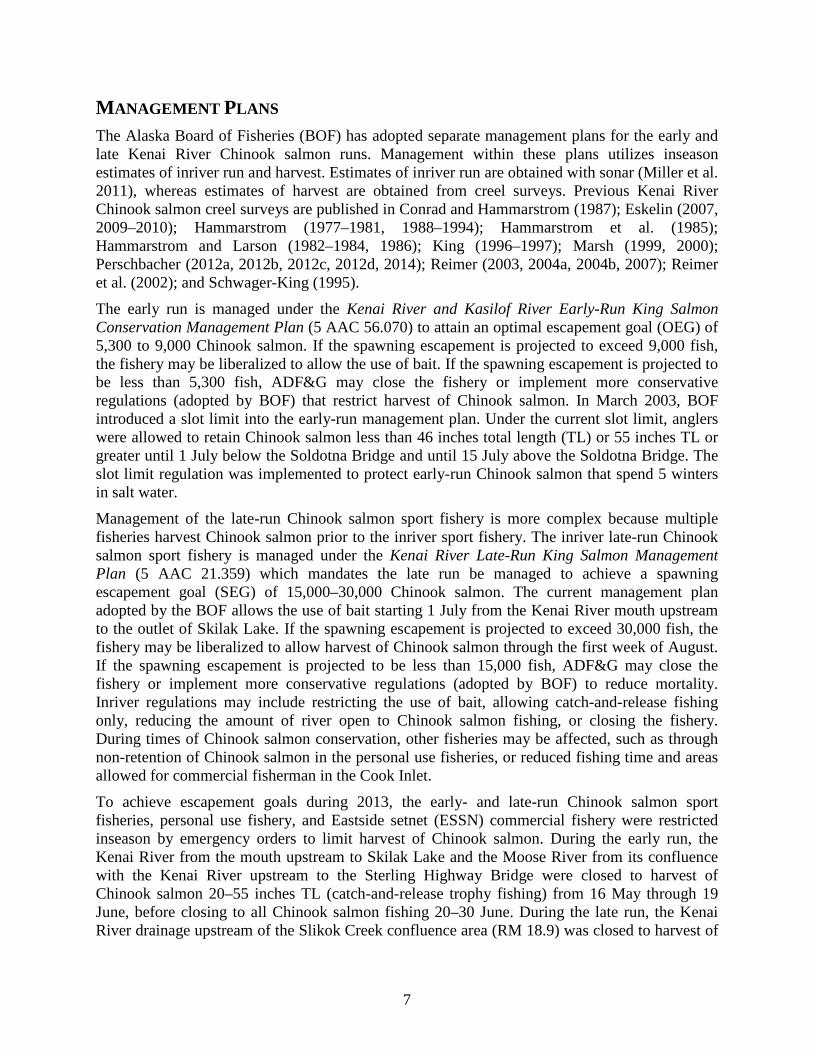
MANAGEMENT PLANS The Alaska Board of Fisheries (BOF) has adopted separate management plans for the early and late Kenai River Chinook salmon runs. Management within these plans utilizes inseason estimates of inriver run and harvest. Estimates of inriver run are obtained with sonar (Miller et al. 2011), whereas estimates of harvest are obtained from creel surveys. Previous Kenai River Chinook salmon creel surveys are published in Conrad and Hammarstrom (1987); Eskelin (2007, 2009–2010); Hammarstrom (1977–1981, 1988–1994); Hammarstrom et al. (1985); Hammarstrom and Larson (1982–1984, 1986); King (1996–1997); Marsh (1999, 2000); Perschbacher (2012a, 2012b, 2012c, 2012d, 2014); Reimer (2003, 2004a, 2004b, 2007); Reimer et al. (2002); and Schwager-King (1995).
The early run is managed under the Kenai River and Kasilof River Early-Run King Salmon Conservation Management Plan (5 AAC 56.070) to attain an optimal escapement goal (OEG) of 5,300 to 9,000 Chinook salmon. If the spawning escapement is projected to exceed 9,000 fish, the fishery may be liberalized to allow the use of bait. If the spawning escapement is projected to be less than 5,300 fish, ADF&G may close the fishery or implement more conservative regulations (adopted by BOF) that restrict harvest of Chinook salmon. In March 2003, BOF introduced a slot limit into the early-run management plan. Under the current slot limit, anglers were allowed to retain Chinook salmon less than 46 inches total length (TL) or 55 inches TL or greater until 1 July below the Soldotna Bridge and until 15 July above the Soldotna Bridge. The slot limit regulation was implemented to protect early-run Chinook salmon that spend 5 winters in salt water.
Management of the late-run Chinook salmon sport fishery is more complex because multiple fisheries harvest Chinook salmon prior to the inriver sport fishery. The inriver late-run Chinook salmon sport fishery is managed under the Kenai River Late-Run King Salmon Management Plan (5 AAC 21.359) which mandates the late run be managed to achieve a spawning escapement goal (SEG) of 15,000–30,000 Chinook salmon. The current management plan adopted by the BOF allows the use of bait starting 1 July from the Kenai River mouth upstream to the outlet of Skilak Lake. If the spawning escapement is projected to exceed 30,000 fish, the fishery may be liberalized to allow harvest of Chinook salmon through the first week of August. If the spawning escapement is projected to be less than 15,000 fish, ADF&G may close the fishery or implement more conservative regulations (adopted by BOF) to reduce mortality. Inriver regulations may include restricting the use of bait, allowing catch-and-release fishing only, reducing the amount of river open to Chinook salmon fishing, or closing the fishery. During times of Chinook salmon conservation, other fisheries may be affected, such as through non-retention of Chinook salmon in the personal use fisheries, or reduced fishing time and areas allowed for commercial fisherman in the Cook Inlet.
To achieve escapement goals during 2013, the early- and late-run Chinook salmon sport fisheries, personal use fishery, and Eastside setnet (ESSN) commercial fishery were restricted inseason by emergency orders to limit harvest of Chinook salmon. During the early run, the Kenai River from the mouth upstream to Skilak Lake and the Moose River from its confluence with the Kenai River upstream to the Sterling Highway Bridge were closed to harvest of Chinook salmon 20–55 inches TL (catch-and-release trophy fishing) from 16 May through 19 June, before closing to all Chinook salmon fishing 20–30 June. During the late run, the Kenai River drainage upstream of the Slikok Creek confluence area (RM 18.9) was closed to harvest of
7
Chinook salmon, and the use of bait was prohibited upstream of the Kenai River mouth 1 July through 31 July. The Kenai River downstream of the Slikok Creek closure area was restricted to catch-and-release trophy fishing 25–27 July before the fishery was closed to all Chinook salmon fishing 28–31 July.
OBJECTIVES Objectives for the 2013 study were as follows:
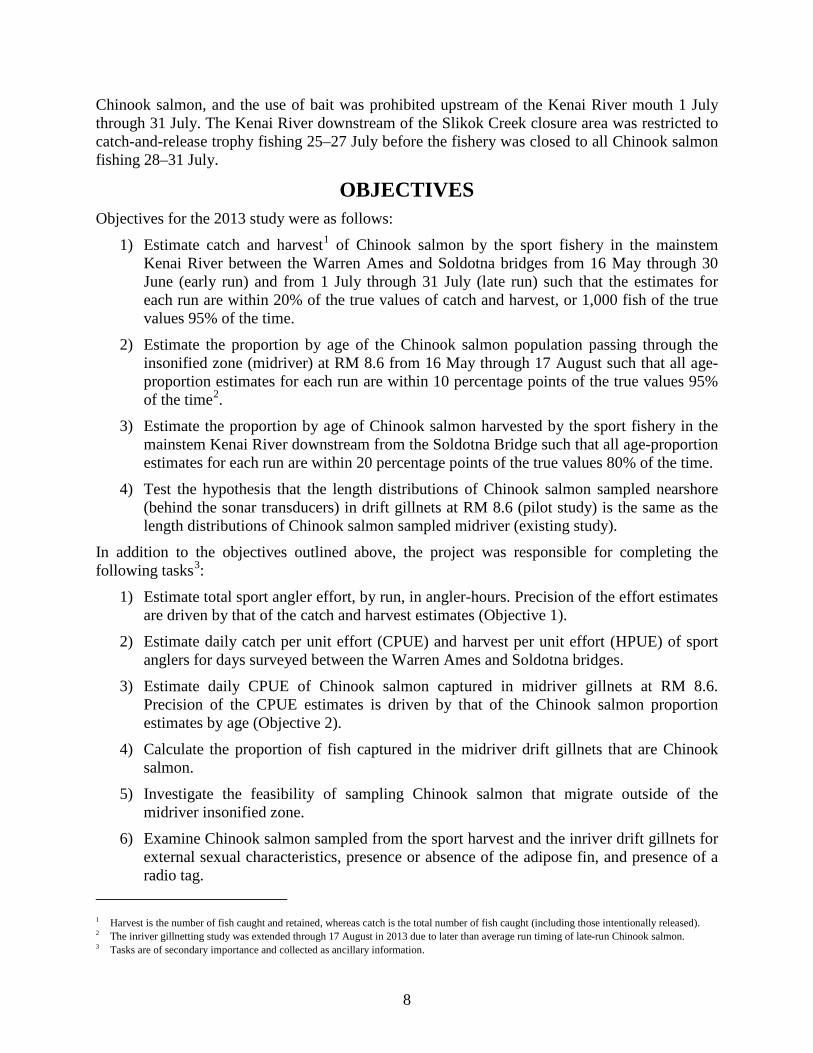
1) Estimate catch and harvest1 of Chinook salmon by the sport fishery in the mainstem Kenai River between the Warren Ames and Soldotna bridges from 16 May through 30 June (early run) and from 1 July through 31 July (late run) such that the estimates for each run are within 20% of the true values of catch and harvest, or 1,000 fish of the true values 95% of the time.
2) Estimate the proportion by age of the Chinook salmon population passing through the insonified zone (midriver) at RM 8.6 from 16 May through 17 August such that all age-proportion estimates for each run are within 10 percentage points of the true values 95% of the time2.
3) Estimate the proportion by age of Chinook salmon harvested by the sport fishery in the mainstem Kenai River downstream from the Soldotna Bridge such that all age-proportion estimates for each run are within 20 percentage points of the true values 80% of the time.
4) Test the hypothesis that the length distributions of Chinook salmon sampled nearshore (behind the sonar transducers) in drift gillnets at RM 8.6 (pilot study) is the same as the length distributions of Chinook salmon sampled midriver (existing study).
In addition to the objectives outlined above, the project was responsible for completing the following tasks3:
1) Estimate total sport angler effort, by run, in angler-hours. Precision of the effort estimates are driven by that of the catch and harvest estimates (Objective 1).
2) Estimate daily catch per unit effort (CPUE) and harvest per unit effort (HPUE) of sport anglers for days surveyed between the Warren Ames and Soldotna bridges.
3) Estimate daily CPUE of Chinook salmon captured in midriver gillnets at RM 8.6. Precision of the CPUE estimates is driven by that of the Chinook salmon proportion estimates by age (Objective 2).
4) Calculate the proportion of fish captured in the midriver drift gillnets that are Chinook salmon.
5) Investigate the feasibility of sampling Chinook salmon that migrate outside of the midriver insonified zone.
6) Examine Chinook salmon sampled from the sport harvest and the inriver drift gillnets for external sexual characteristics, presence or absence of the adipose fin, and presence of a radio tag.
1 Harvest is the number of fish caught and retained, whereas catch is the total number of fish caught (including those intentionally released). 2 The inriver gillnetting study was extended through 17 August in 2013 due to later than average run timing of late-run Chinook salmon. 3 Tasks are of secondary importance and collected as ancillary information.
8

7) Collect tissue samples for genetic analysis from Kenai River Chinook salmon sampled from inriver gillnets and the sport fish harvest.
8) Insert esophageal radio transmitters into Chinook salmon captured in inriver gillnets from 16 May through 17 August in conjunction with the Kenai River Chinook Salmon Abundance and Migratory Timing study (Reimer 2013a).
9) Collect Secchi disk and water temperature readings midchannel at RM 15.3 during creel survey sampling days and collect daily Secchi disk readings at RM 8.6.
METHODS CREEL SURVEY To avoid biases, a stratified, 2-stage roving-access creel survey (Bernard et al. 1998) was employed to estimate sport fishing effort, catch, and harvest of Chinook salmon from the Warren Ames Bridge (RM 5.2) to the Soldotna Bridge (RM 21.1) (Figure 2). Although the 2013 creel survey was planned for 16 May–30 June and 1–30 July, fishery closures restricted the creel survey to 16 May–19 June and 1–27 July. The survey’s first-stage sampling units were the sampling period “angler-days.” The unguided angler-day was assumed to be 20 h long (0400 to 2400 hours), whereas the guided angler-day was 12 h long (0600 to 1800 hours) by regulation. Daily catch and harvest were estimated as the product of effort (angler-hours) and CPUE or HPUE. The second-stage sampling units, for estimating angler effort and CPUE or HPUE, were periodic angler counts and angler trips. Angler trips were sampled by interviewing anglers at the end of their fishing trips.
Stratification was used to account for the geographical, temporal, and regulatory factors affecting the fishery (Table 1). Because significant harvest below the sonar site would affect inriver run and escapement estimates, angler counts were geographically stratified into 2 areas: 1) between the Soldotna Bridge and the Chinook salmon sonar site (RM 8.6) and 2) between the Chinook salmon sonar site and the Warren Ames Bridge. Angler interviews did not include this level of stratification because past attempts to estimate catch and harvest downstream of the sonar site using geographically stratified angler interviews were ineffective (Marsh 2000). Therefore, catch and harvest downstream of the sonar site are based on estimated effort downstream of the sonar site, and CPUE and HPUE are assumed constant throughout the study area.
Because the harvest and catch rates of anglers can differ by time and by whether or not they are guided, the creel survey was temporally stratified by week and day type (weekday or weekends and holidays), and by angler type (guided or unguided). Due to budgetary constraints, nonholiday Mondays were assessed with an “index” angler count and ad hoc procedure to generate effort, catch, and harvest estimates4. The sampling strata used for conducting Kenai River Chinook salmon angler counts and estimating creel statistics are presented in Table 1.
Two of 4 available weekdays and both weekend days were sampled each week the fishery was open to Chinook salmon fishing. An exception was the Memorial Day weekend of 25–27 May, when 2 days were selected randomly from the 3 weekend or holiday days available. The early run was composed of 22 strata and the late run was composed of 20 strata (Tables 2 and 3).
4 See “Angler Effort, Catch, and Harvest on Mondays” in the Data Analysis section for an explanation of Monday angler counts.
9

Water clarity was measured to the nearest 0.05 m with a Secchi disk, and temperature was measured to the nearest 0.1°F twice daily near midchannel at RM 15.3.
Table 1.–Sampling strata used for conducting Kenai River Chinook salmon angler counts and estimating creel statistics, 2013.
Type Number Description Geographica 2 Warren Ames Bridge (RM 5.1) to the Chinook salmon sonar site (RM 8.6)
Chinook salmon sonar site (RM 8.6) to Soldotna Bridge (RM 21.1)
Temporalb 6 Early run: 16–19 May, 21–27 May, 28 May–2 June, 4–9 June, 11–16 June,
18–19 June
4 Late run: 2–7 July, 9–14 July, 16–21 July, 23–27 July
Day typec 3 Weekdays
Weekends and holidays
Late-run Mondays
Angler type 2 Guided Unguided
a Used for angler counts only. b The early-run sport fishery was closed to harvest of Chinook salmon 20–55 inches TL from 16 May to 19 June and closed to
all Chinook salmon fishing from 20 to 30 June. The late-run sport fishery was closed to harvest of Chinook salmon 20–55 inches TL from 25 to 27 July and closed to all Chinook salmon fishing from 28 to 31 July.
c Creel statistics for Mondays were not sampled but were estimated using an index during the late run.
Angler Counts Four angler counts were conducted during each sampled day. The first count began at the start of a randomly chosen hour (0400, 0500, 0600, 0700, or 0800 hours) with the remaining counts done every 5 hours thereafter. The schedule ensured that at least 2 angler counts were conducted while guided anglers were fishing (between 0600 and 1800 hours) each day.
Counts were conducted from a survey boat between the Soldotna Bridge and the Warren Ames Bridge, a distance of 15.9 mi. To maximize interview time, the direction (upstream or downstream) traveled to conduct angler counts was preselected to minimize total distance traveled and time spent conducting the count. Anglers were counted while driving the survey boat through the survey area, and counts were typically completed in less than 1 hour. Angler counts were treated as instantaneous counts; they reflect fishing effort at the time the count began. Anglers were counted if they were fishing or rigging their lines when observed during an angler count. Boats were counted as fishing if the boat contained at least 1 angler. Ten hand-held counters were used to sum the following categories for each geographic stratum: 1) unguided power boats, 2) unguided drift boats, 3) guided power boats, 4) guided drift boats, 5) unguided anglers in power boats, 6) unguided anglers in drift boats, 7) guided anglers in power boats (excluding the guide), 8) guided anglers in drift boats (excluding the guide), 9) active boats5, and
5 Boats were counted as active boats if there were no anglers actively fishing from the boat but the boat and motor were in operation.
10

10) nonactive boats6. Only categories 5–8 were required for this project; categories 1–4 and 9–10 were supplementary information for management purposes.
A single boat count was completed between 0800 and 1400 hours for each Monday of the late run (restricted to unguided drift boats) to generate index estimates of effort, catch, and harvest.
Angler Interviews Anglers who completed fishing were interviewed at the following boat launch sites (Figure 2):
1) Pillars Boat Launch 2) Riverbend Campground 3) Stewart’s Landing 4) Centennial Campground 5) Poacher’s Cove 6) Eagle Rock Campground
When the creel survey began on 16 May, interviews were conducted only at Pillars Boat Launch because of low water levels typical of the beginning of the early run. As water levels increased, other boat launch sites were added to the sampling schedule immediately after sufficient boat traffic was observed. For each day sampled, the first randomly scheduled boat count of the day was completed prior to conducting interviews (between 0500 and 0900 hours). There was a smaller probability of conducting an interview during the first 1–4 hours of the angler-day than other times; however, the chance of introducing length-of-stay bias (Bernard et al. 1998) was small. In 2001, only 2% of the interviews were conducted from 0400 to 0759 hours, and the mean CPUE for that period was similar to the overall mean (Reimer 2003). During 2007–2009, the most recent years without inseason fishery restrictions, 1–2% of the interviews were conducted from 0400 to 0759. The mean CPUE and HPUE for that period compared to each year’s overall mean were similar in 2007, lower in 2008, and higher during 2009.
There were 4 time intervals per day during which interviews could be conducted: 3 intervals between consecutive angler counts and 1 interval after the last angler count. During the early run, when there were more interview periods than active boat launches, each launch was sampled once before it was repeated in the daily schedule. During the late run, when there were more accessible boat launches than interview periods, access location was chosen with replacement from the locations available. Time and boat launch were paired randomly.
The following information was recorded for each interviewed angler: 1) time of interview, 2) guided or unguided angler, 3) number of hours spent fishing downstream of the Soldotna Bridge7, 4) number of Chinook salmon harvested downstream of the Soldotna Bridge, 5) number of Chinook salmon released downstream of the Soldotna Bridge, and 6) whether released Chinook salmon were less than 46 inches TL, 46–55 inches TL, or 55 inches TL or greater (during the early run only).
6 Boats were counted as nonactive boats if there were no anglers actively fishing from the boat and the motor was not in operation, but it was obvious the motor had been run during the day.
7 Hours fishing were rounded to the nearest 0.25 hour and included when an angler’s line was in the water or being rigged but did not include travel time or time after an angler had harvested a fish.
11
Age, Sex, and Length of the Sport Harvest Harvested Chinook salmon were sampled for ASL during angler interviews. Sex was identified from external morphological characteristics (i.e., protruding ovipositor on females or a developing kype on males). Lengths from mid eye to tail fork (METF) were measured to the nearest half-centimeter. Three scales were removed from the preferred area of each fish and placed on an adhesive-coated card (Clutter and Whitesel 1956; Welander 1940). Acetate impressions of the scales were aged using a microfiche reader.
All harvested sampled fish were inspected for an adipose fin. A missing adipose fin indicated the fish was either missing the fin naturally or received a coded wire tag as a juvenile. Presence of a coded wire tag may identify a hatchery-produced Chinook salmon stray or a wild Chinook salmon tagged in another river system that strayed to the Kenai River. If a fish without an adipose fin was found, and permission was granted from the angler, the fish’s head was removed and examined later for a coded wire tag.
Additionally, all harvested Chinook salmon sampled for ASL in the creel survey were examined for the presence of an esophageal radio transmitter. If a fish with a radio transmitter was found, the transmitter was collected and the date and location (RM) the angler caught the Chinook salmon were recorded.
INRIVER GILLNETTING In 2013, midriver gillnetting was conducted each day from 16 May through 17 August. The same section of river has been used for inriver gillnetting since 1998, which is an area approximately 0.3 RMs long and located at RM 8.6 (Figure 2). Nets of 2 mesh sizes were fished with equal frequency. Specifications of the nets used during the years 2002–2013 are shown below:
1) 5.0 inch (stretched mesh) multifilament, 80 meshes deep, 10 fathoms long, R44 color, MS73 (14 strand) twine
2) 7.5 inch (stretched mesh) multifilament, 55 meshes deep, 10 fathoms long, R44 color, MS93 (18 strand) twine
Each midriver drift was positioned to sample fish that pass through the insonified river channel (approximately 3 m offshore from the right-bank transducer to 3 m offshore from the left-bank transducer). The drift area began immediately downstream from the sonar transducers (RM 8.6) and ended approximately 0.3 mi downstream (RM 8.3). Drifts were terminated when any of the following occurred: 1) the crew believed there were more than 5 fish in the net, 2) the net was drifting outside of the area insonified by the Chinook salmon sonar, 3) the net became snagged on the bottom or was not fishing properly, or 4) the end of the drift area was reached. Drifts always began at the upstream end of the study area. Two drifts (1 starting on each bank) were completed with 1 mesh size before switching to the other mesh size. For each set, the mesh size, starting bank, start and stop times, and number of fish caught by species were recorded on a Juniper Systems Allegro CX8 field computer.
Water clarity was measured to the nearest 0.05 m with a Secchi disk 3 times daily (beginning, middle, and end of scheduled shift) in midchannel, near the sonar site.
8 Product names used in this publication are included for completeness but do not constitute product endorsement.
12

Age, Sex, and Length of the Inriver Run Chinook salmon captured in midriver gillnets within the insonified area (at RM 8.6) constituted the ASL sample for the inriver run. Prior to 30 June, every Chinook salmon captured in gillnets was removed and placed in a tagging cradle (Larson 1995) and sampled for ASL data, which were recorded on a field computer. ASL data collection was similar to the methods described for sport harvested Chinook salmon. To prevent resampling, a quarter-inch hole was punched in the dorsal lobe of the caudal fin on every Chinook salmon handled, and each captured Chinook salmon was examined for a hole-punch prior to sampling. Chinook salmon were also checked for an adipose fin. If a Chinook salmon adipose fin was missing, the fish was sacrificed, and the head was removed and examined later for a coded wire tag. Injuries sustained by Chinook salmon during the capture and handling process were also recorded. Samples were stratified into 2 approximately 3-week strata during each run with a sample-size goal of 149 fish for each stratum. Strata for the early run were 16 May–9 June and 10–30 June; strata for the late run were 1–20 July and 21 July–17 August.
The number and species of all fish captured were recorded. In addition, METF lengths of captured sockeye, pink, and coho salmon were measured every other day. Length distribution of captured salmon was used as one variable in a mixture model to evaluate species composition in the insonified area at RM 8.6 (Miller et al. 2005).
After 30 June, every other captured Chinook salmon per drift was sampled for ASL data. All other captured Chinook salmon were not placed in the cradle but had a tissue sample taken for genetic analysis (see Genetics Sampling section) and were given a hole-punch on the dorsal lobe of the caudal fin to prevent resampling before being released. Estimates of age, sex, and length composition of the inriver run were generated using the midriver Chinook salmon catches from 5.0- and 7.5-inch mesh gillnets combined.
Nearshore Gillnetting Pilot Study During 2013, the netting program was supplemented with a small auxiliary study to investigate the size of Chinook salmon passing the Chinook salmon sonar nearshore (behind the sonar transducers) versus midriver (within the insonified area). The pilot study incorporated gillnetting nearshore with a separate crew in addition to the standard midriver gillnetting. Gillnets were deployed from each bank to a point 3 m from the face of the dual frequency identification sonar (DIDSON) (noninsonified area) where the midriver gillnetting (insonified area) began (see location of lower Chinook salmon sonar in Figure 2). The nearshore netting schedule was designed for 2 days per week beginning approximately 2 hours before high tide to 4 hours after high tide. All other aspects of nearshore gillnetting were similar to the midriver gillnetting regarding data collection.
Radio Transmitter Deployment The inriver gillnetting study served as the marking event for a separate Kenai River Chinook Salmon Abundance and Migratory Timing study (Reimer 2013a). In the midriver netting study, every Chinook salmon sampled for ASL from 16 May through 15 July, and every other Chinook salmon sampled for ASL from 16 July through 15 August, received an Advanced Telemetry Systems (ATS; Isanti, MN) model F1845B radio transmitter. In the nearshore netting study, every Chinook salmon sampled for ASL in the early and late runs received a radio transmitter. Fish with profusely bleeding gills, measuring 550 mm METF or less, or observed to be injured,
13

were released without tagging to minimize potential differences in survival and behavior between tagged and untagged populations.
GENETIC SAMPLING In the creel survey, tissue samples (tip of axillary process) were taken from harvested fish for genetic analysis. In the inriver gillnetting study, tissue samples (dorsal finclips) were collected from all captured Chinook salmon because the axillary process, on the ventral side of the fish, was difficult to remove from Chinook salmon held in sampling cradles suspended in the water. Axillary process and dorsal finclip samples consisted of a half-inch piece of tissue that was placed in a 2 ml plastic vial and completely covered with a buffered 95% alcohol solution such that the liquid to tissue ratio was approximately 3:1. Plastic vials were sequentially number for each project and stored at the ADF&G Gene Conservation Laboratory for future analysis.
DATA ANALYSIS Effort, catch, and harvest were estimated separately for guided and unguided anglers using the following procedures.
Angler Effort The mean number of anglers on day i in stratum h was estimated as follows:
hi
r
ghig
hi r
xx
hi
∑== 1 (1)
where
higx = the number of anglers observed in the gth count of day i in stratum h, and
hir = the number of counts on day i in stratum h.
Angler counts were conducted systematically within each sample day. The variance of the mean angler count was estimated as follows:
( )( )
( )12ˆ
2
2)1(
−
−=∑=
−
hihi
r
gghihig
hi rr
xxxV
hi
. (2)
Effort (angler-hours) during day i in stratum h was estimated by
hihihi xLE =ˆ (3)
where
hiL = length of the sample day (20 hours for unguided anglers, 12 hours for guided anglers).
The within-day variance (effort) was estimated as follows:
( ) ( )hihihi xVLEV ˆˆˆ 2= . (4)
14

The mean effort for stratum h was estimated by
h
d
ihi
h d
EE
h
∑== 1
ˆ (5)
where
hd = number of days sampled in stratum h.
The sample variance of daily effort for stratum h was estimated as follows:
( )( )1
ˆ)(
2
12
−
−=∑=
h
d
ihhi
h d
EEES
h
. (6)
Total effort for stratum h was estimated by
hhh EDE =ˆ (7)
where
hD = total number of days the fishery was open in stratum h.
The variance of total effort for each stratum in a 2-stage design, omitting the finite population correction factor for the second stage, was estimated by Bernard et al. (1988) as follows:
( ) ( )( )2
122
2
ˆˆ)(
1ˆˆh
d
ihi
hh
hhh d
EVfD
dES
DfEV
h
∑=+−= (8)
where
f = fraction of days sampled (= hh Dd / ).
Catch and Harvest Catch and harvest per unit (hour) of effort for day i was estimated from angler interviews using the jackknife method to minimize the bias of these ratio estimators (Efron 1982). The jackknife estimate of CPUE (similarly HPUE) for angler j was as follows:
∑
∑
≠=
≠=
=hi
hi
j
m
jaa
hia
m
aa
hia
hij
e
c
CPUE
1
1* (9)
where
hiac = catch of angler a interviewed on day i in stratum h,
15

hiae = effort (hours fished) by angler a interviewed on day i in stratum h, and
him = number of anglers interviewed on day i in stratum h.
The jackknife estimate of mean CPUE for day i was the mean of the angler estimates:
hi
m
jhij
him
CPUECPUE
hi
∑== 1
*
* (10)
and the bias-corrected mean was
( ) ****hihihihihi CPUECPUECPUEmCPUE +−= (11)
where
∑
∑
=
==hi
hi
m
jhij
m
jhij
hi
e
cCPUE
1
1 . (12)
The variance of the jackknife estimate of CPUE was estimated as follows:
( ) ( )21
** 1ˆ ∑=
** −−
=him
jhihij
hi
hihi CPUECPUE
mmCPUEV . (13)
Catch during each sample day was estimated as the product of effort and CPUE by **ˆˆ hihihi CPUEEC = (14)
and the variance was estimated as follows (Goodman 1960):
( ) ( )( ) +=2**ˆˆˆˆ hihihi CPUEEVCV ( ) ( ) ( )**2** ˆˆˆˆˆ hihihihi CPUEVEVECPUEV − . (15)
HPUE was estimated by substituting angler harvest for angler catch in Equations 9–13. Harvest during sample day i was estimated by substituting the appropriate HPUEhi statistics into Equations 14 and 15. Total catch and harvest during stratum h was estimated using Equations 5–8, substituting estimated catch ( hiC ) and harvest ( hiH ) during sample day i for the estimated
effort ( hiE ) during day i.
When no interviews from a particular angler type were obtained during a particular day, there were no CPUE and HPUE estimates to pair with angler counts. For these days, pooled estimates of CPUE and HPUE calculated from interviews obtained during the remaining days within the stratum, or similar strata, were imputed. A bootstrap procedure was used to estimate the variance introduced by use of imputed values.
Total effort, catch, and harvest estimates, and their respective variances, were summed across strata within each run. Technically, estimates of catch and harvest by geographic location and angler type were not statistically independent, because HPUE and CPUE were estimated from
16
the same interviews for both geographic strata, and estimates were poststratified by angler type. This lack of independence between strata could underestimate variances; however, the bias in variance estimates is small.
Angler Effort, Catch, and Harvest on Mondays Regulations allow only unguided fishing from drift boats or from shore on Mondays. Due to budgetary constraints, the creel survey was not conducted on Mondays for the years 2001–2008 and 2011–2013; rather, a single “index” angler count was conducted each late-run Monday between 0800 and 1400 hours. The index count was used in the following ad hoc procedure to estimate effort, catch, and harvest on drift-boat Mondays:
1) The relationship between index counts and mean angler counts on Mondays for 2009–2010 angler count data was used to estimate the relationship between index counts and mean angler counts on Mondays for 2013. The mean number of anglers was approximately 52% of the number of anglers counted during the “index” period.
2) To estimate angler-hours of effort E, the estimated mean count (52% of the index count) was multiplied by the length of the unguided angler-day (20 hours).
3) To estimate CPUE and HPUE on Mondays without angler interviews, we exploited the tendency for angler success to exhibit an autocorrelated time trend. CPUE and HPUE were plotted versus time for days sampled with angler interviews, and then we imputed CPUE and HPUE values for each Monday.
4) Catch and harvest were estimated as the product of the imputed values of CPUE and HPUE and the estimate of E derived from the index count.
CPUE of Inriver Gillnetting Two gillnet mesh sizes were deployed: 5.0 and 7.5 inches. Two drifts, originating from each side k of the river, were conducted with 1 mesh size; the sequence was then repeated with the other mesh size. A repetition j consisted of a complete set of 4 such drifts. Daily CPUE r of species s in mesh size m for day i was estimated as follows:
∑∑
∑∑
= =
= ==i
i
J
j kmijk
J
j ksmijk
smi
e
cr
1
2
1
1
2
1ˆ (16)
with variance
( ))1(
ˆ)ˆ(ˆ
21
2
−
−=∑=
⋅⋅
iimi
J
jmijsmismij
smi JJe
ercrV
i
(17)
where csmijk is the catch of species s in mesh m during a drift originating from bank k during repetition j on day i, emijk is the effort (soak time in minutes) for that drift, Ji is the number of repetitions completed on day i, csmij is the catch of species i in mesh m summed across drifts on both banks conducted during repetition j of day i, emij. is the effort for mesh m summed across
17

drifts on both banks conducted during repetition j of day i, and mie is the mean of emij across all repetitions j for mesh m on day i. The variance follows Cochran (1977: 66).
Proportion of Chinook Salmon Captured by Inriver Gillnetting The proportion of species s passing through the insonified zone of the river channel (midriver) on day i was estimated as follows:
∑∑
∑=
s
J
jsij
J
jsij
si i
i
r
rp
ˆ
ˆˆ (18)
with variance
( )( )
)1(
ˆˆˆˆˆ
2
2
1
−
−=∑=
iii
J
jijsisij
si JJr
rprpV
i
(19)
where CPUE r of species s during repetition j of day i was estimated as the mean of the 5.0 and 7.5 inch mesh CPUEs; each CPUE is calculated by pooling catch and effort across banks:
∑= ∑
=
∑==
2
12
1
2
121ˆ
mk mijke
k smijkc
sijr (20)
where
∑=s
ij sijrr ˆˆ (21)
and
i
J
jij
i J
rr
i
∑== 1
ˆ (22)
where
ijr = the CPUE summed across all species caught during repetition j of day i, and
ir = is the mean CPUE of salmon (all species) caught across all drifts k during day i.
Only data from repetitions with at least 1 drift with each mesh were used for estimation of species proportions.
Age and Sex Composition Age and sex compositions of the Chinook salmon harvest were estimated for each run by time stratum t. The proportion of Chinook salmon in age or sex group b in time stratum t was estimated as follows:
18

t
btbt n
np =ˆ (23)
where
btn = the number of Chinook salmon of age or sex group b sampled during stratum t, and
tn = the number of successfully aged Chinook salmon sampled during stratum t.
The variance of btp was approximated9 as follows (Cochran 1977):
)1()ˆ1(ˆ
)ˆ(ˆ−−
=t
btbtbt n
pppV . (24)
Contingency tables and chi-square tests were used to determine if age or sex composition differed significantly (P < 0.05) among strata. If not, the proportion of Chinook salmon in age or sex group b during an entire run, and its variance, were estimated by pooling data across strata (Equations 23–24 without stratum subscripts t). The harvest of each age or sex group by time stratum t and geographic stratum g (above and below the sonar), was estimated by
btgtgbt pHH ˆˆˆ = (25)
with variance (Goodman 1960)
( ) ( ) ( ) ( ) ( )gtbtgtbtbtgtgbt HVpVHVppVHHV ˆˆˆˆˆˆˆˆˆˆˆˆ 22 −+= (26)
where
gtH and ( )gtHV = estimated harvest and its variance in geographic stratum g during temporal stratum t.
If age or sex composition differed (P < 0.05) among strata, a weighted proportion and its variance were calculated as follows:
∑∑
=
tgt
tbtgt
gb H
pHp ˆ
ˆˆˆ and (27)
[ ] [ ]
++
−+
−= 2
222112
21122
2
22211
2ˆ)ˆ(ˆˆ)ˆ(ˆˆ
ˆˆˆ)ˆ(ˆ
ˆˆˆ)ˆ(ˆˆ1)ˆ(ˆ
gbgbg
gbgbg
g
gbgbg
ggb HpvHpv
HHHpHv
HHHpHv
HpV . (28)
9 Variance estimates for species proportions assume that each fish sampled is an independent observation (i.e., that simple random sampling, SRS, was employed). In reality, the sport harvest is sampled with a multistage design (creel survey) and the inriver run with a cluster design (netting), and technically, the age proportion variances should be estimated in the context of those designs. However, age composition changes very slowly over time, and in the past we have assumed that variability between sampling stages and among clusters is negligible. To verify this, we reanalyzed the 2006 netting data, calculated the age proportions using a modified version of Equation 8, and compared them to the SRS estimates in Equation 23. The point estimates and their standard errors were essentially equivalent. Based on this evidence, we continue to use the SRS equations for convenience.
19

The number of Chinook salmon passing the sonar N was apportioned by age and sex similarly using Equations 23–28, ignoring geographic stratum subscript g, substituting N for H, and using the net-captured Chinook salmon to estimate p. The inriver run R of age or sex group b was estimated as the sum of the age- or sex-specific sonar passage Nb and harvest below the sonar H2b as follows:
bbb HNR 2ˆˆˆ += . (29)
Nearshore and Midriver Chinook salmon Size A 2-sample Kolmogorov–Smirnov test (K–S test) was used to test the difference between the length distributions of Chinook salmon sampled in nearshore nets and those sampled in midriver nets for the early run and the late run. A one-sample K–S test compared the length distribution of early-run Chinook salmon sampled in midriver nets with the reference distribution (Killey River weir and Funny River weir combined length distribution weighted by abundance). The Killey River and Funny River account for a majority of spawning early-run Chinook salmon (Reimer 2013b), and in the 1-sample K–S test we assumed the Killey River weir and Funny River weir combined length distribution was an adequate representation of Kenai River early-run Chinook salmon. The D statistic and the associated P-value were reported for each test.
RESULTS CREEL SURVEY Effort, Catch, and Harvest The creel survey was conducted from 16 May through 19 June, and 1–27 July 2013. The fishery was closed to all Chinook salmon fishing 20–30 June and 28–31 July. During the early run, the creel survey sampled 65% (17/26) of the days the fishery was open to guided anglers and 68% (21/31) of the days open to unguided anglers (Table 2). During the late run, the creel survey sampled 60% (12/20) of the days the fishery was open to guided anglers and 65% (15/23) of the days the fishery was open to unguided anglers (Table 3). Index estimates of catch, harvest, and effort on the 3 late-run Mondays are not included in the unguided angler subtotals and season totals presented herein. A total of 750 angler interviews were conducted: 147 during the early run and 603 during the late run (Tables 2 and 3).
The estimated early-run effort of 3,054 (SE 275) angler-hours (Table 2) was the lowest on record dating back to 1981 (Figure 3), with guided anglers accounting for 62% of the early-run effort. The maximum counts within a time stratum were 18 unguided anglers on 16 June and 25 guided anglers on 18 June. (Appendix A1). The estimated late-run effort of 59,910 (SE 2,387) angler-hours (Table 3) was the second lowest on record (Figure 4). During 2012 and 2013, guided anglers accounted for the highest percentage of late run effort on record (each 64% of total late-run effort). The maximum counts within a time stratum during the 2013 late run occurred on 23 July for both unguided anglers (177) and guided anglers (406) (Appendix A2).
20
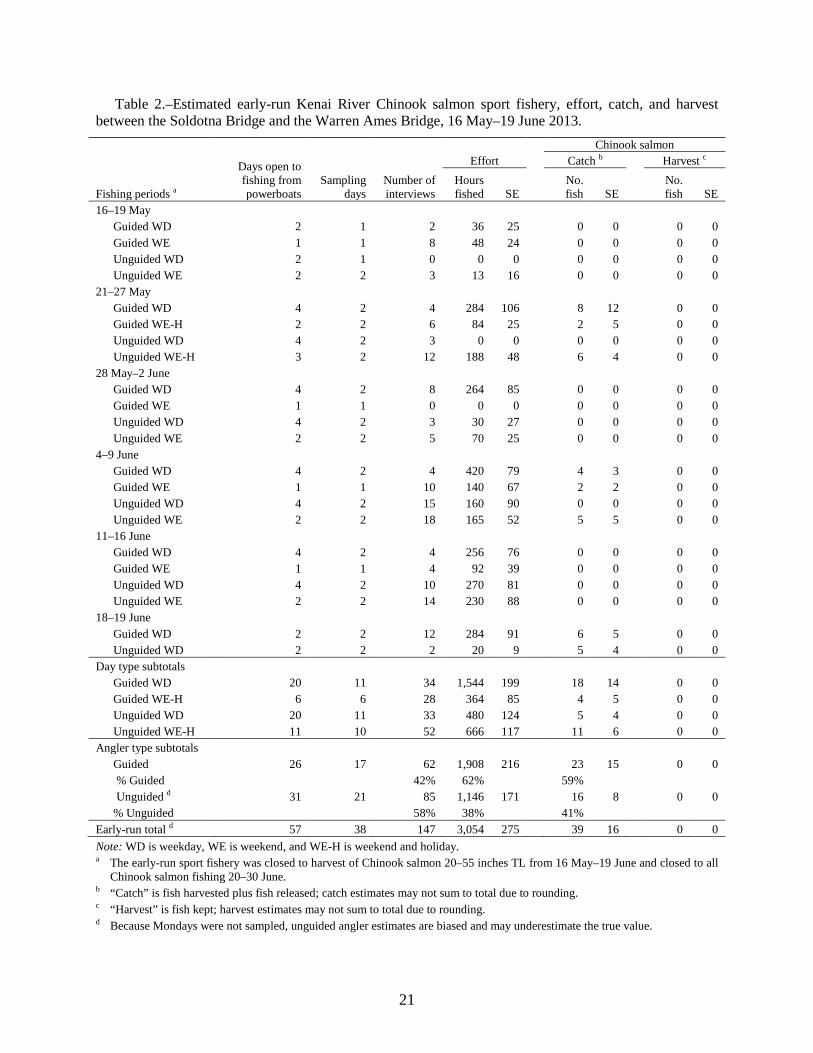
Table 2.–Estimated early-run Kenai River Chinook salmon sport fishery, effort, catch, and harvest between the Soldotna Bridge and the Warren Ames Bridge, 16 May–19 June 2013.
Fishing periods a
Days open to fishing from powerboats
Sampling days
Number of interviews
Effort
Chinook salmon Catch b
Harvest c Hours fished
No. fish
No. fish SE SE SE
16–19 May
Guided WD 2 1 2 36 25
0 0
0 0
Guided WE 1 1 8 48 24
0 0
0 0
Unguided WD 2 1 0 0 0
0 0
0 0
Unguided WE 2 2 3 13 16
0 0
0 0
21–27 May
Guided WD 4 2 4 284 106
8 12
0 0
Guided WE-H 2 2 6 84 25
2 5
0 0
Unguided WD 4 2 3 0 0
0 0
0 0
Unguided WE-H 3 2 12 188 48
6 4
0 0
28 May–2 June
Guided WD 4 2 8 264 85
0 0
0 0
Guided WE 1 1 0 0 0
0 0
0 0
Unguided WD 4 2 3 30 27
0 0
0 0
Unguided WE 2 2 5 70 25
0 0
0 0
4–9 June
Guided WD 4 2 4 420 79
4 3
0 0
Guided WE 1 1 10 140 67
2 2
0 0
Unguided WD 4 2 15 160 90
0 0
0 0
Unguided WE 2 2 18 165 52
5 5
0 0
11–16 June
Guided WD 4 2 4 256 76
0 0
0 0
Guided WE 1 1 4 92 39
0 0
0 0
Unguided WD 4 2 10 270 81
0 0
0 0
Unguided WE 2 2 14 230 88
0 0
0 0
18–19 June
Guided WD 2 2 12 284 91
6 5
0 0
Unguided WD 2 2 2 20 9 5 4 0 0 Day type subtotals
Guided WD 20 11 34 1,544 199
18 14
0 0
Guided WE-H 6 6 28 364 85
4 5
0 0
Unguided WD 20 11 33 480 124
5 4
0 0
Unguided WE-H 11 10 52 666 117 11 6 0 0 Angler type subtotals
Guided 26 17 62 1,908 216
23 15
0 0
% Guided
42% 62%
59%
Unguided d 31 21 85 1,146 171
16 8
0 0 % Unguided 58% 38% 41%
Early-run total d 57 38 147 3,054 275 39 16 0 0 Note: WD is weekday, WE is weekend, and WE-H is weekend and holiday. a The early-run sport fishery was closed to harvest of Chinook salmon 20–55 inches TL from 16 May–19 June and closed to all
Chinook salmon fishing 20–30 June. b “Catch” is fish harvested plus fish released; catch estimates may not sum to total due to rounding. c “Harvest” is fish kept; harvest estimates may not sum to total due to rounding. d Because Mondays were not sampled, unguided angler estimates are biased and may underestimate the true value.
21

Table 3.–Estimated late-run Kenai River Chinook salmon sport fishery effort, catch, and harvest between Soldotna Bridge and Warren Ames Bridge, 1–27 July 2013.
Days open to fishing from powerboats
Sampling days
Number of interviews
Chinook salmon
Effort
Catch b Harvest c
Hours fished
No. fish
No. fish Fishing periods a SE SE SE
2–7 July Monday d 0 1 0 62 NA
1 NA
0 NA
Guided WD 4 2 70 6,504 1,186
127 64
98 43
Guided WE 1 1 2 1,056 302
19 23
15 17
Unguided WD 4 2 31 1,520 229
20 15
0 0
Unguided WE 2 2 33 1,395 181
44 20
37 18
8–14 July
Monday d 0 1 0 260 NA
7 NA
7 NA
Guided WD 4 2 79 5,424 710
347 182
216 102
Guided WE 1 1 72 2,298 294
48 16
29 12
Unguided WD 4 2 4 2,450 513
0 0
0 0
Unguided WE 2 2 41 2,710 349
75 33
63 30
15–21 July
Monday d 0 1 0 229 NA
10 NA
9 NA
Guided WD 4 2 31 11,964 1,068
760 235
600 215
Guided WE 1 1 21 2,160 620
62 41
62 41
Unguided WD 4 2 29 4,200 370
245 61
131 56
Unguided WE 2 2 52 3,235 319
111 51
86 45
22–27 July
Monday d 0 1 0 312 NA
13 NA
6 NA
Guided WD 4 2 55 7,748 1,043
421 198
224 144
Guided WE 1 1 4 1,026 234
71 69
0 0
Unguided WD 4 2 59 5,330 474
168 47
19 19
Unguided WE 1 1 20 890 110 35 18 0 0 Day type subtotals
Monday d 0 4 0 863 NA
31 NA
22 NA
Guided WD 16 8 235 31,640 2,034
1,655 362
1,137 281
Guided WE 4 4 99 6,540 785
200 85
106 46
Unguided WD 16 8 123 13,500 823
433 78
149 59
Unguided WE 7 7 146 8,230 518 265 67 185 57
Angler type subtotals
Guided 20 12 334 38,180 2,180
1,855 372
1,243 285
% Guided
55% 64%
73%
79%
Unguided e 23 15 269 21,730 972
698 103
334 82
% Unguided 45% 36% 27% 21%
Late-run total e 43 27 603 59,910 2,387 2,554 386 1,577 297 Note: WD is weekday, WE is weekend, and WE-H is weekend and holiday. NA is no data available. a Emergency order prohibited the use of bait starting 1 July. The sport fishery was closed to harvest of Chinook salmon 20–55
inches TL on 25 July and closed to all Chinook salmon fishing 28–31 July. b “Catch” is fish harvested plus fish released; catch estimates may not sum to total due to rounding. c “Harvest” is fish kept; harvest estimates may not sum to total due to rounding. d Mondays were days when unguided drift boat fishing only was allowed. Estimates of effort, catch, and harvest were based on
an index (see Methods). e Unguided angler totals do not include Monday index estimates.
22

During the early run, daily CPUE for unguided anglers was the highest (0.250 fish per hour) on 18 and 19 June and averaged 0.029 fish per hour, whereas daily CPUE for guided anglers was the highest (0.029 fish per hour) on 21, 22, and 25 May and averaged 0.010 fish per hour (Appendices B1–B2). In the late run, daily CPUE for unguided anglers was the highest (0.060 fish per hour) on 19 July and averaged 0.026 fish per hour, whereas daily CPUE for guided anglers was the highest (0.113 fish per hour) on 11 July and averaged 0.042 fish per hour (Appendices B3–B4).
The early-run Chinook salmon fishery was restricted to catch-and-release trophy fishing, resulting in no Chinook salmon harvest documented in the creel survey. The estimated catch of early-run Chinook salmon was 39 (SE 16) fish. Anglers reported releasing 6 Chinook salmon, of which 4 were below 46 inches TL and 2 were within the slot limit (46–55 inches TL) (Table 4). The absolute precision for total early-run catch (±31 fish) satisfied the project objectives.
Table 4.–Kenai River Chinook salmon reported to be released during the slot-limit sport fishery between Warren Ames Bridge and Soldotna Bridge, 2003–2013.
Below slot limit a Within slot limit a Total number released b Year % released c % released c
2003 52%
48%
64 2004 67%
33%
73
2005 65%
35%
109 2006 65%
35%
100
2007 70%
30%
67 2008 78%
22%
89
2009 85%
15%
20 2010 80%
20%
35
2011 83%
17%
23 2012 62%
38%
21
2013 67% 33% 6 Min 52%
15%
6
Mean 70%
30%
55 Max 85% 48% 109 a During 2003–2007 the 44–55 inch slot limit was in effect and during 2008–2013 the 46–55 inch slot limit was in effect. b There were no fish reported to be released above the slot limit. c The number of fish released below or within the slot limit was given by anglers during creel survey interviews.
The estimated late-run harvest of Chinook salmon (1,577 fish, SE 297) in 2013 was the second lowest on record dating back to 1981 (Table 3, Figure 4). Guided anglers accounted for 79% of the harvest, which was the highest on record (Figure 4); the 30-year average is 55%. The estimated catch of late-run Chinook salmon was 2,554 (SE 386) and 38% of the catch was released. The absolute precision for total late-run harvest (±582) and catch (±757) satisfied the project objectives.
No early-run effort and 2.3% of late-run effort occurred downstream of the RM 8.6 Chinook salmon sonar site (Appendices C1–C2). The estimate of late-run harvest below the sonar site was 37 (SE 11), whereas 1,541 (SE 297) Chinook salmon were harvested from the Chinook salmon sonar site to the Soldotna Bridge (Appendix C2).
The daily angler count for each late-run Monday (Appendix A2) and interpolated values of HPUE and CPUE (Appendix B3) were used to index effort, harvest, and catch estimates (Table
23

3). It was estimated that unguided drift boat anglers caught 31 and harvested 22 Chinook salmon with 863 angler-hours of effort during late-run Mondays (Table 3). Harvest of Chinook salmon on drift-boat Mondays was less than 1.5% of the total late-run harvest in 2013 and has been less than 4% (approximately 400 fish) of the total late-run harvest since 2009 (Perschbacher 2014).
INRIVER GILLNETTING SPECIES COMPOSITION AND CPUE Midriver Gillnetting During the early run, 55 Chinook salmon and 557 sockeye salmon greater than 400 mm METF length were captured with midriver gillnets (Appendix D1). A total of 843 other fish (4 starry flounder [Platichthys stellatus], 836 eulachon [Thaleichthys pacificus], 2 Dolly Varden, and 1 rainbow trout) were also captured. Only salmonids greater than 400 mm METF were used to calculate both daily CPUE by species and daily Chinook salmon proportions. Daily Chinook salmon CPUE for both mesh sizes was the highest (0.043 fish per minute) on 29 June and averaged 0.008 fish per minute, whereas daily sockeye salmon CPUE was the highest (0.324 fish per minute) on 30 June and averaged 0.082 fish per minute (Appendix D2). The daily proportions of captured Chinook salmon to total number of captured fish ranged from 0 to 0.47 and averaged 0.13 (Appendix D2).
During the late run, 200 Chinook salmon, 2,066 sockeye salmon, 403 coho salmon, and 5 pink salmon greater than 400 mm METF length were captured with midriver gillnets (Appendix D3). A total of 6 other fish (4 Dolly Varden and 2 rainbow trout) were also captured. Daily Chinook salmon CPUE for both mesh sizes combined was the highest (0.142 fish per minute) on 14 July and averaged 0.037 fish per minute, whereas daily sockeye salmon CPUE was the highest (1.843 fish per minute) on 19 July and averaged 0.377 fish per minute (Appendix D4). The daily proportions of captured Chinook salmon to total number of captured fish ranged from 0 to 0.34 and averaged 0.10.
During both the early and late run, Chinook salmon cumulative CPUE was significantly below the respective 10-year (2003–2012) average (Figure 5). Sockeye salmon cumulative CPUE was significantly below the early-run 10-year average, and slightly below the late-run 10-year average.
Nearshore Gillnetting During the early run, 18 Chinook salmon and 250 sockeye salmon greater than 400 mm METF were captured with nearshore nets (Appendix D5). A total of 7 other fish (3 Dolly Varden and 4 rainbow or steelhead trout) were also captured. Eulachon and starry flounder were also captured in nearshore nets but were not enumerated in the early or late run. Daily Chinook salmon CPUE for both mesh sizes was the highest (0.061 fish per minute) on 13 June and averaged 0.017 fish per minute, whereas daily sockeye salmon CPUE was the highest (0.642 fish per minute) on 10 June and averaged 0.206 fish per minute.
During the late run, 19 Chinook salmon, 1,261 sockeye salmon, 103 coho salmon, and 4 pink salmon greater than 400 mm METF were captured with nearshore nets (Appendix D6). Five Dolly Varden were also captured. Daily Chinook salmon CPUE for both mesh sizes was the highest (0.099 fish per minute) on 15 July and averaged 0.016 fish per minute, whereas daily sockeye salmon CPUE was the highest (6.572 fish per minute) on 15 July and averaged 1.192 fish per minute.
24

During the early run, the nearshore netting CPUEs for each tide stage (numbers of each species caught per drift minute) of Chinook salmon and sockeye salmon were greater in the tide stage lasting 2 hours before high tide to high tide compared to the CPUEs of the other tide stages (Figure 6). During the late run, nearshore netting CPUE for Chinook salmon was greatest during the tide stages lasting 2 hours before high tide to 2 hours after high tide. The nearshore CPUE for late-run sockeye salmon was greatest during the tide stage lasting 2–4 hours after high tide.
Figure 5.–Cumulative CPUE for early-run (top) and late-run (bottom) Kenai River Chinook and
sockeye salmon midriver gillnet catches, 2002–2013. Note: Late-run inriver netting was conducted through 10 August during 2002–2011, 15 August during 2012, and 17 August
during 2013.
1
2
3
4
5
6
7
8
9
10
Cum
ulat
ive
CPU
E (c
atch
per
min
ute)
Early Run (16 May–30 June)
Mean 2003-2012 Chinook salmon
Mean 2003-2012 Sockeye salmon
2013 Chinook salmon
2013 Sockeye salmon
5
10
15
20
25
Cum
ulat
ive
CPU
E (c
atch
per
min
ute)
Late Run (1 July–17 August)
2003-2012 Mean Chinook salmon
2003-2012 Mean Sockeye salmon
2013 Chinook salmon
2013 Sockeye salmon
25
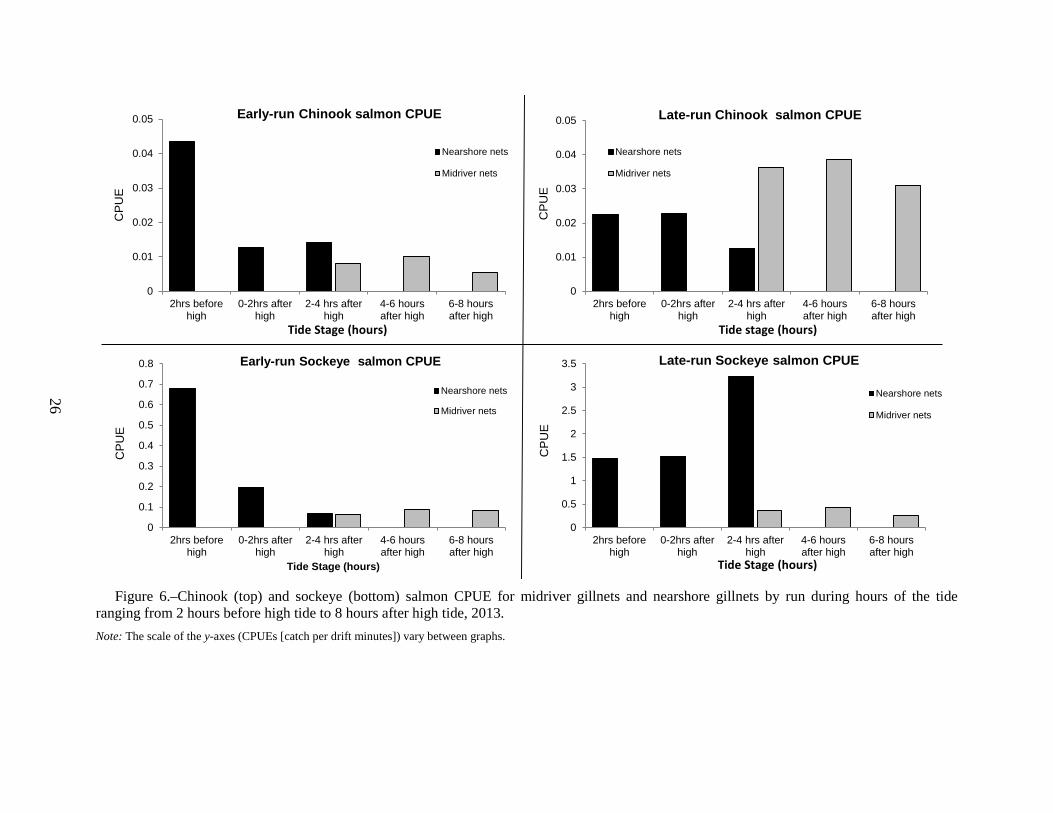
26
Figure 6.–Chinook (top) and sockeye (bottom) salmon CPUE for midriver gillnets and nearshore gillnets by run during hours of the tide
ranging from 2 hours before high tide to 8 hours after high tide, 2013. Note: The scale of the y-axes (CPUEs [catch per drift minutes]) vary between graphs.
0
0.01
0.02
0.03
0.04
0.05
2hrs beforehigh
0-2hrs afterhigh
2-4 hrs afterhigh
4-6 hoursafter high
6-8 hoursafter high
CPU
E
Tide Stage (hours)
Early-run Chinook salmon CPUE
Nearshore nets
Midriver nets
0
0.01
0.02
0.03
0.04
0.05
2hrs beforehigh
0-2hrs afterhigh
2-4 hrs afterhigh
4-6 hoursafter high
6-8 hoursafter high
CPU
E
Tide stage (hours)
Late-run Chinook salmon CPUE
Nearshore nets
Midriver nets
0
0.1
0.2
0.3
0.4
0.5
0.6
0.7
0.8
2hrs beforehigh
0-2hrs afterhigh
2-4 hrs afterhigh
4-6 hoursafter high
6-8 hoursafter high
CPU
E
Tide Stage (hours)
Early-run Sockeye salmon CPUE
Nearshore nets
Midriver nets
0
0.5
1
1.5
2
2.5
3
3.5
2hrs beforehigh
0-2hrs afterhigh
2-4 hrs afterhigh
4-6 hoursafter high
6-8 hoursafter high
CPU
E
Tide Stage (hours)
Late-run Sockeye salmon CPUE
Nearshore nets
Midriver nets

AGE, SEX, AND LENGTH Creel Survey The early-run Chinook salmon fishery was restricted to catch-and-release trophy fishing and no Chinook salmon were sampled.
The 50 age samples collected in the late-run sport fishery met the goal of 49 valid scale ages. The age composition of the late-run harvest was composed of approximately 10% age-1.1 fish, 32% age-1.2 fish, 24% age-1.3 fish, and 34% age-1.4 fish (Table 5). Age-1.1 and -1.2 males accounted for 42% of the late-run harvest. Overall, 76% of the harvested late-run Chinook salmon were males; the remaining 24% were females.
Table 5.–Age composition and estimated sport harvest by age class and geographic strata for late-run Kenai River Chinook salmon between the Soldotna Bridge and the Warren Ames Bridge, 1–27 July 2013.
Age
Parameter a 1.1 1.2 1.3 1.4 Total Female
Sample size
3 9 12
% Sample
6.0% 18.0% 24.0%
SE % sample
3.4% 5.5% 6.1%
Downstream harvest
1 8 9
SE downstream harvest
1 4 4
Upstream harvest
48 346 394
SE upstream harvest
29 130 134
Total harvest
49 355 404
SE total harvest
29 132 136
Male
Sample size 5 16 9 8 38
% Sample 10.0% 32.0% 18.0% 16.0% 76.0%
SE % sample 4.3% 6.7% 5.5% 5.2% 6.1%
Downstream harvest 2 9 8 8 27
SE downstream harvest 1 3 4 4 8
Upstream harvest 80 390 346 330 1,147
SE upstream harvest 38 121 130 129 244
Total harvest 82 399 355 338 1,174
SE total harvest 39 123 132 131 245
Both sexes combined
Sample size 5 16 12 17 50
% Sample 10.0% 32.0% 24.0% 34.0% 100.0%
SE % sample 4.3% 6.7% 6.1% 6.8% 0.0%
Downstream harvest 2 9 9 16 37
SE downstream harvest 1 3 4 6 11
Upstream harvest 80 390 394 677 1,541
SE upstream harvest 38 121 134 192 297
Total harvest 82 399 404 693 1,577
SE total harvest 39 123 136 194 297 Note: Values given by age and sex may not sum to totals due to rounding. a “Downstream” is the Kenai River reach between Warren Ames Bridge and the RM 8.6 Chinook salmon sonar site; “upstream”
is the Kenai River reach between the Chinook salmon sonar site and the Soldotna Bridge.
27

Midriver Gillnetting Only 41 Chinook salmon were sampled midriver in the early run (Table 6), far less than the goal of 127 valid scale ages and the lowest ever sampled historically. The age composition was 7.3% age-1.1 fish, 19.5% age-1.2 fish, 26.8% age-1.3 fish, 43.9% age-1.4 fish, and 2.4% age-1.5 fish (Table 6 and Figure 7). Females were a larger percentage of the catch in age-1.3 and -1.4 fish, whereas males were a larger percentage of age-1.1, -1.2, and -1.5 age classes (Table 6). Overall, approximately equal proportions of males (51.2%) and females (48.8%) were captured. During the late run, the age composition of the 147 Chinook salmon sampled midriver was estimated to be 2.0% age-1.1 fish, 28.2% age-1.2 fish, 23.5% age-1.3 fish, 43.0% age-1.4 fish, and 3.4% age-1.5 fish (Table 7). Females were a larger percentage of the catch in age-1.4 fish, whereas males were a larger percentage in all other age classes. Overall, more males (66.4%) were captured than females (33.6%).
Table 6.–Age composition and estimated midriver run by age class for early-run Kenai River Chinook salmon 16 May–30 June 2013. Age Parameter 1.1 1.2 1.3 1.4 1.5 Total Female
Sample size a
1 7 12
20
% Midriver run
2.4% 17.1% 29.3%
48.8%
SE % midriver run
2.4% 5.9% 7.2%
7.9%
Male
Sample size a 3 7 4 6 1 21
% Midriver run 7.3% 17.1% 9.8% 14.6% 2.4% 51.2%
SE % midriver run 4.1% 5.9% 4.7% 5.6% 2.4% 7.9%
Both sexes combined
Sample size a 3 8 11 18 1 41
% Midriver run 7.3% 19.5% 26.8% 43.9% 2.4% 100.0%
SE % midriver run 4.1% 6.3% 7.0% 7.8% 2.4% 0.0% Note: Values given by age and sex may not sum to totals due to rounding. a The sample size goal of 127 valid aged scales was not met.
Table 7.–Age composition and estimated midriver run by age class for late-run Kenai River Chinook salmon, 1 July–17 August 2013.
Age
Parameter 1.1 1.2 1.3 1.4 1.5 Total Female
Sample size
2 11 37
50
% Midriver run
1.3% 7.4% 24.8%
33.6%
SE % midriver run
0.9% 2.1% 3.6%
3.9%
Male
Sample size 3 40 24 27 5 99
% Midriver run 2.0% 26.8% 16.1% 18.1% 3.4% 66.4%
SE % midriver run 1.2% 3.6% 3.0% 3.2% 1.5% 3.9%
Both sexes combined
Sample size 3 42 35 64 5 149
% Midriver run 2.0% 28.2% 23.5% 43.0% 3.4% 100.0%
SE % midriver run 1.2% 3.7% 3.5% 4.1% 1.5% 0.0% Note: Values given by age and sex may not sum to totals due to rounding.
28

29
Figure 7.–Age composition of early-run harvest versus early-run midriver gillnets between the Soldotna Bridge and the Warren Ames Bridge
for age-1.2 (top left), age-1.3 (top right), age-1.4 (bottom left), and age-1.5 (bottom right) Chinook salmon, Kenai River, 1986–2013. Note: The 2013 early-run sport fishery was closed to harvest of Chinook salmon 20–55 inches TL from 16 May–19 June and closed to all Chinook salmon fishing 20–30 June.
During 1986–2001, only 7.5-inch mesh nets were used, whereas during 2002–2013, both 5.0-inch and 7.5-inch mesh nets were used.
2%
4%
6%
8%
10%
12%
14%
16%
18%
Perc
ent o
f tot
al
Age 1.5
5%
10%
15%
20%
25%
30%
35%Pe
rcen
t of t
otal
Age 1.2Midriver run
Sport harvest
Start of 44"-55" slot limit
Start of 46"-55" slot limit
10%
20%
30%
40%
50%
60%
70%
Perc
ent o
f tot
al
Age 1.3
10%
20%
30%
40%
50%
60%
70%
80%
90%
Perc
ent o
f tot
al
Age 1.4

Size of Chinook Salmon Midriver and Nearshore During the early run, the length distribution of 17 Chinook salmon captured in nearshore nets was compared to the length distribution of 50 Chinook salmon captured midriver (Figure 8). A higher proportion of smaller fish were captured in nearshore nets compared to midriver nets, and the 2-sample K–S test showed a significant difference (D = 0.41, P = 0.03) between length distributions (Figure 8). A higher proportion of smaller Chinook salmon were sampled at the Killey River and Funny River weirs than were captured in midriver nets, and the 1-sample K–S test showed a significant difference between length distributions (D = 0.47, P < 0.001; Figure 8).
During the late run, the length distribution of 18 Chinook salmon captured in nearshore nets was compared to the length distribution of 170 Chinook salmon captured midriver (Figure 8). A higher proportion of smaller fish were captured nearshore than midriver but the 2-sample K–S test showed no significant difference (D = 0.27, P = 0.18) between these 2 length distributions.
LENGTH-AT-AGE COMPARISONS The age composition of fish captured midriver during early and late runs did not differ significantly (χ2 = 1.04, df = 2, P = 0.60) with age-1.2, -1.3, and -1.4 fish considered (Tables 6–7). Age-1.4 Chinook salmon made up the highest proportion of the early run (43.9%, SE 7.8%) and late run (43.0%, SE 4.1%)
METF lengths were compiled by age and sex for the early- and late-run midriver gillnetting (Table 8) and the sport harvest creel survey (Table 9). A graphical depiction of length-at-age is shown in Figure 9. On average, age-1.3 female Chinook salmon were slightly larger than age-1.3 males, whereas age-1.4 male Chinook salmon were larger on average than females of this age.
The age composition of the late-run harvest and the fish captured midriver during the late run did not differ significantly (χ2 = 0.86, df = 2, P = 0.65) with age-1.2, -1.3, and -1.4 fish considered (Table 9).
30

Figure 8.–Cumulative length distributions and K–S test results for Chinook salmon sampled in early-
run nearshore versus midriver netting (top), midriver netting versus Funny and Killey River weirs (middle), and late-run nearshore versus midriver netting (bottom), 2013.
400 600 800 1000 1200
0.0
0.2
0.4
0.6
0.8
1.0
NearshoreMidriver
D statistic = 0.271at Length= 610 mmP-value= 0.18221
300 400 500 600 700 800 900 1000
0.0
0.2
0.4
0.6
0.8
1.0
NearshoreMidriver
D statistic = 0.407at Length= 690 mmP-value= 0.02986
400 600 800 1000 1200
0.00.2
0.40.6
0.81.0
MidriverKilley and Funny Weir
D statistic = 0.469at Length= 630 mmP-value= 0
D-statistic = 0.41P-value = 0.03
D-statistic = 0.47P-value < 0.01
D-statistic = 0.27P-value = 0.18
31

Table 8.–Early-run Kenai River Chinook salmon lengths by sex and age from midriver gillnet samples, 16 May–30 June 2013.
Age Parameter 1.1 1.2 1.3 1.4 1.5 Combined
Females Sample size
1 7 12
20 Mean length (mm)
630 806 971
896
SE length (mm)
12 13
24 Min length (mm)
630 750 900
630
Max length (mm)
630 840 1,060
1,060 Males
Sample size 3 7 4 6 1 21 Mean length (mm) 448 632 740 1,024 1,130 762
SE length (mm) 19 26 25 35
50 Min length (mm) 420 545 670 910 1,130 420 Max length (mm) 485 735 790 1,165 1,130 1,165
Both sexes combined Sample size 3 8 11 18 1 41
Mean length (mm) 448 632 782 989 1,130 827 SE length (mm) 19 23 15 15
30
Min length (mm) 420 545 670 900 1,130 420 Max length (mm) 485 735 840 1,165 1,130 1,165
Note: All lengths measured from mid eye to tail fork (METF).
32

Table 9.–Late-run Kenai River Chinook salmon lengths by sex and age from 1–27 July creel survey and 1 July–17 August midriver gillnet samples, 2013.
Age Source Parameter 1.1 1.2 1.3 1.4 1.5 Combined Creel survey
Females
Sample size
3 9
12
Mean length (mm)
923 991
974
SE length (mm)
13 19
17
Min length (mm)
910 940
910
Max length (mm)
950 1,120
1,120
Males
Sample size 5 16 9 8
38
Mean length (mm) 402 578 831 1,036
711
SE length (mm) 13 16 34 18
37
Min length (mm) 370 480 660 970
370
Max length (mm) 440 705 925 1,145
1,145
Both sexes combined
Sample size 5 16 12 17
50
Mean length (mm) 402 578 854 1,012
774
SE length (mm) 13 16 28 14
32
Min length (mm) 370 480 660 940
370
Max length (mm) 440 705 950 1,145
1,145
Midriver gillnet
Females
Sample size
2 11 37 1 51
Mean length (mm)
660 868 989 1,090 952
SE length (mm)
10 22 9
14
Min length (mm)
650 700 890 1,090 650
Max length (mm)
670 940 1,115 1,090 1,115
Males
Sample size 3 40 24 27 5 99
Mean length (mm) 427 621 779 1,047 1,133 795
SE length (mm) 17 8 18 13 17 21
Min length (mm) 410 490 630 940 1,080 410
Max length (mm) 460 710 960 1,190 1,175 1,190
Both sexes combined
Sample size 3 42 35 64 6 150
Mean length (mm) 427 623 807 1,013 1,126 849
SE length (mm) 17 8 16 8 16 16
Min length (mm) 410 490 630 890 1,080 410
Max length (mm) 460 710 960 1,190 1,175 1,190 Note: All lengths measured from mid eye to tail fork.
33

Figure 9.–Box plots of METF length distribution by sex and age of early- and late-run Kenai River
Chinook salmon males (top) and females (bottom) from creel survey and midriver gillnetting. Note: Age categories are given at the top of each graph and sources for samples are given at the bottom. ER NET is early-run
gillnetting, LR NET is late-run gillnetting, and LR CREEL is late-run creel survey.
34

OTHER RESULTS During 2013, river conditions in the early and late runs were average in water clarity and above average in discharge (Figure 10). Secchi disk measurements of water clarity in the sport fishery (taken at RM 15.3) ranged between 0.3 m and 1.4 m, with the average (0.8 m) slightly below the historical (1987–2012) average of 0.9 m. Secchi disk measurements at the Chinook salmon sonar site (RM 8.6) ranged between 0.3 m and 1.0 m with an average (0.6 m) equal to the historical (1998–2012) average. The discharge average (12,184 ft3/s) was above the historical (1965–2012) average of 10,296 ft3/s.
Figure 10.–Kenai River discharge (top) and water clarity (bottom), 16 May–17 August, 2013. Note: Discharge data downloaded from USGS 15266300 KENAI RIVER AT SOLDOTNA AK 2014-09-26 11:20 EST
http://waterdata.usgs.gov/ak/nwis/dv. Water clarity measurement for 2013 Secchi (RM 15.3) collected only when fishery was open.
2,000
4,000
6,000
8,000
10,000
12,000
14,000
16,000
18,000
20,000
Dis
char
ge (c
ubic
feet
/sec
)
1965-2012 mean discharge(a) 2013 discharge(a)
0.50
1.00
1.50
2.00
Wat
er c
larit
y (m
)
1987–2012 mean secchi (RM 15.3) 2013 secchi (RM 15.3)1998–2012 mean secchi (RM 8.5) 2013 secchi (RM 8.5)
35
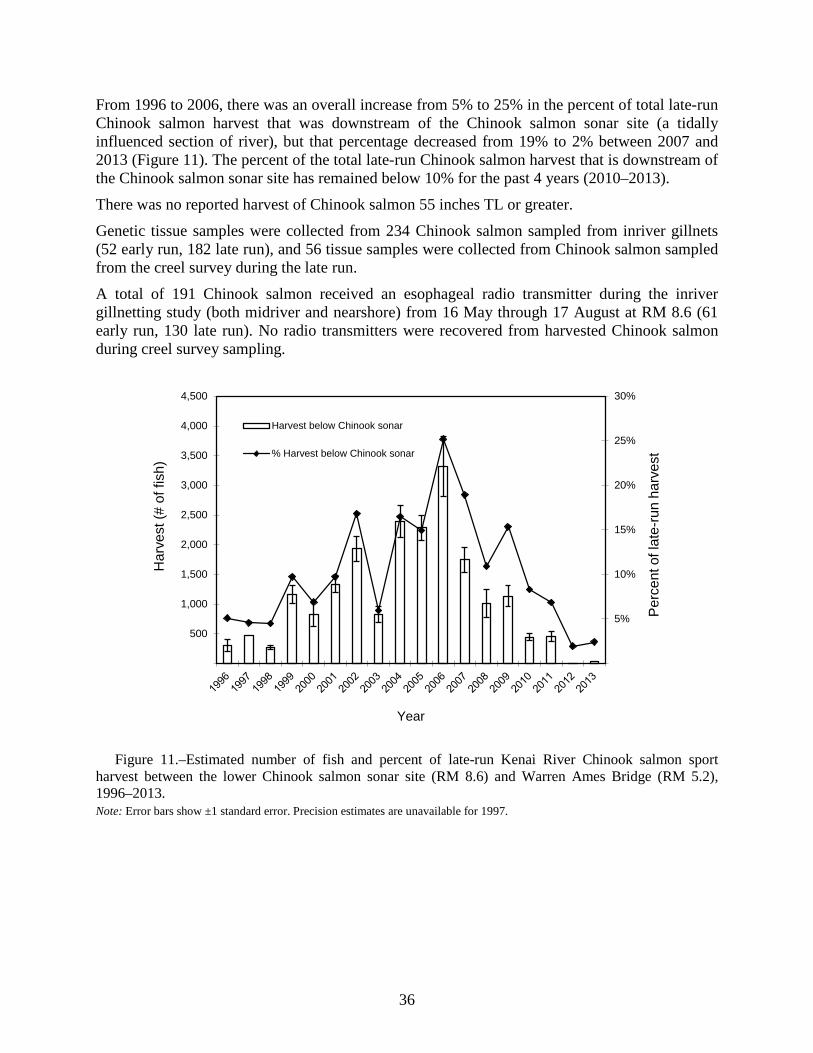
From 1996 to 2006, there was an overall increase from 5% to 25% in the percent of total late-run Chinook salmon harvest that was downstream of the Chinook salmon sonar site (a tidally influenced section of river), but that percentage decreased from 19% to 2% between 2007 and 2013 (Figure 11). The percent of the total late-run Chinook salmon harvest that is downstream of the Chinook salmon sonar site has remained below 10% for the past 4 years (2010–2013).
There was no reported harvest of Chinook salmon 55 inches TL or greater.
Genetic tissue samples were collected from 234 Chinook salmon sampled from inriver gillnets (52 early run, 182 late run), and 56 tissue samples were collected from Chinook salmon sampled from the creel survey during the late run.
A total of 191 Chinook salmon received an esophageal radio transmitter during the inriver gillnetting study (both midriver and nearshore) from 16 May through 17 August at RM 8.6 (61 early run, 130 late run). No radio transmitters were recovered from harvested Chinook salmon during creel survey sampling.
Figure 11.–Estimated number of fish and percent of late-run Kenai River Chinook salmon sport
harvest between the lower Chinook salmon sonar site (RM 8.6) and Warren Ames Bridge (RM 5.2), 1996–2013. Note: Error bars show ±1 standard error. Precision estimates are unavailable for 1997.
5%
10%
15%
20%
25%
30%
500
1,000
1,500
2,000
2,500
3,000
3,500
4,000
4,500
Per
cent
of l
ate-
run
harv
est
Har
vest
(# o
f fis
h)
Year
Harvest below Chinook sonar
% Harvest below Chinook sonar
36
DISCUSSION AND RECOMMENDATIONS CREEL SURVEY To achieve early- and late-run escapement goals during 2013, inseason management actions were imposed to restrict harvest of Kenai River Chinook salmon monitored by the creel survey. Early-run effort and harvest were the lowest on record, while late-run effort and harvest were among the lowest observed (Figures 3–4). During the early run, the sport fishery was restricted to catch-and-release trophy fishing, and all fish caught were released (Appendix B2). Prior to catch-and-release trophy fishing restrictions imposed in the late run (starting 25 July), approximately 29% (calculated from Appendices B3–B4) of Chinook salmon were released in the sport fishery. After the catch-and-release trophy fishing restriction was implemented during the late-run, 100% of Chinook salmon caught were released.
The late-run driftboat Monday fishery grew in popularity since its inception until 2008 (Perschbacher 2012d). However, during 2009–2012, late-run Monday index estimates of unguided angler effort and harvest were less than 5% of the total late-run effort and harvest and were less than 1.5% of the total late-run harvest during 2013. It is anticipated that as Chinook salmon runs rebound, so will angler effort and harvest on Mondays. This unique portion of the fishery should continue to be monitored annually. Periodic calibration of the index estimation method will be necessary to ensure relative accuracy.
Currently, CPUE in the creel survey is used with other indices by fisheries managers to gauge run strength and run timing of Kenai River Chinook salmon. The creel survey, coupled with management tools used for inseason estimates of run strength, timing, and abundance (such as the inriver gillnetting project, ESSN fishery, and the DIDSON sonar), is critical for inseason and postseason assessment of Kenai River Chinook salmon.
INRIVER GILLNETTING Since 2007, inriver gillnetting has been scheduled to begin sampling as close to the high tide as possible without interfering with the gillnetting crew’s ability to drift the net effectively. Compared to previous netting schedules, greater sonar fish passage has been observed during the current midriver netting schedule (Perschbacher 2012d); in addition, the schedule change from netting centered around low tide (years 2002–2006) to netting closer to high tide (years 2007–2013) has resulted in higher interception rates of sockeye salmon during the early- and late runs. In 2013, Chinook salmon and sockeye salmon catch rates differed significantly during different hours of the tidal stage and between nearshore and midriver areas (Figure 6).
The nearshore netting study in 2013 caught a disproportionate number of small Chinook salmon in the nearshore noninsonified area compared to the midriver insonified area, especially during the early run. Because early-run Chinook salmon primarily spawn in tributaries of the Kenai River, this may explain the discrepancy between the length composition of early-run Chinook salmon captured midriver and those sampled at the Funny River and Killey River weirs in 2012 and 2013. During the late run, there was no difference between the length distributions of Chinook salmon caught nearshore and midriver. However, it is important to note that sample sizes were small and the power to detect a difference was low. A more rigorous nearshore netting study will be implemented during 2014 to examine potential size differences, especially during the early run. If it becomes feasible to net nearshore and midriver with equal effort, shoreline to shoreline, this would allow better correspondence with the future RM 13.7 Chinook salmon
37

sonar site, which will insonify the entire water column. Because the Chinook salmon sonar site is being relocated from RM 8.6 to RM 13.7, investigating a possible site for netting upstream of the current RM 8.6 netting area is also warranted. With respect to dissimilar catch rates during different tidal stages, a fixed schedule (i.e., 0800–1600 hours) to examine tidal effects on catch rates should be employed. Ideally, all tide stages would be fished for both midriver and nearshore regions, and catch rates for sockeye and Chinook salmon by hours of the tide would suggest an optimal time frame for netting that would produce the largest catch rates and unbiased length composition estimates of the inriver run.
The inriver gillnetting study has been located at the RM 8.6 sonar site since 1998 and has been budgeted to end each year on 10 August, coinciding with the seasonal end of the sonar project. In 2012, the inriver gillnetting study was extended 5 days through 15 August because of a later than usual Chinook salmon run timing. Approximately 8% of the late-run Chinook salmon sampled in the inriver gillnets were captured 11–15 August (Perschbacher 2014). In 2013, netting was extended 7 days from 11 through 17 August, sampling approximately 6% of the total late-run Chinook salmon captured in the inriver gillnets. In the future, the inriver netting study should be budgeted through 15 August and end when less than 1% of the total late-run Chinook salmon gillnet catch is captured for 3 consecutive days.
Since 2011, managers have relied more heavily on inseason inriver gillnetting data as ADF&G transitions from the split-beam sonar to DIDSON/ARIS10 multi-beam technology for estimating Kenai River Chinook salmon abundance. The inriver gillnetting program continues to be an integral part of Kenai River Chinook salmon stock assessment and is critical to both inseason and postseason management of Kenai River Chinook salmon.
ACKNOWLEDGEMENTS Thanks are due to several individuals involved with the continued success of this project. Area research supervisor Tim McKinley oversaw the study and assisted when needed in all aspects of this project. Tony Eskelin provided knowledge of this project’s technical and biological issues, and spearheaded the nearshore netting pilot study. Jiaqi Huang and Steve Fleischman provided valuable biometric assistance. The creel survey and inriver gillnetting field crews successfully collected most of the data used in this report. Thanks also go to seasonal technicians Ivan Karic and Amanda Alaniz on the creel survey, and Kassi Johnson, Samantha Jones, Averee Amend, and Art Barbaza on the inriver gillnetting crews.
10 Adaptive Resolution Imaging Sonar (ARIS) is the next generation of mult-beam sonar technology producing images comparable to DIDSON or better.
38

REFERENCES CITED Bendock, T. N., and M. Alexandersdottir. 1992. Mortality and movement behavior of hooked-and-released Chinook
salmon in the Kenai River recreational fishery, 1989-1991. Alaska Department of Fish and Game, Fishery Manuscript No. 92-02, Anchorage. http://www.adfg.alaska.gov/FedAidPDFs/fms92-02.pdf
Bernard, D. R., A. E. Bingham, and M. Alexandersdottir. 1998. The mechanics of onsite creel surveys in Alaska. Alaska Department of Fish and Game, Special Publication No. 98-01, Anchorage. http://www.adfg.alaska.gov/FedAidPDFs/sp98-01.pdf
Boersma, J. K., and K. S. Gates. 2013. Abundance and run timing of adult Chinook salmon and steelhead in the Funny River, Kenai Peninsula, Alaska, 2012. U.S. Fish and Wildlife Service, Alaska Fisheries Data Series Report Number 2013-4, Soldotna. http://www.fws.gov/alaska/fisheries/fish/Data_Series/d_2013_4.pdf
Burger, C. V., R. L. Wilmot, and D. B. Wangaard. 1985. Comparison of spawning areas and times for two runs of Chinook salmon (Oncorhynchus tshawytscha) in the Kenai River, Alaska. Canadian Journal of Fisheries and Aquatic Sciences 42(4):693-700.
Clutter, R., and L. Whitesel. 1956. Collection and interpretation of sockeye salmon scales. International Pacific Salmon Commission, Bulletin 9. Westminster, British Columbia, Canada.
Cochran, W. G. 1977. Sampling techniques. 3rd edition. John Wiley and Sons, New York.
Conrad, R. H., and S. L. Hammarstrom. 1987. Harvest of Chinook salmon (Oncorhynchus tshawytscha) and coho salmon (O. kisutch) and angler-effort by the lower Kenai River recreational fisheries, 1986. Alaska Department of Fish and Game, Fishery Data Series No. 6, Juneau. http://www.adfg.alaska.gov/FedAidPDFs/fds-006.pdf
Efron, B. 1982. The jackknife, the bootstrap and other resampling plans. Society of Industrial and Applied Mathematics, Philadelphia CBMS-NSF Monograph 38, Philadelphia.
Eskelin, A. 2007. Chinook salmon creel survey and inriver gillnetting study, lower Kenai River, Alaska, 2005. Alaska Department of Fish and Game, Fishery Data Series No. 07-87, Anchorage. http://www.adfg.alaska.gov/FedAidPDFs/fds07-87.pdf
Eskelin, A. 2009. Chinook salmon creel survey and inriver gillnetting study, lower Kenai River, Alaska, 2006. Alaska Department of Fish and Game, Fishery Data Series No. 09-38, Anchorage. http://www.adfg.alaska.gov/FedAidPDFs/FDS09-38.pdf
Eskelin, A. 2010. Chinook salmon creel survey and inriver gillnetting study, lower Kenai River, Alaska, 2007. Alaska Department of Fish and Game, Fishery Data Series No. 10-63, Anchorage. http://www.adfg.alaska.gov/FedAidpdfs/FDS10-63.pdf
Gates, K. S., and J. K. Boersma. 2013. Abundance and run timing of adult Chinook salmon in the Killey River, Kenai Peninsula, Alaska, 2012. U.S. Fish and Wildlife Service, Alaska Fisheries Data Series Report Number 2013-5, Soldotna. http://www.fws.gov/alaska/fisheries/fish/Data_Series/d_2013_5.pdf
Goodman, L. A. 1960. On the exact variance of products. Journal of the American Statistical Association 55:708-713.
Hammarstrom, S. L. 1977. Evaluation of Chinook salmon fisheries of the Kenai Peninsula. Alaska Department of Fish and Game, Federal Aid in Sport Fish Restoration, Annual Performance Report 1976-1977, Project F-9-9(18)G-II-L, Juneau. http://www.adfg.alaska.gov/FedAidPDFs/fredF-9-9(18)G-II-L.pdf
Hammarstrom, S. L. 1978. Evaluation of Chinook salmon fisheries of the Kenai Peninsula. Alaska Department of Fish and Game, Federal Aid in Fish Restoration, Annual Report of Performance, 1977-1978, Project F-9-10(19)G-II-L, Juneau. http://www.adfg.alaska.gov/Fedaidpdfs/fredF-9-10(19)G-II-L.pdf
Hammarstrom, S. L. 1979. Evaluation of Chinook salmon fisheries of the Kenai Peninsula. Alaska Department of Fish and Game, Federal Aid in Fish Restoration, Annual Report of Performance, 1978-1979, Project F-9-11(20)G-II-L, Juneau. http://www.adfg.alaska.gov/fedaidpdfs/FREDf-9-11(20)g-ii-l.pdf
39
REFERENCES CITED (Continued) Hammarstrom, S. L. 1980. Evaluation of Chinook salmon fisheries of the Kenai Peninsula. Alaska Department of
Fish and Game, Sport Fish Division. Federal Aid in Fish Restoration, Annual Performance Report, 1980-1981, Project F-9-12(21)G-II-L, Juneau. http://www.adfg.alaska.gov/FedAidpdfs/FREDf-9-12(21)G-II-L.pdf
Hammarstrom, S. L. 1981. Evaluation of Chinook salmon fisheries of the Kenai Peninsula. Alaska Department of Fish and Game. Federal Aid in Fish Restoration, Annual Performance Report, 1980-1981, Project F-9-13(22)G-II-L, Juneau. http://www.adfg.alaska.gov/FedAidpdfs/fredf-9-13(22)G-II-L.pdf
Hammarstrom, S. L. 1988. Angler effort and harvest of Chinook salmon Oncorhynchus tshawytscha and coho salmon O. kisutch by the recreational fisheries in the lower Kenai River, 1987. Alaska Department of Fish and Game, Fishery Data Series No. 50, Juneau., Anchorage. http://www.adfg.alaska.gov/FedAidPDFs/fds-050.pdf
Hammarstrom, S. L. 1989. Angler-effort and harvest of Chinook salmon and coho salmon by the recreational fisheries in the lower Kenai River, 1988. Alaska Department of Fish and Game, Fishery Data Series No. 100, Juneau. http://www.adfg.alaska.gov/FedAidPDFs/fds-100.pdf
Hammarstrom, S. L. 1990. Angler-effort and harvest of Chinook salmon and coho salmon by the recreational fisheries in the lower Kenai River, 1989. Alaska Department of Fish and Game, Fishery Data Series No. 90-22, Anchorage. http://www.adfg.alaska.gov/FedAidPDFs/fds90-22.pdf
Hammarstrom, S. L. 1991. Angler effort and harvest of Chinook salmon and coho salmon by the recreational fisheries in the lower Kenai River, 1990. Alaska Department of Fish and Game, Fishery Data Series No. 91-44, Anchorage. http://www.adfg.alaska.gov/FedAidPDFs/fds91-44.pdf
Hammarstrom, S. L. 1992. Angler effort and harvest of Chinook salmon by the recreational fisheries in the Lower Kenai River, 1991. Alaska Department of Fish and Game, Fishery Data Series No. 92-25, Anchorage. http://www.adfg.alaska.gov/FedAidPDFs/fds92-25.pdf
Hammarstrom, S. L. 1993. Angler effort and harvest of Chinook salmon by the recreational fisheries in the lower Kenai River, 1992. Alaska Department of Fish and Game, Fishery Data Series No. 93-40, Anchorage. http://www.adfg.alaska.gov/FedAidPDFs/fds93-40.pdf
Hammarstrom, S. L. 1994. Angler effort and harvest of Chinook salmon by the recreational fisheries in the lower Kenai River, 1993. Alaska Department of Fish and Game, Fishery Data Series No. 94-7, Anchorage. http://www.adfg.alaska.gov/FedAidPDFs/fds94-07.pdf
Hammarstrom, S. L., L. Larson, M. Wenger, and J. Carlon. 1985. Kenai Peninsula Chinook and coho salmon studies. Alaska Department of Fish and Game. Federal Aid in Fish Restoration. Annual Performance Report, 1984-1985, Project F-9-17(26)G-II-L, Juneau. http://www.adfg.alaska.gov/FedAidPDFs/FREDf-9-17(26)G-II-L.pdf
Hammarstrom, S. L., and L. L. Larson. 1982. Evaluation of Chinook salmon fisheries of the Kenai Peninsula. Alaska Department of Fish and Game, Federal Aid in Fish Restoration, Annual Report of Performance, 1981-1982, Project F-9-14(23)G-II-L, Juneau. http://www.adfg.alaska.gov/FedAidPDFs/FREDf-9-14(23)G-II-L.pdf
Hammarstrom, S. L., and L. L. Larson. 1983. Evaluation of Chinook salmon fisheries of the Kenai Peninsula. Alaska Department of Fish and Game. Federal Aid in Fish Restoration, Annual Performance Report, 1982-1983, Project F-9-15(24)G-II-L, Juneau. http://www.adfg.alaska.gov/FedAidPDFs/FREDf-9-15(24)G-II-L.pdf
Hammarstrom, S. L., and L. L. Larson. 1984. Evaluation of Chinook salmon fisheries of the Kenai Peninsula. Alaska Department of Fish and Game. Federal Aid in Fish Restoration, Annual Performance Report, 1983-1984, Project F-9-16(25)G-II-L, Juneau. http://www.adfg.alaska.gov/FedAidPDFs/FREDf-9-16(25)G-II-L.pdf
Hammarstrom, S. L., and L. L. Larson. 1986. Kenai River creel census. Alaska Department of Fish and Game. Federal Aid in Fish Restoration, Annual Performance Report, 1985-1986, Project F-10-1, 27 (S-32-1), Juneau. http://www.sf.adfg.state.ak.us/FedAidPDFs/FREDf-10-1(27)S-32-1,2,4,5.pdf
Hughes, N. F. 2004. The wave-drag hypothesis: an explanation for size-based lateral segregation during the upstream migration of salmonids. Canadian Journal of Fisheries and Aquatic Sciences 61(1):103-109.
40

REFERENCES CITED (Continued) Jennings, G. B., K. Sundet, and A. E. Bingham. 2009a. Estimates of participation, catch, and harvest in Alaska sport
fisheries during 2005. Alaska Department of Fish and Game, Fishery Data Series No. 09-47, Anchorage. http://www.adfg.alaska.gov/FedAidPDFs/FDS09-47.pdf
Jennings, G. B., K. Sundet, and A. E. Bingham. 2009b. Estimates of participation, catch, and harvest in Alaska sport fisheries during 2006. Alaska Department of Fish and Game, Fishery Data Series No. 09-54, Anchorage. http://www.adfg.alaska.gov/FedAidPDFs/FDS09-54.pdf
Jennings, G. B., K. Sundet, and A. E. Bingham. 2010a. Estimates of participation, catch, and harvest in Alaska sport fisheries during 2007. Alaska Department of Fish and Game, Fishery Data Series No. 10-02, Anchorage. http://www.adfg.alaska.gov/FedAidpdfs/Fds10-02.pdf
Jennings, G. B., K. Sundet, and A. E. Bingham. 2010b. Estimates of participation, catch, and harvest in Alaska sport fisheries during 2008. Alaska Department of Fish and Game, Fishery Data Series No. 10-22, Anchorage. http://www.adfg.alaska.gov/FedAidpdfs/FDS10-22.pdf
Jennings, G. B., K. Sundet, and A. E. Bingham. 2011a. Estimates of participation, catch, and harvest in Alaska sport fisheries during 2009. Alaska Department of Fish and Game, Fishery Data Series No. 11-45, Anchorage. http://www.adfg.alaska.gov/FedAidpdfs/FDS11-45
Jennings, G. B., K. Sundet, and A. E. Bingham. 2011b. Estimates of participation, catch, and harvest in Alaska sport fisheries during 2010. Alaska Department of Fish and Game, Fishery Data Series No. 11-60, Anchorage. http://www.adfg.alaska.gov/FedAidpdfs/FDS11-60
King, M. A. 1996. Angler effort and harvest of Chinook salmon by the recreational fisheries in the lower Kenai River, 1995. Alaska Department of Fish and Game, Fishery Data Series No. 96-22, Anchorage. http://www.adfg.alaska.gov/FedAidPDFs/fds96-22.pdf
King, M. A. 1997. Angler effort and harvest of Chinook salmon by the recreational fisheries in the lower Kenai River, 1996. Alaska Department of Fish and Game, Fishery Data Series No. 97-9, Anchorage. http://www.adfg.alaska.gov/FedAidPDFs/fds97-09.pdf
Larson, L. 1995. A portable restraint cradle for handling large salmonids. North American Journal of Fisheries Management 15:654-656.
Marsh, L. E. 1999. Angler effort and harvest of Chinook salmon by the recreational fisheries in the lower Kenai River, 1997. Alaska Department of Fish and Game, Fishery Data Series No. 99-4, Anchorage. http://www.adfg.alaska.gov/FedAidPDFs/fds99-04.pdf
Marsh, L. E. 2000. Angler effort and harvest of Chinook salmon by the recreational fisheries in the lower Kenai River, 1998. Alaska Department of Fish and Game, Fishery Data Series No. 00-21, Anchorage. http://www.adfg.alaska.gov/FedAidPDFs/fds00-21.pdf
Miller, J. D., D. L. Burwen, and S. J. Fleischman. 2005. Estimates of Chinook salmon abundance in the Kenai River using split-beam sonar, 2003. Alaska Department of Fish and Game, Fishery Data Series No. 05-59, Anchorage. http://www.adfg.alaska.gov/FedAidPDFs/fds05-59.pdf
Miller, J. D., D. L. Burwen, and S. J. Fleischman. 2011. Estimates of Chinook salmon passage in the Kenai River using split-beam sonar, 2007. Alaska Department of Fish and Game, Fishery Data Series No. 11-52, Anchorage. http://www.adfg.alaska.gov/FedAidpdfs/FDS11-52
Perschbacher, J. 2012a. Chinook salmon creel survey and inriver gillnetting study, lower Kenai River, Alaska, 2008. Alaska Department of Fish and Game, Fishery Data Series No. 12-70, Anchorage. http://www.adfg.alaska.gov/FedAidpdfs/FDS12-70
Perschbacher, J. 2012b. Chinook salmon creel survey and inriver gillnetting study, lower Kenai River, Alaska, 2009. Alaska Department of Fish and Game, Fishery Data Series No. 12-61, Anchorage. http://www.adfg.alaska.gov/FedAidpdfs/FDS12-61
41

REFERENCES CITED (Continued) Perschbacher, J. 2012c. Chinook salmon creel survey and inriver gillnetting study, lower Kenai River, Alaska, 2010.
Alaska Department of Fish and Game, Fishery Data Series No. 12-75, Anchorage. http://www.adfg.alaska.gov/FedAidPDFs/FDS12-75.pdf
Perschbacher, J. 2012d. Chinook salmon creel survey and inriver gillnetting study, lower Kenai River, Alaska, 2011. Alaska Department of Fish and Game, Fishery Data Series No. 12-84, Anchorage. http://www.adfg.alaska.gov/FedAidPDFs/FDS12-84.pdf
Perschbacher, J. 2014. Chinook salmon creel survey and inriver gillnetting study, Lower Kenai River, Alaska, 2012. Alaska Department of Fish and Game, Fishery Data Series No. 14-37, Anchorage. http://www.adfg.alaska.gov/FedAidPDFs/FDS14-37.pdf
Reimer, A. 2003. Chinook salmon creel survey and inriver gillnetting study, lower Kenai River, Alaska, 2001. Alaska Department of Fish and Game, Fishery Data Series No. 03-01, Anchorage. http://www.adfg.alaska.gov/FedAidPDFs/fds03-01.pdf
Reimer, A. 2004a. Chinook salmon creel survey and inriver gillnetting study, lower Kenai River, Alaska, 2002. Alaska Department of Fish and Game, Fishery Data Series No. 04-28, Anchorage. http://www.adfg.alaska.gov/FedAidPDFs/fds04-28.pdf
Reimer, A. 2004b. Chinook salmon creel survey and inriver gillnetting study, lower Kenai River, Alaska, 2003. Alaska Department of Fish and Game, Fishery Data Series No. 04-32, Anchorage. http://www.adfg.alaska.gov/FedAidPDFs/fds04-32.pdf
Reimer, A. 2013a. Kenai River Chinook salmon abundance and migratory timing. Alaska Department of Fish and Game, Division of Sport Fish, Regional Operational Plan ROP.SF.2A.2013.14, Soldotna. http://www.adfg.alaska.gov/FedAidPDFs/ROP.SF.2A.2013.14.pdf
Reimer, A. M. 2007. Chinook salmon creel survey and inriver gillnetting study, lower Kenai River, Alaska, 2004. Alaska Department of Fish and Game, Fishery Data Series No. 07-65, Anchorage. http://www.adfg.alaska.gov/FedAidPDFs/fds07-65.pdf
Reimer, A. M. 2013b. Migratory timing and distribution of Kenai River Chinook salmon, 2010–2013, a report to the Alaska Board of Fisheries, 2014. Alaska Department of Fish and Game, Division of Sport Fish, Regional Information Report 2A13-06, Anchorage. http://www.adfg.alaska.gov/FedAidpdfs/RIR.3A.2013.06
Reimer, A. M., W. W. Jones, and L. E. Marsh. 2002. Chinook salmon creel survey and inriver gillnetting study, lower Kenai River, Alaska, 1999 and 2000. Alaska Department of Fish and Game, Fishery Data Series No. 02-25, Anchorage. http://www.adfg.alaska.gov/FedAidPDFs/fds02-25.pdf
Roni, P., and T. P. Quinn. 1995. Geographic variation in size and age of North American Chinook salmon. North American Journal of Fisheries Management 15:325-345
Schwager-King, M. A. 1995. Angler effort and harvest of Chinook salmon by the recreational fisheries in the lower Kenai River, 1994. Alaska Department of Fish and Game, Fishery Data Series No. 95-12, Anchorage. http://www.adfg.alaska.gov/FedAidPDFs/fds95-12.pdf
Tobias, T. M., and T. M. Willette. 2012. Abundance, age, sex, and size of Chinook, sockeye, coho and chum salmon returning to Upper Cook Inlet, Alaska, 2010. Alaska Department of Fish and Game, Fishery Data Series No. 12-14, Anchorage. http://www.adfg.alaska.gov/FedAidpdfs/FDS12-14
Welander, A. D. 1940. A study of the development of the scale of Chinook salmon Oncorhynchus tshawytscha. Master’s thesis. University of Washington, Seattle.
42

APPENDIX A: GUIDED AND UNGUIDED BOAT ANGLER
COUNTS
43
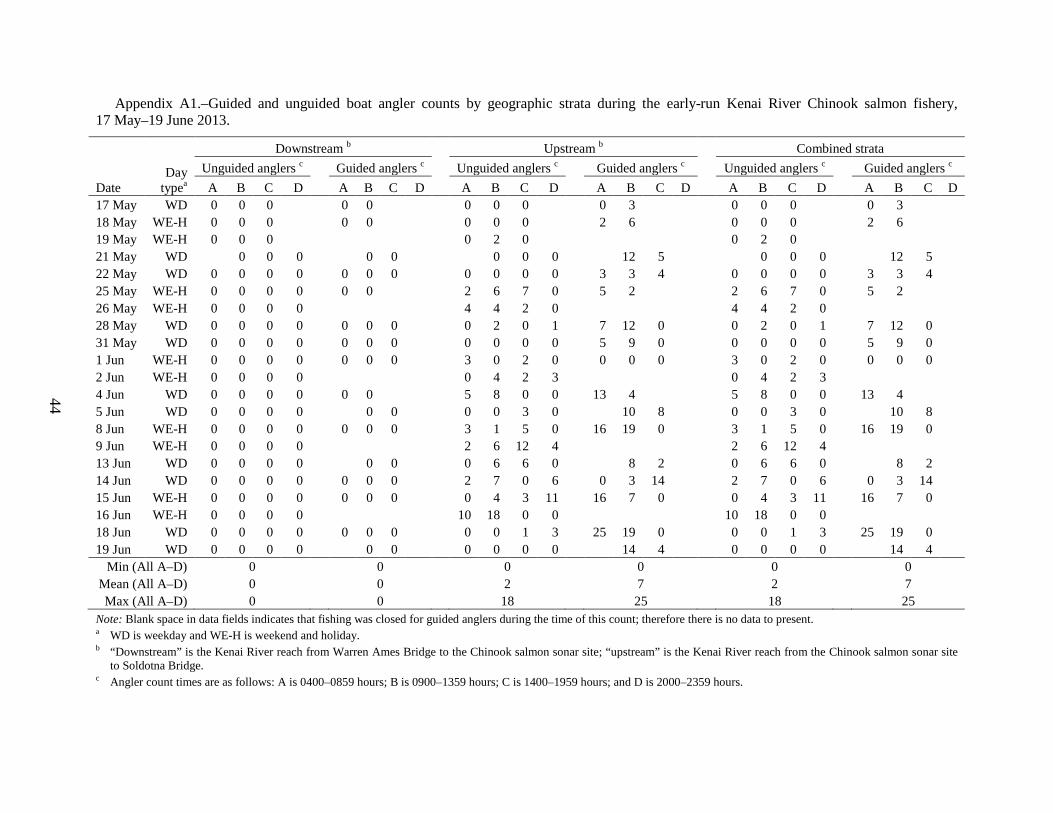
44
Appendix A1.–Guided and unguided boat angler counts by geographic strata during the early-run Kenai River Chinook salmon fishery, 17 May–19 June 2013.
Downstream b Upstream b Combined strata
Day
typea Unguided anglers c
Guided anglers c
Unguided anglers c
Guided anglers c
Unguided anglers c
Guided anglers c
Date A B C D A B C D A B C D A B C D A B C D A B C D 17 May WD 0 0 0
0 0
0 0 0
0 3
0 0 0
0 3
18 May WE-H 0 0 0
0 0
0 0 0
2 6
0 0 0
2 6 19 May WE-H 0 0 0
0 2 0
0 2 0
21 May WD
0 0 0
0 0
0 0 0
12 5
0 0 0
12 5 22 May WD 0 0 0 0 0 0 0
0 0 0 0 3 3 4
0 0 0 0 3 3 4
25 May WE-H 0 0 0 0 0 0
2 6 7 0 5 2
2 6 7 0 5 2 26 May WE-H 0 0 0 0
4 4 2 0
4 4 2 0
28 May WD 0 0 0 0 0 0 0
0 2 0 1 7 12 0
0 2 0 1 7 12 0 31 May WD 0 0 0 0 0 0 0
0 0 0 0 5 9 0
0 0 0 0 5 9 0
1 Jun WE-H 0 0 0 0 0 0 0
3 0 2 0 0 0 0
3 0 2 0 0 0 0 2 Jun WE-H 0 0 0 0
0 4 2 3
0 4 2 3
4 Jun WD 0 0 0 0 0 0
5 8 0 0 13 4
5 8 0 0 13 4 5 Jun WD 0 0 0 0
0 0
0 0 3 0
10 8
0 0 3 0
10 8
8 Jun WE-H 0 0 0 0 0 0 0
3 1 5 0 16 19 0
3 1 5 0 16 19 0 9 Jun WE-H 0 0 0 0
2 6 12 4
2 6 12 4
13 Jun WD 0 0 0 0
0 0
0 6 6 0
8 2
0 6 6 0
8 2 14 Jun WD 0 0 0 0 0 0 0
2 7 0 6 0 3 14
2 7 0 6 0 3 14
15 Jun WE-H 0 0 0 0 0 0 0
0 4 3 11 16 7 0
0 4 3 11 16 7 0 16 Jun WE-H 0 0 0 0
10 18 0 0
10 18 0 0
18 Jun WD 0 0 0 0 0 0 0
0 0 1 3 25 19 0
0 0 1 3 25 19 0 19 Jun WD 0 0 0 0
0 0
0 0 0 0
14 4
0 0 0 0
14 4
Min (All A–D) 0 0 0 0 0 0 Mean (All A–D) 0
0
2
7
2
7
Max (All A–D) 0 0 18 25 18 25 Note: Blank space in data fields indicates that fishing was closed for guided anglers during the time of this count; therefore there is no data to present. a WD is weekday and WE-H is weekend and holiday. b “Downstream” is the Kenai River reach from Warren Ames Bridge to the Chinook salmon sonar site; “upstream” is the Kenai River reach from the Chinook salmon sonar site
to Soldotna Bridge. c Angler count times are as follows: A is 0400–0859 hours; B is 0900–1359 hours; C is 1400–1959 hours; and D is 2000–2359 hours.

45
Appendix A2.–Guided and unguided boat angler counts by geographic strata during the late-run Kenai River Chinook salmon fishery, 1–27 July 2013.
Downstream b Upstream b Combined strata
Day
type a Unguided anglers c
Guided anglers c
Unguided anglers c
Guided anglers c
Unguided anglers c
Guided anglers c
Date A B C D A B C D A B C D A B C D A B C D A B C D 1 Jul M
0
6
6
2 Jul WD 0 0 0 0
11 0
14 18 23 8
186 132
14 18 23 8
197 132 5 Jul WD 0 11 0 0
6 6
16 32 22 8
127 74
16 43 22 8
133 80
6 Jul WE-H 0 3 0 0
3 0 0
25 39 28 19
118 115 28
25 42 28 19
121 115 28 7 Jul WE-H 0 0 0 0
15 50 58 42
15 50 58 42
8 Jul M
0
25
25 9 Jul WD 0 0 0 0
0 10 0
35 19 30 4
201 103 42
35 19 30 4
201 113 42
11 Jul WD 0 0 4 0
0 2 0
24 35 51 43
161 111 48
24 35 55 43
161 113 48 13 Jul WE-H 0 0 0 0
0 0
65 72 52 17
216 167
65 72 52 17
216 167
14 Jul WE-H 0 0 13 0
43 103 109 68
43 103 122 68 15 Jul M
0
22
22
18 Jul WD 0 0 0 0
14 0
70 61 61 22
292 175
70 61 61 22
306 175 19 Jul WD 7 0 4 6
6 6
65 64 42 18
264 240
72 64 46 24
270 246
20 Jul WE-H 3 0 0 0
3 15 3
106 80 50 27
270 208 41
109 80 50 27
273 223 44 21 Jul WE-H 0 8 0 0
142 102 87 42
142 110 87 42
22 Jul M
0
30
30 23 Jul WD 0 0 0 1
0 7 0
177 74 57 57
406 283 57
177 74 57 58
406 290 57
24 Jul WD 0 3 4 0
0 0 0
106 66 79 86
309 243 119
106 69 83 86
309 243 119 27 Jul WD 0 3 0 0
0 0
49 29 46 51
105 66
49 32 46 51
105 66
Min (All A–D) 0 0 4 28 4 28 Mean (All A–D) 1
3
50
164
51
167
Max (All A–D) 13 15 177 406 177 406 Note: Blank space in data fields indicates that fishing was closed for guided anglers during the time of this count; therefore there is no data to present. a M is Monday index count (0800–1359), WD is weekday, and WE-H is weekend and holiday. b “Downstream” is the Kenai River reach from Warren Ames Bridge to the Chinook salmon sonar site; “upstream” is the Kenai River reach from the Chinook salmon sonar site
to Soldotna Bridge. c Angler count times are as follows: A is 0400–0859 hours; B is 0900–1359 hours; C is 1400–1959 hours; and D is 2000–2359 hours.

46

APPENDIX B: DAILY ESTIMATES OF GUIDED AND UNGUIDED BOAT ANGLER EFFORT, CATCH, AND
HARVEST
47

48
Appendix B1.–Daily estimates of unguided boat angler effort, catch, harvest, CPUE, and HPUE by geographic strata during the early-run Kenai River Chinook salmon fishery, 17 May–19 June 2013.
Angler interview data a Downstream b Upstream b
Day
type c
Counts Effort Catch Harvest
Counts Effort Catch Harvest
Date n d CPUE SE HPUE SE n Mean Est. SE Est. SE Est. SE n Mean Est. SE Est. SE Est. SE 17 May WD 0 0.000 0.000 0.000 0.000
3 0.0 0 0 0 0 0 0
3 0.0 0 0 0 0 0 0
18 May WE-H 0 0.000 0.000 0.000 0.000
3 0.0 0 0 0 0 0 0
3 0.0 0 0 0 0 0 0 19 May WE-H 3 0.000 0.000 0.000 0.000
3 0.0 0 0 0 0 0 0
3 0.7 13 16 0 0 0 0
21 May WD 3 0.000 0.000 0.000 0.000
3 0.0 0 0 0 0 0 0
3 0.0 0 0 0 0 0 0 22 May WD 0 0.000 0.000 0.000 0.000
4 0.0 0 0 0 0 0 0
4 0.0 0 0 0 0 0 0
25 May WE-H 10 0.033 0.034 0.000 0.000
4 0.0 0 0 0 0 0 0
4 3.8 75 33 3 3 0 0 26 May WE-H 2 0.031 0.027 0.000 0.000
4 0.0 0 0 0 0 0 0
4 2.5 50 12 2 1 0 0
28 May WD 3 0.000 0.000 0.000 0.000
4 0.0 0 0 0 0 0 0
4 0.8 15 12 0 0 0 0 31 May WD 0 0.000 0.000 0.000 0.000
4 0.0 0 0 0 0 0 0
4 0.0 0 0 0 0 0 0
1 Jun WE-H 1 0.000 0.000 0.000 0.000
4 0.0 0 0 0 0 0 0
4 1.3 25 17 0 0 0 0 2 Jun WE-H 4 0.000 0.000 0.000 0.000
4 0.0 0 0 0 0 0 0
4 2.3 45 19 0 0 0 0
4 Jun WD 9 0.000 0.000 0.000 0.000
4 0.0 0 0 0 0 0 0
4 3.3 65 35 0 0 0 0 5 Jun WD 6 0.000 0.000 0.000 0.000
4 0.0 0 0 0 0 0 0
4 0.8 15 17 0 0 0 0
8 Jun WE-H 10 0.000 0.000 0.000 0.000
4 0.0 0 0 0 0 0 0
4 2.3 45 27 0 0 0 0 9 Jun WE-H 8 0.039 0.038 0.000 0.000
4 0.0 0 0 0 0 0 0
4 6.0 120 44 5 5 0 0
13 Jun WD 6 0.000 0.000 0.000 0.000
4 0.0 0 0 0 0 0 0
4 3.0 60 35 0 0 0 0 14 Jun WD 4 0.000 0.000 0.000 0.000
4 0.0 0 0 0 0 0 0
4 3.8 75 43 0 0 0 0
15 Jun WE-H 0 0.000 0.000 0.000 0.000
4 0.0 0 0 0 0 0 0
4 4.5 90 37 0 0 0 0 16 Jun WE-H 14 0.000 0.000 0.000 0.000
4 0.0 0 0 0 0 0 0
4 7.0 140 80 0 0 0 0
18 Jun WD 0 0.250 0.180 0.000 0.000
4 0.0 0 0 0 0 0 0
4 1.0 20 9 5 4 0 0 19 Jun WD 2 0.250 0.180 0.000 0.000
4 0.0 0 0 0 0 0 0
4 0.0 0 0 0 0 0 0
Min 0 0.000 0.000 3 0.0 0 0 0 3 0.0 0 0 0
Mean 4 0.029
0.000
4 0.0 0
0
0
4 2.0 41
1
0
Max 14 0.250 0.000 4 0.0 0 0 0 4 7.0 140 5 0 Note: “Catch” is fish harvested plus fish released; “harvest” is fish kept; “effort” is angler hours; “CPUE” is catch per unit effort; and “HPUE” is harvest per unit effort. a WD is weekday and WE-H is weekend and holiday. b Angler counts were geographically stratified; angler interviews were not. CPUE and HPUE are catch and harvest per hour. c “Downstream” is the Kenai River reach from Warren Ames Bridge to the Chinook salmon sonar site; “upstream” is the Kenai River reach from the Chinook salmon sonar site
to Soldotna Bridge. d On days with less than 5 angler interviews, pooled estimates of CPUE and HPUE from other days in the stratum were used.

49
Appendix B2.–Daily estimates of guided boat angler effort, catch, harvest, CPUE, and HPUE by geographic strata during the early-run Kenai River Chinook salmon fishery, 17 May–19 June 2013.
Angler interview data a Downstream b Upstream b
Day
type c Counts Effort Catch Harvest
Counts Effort Catch Harvest
Date n d CPUE SE HPUE SE n Mean Est. SE Est. SE Est. SE n Mean Est. SE Est. SE Est. SE 17 May WD 2 0.000 0.000 0.000 0.000
2 0.0 0 0 0 0 0 0
2 1.5 18 18 0 0 0 0
18 May WE-H 8 0.000 0.000 0.000 0.000
2 0.0 0 0 0 0 0 0
2 4.0 48 24 0 0 0 0 21 May WD 0 0.029 0.078 0.000 0.000
2 0.0 0 0 0 0 0 0
2 8.5 102 42 3 8 0 0
22 May WD 4 0.029 0.078 0.000 0.000
3 0.0 0 0 0 0 0 0
3 3.3 40 3 1 3 0 0 25 May WE-H 4 0.029 0.078 0.000 0.000
2 0.0 0 0 0 0 0 0
2 3.5 42 18 1 3 0 0
26 May WE-H 2 0.000 0.000 0.000 0.000
3 0.7
3 3.3 28 May WD 6 0.000 0.000 0.000 0.000
3 0.0 0 0 0 0 0 0
3 6.3 76 45 0 0 0 0
31 May WD 2 0.000 0.000 0.000 0.000
3 0.0 0 0 0 0 0 0
3 4.7 56 34 0 0 0 0 1 Jun WE-H 0 0.000 0.000 0.000 0.000
3 0.0 0 0 0 0 0 0
3 0.0 0 0 0 0 0 0
4 Jun WD 4 0.010 0.012 0.000 0.000
2 0.0 0 0 0 0 0 0
2 8.5 102 54 1 1 0 0 5 Jun WD 0 0.010 0.012 0.000 0.000
3 0.0 0 0 0 0 0 0
3 9.0 108 12 1 1 0 0
8 Jun WE-H 10 0.014 0.014 0.000 0.000
3 0.0 0 0 0 0 0 0
3 11.7 140 67 2 2 0 0 13 Jun WD 4 0.000 0.000 0.000 0.000
3 0.0 0 0 0 0 0 0
3 5.0 60 36 0 0 0 0
14 Jun WD 0 0.000 0.000 0.000 0.000
3 0.0 0 0 0 0 0 0
3 5.7 68 39 0 0 0 0 15 Jun WE-H 4 0.000 0.000 0.000 0.000
3 0.0 0 0 0 0 0 0
3 7.7 92 39 0 0 0 0
18 Jun WD 8 0.023 0.023 0.000 0.000
3 0.0 0 0 0 0 0 0
3 14.7 176 69 4 4 0 0 19 Jun WD 4 0.019 0.018 0.000 0.000
3 0.0 0 0 0 0 0 0
3 9.0 108 60 2 2 0 0
Min 0 0.000 0.000 2 0.0 0 0 0 2 0.0 0 0 0
Mean 4 0.010
0.000
3 0.0 0
0
0
3 6.3 77
1
0
Max 10 0.029 0.000 3 0.7 0 0 0 3 14.7 176 4 0 Note: “Catch” is fish harvested plus fish released; “harvest” is fish kept; “effort” is angler hours; “CPUE” is catch per unit effort; and “HPUE” is harvest per unit effort. a WD is weekday and WE-H is weekend and holiday. b Angler counts were geographically stratified; angler interviews were not. CPUE and HPUE are catch and harvest per hour. c “Downstream” is the Kenai River reach from Warren Ames Bridge to the Chinook salmon sonar site; “upstream” is the Kenai River reach from the Chinook salmon sonar site
to Soldotna Bridge. d On days with less than 5 angler interviews, pooled estimates of CPUE and HPUE from other days in the stratum were used.

50
Appendix B3.–Daily estimates of unguided boat angler effort, catch, harvest, CPUE, and HPUE by geographic strata during the late-run Kenai River Chinook salmon fishery, 1–27 July 2013.
Angler interview data b Downstream c Upstream c
Day
type a Counts Effort Catch Harvest Counts Effort Catch Harvest
Date n d CPUE SE HPUE SE n Mean Est. SE Est. SE Est. SE n Mean Est. SE Est. SE Est. SE 2 Jul WD 6 0.000 0.000 0.000 0.000
4 0.0 0 0 0 0 0 0
4 15.8 315 67 0 0 0 0
5 Jul WD 25 0.022 0.015 0.000 0.000
4 2.8 55 64 1 2 0 0
4 19.5 390 96 9 6 0 0 6 Jul WE-H 9 0.000 0.000 0.000 0.000
4 0.8 15 17 0 0 0 0
4 27.8 555 81 0 0 0 0
7 Jul WE-H 24 0.054 0.022 0.045 0.021
4 0.0 0 0 0 0 0 0
4 41.3 825 160 44 20 37 18 9 Jul WD 2 0.000 0.000 0.000 0.000
4 0.0 0 0 0 0 0 0
4 22.0 440 132 0 0 0 0
11 Jul WD 2 0.000 0.000 0.000 0.000
4 1.0 20 23 0 0 0 0
4 38.3 765 86 0 0 0 0 13 Jul WE-H 13 0.000 0.000 0.000 0.000
4 0.0 0 0 0 0 0 0
4 51.5 1,030 167 0 0 0 0
14 Jul WE-H 28 0.045 0.019 0.037 0.017
4 3.3 65 75 3 4 2 3
4 80.8 1,615 298 72 33 60 30 18 Jul WD 4 0.057 0.033 0.033 0.032
4 0.0 0 0 0 0 0 0
4 53.5 1,070 163 61 37 35 35
19 Jul WD 25 0.060 0.021 0.030 0.017
4 4.3 85 34 5 3 3 2
4 47.3 945 133 57 21 28 17 20 Jul WE-H 26 0.008 0.008 0.008 0.008
4 0.8 15 12 0 0 0 0
4 65.8 1,315 187 10 10 10 10
21 Jul WE-H 26 0.053 0.026 0.040 0.023
4 2.0 40 46 2 3 2 2
4 93.3 1,865 253 98 50 74 44 23 Jul WD 19 0.032 0.017 0.000 0.000
4 0.3 5 4 0 0 0 0
4 91.3 1,825 426 59 33 0 0
24 Jul WD 20 0.022 0.016 0.011 0.011
4 1.8 35 21 1 1 0 0
4 84.3 1,685 174 37 27 18 19 27 Jul WE-H 20 0.040 0.020 0.000 0.000
4 0.8 15 17 1 1 0 0
4 43.8 875 109 35 18 0 0
Min 2 0.000 0.000 4 0.0 0 0 0 4 15.8 315 0 0
Mean 17 0.026
0.013
4 1.2 23
1
0
4 51.7 1,034
32
17
Max 28 0.060 0.045 4 4.3 85 5 3 4 93.3 1,865 98 74 Note: “Catch” is fish harvested plus fish released; “harvest” is fish kept; “effort” is angler hours; “CPUE” is catch per unit effort; and “HPUE” is harvest per unit effort. a WD is weekday and WE-H is weekend and holiday. b Angler counts were geographically stratified; angler interviews were not. CPUE and HPUE are catch and harvest per hour. c “Downstream” is the Kenai River reach from Warren Ames Bridge to the Chinook salmon sonar site; “upstream” is the Kenai River reach from the Chinook salmon sonar site
to Soldotna Bridge. d On days with less than 5 angler interviews, pooled estimates of CPUE and HPUE from other days in the stratum were used.

51
Appendix B4.–Daily estimates of guided boat angler effort, catch, harvest, CPUE, and HPUE by geographic strata during the late-run Kenai River Chinook salmon fishery, 1–27 July 2013.
Angler interview data b Downstream c Upstream c
Day
type a Counts Effort Catch Harvest Counts Effort Catch Harvest
Date n d CPUE SE HPUE SE n Mean Est. SE Est. SE Est. SE n Mean Est. SE Est. SE Est. SE 2 Jul WD 43 0.006 0.005 0.006 0.005
2 5.5 66 66 0 1 0 1
2 159.0 1,908 324 12 9 12 9
5 Jul WD 27 0.040 0.018 0.029 0.013
2 6.0 72 0 3 1 2 1
2 100.5 1,206 318 48 25 34 18 6 Jul WE-H 2 0.018 0.021 0.014 0.015
3 1.0 12 10 0 0 0 0
3 87.0 1,044 302 19 23 15 17
9 Jul WD 54 0.020 0.008 0.017 0.007
3 3.3 40 49 1 1 1 1
3 115.3 1,384 400 28 14 23 12 11 Jul WD 25 0.113 0.032 0.066 0.024
3 0.7 8 10 1 1 1 1
3 106.7 1,280 279 144 52 84 36
13 Jul WE-H 72 0.021 0.006 0.012 0.005
2 0.0 0 0 0 0 0 0
2 191.5 2,298 294 48 16 29 12 18 Jul WD 23 0.075 0.022 0.047 0.018
2 7.0 84 84 6 7 4 4
2 233.5 2,802 702 209 81 131 61
19 Jul WD 8 0.053 0.045 0.053 0.045
2 6.0 72 0 4 3 4 3
2 252.0 3,024 144 161 136 161 136 20 Jul WE-H 21 0.029 0.018 0.029 0.018
3 7.0 84 59 2 2 2 2
3 173.0 2,076 617 60 41 60 41
23 Jul WD 11 0.079 0.057 0.063 0.044
3 2.3 28 34 2 3 2 2
3 248.7 2,984 891 235 184 188 142 24 Jul WD 40 0.016 0.007 0.013 0.007
3 0.0 0 0 0 0 0 0
3 223.7 2,684 487 43 21 34 19
27 Jul WE-H 4 0.029 0.068 0.021 0.048
3 0.0 0 0 0 0 0 0
3 85.5 1,026 234 70 30 0 0 Min 2 0.006 0.006 2 0.0 0 0 0 2 85.5 1,026 12 0
Mean 28 0.042
0.031
3 3.2 39
2
1
3 164.7 1,976
90
64
Max 72 0.113 0.066 3 7.0 84 6 4 3 252.0 3,024 235 188 Note: “Catch” is fish harvested plus fish released; “harvest” is fish kept; “effort” is angler hours; “CPUE” is catch per unit effort; and “HPUE” is harvest per unit effort. a WD is weekday and WE-H is weekend and holiday. b Angler counts were geographically stratified; angler interviews were not. CPUE and HPUE are catch and harvest per hour. c “Downstream” is the Kenai River reach from Warren Ames Bridge to the Chinook salmon sonar site; “upstream” is the Kenai River reach from the Chinook salmon sonar site
to Soldotna Bridge. d On days with less than 5 angler interviews, pooled estimates of CPUE and HPUE from other days in the stratum were used.

52

APPENDIX C: ESTIMATED EFFORT, CATCH, AND
HARVEST ABOVE AND BELOW RM 8.6
53

54
Appendix C1.–Estimated effort, catch, and harvest above and below RM 8.6 during the early-run Kenai River Chinook salmon fishery, 16 May–19 June 2013.
Downstreama creel estimates Upstreama creel estimates
Chinook salmon
Chinook salmon
Effort
Catch Harvest
Effort
Catch Harvest
Hours fished SE
No. fish SE
No. fish SE
Hours fished SE
No. fish SE
No. fish SE
Downstream % Fishing periods b Effort Catch Harvest 16–19 May
Guided WD 0 0
0 0
0 0
36 25
0 0
0 0 0.0% NA NA
Guided WE 0 0
0 0
0 0
48 24
0 0
0 0 0.0% NA NA
Unguided WD 0 0
0 0
0 0
0 0
0 0
0 0 NA NA NA
Unguided WE 0 0
0 0
0 0
13 16
0 0
0 0 0.0% NA NA
21–27 May
Guided WD 0 0
0 0
0 0
284 106
8 12
0 0 0.0% 0.0% NA
Guided WE-H 0 0
0 0
0 0
84 25
2 5
0 0 0.0% 0.0% NA
Unguided WD 0 0
0 0
0 0
0 0
0 0
0 0 NA NA NA
Unguided WE-H 0 0
0 0
0 0
188 48
6 4
0 0 0.0% 0.0% NA
28 May–2 June
Guided WD 0 0
0 0
0 0
264 85
0 0
0 0 0.0% NA NA
Guided WE 0 0
0 0
0 0
0 0
0 0
0 0 NA NA NA
Unguided WD 0 0
0 0
0 0
30 27
0 0
0 0 0.0% NA NA
Unguided WE 0 0
0 0
0 0
70 25
0 0
0 0 0.0% NA NA
4–9 June
Guided WD 0 0
0 0
0 0
420 79
4 3
0 0 0.0% 0.0% NA
Guided WE 0 0
0 0
0 0
140 67
2 2
0 0 0.0% 0.0% NA
Unguided WD 0 0
0 0
0 0
160 90
0 0
0 0 0.0% NA NA
Unguided WE 0 0 0 0 0 0 165 52 5 5 0 0 0.0% 0.0% NA -continued-

55
Appendix C1.–Page 2 of 2.
Downstream creel estimates b Upstream creel estimates b
Chinook salmon
Chinook salmon
Effort
Catch Harvest
Effort
Catch Harvest
Hours fished SE
No. fish SE
No. fish SE
Hours fished SE
No. fish SE
No. fish SE
Downstream % Fishing periods a Effort Catch Harvest 11–16 June
Guided WD 0 0
0 0
0 0
256 76
0 0
0 0 0.0% NA NA
Guided WE 0 0
0 0
0 0
92 39
0 0
0 0 0.0% NA NA
Unguided WD 0 0
0 0
0 0
270 81
0 0
0 0 0.0% NA NA
Unguided WE 0 0
0 0
0 0
230 88
0 0
0 0 0.0% NA NA
18–19 June
Guided WD 0 0
0 0
0 0
284 91
6 5
0 0 0.0% 0.0% NA
Unguided WD 0 0 0 0 0 0 20 9 5 4 0 0 0.0% 0.0% NA Day type subtotals
Guided WD 0 0
0 0
0 0
1,544 199
18 14
0 0 0.0% 0.0% NA
Guided WE-H 0 0
0 0
0 0
364 85
4 5
0 0 0.0% 0.0% NA
Unguided WD 0 0
0 0
0 0
480 124
5 4
0 0 0.0% 0.0% NA
Unguided WE-H 0 0 0 0 0 0 666 117 11 6 0 0 0.0% 0.0% NA Angler type subtotals
Guided 0 0
0 0
0 0
1,908 216
23 15
0 0 0.0% 0.0% NA
% Guided 0.0%
0.0%
0.0%
62.5%
59.2%
0.0%
Unguided 0 0
0 0
0 0
1,146 171
16 8
0 0 0.0% 0.0% NA
% Unguided 0.0% 0.0% 0.0% 37.5% 40.8% 0.0%
Early-run total 0 0 0 0 0 0 3,054 275 39 16 0 0 0.0% 0.0% NA Note: NA means not applicable. a The sport fishery was closed to harvest of Chinook salmon 20–55 inches TL on 16 May–19 June and closed to all Chinook salmon fishing 20–30 June. b “Downstream” is the Kenai River reach from the Warren Ames Bridge to the Chinook salmon sonar site; “upstream” is the Kenai River reach from the Chinook salmon sonar
site to Soldotna Bridge.

56
Appendix C2.–Estimated effort, catch, and harvest above and below RM 8.6 during the late-run Kenai River Chinook salmon fishery, 1–27 July 2013.
Downstream creel estimates b Upstream creel estimates b
Chinook salmon
Chinook salmon
Effort
Catch
Harvest
Effort
Catch
Harvest
Hours
No. fish
No. fish
Hours
No. fish
No. fish
Downstream % Fishing periods a fished SE SE SE fished SE SE SE Effort Catch Harvest 2–7 July
Guided WD 276 94
7 4
5 3
6,228 1,182
121 63
93 43 4.2% 5.2% 5.1%
Guided WE 12 10
0 0
0 0
1,044 302
19 23
15 17 1.1% 1.1% 1.1%
Unguided WD 110 119
2 3
0 0
1,410 196
17 15
0 0 7.2% 12.4% N/A
Unguided WE 15 17
0 0
0 0
1,380 180
44 20
37 18 1.1% 0.0% 0.0%
9–14 July
Guided WD 96 84
3 2
2 2
5,328 705
344 182
214 102 1.8% 1.0% 1.1%
Guided WE 0 0
0 0
0 0
2,298 294
48 16
29 12 0.0% 0.0% 0.0%
Unguided WD 40 43
0 0
0 0
2,410 511
0 0
0 0 1.6% N/A N/A
Unguided WE 65 75
3 4
2 3
2,645 341
72 33
60 30 2.4% 3.9% 3.9%
16–21 July
Guided WD 312 120
20 11
16 8
11,652 1,061
740 234
584 215 2.6% 2.7% 2.6%
Guided WE 84 59
2 2
2 2
2,076 617
60 41
60 41 3.9% 3.9% 3.9%
Unguided WD 170 129
10 8
5 4
4,030 346
235 60
126 55 4.0% 4.2% 3.9%
Unguided WE 55 48
2 3
2 2
3,180 315
108 51
84 45 1.7% 2.0% 2.0%
23–27 July
Guided WD 28 34
2 3
2 2
7,720 1,042
419 198
222 144 0.4% 0.5% 0.8%
Guided WE 0 0
0 0
0 0
1,026 234
71 69
0 0 0.0% 0.0% N/A
Unguided WD 70 27
2 1
0 0
5,260 473
165 47
18 19 1.3% 1.3% 2.0%
Unguided WE 15 17 1 1 0 0 875 109 35 18 0 0 1.7% 1.7% N/A -continued-
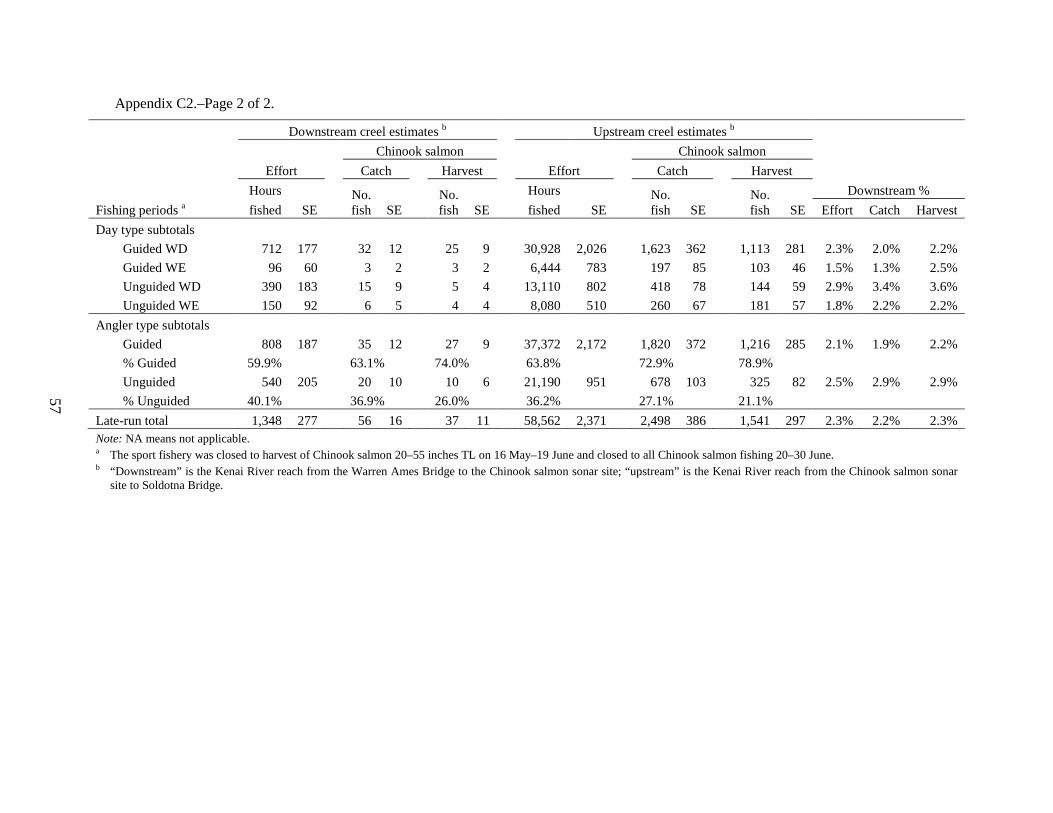
57
Appendix C2.–Page 2 of 2.
Downstream creel estimates b Upstream creel estimates b
Chinook salmon
Chinook salmon
Effort
Catch
Harvest
Effort
Catch
Harvest
Hours
No. fish
No. fish
Hours
No. fish
No. fish
Downstream % Fishing periods a fished SE SE SE fished SE SE SE Effort Catch Harvest Day type subtotals
Guided WD 712 177
32 12
25 9
30,928 2,026
1,623 362
1,113 281 2.3% 2.0% 2.2%
Guided WE 96 60
3 2
3 2
6,444 783
197 85
103 46 1.5% 1.3% 2.5%
Unguided WD 390 183
15 9
5 4
13,110 802
418 78
144 59 2.9% 3.4% 3.6%
Unguided WE 150 92 6 5 4 4 8,080 510 260 67 181 57 1.8% 2.2% 2.2% Angler type subtotals
Guided 808 187
35 12
27 9
37,372 2,172
1,820 372
1,216 285 2.1% 1.9% 2.2%
% Guided 59.9%
63.1%
74.0%
63.8%
72.9%
78.9%
Unguided 540 205
20 10
10 6
21,190 951
678 103
325 82 2.5% 2.9% 2.9%
% Unguided 40.1% 36.9% 26.0% 36.2% 27.1% 21.1%
Late-run total 1,348 277 56 16 37 11 58,562 2,371 2,498 386 1,541 297 2.3% 2.2% 2.3% Note: NA means not applicable. a The sport fishery was closed to harvest of Chinook salmon 20–55 inches TL on 16 May–19 June and closed to all Chinook salmon fishing 20–30 June. b “Downstream” is the Kenai River reach from the Warren Ames Bridge to the Chinook salmon sonar site; “upstream” is the Kenai River reach from the Chinook salmon sonar
site to Soldotna Bridge.

58

APPENDIX D: NUMBER OF CHINOOK AND SOCKEYE
SALMON CAUGHT IN INRIVER GILLNETS
59

60
Appendix D1.–Number of Chinook and sockeye salmon caught midriver in 5.0-inch and 7.5-inch mesh gillnets during the early-run Kenai River Chinook salmon sport fishery, 16 May–30 June 2013.
Inriver drift gillnetting catch
5.0-inch mesh
7.5-inch mesh
Combined total a
No. drifts
Time fished (min)
Chinook salmon
Sockeye salmon No.
drifts
Time fished (min)
Chinook salmon
Sockeye salmon Total
Chinook salmon Total
Total
Date No. fish No. fish No. fish No. fish No. fish No. fish No. fish No. fish 16 May 11 129 0
0
0
12 126 0
0
0
0
0
17 May 9 109 0
0
0
10 105 0
0
0
0
0 18 May 10 118 0
0
0
9 88 0
0
0
0
0
19 May 10 98 0
0
0
10 102 0
0
0
0
0 20 May 8 92 0
1
1
8 83 1
0
1
1
2
21 May 10 112 0
2
2
10 106 0
0
0
0
2 22 May 10 111 1
4
5
9 95 0
1
1
1
6
23 May 9 90 1
2
3
10 92 0
1
1
1
4 24 May 10 100 1
4
5
10 92 0
1
1
1
6
25 May 11 101 0
0
0
12 91 0
0
0
0
0 26 May 10 90 0
4
4
9 74 0
1
1
0
5
27 May 9 83 0
9
9
10 88 0
1
2
0
11 28 May 8 72 0
16
17
8 74 0
1
1
0
18
29 May 11 83 0
9
9
12 88 0
5
5
0
14 30 May 10 93 0
16
16
10 89 0
4
4
0
20
31 May 10 86 0
14
14
10 88 1
5
6
1
20 1 Jun 10 92 1
8
9
10 92 0
2
2
1
11
2 Jun 8 73 0
30
30
8 77 0
5
5
0
35 3 Jun 10 86 0
20
20
9 82 0
5
5
0
25
4 Jun 8 59 0
34
34
8 74 1
1
2
1
36 5 Jun 12 102 0
23
23
11 91 0
8
8
0
31
6 Jun 10 81 0
10
10
10 81 2
2
4
2
14 7 Jun 12 93 2
5
7
12 98 2
1
3
4
10
8 Jun 10 72 0 20 20 12 84 6 2 8 6 28 -continued-

61
Appendix D1.–Page 2 of 2.
Inriver drift gillnetting catch
5.0-inch mesh
7.5-inch mesh
Combined total a
No. drifts
Time fished (min)
Chinook salmon
Sockeye salmon No.
drifts
Time fished (min)
Chinook salmon
Sockeye salmon Total
Chinook salmon Total
Total
Date No. fish No. fish No. fish No. fish No. fish No. fish No. fish No. fish 9 Jun 10 71 1
10
11
9 61 2
3
5
3
16
10 Jun 11 80 0
6
6
12 92 0
0
0
0
6 11 Jun 12 80 1
10
11
12 85 1
3
4
2
15
12 Jun 11 63 2
9
11
12 63 1
3
4
3
15 13 Jun 12 65 1
12
13
12 59 1
5
6
2
19
14 Jun 14 73 1
21
22
14 69 1
6
7
2
29 15 Jun 16 86 0
14
14
16 80 1
4
5
1
19
16 Jun 12 80 0
5
5
12 69 1
0
1
1
6 17 Jun 12 82 1
3
4
12 80 1
0
1
2
5
18 Jun 15 80 0
5
5
16 81 1
1
3
1
8 19 Jun 16 92 2
9
11
16 84 0
3
3
2
14
20 Jun 16 75 1
3
4
18 86 0
1
1
1
5 21 Jun 14 81 0
3
3
13 69 3
2
5
3
8
22 Jun 16 81 0
2
2
16 82 0
1
1
0
3 23 Jun 12 72 0
1
1
12 72 1
1
2
1
3
24 Jun 15 81 0
2
2
16 86 0
2
2
0
4 25 Jun 18 96 0
1
1
17 95 1
1
2
1
3
26 Jun 12 68 0
5
5
12 70 2
3
5
2
10 27 Jun 16 92 1
3
4
15 88 0
0
0
1
4
28 Jun 10 63 0
15
15
10 60 3
25
28
3
43 29 Jun 10 58 2
23
25
9 53 3
13
16
5
41
30 Jun 11 68 0 34 34 12 70 0 7 7 0 41 Total 527 3,908 19 427 447 532 3,811 36 130 168 55 615 Min 8 58 0
0
0
8 53 0
0
0
0
0
Mean 11 85 0
9
10
12 83 1
3
4
1
13 Max 18 129 2 34 34 18 126 6 25 28 6 43 a Combined total is number of Chinook salmon and total number of fish caught in 5.0-inch and 7.5-inch mesh gillnets.

62
Appendix D2.–Catch and CPUE of Chinook and sockeye salmon and proportion of Chinook salmon caught midriver in 5.0-inch and 7.5-inch mesh gillnets for replicates with at least 1 drift from each mesh size during the early-run Kenai River Chinook salmon sport fishery, 16 May–30 June 2013.
Date
Inriver drift gillnetting catch
Reps a No.
drifts
Time fished (min)
Chinook salmon
Sockeye salmon
Total
Chinook salmon No. fish CPUE b SE
No. fish CPUE b SE
No. fish CPUE b Prop.c SE
16 May 6 23 255 0 0.000 0.000
0 0.000 0.000
0 0.000 17 May 5 19 214 0 0.000 0.000
0 0.000 0.000
0 0.000
18 May 5 19 206 0 0.000 0.000
0 0.000 0.000
0 0.000 19 May 5 20 200 0 0.000 0.000
0 0.000 0.000
0 0.000
20 May 4 16 175 1 0.006 0.006
1 0.007 0.007
2 0.011
0.47 0.41 21 May 5 20 218 0 0.000 0.000
2 0.011 0.011
2 0.009
0.00 0.00
22 May 5 19 206 1 0.004 0.004
5 0.023 0.008
6 0.029
0.16 0.14 23 May 5 19 182 1 0.005 0.005
3 0.026 0.014
4 0.022
0.17 0.19
24 May 5 20 192 1 0.004 0.004
5 0.027 0.009
6 0.031
0.13 0.13 25 May 6 23 192 0 0.000 0.000
0 0.000 0.000
0 0.000
26 May 5 19 163 0 0.000 0.000
5 0.030 0.019
5 0.031
0.00 0.00 27 May 5 19 171 0 0.000 0.000
10 0.054 0.037
10 0.059
0.00 0.00
28 May 4 16 145 0 0.000 0.000
17 0.116 0.019
17 0.117
0.00 0.00 29 May 6 23 171 0 0.000 0.000
14 0.071 0.019
14 0.082
0.00 0.00
30 May 5 20 182 0 0.000 0.000
20 0.108 0.039
20 0.110
0.00 0.00 31 May 5 20 174 1 0.006 0.006
19 0.112 0.035
20 0.115
0.05 0.05
1 Jun 5 20 184 1 0.006 0.006
10 0.057 0.040
11 0.060
0.09 0.04 2 Jun 4 16 150 0 0.000 0.000
35 0.238 0.082
35 0.234
0.00 0.00
3 Jun 5 19 168 0 0.000 0.000
25 0.204 0.080
25 0.149
0.00 0.00 4 Jun 4 16 133 1 0.006 0.006
35 0.285 0.045
36 0.271
0.02 0.02
5 Jun 6 23 192 0 0.000 0.000
31 0.155 0.035
31 0.161
0.00 0.00 6 Jun 5 20 162 2 0.013 0.008
12 0.076 0.028
14 0.086
0.15 0.05
7 Jun 6 24 191 4 0.021 0.011
6 0.032 0.015
10 0.052
0.39 0.18 8 Jun 5 20 145 6 0.041 0.020
21 0.146 0.048
27 0.187
0.22 0.06
9 Jun 5 19 132 3 0.022 0.009
13 0.098 0.027
16 0.121
0.18 0.07 10 Jun 6 23 172 0 0.000 0.000
6 0.034 0.017
6 0.035
0.00 0.00
-continued-

63
Appendix D2.–Page 2 of 2.
Date
Inriver drift gillnetting catch
Reps a No.
drifts
Time fished (min)
Chinook salmon
Sockeye salmon Total
Chinook salmon No. fish CPUE b SE
No. fish CPUE b SE
No. fish CPUE b Prop.c SE
11 Jun 6 24 166 2 0.011 0.007
13 0.080 0.025
15 0.090
0.12 0.09 12 Jun 6 23 125 3 0.023 0.011
12 0.090 0.029
15 0.120
0.20 0.07
13 Jun 6 24 124 2 0.016 0.016
17 0.137 0.050
19 0.153
0.11 0.11 14 Jun 7 28 142 2 0.014 0.009
27 0.187 0.034
29 0.205
0.07 0.04
15 Jun 8 32 166 1 0.006 0.006
18 0.106 0.023
19 0.114
0.06 0.04 16 Jun 6 24 149 1 0.007 0.007
5 0.029 0.014
6 0.040
0.20 0.20
17 Jun 6 24 162 2 0.013 0.008
3 0.018 0.008
5 0.031
0.42 0.19 18 Jun 8 31 161 1 0.006 0.006
6 0.035 0.011
7 0.044
0.13 0.12
19 Jun 8 32 176 2 0.012 0.008
12 0.071 0.021
14 0.080
0.14 0.07 20 Jun 8 32 157 1 0.006 0.006
3 0.017 0.008
4 0.026
0.27 0.24
21 Jun 7 27 150 3 0.021 0.010
5 0.030 0.012
8 0.053
0.42 0.14 22 Jun 8 32 163 0 0.000 0.000
3 0.017 0.012
3 0.018
0.00 0.00
23 Jun 6 24 145 1 0.007 0.007
2 0.013 0.008
3 0.021
0.35 0.31 24 Jun 8 31 167 0 0.000 0.000
4 0.023 0.018
4 0.024
0.00 0.00
25 Jun 9 35 191 1 0.005 0.005
2 0.009 0.006
3 0.016
0.34 0.17 26 Jun 6 24 138 2 0.015 0.009
8 0.055 0.013
10 0.073
0.21 0.10
27 Jun 8 31 180 1 0.004 0.004
3 0.016 0.008
4 0.022
0.20 0.20 28 Jun 5 20 123 3 0.026 0.011
40 0.305 0.135
43 0.349
0.08 0.03
29 Jun 5 19 111 5 0.043 0.021
36 0.319 0.091
41 0.369
0.12 0.06 30 Jun 6 23 138 0 0.000 0.000
41 0.324 0.078 41 0.297 0.00 0.00
Total 269 1,055 7,704 55 0.369 555 3.790
610 0.0792
NA NA Min 4 16 111 0 0.000
0 0.000
0 0.000
0.00
Mean 6 23 167 1 0.008
12 0.082
13 0.0792
0.13 Max 9 35 255 6 0.043 41 0.324 43 0.1687 0.47
Note: NA means not applicable. a A complete replicate (rep) consists of 4 drifts (2 mesh sizes, 2 banks). Only reps that had at least 1 drift from each mesh size were used in this table. b CPUE is catch per minute. c Proportion of combined total catch equals Chinook salmon CPUE divided by the combined total of all species CPUE.
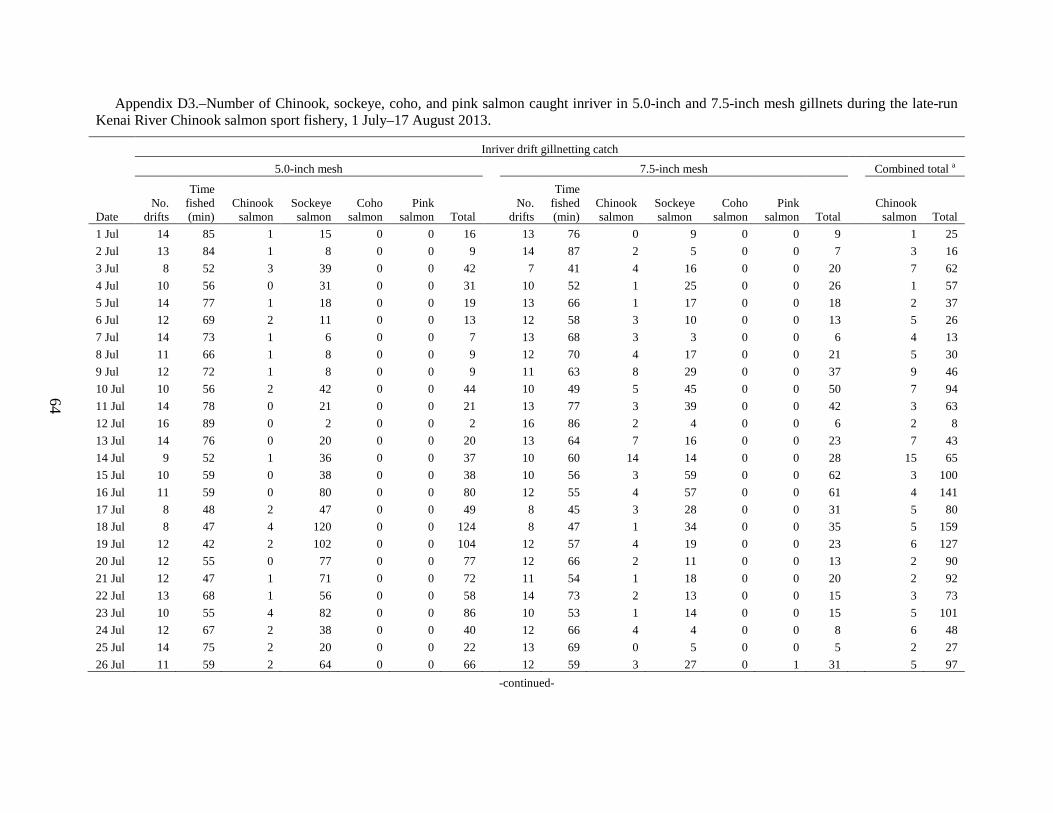
64
Appendix D3.–Number of Chinook, sockeye, coho, and pink salmon caught inriver in 5.0-inch and 7.5-inch mesh gillnets during the late-run Kenai River Chinook salmon sport fishery, 1 July–17 August 2013.
Date
Inriver drift gillnetting catch 5.0-inch mesh
7.5-inch mesh
Combined total a
Time
fished (min)
Chinook salmon
Sockeye salmon
Coho salmon
Pink salmon Total
No. drifts
Time fished (min)
Chinook salmon
Sockeye salmon
Coho salmon
Pink salmon Total
Chinook salmon Total
No. drifts
1 Jul 14 85 1 15 0 0 16
13 76 0 9 0 0 9
1 25 2 Jul 13 84 1 8 0 0 9
14 87 2 5 0 0 7
3 16
3 Jul 8 52 3 39 0 0 42
7 41 4 16 0 0 20
7 62 4 Jul 10 56 0 31 0 0 31
10 52 1 25 0 0 26
1 57
5 Jul 14 77 1 18 0 0 19
13 66 1 17 0 0 18
2 37 6 Jul 12 69 2 11 0 0 13
12 58 3 10 0 0 13
5 26
7 Jul 14 73 1 6 0 0 7
13 68 3 3 0 0 6
4 13 8 Jul 11 66 1 8 0 0 9
12 70 4 17 0 0 21
5 30
9 Jul 12 72 1 8 0 0 9
11 63 8 29 0 0 37
9 46 10 Jul 10 56 2 42 0 0 44
10 49 5 45 0 0 50
7 94
11 Jul 14 78 0 21 0 0 21
13 77 3 39 0 0 42
3 63 12 Jul 16 89 0 2 0 0 2
16 86 2 4 0 0 6
2 8
13 Jul 14 76 0 20 0 0 20
13 64 7 16 0 0 23
7 43 14 Jul 9 52 1 36 0 0 37
10 60 14 14 0 0 28
15 65
15 Jul 10 59 0 38 0 0 38
10 56 3 59 0 0 62
3 100 16 Jul 11 59 0 80 0 0 80
12 55 4 57 0 0 61
4 141
17 Jul 8 48 2 47 0 0 49
8 45 3 28 0 0 31
5 80 18 Jul 8 47 4 120 0 0 124
8 47 1 34 0 0 35
5 159
19 Jul 12 42 2 102 0 0 104
12 57 4 19 0 0 23
6 127 20 Jul 12 55 0 77 0 0 77
12 66 2 11 0 0 13
2 90
21 Jul 12 47 1 71 0 0 72
11 54 1 18 0 0 20
2 92 22 Jul 13 68 1 56 0 0 58
14 73 2 13 0 0 15
3 73
23 Jul 10 55 4 82 0 0 86
10 53 1 14 0 0 15
5 101 24 Jul 12 67 2 38 0 0 40
12 66 4 4 0 0 8
6 48
25 Jul 14 75 2 20 0 0 22
13 69 0 5 0 0 5
2 27 26 Jul 11 59 2 64 0 0 66 12 59 3 27 0 1 31 5 97
-continued-

65
Appendix D3.–Page 2 of 2.
Date
Inriver drift gillnetting catch 5.0-inch mesh
7.5-inch mesh
Combined total a
Time
fished (min)
Chinook salmon
Sockeye salmon
Coho salmon
Pink salmon Total
No. drifts
Time fished (min)
Chinook salmon
Sockeye salmon
Coho salmon
Pink salmon Total
Chinook salmon Total
No. drifts
27 Jul 14 79 1 52 0 0 53
13 70 2 24 0 3 29
3 82 28 Jul 11 65 3 30 0 0 34
12 64 6 6 0 0 12
9 46
29 Jul 12 73 2 40 1 0 43
11 53 5 14 1 0 20
7 63 30 Jul 13 80 0 22 0 0 22
14 81 8 5 1 0 14
8 36
31 Jul 10 67 2 21 2 0 25
10 60 4 10 4 0 18
6 43 1 Aug 11 58 4 22 16 0 43
12 59 4 8 1 0 13
8 56
2 Aug 10 63 2 22 5 0 29
10 70 1 4 2 0 7
3 36 3 Aug 10 73 1 26 4 0 31
10 74 1 7 1 0 10
2 41
4 Aug 10 65 4 17 7 0 28
10 59 0 5 6 0 11
4 39 5 Aug 10 70 1 14 8 0 23
10 67 0 6 4 0 10
1 33
6 Aug 12 69 2 4 7 0 13
11 64 3 6 10 0 19
5 32 7 Aug 10 62 2 11 18 1 32
10 76 3 2 8 0 13
5 45
8 Aug 10 61 0 10 11 0 21
10 59 2 2 6 0 10
2 31 9 Aug 13 62 1 6 8 0 16
14 73 4 2 8 0 14
5 30
10 Aug 14 75 0 13 44 0 57
13 67 1 2 24 0 27
1 84 11 Aug 9 54 1 3 12 0 16
10 59 1 6 11 0 18
2 34
12 Aug 10 66 2 5 10 0 17
9 58 0 4 6 0 10
2 27 13 Aug 13 80 0 2 19 0 21
14 84 0 2 5 0 7
0 28
14 Aug 12 68 3 7 27 0 37
11 60 4 1 7 0 12
7 49 15 Aug 12 74 0 3 44 0 47
12 79 1 4 6 0 11
1 58
16 Aug 14 82 0 9 25 0 34
13 74 0 3 10 0 13
0 47 17 Aug 11 66 0 4 5 0 9 12 83 0 2 9 0 11 0 20
Total 555 3,176 65 1,403 273 1 1,746 552 3,113 135 663 130 4 934 200 2,680 Min 8 42 0 2 0 0 2
7 41 0 1 0 0 5
0 8
Mean 12 66 1 29 6 0 36
12 65 3 14 3 0 19
4 56 Max 16 89 4 120 44 1 124 16 87 14 59 24 3 62 15 159
a Combined total is the number of Chinook salmon and the total number of fish caught in 5.0- and 7.5-inch mesh gillnets.

66
Appendix D4.–Catch and CPUE of Chinook, sockeye, coho, and pink salmon and proportion of Chinook salmon caught midriver in 5.0-inch and 7.5-inch mesh gillnets for replicates with at least 1 drift from each mesh size during the late-run Kenai River Chinook salmon sport fishery, 1 July–17 August 2013.
Inriver drift gillnetting catch
Repsa
No. drifts
Time fished (min)
Chinook salmon Sockeye salmon Coho salmon Pink salmon Total Chinook salmon
No. CPUEb SE No. CPUEb SE No. CPUEb SE No. CPUEb SE No. CPUEb Date Prop.c SE 1 Jul 7 27 162 1 0.005 0.005 24 0.137 0.031 0 0.000 0.000 0 0.000 0.000 25 0.155 0.04 0.03 2 Jul 7 27 171 3 0.017 0.008 13 0.079 0.046 0 0.000 0.000 0 0.000 0.000 16 0.094 0.18 0.14 3 Jul 4 15 94 7 0.090 0.030 55 0.550 0.103 0 0.000 0.000 0 0.000 0.000 62 0.662 0.14 0.06 4 Jul 5 20 108 1 0.011 0.011 56 0.513 0.014 0 0.000 0.000 0 0.000 0.000 57 0.528 0.02 0.02 5 Jul 7 27 143 2 0.014 0.009 35 0.235 0.050 0 0.000 0.000 0 0.000 0.000 37 0.259 0.06 0.04 6 Jul 6 24 127 5 0.065 0.038 21 0.166 0.056 0 0.000 0.000 0 0.000 0.000 26 0.205 0.28 0.14 7 Jul 7 27 141 4 0.031 0.011 9 0.060 0.022 0 0.000 0.000 0 0.000 0.000 13 0.092 0.34 0.08 8 Jul 6 23 136 5 0.034 0.017 25 0.176 0.049 0 0.000 0.000 0 0.000 0.000 30 0.221 0.16 0.07 9 Jul 6 23 135 9 0.072 0.022 37 0.260 0.090 0 0.000 0.000 0 0.000 0.000 46 0.341 0.22 0.09 10 Jul 5 20 105 7 0.070 0.031 87 0.836 0.201 0 0.000 0.000 0 0.000 0.000 94 0.896 0.08 0.02 11 Jul 7 27 155 3 0.018 0.013 60 0.362 0.075 0 0.000 0.000 0 0.000 0.000 63 0.407 0.05 0.03 12 Jul 8 32 176 2 0.013 0.009 6 0.033 0.014 0 0.000 0.000 0 0.000 0.000 8 0.046 0.29 0.20 13 Jul 7 27 140 7 0.052 0.024 36 0.266 0.031 0 0.000 0.000 0 0.000 0.000 43 0.307 0.16 0.07 14 Jul 5 19 112 15 0.142 0.060 50 0.404 0.113 0 0.000 0.000 0 0.000 0.000 65 0.579 0.26 0.09 15 Jul 5 20 115 3 0.027 0.011 97 0.866 0.246 0 0.000 0.000 0 0.000 0.000 100 0.871 0.03 0.02 16 Jul 6 23 114 4 0.061 0.042 137 1.107 0.271 0 0.000 0.000 0 0.000 0.000 141 1.236 0.05 0.04 17 Jul 4 16 94 5 0.055 0.028 75 0.807 0.110 0 0.000 0.000 0 0.000 0.000 80 0.855 0.06 0.03 18 Jul 4 16 94 5 0.058 0.023 154 1.622 0.468 0 0.000 0.000 0 0.000 0.000 159 1.696 0.03 0.01 19 Jul 6 24 99 6 0.084 0.034 121 1.843 0.551 0 0.000 0.000 0 0.000 0.000 127 1.285 0.04 0.02 20 Jul 6 24 121 2 0.016 0.010 88 0.866 0.190 0 0.000 0.000 0 0.000 0.000 90 0.743 0.02 0.01 21 Jul 6 23 100 2 0.026 0.017 89 0.947 0.143 0 0.000 0.000 0 0.000 0.000 91 0.908 0.03 0.02 22 Jul 7 27 141 3 0.019 0.009 69 0.461 0.090 0 0.000 0.000 0 0.000 0.000 72 0.510 0.04 0.02 23 Jul 5 20 108 5 0.043 0.019 96 0.929 0.224 0 0.000 0.000 0 0.000 0.000 101 0.935 0.04 0.02 24 Jul 6 24 133 6 0.043 0.016 42 0.321 0.067 0 0.000 0.000 0 0.000 0.000 48 0.360 0.12 0.04 25 Jul 7 27 145 2 0.013 0.008 25 0.164 0.053 0 0.000 0.000 0 0.000 0.000 27 0.187 0.07 0.05
-continued-

67
Appendix D4.–Page 2 of 2.
Date
Inriver drift gillnetting catch
Repsa No.
drifts
Time fished (min)
Chinook salmon Sockeye salmon Coho salmon Pink salmon Total Chinook
No. CPUEb SE No. CPUEb SE No. CPUEb SE No. CPUEb SE No. CPUEb Prop.c SE 26 Jul 6 23 117 5 0.053 0.024 91 0.699 0.223 0 0.000 0.000 1 0.009 0.009 97 0.828 0.07 0.04 27 Jul 7 27 149 3 0.019 0.009 76 0.483 0.119 0 0.000 0.000 3 0.020 0.020 82 0.550 0.04 0.02 28 Jul 6 23 129 9 0.071 0.021 36 0.267 0.085 0 0.000 0.000 0 0.000 0.000 45 0.349 0.20 0.03 29 Jul 6 23 126 7 0.081 0.026 54 0.400 0.117 2 0.017 0.012 0 0.000 0.000 63 0.498 0.16 0.07 30 Jul 7 27 161 8 0.053 0.018 27 0.153 0.060 1 0.005 0.005 0 0.000 0.000 36 0.224 0.25 0.10 31 Jul 5 20 127 6 0.048 0.022 31 0.241 0.097 6 0.049 0.016 0 0.000 0.000 43 0.339 0.14 0.05 1 Aug 6 23 118 8 0.070 0.026 30 0.226 0.082 17 0.155 0.036 0 0.000 0.000 55 0.468 0.15 0.07 2 Aug 5 20 133 3 0.026 0.017 26 0.219 0.047 7 0.059 0.017 0 0.000 0.000 36 0.271 0.09 0.04 3 Aug 5 20 147 2 0.015 0.009 33 0.223 0.070 5 0.034 0.016 0 0.000 0.000 40 0.272 0.05 0.04 4 Aug 5 20 124 4 0.032 0.015 22 0.174 0.059 13 0.106 0.028 0 0.000 0.000 39 0.315 0.10 0.04 5 Aug 5 20 138 1 0.008 0.008 20 0.144 0.062 12 0.083 0.024 0 0.000 0.000 33 0.240 0.03 0.04 6 Aug 6 23 133 5 0.030 0.022 10 0.068 0.024 17 0.121 0.057 0 0.000 0.000 32 0.242 0.14 0.09 7 Aug 5 20 137 5 0.034 0.016 13 0.099 0.028 26 0.201 0.041 1 0.009 0.009 45 0.328 0.10 0.03 8 Aug 5 20 120 2 0.015 0.010 12 0.097 0.041 17 0.136 0.060 0 0.000 0.000 31 0.259 0.06 0.04 9 Aug 7 27 134 5 0.039 0.020 8 0.058 0.027 16 0.107 0.031 0 0.000 0.000 29 0.216 0.18 0.05 10 Aug 7 27 142 1 0.008 0.008 15 0.104 0.029 68 0.481 0.120 0 0.000 0.000 84 0.591 0.01 0.01 11 Aug 5 19 113 2 0.018 0.011 9 0.078 0.047 23 0.196 0.069 0 0.000 0.000 34 0.300 0.06 0.05 12 Aug 5 19 123 2 0.014 0.009 9 0.071 0.013 16 0.125 0.043 0 0.000 0.000 27 0.219 0.07 0.05 13 Aug 7 27 164 0 0.000 0.000 4 0.023 0.012 24 0.140 0.036 0 0.000 0.000 28 0.170 0.00 0.00 14 Aug 6 23 128 7 0.053 0.023 8 0.059 0.015 34 0.263 0.045 0 0.000 0.000 49 0.382 0.14 0.07 15 Aug 6 24 153 1 0.006 0.006 7 0.051 0.021 50 0.392 0.201 0 0.000 0.000 58 0.380 0.01 0.02 16 Aug 7 27 156 0 0.000 0.000 12 0.078 0.020 35 0.230 0.079 0 0.000 0.000 47 0.302 0.00 0.00 17 Aug 6 23 150 0 0.000 0.000 6 0.056 0.025 14 0.143 0.043 0 0.000 0.000 20 0.133 0.00 0.00 Total 284 1,107 6,289 200 1.773
2,066 18.081
403 3.043
5 0.038
2,674 0.425 NA NA
Min 4 15 94 0 0.000
4 0.023
0 0.000
0 0.000
8 0.086 0.00
Mean 6 23 131 4 0.037
43 0.377
8 0.063
0 0.001
56 0.425 0.10
Max 8 32 176 15 0.142 154 1.843 68 0.481 3 0.020 159 0.905 0.34
Note: NA means not applicable. a A complete replicate (rep) consists of 4 drifts (2 mesh sizes, 2 banks). Only reps that had at least 1 drift from each mesh size were used in this table. b CPUE is catch per minute. c Proportion of combined total catch equals Chinook salmon CPUE divided by the combined total of all species CPUE.

68
Appendix D5.–Catch and CPUE of Chinook, sockeye, coho, and pink salmon caught nearshore in 5.0-inch and 7.5-inch mesh gillnets during the early-run Kenai River Chinook salmon sport fisheries, 20 May–28 June 2013.
Early Run
Time fished (min)
Chinook salmon
Sockeye salmon
Coho salmon
Pink salmon Total
No.
drifts No. fish CPUE
No. fish CPUE
No. fish CPUE
No. fish CPUE
No. fish CPUE Date
20 May 8 245
0 0.000
0 0.000
0 0.000
0 0.000
0 0.000 22 May 8 143
0 0.000
0 0.000
0 0.000
0 0.000
0 0.000
27 May 14 125
0 0.000
6 0.056
0 0.000
0 0.000
6 0.048 31 May 18 258
0 0.000
4 0.014
0 0.000
0 0.000
4 0.016
3 Jun 17 102
2 0.020
51 0.503
0 0.000
0 0.000
53 0.520 6 Jun 20 116
3 0.025
55 0.498
0 0.000
0 0.000
58 0.500
10 Jun 12 61
2 0.033
36 0.642
0 0.000
0 0.000
38 0.623 13 Jun 21 93
4 0.061
29 0.265
0 0.000
0 0.000
33 0.355
17 Jun 26 261
1 0.008
16 0.121
0 0.000
0 0.000
17 0.065 19 Jun 26 115
5 0.044
9 0.079
0 0.000
0 0.000
14 0.122
25 Jun 29 154
0 0.000
13 0.083
0 0.000
0 0.000
13 0.084 28 Jun 27 150 1 0.007 31 0.207 0 0.000 0 0.000 32 0.213 Total 226 1823
18 0.198
250 2.468
0 0.00
0 0.00
268 2.546
Min 8 61
0 0.000
0 0.000
0 0.00
0 0.00
0 0 Mean 19 152
2 0.017
21 0.206
0 0.00
0 0.00
22.3 0.212
Max 29 261 5 0.061 55 0.642 0 0.00 0 0.00 58 0.623 Note: CPUE is catch per minute.

69
Appendix D6.–Catch and CPUE of Chinook, sockeye, coho, and pink salmon caught nearshore in 5.0-inch and 7.5-inch mesh gillnets during the late-run Kenai River Chinook salmon sport fisheries, 1 July–16 August 2013.
Late Run
No. drifts
Time fished (min)
Chinook salmon
Sockeye salmon
Coho salmon
Pink salmon
Total
No. fish CPUE No. fish CPUE
No. fish CPUE
No. fish CPUE No. fish CPUE Date
1 Jul 32 112
0 0.000
10 0.089
0 0.000
0 0.000
10 0.089 5 Jul 30 123
1 0.008
22 0.171
0 0.000
1 0.008
24 0.195
9 Jul 21 108
2 0.019
59 0.576
0 0.000
0 0.000
61 0.565 11 Jul 32 125
2 0.016
14 0.112
0 0.000
0 0.000
16 0.128
15 Jul 19 50
5 0.099
300 6.572
0 0.000
1 0.024
306 6.120 18 Jul 20 75
0 0.000
354 4.614
0 0.000
0 0.000
354 4.720
24 Jul 24 128
1 0.007
17 0.140
0 0.000
0 0.000
18 0.141 25 Jul 20 132
3 0.023
43 0.303
1 0.007
0 0.000
47 0.356
29 Jul 24 87
1 0.012
151 1.720
0 0.000
2 0.023
154 1.770 1 Aug 26 112
0 0.000
191 1.694
4 0.035
0 0.000
195 1.741
5 Aug 24 145
0 0.000
44 0.260
6 0.036
0 0.000
50 0.345 7 Aug 25 164
0 0.000
15 0.084
12 0.068
0 0.000
27 0.165
14 Aug 24 119
1 0.009
25 0.216
51 0.439
0 0.000
77 0.647 16 Aug 24 121 3 0.025 16 0.133 29 0.241 0 0.000 48 0.397 Total 345 1,601
19 0.218
1,261 16.684
103 0.826
4 0.055
1,387 17.378
Min 19 50
0 0.000
10 0.084
0 0.000
0 0.000
10 0.089 Mean 25 114
1 0.016
90 1.192
7 0.059
0 0.004
99 1.241
Max 32 164 5 0.099 354 6.572 51 0.439 2 0.024 354 6.120 Note: CPUE is catch per minute.