china’s wind electricity and cost of carbon mitigation are ... energy carbon... · capacity come...
TRANSCRIPT

This content has been downloaded from IOPscience. Please scroll down to see the full text.
Download details:
IP Address: 182.73.193.34
This content was downloaded on 23/08/2016 at 10:46
Please note that terms and conditions apply.
You may also be interested in:
Balancing Green Power: System integration
D Elliott
Balancing Green Power: The story so far: balancing with generation plants
D Elliott
Electricity reform and sustainable development in China
James H Williams and Fredrich Kahrl
North-East Asian Super Grid: Renewable energy mix and economics
Christian Breyer, Dmitrii Bogdanov, Keiichi Komoto et al.
The system-wide economics of a carbon dioxide capture, utilization, and storage network: Texas Gulf
Coast with pure CO2-EOR flood
Carey W King, Gürcan Gülen, Stuart M Cohen et al.
Consumer cost effectiveness of CO2 mitigation policies in restructured electricity markets
Jared Moore and Jay Apt
The contribution of Paris to limit global warming to 2 °C
Gokul C Iyer, James A Edmonds, Allen A Fawcett et al.
China’s wind electricity and cost of carbon mitigation are more expensive than anticipated
View the table of contents for this issue, or go to the journal homepage for more
2016 Environ. Res. Lett. 11 084015
(http://iopscience.iop.org/1748-9326/11/8/084015)
Home Search Collections Journals About Contact us My IOPscience

Environ. Res. Lett. 11 (2016) 084015 doi:10.1088/1748-9326/11/8/084015
LETTER
China’s wind electricity and cost of carbonmitigation aremoreexpensive than anticipated
LongTLam1,4, Lee Branstetter2 and InêsMLAzevedo3
1 Department of Engineering and Public Policy, CarnegieMellonUniversity andCatólica Lisbon School of Business and Economics, USA2 HeinzCollege andDepartment of Social andDecision Sciences, CarnegieMellonUniversity, Peterson Institute for International
Economics, andNBER,USA3 Department of Engineering and Public Policy, CarnegieMellonUniversity, 5000 Forbes Avenue, Pittsburgh PA15213,USA4 Author towhomany correspondence should be addressed.
E-mail: [email protected], [email protected] and [email protected]
Keywords: levelized cost of electricity, cost of carbonmitigation, China, renewable energy, wind electricity
Supplementarymaterial for this article is available online
AbstractThe success of China’s transition to a low-carbon energy systemwill be key to achieve the global levelof emissions reductions needed to avoid large negative consequences from climate change. China isundergoing an impressive build up of renewable capacity, in particular wind. Using data from theCleanMechanismDevelopment project database between 2004 and 2012, this study shows that whileChinamade progress in bringing down the levelized cost of wind electricity and cost of carbonmitigation (CCM), serious grid-connection issues and highwind curtailment rates resulted in alevelized cost of wind electricity that is one-half to two times higher than expected, and aCCM that isfour to six times higher. Sharp drop in electricity demand, utilization rate, and coal prices in recentyearsmay lead to even higher results.
1. Background: renewable energyintegration inChina
In 2014 China’s wind energy installed capacity out-stripped that of the US by some 75%. However,China’s wind turbines generated only 156 TWh ofelectricity in the same year, compared to 180 TWh inthe US (see figure 1). This gap between the totalinstalled capacity and electricity generation has nar-rowed in recent years but remains substantial. In fact,if China were to connect its entire wind turbine fleet tothe grid and put them to full use at a 22% capacityfactor, it would generate almost 40% more electricityfrom wind, or 217 TWh, an equivalent to installing anadditional 32 GWof capacity.
To address some of the country’s serious environ-mental problems, China is undergoing amassive buildup of renewable capacity, in particular wind. Further-more, global progress in reducing emissions to avoidlarge negative consequences from climate change hin-ges on China’s ability to transition to a low-carbonenergy system. However, efforts to integrate the
country’s wind power base into its electrical grid andto reduce curtailment have had limited success to date.
Recently, a number of studies have tried todescribe a number of barriers that restrict the full utili-zation of China’s installed capacity. Much of the exist-ing research highlights the inadequacy of the country’selectricity grid system, specifically its inability to trans-mit electricity produced by renewable sources gener-ated in remote wind- and solar-rich regions to energyload centers (Wang et al 2010, Li et al 2012, 2014, Peiet al 2015, Zhao et al 2016). The absence of inter-provincial power markets owing to the ambiguousauthority of various stakeholders over transmission(Davidson 2013), different levels of feed-in-tariffs(Zhao et al 2012, Pei et al 2015), the lack of a mature,and standardized exchange platform and grid compa-nies’ conflicts of interest (Kahrl and Wang 2014) fur-ther aggravate grid integration problems5.
Nevertheless, little has been reported on how thepervasive lack of grid connection and widespread
OPEN ACCESS
RECEIVED
19April 2016
REVISED
3August 2016
ACCEPTED FOR PUBLICATION
3August 2016
PUBLISHED
18August 2016
Original content from thisworkmay be used underthe terms of the CreativeCommonsAttribution 3.0licence.
Any further distribution ofthis workmustmaintainattribution to theauthor(s) and the title ofthework, journal citationandDOI.
5Please see IEA (2016), Lewis (2013), and Gallagher (2014) for a
review of relevant renewable energy policies.
© 2016 IOPPublishing Ltd

curtailment affect the industry’s levelized cost of elec-tricity (LCOE) and the cost of carbon mitigation(CCM). Using Clean Mechanism Development datafrom 2004 to 2012 and industry statistics, this studyprovides an analysis on these measures when account-ing for both the capacity that has not been connectedand the curtailments due to poor transmission.
2.Data andmethods
2.1.DataWe rely primarily on data from Clean DevelopmentMechanism (CDM) project database. Establishedunder the Kyoto Protocol, CDM aims to stimulatesustainable development and greenhouse gas emis-sions (GHGs) reductions in developing countries.Through the program’s framework, developing coun-tries can earn certified emission reduction credits(CERs) by building projects that would reduce GHGs.Industrialized countries in turn can purchase thesecredits in order to meet their emission reductiontargets.
The process and rules for a project to becomeCDM-registered and certified are standardized by theSecretariat of theUnitedNations Framework Conven-tion on Climate Change (UNFCCC)6, who collectsand publishes relevant data on all low-carbon energyprojects that receive financial support through CDM.Two organizations organize and compile these data(IGES 2015,UNEPRisoeCenter 2015).
The CDM dataset has been used to examine thelearning rate in China’s wind energy industry (Yao
et al 2015), the network effects of technological learn-ing (Tang and Popp 2014), the effect of CDM on Chi-na’s industry development (Stua 2013), and theefficacy of CDM’s additionality requirement (He andMorse 2013, Chan 2015), among other effects. Ourversion of the CDM project database contains data formost of China’s onshore wind farm projects between2004 and 2012. This dataset includes the project’sname and location, turbine manufacturer and type,total investment, total installed capacity, startingdate7, estimated utilization hours, estimated yearlyand lifetime generation, estimated emission factors,etc. Tables S1 and S2 in the supplemental information(SI) report summary statistics for the major variablesof interest.
Because cost data are not publically available, weuse price data as a proxy for cost data.While data qual-ity is not of concern because the process and rules for aproject to become CDM-registered and certified arelengthy and highly standardized8, there may existsome doubts as to what extent the investment datareflect the true costs of the projects. In an extremelycompetitive wind turbine market like China, we mayexpect the turbine’s price to be close to its cost. How-ever, it is plausible that because State-Owned Enter-prises (SOEs) dominate the wind turbine industry andare wiling to sell products below cost to gain marketshare or to comply with government installation tar-gets, the product price may be distorted. We will
Figure 1. (a)Wind cumulative capacity installed (MW) over time inChina and in theUSA (2005–2014). (b)Annual electricitygeneration (TWh) fromwind (TWh) over time inChina and in theUSA (2005–2014). The cumulative installedwind capacity inChinasurpassed that of theUSA in 2009–2010.However, the annual electricity generation in theUSA is still larger than inChina. Plotproduced by the authors using data fromAmericanWind EnergyAssociation (2015), CWEAChinaWind Energy Association (2015),andCECChina Electricity Council (2015).
6For more information see https://cdm.unfccc.int/Projects/
diagram.html
7Starting date refers to when a ‘real’ project activity takes place,
typically referring to the signing date of equipment purchasecontract or the construction date. The registration process for CDMusually completes some time later.8The CDM project database’s investment data tracks closely with a
similar databasemaintained by theNDRC. See SI formore details.
2
Environ. Res. Lett. 11 (2016) 084015

explore this possibility further in our sensitivityanalyses.
Our 2004–2014 province-level data on installedcapacity come from the China Energy Databook pub-lished by the LBNL Lawrence Berkeley NationalLaboratory (2014) and from the annual industry datapublished byCWEAChina’sWind Energy Association(2015). We refer to China’s Electricity Council (CEC)and National Energy Administration (NEA) fornational-level electricity data, including generationand consumption amount, and utilization hours(CEC China Electricity Council 2015). The NEA andChinese Renewable Energy Industries Association(CREIA) also keep track of grid-connected capacity,allowing us to compute unconnected capacity.
2.2.MethodsWe use the CDM project database and the industry’sannual statistics published by various organizations toestimate the Chinese wind turbine’s capacity factor(both projected and actual), the LCOE, and theCCM.
2.2.1. Connected, unconnected capacity, and curtailmentWe start by showing the amount of installed windcapacity, and whether it has been connected or not. Todo so, we use province-level installed capacity datafrom LBNL’s China Energy Databook and CWEA’smonthly magazines and the grid-connected capacityfrom the NEA and CREIA. We also report province-level curtailment data from the NEA and CREIA from2011 to 2015. Note that the national curtailment ratereported in this study is computed using the nationalcurtailed wind electricity total. It is not the average ofthe provincial curtailment rates as sometimes publiclyreported.
2.2.2. Capacity factorsWe estimate the capacity factor (CFt) from wind,which is defined as the ratio of actual electricitygeneration to the maximum possible generationassuming continuous full power operation during thesame period, or:
=⋅
( )C
CFGE
8760, 1t
t
t
where t indexes the year; GE is the amount ofelectricity generated and delivered to the grid, C theinstalled capacity, 8760 the number of hours in a year.In practice, the capacity factor depends on a numberof factors, including wind resources, grid capacity andavailability, generation costs and electricity prices, andequipment.
We first show the ex-ante capacity factor usingCDM data. Each Project Design Document reportsestimates for the project’s anticipated capacity factorsas determined by an independent third-party consult-ing agency using the local region’s historical meteor-ological conditions in the past 30 years, onsiteanemometric data of the previous year, and other data
relevant the aforementioned factors. These estimatesassume that all the electricity generated would be used,i.e., there is no curtailment or issues with connectingthe wind farms to the grid. Therefore, this estimateprovides an upper bound on the potential wind capa-city factor. To ensure the estimations’ precision, theagency also crosschecks with power plants of similarprofiles within the region. The yearly capacity factor isaveraged over all CDM-registered projects in that year.
Next, we use CEC annual statistics on utilizationhours to compute the ex-post utilization factor. Utili-zation factor is the ratio of the number of hours duringwhich the turbines are spinning in a year to the totalnumber of hours in the year. The utilization factordoes notmeasure actual electricity supplied to the grid.Utilization hour numbers are widely reported in offi-cial documents, but because the utilization factor doesnot account for efficiency factors (e.g. wind speed orequipment availability), it can be a highly misleadingmetric for performance. The electricity output of awind turbine is a function of the cube of the windspeed, and a metric such as the utilization factor com-pletely misses that point. We still include this metricgiven that it provides a proxy for an upper bound forthe capacity factor, and because the CEC and otherofficial reports often emphasize this metric (NEANational Energy Administration 2015).
We also compute the ex-post capacity factor usingactual aggregate wind generation data published by theCEC andNEA divided by the total installed capacity orthe total connected capacity (times the number ofhours in the year) published from the CEC andCWEA. Thus, we report both the capacity factors cal-culated using the cumulative grid-connected capacityand cumulative installed capacity.
Therefore, we present four estimations: (i) CDMreported ex-ante capacity factors which estimate windelectricity production if there were no connection orcurtailment issues (ii) utilization factors, which repre-sent the percentage of time the turbines were spinning,but do not provide a good proxy for the electricity pro-duced since they do not take into account wind speedsand other factors (iii) ex-post estimates of end-yearcapacity factors calculated based on the reportedcumulative grid-connected capacity (CF ex-post con-nected) and (iv) based on the cumulative installedcapacity (CF ex-post installed).
2.2.3. Levelized cost of electricity (LCOE)We also estimate the LCOE for each of the fourestimates outlined above. LCOE is the price at whichelectricity can break even over the project’s lifetimeand can be calculated as follows:
å
å=
+
+
+
( )
( )
( )r
r
LCOE
FC VC
1GE
1
, 2j
n j j
j
j
n j
j
3
Environ. Res. Lett. 11 (2016) 084015

where j indexes the year, FC and VC indicate theproject’s fixed and variable investment costs, GE thetotal amount of generated electricity, and i thediscount rate. A project’s expected amount of electri-city generation is the product of its installed capacity,averaged capacity factor, and operational time. In thecase of wind power, a project would initially incur afixed capital cost, and subsequently some variablecosts in the form of operations and maintenance. Awind farm’s project is typically in service for 20 years.We assume in our analysis that the discount rate is 8%,which is same as the China power industry’s bench-mark internal rate of return. For simplicity, we furtherassume that the operations and maintenance costaccounts for 20% of the total investment costdue to the lack of better reported estimates. We reportin local currency unit (yuan RMB) and when appro-priate in Euro (€) for comparison9. All Chinesecurrency values are deflated to 2004 level using theWorld Bank’s Currency Deflator for China.We reportfour setsof results corresponding to different capacity factorassumptions.
2.2.4. Cost of carbonmitigationThe CCM using wind electricity is the differencebetween the wind LCOE and baseline LCOE dividedby the carbon emission factor EF, or:
=- ( )CCM
LCOE LCOE
EF, 3t
tw
tb
t
where t indexes the year. Because coal-fired powerplants make up a large majority of China’s electricitygenerating capacity, we use the LCOE of coal for eachyear as the baseline.We use E3’s generation costmodelto compute the LCOE of coal (E3 Energy+Environ-mental Economics 2012). To be consistent with ourLCOEmodel usingCDMdata, we focus on investment
and operating costs and ignore related taxes. Averageannual data for 5500-grade coal prices are obtainedfrom Qinhuangdao Port’s Free-On-Board Price (Qin-huangdao Coal Web 2016). We use annual nationalaverage utilization hours for coal power plants asreported by the CEC. Since a substantial portion ofChina’s coal fleet consists of subcritical plants, weassume that the subcritical plants make up China’sentire coal fleet in the baseline case. However, thenumber of the more efficient supercritical plants is onthe rise and makes up close to 30% of the country’stotal thermal capacity (IEA 2012). We will thus alsoconsider a scenario where the fleet consists exclusivelyof supercritical plants.
Using CDM-register projects’ data, we computethe yearly average emissions’ factors (EFs) for China’sgrid, which ranges from 823 to 929 gCO2 kWh−1. Allcurrency numbers are again deflated to 2004 prices.
3. Results
3.1. Connected and unconnected capacityBetween 2006 and 2010, China doubled its cumulativeinstallation capacity every year. However, we find thatproportion of the installed turbines that were offlineremained a very high share of the total installedcapacity, ranging from 25% to 31% between 2006 and2008. In 2010, this number peaked, with 34% of theinstalled turbines never spinning their blades (seefigure 2). For comparison, grid connection issues arenot common in the US, where infrastructure con-siderations are often part of the planning process.During this period, a number of accidents occurredwhere turbines suddenly and unexpectedly went off-line, further hampering efforts to integrate renewableenergy into the Chinese electricity grid. Ming et al(2014) report that as many as 80 accidents occurred in2010, a number that increased to 193 in 2011, ofwhich 54 events caused a loss of more than 500MWin capacity. Wind farms in Gansu and Hebei have
Figure 2.China’s cumulative installed and connected capacity between 2006 and 2015 (left axis). The line tracks the percentage ofChina’s wind base that is not connected to the grid (right axis). Figure produced by authors using data fromCWEAChinaWindEnergy Association (2015), LBNL Lawrence BerkeleyNational Laboratory (2014) for installed capacity and fromCECChinaElectricity Council (2015) for connected capacity.
9We use a constant exchange rate of 1 Euro=8 RMB throughout
the paper.
4
Environ. Res. Lett. 11 (2016) 084015

experienced some of the worst power loss accidents.On 24th February 2011, a substation inGansu sufferedan equipment fault and resulted in a cascadingfailure, tripping off 598 wind turbines whose com-bined capacity totaled more than 800MW (Xu andAlleyne 2012). In the following April, another accidentin Gansu caused power losses of 1006.2 MW, and onthe same day, Hebei lost 854MW of wind power (Liet al 2012). A week later, an accident in Gansu trippedoff 1278 wind turbines, resulting a total loss of1535MWpower (Schuman and Lin 2012).
3.2. CurtailmentChina’s installed wind has seen large curtailment rates,in particular in the North and Northeastern regions(see figure 3). According to NEA, the 2013 curtailmentrate was greater than 15% in Hebei and InnerMongolia and around 20% in Jilin and Gansu (NEANational Energy Administration 2014). (In table S5,we show the curtailment for various provincesbetween 2011 and 2015 in the supplemental informa-tion.) Curtailment issues initially occurred in the‘Three North’ regions10, though they subsequentlyemerged in other provinces as well. While someprovinces seemed to leave their curtailment issuesbehind by 2015, the Three North provinces have beencontinually dogged by curtailment. There were someimprovements in 2014, when the average national
curtailment rate dropped to 8%, though the totalamount of curtailed electricity was comparable to thatof 2011 amount. Latest industry data underscore thatthe problem is far from being resolved. In 2015, asmuch as 33.9 TWh of wind electricity was discarded,an equivalent of 17.3 billion RMB (€2.2 billion) loss inrevenue using the lowest FIT rate of 0.51 RMB kWh−1
(€6.38 cents kWh−1) (NEANational Energy Adminis-tration 2015). In fact, with the exception of InnerMongolia, curtailment rates actually worsened for allconcerned provinces between 2011 and 2015.
Curtailment problems also happen in other partsof the world, but not to the extent that they do inChina. For instance, Wiser and Bolinger (2014) reportthat the US wind curtailment rate is approximately2%. The highest curtailment rate ever recorded in theUS was 11% in 2009, though curtailment quicklydecreased to levels far below this historical peak. At theregional level the Electric Reliability Council of Texas(ERCOT), one of the nine US independent systemoperators, reported a peak curtailment rate of around17% in 2009. By 2014, only 0.5% of potential windenergy generation within ERCOT was curtailed. Incomparative perspective, the magnitude and persis-tence of curtailment rates inChina seemquite high.
In figure 3 we show the relationship betweencumulative installed capacity (represented by the sizeof the circles), penetration rate (defined by the ratio ofelectricity produced by wind to total electricity pro-duced), and curtailment rate for all provinces. Pro-vinces with the highest wind penetration rates tend tohave the highest curtailment rates. For instance, Inner
Figure 3. 2014wind curtailment rates in various provinces (circle areas are proportional to the installed capacity). Provinces with highwind penetration rates tend to have high curtailment rates aswell. Plot produced by authors using data fromCWEAChinaWindEnergy Association (2015) for wind installed capacity, NEANational Energy Administration (2015) for electricity generated bywind,andNBSNational Bureau of Statistics (2014) for total electricity generation.
10China’s ‘Three Norths’ refers to Hebei, Bejing, Tianjin, Shanxi,
Shandong, West Inner Mongolia (North); Heilongjiang, Jilin,Liaoning, East Inner Mongolia (Northeast); Shaanxi, Gansu, Qin-ghai, Ningxia, andXinjiang (Northwest).
5
Environ. Res. Lett. 11 (2016) 084015

Mongolia, a vast province with abundant wind resour-ces, has become one of the focal regions for winddevelopment, and at 10%, its wind penetration ratewas the highest in the country in 2014. InnerMongoliahas also been a wind curtailment hotspot in China.Similarly, electricity grids in provinces with high windpenetration rate such as Gansu, Heilongjiang, Jilin,andXinjiang all had to reject a high proportion of elec-tricity produced bywind.
3.3. Relationship between unconnected capacity andcurtailed electricityFigures 4(a) and (b) respectively show the amount ofChina’s 2014 unconnected capacity and curtailedelectricity in all provinces. At first glance, provinces inthe ‘Three North’ region that have high amount ofcurtailed electricity also have large unconnected capa-city. However, once adjusted for the provinces’ totalcapacity and electricity generation, a different pictureemerges. The curtailment rates, or the ratio of curtailedelectricity to total electricity produced by wind, arehighest in the ‘Three North’ region, but the rates ofdisconnected capacity are highest in the Central andSouthern provinces (figures 4(c) and (d)). The initialfocus of China’s wind power development was in the‘Three North’ region, provinces abundant with windresources. Both grid connection and curtailments
hindered integration efforts in the early days of winddevelopment. Though the country has made muchprogress connecting turbines to the grid, curtailmentscontinued to dog the industry. Disconnection rates inprovinces with highwind development decreased in thepast five years, but curtailment problems persist (tablesS5 and S6). As curtailment worsens, the central govern-ment turned the focus to other provinces (NEANational Energy Administration 2016a), and theseprovinces have some of the highest disconnection ratesin recent year. In 2015 42%ofwind turbines inGuangxiwere not connected, compared Qinghai’s 47%,Sichuan’s 37%, andHunan’s 37%.
Figure 4.Maps (a) and (b) show the disconnected capacity (MW) and curtailed electricity (GWh) for 2014, whereasmaps (c) and (d)the disconnection and curtailment rates (%) for the same year.Maps produced by authors using data fromCECChina ElectricityCouncil (2015) andCWEAChinaWind EnergyAssociation (2015) to compute the unconnected capacity and fromNEANationalEnergy Administration (2014, 2015) for curtailment rates.
Table 1. 2010–2012wind electricity generation (TWh). Expec-ted generation is the product of the total installed capacity andtheCDM’s estimated capacity factor. CEC andNEA report theactual generation and the total amount of curtailed electricity.
Year Expected Actual Actual, if no curtailment
2010 94.0 49.4 54.3
2011 131.1 74.1 86.4
2012 153.0 103.0 123.8
Sources: CWEA China Wind Energy Association (2015), UNEPRisoe Center (2015), CREIAChina Renewable Energy Industries
Association (2012), SERC State Electricity Regulatory Commis-
sion (2013), CECChina Electricity Council (2015).
6
Environ. Res. Lett. 11 (2016) 084015
We also show in table 1 the actual amount of gener-ated electricity between 2010 and 2012 (when the dataare complete) and howmuch curtailment issues causedthe electricity output to deviate from the expectedamount. If all of China’s installed wind turbines wereput to use at capacity factors that were estimated by theCDM, the country could have produced as much as153 TWh in 2012. In reality, the country’s turbines onlygenerated 103 TWh of electricity, or around 33% less.Curtailment alone accounts for 20.8 TWh of the short-fall in the same year, or 42%of the discrepancy betweenexpected and actual amount of generation.
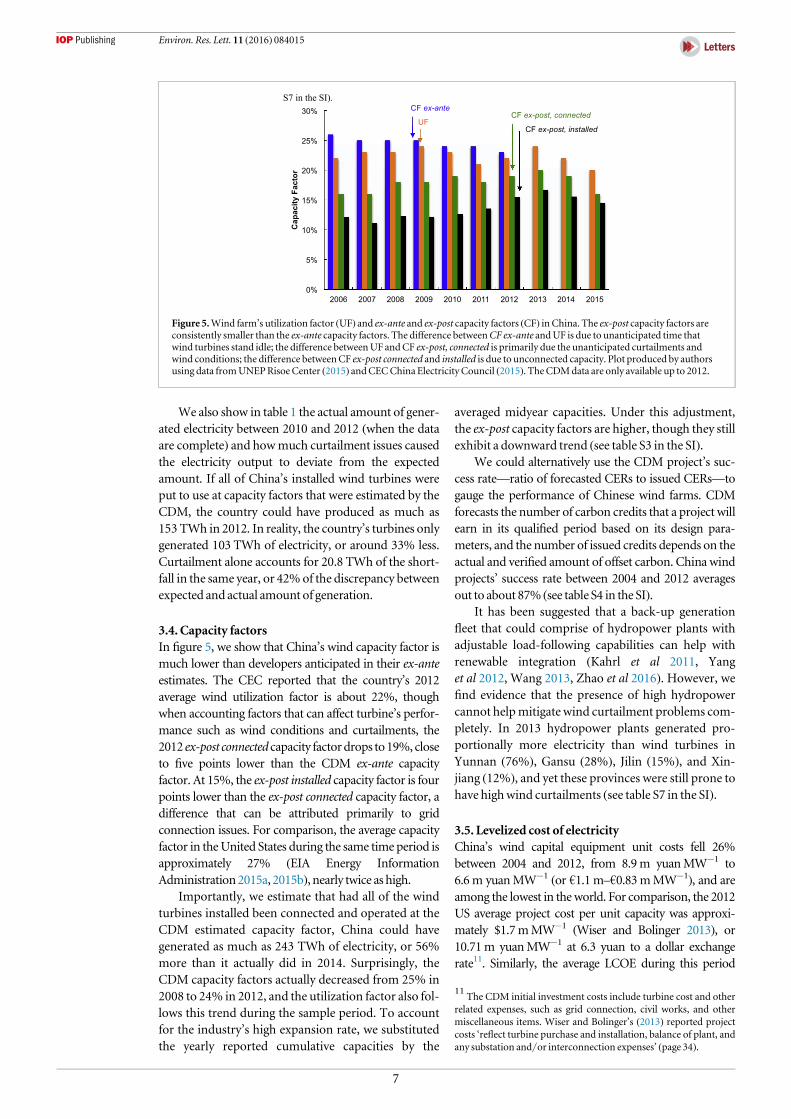
3.4. Capacity factorsIn figure 5, we show that China’s wind capacity factor ismuch lower than developers anticipated in their ex-anteestimates. The CEC reported that the country’s 2012average wind utilization factor is about 22%, thoughwhen accounting factors that can affect turbine’s perfor-mance such as wind conditions and curtailments, the2012 ex-post connected capacity factordrops to19%, closeto five points lower than the CDM ex-ante capacityfactor. At 15%, the ex-post installed capacity factor is fourpoints lower than the ex-post connected capacity factor, adifference that can be attributed primarily to gridconnection issues. For comparison, the average capacityfactor in theUnited States during the same time period isapproximately 27% (EIA Energy InformationAdministration2015a, 2015b), nearly twice as high.
Importantly, we estimate that had all of the windturbines installed been connected and operated at theCDM estimated capacity factor, China could havegenerated as much as 243 TWh of electricity, or 56%more than it actually did in 2014. Surprisingly, theCDM capacity factors actually decreased from 25% in2008 to 24% in 2012, and the utilization factor also fol-lows this trend during the sample period. To accountfor the industry’s high expansion rate, we substitutedthe yearly reported cumulative capacities by the
averaged midyear capacities. Under this adjustment,the ex-post capacity factors are higher, though they stillexhibit a downward trend (see table S3 in the SI).
We could alternatively use the CDM project’s suc-cess rate—ratio of forecasted CERs to issued CERs—togauge the performance of Chinese wind farms. CDMforecasts the number of carbon credits that a project willearn in its qualified period based on its design para-meters, and the number of issued credits depends on theactual and verified amount of offset carbon. China windprojects’ success rate between 2004 and 2012 averagesout to about 87% (see table S4 in the SI).
It has been suggested that a back-up generationfleet that could comprise of hydropower plants withadjustable load-following capabilities can help withrenewable integration (Kahrl et al 2011, Yanget al 2012, Wang 2013, Zhao et al 2016). However, wefind evidence that the presence of high hydropowercannot helpmitigate wind curtailment problems com-pletely. In 2013 hydropower plants generated pro-portionally more electricity than wind turbines inYunnan (76%), Gansu (28%), Jilin (15%), and Xin-jiang (12%), and yet these provinces were still prone tohave highwind curtailments (see table S7 in the SI).
3.5. Levelized cost of electricityChina’s wind capital equipment unit costs fell 26%between 2004 and 2012, from 8.9m yuanMW−1 to6.6m yuanMW−1 (or €1.1m–€0.83mMW−1), and areamong the lowest in theworld. For comparison, the 2012US average project cost per unit capacity was approxi-mately $1.7mMW−1 (Wiser and Bolinger 2013), or10.71m yuanMW−1 at 6.3 yuan to a dollar exchangerate11. Similarly, the average LCOE during this period
Figure 5.Wind farm’s utilization factor (UF) and ex-ante and ex-post capacity factors (CF) in China. The ex-post capacity factors areconsistently smaller than the ex-ante capacity factors. The difference betweenCF ex-ante andUF is due to unanticipated time thatwind turbines stand idle; the difference betweenUF andCF ex-post, connected is primarily due the unanticipated curtailments andwind conditions; the difference betweenCF ex-post connected and installed is due to unconnected capacity. Plot produced by authorsusing data fromUNEPRisoe Center (2015) andCECChina Electricity Council (2015). TheCDMdata are only available up to 2012.
11The CDM initial investment costs include turbine cost and other
related expenses, such as grid connection, civil works, and othermiscellaneous items. Wiser and Bolinger’s (2013) reported projectcosts ‘reflect turbine purchase and installation, balance of plant, andany substation and/or interconnection expenses’ (page 34).
7
Environ. Res. Lett. 11 (2016) 084015

decreased significantly, owing to a sharp reduction ininvestment costs and a slight increase in capacity factor.
In figure 6 we show the LCOE using differentassumptions about the capacity factors. For instance,using CDM ex-ante capacity factor yields an LCOE of0.49 yuan kWh−1 in 2006 (or €6.13 cents kWh−1),which decreased to 0.39 yuan kWh−1 (or €4.88cents kWh−1) in 2012. When taking into account thesignificant fraction of the wind base that was not con-nected during this period, the 2006 LCOE (computedusing ex-post installed capacity factor)more than dou-bles the ex-ante estimate, at around 1.02 yuan kWh−1.As grid connection problems improved, the corresp-onding LCOE decreased at a fast rate, though at 0.59yuan kWh−1 (€7.4 cents kWh−1), it is still around 50%higher than the ex-ante estimate in 2012. The overalldownward trend over the sample period is consistentacross different assumptions.
3.6. Cost of carbonmitigationChina alsomade significant inroads in driving down theCCM using wind energy. Using CDM ex-ante estimatesfor capacity factors, we find that mitigation costs rangefrom 151 yuan/tCO2 in 2004 to 33 yuan/tCO2 in 2012(or €18.9–€4.1/tCO2) for the baseline case (assuming allsubcritical plants). Again, results are sensitive to capacityfactor assumptions (see figure 7) as well as the assump-tion about the composition of China’s coal fleet. Underthe ex-post installed capacity factor assumption, theCCM is four to six times higher than the ex-anteestimates, ranging from 207 yuan/tCO2 in 2012 to 618yuan/tCO2 in 2006 (or around €25.8–€77.3/tCO2). The2012 CCM is comparable to the European EmissionAllowance nominal price at its peak, though it is severaltimes higher than the currentmarket price.
The downward trends are again consistent acrossall assumptions. However, the CCM reductions aresteeper than the LCOE reductions due to the increasein coal prices in the first half of the sample period and
the sharp decrease that followed. We expect the CCMin recent years to bemuch higher given the recent pre-cipitous drop in coal prices (figure S5). Likewise, therecent lower capacity factors are likely to push up thecorrespondingCCM.
4.Discussion and conclusions
In this paper we illustrate the scale of connection andcurtailment problems of China’s wind energy industryacross provinces, their affect on China’s wind capacityfactor, LCOE produced by wind, and the associatedCCM. We show that China’s wind capacity factor ismuch lower than developers anticipated in their ex-anteestimates. As a result, the corresponding wind LCOEandCCMin reality are also higher than expected.
This work has some caveats and limitations. First,CDM data on capital investment costs do not necessa-rily reflect the real costs of wind turbines in the Chi-nese markets. It could be the case that SOEs, whichmake upmore than 90% of the market in recent years,intentionally distorted product prices to gain marketshare. The LCOE and CCM estimates are then higherin this case. We explore this possibility by varying theinvestment costs and the O&M costs in more detail inthe SI (table S6). The LCOE is more sensitive to thecapital investments and the capacity factors. Forinstance, in the scenario where the capital investmentis 30% higher, the lowest LCOE is 0.51 yuan kWh−1,which occurred in 2012 using CDM ex-ante capacityfactor, 0.12 yuan kWh−1 or 24% higher than thecorresponding baseline case. Using the ex-post capa-city results in a 0.63 yuan kWh−1 LCOE for the sameyear, 0.24 yuan kWh−1 or 24% higher than thecorresponding baseline case.
Estimates for thefirst half of our sample periodmaybe more accurate, when foreign and private firms stillhad a substantialmarket share, and the industrywas not
Figure 6.Wind levelized cost of electricity (LCOE) under different assumptions about the capacity factors in RMB kWh−1 (left axis)and in Euro cents kWh−1 (right axis). Computed LCOEusing ex-post capacity factor is consistently higher than using ex-ante capacityfactor. CECdid not releasewind electricity generation data prior to 2006. Plot produced by authors using data fromCECChinaElectricity Council (2015) andUNEPRisoe Center (2015).
8
Environ. Res. Lett. 11 (2016) 084015

as competitive. Additionally, Chinesewind farms bear anumber of tax burdens, and of these, income tax, value-added tax (VAT), urbanmaintenance and constructiontax, and education surcharges are not reflected in thetotal investment costs. Chinese wind farms enjoy fullincome tax exemption in the first three years, halfexemption in the following three years, and a pre-ferential 15% income tax rate thereafter (Liu et al 2015).However, given the large discrepancy between theexpected generation and the actual generation of windelectricity across the country as well as thewidely repor-ted delays in payments to the generators, many gen-erators during this the sample period operated at verytight margins, and would not have to pay significantincome taxes. Based on the FITs for wind, we estimatethat the VAT, urban maintenance and constructiontax, and education surcharges total to approximately0.047–0.056 yuan kWh−1 (nominal).
Second, in calculating the CCM, we assume thatwind power plants replace coal-fired power plants.While smaller in its contribution to electricity genera-tion, hydropower was still responsible for 14%–17%of China’s electricity in our sample period (CECChinaElectricity Council 2015), thus the actual baselineLCOE would have to account for hydropower’s LCOEaswell.
Third, we consider scenarios where China’s coalfleet is made up exclusively of subcritical or super-critical plants. Thus the results reported here are likelythe lower and upper bounds. Finally, we do not con-sider how integrating electricity produced by windcould affect the CO2 emissions and the associatedCCM of the rest of system.When a traditional (mostlycoal-fired in China) generator ramps up and down tocompensate for wind’s intermittency and variability, itmay requiremore fuel use than when it is operated at asteady level, thus wind integration may increase CO2
emissions and CCM (Katzenstein and Apt 2008,Zhang et al 2015).
The success of China’s transition to a low-carbonenergy system will be key to achieve the global level ofemissions reductions needed to avoid large negativeconsequences from climate change. On the surface, therapid build-out in thepast decade appears to represent atriumph of China’s centralized government-directedapproach to investment. However, China has struggledto utilize this massive installed base effectively. In 2015alone wind curtailment exceeds 33.9 TWh. Had all ofthese spilled electrons been used, and assuming thatwould be able to avoid the generation from the averageelectricity mix, about 29.5 million on of CO2 wouldhave been avoided—roughly the same amount of CO2
Connecticut produces (EIA Energy InformationAdministration 2015a, 2015b). Between 2011 and 2015China’s grid systems curtailed approximately 96.5TWh of wind electricity, missing the opportunity toavoid 84million tons of CO2. Moreover, because theactual amount of electricity consumption determineshow much revenue and the number of CDM emissionreduction credits wind farm owners can earn, windfarmowners have lost billions ofRMBdue to these largeproduction shortfalls.
The still-large gap between installed capacity andrenewable energy usage helps explain one of the pain-ful realities of China’s green energy push: after a dec-ade of unprecedented expansion, renewables haverisen from 6% to only 9% of China’s total primaryenergy consumption, and 7% of this total is generatedby hydropower (BP 2015). Macroeconomic trendsalso present daunting challenges as China pushes for-ward with its ambitious renewable energy develop-ment plans (please see the SI for more information).China’s economy has slowed substantially in recentyears, and the electricity consumption growth rate hassuddenly come to a virtual halt. In 2015 China’s econ-omy grew 6.9%, but the electricity consumption rateincreased merely half a percentage point (see figure S2in the SI). Nevertheless, the country’s energy supply
Figure 7.Cost of carbonmitigation (CCM) under different assumptions about the capacity factors and the baseline LCOE in yuan/tCO2 (left axis) and €/tCO2 (right axis). In each capacity factor scenario, we assume the coal plants replaced by newwind power plantsare either all subcritical or all supercritical. Plot produced by authors using data fromCECChina Electricity Council (2015) andUNEPRisoe Center (2015) forwind LCOE, E3 Energy+Environmental Economics (2012) andQinhuangdaoCoalWeb (2016) for coalLCOE, and IGES (2015) for emission factors.
9
Environ. Res. Lett. 11 (2016) 084015
has continued to expand at a rapid pace. Last year,thermal capacity (mostly coal) grew by 8% (see figureS4 in the SI), hydropower 6%, and wind 36%. Theslowdown in energy demand coupled with a business-as-usual increase in supply have led to sharp reduc-tions in utilization rates across all energy sources (seefigure S3 in the SI).
Nevertheless, China has decided to redouble itsefforts and press onwith its renewable energy develop-ment plans. The country now wants to lift its windpower target to 250 GW, or twice the current capacity,by 2020. By the same year, it aims to install 150 to200 GW of solar power (Reed 2015), and 58 GW ofnuclear power (WNA World Nuclear Associa-tion 2016). At the COP21 meeting, China committedto a 20% non-fossil primary energy consumption tar-get by 2030, an ambitious target. In order to achievethese goals and successfully integrate renewable energyinto the country’s existing power generation system,serious reform efforts are needed.
Interprovincial power exchange markets andimprovements in transmission infrastructure arelikely key to the successful growth of low carbon elec-tricity in China. Between 2011 and 2014, Inner Mon-golia’s electric power generation capacity grew by18.69 GW, of which 4.76 GW came from wind power.(Thermal power accounted for most of the remain-der.)Assuming a 60% capacity factor, the new thermalcapacity alone could provide Inner Mongolia with73.2 TWh of energy, some 18 TWh more than theincrease in consumption during this period. Put dif-ferently, Inner Mongolia could satisfy its energy needswithout renewables. Exporting its excess electricityproduction using non-UHV lines to the energy-thirstycoastal region to alleviate some of Inner Mongolia’scurtailment problems remains difficult without arobust electricity network and a mature marketexchange. Similar problems exist in other provinceswith high wind curtailment rates such as Gansu andJilin. As per the NEA’s mandate, wind turbine con-struction in these provinces had been halted until cur-tailment problems are adequately addressed (NEANational Energy Administration 2016a).
Some have called for a more flexible power genera-tion system that would consist of pumped hydro storageand electric boilers (Lu et al 2016). Indeed, Zhang et al(2015) demonstrate that the deployment of pumpedhydro storage and electric boilers can be a cost-effectivemethod to reduce curtailments ofwindpower in apowersystem that heavily relies combined-heat-and-powerplants. The NEA is pushing Northern provinces to usewind energy that would otherwise go to waste for resi-dential heating instead, and a pilot project is expected tocomplete in Inner Mongolia in 2020 (Liu 2015). How-ever, significant challenges remain as the governmentmanages competing interests among the stakeholders,and there are questions regarding the economics of aprovincial or national deploymentprogram.
Traditionally, China follows an ‘equal shares’ sys-tem, where coal-powered generating plants are givencontracts with fixed electricity prices, and the operat-ing hours are allocated equally across the generators.This policy effectively shuts out renewable energy bycarving out and reserving a significant chunk of theelectricity market for expensive and inefficient coalplants. In principle, a priority dispatch system wherepriority is given to renewable energy in the dispatchsequence can increase the demand for electricity pro-duced by renewable sources. The amendments to therenewable energy law require grid operators in five pro-vinces to move past the generation guarantee quotasystem and establish a priority dispatch sequence,though grid operators are still allowed to curtail windelectricity output under certain system constraints.Recently China announced its intention to commit toa national green dispatch program (TheWhite House,Office of the Press Secretary 2015), though neither theprogram’s timeline nor its implementation is clear.China is also considering a power generation quotasystem where provinces must generate a certain frac-tion of their electricity from renewable sources,though enforcement methods are again unclear (NEANational Energy Administration 2016b).
Finally, an emissions trading system can bringChina closer to a more cost-effective and efficientmechanism for emissions reductions. Senior policy-makers have embraced this as a long-run goal, andpilot emissions trading systems have been introducedin several areas. Plans to establish a national ETS areunder way, and China plans to roll out the nationaltrading system in 2017 (The White House, Office ofthe Press Secretary 2015). While challenging, such atrading system can significantly reduce China’s carbonemissions and boost its utilization of renewable energyif successfully implemented.
Acknowledgments
We gratefully acknowledge the financial support fromthe following sources: Fundação para a Ciência e aTecnologia (Portuguese Foundation for Science andTechnology), the CMU|Portugal Program, CMU’sScott Energy Institute and the Climate and EnergyDecisionMaking Center (CEDM). We thank Sally Xu,Jørgen Villy Fenhann, Yang Liu, António Moreirafor valuable assistance with the data used in thisstudy.
References
AmericanWind EnergyAssociation 2015 AWEAUSWind Industry2014Market Report (http://awea.org/Resources) (Accessed:25 September 2015)
BP 2015 Statistical Review ofWorld Energy 2015 (http://bp.com/
en/global/corporate/energy-economics/statistical-review-of-world-energy.html) (Accessed: 30March 2016)
CECChina Electricity Council 2015Electricity Industry OperationsStatus 2006–2015 (http://cec.org.cn/guihuayutongji/
10
Environ. Res. Lett. 11 (2016) 084015

gongxufenxi/dianliyunxingjiankuang) (Accessed: 25 Janu-ary 2016)
ChanG2015Essays on energy technology innovationpolicyPhDThesisHarvardUniversity,Graduate School ofArts&Sciences
CREIAChinaRenewable Energy Industries Association 20122012ChinaWindPowerOutlook (http://creia.net/publish/report)
CWEAChinaWind EnergyAssociation (2008–2015) 2007–2014China’sWind Power Installed Capacity Statistics (http://cwea.org.cn/upload) (Accessed: 18 April 2015)
DavidsonM2013 Politics of power inChina: institutionalbottlenecks to reducingwind curtailment through improvedtransmission Int. Association for Energy Economics (IAEE)
E3Energy+Environmental Economics 2012GenerationCostModelforChina (https://ethree.com/public_projects/generation_cost_model_for_china.php) (Accessed: 25 January 2016)
EIAEnergy InformationAdministration 2015aElectricity DataBrowser (http://eia.gov/electricity/data/browser)(Accessed: 2October 2015)
EIAEnergy InformationAdministration 2015b Energy-RelatedCarbonDioxide Emissions at the State Level, 2000–2013(http://eia.gov/environment/emissions/state/analysis/)(Accessed: 1 April 2016)
Gallagher K S 2014TheGlobalization of Clean Energy Technology—Lessons fromChina (Cambridge,MA:MITPress)
HeGandMorse R 2013Addressing carbon offsetters’ paradox:lessons fromChinese windCDMEnergy Policy 63 1051–5
IEA 2012Technology Roadmap:High-Efficiency, Low-EmissionsCoal-Fired Power Generation (www.iea.org/publications/freepublications/publication) (Accessed: 28 February 2016)
IEA 2016 IEA/IRENA Joint Policies andMeasures Database (iea.org/policiesandmeasures/renewableenergy/?country=China)(Accessed: 16March 2015)
IGES 2015 List of Grid Emission Factors (http://pub.iges.or.jp/)(Accessed: 3 August 2015)
Kahrl F andWangX 2014 Integrating Renewable Energy into PowerSystems inChina: ATechnical Primer—Power SystemOperations (Beijing: Regulatory Assistance Project) (http://raponline.org/document/download/id/7459)
Kahrl F,Williams J, JianhuaD and JunfengH 2011Challenges toChina’s transition to a low carbon electricity systemEnergyPolicy 39 4032–41
KatzensteinWandApt J 2008Air emissions due towind and solarpowerEnviron. Sci. Technol. 43 253–8
LBNLLawrence BerkeleyNational Laboratory 2014China EnergyDatabookVersion 8 (https://china.lbl.gov/research-projects/china-energy-databook) (Accessed: 6 July 2015)
Lewis J 2013Green Innovation inChina: China’sWind PowerIndustry and theGlobal Transition to a Low-Carbon Economy(NewYork: ColumbiaUniversity Press)
LiC-B, Li P andFengX2014Analysis ofwindpowergenerationoperationmanagement risk inChinaRenew.Energy64266–75
Li X,HubacekK and SiuY L 2012Wind power inChina—dreamorreality? Energy 37 51–60
LiuC2015China Struggles toUseWind Power to Avert Toxic, ‘RedAlert’ Smog E&EPublishing (http://eenews.net/stories/1060029923) (Accessed: 14 January 2016)
Liu Z, ZhangW, ZhaoC andYuan J 2015The economics of windpower inChina and policy implications Energies 8 1529–46
LuX,McElroyM, PengW, Liu S,Nielsen C andWangK 2016Challenges faced byChina comparedwith theUS indevelopingwind powerNat. Energy 1 16061
MingZ,XimeiL, YulongL andLilin P 2014Reviewof renewableenergy investment andfinancing inChina: status,mode, issuesand countermeasuresRenew. Sustainable EnergyRev.31 23–37
NBSNational Bureau of Statistics 2014China Energy StatisticalYearbook (Beijing: China Statistics Press)
NEANational EnergyAdministration 2014 2013Wind EnergyIndustry Continues toHold Fast and SteadyDevelopmentTrends (http://nea.gov.cn/2014- 03/06/c_133166473.htm)(Accessed: 25 September 2014)
NEANational EnergyAdministration 2015 2014Wind EnergyIndustryMonitoring Situation (http://nea.gov.cn/2015-02/12/c_133989991.htm) (Accessed: 7 June 2015)
NEANational EnergyAdministration 2016aNEA Issues 2016WindPower Construction Plan (http://zfxxgk.nea.gov.cn/auto87/201603/t20160321_2212.htm) (Accessed: 1 April 2016)
NEANational EnergyAdministration 2016bNEA Issues Notice on2016Wind Power Consumption Requirements (http://zfxxgk.nea.gov.cn/auto87/201603/t20160317_2208.htm)(Accessed: 1 April 2016)
PeiW,ChenY, ShengK,DengW,DuY,Qi Z andKong L 2015Temporal-spatial analysis and improvementmeasures ofChinese power system forwind power curtailment problemRenew. Sustainable Energy Rev. 49 148–68
QinhuangdaoCoalWeb 2016Bohai Coal Price Index (BSPI) (www.cqcoal.com) (Accessed: 24 February 2016)
Reed S 2015China raises its targets for renewable energyTheNewYork Times (http://nytimes.com/interactive/projects/cp/climate/2015-paris-climate-talks/china-raises-its-targets-for-renewable-energy) (Accessed: 16December 2015)
Schuman S and Lin A 2012China’s renewable energy law and itsimpact on renewable power in China: progress, challengesand recommendations for improving implementation EnergyPolicy 51 89–109
SERCState Electricity Regulatory Commission 2013Report onWindElectricity ConsumptionMonitoring in Important Areas(http://cnwp.org.cn/fenxi/show.php?itemid=1596)(Accessed: 3 August 2015)
StuaM2013 Evidence of the clean developmentmechanism impacton theChinese electric power system’s low-carbon transitionEnergy Policy 62 1309–19
TangT and PoppD2014The learning process and technologicalchange inwind power: evidence fromChina’s CDMwindprojectsWorking Paper
TheWhiteHouse, Office of the Press Secretary 2015US-China JointPresidential Statement onClimate Change (https://whitehouse.gov/the-press-office/2015/09/25/us-china-joint-presidential-statement-climate-change)
UNEPRisoeCenter 2015UNEPRisoeCDM/JI PipelineAnalysis andDatabase (http://cdmpipeline.org/) (Accessed: 3August 2015)
Wang F, YinH and Li S 2010China’s renewable energy policy:commitments and challenges Energy Policy 38 1872–8
WangQ2013Windpower relatedpolicies and regulations inChina-status, problems and solutions J. EnergyPowerEng.7 963–71
Wiser R andBolingerM2013 2012Wind TechnologiesMarket Report(http://escholarship.org/uc/item/1vd1s6gf.pdf) (Accessed:12August 2014)
Wiser R andBolingerM2014 2013Wind TechnologiesMarket Report(http://escholarship.org/uc/item/1vd1s6gf.pdf) (Accessed:12August 2014)
WNAWorldNuclear Association 2016Nuclear Power inChina(http://world-nuclear.org/information-library/country-profiles/countries-a-f/china-nuclear-power.aspx)(Accessed:14March 2016)
XuL andAlleyne J 2012Embarrassments of China’sWind Power SGTResearch (http://sgtresearch.com/insights/2012/0314/72.html) (Accessed: 5 September 2015)
YangM, Patiño-Echeverri D andYang F 2012Wind powergeneration inChina: understanding themismatch betweencapacity and generationRenew. Energy 41 145–51
YaoX, Liu Y andQu S 2015Whenwill wind energy achieve gridparity in China? Connecting technological learning andclimatefinanceAppl. Energy 160 697–704
ZhangN, LuX,McElroyM,NielsenC,ChenX,Deng Y andKangC2015Reducing curtailment of wind electricity in China byemploying electric boilers for heat and pumped hydro forenergy storageAppl. Energy in press (doi:10.1016/j.apenergy.2015.10.147)
ZhaoX, Zhang S, YangR andWangM2012Constraints on theeffective utilization ofwind power inChina: an illustrationfrom the northeast China gridRenew. Sustainable Energy Rev.16 4508–14
Zhao Z-Y, Chang R-D and Chen Y-L 2016What hinderthe further development of wind power in China?A socio-technical barrier study Energy Policy88 465–76
11
Environ. Res. Lett. 11 (2016) 084015