china’s currency manipulation and the effect on the united states derek griest, fraser hunt, &...
Post on 19-Dec-2015
215 views
TRANSCRIPT

China’s Currency Manipulation and the Effect on
the United States
Derek Griest, Fraser Hunt, & Alka Shah

Stuck on USA
• Essentially 1994 (1997 officially) until July 2005, it was pegged strictly to the dollar at about 8.28 Yuan to the dollar
• Now adjusted nightly by Zhou Xiaochuan according to basket of currencies
• Appreciated slightly since July 2005
• Still believed to be vastly undervalued
• Accused of being currency manipulator

Value of the Yuan Against the Dollar Over Past 2 Years

Strength of U.S. Dollar Against Various Currencies: 2000-2005
Percentage Change
YearSouth Korea Canada Japan China India Euro
UnitedKingdom
2000 - - - - - - -
2001 12% 4% 12% 0% 7% 2% 5%
2002 4% 1% 15% 0% 4% -5% -3%
2003 -10% -11% -10% 0% 0% -15% -9%
2004 1% -7% -10% 0% -5% -10% -10%
2005 -10% -7% -5% -1% -5% 0% 0%
Total Change:
2000-2005 -5% -19% 0% -1% 0% -27% -17%

Deficit
• Overall U.S. Deficit $726 billion of 2005
• Deficit of $201.6 billion with China for 2005– Almost 25%
• Due to the low currency rate of Yuan, we can import from them cheaply and exports are expensive for us.

Exports (Millions of Dollars)
China USAChina
GrowthUSA
Growth
China's Minus
the USA1994 121,006 512,627 0% 0% 0%
1995 148,780 584,743 23% 14% 9%
1996 151,048 625,073 25% 22% 3%
1997 182,792 689,182 51% 34% 17%
1998 183,712 682,138 52% 33% 19%
1999 194,931 695,797 61% 36% 25%
2000 249,203 781,918 106% 53% 53%
2001 266,098 729,100 120% 42% 78%
2002 325,591 693,103 169% 35% 134%
2003 438,228 724,771 262% 41% 221%
2004 593,329 818,775 390% 60% 331%
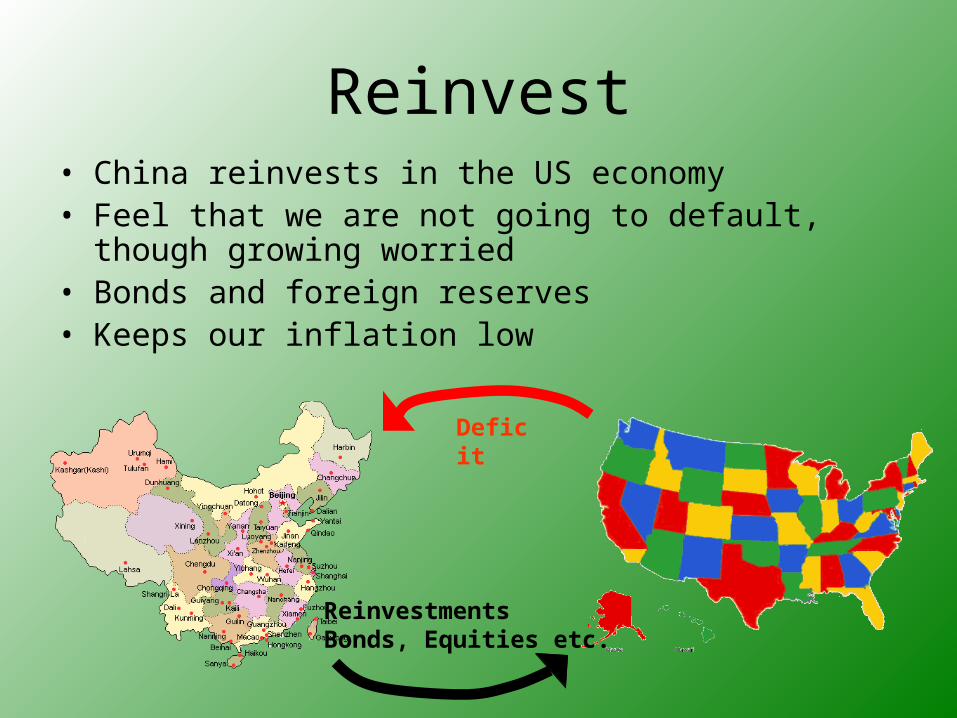
Reinvest• China reinvests in the US economy• Feel that we are not going to default, though growing
worried• Bonds and foreign reserves• Keeps our inflation low
Deficit
ReinvestmentsBonds, Equities etc.

M.A.F.D.• Mutually Assured Destruction, now known as MAD 2 or MAFD (Mutually Assured Financial Destruction)
• If China stops investing then the likely results are bad for them; world
• US refusing to hone deficit and trying to hold it over China’s head

Jobless
• Due to cheap imports, there has been a loss of manufacturing which put people out of jobs, especially the textile industry.

Manufacturing Employment Level
12000
13000
14000
15000
16000
17000
18000
1990 1993 1996 1999 2002 2005Tho
usan
ds o
f em
ploy
ees

Protectionism• U.S. wants to add duties
27.5% on Chinese imports until China allows its currency to float more freely against the dollar
• To decrease bilateral trade deficit with China
• Believed that effect could be minimal due to other countries
• China feels prices are lower in U.S., therefore refuses to change currency policy
