china power sector - credit suisse
TRANSCRIPT

KEY CONCLUSIONS
CREDIT SUISSE SECURITIES RESEARCH & ANALYTICS BEYOND INFORMATION®
Client-Driven Solutions, Insights, and Access
Equity Research China&Hong Kong
Utilities (Utilities CN (Asia))
29 April 2015
China Power Sector THEME
The Ideas Engine
series showcases
Credit Suisse’s unique
insights and investment ideas.
Please contact your
Sales person to
access the
supplemental
analysis behind this
report.
Reforms bite!
New game rules. Safety will become Rule No.1 when investing in the power generators
in the coming years amid China's aggressive push for power reforms. Our preliminary
analysis of market-based pricing in the recent primer report is now strengthened by the
four official documents issued in the past month. Without large demand recovery,
electricity will remain a seriously oversupplied commodity, and price war and consolidation
could pull the average ROE of national coal-fired IPPs from 17% in 2014 down to 10%
by 2020E. With 2Q15 earnings likely marking a meaningful inflection, we recommend
investors exit.
A painful process before gain. The IPPs tariffs could go down further after the recent
5% cut and IPPs' tariffs for direct supplied contracts in 2014 (10% lower on average) is a
very strong early signal of what market forces can do. China aims full liberalisation of power
pricing and when it happens, depressed tariffs could force the exit of uncompetitive smaller
units together with a large impairment (before full depreciation). Competitive survivors could
swell after consolidation but the process could take years and could be painful.
Safe waters in the storm. Meanwhile, investors should find much better visibility for
demand and prices in: (1) wind operators; (2) low-cost hydro power generators; and (3)
A-share listed local IPPs with protective schemes. Nuclear operators are no longer
attractive with rising uncertainty on utilisation and technology risks.
SELL the national IPPs. With valuation nearing a five-year high plus major industry
headwinds, we recommend investors to sell the national IPPs. We cut target prices and
ratings (Huadian-H) on lower sustainable ROEs and our top sells are Huaneng (both A/H)
and CR Power. We also downgrade CGN to UNDERPERFORM with an unjustified valuation
and rising nuclear earnings risks. Areas that are worth buying include wind operators, low-
cost hydro power generators and local power utilities (we are initiating on Jingneng and
Mengdian with an Outperform).
Structural ROE trend of the national IPPs
Source: Company data, Credit Suisse estimates
Switch to the safer sectors!
Source: Credit Suisse research
The report follows our China Utilities Reform Primer in March 2015
(click here)
RESEARCH ANALYSTS
Dave Dai, CFA
852 2101 7358
Ran Ma 852 2101 6653
18% 17% 16%
14%
11%
9% 10% 10%
6%
8%
10%
12%
14%
16%
18%
20%
2013 2014 2015E 2016E 2017E 2018E 2019E 2020E
IDEAS ENGINE SERIES

IDEAS ENGINE 2
China Power Sector
Focus charts
Figure 1: Slow demand scenario—utilisation trend would
continue to weaken without power reforms
Figure 2: Slow demand scenario—market reform can make
consolidation possible
Figure 3: IPPs with larger exposure to smaller units could
see greater shut-down risks
Source: CEIC, Credit Suisse estimates Source: CEIC, Credit Suisse estimates Source: Company data
Figure 4: Inner Mongolia enjoys better utilisation hours than the
national average
Figure 5: Forward P/B of national IPPs at five-year high despite
upcoming ROE pressure
Figure 6: Switch to the safer sectors!
Source: CEIC Source: Bloomberg, Credit Suisse estimates, excluding Datang Source: Credit Suisse research
The author of this report wishes to acknowledge the contributions made by Gary Zhou, an employee of Evalueserve Research Hong Kong Ltd, a third-party provider to Credit Suisse of
research support services.
5,031
5,294
4,9655,012
4,706
4,559
5,1025,043 5,085 5,130
4,000
4,200
4,400
4,600
4,800
5,000
5,200
5,400
2010 2011 2012 2013 2014
(Hours)
China Inner Mongolia
0%
4%
8%
12%
16%
20%
0.4
0.6
0.8
1.0
1.2
1.4
1.6
Jan-10 Jan-11 Jan-12 Jan-13 Jan-14 Jan-15
ROE (RHS)
0.8x Avg-1SD
0.6x Avg-2SD
1.0x Avg
1.2x Avg+1SD
1.4x Avg+2SD
(x)

IDEAS ENGINE 3
China Power Sector
Figure 7: Valuation summary
Name Ticker Rating Price TP Mkt cap P/E (x) P/B (x) Yield (%) ROE (%) %EPS CAGR
(US$ bn) 15E 16E 15E 16E 15E 16E 15E 16E 14-16E
China Wind power sector
Huaneng Renewables 0958.HK O 3.3 4.0 4.1 13.4 9.6 1.5 1.3 1.5 2.1 11.4 14.3 49.2
Longyuan Power 0916.HK O 9.7 11.5 10.0 14.8 11.9 1.7 1.5 1.3 1.7 12.0 13.5 42.7
China Datang Renewables 1798.HK O 1.3 1.5 1.2 17.0 11.5 0.7 0.6 0.6 0.9 4.0 5.6 n.a.
Huadian Fuxin Energy 0816.HK O 4.3 5.5 4.7 10.6 8.7 1.7 1.5 1.8 2.9 17.0 18.1 30.2
China Suntien Green Energy 0956.HK O 2.1 2.5 1.0 12.5 8.6 0.8 0.7 2.7 4.0 6.4 8.8 44.4
Simple average 13.7 10.1 1.3 1.1 1.6 2.3 10.2 12.1 41.6
China Hydro power sector
SDIC Power 600886.SS N 12.5 12.5 13.7 11.7 11.0 3.1 2.6 3.0 3.2 28.5 25.5 17.3
China Yangtze Power Co Ltd 600900.SS O 12.6 14.8 33.6 17.6 18.6 2.3 2.2 2.9 2.7 13.6 12.1 -1.7
Sichuan Chuantou Energy 600674.SS O 26.2 30.0 9.3 11.4 10.9 3.2 2.6 1.3 1.4 32.1 26.3 23.6
Simple average 13.6 13.5 2.9 2.5 2.4 2.4 24.7 21.3 13.0
China IPPs sector - A (Local)
Inner Mongolia Mengdian 600863.SS O 6.1 7.5 5.7 34.2 21.4 3.2 3.0 3.1 2.3 9.4 14.5 10.5
Jingneng Power 600578.SS O 8.1 10.0 6.0 17.6 18.2 2.4 2.2 2.0 1.9 14.1 12.5 -10.3
Simple average 26.0 19.9 2.8 2.6 2.5 2.1 11.8 13.5 0.1
China Nuclear sector
CGN Power 1816.HK U 4.5 3.4 26.3 26.3 22.8 3.0 2.7 1.3 1.5 11.7 12.5 11.9
China IPPs sector - H (National)
Datang International Power 0991.HK O 4.8 4.6 14.9 10.5 8.7 1.1 1.0 3.8 4.6 10.4 11.6 52.1
Huadian Power International 1071.HK U 8.7 6.4 11.9 11.0 12.3 1.7 1.6 3.7 3.3 16.6 13.6 -8.7
China Resources Power 0836.HK U 23.3 16.3 14.4 9.2 9.3 1.4 1.3 3.5 3.8 16.2 14.5 14.4
Huaneng Power International 0902.HK U 11.3 7.3 24.3 10.8 12.0 1.7 1.6 5.1 4.6 16.6 13.8 -0.3
Simple average 10.4 10.6 1.5 1.4 4.0 4.1 14.9 13.4 14.4
China IPPs sector - A (National)
Huadian Power International 600027.SS U 8.7 5.1 11.9 13.8 15.4 2.2 2.0 2.9 2.6 16.6 13.6 -8.7
Datang International Power 601991.SS U 7.9 3.7 14.9 21.6 18.1 2.2 2.0 1.9 2.2 10.4 11.6 52.1
Huaneng Power International 600011.SS U 11.0 5.8 24.3 13.1 14.6 2.1 2.0 4.2 3.8 16.6 13.8 -0.3
Simple average 16.2 16.0 2.1 2.0 3.0 2.9 14.5 13.0 14.4
China City Gas sector
China Gas Holdings Ltd 0384.HK O 14.3 17.5 9.2 18.0 14.3 3.4 2.9 1.3 1.7 20.2 21.6 25.2
Beijing Enterprises Holdings 0392.HK O 72.1 82.0 12.0 15.7 13.7 1.5 1.4 1.9 2.2 10.1 10.7 17.9
China Resources Gas 1193.HK O 27.1 27.0 7.8 19.4 15.4 3.2 2.8 1.1 1.4 17.6 19.2 24.1
ENN Energy Holdings Ltd 2688.HK O 56.7 56.0 7.9 18.3 15.6 3.5 3.0 1.6 1.9 20.6 20.9 15.9
Shenzhen Gas Corporation 601139.SS U 12.3 6.6 3.9 30.6 27.2 4.1 3.8 1.3 1.5 14.0 14.5 11.3
Kunlun Energy 0135.HK N 9.1 8.7 9.4 14.4 12.3 1.3 1.2 2.0 2.3 9.3 10.1 2.8
Hong Kong and China Gas 0003.HK U 18.7 15.0 25.3 26.3 24.9 3.5 3.3 2.3 2.4 13.8 13.8 5.2
Simple average 20.4 17.7 2.9 2.6 1.6 1.9 15.1 15.8 14.6
Source: Company data, Credit Suisse estimates

IDEAS ENGINE 4
China Power Sector
New game rules YTD 2015, the national IPPs have mostly underperformed the broader index and most other
utilities sub-sectors. However, the names showed strength again in April with lower coal prices
and stronger-than-expected 1Q15 results. In our view, the national IPPs are unlikely to enjoy
such high profitability as in 1Q15 over the next few years as: (1) cheaper coal prices are likely
to be offset by another "cost-plus" tariff cut later this year; (2) the recent 5% tariff cut should
reflect legacy costs instead of recent costs; and (3) most importantly, the power reform is likely
to trigger huge dynamic changes in this oversupplied industry. With rising uncertainties on the
operational environment for power generators, we believe safety should replace growth as the
key investment criteria.
Figure 8: YTD sub-sector performance
Source: Bloomberg
Further downgrade of national IPPs
With four separate documents issued in the past month, there is little doubt that China is very
determined to push for a market-based power economy. This is likely to radically change the
dynamics from the current industry structure, whereby every power tariff change has been
regulated by the central authority (National Development and Reform Commission or the
NDRC) and power plants' utilisation ability is largely planned. In an oversupplied industry
(thermal utilisation is nearing a 39-year-low this year), market pricing could pull down sector
ROE from 17% in 2014 to about 10% in 2020E in a slow demand scenario. We reflect our
P/B-based target prices with lower sustainable ROE (average of a stable demand and slow
demand scenario).
Figure 9: China IPPs—target price and rating changes
Company Ticker Prev.
rating
New
rating
Prev.
TP
New
TP
U/D Target
P/B
Underlying
ROE
Prev. ROE
HNP-H 0902.HK U U 7.7 7.3 -35% 1.0 11.3% 13.5%
HDP-H 1071.HK N U 6.6 6.4 -26% 1.2 12.2% 14.0%
CRP 0836.HK U U 17.0 16.3 -30% 1.2 12.6% 14.0%
HNP-A 600011.SS U U 6.2 5.8 -47% 1.0 11.1% 13.5%
HDP-A 600027.SS U U 5.2 5.1 -41% 1.2 12.2% 14.0%
Source: Company data, Credit Suisse estimates
Coal prices are unlikely to impact post-FY15 profits
In 1Q15, some IPPs reported strong profits and the key positive surprises mostly came from
cheaper coal prices. However, the recent tariff cut suggested that China has started to base
regulated tariff calculations on movements in fuel prices, suggesting any weakness in coal
prices could trigger another tariff cut later this year. Therefore, given that it is largely a rule of
90% pass-through, a stronger FY15 net profit would mean more tariff cuts going into FY16.
This is why we now base our target price calculations on FY16E P/B which will largely reduce
any influence of short-term movements in coal prices. Taking a longer-term view, valuation
would become much more stretched vs. history.
Figure 10: Three-year forward P/B history
Source: Bloomberg, Credit Suisse estimates

IDEAS ENGINE 5
China Power Sector
Why is consolidation needed?
In the following sections, we try to reflect on the "consolidation" and "no consolidation" cases in
a "slow demand" scenario. Given the continuing pressure on overall thermal utilisation, the
power reforms may make consolidation possible where power generating units compete with
each other on generation costs. In a nutshell, with utilisation hours likely touching a 39-year low
in 2015 (4,706 in 2014), a large fleet of units need to be phased out for the entire thermal
power industry to restore the optimal level of >5,000 hours. In the consolidation scenario, we
assume utilisation and tariffs to keep weakening in the next three years, phasing smaller units
out but companies that need to shut down before full depreciation may realise impairment
losses; however, a recovery may happen in 2019-20 as smaller units would be out of the fray
and it would be a more orderly industry. If there is no power reform and consolidation, tariffs
may be less destructive but everyone will get hurt with the rising pain of oversupply. Therefore,
without assuming additional asset injections, the key loser would be Huaneng with similar ROE
in both scenarios while the other three companies will be better positioned post consolidation
vs. no consolidation at all. More details are in the following sections.
Figure 11: ROE scenarios in the two cases (slow demand scenario)
2014 ROE 2020E ROE
Huaneng Power Consolidation 16.2% 10.2%
No consolidation 16.2% 10.5%
Datang Power Consolidation 4.0% 11.9%
No consolidation 4.0% 10.2%
Huadian Power Consolidation 21.8% 12.2%
No consolidation 21.8% 9.6%
CR Power Consolidation 13.6% 12.1%
No consolidation 13.6% 9.1%
Source: Company data, Credit Suisse estimates
The reform is moving quicker than expected
In our first primer report published in March 2015, we expected that coal-fired IPPs could face
both near-term and longer-term earnings headwinds. In the short run, we forecast an
asymmetric cut to on-grid power tariffs: coastal and inland provinces to be impacted by 2.5
fen/kWh (6%) and 1.5 fen/kWh (4%) cuts, respectively. Given that the IPPs could deflect
incremental pricing pressure to the coal producers, we expect average unit fuel cost to drop 5%
YoY for the IPPs in FY15. However, the cost-plus formula should remain effective going
forward, which will trigger another possible tariff cut in early FY16 (we assume further cuts by
1.5 fen and 1.0 fen/kWh for coastal and inland provinces ,respectively).
Also, our previous analysis of full-blown power reforms was based more on tariff differences
whereby high-tariff zones could see much larger tariff pressure than low-tariff locations. This
would result in an ROE squeeze of another >100 bp, but this scenario excludes the impact of
further utilisation downside.
Figure 12: The first reform primer report (March 2015)
Source: Credit Suisse estimates
Figure 13: China IPPs ROE (stable demand scenario)
Source: Company data, Credit Suisse estimate

IDEAS ENGINE 6
China Power Sector
A painful process before gain We begin this section by looking at how seriously oversupplied electricity is in China. In 2014,
China recorded thermal utilisation hours of 4,706 (implying a 54% utilisation rate), which is
reportedly the lowest reading in the past 38 years. Utilisation hours of 5,500 are used as a
common industry borderline between shortages and surpluses.
Figure 14: China—power demand/supply/utilisation trend
Source: CEIC
Further downside in utilisation
The power-GDP intensity factor is a way to gauge the amount of electricity inputs required to
support a period of economic activities. Given that the majority of power users in China are
industrial users, power intensity tends to overshoot on either side during sudden changes in
GDP. For example, during 4Q08 and 1Q09, overall power demand was reported as negative
despite quarterly GDP at 7.6% and 6.6%, respectively. Another recent weakness was
recorded in 2Q-3Q12, whereby power demand growth was close to zero as a result of
continuing GDP slowdown that marked the end of the "8%" growth era. Most recently, we saw
a negative growth in power demand in August 2014, the first negative month since 2009.
Figure 15: Power demand vs GDP
Source: CEIC
Figure 16: Monthly power consumption growth (YoY)
Source: CEIC
-5.0%
5.0%
15.0%
25.0%
35.0%
4,000
4,500
5,000
5,500
6,000
6,500
199719981999200020012002200320042005200620072008200920102011201220132014
Thermal power demand Thermal power capacityThermal utilization hours (LHS)
Power shortage
Power oversupply
-1.0
-0.5
0.0
0.5
1.0
1.5
2.0
2.5
3.0
(10)
(5)
0
5
10
15
20
25(x)
(%)
Power gen YoY GDP growth Power-GDP Intensity factor (RHS)
(15)
(10)
(5)
0
5
10
15
20
25
30
Jan-F
eb 0
7
May-
07
Au
g-0
7
Nov-
07
Mar-
08
Jun-0
8
Se
p-0
8
Dec-
08
Ap
r-0
9
Jul-0
9
Oct
-09
Jan-F
eb 1
0
May-
10
Au
g-1
0
Nov-
10
Mar-
11
Jun-1
1
Se
p-1
1
Dec-
11
Ap
r-1
2
Jul-1
2
Oct
-12
Jan-F
eb 1
3
May-
13
Au
g-1
3
Nov-
13
Mar-
14
Jun-1
4
Se
p-1
4
Dec-
14
(%)

IDEAS ENGINE 7
China Power Sector
Stay in safer waters In a "fire and ice" era, we prefer power producers that can offer better visibility either through
government-mandated support or output protection driven by location-specific reasons, coupled
with protection of tariff risks. Therefore, the following groups stand out:
(1) Renewables such as wind power operators are positioned at sweet spots.
(2) Clean energy such as hydro power. Within hydro, we prefer low-cost producers exposed to
lower tariff cut risks.
(3) Local utilities with protective utilisation and potential to enter new power retail markets.
(4) Nuclear operators could face issues of lower utilisation hours with more flexible peak
functions.
The power of priority
Given the high cost and intermittency issues of renewable energy and non-stop features of nuclear
power, they are unlikely to be included in the power pool, in our view. China's current power dispatch
order protects the on-grid purchases of renewable energy and nuclear energy. According to the
policy, power grid companies are required to follow a pecking order of: (1) maximum purchase of
renewable energy (wind, solar, marine energy, hydro and renewables with no flexibility in power
generation adjustments), (2) hydro, biomass, geothermal and other renewables with flexibility of
adjustments, (3) nuclear power, (4) co-generation coal-fired power (power and heat), (5) gas-fired
power and coal gasification power, (6) coal-fired power and (7) oil-fired power.
Given the high cost and reliability issues of renewable energy and non-stop features of nuclear
power, they are unlikely to be included in the power pool, in our view. China's current power
dispatch order protects the on-grid purchases of renewable energy and nuclear energy.
Potential overhang for nuclear and hydro tariffs
Although nuclear and renewables may be free from pooling, tariff risks could emerge with
further downside adjustment of coal-fired tariffs, which are usually the benchmark prices.
1. Nuclear tariff
The on-grid tariffs of CGN's nuclear projects which commenced operation before 2013 were
determined project-by-project in accordance with fixed costs and operating costs. According to
NDRC's Circular on Relevant Issues Concerning Improving the On-grid Tariff Mechanism for
Nuclear, nuclear generating units (Gen-II) that started operations after 1 January 2013, will be
subject to a national benchmark no-grid tariff of Rmb0.43/kWh (including the 17% value-
added tax). However, it is worth noting that the tariff set for Hongyanhe's first two units has
been Rmb0.4142/kWh, which is same as the local benchmark tariff for coal-fired power before
the adjustment in September 2014.
Figure 17: China's electricity purchase priority list
Source: NDRC, Credit Suisse research
2. Hydro tariff
Hydro power tariffs were previously set on a plant-by-plant basis usually based on cost-plus
models (reasonable return based on budgeted capex and opex). However, China is working on
a different pricing option for hydro power designed for outer transmissions. The so-called
retrograde method is calculated by deducting on-grid selling tariff by transmission charges.
CYP's parentco's new plants—Xiluodu and Xiangjiaba—have much higher pricing than the
current Gezhouba and Three Gorges units given that the calculation is now benchmarking to the
new method. Similarly, the Yalong River projects (owned by SDIC and Chuantou) also enjoy this
calculation, although most hydro tariffs are still lower than coal-fired tariff, which is now at
Rmb400/MWh including VAT. The differences are slightly smaller, if we take into consideration
the hydro VAT rebates currently enforced.
Wind, solar, marine energy, hydro and other renewables (with no flexibility in power generation)
Hydro, biomass, geothermal and other renewables (with flexibility in power generation) & waste-to-energy
Nuclear power
Co-generation coal-fired power
Gas-fired power and coal gasification power
Coal-fired power (units with lower energy consumption and emissions have higher dispatch priority)
Oil-fired power

IDEAS ENGINE 8
China Power Sector
Sell the national IPPs In a world of safety for power gencos, we like: (1) Wind operators (top picks: Huaneng
Renewables and Longyuan), (2) Low-cost Hydro (China Yangtze Power) and (3) Local IPPs
protected by policies (top pick: Mengdian). We are negative on National IPPs (top sells:
Huaneng A/H, China Resources Power).
Figure 18: Recommendation summary of China power operators
POSITIVE NEGATIVE
Wind National IPPs
Huaneng Renewables (0958.HK) Huaneng Power-H (0902.HK) – top sell
Longyuan Power (0916.HK) Huaneng Power-A (600011.SS) – top sell
Low-cost hydro CR Power (0836.HK) – top sell
Yangtze Power (600900.SS) Datang Power-A (601991.SS)
Local IPPs Huadian Power-H (1071.HK) – downgrade to U/P
Jingneng (600578.SS) – initiation Huadian Power-A (600027.SS)
Mengdian (600863.SS) – initiation Nuclear
CGN Power (1816.HK) – downgrade to U/P
Source: Credit Suisse estimates
Figure 19: Matrix of volume/tariff visibility going into the power reform
Source: Credit Suisse estimates
Unsustainable valuation ahead of major headwinds
Following the recent share price strength, national IPPs are now trading at stretched multiples
with 12-month forward P/B nearing a five-year high despite likely pressure on future ROE. The
12-month dividend yield is also around 1 standard deviation below the five-year mean at around
4%. The current valuation could weaken the positive thesis of buying these names on the back
of near-term dividends. If we adjust the calculation to look at three-year forward multiples
(where we could see a meaningful downside in ROE), the multiple could become even more
stretched than the 12-month calculation.
Figure 20: National IPPs—one-year forward P/B history
Source: Bloomberg, Credit Suisse estimates, excluding Datang
0%
4%
8%
12%
16%
20%
0.4
0.6
0.8
1.0
1.2
1.4
1.6
Jan-10 Jan-11 Jan-12 Jan-13 Jan-14 Jan-15
ROE (RHS)
0.8x Avg-1SD
0.6x Avg-2SD
1.0x Avg
1.2x Avg+1SD
1.4x Avg+2SD
(x)

IDEAS ENGINE 9
China Power Sector
Inner Mongolia Mengdian Huaneng (600863.SS / 600863 CH)
Improving earnings with additional transmission
Dave Dai, CFA / 852 2101 7358 / [email protected]
Ran Ma / 852 2101 6653 / [email protected]
■ Initiate coverage with OUTPERFORM. We initiate coverage on Inner Mongolia Mengdian
Huaneng (Mengdian) with an OUTPERFORM rating and a DCF-based target price of
Rmb7.50. With all generation units (>90% is coal-fired power) located in Inner Mongolia
(one of the least oversupplied locations), Mengdian's earnings growth should be driven by:
(1) capacity and utilisation supported by outbound transmission; (2) cheaper tariffs leading
to marginal benefits of direct supplies or competitive bidding; and (3) strong local
background helping it bid in the event of a potential opening-up of local power retail assets.
■ Earnings to improve. While FY15 earnings are likely to be impacted by weak power
demand, additional ultra-high voltage transmission lines should help transmit most of the
output to other provinces, creating utilisation upside in FY16-17E. We forecast the time-
weighted attributable capacity to witness a 13% FY14-16E CAGR with ~4GW capacity
under construction, stronger than most national IPPs. Parentco may also inject other local
projects (~10% upside on FY16E capacity) but there is no firm timeline yet.
■ A power reform winner. Mengdian is well-positioned to protect its utilisation hours with
competitive tariffs for outbound transmission (cheaper than local destination tariff) under
reforms. Meanwhile, as a dominant power generator in Western Inner Mongolia,
participation in the power retail bidding (we estimate potential annual profit of Rmb1.9 bn at
3% net margin) is possible.
■ Resembling renewable energy. Even without injections and power retail, we expect
meaningful earnings turnaround in FY16-17 helped by new transmission. High visibility on
utilisation and supreme ROE (21% by FY17E) resemble characteristics of a renewable
energy player and justifies its higher multiple than national peers. Key downside risks are
lower-than-expected utilisation and tariffs.
Rating OUTPERFORM* Price (24 Apr 15, Rmb) 6.11 Target price (Rmb) 7.50¹ Upside/downside (%) 22.7 Mkt cap (Rmb mn) 35,485 (US$ 5,730) Enterprise value (Rmb mn) 60,501 Number of shares (mn) 5,807.74 Free float (%) 32.3 52-week price range 6.26 - 2.37 ADTO - 6M (US$ mn) 102.9 *Stock ratings are relative to the coverage universe in each
analyst's or each team's respective sector.
¹Target price is for 12 months.
Share price performance
The price relative chart measures performance against the
Shanghai Shenzhen CSI300 index which closed at 4807.59 on
24/04/15
On 24/04/15 the spot exchange rate was Rmb6.19/US$1
Performance over 1M 3M 12M Absolute (%) 32.8 46.5 156.7 Relative (%) 11.6 26.1 113.4
Financial and valuation metrics
Year 12/13A 12/14E 12/15E 12/16E Revenue (Rmb mn) 12,153.0 13,634.0 13,488.1 16,435.8 EBITDA (Rmb mn) 4,363.5 4,604.8 4,574.5 5,892.1 EBIT (Rmb mn) 2,669.3 2,781.5 2,218.6 3,409.9 Net profit (Rmb mn) 1,375.6 1,359.6 1,037.4 1,659.7 EPS (CS adj.) (Rmb) 0.36 0.23 0.18 0.29 Change from previous EPS (%) n.a. Consensus EPS (Rmb) n.a. 0.36 0.37 — EPS growth (%) -29.2 -34.1 -23.7 60.0 P/E (x) 17.2 26.1 34.2 21.4 Dividend yield (%) 2.4 3.3 3.1 2.3 EV/EBITDA (x) 12.0 13.1 13.4 10.0 P/B (x) 2.2 3.2 3.2 3.0 ROE (%) 13.2 12.4 9.4 14.5 Net debt/equity (%) 122.7 170.2 171.4 141.4
Source: Company data, Thomson Reuters, Credit Suisse estimates.
60
80
100
120
0
2
4
6
8
May-13 Sep-13 Jan-14 May-14 Sep-14 Jan-15
Price (LHS) Rebased Rel (RHS)

IDEAS ENGINE 10
China Power Sector
Beijing Jingneng Power Co Ltd (600578.SS / 600578 CH)
Strong asset injection theme
Dave Dai, CFA / 852 2101 7358 / [email protected]
Ran Ma / 852 2101 6653 / [email protected]
■ Initiate coverage with OUTPERFORM. We initiate coverage on Beijing Jingneng Power
(Jingneng) with an OUTPERFORM rating and an SOTP-based target price of Rmb10.0
(including asset injections). Jingneng has a portfolio of high quality coal-fired power units
with >60% of attributable capacity located in Inner Mongolia. Similar to Mengdian, Jingneng
should enjoy resilient utilisation hours for Inner Mongolia assets but the asset injection angle
should be more clear with parentco commitment by 2016.
■ Asset injection commitment. The company's output and earnings may be depressed in
FY15 given the scheduled shutdown of the Shijingshan (Beijing) project but capacity growth
should turn positive again with 6% and 11% in FY16 and FY17, respectively. Additionally,
the parentco has committed to inject additional assets before end of FY16 and we believe it
should be of the size of 4-5GW (>50%). The transaction should be supported by the light
balance sheet.
■ Power retail is only possible. Unlike Mengdian with the local government as one of the
indirect shareholders, Jingneng is ultimately controlled by the Beijing SASAC. Therefore,
the probability of acquiring local power retail business may be low despite its large capacity
exposure to Inner Mongolia. Additionally, Jingneng has 12% of its capacity in Ningxia,
which is also listed for the next batch of power reforms.
■ Compared with Mengdian. We have incorporated the injection potential in our SOTP
target price but no earnings contribution is built in considering limited details. We prefer
Jingneng to Mengdian given similar exposure to Inner Mongolia but better asset growth
opportunity with asset injection. Bidding for the power retail business would be a plus. Key
downside risks are lower-than-expected utilisation and tariffs.
Rating OUTPERFORM* Price (24 Apr 15, Rmb) 8.08 Target price (Rmb) 10.00¹ Upside/downside (%) 23.8 Mkt cap (Rmb mn) 37,308 (US$6,024 mn) Enterprise value (Rmb mn) 47,501 Number of shares (mn) 4,617.32 Free float (%) 21.4 52-week price range 8.08–3.23 ADTO - 6M (US$ mn) 68.7 *Stock ratings are relative to the coverage universe in each analyst's or each
team's respective sector.
¹Target price is for 12 months.
Share price performance
The price relative chart measures performance against the Shanghai
Shenzhen CSI300 index which closed at 4702.64 on 24/04/15
On 24/04/15 the spot exchange rate was Rmb6.19/US$1
Performance over 1M 3M 12M Absolute (%) 25.1 46.9 137.6 Relative (%) 6.7 16.6 20.7
Financial and valuation metrics
Year 12/14A 12/15E 12/16E 12/17E Revenue (Rmb mn) 12,964.0 10,962.0 11,371.6 14,054.1 EBITDA (Rmb mn) 4,899.2 4,055.1 4,135.8 5,526.4 EBIT (Rmb mn) 3,233.0 2,271.8 2,255.0 3,364.0 Net profit (Rmb mn) 2,551.0 2,115.5 2,050.4 2,527.9 EPS (CS adj.) (Rmb) 0.55 0.46 0.44 0.55 Change from previous EPS (%) n.a. Consensus EPS (Rmb) n.a. 0.43 — — EPS growth (%) 6.2 -17.1 -3.1 23.3 P/E (x) 14.6 17.6 18.2 14.8 Dividend yield (%) 2.5 2.0 1.9 2.4 EV/EBITDA (x) 9.5 11.7 11.5 8.3 P/B (x) 2.6 2.4 2.2 2.0 ROE (%) 18.5 14.1 12.5 14.2 Net debt/equity (%) 50.5 50.4 45.9 34.6
Source: Company data, Thomson Reuters, Credit Suisse estimates.
80
90
100
110
120
2
4
6
8
10
Apr-13 Aug-13 Dec-13 Apr-14 Aug-14 Dec-14
Price (LHS) Rebased Rel (RHS)
IDEAS ENGINE 11
China Power Sector
China Resources Power Holdings (0836.HK / 836 HK)
Unattractive risk-reward
Dave Dai, CFA / 852 2101 7358 / [email protected]
Ran Ma / 852 2101 6653 / [email protected]
■ Maintain UNDERPERFORM. We cut our target price for China Resources Power (CRP) to
HK$16.30 (from HK$17.00) based on 1.2x FY16E P/B (previously 1.3x FY15E P/B) as
we now use an average of stable- and slow-demand scenario to look at sustainable ROE
(12%) as in a slowing-demand scenario. Meanwhile, CRP does not have parent support on
further asset injections.
■ A potential survivor post consolidation. China aims for full liberalisation of power pricing
and when this happens, depressed tariffs could force the exit of uncompetitive smaller units
together with a large impairment (before full depreciation). Based on our calculation, around
16% of CRP's capacity consists of small units (<=300MW) which are not for power and
heat co-generation (less competitive and facing shut-down risks), which is much lower than
national IPP peers at 19-41%. This could make CRP a post-consolidation survivor but there
can be pain before gain with utilisation/tariff risks in the process.
■ Asset injection not a theme for CRP. Unlike other IPPs such as Huadian Power, Datang
Power and Huaneng Power, the parent company of CRP has little power generation assets
that can be injected into the listco. We expect the organic capacity growth for CRP would
also slow down from 11% CAGR in FY12-14 to 7% in FY15-17E given the prevailing
weakness in thermal power demand.
■ Valuation. Current FY15E P/B is higher than its past five-year average and may not be
sustainable with decreasing ROE (13% in FY17E). Key upside risks to our call include:
(1) better-than-expected thermal power utilisation in coastal regions; and (2) less-than-
expected tariff cut for coal-fired power.
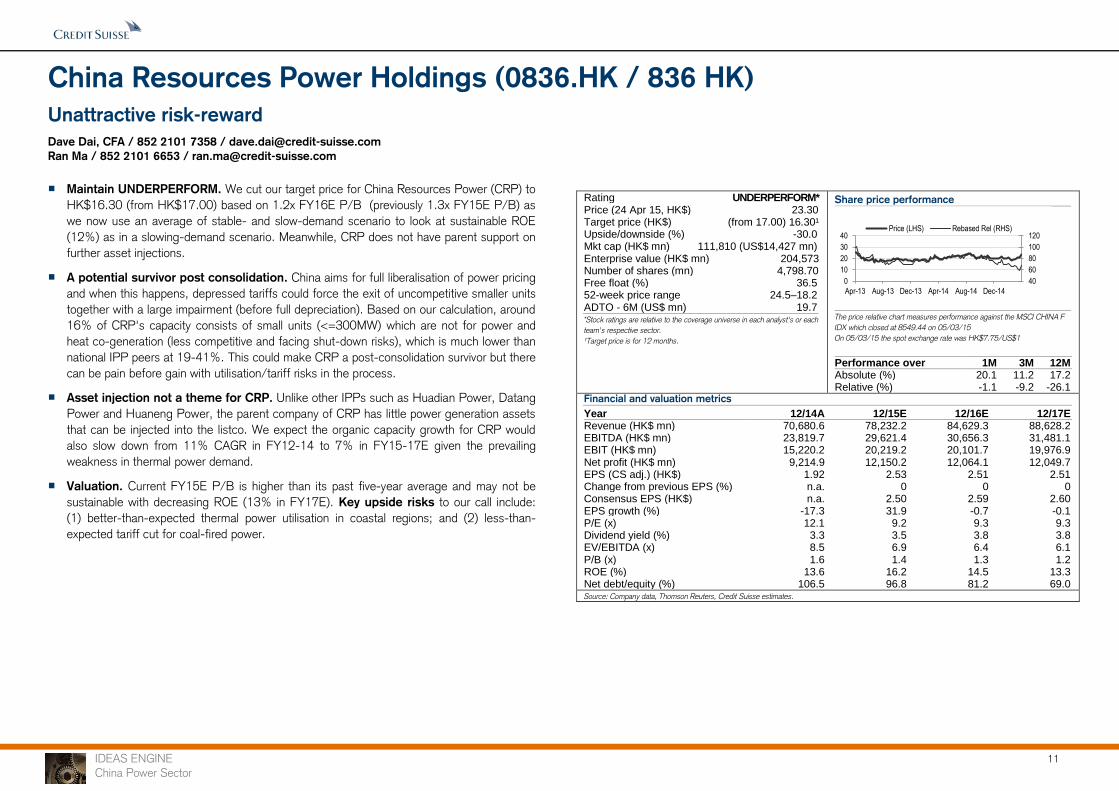
Rating UNDERPERFORM* Price (24 Apr 15, HK$) 23.30 Target price (HK$) (from 17.00) 16.30¹ Upside/downside (%) -30.0 Mkt cap (HK$ mn) 111,810 (US$14,427 mn) Enterprise value (HK$ mn) 204,573 Number of shares (mn) 4,798.70 Free float (%) 36.5 52-week price range 24.5–18.2 ADTO - 6M (US$ mn) 19.7 *Stock ratings are relative to the coverage universe in each analyst's or each
team's respective sector.
¹Target price is for 12 months.
Share price performance
The price relative chart measures performance against the MSCI CHINA F
IDX which closed at 8549.44 on 05/03/15
On 05/03/15 the spot exchange rate was HK$7.75/US$1
Performance over 1M 3M 12M Absolute (%) 20.1 11.2 17.2 Relative (%) -1.1 -9.2 -26.1
Financial and valuation metrics
Year 12/14A 12/15E 12/16E 12/17E Revenue (HK$ mn) 70,680.6 78,232.2 84,629.3 88,628.2 EBITDA (HK$ mn) 23,819.7 29,621.4 30,656.3 31,481.1 EBIT (HK$ mn) 15,220.2 20,219.2 20,101.7 19,976.9 Net profit (HK$ mn) 9,214.9 12,150.2 12,064.1 12,049.7 EPS (CS adj.) (HK$) 1.92 2.53 2.51 2.51 Change from previous EPS (%) n.a. 0 0 0 Consensus EPS (HK$) n.a. 2.50 2.59 2.60 EPS growth (%) -17.3 31.9 -0.7 -0.1 P/E (x) 12.1 9.2 9.3 9.3 Dividend yield (%) 3.3 3.5 3.8 3.8 EV/EBITDA (x) 8.5 6.9 6.4 6.1 P/B (x) 1.6 1.4 1.3 1.2 ROE (%) 13.6 16.2 14.5 13.3 Net debt/equity (%) 106.5 96.8 81.2 69.0
Source: Company data, Thomson Reuters, Credit Suisse estimates.
40
60
80
100
120
0
10
20
30
40
Apr-13 Aug-13 Dec-13 Apr-14 Aug-14 Dec-14
Price (LHS) Rebased Rel (RHS)

IDEAS ENGINE 12
China Power Sector
Huaneng Power International Inc (0902.HK / 902 HK)
The worst is yet to come
Dave Dai, CFA / 852 2101 7358 / [email protected]
Ran Ma / 852 2101 6653 / [email protected]
■ One of the top sells. We cut our target price for Huaneng Power (HNP) to HK$7.30
(from HK$7.70) based on 1.0x FY16E P/B (previously 1.2x FY15E P/B) as we now use
an average of stable- and slow-demand scenario to look at sustainable ROE (10.5%). In
the slow demand scenario, ROE can average ~8.7% in FY16-20 given HNP's higher
exposure to smaller units (shutdown risks). We have not cut earnings to reflect the slow-
demand scenario but further weak signs could impact valuation ahead of earnings.
■ Painful industry consolidation. China aims for full liberalisation of power pricing and
when this happens, depressed tariffs could force the exit of uncompetitive smaller units
together with a large impairment (before full depreciation). The tariffs for HNP's direct
supplied power in 2014 (8-10% lower on average) is a very strong early signal of what
market forces can do. Based on our calculation, close to 40% of HNP's capacity consists
of small units (<=300MW) and 89% of such units are not for power and heat co-
generation, which may be less competitive and face shutdown risks.
■ Asset injection limited. After the asset injection at end-2014, we expect limited profitable
assets to be injected into HNP in the near term, based on our analysis of the parentco's
unlisted assets. Besides, the total unlisted thermal capacity represents only 58% of HNP's
capacity (2013 data), lower than peers at over 100%.
■ Valuation unattractive. The stock is currently trading at 1.7x 2015E P/B, much higher
than its five-year historical average of 1.1x, unjustified given our projected long-term ROE
of 11%. The key upside risks to our forecasts are better-than-expected utilisation hours
and later-than-expected tariff cuts.
Rating UNDERPERFORM* Price (24 Apr 15, HK$) 11.30 Target price (HK$) (from 7.70) 7.30¹ Upside/downside (%) -35.4 Mkt cap (HK$ mn) 188,313 (US$24,298 mn) Enterprise value (Rmb mn) 316,747 Number of shares (mn) 14,420.38 Free float (%) 48.7 52-week price range 11.66–7.57 ADTO - 6M (US$ mn) 37.5 *Stock ratings are relative to the coverage universe in each analyst's or each
team's respective sector.
¹Target price is for 12 months.
Share price performance
The price relative chart measures performance against the MSCI CHINA F
IDX which closed at 8549.44 on 24/04/15
On 24/04/15 the spot exchange rate was HK$7.75/US$1
Performance over 1M 3M 12M Absolute (%) 28.7 0.5 46.0 Relative (%) 7.5 -19.9 2.7
Financial and valuation metrics
Year 12/14A 12/15E 12/16E 12/17E Revenue (Rmb mn) 125,406.9 137,510.3 137,490.2 143,090.8 EBITDA (Rmb mn) 36,921.3 39,820.2 37,649.0 38,999.2 EBIT (Rmb mn) 25,274.6 26,748.9 23,560.7 24,464.7 Net profit (Rmb mn) 10,672.2 12,067.0 10,816.0 11,558.8 EPS (CS adj.) (Rmb) 0.75 0.84 0.75 0.80 Change from previous EPS (%) n.a. 0 0 0 Consensus EPS (Rmb) n.a. 0.92 0.94 0.91 EPS growth (%) 1.6 11.0 -10.4 6.9 P/E (x) 12.0 10.8 12.0 11.3 Dividend yield (%) 4.2 5.1 4.6 4.9 EV/EBITDA (x) 7.9 8.0 8.2 7.6 P/B (x) 1.8 1.7 1.6 1.5 ROE (%) 16.1 16.6 13.8 13.9 Net debt/equity (%) 167.4 174.3 152.6 132.4
Source: Company data, Thomson Reuters, Credit Suisse estimates.
60
80
100
120
6
8
10
12
14
Apr-13 Aug-13 Dec-13 Apr-14 Aug-14 Dec-14
Price (LHS) Rebased Rel (RHS)

IDEAS ENGINE 13
China Power Sector
Huaneng Power International Inc (600011.SS / 600011 CH)
Stay negative
Dave Dai, CFA / 852 2101 7358 / [email protected]
Ran Ma / 852 2101 6653 / [email protected]
■ Maintain UNDERPERFORM. We cut our target price for Huaneng Power-A (HNP-A) to
Rmb5.80 (from Rmb6.20) based on 1.0x FY16E P/B (previously 1.2x FY15E P/B) as we
now use an average of stable- and slow-demand scenario to look at sustainable ROE
(10.5%). In the slow demand scenario, ROE can average ~8.7% in FY16-20 given HNP's
higher exposure to smaller units (shutdown risks). We have not cut earnings to reflect the
slow-demand scenario but further weak signs could impact valuation ahead of earnings.
■ Painful industry consolidation. China aims for full liberalisation of power pricing and
when this happens, depressed tariffs could force the exit of uncompetitive smaller units
together with a large impairment (before full depreciation). The tariffs for HNP's direct
supplied power in 2014 (8-10% lower on average) is a very strong early signal of what
market forces can do. Based on our calculation, close to 40% of HNP's capacity consists
of small units (<=300MW) and 89% of such units are not for power and heat co-
generation, which may be less competitive and face shut-down risks.
■ Asset injection limited. After the asset injection at end-2014, we expect limited profitable
assets to be injected into HNP in the near term, based on our analysis of the parentco's
unlisted assets. Besides, the total unlisted thermal capacity represents only 58% of HNP's
capacity (2013 data), lower than peers at over 100%.
■ Valuation unattractive. The stock is currently trading at 2.0x 2015E P/B, much higher
than its five-year historical average of 1.1x, unjustified given our projected long-term ROE
of 11%. The key upside risks to our forecasts are better-than-expected utilisation hours
and later-than-expected tariff cuts.
Rating UNDERPERFORM* Price (24 Apr 15, Rmb) 10.96 Target price (Rmb) (from 6.20) 5.80¹ Upside/downside (%) -47.1 Mkt cap (Rmb mn) 150,480 (US$ 24,298) Enterprise value (Rmb mn) 316,747 Number of shares (mn) 14,420.38 Free float (%) 48.7 52-week price range 10.96 - 5.27 ADTO - 6M (US$ mn) 37.5 *Stock ratings are relative to the coverage universe in each analyst's or each
team's respective sector.
¹Target price is for 12 months.
Share price performance
The price relative chart measures performance against the Shanghai
Shenzhen CSI300 index which closed at 4702.64 on 24/04/15
On 24/04/15 the spot exchange rate was Rmb6.19/US$1
Performance over 1M 3M 12M Absolute (%) 34.0 29.4 105.2 Relative (%) 12.8 9.0 62.0
Financial and valuation metrics
Year 12/14A 12/15E 12/16E 12/17E Revenue (Rmb mn) 125,406.9 137,510.3 137,490.2 143,090.8 EBITDA (Rmb mn) 36,921.3 39,820.2 37,649.0 38,999.2 EBIT (Rmb mn) 25,274.6 26,748.9 23,560.7 24,464.7 Net profit (Rmb mn) 10,672.2 12,067.0 10,816.0 11,558.8 EPS (CS adj.) (Rmb) 0.75 0.84 0.75 0.80 Change from previous EPS (%) n.a. 0 0 0 Consensus EPS (Rmb) n.a. 0.92 0.95 0.93 EPS growth (%) 1.6 11.0 -10.4 6.9 P/E (x) 14.5 13.1 14.6 13.7 Dividend yield (%) 3.5 4.2 3.8 4.0 EV/EBITDA (x) 7.9 8.0 8.2 7.6 P/B (x) 2.2 2.1 2.0 1.8 ROE (%) 16.1 16.6 13.8 13.9 Net debt/equity (%) 167.4 174.3 152.6 132.4
Source: Company data, Thomson Reuters, Credit Suisse estimates.
60
80
100
120
4
6
8
10
12
Apr-13 Aug-13 Dec-13 Apr-14 Aug-14 Dec-14
Price (LHS) Rebased Rel (RHS)

IDEAS ENGINE 14
China Power Sector
CGN Power Co., Ltd. (1816.HK / 1816 HK)
Downgrade to UNDERPERFORM with rising risks
Dave Dai, CFA / 852 2101 7358 / [email protected]
Ran Ma / 852 2101 6653 / [email protected]
■ Downgrade rating. We downgrade CGN Power (CGN) to UNDERPERFORM from
Neutral with China's introduction of peaking functions and possible delays in the Taishan
project. The stock is now trading at 26x FY15 P/E with little yield and one of the most
expensive large-cap global utilities names. We incorporated the newly approved Hongyanhe
Phase II project but the revised DCF-based target price of HK$3.40 still implies significant
downside.
■ Expectations are rich. We believe that the market is forecasting stable utilisation hours
across different locations but the recent reform document suggests the possibility of
peaking functions going forward, which implies possible utilisation downside. China has
started to investigate the equipment risks of the Taishan EPR project (10% of FY17E
attributable capacity) after receiving a warning from the French nuclear authority. We cut
our FY16-17 EPS forecasts by 4-6% on lower utilisation for Hongyanhe (very oversupplied)
after FY16 and delayed operation of Taishan by 12 months.
■ Not a lot left for immediate earnings upside. After Taishan, the parentco still owns the
Fangchenggang (Guangxi) project, if the project is injected, it could create ~9% attributable
capacity upside. Any new approval (such as the case of Hongyanhe Phase II) will take 5-6
years of construction time and contribute no earnings in the medium term. If Taishan is
delayed, it could push back the capacity growth beyond our forecast 2H16.
■ Rarity has a price. As the only listed pure nuclear operator in China, CGN is enjoying a
large scarcity premium, which we see as unjustified with rising earnings risks. Upside
investment risks are higher utilisation hours.
Rating (from Neutral) UNDERPERFORM* [V] Price (24 Apr 15, HK$) 4.48 Target price (HK$) (from 3.20) 3.40¹ Upside/downside (%) -24.1 Mkt cap (HK$ mn) 203,610 (US$ 26,272) Enterprise value (Rmb mn) 276,716 Number of shares (mn) 45,448.75 Free float (%) 41.6 52-week price range 4.65 - 3.07 ADTO - 6M (US$ mn) 86.6 *Stock ratings are relative to the coverage universe in each analyst's or each
team's respective sector.
¹Target price is for 12 months.
[V] = Stock considered volatile (see Disclosure Appendix).
Share price performance
The price relative chart measures performance against the MSCI CHINA F
IDX which closed at 8650.86 on 24/04/15
On 24/04/15 the spot exchange rate was HK$7.75/US$1
Performance over 1M 3M 12M Absolute (%) 40.9 43.1 — Relative (%) 20.1 22.7 —
Financial and valuation metrics
Year 12/14A 12/15E 12/16E 12/17E Revenue (Rmb mn) 20,793.3 21,760.8 26,248.4 32,901.2 EBITDA (Rmb mn) 12,446.3 13,402.2 15,786.2 19,452.9 EBIT (Rmb mn) 9,826.3 10,523.1 12,318.5 14,714.1 Net profit (Rmb mn) 5,712.2 6,185.8 7,151.2 8,193.2 EPS (CS adj.) (Rmb) 0.13 0.14 0.16 0.18 Change from previous EPS (%) n.a. -0.4 -5.5 -4.1 Consensus EPS (Rmb) n.a. 0.14 0.17 0.20 EPS growth (%) -18.0 8.3 15.6 14.6 P/E (x) 28.5 26.3 22.8 19.9 Dividend yield (%) 0.1 1.3 1.5 1.7 EV/EBITDA (x) 17.2 20.6 17.9 14.2 P/B (x) 3.2 3.0 2.7 2.5 ROE (%) 15.5 11.7 12.5 13.1 Net debt/equity (%) 85.5 151.7 145.9 127.4
Source: Company data, Thomson Reuters, Credit Suisse estimates.
80
90
100
110
120
2
3
4
5
6
Dec-14 Apr-15
Price (LHS) Rebased Rel (RHS)
IDEAS ENGINE 15
China Power Sector
Companies Mentioned (Price as of 27-Apr-2015)
Beijing Enterprises Holdings (0392.HK, HK$71.65) Beijing Jingneng Power Co Ltd (600578.SS, Rmb8.11, OUTPERFORM, TP Rmb10.0) CGN Power Co., Ltd. (1816.HK, HK$4.55, UNDERPERFORM[V], TP HK$3.4) CLP Holdings Limited (0002.HK, HK$68.25) Cheung Kong Infrastructure (1038.HK, HK$65.1) China Datang Renewables Power (1798.HK, HK$1.31) China Gas Holdings Ltd (0384.HK, HK$14.12) China Resources Gas (1193.HK, HK$27.15) China Resources Power Holdings (0836.HK, HK$23.75, UNDERPERFORM, TP HK$16.3) China Suntien Green Energy Corporation (0956.HK, HK$2.07) China Yangtze Power Co Ltd (600900.SS, Rmb13.09, OUTPERFORM, TP Rmb14.8) Datang International Power Generation Co. Ltd. (0991.HK, HK$4.89) Datang International Power Generation Co. Ltd. (601991.SS, Rmb8.35) ENN Energy Holdings Ltd (2688.HK, HK$58.8) Hong Kong Electric Investments (2638.HK, HK$5.22) Hong Kong and China Gas (0003.HK, HK$18.68) Huadian Fuxin Energy Corporation Limited (0816.HK, HK$4.37, OUTPERFORM, TP HK$5.5) Huadian Power International (600027.SS, Rmb8.89, UNDERPERFORM, TP Rmb5.1) Huadian Power International (1071.HK, HK$8.73, UNDERPERFORM, TP HK$6.4) Huaneng Power International Inc (600011.SS, Rmb11.5, UNDERPERFORM, TP Rmb5.8) Huaneng Power International Inc (0902.HK, HK$11.36, UNDERPERFORM, TP HK$7.3) Huaneng Renewables Corporation (0958.HK, HK$3.4, OUTPERFORM, TP HK$4.0) Inner Mongolia MengDian HuaNeng Thermal (600863.SS, Rmb6.13, OUTPERFORM, TP Rmb8.0) Longyuan Power (0916.HK, HK$9.93, OUTPERFORM, TP HK$11.5) Power Assets Holdings Limited (0006.HK, HK$78.5) SDIC Power Holdings (600886.SS, Rmb12.9) Shenzhen Gas Corporation Ltd. (601139.SS, Rmb12.31) Sichuan Chuantou Energy (600674.SS, Rmb25.94)
Disclosure Appendix
Important Global Disclosures
The analysts identified in this report each certify, with respect to the companies or securities that the individual analyzes, that (1) the views expressed in this report accurately reflect his or her personal views about all of the subject companies and securities and (2) no part of his or her compensation was, is or will be directly or indirectly related to the specific recommendations or views expressed in this report.
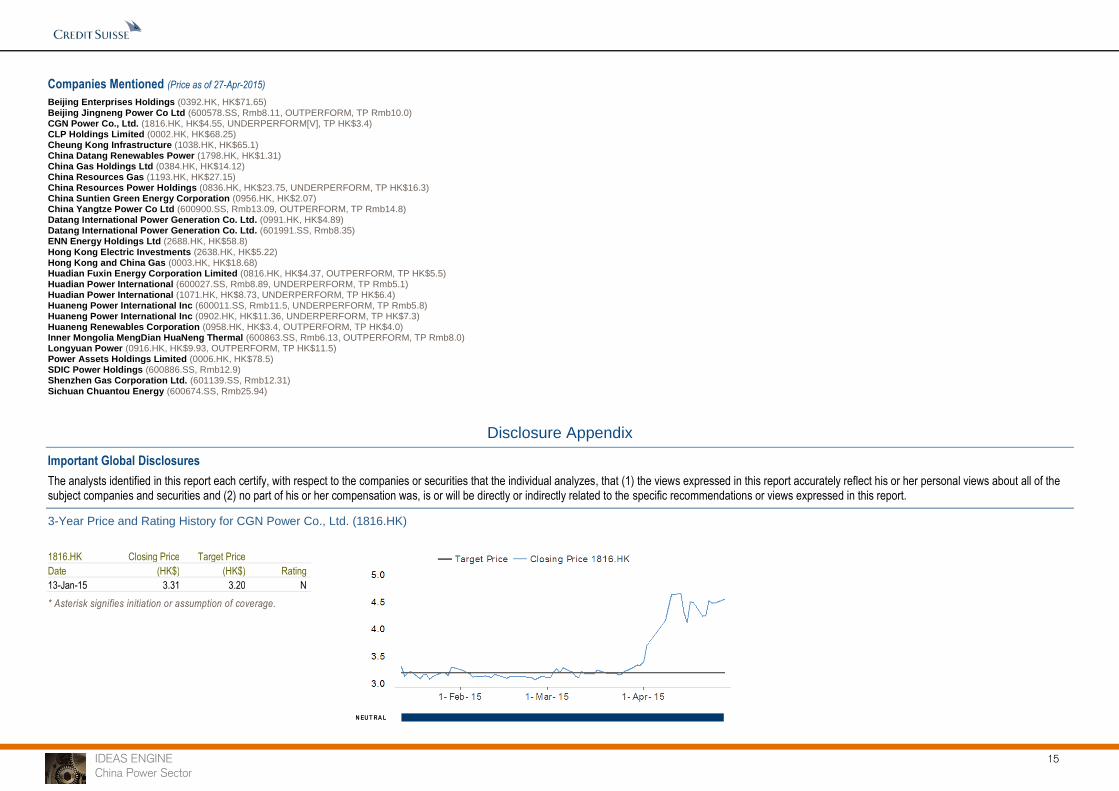
3-Year Price and Rating History for CGN Power Co., Ltd. (1816.HK)
1816.HK Closing Price Target Price
Date (HK$) (HK$) Rating
13-Jan-15 3.31 3.20 N
* Asterisk signifies initiation or assumption of coverage.
N EU T RA L

IDEAS ENGINE 16
China Power Sector
3-Year Price and Rating History for China Resources Power Holdings (0836.HK)
0836.HK Closing Price Target Price
Date (HK$) (HK$) Rating
21-Aug-12 17.06 19.00 O
03-Oct-12 16.78 19.70
19-Mar-13 22.65 23.00
11-Apr-13 23.90 28.00
27-Nov-13 18.78 22.00 *
18-Mar-14 19.24 23.50
21-Apr-14 21.00 23.50 N
18-Aug-14 22.20 25.00
14-Oct-14 20.80 22.00
11-Mar-15 19.22 17.00 U
* Asterisk signifies initiation or assumption of coverage.
O U T PERFO RM
N EU T RA L
U N D ERPERFO RM
3-Year Price and Rating History for China Yangtze Power Co Ltd (600900.SS)
600900.SS Closing Price Target Price
Date (Rmb) (Rmb) Rating
30-Apr-12 6.48 8.30 O
01-Nov-12 6.46 8.50
02-May-13 7.13 8.60
02-Sep-13 6.71 8.30
21-May-14 5.97 7.60
22-May-14 6.04 *
26-Sep-14 7.79 9.50 O
13-Jan-15 10.55 12.20
* Asterisk signifies initiation or assumption of coverage. O U T PERFO RM

IDEAS ENGINE 17
China Power Sector
3-Year Price and Rating History for Huadian Fuxin Energy Corporation Limited (0816.HK)
0816.HK Closing Price Target Price
Date (HK$) (HK$) Rating
03-Mar-14 4.24 5.20 O *
25-Mar-14 3.80 5.30
* Asterisk signifies initiation or assumption of coverage.
O U T PERFO RM
3-Year Price and Rating History for Huadian Power International (600027.SS)
600027.SS Closing Price Target Price
Date (Rmb) (Rmb) Rating
15-Oct-14 3.97 4.92 O
13-Jan-15 6.18 5.70 U
11-Mar-15 5.80 5.10
31-Mar-15 6.80 5.20
* Asterisk signifies initiation or assumption of coverage.
O U T PERFO RM
U N D ERPERFO RM

IDEAS ENGINE 18
China Power Sector
3-Year Price and Rating History for Huadian Power International (1071.HK)
1071.HK Closing Price Target Price
Date (HK$) (HK$) Rating
15-Oct-14 5.49 6.20 O
13-Jan-15 6.45 7.10
11-Mar-15 6.39 6.40 N
31-Mar-15 6.45 6.60
* Asterisk signifies initiation or assumption of coverage.
O U T PERFO RM
N EU T RA L
3-Year Price and Rating History for Huaneng Power International Inc (600011.SS)
600011.SS Closing Price Target Price
Date (Rmb) (Rmb) Rating
14-Oct-14 6.20 5.95 N *
13-Jan-15 8.25 6.90 U
11-Mar-15 7.58 6.20
* Asterisk signifies initiation or assumption of coverage.
N EU T RA L
U N D ERPERFO RM

IDEAS ENGINE 19
China Power Sector
3-Year Price and Rating History for Huaneng Power International Inc (0902.HK)
0902.HK Closing Price Target Price
Date (HK$) (HK$) Rating
02-Aug-12 5.62 5.85 O
03-Oct-12 5.88 7.10
10-Apr-13 8.37 9.00
24-Apr-13 8.80 9.40
27-Nov-13 7.43 6.40 U *
30-Jul-14 8.73 7.40
14-Oct-14 8.90 7.50 *
13-Jan-15 10.84 8.60
11-Mar-15 8.89 7.70
* Asterisk signifies initiation or assumption of coverage.
O U T PERFO RM
U N D ERPERFO RM
3-Year Price and Rating History for Huaneng Renewables Corporation (0958.HK)
0958.HK Closing Price Target Price
Date (HK$) (HK$) Rating
03-Mar-14 3.45 4.05 O *
10-Apr-14 2.63 3.65
19-Mar-15 2.79 3.55
10-Apr-15 3.20 3.80
* Asterisk signifies initiation or assumption of coverage.
O U T PERFO RM

IDEAS ENGINE 20
China Power Sector
3-Year Price and Rating History for Longyuan Power (0916.HK)
0916.HK Closing Price Target Price
Date (HK$) (HK$) Rating
13-May-12 5.84 6.95 O
29-Aug-12 5.08 6.32
05-Nov-12 5.08 6.19
17-Dec-12 5.23 6.10
12-Mar-13 6.51 7.08 N
25-Nov-13 10.10 12.30 O *
03-Mar-14 9.61 12.60
18-Mar-14 7.93 11.90
20-Aug-14 8.57 10.50
* Asterisk signifies initiation or assumption of coverage.
O U T PERFO RM
N EU T RA L
The analyst(s) responsible for preparing this research report received Compensation that is based upon various factors including Credit Suisse's total revenues, a portion of which are generated by Credit Suisse's investment banking activities
As of December 10, 2012 Analysts’ stock rating are defined as follows:
Outperform (O) : The stock’s total return is expected to outperform the relevant benchmark*over the next 12 months.
Neutral (N) : The stock’s total return is expected to be in line with the relevant benchmark* over the next 12 months.
Underperform (U) : The stock’s total return is expected to underperform the relevant benchmark* over the next 12 months.
*Relevant benchmark by region: As of 10th December 2012, Japanese ratings are based on a stock’s total return relative to the analyst's coverage universe which consists of all companies covered by the analyst within the relevant sector, with Outperforms representing the most attractive, Neutrals the less attractive, and Underperforms the least attractive investment opportunities. As of 2nd October 2012, U.S. and Canadian as well as European ratings are based on a stock’s total return relative to the analyst's coverage universe which consists of all companies covered by the analyst within the relevant sector, with Outperforms representing the most attractive, Neutra ls the less attractive, and Underperforms the least attractive investment opportunities. For Latin American and non-Japan Asia stocks, ratings are based on a stock’s total return relative to the average total return of the relevant country or regional ben chmark; prior to 2nd October 2012 U.S. and Canadian ratings were based on (1) a stock’s absolute total return potential to its current share price and (2) the relative attractiveness of a stock’s total return potential within an analyst’s coverage universe . For Australian and New Zealand stocks, 12-month rolling yield is incorporated in the absolute total return calculation and a 15% and a 7.5% threshold replace the 10-15% level in the Outperform and Underperform stock rating definitions, respectively. The 15% and 7.5% thresholds replace the +10-15% and -10-15% levels in the Neutral stock rating definition, respectively. Prior to 10th December 2012, Japanese ratings were based on a stock’s total return relative to the average total return of the relevant country or regional benchmark.
Restricted (R) : In certain circumstances, Credit Suisse policy and/or applicable law and regulations preclude certain types of communications, including an investment recommendation, during the course of Credit Suisse's engagement in an investment banking transaction and in certain other circumstances.
Volatility Indicator [V] : A stock is defined as volatile if the stock price has moved up or down by 20% or more in a month in at least 8 of the past 24 months or the analyst expects significant volatility going forward.
Analysts’ sector weightings are distinct from analysts’ stock ratings and are based on the analyst’s expectations for the fundamentals and/or valuation of the sector* relative to the group’s historic fundamentals and/or valuation:
Overweight : The analyst’s expectation for the sector’s fundamentals and/or valuation is favorable over the next 12 months.
Market Weight : The analyst’s expectation for the sector’s fundamentals and/or valuation is neutral over the next 12 months.
Underweight : The analyst’s expectation for the sector’s fundamentals and/or valuation is cautious over the next 12 months.
*An analyst’s coverage sector consists of all companies covered by the analyst within the relevant sector. An analyst may cover multiple sectors.

IDEAS ENGINE 21
China Power Sector
Credit Suisse's distribution of stock ratings (and banking clients) is:
Global Ratings Distribution
Rating Versus universe (%) Of which banking clients (%)
Outperform/Buy* 43% (53% banking clients)
Neutral/Hold* 38% (50% banking clients)
Underperform/Sell* 16% (44% banking clients)
Restricted 3%
*For purposes of the NYSE and NASD ratings distribution disclosure requirements, our stock ratings of Outperform, Neutral, and Underperform most closely correspond to B uy, Hold, and Sell, respectively; however, the meanings are not the same, as our stock ratings are determined on a relative basis. (Please refer to definitions above.) An investor's decision to buy or sell a security should be based on investment objective s, current holdings, and other individual factors.
Credit Suisse’s policy is to update research reports as it deems appropriate, based on developments with the subject company, the sector or the market that may have a material impact on the research views or opinions stated herein.
Credit Suisse's policy is only to publish investment research that is impartial, independent, clear, fair and not misleading. For more detail please refer to Credit Suisse's Policies for Managing Conflicts of Interest in connection with Investment Research: http://www.csfb.com/research-and-analytics/disclaimer/managing_conflicts_disclaimer.html
Credit Suisse does not provide any tax advice. Any statement herein regarding any US federal tax is not intended or written to be used, and cannot be used, by any taxpayer for the purposes of avoiding any penalties.
Price Target: (12 months) for CGN Power Co., Ltd. (1816.HK)
Method: Our target price of HK$3.40 for CGN Power is based on discounted cash flow method with a WACC of 7% (cost of equity of 11% and cost of debt of 4.5%, debt to equity ratio of 1.5x) as well as zero
terminal growth.
Risk: Key risks to our target price of HK$3.40 for CGN Power includes: (1) drop of utilisaiton hours; (2) change of national nuclear policies; (3) nuclear accidents worldwide; (4) increase in the fuel costs and other costs
as well as (5) delay of construction schedule of nuclear
Price Target: (12 months) for China Yangtze Power Co Ltd (600900.SS)
Method: We arrive at our target price for China Yangtze Power by using DCF model, as we believe operating cash flow best captures the company's mid- to long-term growth profile. Our WACC of 8.3% with
terminal growth of 0% suggest a fair price of Rmb10.7 for the stock (without injection), and a target price of Rmb14.8 (with injection).
Risk: The following are the risks to our target price: (1) volatilities in hydro resources, (2) changes in interest rate (3) a delay in asset injection or no injection would surprise the market negatively.
Price Target: (12 months) for Huaneng Power International Inc (600011.SS)
Method: Our target price of Rmb5.8 for Huaneng Power International Inc (A) is based on a P/B (price-to-book) of 1.0x backed by a sustainable ROE (return on equity) of 10.5%..
Risk: Risks that could cause the share price to diverge from our Rmb5.8 target price for Huaneng Power International Inc include: (1) worse-than-expected thermal utilisation in coastal areas; and (2) coal price rebound.
Price Target: (12 months) for Huadian Power International (600027.SS)
Method: Our target price of Rmb5.1 for Huadian Power International (A) is based on a P/B (price-to-book) of 1.2x backed by a sustainable ROE (return on equity) of 11%.
Risk: Risks that could impede achievement target price of Rmb5.1 for Huadian Power International (A) include: (1) thermal utlisation; and (2) uncertainty on asset injections.

IDEAS ENGINE 22
China Power Sector
Price Target: (12 months) for Huaneng Power International Inc (0902.HK)
Method: We use P/B (price-to-book) valuation to derive our target price of HK$7.30 for Huaneng Power International Inc (H). We assume a long-term ROE (return on equity) of 11.1%, which implies a FY16 P/B of
1.0x.
Risk: Risks to our HK$7.30 target price for Huaneng Power International Inc (H) include: (1) faster-than-expected capacity growth; (2) lower-than-expected coal prices; (3) better-than expected utilisation hours.
Price Target: (12 months) for China Resources Power Holdings (0836.HK)
Method: Our target price of HK$16.30 for CRP is based on the sum-of-the-parts valuation. We use 1.2x FY16 P/B (price-to-book) ratio for the power generation business and DCF (discounted cash flow)
methodology for coal mining.
Risk: Risks to our target price of HK$16.30 for CRP include: (1) Better-than-expected thermal power utilisation in coastal regions; and (2) less-than-expected tariff cuts for coal-fired power.
Price Target: (12 months) for Huadian Power International (1071.HK)
Method: Our target price of HK$6.4 for Huadian Power International (H) is derived from a price-to-book (P/B) methodology with a target P/B of 1.2x backed by a sustainable ROE (return on equity) of 12%.
Risk: Risks that could impede achievement of our target price of HK$6.4 for Huadian Power International include: (1) coal price increase in 2015; (2) worse-than-expected thermal power utlisation in 2015-16; (3)
uncertain details for asset injections.
Price Target: (12 months) for Huaneng Renewables Corporation (0958.HK)
Method: Our HK$ 4.00 target price for Huaneng Renewables is based on discounted cash flow method with a WACC of 7% and terminal growth rate of 2%. We use 12% cost of equity and 5% after tax cost of
debt. The terminal value takes up 90% in our total DCF valuation.
Risk: Key investment risks to our target price of HK$4.00 for Huaneng Renewables include: (1) slower-than-expected capacity growth; (2) volatile wind resources and utilisation hours; and (3) further impairment of
assets.
Price Target: (12 months) for Longyuan Power (0916.HK)
Method: Our HK$11.5 for Longyuan Power Group is based on DCF. Our WACC of 8% is based on a cost of equity of 12% and a post-tax cost of debt of 4%. The terminal growth we assume is 2%.
Risk: Key risks to our target price of HK$11.5 for Longyuan Power include: (1) lower-than-expected capacity growth; (2) worse-than-expected utilisation hours; and (3) potential wind power tariff cut in 2015 or later.
Price Target: (12 months) for Huadian Fuxin Energy Corporation Limited (0816.HK)
Method: Our HK$5.50 target price for Huadian Fuxin Energy Corp. is based on discounted cash flow method with a WACC of 8% and terminal growth rate of 1%. We use 12% cost of equity and 5.5% after tax
cost of debt. The terminal value takes up 80% in our total DCF valuation.
Risk: Key risks to our target price of HK$5.50 for Huadian Fuxin Energy Corp. include: (1) slower-than-expected wind power capacity growth; (2) volatile wind and hydro resources; and (3) more-than-expected cut of
coal-fired tariff.

IDEAS ENGINE 23
China Power Sector
Price Target: (12 months) for Inner Mongolia MengDian HuaNeng Thermal (600863.SS)
Method: The target price of Rmb 8.0 for Inner Mongolia MengDian HuaNeng Thermal is based on discounted cash flow method. We use 8% WACC and zero terminal growth.
Risk: Key risks to our target price of Rmb 8.0 for Inner Mongolia MengDian HuaNeng Thermal includes: (1) lower tariff and (2) lower utilisation hours.
Price Target: (12 months) for Beijing Jingneng Power Co Ltd (600578.SS)
Method: The target price of Rmb 10.0 for Beijing Jingneng Power Co Ltd is based on sum-of-the-parts method. We values existing pipeline at Rmb 8.90/share and asset injection at Rmb 1.00/share.
Risk: Key risks to our SOTP-based target price of Rmb 10.0 for Beijing Jingneng Power Co Ltd includes: (1) lower-than-expected tariff; (2) lower-than-expected utilisation hours; (3) delay of asset injections.
Please refer to the firm's disclosure website at https://rave.credit-suisse.com/disclosures for the definitions of abbreviations typically used in the target price method and risk sections.
See the Companies Mentioned section for full company names
The subject company (1816.HK, 0902.HK, 0836.HK, 1071.HK, 0958.HK, 0916.HK, 0816.HK, 600863.SS, 0002.HK, 0006.HK, 0392.HK, 0991.HK, 1038.HK, 1798.HK, 601139.SS, 601991.SS) currently is, or was during the 12-month period preceding the date of distribution of this report, a client of Credit Suisse.
Credit Suisse provided investment banking services to the subject company (1816.HK, 0958.HK, 600863.SS, 0392.HK, 601139.SS) within the past 12 months.
Credit Suisse has managed or co-managed a public offering of securities for the subject company (1816.HK, 0958.HK, 600863.SS) within the past 12 months.
Credit Suisse has received investment banking related compensation from the subject company (1816.HK, 0958.HK, 600863.SS, 0392.HK, 601139.SS) within the past 12 months
Credit Suisse expects to receive or intends to seek investment banking related compensation from the subject company (1816.HK, 600900.SS, 600027.SS, 0902.HK, 0836.HK, 1071.HK, 0958.HK, 0916.HK, 0816.HK, 600863.SS, 0002.HK, 0003.HK, 0006.HK, 0392.HK, 0991.HK, 1038.HK, 1193.HK, 1798.HK, 2688.HK, 601139.SS) within the next 3 months.
As of the end of the preceding month, Credit Suisse beneficially own 1% or more of a class of common equity securities of (0902.HK, 0916.HK, 0991.HK).
For other important disclosures concerning companies featured in this report, including price charts, please visit the website at https://rave.credit-suisse.com/disclosures or call +1 (877) 291-2683.
Important Regional Disclosures
Singapore recipients should contact Credit Suisse AG, Singapore Branch for any matters arising from this research report.
The analyst(s) involved in the preparation of this report have not visited the material operations of the subject company (1816.HK, 600900.SS, 0902.HK, 0836.HK, 1071.HK, 0958.HK, 0916.HK, 0816.HK, 600863.SS, 600578.SS, 0002.HK, 0003.HK, 0006.HK, 0384.HK, 0392.HK, 0956.HK, 0991.HK, 1038.HK, 1193.HK, 1798.HK, 2638.HK, 2688.HK, 600674.SS, 600886.SS, 601139.SS) within the past 12 months
Restrictions on certain Canadian securities are indicated by the following abbreviations: NVS--Non-Voting shares; RVS--Restricted Voting Shares; SVS--Subordinate Voting Shares.
Individuals receiving this report from a Canadian investment dealer that is not affiliated with Credit Suisse should be advised that this report may not contain regulatory disclosures the non-affiliated Canadian investment dealer would be required to make if this were its own report.
For Credit Suisse Securities (Canada), Inc.'s policies and procedures regarding the dissemination of equity research, please visit https://www.credit-suisse.com/sites/disclaimers-ib/en/canada-research-policy.html.
Credit Suisse has acted as lead manager or syndicate member in a public offering of securities for the subject company (1816.HK, 600011.SS, 0902.HK, 0958.HK, 600863.SS) within the past 3 years.
As of the date of this report, Credit Suisse acts as a market maker or liquidity provider in the equities securities that are the subject of this report.
Principal is not guaranteed in the case of equities because equity prices are variable.
Commission is the commission rate or the amount agreed with a customer when setting up an account or at any time after that.
To the extent this is a report authored in whole or in part by a non-U.S. analyst and is made available in the U.S., the following are important disclosures regarding any non-U.S. analyst contributors: The non-U.S. research analysts listed below (if any) are not registered/qualified as research analysts with FINRA. The non-U.S. research analysts listed below may not be associated persons of CSSU and therefore may not be subject to the NASD Rule 2711 and NYSE Rule 472 restrictions on communications with a subject company, public appearances and trading securities held by a research analyst account.

IDEAS ENGINE 24
China Power Sector
Credit Suisse (Hong Kong) Limited ................................................................................................................................... Dave Dai, CFA ; Ran Ma
For Credit Suisse disclosure information on other companies mentioned in this report, please visit the website at https://rave.credit-suisse.com/disclosures or call +1 (877) 291-2683.

IDEAS ENGINE 25
China Power Sector
References in this report to Credit Suisse include all of the subsidiaries and affiliates of Credit Suisse operating under its investment banking division. For more information on our structure, please use the following link: https://www.credit-suisse.com/who_we_are/en/This report may contain material that is not directed to, or intended for distribution to or use by, any person or entity who is a citizen or resident of or located in any locality, state, country or other jurisdiction where such distribution, publication, availability or use would be contrary to law or regulation or which would subject Credit Suisse AG or its affiliates ("CS") to any registration or licensing requirement within such jurisdiction. All material presented in this report, unless specifically indicated otherwise, is under copyright to CS. None of the material, nor its content, nor any copy of it, may be altered in any way, transmitted to, copied or distributed to any other party, without the prior express written permission of CS. All trademarks, service marks and logos used in this report are trademarks or service marks or registered trademarks or service marks of CS or its affiliates. The information, tools and material presented in this report are provided to you for information purposes only and are not to be used or considered as an offer or the solicitation of an offer to sell or to buy or subscribe for securities or other financial instruments. CS may not have taken any steps to ensure that the securities referred to in this report are suitable for any particular investor. CS will not treat recipients of this report as its customers by virtue of their receiving this report. The investments and services contained or referred to in this report may not be suitable for you and it is recommended that you consult an independent investment advisor if you are in doubt about such investments or investment services. Nothing in this report constitutes investment, legal, accounting or tax advice, or a representation that any investment or strategy is suitable or appropriate to your individual circumstances, or otherwise constitutes a personal recommendation to you. CS does not advise on the tax consequences of investments and you are advised to contact an independent tax adviser. Please note in particular that the bases and levels of taxation may change. Information and opinions presented in this report have been obtained or derived from sources believed by CS to be reliable, but CS makes no representation as to their accuracy or completeness. CS accepts no liability for loss arising from the use of the material presented in this report, except that this exclusion of liability does not apply to the extent that such liability arises under specific statutes or regulations applicable to CS. This report is not to be relied upon in substitution for the exercise of independent judgment. CS may have issued, and may in the future issue, other communications that are inconsistent with, and reach different conclusions from, the information presented in this report. Those communications reflect the different assumptions, views and analytical methods of the analysts who prepared them and CS is under no obligation to ensure that such other communications are brought to the attention of any recipient of this report. Some investments referred to in this report will be offered solely by a single entity and in the case of some investments solely by CS, or an associate of CS or CS may be the only market maker in such investments. Past performance should not be taken as an indication or guarantee of future performance, and no representation or warranty, express or implied, is made regarding future performance. Information, opinions and estimates contained in this report reflect a judgment at its original date of publication by CS and are subject to change without notice. The price, value of and income from any of the securities or financial instruments mentioned in this report can fall as well as rise. The value of securities and financial instruments is subject to exchange rate fluctuation that may have a positive or adverse effect on the price or income of such securities or financial instruments. Investors in securities such as ADR's, the values of which are influenced by currency volatility, effectively assume this risk. Structured securities are complex instruments, typically involve a high degree of risk and are intended for sale only to sophisticated investors who are capable of understanding and assuming the risks involved. The market value of any structured security may be affected by changes in economic, financial and political factors (including, but not limited to, spot and forward interest and exchange rates), time to maturity, market conditions and volatility, and the credit quality of any issuer or reference issuer. Any investor interested in purchasing a structured product should conduct their own investigation and analysis of the product and consult with their own professional advisers as to the risks involved in making such a purchase. Some investments discussed in this report may have a high level of volatility. High volatility investments may experience sudden and large falls in their value causing losses when that investment is realised. Those losses may equal your original investment. Indeed, in the case of some investments the potential losses may exceed the amount of initial investment and, in such circumstances, you may be required to pay more money to support those losses. Income yields from investments may fluctuate and, in consequence, initial capital paid to make the investment may be used as part of that income yield. Some investments may not be readily realisable and it may be difficult to sell or realise those investments, similarly it may prove difficult for you to obtain reliable information about the value, or risks, to which such an investment is exposed. This report may provide the addresses of, or contain hyperlinks to, websites. Except to the extent to which the report refers to website material of CS, CS has not reviewed any such site and takes no responsibility for the content contained therein. Such address or hyperlink (including addresses or hyperlinks to CS's own website material) is provided solely for your convenience and information and the content of any such website does not in any way form part of this document. Accessing such website or following such link through this report or CS's website shall be at your own risk. This report is issued and distributed in Europe (except Switzerland) by Credit Suisse Securities (Europe) Limited, One Cabot Square, London E14 4QJ, England, which is authorised by the Prudential Regulation Authority and regulated by the Financial Conduct Authority and the Prudential Regulation Authority. This report is being distributed in Germany by Credit Suisse Securities (Europe) Limited Niederlassung Frankfurt am Main regulated by the Bundesanstalt fuer Finanzdienstleistungsaufsicht ("BaFin"). This report is being distributed in the United States and Canada by Credit Suisse Securities (USA) LLC; in Switzerland by Credit Suisse AG; in Brazil by Banco de Investimentos Credit Suisse (Brasil) S.A or its affiliates; in Mexico by Banco Credit Suisse (México), S.A. (transactions related to the securities mentioned in this report will only be effected in compliance with applicable regulation); in Japan by Credit Suisse Securities (Japan) Limited, Financial Instruments Firm, Director-General of Kanto Local Finance Bureau (Kinsho) No. 66, a member of Japan Securities Dealers Association, The Financial Futures Association of Japan, Japan Investment Advisers Association, Type II Financial Instruments Firms Association; elsewhere in Asia/ Pacific by whichever of the following is the appropriately authorised entity in the relevant jurisdiction: Credit Suisse (Hong Kong) Limited, Credit Suisse Equities (Australia) Limited, Credit Suisse Securities (Thailand) Limited, regulated by the Office of the Securities and Exchange Commission, Thailand, having registered address at 990 Abdulrahim Place, 27th Floor, Unit 2701, Rama IV Road, Silom, Bangrak, Bangkok 10500, Thailand, Tel. +66 2614 6000, Credit Suisse Securities (Malaysia) Sdn Bhd, Credit Suisse AG, Singapore Branch, Credit Suisse Securities (India) Private Limited (CIN no. U67120MH1996PTC104392) regulated by the Securities and Exchange Board of India (registration Nos. INB230970637; INF230970637; INB010970631; INF010970631), having registered address at 9th Floor, Ceejay House, Dr.A.B. Road, Worli, Mumbai - 18, India, T- +91-22 6777 3777, Credit Suisse Securities (Europe) Limited, Seoul Branch, Credit Suisse AG, Taipei Securities Branch, PT Credit Suisse Securities Indonesia, Credit Suisse Securities (Philippines ) Inc., and elsewhere in the world by the relevant authorised affiliate of the above. Research on Taiwanese securities produced by Credit Suisse AG, Taipei Securities Branch has been prepared by a registered Senior Business Person. Research provided to residents of Malaysia is authorised by the Head of Research for Credit Suisse Securities (Malaysia) Sdn Bhd, to whom they should direct any queries on +603 2723 2020. This report has been prepared and issued for distribution in Singapore to institutional investors, accredited investors and expert investors (each as defined under the Financial Advisers Regulations) only, and is also distributed by Credit Suisse AG, Singapore branch to overseas investors (as defined under the Financial Advisers Regulations). By virtue of your status as an institutional investor, accredited investor, expert investor or overseas investor, Credit Suisse AG, Singapore branch is exempted from complying with certain compliance requirements under the Financial Advisers Act, Chapter 110 of Singapore (the "FAA"), the Financial Advisers Regulations and the relevant Notices and Guidelines issued thereunder, in respect of any financial advisory service which Credit Suisse AG, Singapore branch may provide to you. This information is being distributed by Credit Suisse AG, Dubai Branch, duly licensed and regulated by the Dubai Financial Services Authority (DFSA), and is directed at Professional Clients or Market Counterparties only, as defined by the DFSA. The financial products or financial services to which the information relates will only be made available to a client who meets the regulatory criteria to be a Professional Client or Market Counterparty only, as defined by the DFSA, and is not intended for any other person. This research may not conform to Canadian disclosure requirements. In jurisdictions where CS is not already registered or licensed to trade in securities, transactions will only be effected in accordance with applicable securities legislation, which will vary from jurisdiction to jurisdiction and may require that the trade be made in accordance with applicable exemptions from registration or licensing requirements. Non-U.S. customers wishing to effect a transaction should contact a CS entity in their local jurisdiction unless governing law permits otherwise. U.S. customers wishing to effect a transaction should do so only by contacting a representative at Credit Suisse Securities (USA) LLC in the U.S. Please note that this research was originally prepared and issued by CS for distribution to their market professional and institutional investor customers. Recipients who are not market professional or institutional investor customers of CS should seek the advice of their independent financial advisor prior to taking any investment decision based on this report or for any necessary explanation of its contents. This research may relate to investments or services of a person outside of the UK or to other matters which are not authorised by the Prudential Regulation Authority and regulated by the Financial Conduct Authority and the Prudential Regulation Authority or in respect of which the protections of the Prudential Regulation Authority and Financial Conduct Authority for private customers and/or the UK compensation scheme may not be available, and further details as to where this may be the case are available upon request in respect of this report. CS may provide various services to US municipal entities or obligated persons ("municipalities"), including suggesting individual transactions or trades and entering into such transactions. Any services CS provides to municipalities are not viewed as "advice" within the meaning of Section 975 of the Dodd-Frank Wall Street Reform and Consumer Protection Act. CS is providing any such services and related information solely on an arm's length basis and not as an advisor or fiduciary to the municipality. In connection with the provision of the any such services, there is no agreement, direct or indirect, between any municipality (including the officials, management, employees or agents thereof) and CS for CS to provide advice to the municipality. Municipalities should consult with their financial, accounting and legal advisors regarding any such services provided by CS. In addition, CS is not acting for direct or indirect compensation to solicit the municipality on behalf of an unaffiliated broker, dealer, municipal securities dealer, municipal advisor, or investment adviser for the purpose of obtaining or retaining an engagement by the municipality for or in connection with Municipal Financial Products, the issuance of municipal securities, or of an investment adviser to provide investment advisory services to or on behalf of the municipality. If this report is being distributed by a financial institution other than Credit Suisse AG, or its affiliates, that financial institution is solely responsible for distribution. Clients of that institution should contact that institution to effect a transaction in the securities mentioned in this report or require further information. This report does not constitute investment advice by Credit Suisse to the clients of the distributing financial institution, and neither Credit Suisse AG, its affiliates, and their respective officers, directors and employees accept any liability whatsoever for any direct or consequential loss arising from their use of this report or its content. Principal is not guaranteed. Commission is the commission rate or the amount agreed with a customer when setting up an account or at any time after that.
Copyright © 2015 CREDIT SUISSE AG and/or its affiliates. All rights reserved.
Investment principal on bonds can be eroded depending on sale price or market price. In addition, there are bonds on which investment principal can be eroded due to changes in redemption amounts. Care is required when investing in such instruments. When you purchase non-listed Japanese fixed income securities (Japanese government bonds, Japanese municipal bonds, Japanese government guaranteed bonds, Japanese corporate bonds) from CS as a seller, you will be requested to pay the purchase price only.
UT0400.docx