china energy future: leap tool application in...
TRANSCRIPT
1
CHINA ENERGY FUTURE: LEAP TOOL APPLICATION
IN CHINA
Baolei GUO, Yanjia WANG, Aling ZHANG
Tsinghua University
2
GENERAL INTRODUCTION
Funded by Nautilus Institute, LEAP modeling in China started from 2001.This project has two stages: assembling dataset for LEAP and scenario analysis.This presentation is based on the paper
prepared by Mr. Guo. Prof. Yanjia Wang, Prof. Aling Zhang, and Dr. David Von Hippel have been of great help to the complete of the paper’s Chinese version.

3
DEVELOPING FUTURE SCENARIOS FOR CHINA
Step I: Define a focal issue
C h in a E n e r g y F u tu r e S c e n a r io F o c a l I s s u e
H o w w il l d iv e r s ifie d a n d c le a n e n e r g y su p p ly b e r e a l iz e d in th e n e x t 3 0 y e a r s?W il l n e w p r io r i t ie s e m e r g e fr o m r e g io n a l c o o p e r a t io in ? W h a t im p a c t w il l th e sen e w fa c to r s h a v e o n C h in a 's e n e r g y p a th w a y ?
4
DEVELOPING FUTURE SCENARIOS FOR CHINA
Step II: List important forces in the environment1 regional economic cooperation,2 political relationship, 3 social development (including population increase, education, government deregulation, etc.), 4 technological progress. 5 the energy demand and supply situation, 6 the possibility of regional cooperation,
5
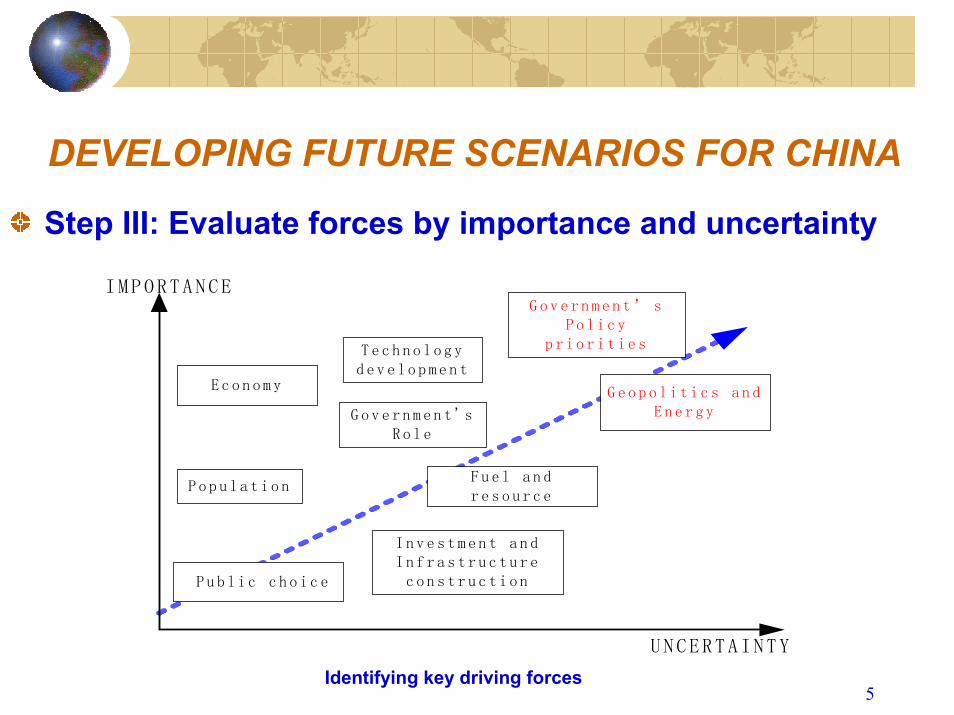
DEVELOPING FUTURE SCENARIOS FOR CHINA
Step III: Evaluate forces by importance and uncertainty
IMPORTANCE
UNCERTAINTY
Pop u l a t i o n
E c o n o m y
F u e l a n dr e s o u r c e
I n v e s t m e n t a n dI n f r a s t r u c t u r ec o n s t r u c t i o n
G e o p o l i t i c s a n dE n e r g y
G o v e r n m e n t’ sPol i c y
p r i o r i t i e s
P u b l i c c h o i c e
T e c h n o l o g yd e v e l o p m e n t
G o v e r n m e n t ' sR o l e
Identifying key driving forces

6
DEVELOPING FUTURE SCENARIOS FOR CHINA
Step IV: Select scenario logic
A higherpriority on
the object of adiversified energy
supplyN
Y
How toensure energy
security Import-oriented
H-External
“Middle of theroad” BAU
Self-susatainedH-Internal
L
Select scenario logic

7
DEVELOPING FUTURE SCENARIOS FOR CHINA
Step V: Develop scenarios around critical uncertainties
The object ofa diversifiedenergy supply
Self-sustained
HighLow
How to ensureenergy security?
BAU
H-I
H-E
L
Imported-oriented

8
Modeling the structure
LEAP-China Model Structure
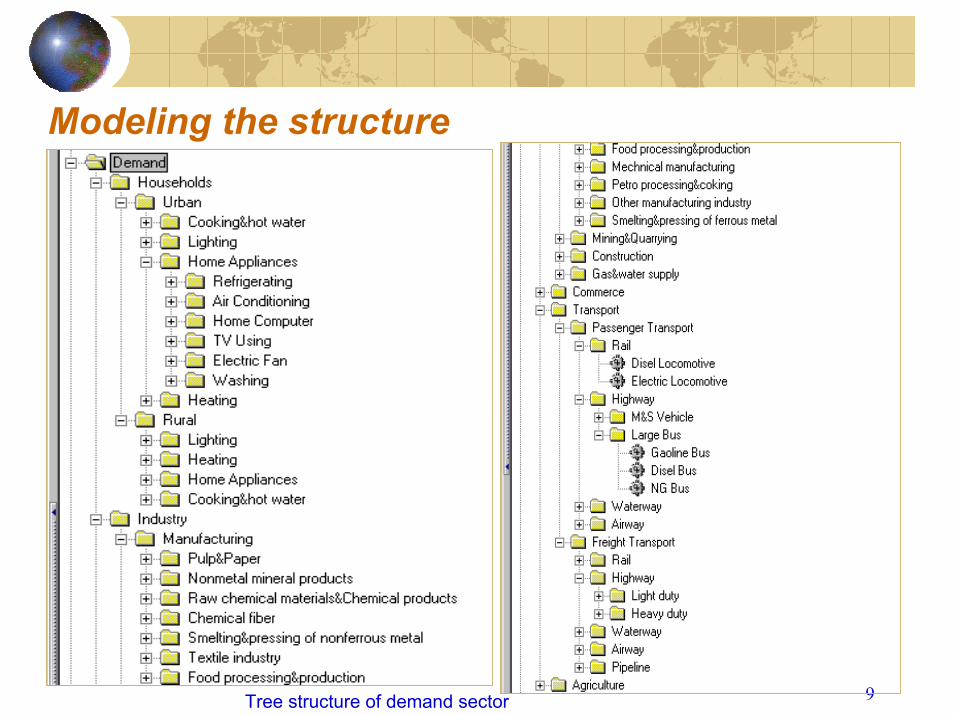
9Tree structure of demand sector
Modeling the structure

10
Modeling the structure
Tree structure of Power Generation sector
11
Assumptions of Business-As-Usual Scenario
The BAU scenario is based on a set of assumptions derived either directly or through interpretation of official state-level forecasts and plans.

12
Assumption of Alternative Scenarios
H-E scenario:more natural gas is widely used in almost all demand sectors and electricity generation while the use of coal is further decreased. As to renewable energy and nuclear power utilization, no further efforts are made to promote their use.
13
Assumption of Alternative Scenarios
H-I scenario: the program of renewable energy utilization makes the biomass still act as an important fuel type in residential sector. Nuclear power is widely used in electricity generation. More new energy techniques are used in power generation. Coal still plays an important part in almost all demand sectors.

14
Overview of Final energy demand spanning 1999-2030 in
Business-as-usual and other alternative scenarios
MODELING RESULTS
China: Final energy demand in final energy units: demandUnits: million tonne of coal equivalent
Base year Fuel Mix BAU 2030 Fuel Mix H-E 2030 Fuel Mix H-I 2030 Fuel MixBiomass 204.4 16.4% 121.3 5.0% 119.3 5.0% 167.4 6.7%
Coal 534.2 42.9% 926.3 38.2% 830.1 35.0% 879.1 35.3%
Electricity 138.5 11.1% 329.3 13.6% 339.4 14.3% 339.4 13.6%
Heat 42.8 3.4% 108.3 4.5% 108.3 4.6% 108.3 4.3%
NG 23.9 1.9% 76.5 3.2% 248 10.5% 86.5 3.5%
Oil products 283.1 22.7% 800.6 33.0% 674.6 28.4% 801.1 32.1%
Other fuels 11.9 1.0% 19.2 0.8% 8.6 0.4% 17.4 0.7%
Renewables 1 0.1% 36.4 1.5% 36.4 1.5% 86.6 3.5%
final energy demands and fuel mix of each scenario
15
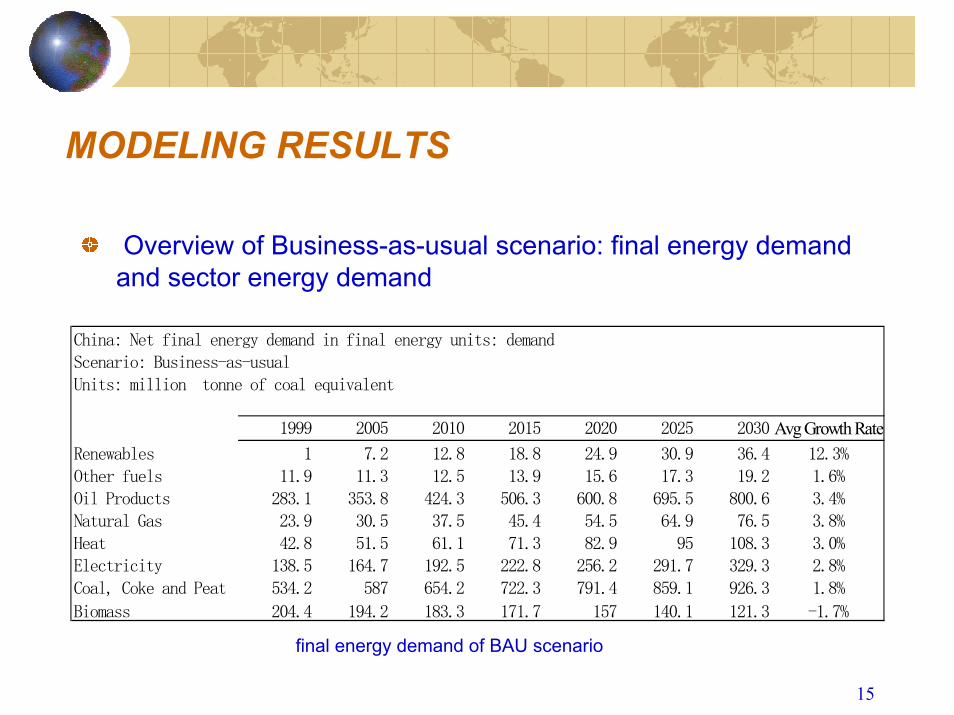
MODELING RESULTS
Overview of Business-as-usual scenario: final energy demand and sector energy demand
China: Net final energy demand in final energy units: demandScenario: Business-as-usualUnits: million tonne of coal equivalent
1999 2005 2010 2015 2020 2025 2030 Avg Growth RateRenewables 1 7.2 12.8 18.8 24.9 30.9 36.4 12.3%Other fuels 11.9 11.3 12.5 13.9 15.6 17.3 19.2 1.6%Oil Products 283.1 353.8 424.3 506.3 600.8 695.5 800.6 3.4%Natural Gas 23.9 30.5 37.5 45.4 54.5 64.9 76.5 3.8%Heat 42.8 51.5 61.1 71.3 82.9 95 108.3 3.0%Electricity 138.5 164.7 192.5 222.8 256.2 291.7 329.3 2.8%Coal, Coke and Peat 534.2 587 654.2 722.3 791.4 859.1 926.3 1.8%
Biomass 204.4 194.2 183.3 171.7 157 140.1 121.3 -1.7%
final energy demand of BAU scenario
16
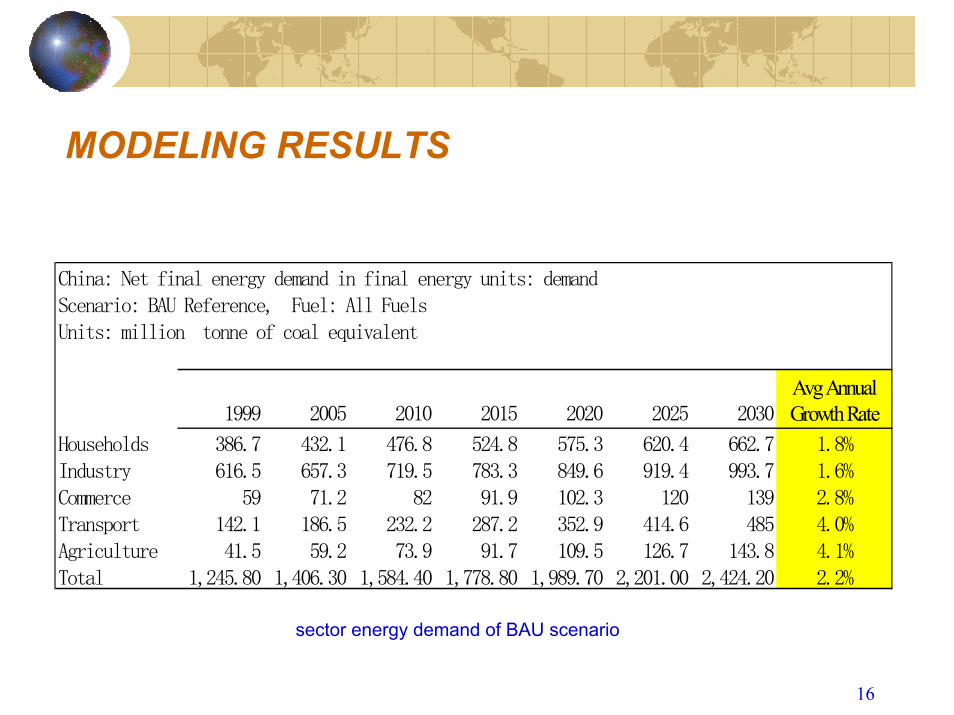
MODELING RESULTS
rgy demand in final energy units: demandnce, Fuel: All Fuelse of coal equivalent
1999 2005 2010 2015 2020 2025 2030Avg AnnualGrowth Rate
386.7 432.1 476.8 524.8 575.3 620.4 662.7 1.8%616.5 657.3 719.5 783.3 849.6 919.4 993.7 1.6%
59 71.2 82 91.9 102.3 120 139 2.8%142.1 186.5 232.2 287.2 352.9 414.6 485 4.0%41.5 59.2 73.9 91.7 109.5 126.7 143.8 4.1%
1,245.80 1,406.30 1,584.40 1,778.80 1,989.70 2,201.00 2,424.20 2.2%
sector energy demand of BAU scenario
China: Net final eneScenario: BAU RefereUnits: million tonn
HouseholdsIndustryCommerceTransportAgricultureTotal
17
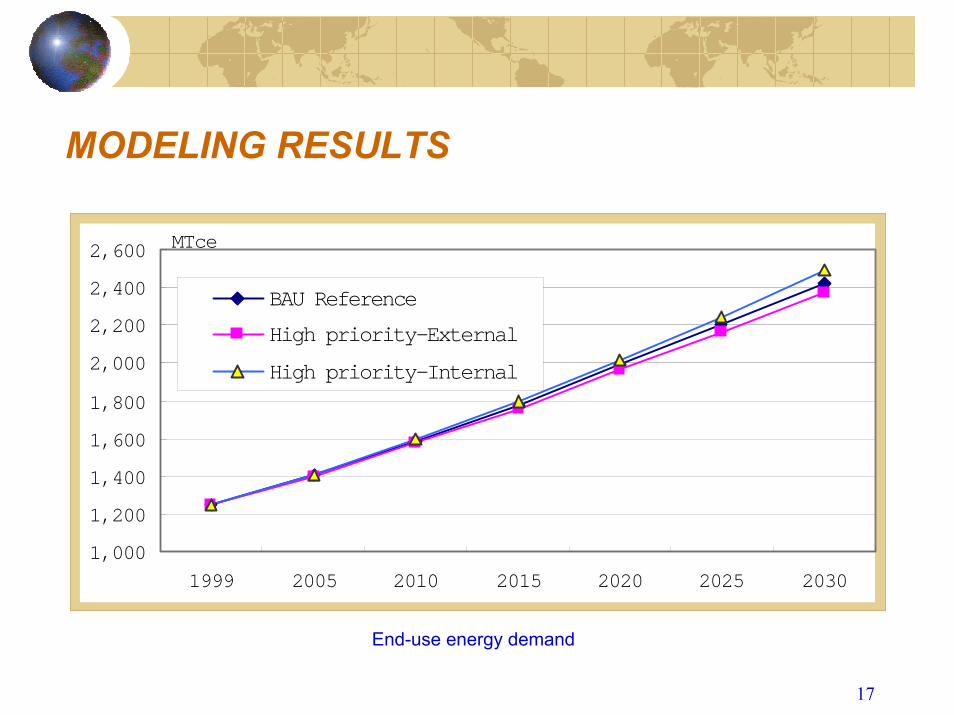
MODELING RESULTS
1,000
1,200
1,400
1,600
1,800
2,000
2,200
2,400
2,600
1999 2005 2010 2015 2020 2025 2030
MTce
BAU Reference
High priority-External
High priority-Internal
End-use energy demand
18
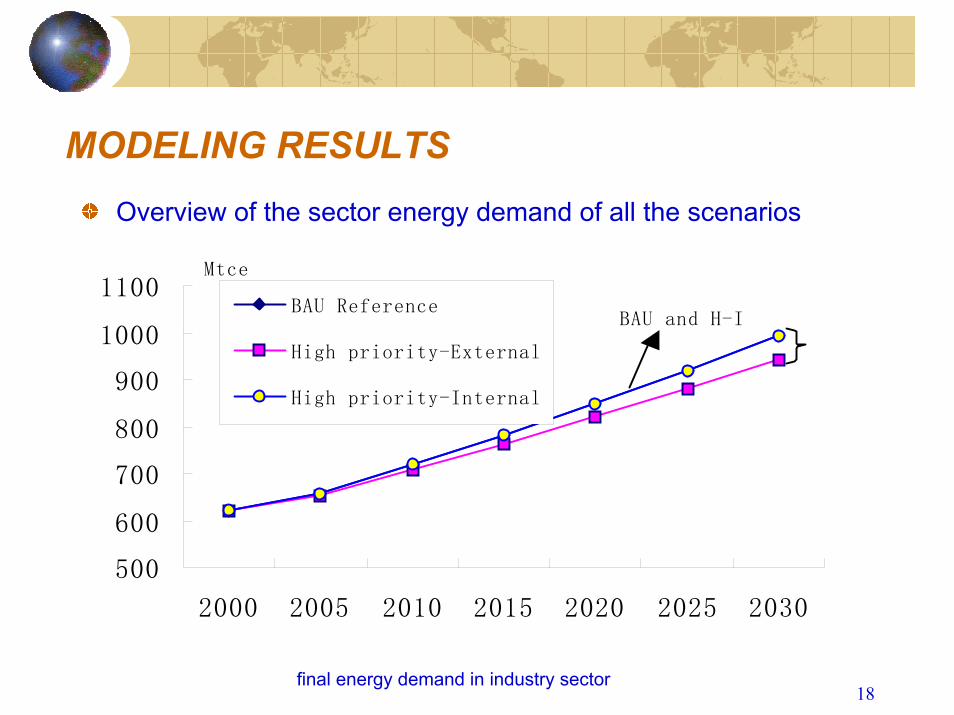
MODELING RESULTS Overview of the sector energy demand of all the scenarios
500
600
700
800
900
1000
1100
2000 2005 2010 2015 2020 2025 2030
Mtce
BAU Reference
High priority-External
High priority-Internal
BAU and H-I
final energy demand in industry sector
19
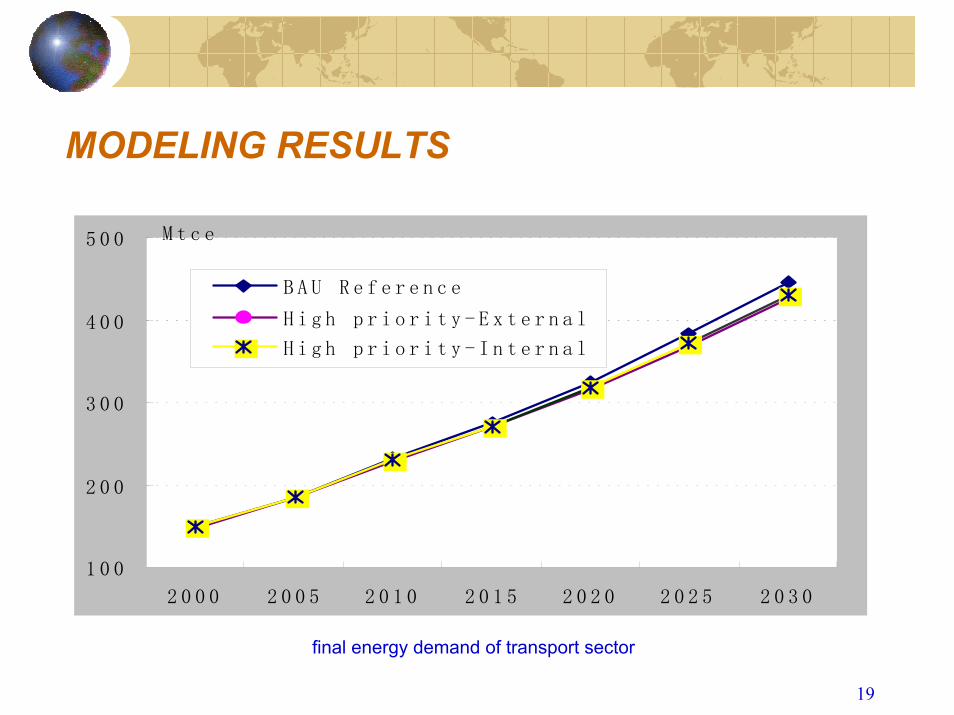
MODELING RESULTS
1 0 0
2 0 0
3 0 0
4 0 0
5 0 0
2 0 0 0 2 0 0 5 2 0 1 0 2 0 1 5 2 0 2 0 2 0 2 5 2 0 3 0
M t c e
B A U R e f e r e n c e
H i g h p r i o r i t y - E x t e r n a l
H i g h p r i o r i t y - I n t e r n a l
final energy demand of transport sector
20
MODELING RESULTS
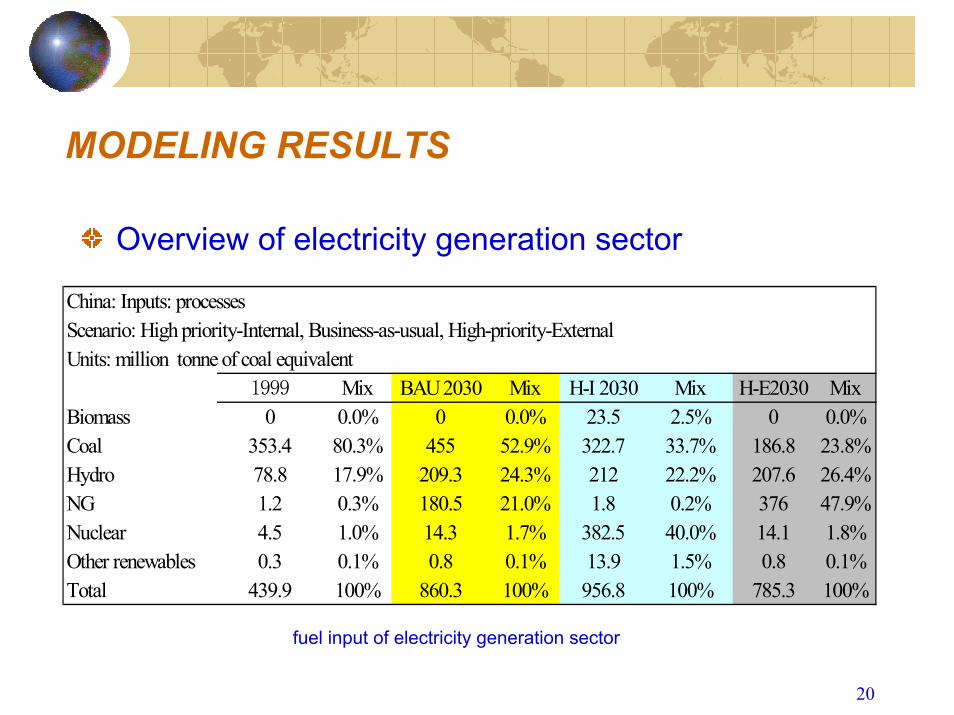
Overview of electricity generation sector
China: Inputs: processesScenario: High priority-Internal, Business-as-usual, High-priority-ExternalUnits: million tonne of coal equivalent
1999 Mix BAU 2030 Mix H-I 2030 Mix H-E2030 MixBiomass 0 0.0% 0 0.0% 23.5 2.5% 0 0.0%Coal 353.4 80.3% 455 52.9% 322.7 33.7% 186.8 23.8%Hydro 78.8 17.9% 209.3 24.3% 212 22.2% 207.6 26.4%NG 1.2 0.3% 180.5 21.0% 1.8 0.2% 376 47.9%Nuclear 4.5 1.0% 14.3 1.7% 382.5 40.0% 14.1 1.8%Other renewables 0.3 0.1% 0.8 0.1% 13.9 1.5% 0.8 0.1%Total 439.9 100% 860.3 100% 956.8 100% 785.3 100%
fuel input of electricity generation sector

21
MODELING RESULTS China: Outputs: processesUnits: thousand gigawatt-hour
1999 2005 2010 2015 2020 2025 2030Scenario: Business-as-usualDomestic generation total 1,210.90 1,433.80 1,681.70 1,934.50 2,208.10 2,500.20 2,808.00Import 0.00 15.90 21.70 26.70 34.30 39.70 44.30Total 1,210.90 1,449.70 1,703.40 1,961.20 2,242.40 2,539.90 2,852.30Share of Imported electricity 0.0% 1.1% 1.3% 1.4% 1.5% 1.6% 1.6%Scenario: H-EDomestic generation total 1,210.90 1,429.00 1,678.00 1,934.80 2,215.50 2,517.80 2,842.10Import 0.00 25.60 37.40 49.20 65.80 81.50 97.50Total 1,210.90 1,454.50 1,715.40 1,984.00 2,281.20 2,599.40 2,939.70Share of Imported electricity 0.0% 1.8% 2.2% 2.5% 2.9% 3.1% 3.3%Scenario: H-IDomestic generation total 1,210.90 1,443.40 1,701.20 1,965.60 2,256.90 2,578.60 2,930.50Import 0.00 9.10 9.00 11.10 14.10 14.40 9.10Total 1,210.90 1,452.20 1,710.10 1,976.60 2,271.10 2,593.10 2,939.40Share of Imported electricity 0.0% 0.6% 0.5% 0.6% 0.6% 0.6% 0.3%
total electricity supply in each scenario
22
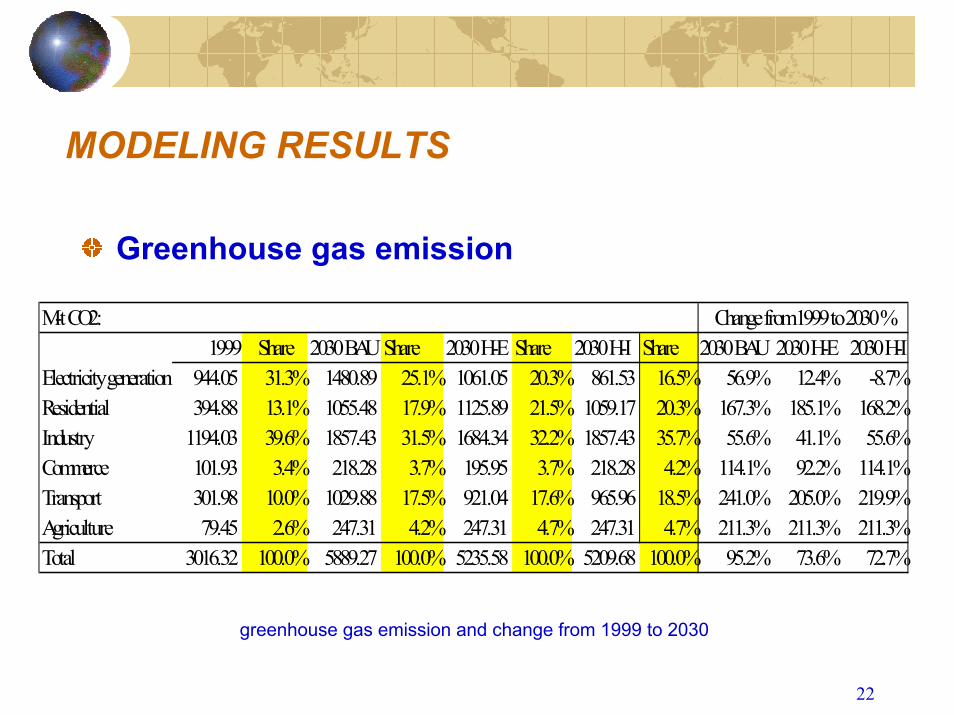
MODELING RESULTS
Greenhouse gas emission
M-t CO2:1999 Share 2030 BAU Share 2030 H-E Share 2030 H-I Share 2030 BAU 2030 H-E 2030 H-I
Electricity generation 944.05 31.3% 1480.89 25.1% 1061.05 20.3% 861.53 16.5% 56.9% 12.4% -8.7%Residential 394.88 13.1% 1055.48 17.9% 1125.89 21.5% 1059.17 20.3% 167.3% 185.1% 168.2%Industry 1194.03 39.6% 1857.43 31.5% 1684.34 32.2% 1857.43 35.7% 55.6% 41.1% 55.6%Commerce 101.93 3.4% 218.28 3.7% 195.95 3.7% 218.28 4.2% 114.1% 92.2% 114.1%Transport 301.98 10.0% 1029.88 17.5% 921.04 17.6% 965.96 18.5% 241.0% 205.0% 219.9%Agriculture 79.45 2.6% 247.31 4.2% 247.31 4.7% 247.31 4.7% 211.3% 211.3% 211.3%Total 3016.32 100.0% 5889.27 100.0% 5235.58 100.0% 5209.68 100.0% 95.2% 73.6% 72.7%
Change from 1999 to 2030 %
greenhouse gas emission and change from 1999 to 2030

23
MODELING RESULTS
�����������������������������
�����������������������������
�����������������������������
�����������������������������
�����������������������������
�����������������������������
�����������������������������
�����������������������������
�����������������������������
�����������������������������
�����������������������������
�����������������������������
�����������������������������
�����������������������������
�����������������������������
�����������������������������
�����������������������������
�����������������������������
�����������������������������
�����������������������������
�����������������������������
�����������������������������
�����������������������������
�����������������������������
�����������������������������
�����������������������������
�����������������������������
�����������������������������
�����������������������������
�����������������������������
�����������������������������
�����������������������������
�����������������������������
�����������������������������
�����������������������������
�����������������������������
�����������������������������
�����������������������������
�����������������������������
�����������������������������
�����������������������������
�����������������������������
�����������������������������
�����������������������������
�����������������������������
�����������������������������
�����������������������������
�����������������������������
�����������������������������
�����������������������������
�����������������������������
�����������������������������
�����������������������������
�����������������������������
�����������������������������
�����������������������������
����������������������������� �����������������������������
�����������������������������
�����������������������������
�����������������������������
�����������������������������
�����������������������������
�����������������������������
�����������������������������
�����������������������������
�����������������������������
�����������������������������
�����������������������������
�����������������������������
�����������������������������
�����������������������������
0
1000
2000
3000
4000
5000
6000
7000
1999 基础年 2030 BAU 2030 H-E 2030 H-I
M-t CO2
农业���������� 交通
���������� 商业
����� 工业���������� 居民
���������� 电力生产
CO2 emission

24
MODELING RESULTS
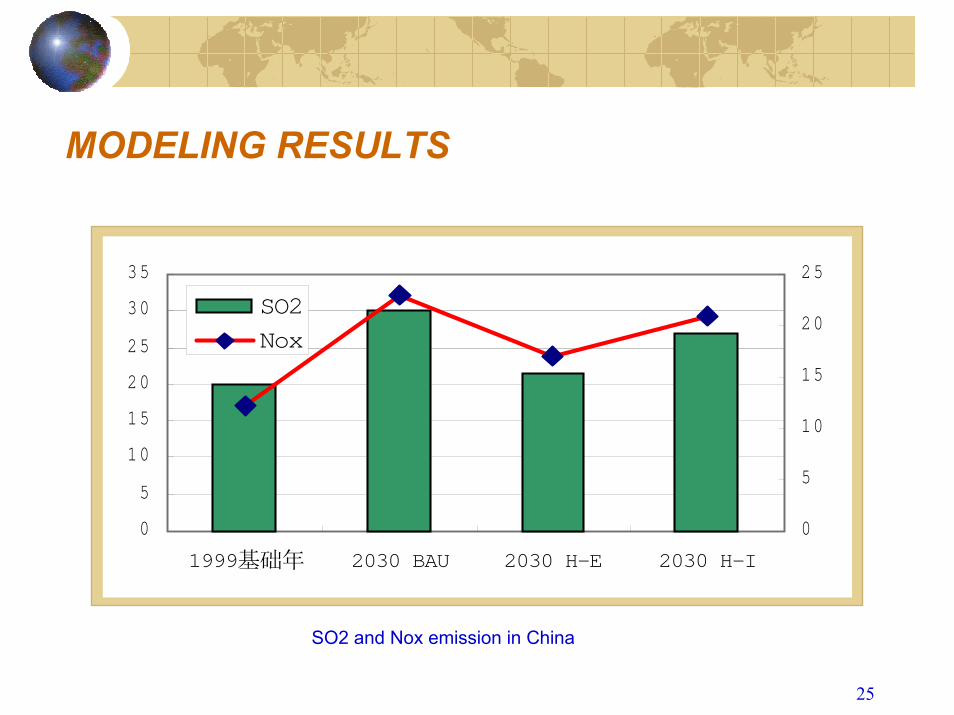
SO2 and Nox emission
China: SO2 and Nox emissionUnit: million tons
SO2 V.S.1999 V.S. 2030 BAU Nox V.S.1999 V.S. 2030 BAU1999 20 0% N.A 12.2 0% N.A2030 BAU 30.2 51% 0% 23 89% 0%2030 H-E 21.6 8% -28% 17 39% -26%2030 H-I 27 35% -11% 21 72% -9%
SO2 and Nox emission in China
25
MODELING RESULTS
0
5
10
15
20
25
30
35
1999基础年 2030 BAU 2030 H-E 2030 H-I
0
5
10
15
20
25
SO2
Nox
SO2 and Nox emission in China

26
CONCLUSIONS AND IMPLICATIONS
(1) In the object year 2030, all three scenarios and pathways explored in the paper lead to a more diversified and cleaner energy system relative to base year in China.
27
CONCLUSIONS AND IMPLICATIONS
(2) Future technology choices in Electricity generation sector will have significant effect on future primary energy demand composition.Future energy demand of transporting activities will be a great challenge to China’s energy supply

28
CONCLUSIONS AND IMPLICATIONS
(3) Supply channel and regional cooperation
China is not an isolated island. The tide of regional cooperation has brought both opportunities and challenges. One possible way to tackle the future risk of supply failure and avoid the embarrassment of policy incompetence is to strengthen regional cooperation and make full use of the resources available in the region at a lower risk and cost

29
Thank you very much!