children’s outcomes and classroom quality from pre-k ... · children’s outcomes and classroom...
TRANSCRIPT

Children’s Outcomes and Classroom Quality from Pre-K through Kindergarten Findings from Year 2 of Georgia’s Pre-K Longitudinal Study
Ellen S. Peisner-Feinberg, PhD, Justin D. Garwood, PhD, & Irina L. Mokrova, PhD
Georgia’s Pre-K
Program Evaluation
Project

© July 2016 by Ellen S. Peisner-Feinberg, FPG Child Development Institute, The University of
North Carolina at Chapel Hill.
We wish to acknowledge the members of our Georgia’s Pre-K Program Evaluation Team who
assisted with this study: Research Staff Margaret Boccieri, Robert Carr, Lauren Conder, Kelly
Downing, Elizabeth Gunn, Cristina Luna Evans, Jean Healy, Donna Jeter, Diana Knechtel, Dr.
Doré LaForett, Tom Leggett, Rebecca Levy, Carla Moreno, Jennifer Osborne, Maria Sanchez,
Eric Savage, Dr. Jennifer Schaaf, Gina Walker, Bethany Warnaar, Rickiah Wingfield, and
Xiajuan Yin; Data Collectors Deana Bailey, Dean Bragg, Lisa Burford, Jessamine Burkey, Laura
Boham, Caroline Butler, Daphne Collins, Margerie Coomes, Abby Davis, CL Dunn, Leslie
Forthman, Elizabeth Garbin, Nakea Green- Quarterman, Stacey Harris, Susan Holmberg,
Melissa Johns, Jacoda Kee, Elizabeth Milling, Wanda Muhammad, Ann O’Mahoney, Stephanie
Paladino, Nicole Poucher, Vontricie Roberson, Carolina Sandoval, Melissa Silva, Patricia
Simpson, Diane Stewart, Claudia Sorto, Alissa Sypsa, Virgil Thomas, Peggy Tymes, Susan
Tutan-Gonzales, and Ann Zimmer- Shepherd; and Statistical consultants Dr. Margaret
Burchinal and Dr. Yi Pan.
In addition, we offer our appreciation to all those who participated in and assisted with this
study, including the teachers, administrators, other staff, and children and families of Georgia’s
Pre-K Program, and the staff of Bright from the Start: Georgia Department of Early Care and
Learning.
Cover by Gina Harrison.
Suggested citation: Peisner-Feinberg, E. S., Garwood, J. D., & Mokrova, I. L. (2016). Children’s
Outcomes and Classroom Quality from Pre-K through Kindergarten: Findings from Year 2 of Georgia’s
Pre-K Longitudinal Study. Chapel Hill, NC: The University of North Carolina, FPG Child
Development Institute.
This study was funded by Bright from the Start: Georgia Department of Early Care and
Learning. The opinions expressed in this report do not necessarily reflect those of the funding
agency.
This report is available at http://fpg.unc.edu/projects/georgia-pre-kindergarten-evaluation or at
www.decal.ga.gov.

1
Contents
List of Tables ............................................................................................................................................... 2
List of Figures ............................................................................................................................................. 3
Purpose of the Evaluation Study ............................................................................................................. 4
Overview of Georgia’s Pre-K Program ................................................................................................... 5
Methods ....................................................................................................................................................... 6
Participants ............................................................................................................................................. 6
Classrooms .......................................................................................................................................... 6
Children ............................................................................................................................................... 6
Measures and Procedures ..................................................................................................................... 7
Child Assessments ............................................................................................................................. 7
Classroom Observations ................................................................................................................... 8
Parent and Teacher Surveys ............................................................................................................. 9
Analysis Approach .................................................................................................................................... 9
Sample Description and Comparison ................................................................................................. 9
Child Outcomes .................................................................................................................................... 10
Changes over Time .......................................................................................................................... 10
Moderators of Growth..................................................................................................................... 10
Quality of Classroom Practices .......................................................................................................... 10
Results …………………………………………………………………………………………………….11
Children’s Growth over Time ............................................................................................................ 11
Full Sample ....................................................................................................................................... 11
DLL Subsample ................................................................................................................................ 12
Moderators of Children’s Growth ..................................................................................................... 13
Child/Family Characteristics .......................................................................................................... 13
Classroom/Teacher Characteristics ............................................................................................... 14
Classroom Quality Moderators ...................................................................................................... 14
Quality of Classroom Practices in Pre-K and Kindergarten ...................................................... 15
Conclusions ............................................................................................................................................... 16
References ................................................................................................................................................. 55
2
List of Tables
Table 1. Characteristics of Pre-Kindergarten Classrooms and Teachers .......................................... 18
Table 2. Characteristics of Kindergarten Classrooms and Teachers ................................................. 19
Table 3. Characteristics of Children in the Sample ............................................................................. 20
Table 4. Child Outcome and Classroom Quality Measures ............................................................... 21
Table 5. Child Language Proficiency Levels at Pre-K Entry .............................................................. 22
Table 6. Child Outcomes for Full Sample (2013-2015) ........................................................................ 23
Table 7. Full Sample Kindergarten Regression Results—Language and Literacy ......................... 24
Table 8. Full Sample Kindergarten Regression Results—Math, General Knowledge, and
Classroom Behavior ................................................................................................................................. 25
Table 9. Comparisons of Children’s Growth in Pre-K and Kindergarten ........................................ 26
Table 10. English Outcome Scores for DLL Subsample ...................................................................... 27
Table 11. DLL Subsample English Kindergarten Regression Results—Language and Literacy .. 28
Table 12. DLL Subsample English Kindergarten Regression Results—Math and General
Knowledge ................................................................................................................................................ 29
Table 13. Spanish Outcome Scores for DLL Subsample ..................................................................... 30
Table 14. DLL Subsample Spanish Kindergarten Regression Results—Language and Literacy . 31
Table 15. DLL Subsample Spanish Kindergarten Regression Results—Math and General
Knowledge ................................................................................................................................................ 32
Table 16. Moderators of Kindergarten Outcomes–Language and Literacy ..................................... 33
Table 17. Moderators of Kindergarten Outcomes–Math, General Knowledge, and Classroom
Behavior ..................................................................................................................................................... 34
Table 18. Moderators of Kindergarten Outcomes–CLASS Subsample–Language and Literacy .. 45
Table 19. Moderators of Kindergarten Outcomes–CLASS Subsample–Math, General
Knowledge, and Behavior ....................................................................................................................... 46
Table 20. Classroom Assessment Scoring System (CLASS) Scores ................................................... 51

3
List of Figures
Figure 1. Growth in WJ-III Letter-Word Identification by English Proficiency .............................. 35
Figure 2. Growth in WJ-III Picture Vocabulary by English Proficiency ........................................... 35
Figure 3. Growth in Naming Letters Task by English Proficiency ................................................... 36
Figure 4. Growth in WJ-III Applied Problems by English Proficiency ............................................ 36
Figure 5. Growth in Counting Task by English Proficiency .............................................................. 37
Figure 6. Growth in Social Awareness Task by English Proficiency ................................................ 37
Figure 7. Growth in SSiS Social Skills by English Proficiency ........................................................... 38
Figure 8. Change in SSiS Problem Behaviors by English Proficiency............................................... 38
Figure 9. Growth in WJ-III Letter-Word Identification by Race ........................................................ 39
Figure 10. Growth in WJ-III Word Attack by Race.............................................................................. 39
Figure 11. Growth in Naming Letters Task by Race ........................................................................... 40
Figure 12. Growth in Social Awareness Task by Race ........................................................................ 40
Figure 13. Growth in Naming Letters Task by Income ...................................................................... 41
Figure 14. Growth in Counting Task by Income ................................................................................. 41
Figure 15. Change in SSiS Problem Behaviors by Income .................................................................. 42
Figure 16. Growth in WJ-III Letter-Word Identification by Program Type ..................................... 42
Figure 17. Growth in WJ-III Sound Awareness by Program Type ................................................... 43
Figure 18. Growth in WJ-III Word Attack by Program Type ............................................................ 43
Figure 19. Growth in Naming Letters Task by Program Type .......................................................... 44
Figure 20. Growth in WJ-III Word Attack by CLASS Classroom Organization ............................. 47
Figure 21. Growth in WJ-III Word Attack by CLASS Instructional Support .................................. 47
Figure 22. Growth in SSiS Social Skills by CLASS Instructional Support ........................................ 48
Figure 23. Growth in Naming Letters Task by CLASS Emotional Support .................................... 48
Figure 24. Growth in Counting Task by CLASS Emotional Support ............................................... 49
Figure 25. Growth in WJ-III Letter-Word Identification by CLASS Emotional Support ............... 49
Figure 26. Growth in WJ-III Word Attack by CLASS Emotional Support ....................................... 50
Figure 27. CLASS Emotional Support Scores in Pre-K (n=199) and Kindergarten (n=296) ........... 52
Figure 28. CLASS Classroom Organization Scores in Pre-K (n=199) and Kindergarten (n=296) . 53
Figure 29. CLASS Instructional Support Scores in Pre-K (n=199) and Kindergarten (n=296) ....... 54

4
Purpose of the Evaluation Study
In 2011-2012, the Georgia legislature funded a series of ongoing studies to evaluate Georgia’s
Pre-K Program. The first study, conducted in 2011-2012, was designed to examine children’s
learning outcomes during pre-k, the factors that predict better outcomes, and the quality of
children’s experiences in Georgia’s Pre-K classrooms based on a random sample of 100
classrooms and 509 children within those classrooms. The second study, conducted in 2012-
2013, was designed to investigate the effects of participation in Georgia’s Pre-K on children’s
school readiness skills, and whether those effects are similar for different groups of children.
This study utilized a regression discontinuity design (RDD) to compare children who had and
had not attended the program, and included 1,181 children (611 treated and 570 untreated). The
third study, occurring from 2013-2018, involves a longitudinal design to follow a sample of
1,169 children from pre-k through third grade, in order to examine the short- and long-term
learning outcomes for children who attended Georgia’s Pre-K as well as the quality of their
preschool and school experiences.
The current report focuses on the results of the second year of this longitudinal study—the
2014–2015 Georgia’s Pre-K Program Evaluation. The purpose of this evaluation study was to
examine initial longitudinal outcomes related to school readiness for children and the quality of
their classrooms from pre-k through kindergarten. The primary evaluation questions addressed
included:
What are the learning outcomes through kindergarten for children attending Georgia’s
Pre-K Program?
What factors predict better learning outcomes for children?
What is the quality of children’s experiences in pre-k and kindergarten?
To address these questions, the evaluation study included a sample of 1,169 children (139
Spanish-speaking dual language learners/DLLs) attending a random sample of 199 Georgia’s
Pre-K classrooms in year 1, and 1,034 of these children (118 Spanish-speaking DLLs) who were
attending kindergarten in year 2. Researchers conducted individual child assessments near the
beginning and end of each year to examine growth in children’s skills. The assessment
measures covered multiple domains of learning, including language, literacy, math, and general
knowledge, and teacher ratings of behavior skills. For the DLL subsample, parallel assessments
were conducted in both English and Spanish. Researchers also conducted observations of the
quality of teacher-child instructional interactions using the CLASS in both pre-k and
kindergarten classrooms attended by this sample. In addition, information about characteristics
of the classrooms, teachers, and children was gathered from teacher and parent surveys and
from existing statewide pre-k program data. Child/family characteristics, classroom/teacher
characteristics, and classroom quality were examined as moderators of children’s growth in
skills.
5
Overview of Georgia’s Pre-K Program
Georgia’s Pre-K Program is a state-funded universal pre-kindergarten program for 4-year-olds.
The program serves children from all income levels, with no fees charged to families for
program participation. Georgia was one of the first states to offer such a universal program in
1995, currently serving over 80,000 children each program year in a variety of settings across the
state, including public school systems, private providers, and blended Head Start/pre-k
classrooms. Georgia’s Pre-K Program is based on a school-year model with instruction for 180
days/year and 6.5 hours/daya. Class sizes are limited to 20–22 children with a lead and assistant
teacher, and adult:child ratios of 1:11. Lead teachers are required to have at least a bachelor’s
degree in early childhood education or a related field (unless previously approved), and
assistant teachers are required to have at least a Child Development Associate (CDA) credential.
In addition, program guidelines provide minimum salary requirements for lead teachers based
on credentials, with funding provided by the state, as well as minimum salary requirements for
assistant teachers meeting the credential requirements.
Guidelines for classroom instruction are provided through the Georgia Early Learning and
Development Standards (GELDS)i, which are aligned with Georgia’s Performance Standards for
Kindergartenii. The program standards also require Georgia’s Pre-K sites to use an approved
curriculum; provide written lesson plans which include educational experiences in language
and literacy, math, science, social studies, creative arts (music, art, and drama), social and
emotional, and health and physical development; implement individual child assessments
using the Georgia’s Pre-K Child Assessment—Work Sampling Onlineiii, which is based on the Work
Sampling Systemiv; offer meals, rest time, and both indoor and outdoor play time; and provide
support services or referrals to families as needed. Bright from the Start: Georgia Department of
Early Care and Learning (DECAL) oversees the program, and staff provide consultation,
technical assistance, and monitoring visits throughout the year. (See 2015–2016 Georgia’s Pre-K
Program Operating Guidelinesv for further information.)
a Prior to 2011-2012, Georgia’s Pre-K Program provided 180 instruction days per year, but budget restrictions led to a
reduction to 160 days in 2011-2012. In 2012–2013, the program year was increased to 170 days and in 2013–2014, it was
returned to 180 days.

6
Methods
In year 1 of the longitudinal study, data were gathered from a random sample of classrooms
and children within classrooms to examine child outcomes and classroom quality in Georgia’s
Pre-K Program (2013-2014). This random sample of children was then followed into
kindergarten (2014-2015) in year 2 of the study. At the beginning (fall) and end (spring) of both
pre-k and kindergarten, researchers conducted individual assessments of children’s language,
literacy, math, and general knowledge skills and gathered teacher ratings of behavior skills.
Researchers also conducted classroom observations of teacher-child instructional interactions.
Program and classroom characteristics, as well as teacher and child demographic data, were
obtained from teacher and parent surveys and existing statewide administrative data collected
by DECAL.
Pa rt i c ipant s
Classrooms Children in the study sample initially attended 199 Georgia’s Pre-K classrooms in 2013–2014
(year 1) and 822 kindergarten classrooms in 2014–2015 (year 2). Information about pre-k
settings and teacher certification was obtained from DECAL data. About half of Georgia’s Pre-
K classrooms attended by children in the study sample were in public school settings (49%) and
about half were in private sites (51%). The kindergarten classrooms attended by children in the
sample primarily were located in public school settings (796), with a few in charter schools (19)
and private schools (7).
Information on characteristics of the pre-k classrooms and teachers included in the year 1
sample was based on teacher surveys (see Table 1). The average class size was 21 children, with
half boys and half girls. Almost two-thirds (64%) of the teachers had a bachelor’s degree and
about one-third (34%) had a master’s degree or higher. The majority (82%) were Georgia PSC
Certified or Certified Temporary. Teachers reported having an average of 11 years of teaching
experience. Approximately 70% of the teachers were White, 3% were of Latino ethnicity, and
almost all were female.
Information on characteristics of the kindergarten classrooms and teachers included in the year
2 sample was based on teacher surveys (see Table 2). The average class size was about 20
children, with half boys and half girls. Approximately 38% of kindergarten classroom teachers
had a bachelor’s degree and 62% had a master’s degree or higher. Teachers reported an average
of almost 15 years of teaching experience. Nearly 80% of the teachers were White, 2% were of
Latino ethnicity, and almost all were female.
Children The study sample included 1,169 children in year 1 (pre-k) and 1,034 children in year 2
(kindergarten). These children included a subsample of Spanish-speaking dual language
learners (DLL subsample)—139 children in year 1 (pre-k) and 118 children in year 2

7
(kindergarten). Parent permission forms were distributed to all children in each randomly-
selected pre-k classroom, with an overall permission rate of 73% (3,136 of 4,270 eligible
children). An average of 6 children with parent permission per classroom were randomly
selected for inclusion in the study in year 1. Children were excluded from year 2 of the study for
the following reasons: parent withdrew permission (n=4), child attending ineligible site (n=6),
the research team was not able to locate the child in a school during kindergarten (n=30), child
had moved out of state (n=33), or the school district or school was unwilling to participate
(n=62).
Information about child and family characteristics for the study sample was obtained from
DECAL data and parent survey data (see Table 3). The children in the sample in year 2 were
about half boys (48%) and half girls (52%); from varied racial backgrounds, including about half
(53%) White, about one-third African-American (38%), and the remainder from other or
multiracial backgrounds (9%); almost one-fifth (15%) of these children were of Latino ethnicity.
More than half (55%) of the children were from low-income families (as indicated by Category
One status), approximately 10% of the children had limited English language proficiency, and
3% had an individualized education program (IEP). The only significant difference between the
year 1 and 2 samples was that a higher percentage of Asian children were excluded from the
year 2 sample (5.2%) vs included in the year 2 sample (2.1%), although in both cases they
represented a relatively small percentage of the overall distribution [t(1,052)=2.45, p=.014].
Mea sur es and Procedur es
Child Assessments
Individual assessments to measure children’s growth in skills were conducted in their pre-k and
kindergarten settings. Children were assessed at four time points: 1) fall pre-k (9/10/13–
12/10/13); 2) spring pre-k (3/8/14–5/25/14); 3) fall kindergarten (9/12/14–3/9/15); and 4) spring
kindergarten (3/26/15–5/18/15). Only 10% of the sample (103 children) received fall assessments
between January and March in kindergarten. The extended fall data collection period in
kindergarten was a result of extended school closings due to inclement weather and an
outbreak of the flu virus across the state. Project staff ensured a minimum 6-week gap between
fall and spring assessments for all children. Assessments were conducted by trained data
collectors, and children’s verbal assent was obtained prior to the assessment. All children
received assessments in English. Children who were reported by their parents or teachers to
speak Spanish received a second set of parallel assessments using Spanish language versions of
these measures. The Spanish assessments were conducted by a different, bilingual data collector
on a separate day, approximately two weeks after the English assessments.
All of the child assessment measures were available in both English and Spanish versions, with
the same measures used in both pre-k and kindergarten. Most of the measures used are norm-
referenced, so that for most outcomes, standard scores could be used. These scores take into
account children’s age, so that the standardized mean score of 100 represents the expected
performance for an average child at a given age.

8
Language and literacy skills were assessed with five measures (see Table 4). The Naming
Letters taskvi measures children’s ability to recognize and name all 26 letters of the alphabet.
Four subtests from the Woodcock-Johnson III Tests of Achievementvii (WJ-III) / Batería III
Woodcock-Muñoz Pruebas de Aprovechamientoviii (Bat-III) also were used. The Letter-Word
Identification subtest measures basic pre-reading and reading skills, including letter and word
recognition and identification skills. The Picture Vocabulary subtest measures vocabulary skills,
including aspects of both receptive and expressive language. The Sound Awareness subtest
measures phonological awareness skills, including rhyming. The Word Attack subtest measures
phonemic awareness skills, including knowledge of letter sounds and sound combinations.
Math skills were assessed with two measures. The Counting Taskix measures children's ability
to count using one-to-one correspondence and the Applied Problems subtest of the WJ-III / Bat-
III measures math problem-solving skills including simple comparisons, counting, addition,
and subtraction.
General knowledge was assessed with the Social Awareness Scalex which measures whether the
child knows and is able to communicate basic self-knowledge (full name, age, birthday).
Behavior skills were assessed with two subscales of the Social Skills Improvement Systemxi
(SSiS) completed by teachers. The Social Skills subscale rates behaviors that promote positive
interactions while discouraging negative interactions. The Problem Behaviors subscale rates
behaviors that interfere with social behavior performance or acquisition.
In addition, the preLAS 2000xii was used to measure oral language proficiency in English for all
children as well as in Spanish for the DLL subsample in fall pre-k. Scores on this measure were
used as covariates in the analyses in order to examine whether differences in children’s growth
on the various outcome measures were related to their initial level of language proficiency
(1=Non-English/Spanish speaker, 2–3=Limited English/Spanish speaker, 4–5=Fluent
English/Spanish speaker). (See Table 5.)
Classroom Observations Observations of classroom practices were conducted in all 199 randomly-selected pre-k
classrooms attended by the children in the sample in year 1 and in 296 randomly-selected
kindergarten classrooms of the 822 attended by children in the sample in year 2. The focus of
the classroom observations was on interactions between teachers and children. (See Table 4 for
an overview of the classroom observation measure, including subscales and scoring.)
Teacher-child instructional interactions were assessed using the Classroom Assessment Scoring
Systemxiii (CLASS) in pre-k and the CLASS K-3xiv in kindergarten. The CLASS measures
teachers’ interactions with children in the areas of social and emotional functioning, classroom
organization and management, and curriculum implementation to support cognitive and
language development. The CLASS/CLASS K-3 includes 10 dimensions organized into three
domains, with separate scores calculated for each domain. The scale has demonstrated good
interrater reliability (mean agreement within one point=87.1%, range=78.8%–96.9%)xiii, xiv.
9
In year 1, observations of classroom practices were conducted during the second half of the
program year (1/28/14–4/25/14). Observations typically lasted about 3 hours. Data collectors had
to meet established reliability criteria prior to gathering data (i.e., 85% agreement within one
point). Inter-rater reliability data were collected for 20% of the observations and intra-class
correlations indicated that reliability was adequatexv (Emotional Support=.78, Classroom
Organization=.68, Instructional Support=.43). (Intra-class correlations of .40–.59 are considered
in the fair range, .60–.74 good, and .75–1.0 excellent.) In year 2, observations of kindergarten
classrooms were conducted during the second half of the program year (2/23/15–5/13/15). Inter-
rater reliability data were collected for 20% of the observations and intra-class correlations
indicated that reliability was excellent (Emotional Support=.81, Classroom Organization=.83,
Instructional Support=.77).
Parent and Teacher Surveys
Parents completed demographic surveys and both pre-k and kindergarten teachers completed
online surveys that included information about their classrooms and demographic information.
In year 1 and year 2, parents completed demographic surveys about their family and
household. Information about parent education was used in the current study, coded as a three-
level variable (1=less than high school, 2=high school to less than Bachelor’s degree,
3=Bachelor’s degree or above). Parent surveys were distributed to families along with the
permission forms and returned to teachers. Parent surveys were received from 91%
(1,067/1,169) of participating families in year 1 and 86% (888/1,034) of participating families in
year 2. Teachers completed online surveys about characteristics of the classroom and their
background, including classroom composition (number of boys and girls in class), length of
teaching experience, and degrees earned. Teachers were asked to complete the online surveys
via email requests sent during the spring semester, with a completion rate of 95% (189/199) in
year 1 and 95% (777/822) in year 2.
Analysis Approach
Sa mp l e D escr ipt ion and Co mpar i son
Descriptive analyses were conducted on teacher characteristics (teaching experience, teacher
gender, ethnicity, race, and education level), classroom characteristics (classroom size,
proportion of boys/girls, classroom quality), and children’s outcomes. For children’s outcomes,
three sets of descriptive analyses were conducted: for the full sample of children, for the DLL
subsample of children assessed in English, and for the DLL subsample assessed in Spanish.
Additionally, the amount of missing data and zero-order correlations among the study
variables were examined. T-test comparisons were conducted for child and family variables
(child age, gender, ethnicity, race, limited English language proficiency status, IEP status,
parent education and family income status) for those remaining in the sample and not in the
sample during year 2 to examine potential selection bias and to estimate the size of attrition.
10
Ch i ld Ou t co mes
Changes over Time To investigate whether significant levels of growth occurred in children’s outcomes during the
pre-k and kindergarten years, a series of three-level hierarchical linear models (HLM) were
estimated, with separate models conducted for each outcome. Each of the outcome scores,
collected at fall and spring of pre-k and fall and spring of kindergarten, served as the dependent
variables. Children were nested within classrooms, and the Time variable (coded as 0, 1, 2, 3 for
the four time points from fall pre-k to spring kindergarten) was used as an indicator of
children’s growth on each outcome over time. The base model included the following
covariates: child gender (F=0, M=1), child race (Non-White=0, White=1), child ethnicity (Non-
Latino=0, Latino=1), child IEP status (No=0, Yes=1), child English/Spanish language proficiency
level assessed at fall of pre-k (1–5), family income (Category Two=0, Category One=1), program
type at pre-k (public school system=0, private setting=1), lead pre-k teacher certification
(Teacher not certified=0, Teacher certified=1), and class size (time varying for pre-k and
kindergarten). PreLAS English language proficiency level was included for English outcome
measures for the full sample and the DLL subsample English language outcomes, and Spanish
language proficiency level for the DLL subsample Spanish language outcomes. All continuous
covariates were centered. Additionally, the comparison of rates of change in each outcome,
based on the full sample, tested the differences in the amount of growth in each outcome of
interest between the pre-k year and kindergarten year. A FIML (Full Information Maximum
Likelihood) procedure was used to estimate missing values for the regression analyses.
Moderators of Growth To examine moderators of growth in children’s outcomes over the two years of the study, the
second series of three-level HLM models were conducted building upon the base model
described above, using the full sample. Separate models were conducted for each outcome of
interest, with particular child, family, and teacher characteristics tested as potential moderators
of children’s growth, after accounting for the covariates presented in the base model. These
moderators included: child race, child English proficiency level, family income, pre-k teacher
certification, class size (time varying for pre-k and kindergarten classrooms), and pre-k program
type. A third series of three-level HLM models was conducted to examine classroom quality as
a potential moderator of growth. These models built upon the second series of models and
included the main effects of the CLASS Emotional Support, Classroom Organization, and
Instructional Support domain scores, and the interactions of each of these quality domains with
Time. A FIML procedure was used to estimate missing values for the regression analyses.
Q ua l ity o f C la ssroo m Pra ct i ces
Analyses were conducted to examine the quality of instructional practices in pre-k and
kindergarten classrooms for the observed samples of classrooms attended by children in the
study. Descriptive analyses were conducted for pre-k CLASS and kindergarten CLASS K-3
scores on each domain, including means and frequency distributions. T-tests compared the
CLASS domain scores between pre-k and kindergarten classrooms.

11
Results
Ch i ldr en ’ s G ro wth ov er T i m e
Full Sample
Children who attended Georgia’s Pre-K Program made significant gains on almost all measures
from entry into pre-k through the end of kindergarten. They demonstrated significant growth
across all domains of learning (based on regression results): Language/literacy skills (WJ-III
Letter-Word Identification, WJ-III Sound Awareness, WJ-III Word Attack, Naming Letters
Task), Math skills (WJ-III Applied Problems, Counting Task), General knowledge (Social
Awareness Task), and Behavior skills (SSiS Social Skills). Two areas that showed no changes
over this time period were WJ-III Picture Vocabulary and SSiS Problem Behaviors, which had
scores around the population mean at both time points (see Table 6, Table 7, and Table 8).
In general, children showed consistent gains on many of the norm-referenced measures (WJ-III
and SSiS), with average scores at or slightly below the population mean of 100 at the beginning
of pre-k and slightly to somewhat above the mean (from about 0.2 to almost 1 SD higher) by the
end of kindergarten. Growth on these measures indicates that children progressed at an even
greater rate from their entry into Georgia’s Pre-K through the end of kindergarten than would
be expected for normal developmental growth. However, without a comparison group, it is not
possible to establish a clear causal link between outcomes and program participation. Growth
on the other measures showed substantial gains in knowledge. For example, at the beginning of
pre-k, children on average could name 13 letters, count 18 items in one-to-one correspondence,
and respond to 4 (of 6) items about basic self-knowledge (such as name and birthday). By the
end of pre-k, children on average could name 20 letters, count 27 items, and respond to 5 self-
knowledge items; and by the end of kindergarten, could name almost all 26 letters, count 37
items, and respond to almost all 6 of the self-knowledge items.
Comparisons of children’s growth in pre-k and kindergarten showed that children made
significant gains at both time points on most measures, with only two exceptions. On WJ-III
Picture Vocabulary, a norm-referenced measure, children’s scores remained consistent in pre-k
but showed a small, significant decrease in kindergarten. Similarly, on SSiS Problem Behaviors,
also a norm-referenced measure, children’s scores remained consistent in pre-k, but showed a
slight increase in kindergarten (i.e., more problem behaviors). Comparisons of the relative rates
of growth showed that children made greater gains in pre-k than in kindergarten on measures
of early skills in literacy, math, and self-knowledge, as well as social skills: Naming Letters
Task, Counting Task, Social Awareness Task, and SSiS Social Skills. Conversely, children made
greater gains in kindergarten than in pre-k on three measures of literacy and math skills: WJ-III
Letter Word Identification, WJ-III Word Attack, and WJ-III Applied Problems. Rates of growth
were not significantly different in pre-k and kindergarten on the remaining three measures:
WJ-III Picture Vocabulary, WJ-III Sound Awareness, and SSiS Problem Behaviors. (See Table 9.)

12
DLL Subsample
For the subsample of Spanish-speaking DLLs who attended Georgia’s Pre-K Program, growth
in skills in both English and Spanish were examined from entry into pre-k through the end of
kindergarten. Children in the DLL subsample made significant gains for all skills measured in
English (based on regression results): Language/literacy skills (WJ-III Letter-Word
Identification, WJ-III Picture Vocabulary, WJ-III Sound Awareness, WJ-III Word Attack,
Naming Letters Task), Math skills (WJ-III Applied Problems, Counting Task), and General
knowledge (Social Awareness Task). In general, children exhibited continued gains throughout
this time period, with scores on norm-referenced measures slightly below the mean at the
beginning of pre-k and close to or slightly above the mean by the end of kindergarten. The one
area where scores tended to be consistently lower was vocabulary, with scores still about 1 SD
below the population mean by the end of kindergarten. As described previously, growth on
these norm-referenced measures indicates that children progressed at an even greater rate from
entry into Georgia’s Pre-K through kindergarten than would be expected for normal
developmental growth. They also showed substantial growth on the other measures from pre-k
through kindergarten. At the beginning of pre-k, children could on average name 7 letters,
count 12 items in one-to-one correspondence, and respond to 2 (of 6) items about basic self-
knowledge (such as name and birthday). By the end of pre-k, children on average could name
16 letters, count 22 items, and respond to 4 self-knowledge items; and by the end of
kindergarten, could name 25 (of 26) letters, count 36 items, and respond to 5 of the self-
knowledge items (see Table 10, Table 11, and Table 12).
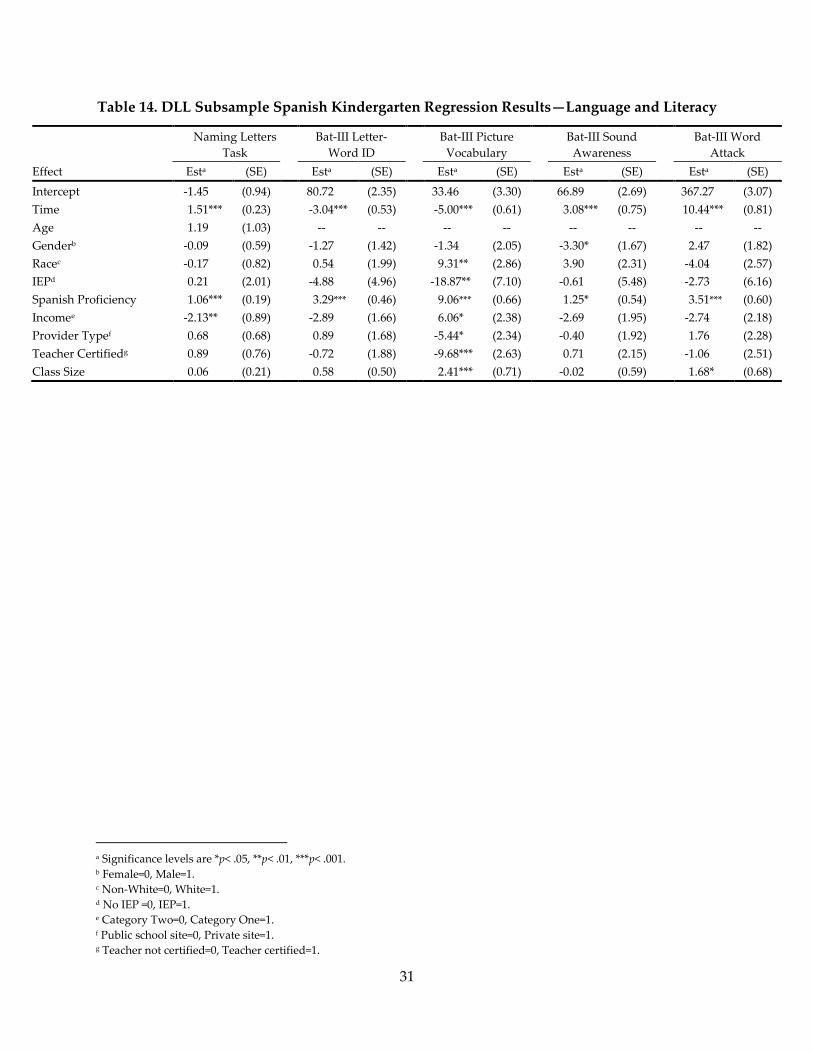
Children in the DLL subsample also showed significant gains throughout this time period for
most of the same skills measured in Spanish, including all domains of learning:
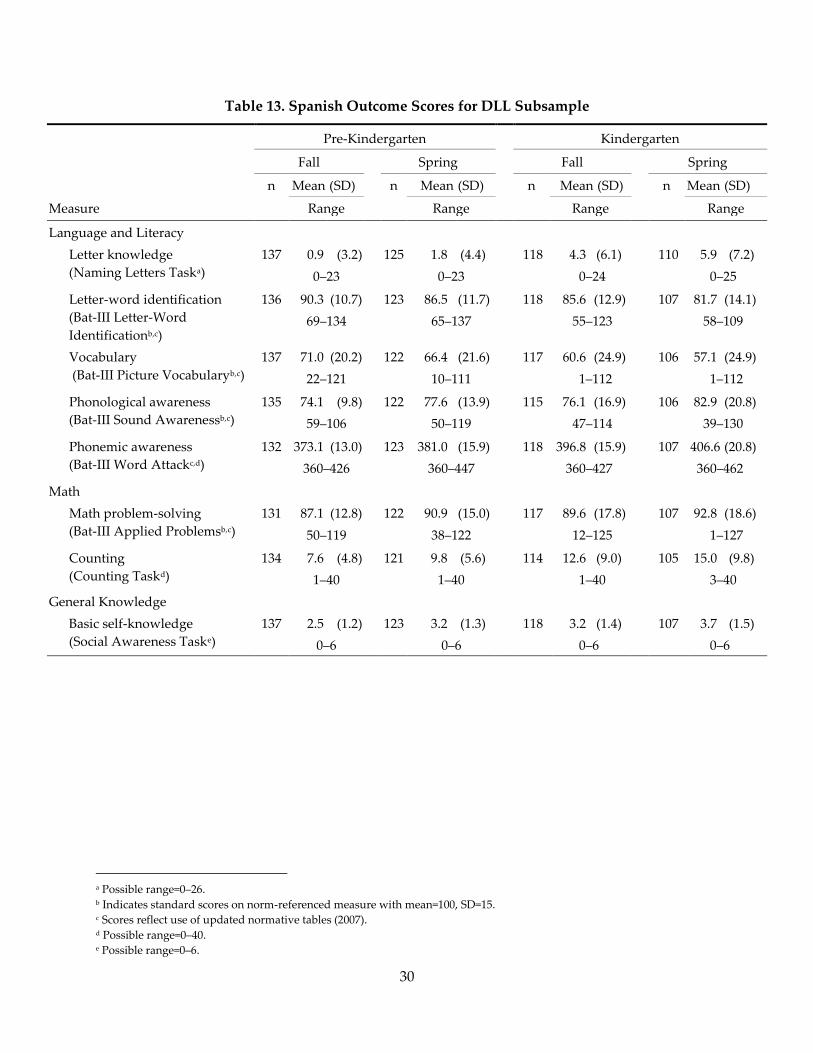
Language/literacy (Bat-III Sound Awareness, Bat-III Word Attack, Naming Letters Task), Math
(Bat-III Applied Problems, Counting), and General knowledge (Social Awareness). As described
previously, growth on the norm-referenced measures indicates that children progressed at an
even greater rate from entry into Georgia’s Pre-K through kindergarten than would be expected
for normal developmental growth. For two measures of Language/literacy skills (Bat-III Letter-
Word Identification, Bat-III Picture Vocabulary), children showed significant decreases in
Spanish scores from pre-k through kindergarten, suggesting that they were making less
progress than expected in their home language for normal developmental growth. In general,
for skills in Spanish, the average scores on norm-referenced measures were well below the
mean (1-2 SD) at the beginning of pre-k and still remained somewhat below the mean by the
end of kindergarten. For the other measures of skills in Spanish, children showed consistent
growth, although at a slower rate with scores at a lower level than for the same skills measured
in English. At the beginning of pre-k, children could on average name 1 letter, count 8 items in
one-to-one correspondence, and respond to under 3 (of 6) items about basic self-knowledge
(such as name and birthday). By the end of pre-k, children on average could name 2 letters,
count 10 items, and respond to 3 self-knowledge items; and by the end of kindergarten, could
name 6 letters, count 15 items, and respond to 4 self-knowledge items (see Table 13, Table 14,
and Table 15).

13
Mod er ato rs o f Chi l dr en ’ s G ro wth
Child/Family Characteristics Specific child and family characteristics were examined as potential moderators of children’s
rates of skill growth from entry into Georgia’s Pre-K through the end of kindergarten for the
full sample. These included children’s race, children’s English language proficiency, and family
income (see Table 16 and Table 17).
The most consistent factor predicting differences in children’s rates of growth from pre-k
through kindergarten was their level of English language proficiency, with moderating effects
found for most measures. Generally, children with lower levels of English proficiency made
greater gains compared to children with higher levels of language proficiency. However, their
scores tended to be lower at entry into pre-k and remained lower through the end of
kindergarten for most measures. In the area of Language/literacy skills, moderating effects were
found on three measures. On WJ-III Letter-Word Identification, children at the lowest
proficiency level exhibited greater growth from pre-k through kindergarten than children at
higher levels (1>3,4,5); further, the literacy scores were consistently lower for children at lower
proficiency levels than for children at the highest proficiency level (see Figure 1). A similar
pattern was found on WJ-III Picture Vocabulary, where children at the lowest proficiency level
exhibited greater growth from pre-k through kindergarten than children at higher levels
(1>2,3,4,5); further, the language scores were lower for these children compared to their peers
(see Figure 2). On the Naming Letters Task, children at lower proficiency levels exhibited
greater growth from pre-k through kindergarten than children at the highest proficiency level
(1,2,3,4>5); further, literacy scores tended to be lower for children at lower proficiency levels
than for their peers at higher levels (1,2<3,4<5) from entry into pre-k through the beginning of
kindergarten, but there were no differences in scores by the end of kindergarten (see Figure 3).
There also were moderating effects of English language proficiency for both measures of math
skills, as well as for the measure of basic self-knowledge. On WJ-III Applied Problems, children
at lower proficiency levels exhibited greater growth from pre-k through kindergarten than
children at higher levels (1>2,3,4>5); math scores were generally lower for children at lower
proficiency levels compared to peers at higher levels from pre-k through the beginning of
kindergarten, although by the end of kindergarten, the differences among children at the three
lowest levels were no longer significant (see Figure 4). On the Counting Task, children at lower
proficiency levels made greater gains than their peers at higher proficiency levels (1,3,4>5);
further, counting scores generally were lower for children at lower proficiency levels compared
to those at higher proficiency levels (see Figure 5). On the Social Awareness Task, children at
lower proficiency levels showed greater gains than their peers (1,2>3,4>5); however, social
awareness scores tended to be lower for children with lower English proficiency levels from
pre-k through kindergarten (see Figure 6).
Moderating effects of English language proficiency also were found for teacher ratings of
behavior skills. On the SSiS Social Skills measure, children at the lowest proficiency level
showed greater growth than their peers at higher proficiency levels (1>3,4,5); further, social

14
skills ratings were lower for children at the lowest proficiency level at entry into pre-k than for
their more proficient peers, but by the end of kindergarten, these differences only existed in
comparison to the highest proficiency level group (see Figure 7). On SSiS Problem Behaviors,
children at the two lowest proficiency levels showed greater decreases in problem behaviors
than children at the highest proficiency level (1,2>5); further, problem behavior ratings were
higher at entry into pre-k through the beginning of kindergarten for children at lower
proficiency levels compared to children at the highest proficiency level, but there were no
differences in scores by the end of kindergarten (see Figure 8).
There were fewer differences on other child and family characteristics. In general, however,
children who entered Georgia’s Pre-K with lower scores based on these characteristics made
greater gains through kindergarten than children who entered with higher scores. Further, in
most cases, these differences in scores were no longer apparent by the end of kindergarten.
With regard to race, white children scored lower at entry into Georgia’s Pre-K compared to non-
white children, but made greater gains through kindergarten on some language/literacy skills
(WJ-III Letter-Word Identification, WJ-III Word Attack, Naming Letters Task) and on the Social
Awareness Task (see Figure 9, Figure 10, Figure 11, and Figure 12). Children from lower-income
families (Category One) exhibited greater growth than children from higher-income families
(Category Two) on the Naming Letters Task and Counting Task (see Figure 13 and Figure 14).
On SSiS Problem Behaviors, there was little difference in scores at the beginning of pre-k, but
children from higher-income families showed greater decreases in scores through the end of
kindergarten (see Figure 15).
Classroom/Teacher Characteristics Specific classroom and teacher characteristics also were examined as potential moderators of
children’s rates of growth in skills from entry into Georgia’s Pre-K through kindergarten for the
full sample. These included pre-k program type (public school system vs private program), pre-
k teacher Georgia PSC certification, and class size (in pre-k and kindergarten). (See Table 16 and
Table 17.)
There were some effects for pre-k program type on children’s rates of growth in language and
literacy skills. Children who attended public school settings in pre-k exhibited greater growth
through kindergarten on WJ-III Letter-Word Identification, WJ-III Sound Awareness, WJ-III
Word Attack, and the Naming Letters Task compared to children who attended private settings
in pre-k. Scores were lower at entry into pre-k for children who attended public school settings,
but generally were similar to those who attended private settings by the end of kindergarten
(see Figure 16, Figure 17, Figure 18, and Figure 19). There were no significant moderating effects
on children’s rates of growth for pre-k teacher certification or class size.
Classroom Quality Moderators The quality of classroom instructional practices in pre-k and kindergarten were examined as
potential moderators of children’s rates of growth in skills from entry into Georgia’s Pre-K
through kindergarten for the full sample. Specifically, teacher-child instructional interactions, as

15
measured by the CLASS Emotional Support, Classroom Organization, and Instructional
Support domains were examined (see Table 18 and Table 19).
Some positive associations were found for CLASS, with higher Classroom Organization and
Instructional Support scores related to greater growth on WJ-III Word Attack (see Figure 20 and
Figure 21). Also, higher CLASS Instructional Support scores were related to greater growth on
teacher ratings on SSiS social skills (see Figure 22). These results indicate that children who
experienced classrooms with higher-quality classroom organization and instructional support
in pre-k and kindergarten made greater gains in these skills compared to children in lower-
quality classrooms.
The moderating effects related to CLASS Emotional Support were more mixed, with positive
effects for the Naming Letters Task and Counting Task, and negative effects for WJ-III Letter-
Word Identification and WJ-III Word Attack (see Figure 23, Figure 24, Figure 25, and Figure 26).
These results indicate that children who experienced classrooms with higher-quality emotional
support in pre-k and kindergarten showed greater growth in letter naming and counting skills,
but lower rates of growth in letter and word identification and phonemic awareness skills
compared to children in lower-quality classrooms. It is important to note that the three domains
on the CLASS are fairly highly correlated (ES-CO r=.80 PK, .78 K; ES-IS r=.59 PK, .46 K; CO-IS
r=.57 PK, .52K) and that these results indicate the unique effects for CLASS Emotional Support
after taking into account the variance attributable to the other two CLASS domains (Classroom
Organization and Instructional Support).
Quality of Classroom Practices in Pre-K and Kindergarten The quality of teacher-child instructional interactions in both pre-k and kindergarten was
examined using the CLASS (see Table 20). Scores varied across the different domains, with
similar patterns in pre-k and kindergarten. Classroom practices were stronger in Emotional
Support (Pre-K=5.7, K=5.2) and Classroom Organization (Pre-K=5.5, K=5.3), with average scores
in the middle to high quality range, than in Instructional Support (Pre-K=2.6, K=2.5), with an
average score in the low to middle range. Average scores on the individual dimensions within
each domain generally were in the same range as the overall domain scores, although there was
some variability among individual classrooms. Most pre-k (72%) and about half of kindergarten
(47%) classrooms scored in the high range (5.5–7.0) on Emotional Support, with most of the
remainder (29% Pre-K, 52% K) scoring in the middle range (2.5–5.4). (See Figure 27.) On
Classroom Organization, over half of all classrooms (59% pre-k, 51% kindergarten) scored in the
high range (5.5–7.0) and the remainder (41% Pre-K, 49% K) scored in the middle range (2.5–5.4).
(See Figure 28.) In contrast, about half of the classrooms (45% Pre-K, 53% K) scored in the low
range (1–2.4) on Instructional Support and about half (54% Pre-K, 47% K) scored in the middle
range (2.5–5.4). (See Figure 29.)
Comparisons indicated that the CLASS scores were slightly higher in the sample of Georgia’s
Pre-K classrooms than in the kindergarten classrooms for two of the three domains: Emotional
Support [t(493)=7.30, p<.001], and Classroom Organization [t(493)=2.14, p=.033]. Scores were not
significantly different between pre-k and kindergarten classrooms on Instructional Support.

16
Conclusions
This study examined findings through the second year of a longitudinal study of over 1,000
children who attended Georgia’s Pre-K Program. The results showed significant growth in
learning outcomes from entry into pre-k though the end of kindergarten across all domains of
language (phonological awareness), literacy (pre-reading/reading skills), math (math problem-
solving and counting), general knowledge (basic self-knowledge), and behavior skills (social
skills). Gains on many of these outcomes which used norm-referenced measures indicated that
children were progressing at an even greater rate than expected for normal developmental
growth. For two measures (vocabulary and problem behaviors), scores remained around the
population mean, which suggests that children were progressing as expected for their age.
When examined by grade, children exhibited gains during both pre-k and kindergarten. Not
surprisingly, however, children demonstrated greater gains in pre-k than in kindergarten on
some early skills, while they showed greater gains in kindergarten on some more advanced
literacy and math skills.
The subsample of Spanish-speaking DLLs showed growth from pre-k through kindergarten on
all measures in English and most in Spanish, even though the language of instruction in these
classrooms is primarily in English. Their skills tended to be more advanced in English than in
Spanish, although the one area where scores were consistently lower in both languages was
vocabulary. Given these findings, it may be worth considering further focus on instructional
practices to support children’s vocabulary development both in English and their home
language.
When examining factors that predict better learning outcomes, there was a general pattern
where children who entered pre-k with lower scores made greater gains through kindergarten.
The most consistent predictor of greater growth in skills was English language proficiency.
Children with lower proficiency levels made greater gains on the various outcome measures
compared to their peers, although they still had not caught up to their peers by the end of
kindergarten in most cases. These effects were less strong for other child/family characteristics
(children’s race, family income), with no differences by the end of kindergarten. The same
pattern was seen for program type, where children in public school programs scored lower on
some literacy skills at entry into pre-k than children in private programs, but made greater
gains, with similar scores by the end of kindergarten.
The quality of teacher-child instructional interactions, as measured by the CLASS, showed a
similar pattern across the randomly-selected pre-k and kindergarten classrooms attended by
children in the study. Scores were generally in the middle to high range for Emotional Support
and Classroom Organization, and in the low to middle range for Instructional Support—a
common finding in early education classrooms xvi, xvii, xviii. Although the overall pattern was
similar, scores were slightly, but significantly, higher on the Emotional Support and Classroom
Organization domains in the pre-k classrooms than in the kindergarten classrooms. These
findings suggest that between pre-k and kindergarten children are experiencing substantial
continuity in the level of teaching and learning opportunities, on average, between pre-k and
kindergarten.

17
Further, there was some evidence that children who attended pre-k and kindergarten
classrooms with better quality classroom organization and instructional support had better
learning outcomes, most consistently in terms of greater growth in phonemic awareness skills.
In contrast, attending classrooms that were higher in emotional support had positive effects on
gains in early literacy and math skills, but resulted in lower gains for more advanced literacy
skills. Taken together, these findings suggest that these associations are somewhat nuanced, and
that various aspects of quality may be more strongly associated with specific child outcomes,
especially at different points in a child’s schooling career. However, these contrasting results
also may be a function of the unique variance of this particular aspect of quality, given the fairly
high correlations among the various quality measures as well as the greater variability between
pre-k and kindergarten in the emotional support measure.
In sum, these longitudinal findings suggest that children who attended Georgia’s Pre-K
Program continued to exhibit positive outcomes through the end of kindergarten across all
domains of learning, including skills in English for all children and in English and Spanish for
DLLs. One important distinction of this study is that classroom quality in both pre-k and
kindergarten were assessed and taken into account as potential factors affecting children’s
growth. Moreover, when examining classroom quality, the similarities across both years are
notable. These consistent patterns of child outcomes and classroom quality from pre-k through
kindergarten offer some potential evidence of positive continuities in experiences for children
who attended Georgia’s Pre-K Program.

18
Table 1. Characteristics of Pre-Kindergarten Classrooms and Teachers
n Mean Range
Classroom Characteristics
Class size 189 21.1 14-23
Proportion of Boys 189 50.1% 18.2%-81.8%
Percent children with limited English
language proficiency 199 11.2% 0.0%-100.0%
Teacher Experience
Years of experience teaching pre-k 184 5.8 0-23
Years of experience at current school 184 5.1 0-21
Total years of teaching experience 179 11.1 1-38
n %
Teacher Gender 189
Female 186 98.4
Male 3 1.6
Teacher Ethnicity 189
Hispanic/Latino 5 2.7
Teacher Race 189
White 132 69.8
Non-White 57 30.2
Teacher Highest Degree Earned 184
Associate’s Degree 4 2.2
Bachelor’s Degree 118 64.1
Master’s Degree 52 28.3
Education Specialist 9 4.9
PhD/EdD/PsyD 1 0.5

19
Table 2. Characteristics of Kindergarten Classrooms and Teachers
n Mean Range
Classroom Characteristics
Class size 772 20.1 4-27
Proportion of Boys 768 51.3% 0.0%-100%
Percent children with limited English
language proficiency 770 14.7% 0.0%-100.0%
Teacher Experience
Years of experience teaching kindergarten 777 8.5 0-39
Years of experience at current school 774 8.8 0-33
Total years of teaching experience 777 14.5 0-46
n %
Teacher Gender 777
Female 762 98.1
Male 15 1.9
Teacher Ethnicity 777
Hispanic/Latino 13 1.7
Teacher Race 777
White 621 79.9
Non-White 156 20.1
Teacher Highest Degree Earned 777
High School Diploma/GED 1 0.1
Bachelor’s Degree 293 37.8
Master’s Degree 338 43.5
Education Specialist 135 17.4
PhD/EdD/PsyD 10 1.2

20
Table 3. Characteristics of Children in the Sample
Original Year 1 Sample
In Year 2 Sample
n=1034
Not in Year 2 Sample
n=135
Characteristica % n %b n
Child’s age on 9/1 of kindergarten year 5.5 1,034 5.5 135
Gender
Male 48.0 496 53.3 72
Female 52.0 538 46.7 63
Ethnicity
Hispanic/Latino 14.7 152 13.3 18
Race
White 53.4 552 47.4 64
Black/African American 38.0 393 40.7 55
Multi-racial 4.7 48 5.2 7
Asian 2.1 22 5.2* 7
Native American/Alaskan Native 1.6 17 1.5 2
Native Hawaiian/Pacific Islander 0.2 2 0.0 0
Incomec
Category One 55.2 571 48.1 65
Category Two 44.8 463 51.9 70
Limited English language proficiency 10.4 108 5.9 8
Individualized Education Program 3.1 32 1.5 2
Parent educationd,e
Level 1 11.5 115 3.8 5
Level 2 61.8 619 68.7 90
Level 3 26.7 267 27.5 36
a Source of data: Bright from the Start: Georgia Department of Early Care and Learning (DECAL) for all characteristics
except parent education, which was obtained from parent surveys. b Significance levels are *p< .05, **p< .01, ***p< .001. c Category One represents participation in one or more of the following programs: SNAP, TANF, SSI, CAPS, Medicaid, free
or reduced-price meals. d Level 1=less than high school; Level 2=high school diploma to less than bachelor’s degree; Level 3=bachelor’s degree or
higher. e Data were not reported for 37 children.

21
Table 4. Child Outcome and Classroom Quality Measures
Measure Scoring
Language and Literacy Skills
Letter knowledgea Total score,
Naming Letters Task Range=0–26
Letter-word identificationa
Woodcock-Johnson III Tests of Achievement Letter-Word Identification
(Subtest 1) / Batería III Pruebas de Aprovechamiento Identificación de
Letras y Palabras (Prueba 1)
Standard score,
Mean=100, SD=15
Vocabularya
Woodcock-Johnson III Tests of Achievement Picture Vocabulary (Subtest
14) / Batería III Pruebas de Aprovechamiento Vocabulario sobre Dibujos
(Prueba 14)
Standard score,
Mean=100, SD=15
Phonological awarenessa
Woodcock-Johnson III Tests of Achievement Sound Awareness (Subtest
21) / Batería III Pruebas de Aprovechamiento Discernimiento de sonidos
(Prueba 21)
Standard score,
Mean=100, SD=15
Phonemic awarenessa
Woodcock-Johnson III Tests of Achievement Word Attack (Subtest 13) /
Batería III Pruebas de Aprovechamiento Análisis de Palabras (Prueba 13)
W score,
Range=360–545
Math Skills
Math problem-solvinga
Woodcock-Johnson III Tests of Achievement Applied Problems (Subest
10) / Batería III Pruebas de Aprovechamiento Problemas Aplicados
(Prueba 10)
Standard score,
Mean=100, SD=15
Countinga Total score,
Counting Task Range=0–40
General Knowledge
Basic self-knowledgea Total score,
Social Awareness Task Range=0–6
Classroom Behavior
Social skillsb
Social Skills Improvement System (SSiS) Social Skills subscale Standard score,
Mean=100, SD=15
Problem behaviors
Social Skills Improvement System (SsiS) Problem Behaviors subscale Standard score,
Mean=100, SD=15
Classroom Quality
Teacher-child instructional interactions
Classroom Assessment Scoring System (CLASS)
Emotional Support, Classroom Organization, Instructional Support
Domain score range=1.0–7.0
low (1–2); middle (3–5); high (6–7)
a These measures are individually administered to children. Both English and Spanish language versions of these measures
were used with dual-language learners. b These measures are teacher ratings of individual children’s skills.

22
Table 5. Child Language Proficiency Levels at Pre-K Entry
English Language
Proficiency
Spanish Language
Proficiency
preLAS Proficiency Level
Full Sample DLL Subsample DLL Subsample
% n % n % n
Level 1 (Non-Speakers) 7.9 91 47.1 65 34.1 46
Level 2 (Limited Speakers) 4.1 48 13.8 19 7.4 10
Level 3 (Limited Speakers) 14.3 166 18.1 25 17.0 23
Level 4 (Fluent Speakers) 26.2 303 11.6 16 21.5 29
Level 5 (Fluent Speakers) 47.5 551 9.4 13 20.0 27
Total 100.0 1159 100.0 138 100.0 135

23
Table 6. Child Outcomes for Full Sample (2013-2015)
Measure
Pre-Kindergarten Kindergarten
Fall Spring Fall Spring
n Mean (SD) n Mean (SD) n Mean (SD) n Mean (SD)
Range Range Range Range
Language and Literacy
Letter knowledge
(Naming Letters Taska)
1,160 13.3 (10.0) 1,055 19.9 (8.0) 1,025 23.8 (4.9) 1,009 25.5 (2.1)
0–26 0–26 0–26 0–26
Letter-word identification
(WJ-III Letter-Word
Identificationb,c)
1,156 100.7 (13.8) 1,051 103.2 (12.7) 1,024 107.3 (12.7) 1,007 113.9 (13.2)
60–183 61–184 69–178 62–182
Vocabulary
(WJ-III Picture Vocabularyb.c)
1,160 99.9 (13.6) 1,052 99.8 (11.8) 1,024 99.3 (10.6) 1,007 98.8 (10.2)
31–134 39–141 48–131 44-133
Phonological awareness
(WJ-III Sound Awarenessb,c)
1,137 95.9 (17.4) 1,044 102.3 (18.8) 1.022 106.9 (19.0) 1,001 114.4 (19.7)
58-166 56–163 48-163 47–200
Phonemic awareness
(WJ-III Word Attackc,d)
1,159 386.2 (23.5) 1.052 403.5 (26.7) 1,025 430.0 (28.4) 1,008 459.2 (26.4)
364–510 364–510 364–520 364-545
Math
Math problem-solving
(WJ-III Applied Problemsb,c)
1,150 102.8 (13.2) 1,052 103.7 (11.7) 1,025 104.7 (11.2) 1,006 106.5 (12.0)
56-143 53–127 71–143 62-149
Counting
(Counting Taske)
1,142 18.0 (11.3) 1,050 26.7 (11.7) 1,024 32.8 (10.0) 1,007 37.2 (6.7)
1–40 1–40 3–40 5–40
General Knowledge
Basic self-knowledge
(Social Awareness Taskf)
1,165 4.3 (1.5) 1,055 4.9 (1.3) 1,025 5.2 (1.1) 1,009 5.5 (2.1)
0–6 0–6 1–6 2–6
Classroom Behavior
Social Skills
(SSiSb)
1,088 96.4 (16.0) 949 100.0 (14.9) 865 100.7 (14.5) 851 102.4 (15.1)
40-130 50-129 52-131 649-131
Problem Behaviors
(SSiSb)
1.093 100.8 (15.5) 953 100.8 (15.3) 873 99.0 (13.7) 853 99.5 (14.4)
82-160 82-160 83-151 83-158
a Possible range=0–26. b Indicates standard scores on norm-referenced measure with mean=100, SD=15. c Scores reflect use of updated normative tables (2007). d W scores were used for this measure. Possible range≈360–545. e Possible range=0–40. f Possible range=0–6.

24
Table 7. Full Sample Kindergarten Regression Results—Language and Literacy
Naming Letters
Task
WJ-III Letter-
Word ID
WJ-III Picture
Vocabulary
WJ-III Sound
Awareness
WJ-III Word
Attack
Effect Esta (SE) Esta (SE) Esta (SE) Esta (SE) Esta (SE)
Intercept 9.16 (0.62) 90.26 (1.17) 81.26 (0.81) 65.18 (1.46) 359.37 (2.26)
Time 4.16*** (0.10) 4.50*** (0.17) -0.21 (0.13) 6.43*** (0.25) 23.91*** (0.40)
Age 2.22*** (0.47) -- -- -- -- -- -- -- --
Genderb -0.54 (0.28) -1.15* (0.53) 1.70*** (0.37) -0.68 (0.65) -0.97 (1.01)
Racec -1.31*** (0.30) -3.85*** (0.59) 1.03* (0.40) 1.66* (0.73) -2.69** (1.13)
Ethnicityd -0.05 (0.46) 0.40 (0.90) -7.62*** (0.62) -1.52 (1.11) 2.70 (1.72)
IEPe -0.75 (0.84) -3.79* (1.60) -1.65 (1.12) -8.37** (2.01) -3.01 (3.07)
English Proficiency 1.48*** (0.14) 2.83*** (0.26) 4.47*** (0.18) 7.25*** (0.32) 6.48*** (0.49)
Incomef -1.42*** (0.30) -3.98*** (0.58) -2.36*** (0.40) -4.61*** (0.71) -5.46*** (1.10)
Provider Typeg 0.17 (0.33) 0.99 (0.66) -0.09 (0.42) 1.79* (0.83) 1.25 (1.24)
Teacher Certifiedh -0.28 (0.43) -0.70 (0.86) 0.07 (0.56) 2.02 (1.08) -0.31 (1.63)
Class Size 0.20 (0.11) 0.46* (0.22) -0.01 (0.14) 0.44 (0.28) 0.88* (0.41)
a Significance levels are *p< .05, **p< .01, ***p< .001. b Female=0, Male=1. c Non-White=0, White = 1. d Non-Latino=0, Latino=1. e No IEP=0, IEP=1. f Category Two=0, Category One=1. g Public school site=0, Private site=1. h Teacher not certified=0, Teacher certified=1.

25
Table 8. Full Sample Kindergarten Regression Results—Math, General Knowledge, and Classroom Behavior
Math
General
Knowledge Classroom Behavior
WJ-III Applied
Problems Counting Task
Social
Awareness Task SSiS Social Skills
SSiS Problem
Behaviors
Effect Esta (SE) Esta (SE) Esta (SE) Esta (SE) Esta (SE)
Intercept 82.08 (0.95) 11.06 (0.85) 3.12 (0.09) 83.49 (1.47) 105.93 (1.41)
Time 1.20*** (0.16) 6.48*** (0.16) 0.41*** (0.02) 2.08*** (0.26) 0.25 (0.24)
Age -- -- 4.55*** (0.62) 0.24*** (0.07) -- -- -- --
Genderb -0.02 (0.43) -1.05** (0.37) -0.09* (0.04) 1.02 (0.64) -0.57 (0.61)
Racec 3.45*** (0.48) -1.29** (0.41) -0.25*** (0.05) 1.82* (0.74) 0.01 (0.72)
Ethnicityd 0.27 (0.73) 0.56 (0.62) -0.41*** (0.07) 5.55*** (1.10) -6.82*** (1.06)
IEPe -5.22*** (1.31) -2.54* (1.14) -0.36** (0.13) -6.81*** (2.01) 5.69** (1.93)
English Proficiency 4.67*** (0.21) 2.14*** (0.18) 0.34*** (0.02) 2.99*** (0.32) -1.62*** (0.31)
Incomef -2.89*** (0.47) -1.36*** (0.40) -0.22*** (0.05) -1.53* (0.71) 1.68* (0.68)
Provider Typeg 1.31* (0.53) 0.58 (0.44) -0.02 (0.05) -1.22 (0.92) 1.65 (0.89)
Teacher Certifiedh 0.83 (0.69) -0.14 (0.58) -0.17** (0.06) -1.83 (1.18) 1.88 (1.15)
Class Size 0.22 (0.18) 0.21 (0.15) 0.03 (0.02) 0.30 (0.29) -0.13 (0.29)
a Significance levels are *p< .05, **p< .01, ***p< .001. b Female=0, Male=1. c Non-White=0, White =1. d Non-Latino=0, Latino=1. e No IEP=0, IEP=1. f Category Two=0, Category One=1. g Public school site=0, Private site=1. h Teacher not certified=0, Teacher certified=1.

26
Table 9. Comparisons of Children’s Growth in Pre-K and Kindergarten
Measure
Estimate Standard
Error
Degrees of
Freedom
t-Value p-Value
Naming Letters Task 4.80 0.27 971 17.79 <.001
WJ-III Letter Word ID -3.97 0.39 971 -10.17 <.001
WJ-III Picture Vocabulary 0.63 0.34 969 1.86 .064
WJ-III Sound Awareness -0.79 0.65 963 -1.21 .225
WJ-III Word Attack -11.68 1.13 971 -10.31 <.001
WJ-III Applied Problems -0.89 0.44 970 -2.04 .042
Counting Task 4.42 0.50 969 8.90 <.001
Social Awareness Task 0.28 0.05 971 5.27 <.001
SSiS Social Skills 1.49 0.70 774 2.14 .033
SSiS Problem Behaviors -0.65 0.61 776 -1.07 .287

27
Table 10. English Outcome Scores for DLL Subsample
Measure
Pre-Kindergarten Kindergarten
Fall Spring Fall Spring
n Mean (SD) n Mean (SD) n Mean (SD) n Mean (SD)
Range Range Range Range
Language and Literacy
Letter knowledge
(Naming Letters Taska)
132 7.3 (9.3) 126 15.5 (9.3) 118 22.3 (6.1) 116 25.2 (2.9)
2–26 0–26 0–26 0–26
Letter-word identification
(WJ-III Letter-Word
Identificationb,c)
133 91.2 (14.2) 126 97.8 (12.8) 118 102.8 (13.2) 116 109.9 (12.6)
60–133 63–148 71–154 77–148
Vocabulary
(WJ-III Picture Vocabularyb,c)
135 77.3 (19.3) 126 82.4 (13.8) 118 84.5 (11.4) 114 86.0 (9.3)
31–120 39–112 48–117 59–110
Phonological awareness
(WJ-III Sound Awarenessb,c)
129 82.1 (10.9) 126 85.0 (15.8) 117 90.1 (17.3) 116 99.5 (19.4)
61–123 56–142 55–136 47–148
Phonemic awareness
(WJ-III Word Attackc,d)
132 374.6 (16.7) 125 391.3 (24.3) 118 422.3 (28.0) 116 452.7 (25.36)
364–468 364–493 364–508 377–508
Math
Math problem-solving
(WJ-III Applied Problemsb,c)
131 90.3 (13.7) 125 96.4 (11.3) 118 99.6 (10.5) 116 103.0 (11.7)
59–122 53–127 71–129 63–130
Counting
(Counting Taske)
130 12.4 (8.6) 125 22.1 (12.0) 117 29.4 (11.0) 116 35.8 (7.8)
1–40 1–40 7–40 12–40
General Knowledge
Basic self-knowledge
(Social Awareness Taskf)
136 2.4 (1.4) 126 3.7 (1.6) 118 4.4 (1.4) 116 4.9 (1.1)
0–6 0–6 0–6 2–6
a Possible range=0–26. b Indicates standard scores on norm-referenced measure with mean=100, SD=15. c Scores reflect use of updated normative tables (2007). d W scores were used for this measure. Possible range≈360–545. e Possible range=0–40. f Possible range=0–6.

28
Table 11. DLL Subsample English Kindergarten Regression Results—Language and Literacy
Effect
Naming Letters
Task
WJ-III Letter-
Word ID
WJ-III Picture
Vocabulary
WJ-III Sound
Awareness
WJ-III Word
Attack
Esta (SE) Esta (SE) Esta (SE) Esta (SE) Esta (SE)
Intercept 5.30 (1.70) 84.73 (3.01) 63.47 (2.54) 63.83 (2.90) 360.61 (5.19)
Time 5.72*** (0.34) 6.71*** (0.49) 3.47*** (0.47) 6.39*** (0.65) 25.19*** (1.15)
Age 0.67 (1.56) -- -- -- -- -- -- -- --
Genderb 0.19 (0.88) -0.13 (1.58) 0.54 (1.35) -1.87 (1.57) 3.51 (2.74)
Racec 0.70 (1.23) -0.63 (2.24) 0.21 (1.90) 3.94 (2.18) 1.48 (3.85)
IEPd 4.07 (2.71) -3.84 (4.73) -0.87 (4.22) -7.72 (4.79) -4.21 (8.31)
English Proficiency 1.24*** (0.35) 2.68*** (0.63) 6.34*** (0.53) 5.85*** (0.61) 4.77*** (1.08)
Incomee 1.15 (1.14) 1.31 (2.06) -0.13 (1.73) 0.42 (2.01) 3.33 (3.53)
Provider Typef -0.84 (1.17) 1.05 (2.17) 1.41 (1.61) 2.90 (1.93) -4.60 (3.55)
Teacher Certifiedg -1.78 (1.29) -2.44 (2.39) 1.69 (1.82) 1.35 (2.17) -5.83 (3.94)
Class Size 0.93** (0.35) 0.78 (0.64) -0.77 (0.50) -0.27 (0.61) 1.73 (1.07)
a Significance levels are *p< .05, **p< .01, ***p< .001. b Female=0, Male=1. c Non-White=0, White =1. d No IEP =0, IEP=1. e Category Two=0, Category One=1. f Public school site=0, Private site=1. g Teacher not certified=0, Teacher certified=1.

29
Table 12. DLL Subsample English Kindergarten Regression Results—Math and General
Knowledge
Math General Knowledge
Effect
WJ-III Applied
Problems Counting Task Social Awareness Task
Esta (SE) Esta (SE) Esta (SE)
Intercept 77.37 (2.54) 8.50 (2.19) 1.33 (0.26)
Time 4.91*** (0.48) 7.77*** (0.47) 0.87*** (0.05)
Age -- -- 7.25*** (1.99) 0.21 (0.24)
Genderb -1.12 (1.36) -0.18 (1.12) -0.26 (0.14)
Racec 1.79 (1.91) -0.09 (1.56) 0.02 (0.19)
IEPd -4.25 (4.20) -2.71 (3.50) -0.64 (0.44)
English Proficiency 4.67*** (0.53) 2.82*** (0.45) 0.50*** (0.05)
Incomee 3.36 (1.77) 2.40 (1.47) 0.19 (0.18)
Provider Typef 0.54 (1.67) 1.62 (1.41) 0.12 (0.16)
Teacher Certifiedg -3.32 (1.85) -2.56 (1.57) -0.24 (0.18)
Class Size 0.19 (0.52) 0.55 (0.44) 0.03 (0.05)
a Significance levels are *p< .05, **p< .01, ***p< .001. b Female=0, Male=1. c Non-White=0, White =1. d No IEP =0, IEP=1. e Category Two=0, Category One=1. f Public school site=0, Private site=1. g Teacher not certified=0, Teacher certified=1.
30
Table 13. Spanish Outcome Scores for DLL Subsample
Measure
Pre-Kindergarten Kindergarten
Fall Spring Fall Spring
n Mean (SD) n Mean (SD) n Mean (SD) n Mean (SD)
Range Range Range Range
Language and Literacy
Letter knowledge
(Naming Letters Taska)
137
0.9 (3.2) 125
1.8 (4.4) 118 4.3 (6.1) 110 5.9 (7.2)
0–23 0–23 0–24 0–25
Letter-word identification
(Bat-III Letter-Word
Identificationb,c)
136
90.3 (10.7) 123
86.5 (11.7) 118 85.6 (12.9) 107 81.7 (14.1)
69–134 65–137 55–123 58–109
Vocabulary
(Bat-III Picture Vocabularyb,c)
137
71.0 (20.2) 122
66.4 (21.6) 117 60.6 (24.9) 106 57.1 (24.9)
22–121 10–111 1–112 1–112
Phonological awareness
(Bat-III Sound Awarenessb,c)
135
74.1 (9.8) 122
77.6 (13.9) 115 76.1 (16.9) 106 82.9 (20.8)
59–106 50–119 47–114 39–130
Phonemic awareness
(Bat-III Word Attackc,d)
132
373.1 (13.0) 123
381.0 (15.9) 118 396.8 (15.9) 107 406.6 (20.8)
360–426 360–447 360–427 360–462
Math
Math problem-solving
(Bat-III Applied Problemsb,c)
131
87.1 (12.8) 122
90.9 (15.0) 117 89.6 (17.8) 107 92.8 (18.6)
50–119 38–122 12–125 1–127
Counting
(Counting Taskd)
134
7.6 (4.8) 121
9.8 (5.6) 114 12.6 (9.0) 105 15.0 (9.8)
1–40 1–40 1–40 3–40
General Knowledge
Basic self-knowledge
(Social Awareness Taske)
137
2.5 (1.2) 123
3.2 (1.3) 118 3.2 (1.4) 107 3.7 (1.5)
0–6 0–6 0–6 0–6
a Possible range=0–26. b Indicates standard scores on norm-referenced measure with mean=100, SD=15. c Scores reflect use of updated normative tables (2007). d Possible range=0–40. e Possible range=0–6.
31
Table 14. DLL Subsample Spanish Kindergarten Regression Results—Language and Literacy
Effect
Naming Letters
Task
Bat-III Letter-
Word ID
Bat-III Picture
Vocabulary
Bat-III Sound
Awareness
Bat-III Word
Attack
Esta (SE) Esta (SE) Esta (SE) Esta (SE) Esta (SE)
Intercept -1.45 (0.94) 80.72 (2.35) 33.46 (3.30) 66.89 (2.69) 367.27 (3.07)
Time 1.51*** (0.23) -3.04*** (0.53) -5.00*** (0.61) 3.08*** (0.75) 10.44*** (0.81)
Age 1.19 (1.03) -- -- -- -- -- -- -- --
Genderb -0.09 (0.59) -1.27 (1.42) -1.34 (2.05) -3.30* (1.67) 2.47 (1.82)
Racec -0.17 (0.82) 0.54 (1.99) 9.31** (2.86) 3.90 (2.31) -4.04 (2.57)
IEPd 0.21 (2.01) -4.88 (4.96) -18.87** (7.10) -0.61 (5.48) -2.73 (6.16)
Spanish Proficiency 1.06*** (0.19) 3.29*** (0.46) 9.06*** (0.66) 1.25* (0.54) 3.51*** (0.60)
Incomee -2.13** (0.89) -2.89 (1.66) 6.06* (2.38) -2.69 (1.95) -2.74 (2.18)
Provider Typef 0.68 (0.68) 0.89 (1.68) -5.44* (2.34) -0.40 (1.92) 1.76 (2.28)
Teacher Certifiedg 0.89 (0.76) -0.72 (1.88) -9.68*** (2.63) 0.71 (2.15) -1.06 (2.51)
Class Size 0.06 (0.21) 0.58 (0.50) 2.41*** (0.71) -0.02 (0.59) 1.68* (0.68)
a Significance levels are *p< .05, **p< .01, ***p< .001. b Female=0, Male=1. c Non-White=0, White=1. d No IEP =0, IEP=1. e Category Two=0, Category One=1. f Public school site=0, Private site=1. g Teacher not certified=0, Teacher certified=1.

32
Table 15. DLL Subsample Spanish Kindergarten Regression Results—Math and General
Knowledge
Math General Knowledge
Effect
Bat-III Applied
Problems Counting Task Social Awareness Task
Esta (SE) Esta (SE) Esta (SE)
Intercept 68.04 (2.67) 2.67 (1.36) 1.46 (0.24)
Time 2.02*** (0.58) 2.40*** (0.35) 0.37*** (0.06)
Age -- -- 2.55 (1.41) 0.39 (0.26)
Genderb -3.45* (1.67) -1.40 (0.78) -0.38** (0.15)
Racec 4.64* (2.31) 1.28 (1.14) 0.32 (0.20)
IEPd -7.60 (5.62) -0.09 (2.66) 0.08 (0.51)
Spanish Proficiency 4.60*** (0.54) 1.43*** (0.26) 0.28*** (0.05)
Incomee 2.04 (1.94) -1.28 (0.94) 0.05 (0.17)
Provider Typef -2.42 (1.90) 1.22 (0.99) -0.18 (0.18)
Teacher Certifiedg -5.85** (2.14) -1.34 (1.10) -0.36 (0.20)
Class Size 0.71 (0.58) 0.36 (0.30) 0.06 (0.05)
a Significance levels are *p< .05, **p< .01, ***p< .001. b Female=0, Male=1. c Non-White=0, White =1. d No IEP =0, IEP=1. e Category Two=0, Category One=1. f Public school site=0, Private site=1. g Teacher not certified=0, Teacher certified=1.

33
Table 16. Moderators of Kindergarten Outcomes–Language and Literacy
Effect
Naming Letters
Task
WJ-III Letter-
Word ID
WJ-III Picture
Vocabulary
WJ-III Sound
Awareness
WJ-III Word
Attack
Esta (SE) Esta (SE) Esta (SE) Esta (SE) Esta (SE)
Intercept 5.64 (0.81) 88.33 (1.41) 75.54 (1.04) 66.56 (1.83) 364.56 (3.00)
Time 6.52*** (0.38) 5.96*** (0.62) 3.67*** (0.48) 5.33*** (0.92) 20.06*** (1.49)
Age 2.18*** (0.46) -- -- -- -- -- -- -- --
Genderb -0.57* (0.27) -1.18* (0.53) 1.69*** (0.36) -0.68 (0.66) -0.98 (1.02)
Racec -2.68*** (0.42) -5.27*** (0.74) 0.62 (0.54) 0.70 (0.95) -7.83*** (1.57)
Ethnicityd -0.05 (0.45) 0.42 (0.89) -7.70*** (0.61) -1.54 (1.11) 2.75 (1.72)
IEPe -0.73 (0.82) -3.82* (1.60) -1.68 (1.10) -8.44*** (2.02) -3.10 (3.08)
English Proficiency 2.55*** (0.18) 3.52*** (0.31) 5.94*** (0.23) 7.04*** (0.40) 5.90*** (0.66)
Incomef -2.98*** (0.42) -4.41*** (0.72) -2.80*** (0.54) -3.44*** (0.94) -6.34*** (1.55)
Provider Typeg 1.35** (0.45) 2.11** (0.81) 0.28 (0.57) 3.58*** (1.08) 3.77* (1.74)
Teacher Certifiedh -0.30 (0.59) -1.41 (1.07) 0.33 (0.75) 2.34 (1.41) 0.36 (2.28)
Class Size 0.45** (0.15) 0.59* (0.27) -0.11 (0.19) 0.36 (0.36) 0.91 (0.58)
Time x Race 0.91*** (0.20) 1.07** (0.33) 0.27 (0.26) 0.77 (0.49) 3.77*** (0.80)
Time x Eng Prof -0.71*** (0.08) -0.51*** (0.13) -1.00*** (0.10) 0.17 (0.20) 0.44 (0.32)
Time x Income 1.04*** (0.21) 0.31 (0.33) 0.27 (0.26) -0.94 (0.49) 0.64 (0.80)
Time x Provider -0.74*** (0.22) -0.81* (0.37) -0.21 (0.27) -1.43** (0.54) -1.79* (0.87)
Time x Teacher Cert 0.05 (0.29) 0.54 (0.48) -0.13 (0.36) -0.34 (0.71) -0.56 (1.14)
Time x Class Size -0.17 (0.07) -0.10 (0.12) 0.06 (0.09) 0.06 (0.18) -0.02 (0.29)
a Significance levels are *p< .05, **p< .01, ***p< .001. b Female=0, Male=1. c Non-White=0, White=1. d Non-Latino=0, Latino=1. e No IEP=0, IEP=1. f Category Two=0, Category One=1. g Public school site=0, Private site=1. h Teacher not certified=0, Teacher certified=1.

34
Table 17. Moderators of Kindergarten Outcomes–Math, General Knowledge, and Classroom Behavior
Math
General
Knowledge Classroom Behavior
Effect
WJ-III Applied
Problems Counting Task
Social
Awareness Task SSiS Social Skills
SSiS Problem
Behaviors
Esta (SE) Esta (SE) Esta (SE) Esta (SE) Esta (SE)
Intercept 75.63 (1.21) 7.26 (1.20) 2.42 (0.13) 79.34 (1.81) 108.53 (1.71)
Time 6.15*** (0.61) 8.96*** (0.60) 0.89*** (0.06) 5.43*** (0.89) -1.88 (0.82)
Age -- -- 4.52*** (0.62) 0.23*** (0.07) -- -- -- --
Genderb -0.06 (0.43) -1.08** (0.37) -0.09* (0.04) 0.99 (0.64) -0.55 (0.61)
Racec 3.81*** (0.63) -1.52* (0.62) -0.40*** (0.07) 1.90 (0.96) -0.59 (0.91)
Ethnicityd 0.28 (0.72) 0.55 (0.62) -0.41*** (0.07) 5.52*** (1.10) -6.81*** (1.06)
IEPe -5.22*** (1.30) -2.59* (1.13) -0.36** (0.13) -6.91*** (2.01) 5.73** (1.93)
English Proficiency 6.21*** (0.27) 3.11*** (0.26) 0.53*** (0.03) 4.01*** (0.40) -2.18*** (0.37)
Incomef -3.40*** (0.62) -2.74*** (0.61) -0.27*** (0.07) -0.45 (0.93) 0.31 (0.88)
Provider Typeg 1.26 (0.69) 1.52* (0.69) -0.07 (0.07) -1.01 (1.21) 2.34* (1.15)
Teacher Certifiedh 1.20 (0.90) 1.24 (0.90) -0.22* (0.09) -0.46 (1.57) 2.93* (1.49)
Class Size 0.13 (0.23) 0.34 (0.23) 0.03 (0.02) 0.60 (0.39) -0.25 (0.37)
Time x Race -0.30 (0.33) 0.16 (0.32) 0.10** (0.03) -0.09 (0.49) 0.50 (0.45)
Time x Eng Prof -1.19*** (0.14) -0.63*** (0.13) -0.13*** (0.01) -0.82*** (0.19) 0.46** (0.18)
Time x Income 0.38 (0.33) 0.92** (0.32) 0.03 (0.03) -0.89 (0.48) 1.10* (0.44)
Time x Provider 0.08 (0.35) -0.57 (0.34) 0.03 (0.04) -0.16 (0.55) -0.47 (0.52)
Time x Teacher Cert -0.23 (0.46) -0.85 (0.46) 0.04 (0.05) -0.94 (0.72) -0.74 (0.68)
Time x Class Size 0.05 (0.12) -0.09 (0.12) -0.00 (0.01) -0.23 (0.18) 0.09 (0.17)
a Significance levels are *p< .05, **p< .01, ***p< .001. b Female=0, Male=1. c Non-White=0, White=1. d Non-Latino=0, Latino=1. e No IEP=0, IEP=1. f Category Two=0, Category One=1. g Public school site=0, Private site=1. h Teacher not certified=0, Teacher certified=1.

35
Figure 1. Growth in WJ-III Letter-Word Identification by English Proficiency
Figure 2. Growth in WJ-III Picture Vocabulary by English Proficiency
90.00
95.00
100.00
105.00
110.00
115.00
120.00
Fall Pre-K Spring Pre-K Fall K Spring K
WJ-
III
Lett
er-
Wo
rd ID
Stan
dar
d S
core
Assessment Period
English Proficiency Level 1
English Proficiency Level 2
English Proficiency Level 3
English Proficiency Level 4
English Proficiency Level 5
80.00
85.00
90.00
95.00
100.00
105.00
110.00
Fall Pre-K Spring Pre-K Fall K Spring K
WJ-
III
Pic
ture
Vo
cab
ula
rySt
and
ard
Sco
re
Assessment Period
English Proficiency Level 1
English Proficiency Level 2
English Proficiency Level 3
English Proficiency Level 4
English Proficiency Level 5

36
Figure 3. Growth in Naming Letters Task by English Proficiency
Figure 4. Growth in WJ-III Applied Problems by English Proficiency
5.00
10.00
15.00
20.00
25.00
30.00
Fall Pre-K Spring Pre-K Fall K Spring K
Nam
ing
Lett
ers
Tas
kSc
ore
Assessment Period
English Proficiency Level 1
English Proficiency Level 2
English Proficiency Level 3
English Proficiency Level 4
English Proficiency Level 5
80.00
85.00
90.00
95.00
100.00
105.00
110.00
Fall Pre-K Spring Pre-K Fall K Spring K
WJ-
III
Ap
plie
d P
rob
lem
sSt
and
ard
Sco
re
Assessment Period
English Proficiency Level 1
English Proficiency Level 2
English Proficiency Level 3
English Proficiency Level 4
English Proficiency Level 5

37
Figure 5. Growth in Counting Task by English Proficiency
Figure 6. Growth in Social Awareness Task by English Proficiency
5.00
10.00
15.00
20.00
25.00
30.00
35.00
40.00
45.00
Fall Pre-K Spring Pre-K Fall K Spring K
Co
un
tin
g Ta
skSc
ore
Assessment Period
English Proficiency Level 1
English Proficiency Level 2
English Proficiency Level 3
English Proficiency Level 4
English Proficiency Level 5
2.00
2.50
3.00
3.50
4.00
4.50
5.00
5.50
6.00
Fall Pre-K Spring Pre-K Fall K Spring K
Soci
al A
war
en
ess
Tas
kSc
ore
Assessment Period
English Proficiency Level 1
English Proficiency Level 2
English Proficiency Level 3
English Proficiency Level 4
English Proficiency Level 5

38
Figure 7. Growth in SSiS Social Skills by English Proficiency
Figure 8. Change in SSiS Problem Behaviors by English Proficiency
80.00
85.00
90.00
95.00
100.00
105.00
Fall Pre-K Spring Pre-K Fall K Spring K
SSiS
So
cial
Ski
llsSc
ore
Assessment Period
English Proficiency Level 1
English Proficiency Level 2
English Proficiency Level 3
English Proficiency Level 4
English Proficiency Level 5
96.00
98.00
100.00
102.00
104.00
106.00
108.00
Fall Pre-K Spring Pre-K Fall K Spring K
SSiS
Pro
ble
m B
eh
avio
rsSc
ore
Assessment Period
English Proficiency Level 1
English Proficiency Level 2
English Proficiency Level 3
English Proficiency Level 4
English Proficiency Level 5

39
Figure 9. Growth in WJ-III Letter-Word Identification by Race
Figure 10. Growth in WJ-III Word Attack by Race
80.00
85.00
90.00
95.00
100.00
105.00
110.00
Fall Pre-K Spring Pre-K Fall K Spring K
WJ-
III
Lett
er-
Wo
rd ID
Stan
dar
d S
core
Assessment Period
Non-White
White
350.00
360.00
370.00
380.00
390.00
400.00
410.00
420.00
430.00
440.00
Fall Pre-K Spring Pre-K Fall K Spring K
WJ-
III
Wo
rd A
ttac
kW
Sco
re
Assessment Period
Non-White
White

40
Figure 11. Growth in Naming Letters Task by Race
Figure 12. Growth in Social Awareness Task by Race
0.00
5.00
10.00
15.00
20.00
25.00
30.00
Fall Pre-K Spring Pre-K Fall K Spring K
Nam
ing
Lett
ers
Tas
kSc
ore
Assessment Period
Non-White
White
1.00
2.00
3.00
4.00
5.00
6.00
Fall Pre-K Spring Pre-K Fall K Spring K
Soci
al A
war
en
ess
Tas
kSc
ore
Assessment Period
Non-White
White

41
Figure 13. Growth in Naming Letters Task by Income
Figure 14. Growth in Counting Task by Income
0.00
5.00
10.00
15.00
20.00
25.00
30.00
Fall Pre-K Spring Pre-K Fall K Spring K
Nam
ing
Lett
ers
Tas
kSc
ore
Assessment Period
Category One
Category Two
0.00
5.00
10.00
15.00
20.00
25.00
30.00
35.00
Fall Pre-K Spring Pre-K Fall K Spring K
Co
un
tin
g Ta
skSc
ore
Assessment Period
Category One
Category Two

42
Figure 15. Change in SSiS Problem Behaviors by Income
Figure 16. Growth in WJ-III Letter-Word Identification by Program Type
102.00
103.00
104.00
105.00
106.00
107.00
108.00
109.00
110.00
Fall Pre-K Spring Pre-K Fall K Spring K
SSiS
Pro
ble
m B
eh
avio
rsSc
ore
Assessment Period
Category One
Category Two
80.00
85.00
90.00
95.00
100.00
105.00
110.00
Fall Pre-K Spring Pre-K Fall K Spring K
WJ-
III
Lett
er-
Wo
rd ID
St
and
ard
Sco
re
Assessment Period
Public
Non-Public

43
Figure 17. Growth in WJ-III Sound Awareness by Program Type
Figure 18. Growth in WJ-III Word Attack by Program Type
60.00
65.00
70.00
75.00
80.00
85.00
Fall Pre-K Spring Pre-K Fall K Spring K
WJ-
III
Sou
nd
Aw
are
ne
ss
Stan
dar
d S
core
Assessment Period
Public
Non-Public
360.00
370.00
380.00
390.00
400.00
410.00
420.00
430.00
Fall Pre-K Spring Pre-K Fall K Spring K
WJ-
III
Wo
rd A
ttac
kW
Sco
re
Assessment Period
Public
Non-Public

44
Figure 19. Growth in Naming Letters Task by Program Type
5.00
10.00
15.00
20.00
25.00
30.00
Fall Pre-K Spring Pre-K Fall K Spring K
Nam
ing
Lett
ers
Tas
kSc
ore
Assessment Period
Public
Non-Public
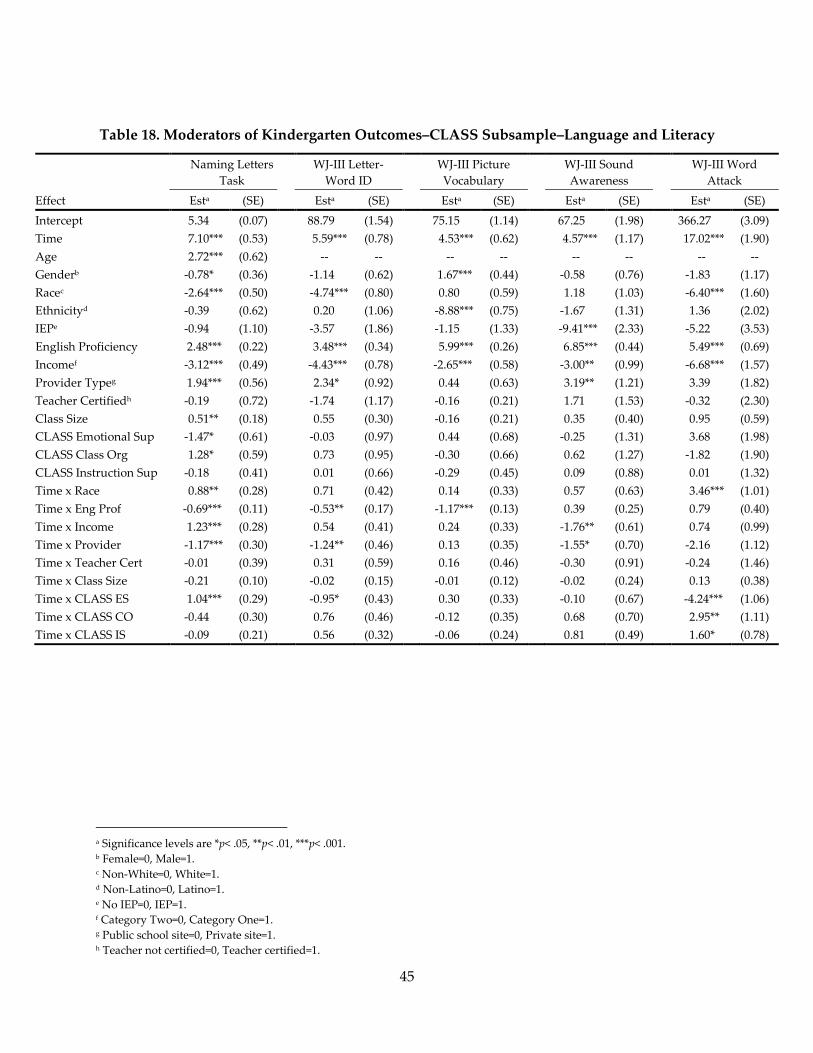
45
Table 18. Moderators of Kindergarten Outcomes–CLASS Subsample–Language and Literacy
Effect
Naming Letters
Task
WJ-III Letter-
Word ID
WJ-III Picture
Vocabulary
WJ-III Sound
Awareness
WJ-III Word
Attack
Esta (SE) Esta (SE) Esta (SE) Esta (SE) Esta (SE)
Intercept 5.34 (0.07) 88.79 (1.54) 75.15 (1.14) 67.25 (1.98) 366.27 (3.09)
Time 7.10*** (0.53) 5.59*** (0.78) 4.53*** (0.62) 4.57*** (1.17) 17.02*** (1.90)
Age 2.72*** (0.62) -- -- -- -- -- -- -- --
Genderb -0.78* (0.36) -1.14 (0.62) 1.67*** (0.44) -0.58 (0.76) -1.83 (1.17)
Racec -2.64*** (0.50) -4.74*** (0.80) 0.80 (0.59) 1.18 (1.03) -6.40*** (1.60)
Ethnicityd -0.39 (0.62) 0.20 (1.06) -8.88*** (0.75) -1.67 (1.31) 1.36 (2.02)
IEPe -0.94 (1.10) -3.57 (1.86) -1.15 (1.33) -9.41*** (2.33) -5.22 (3.53)
English Proficiency 2.48*** (0.22) 3.48*** (0.34) 5.99*** (0.26) 6.85*** (0.44) 5.49*** (0.69)
Incomef -3.12*** (0.49) -4.43*** (0.78) -2.65*** (0.58) -3.00** (0.99) -6.68*** (1.57)
Provider Typeg 1.94*** (0.56) 2.34* (0.92) 0.44 (0.63) 3.19** (1.21) 3.39 (1.82)
Teacher Certifiedh -0.19 (0.72) -1.74 (1.17) -0.16 (0.21) 1.71 (1.53) -0.32 (2.30)
Class Size 0.51** (0.18) 0.55 (0.30) -0.16 (0.21) 0.35 (0.40) 0.95 (0.59)
CLASS Emotional Sup -1.47* (0.61) -0.03 (0.97) 0.44 (0.68) -0.25 (1.31) 3.68 (1.98)
CLASS Class Org 1.28* (0.59) 0.73 (0.95) -0.30 (0.66) 0.62 (1.27) -1.82 (1.90)
CLASS Instruction Sup -0.18 (0.41) 0.01 (0.66) -0.29 (0.45) 0.09 (0.88) 0.01 (1.32)
Time x Race 0.88** (0.28) 0.71 (0.42) 0.14 (0.33) 0.57 (0.63) 3.46*** (1.01)
Time x Eng Prof -0.69*** (0.11) -0.53** (0.17) -1.17*** (0.13) 0.39 (0.25) 0.79 (0.40)
Time x Income 1.23*** (0.28) 0.54 (0.41) 0.24 (0.33) -1.76** (0.61) 0.74 (0.99)
Time x Provider -1.17*** (0.30) -1.24** (0.46) 0.13 (0.35) -1.55* (0.70) -2.16 (1.12)
Time x Teacher Cert -0.01 (0.39) 0.31 (0.59) 0.16 (0.46) -0.30 (0.91) -0.24 (1.46)
Time x Class Size -0.21 (0.10) -0.02 (0.15) -0.01 (0.12) -0.02 (0.24) 0.13 (0.38)
Time x CLASS ES 1.04*** (0.29) -0.95* (0.43) 0.30 (0.33) -0.10 (0.67) -4.24*** (1.06)
Time x CLASS CO -0.44 (0.30) 0.76 (0.46) -0.12 (0.35) 0.68 (0.70) 2.95** (1.11)
Time x CLASS IS -0.09 (0.21) 0.56 (0.32) -0.06 (0.24) 0.81 (0.49) 1.60* (0.78)
a Significance levels are *p< .05, **p< .01, ***p< .001. b Female=0, Male=1. c Non-White=0, White=1. d Non-Latino=0, Latino=1. e No IEP=0, IEP=1. f Category Two=0, Category One=1. g Public school site=0, Private site=1. h Teacher not certified=0, Teacher certified=1.

46
Table 19. Moderators of Kindergarten Outcomes–CLASS Subsample–Math, General Knowledge, and
Behavior
Math
General
Knowledge Classroom Behavior
Effect
WJ-III Applied
Problems Counting Task
Social
Awareness Task SSiS Social Skills
SSiS Problem
Behaviors
Esta (SE) Esta (SE) Esta (SE) Esta (SE) Esta (SE)
Intercept 74.96 (1.29) 7.48 (1.34) 2.36 (0.14) 78.58 (1.96) 109.03 (1.85)
Time 7.73*** (0.78) 9.40*** (0.81) 0.99*** (0.09) 6.73*** (1.14) -2.06* (1.04)
Age -- -- 5.02*** (0.78) 0.25** (0.09) -- -- -- --
Genderb -0.15 (0.49) -1.46** (0.46) -0.12* (0.05) 1.19 (0.74) -0.14 (0.71)
Racec 3.91*** (0.67) -1.46* (0.68) -0.37*** (0.07) 2.01 (1.04) -0.75 (0.98)
Ethnicityd -0.16 (0.85) 0.52 (0.79) -0.55*** (0.09) 5.34*** (1.33) -6.56*** (1.27)
IEPe -4.92** (1.50) -2.72 (1.43) -0.37* (0.16) -7.32** (2.34) 6.19** (2.23)
English Proficiency 6.38*** (0.29) 2.99*** (0.30) 0.54*** (0.03) 4.14*** (0.43) -2.17*** (0.40)
Incomef -3.24*** (0.65) -2.70*** (0.67) -0.28*** (0.07) -0.48 (0.98) 0.28 (0.93)
Provider Typeg 0.97 (0.77) 2.16** (0.78) -0.03 (0.08) 0.08 (1.39) 1.62 (1.35)
Teacher Certifiedh 0.50 (0.97) 1.54 (0.99) -0.24* (0.10) -0.58 (1.75) 3.95* (1.68)
Class Size 0.15 (0.25) 0.39 (0.26) 0.02 (0.03) 0.81 (0.43) -0.41 (0.42)
CLASS Emotional Sup 0.65 (0.83) -2.07* (0.87) -0.00 (0.09) -1.05 (1.48) 2.37 (1.42)
CLASS Class Org 0.16 (0.80) 1.29 (0.83) 0.14 (0.09) 3.57* (1.47) -1.50 (1.43)
CLASS Instruction Sup 0.03 (0.55) 0.97 (0.57) -0.07 (0.06) -2.94** (0.99) -0.82 (0.96)
Time x Race -0.67 (0.42) 0.01 (0.43) 0.12* (0.05) -0.55 (0.62) 0.36 (0.57)
Time x Eng Prof -1.54*** (0.17) -0.61*** (0.17) -0.15*** (0.02) -0.95*** (0.24) 0.49* (0.22)
Time x Income 0.20 (0.41) 0.76 (0.42) 0.04 (0.05) -0.85 (0.60) 0.99 (0.55)
Time x Provider 0.10 (0.46) -0.86 (0.46) 0.04 (0.05) -0.60 (0.74) -0.39 (0.68)
Time x Teacher Cert -0.15 (0.60) -0.78 (0.60) 0.03 (0.07) -1.64 (0.95) -0.96 (0.87)
Time x Class Size -0.02 (0.16) -0.10 (0.15) 0.01 (0.02) -0.39 (0.24) 0.02 (0.22)
Time x CLASS ES -0.53 (0.44) 1.23** (0.44) 0.03 (0.05) 1.12 (0.72) -0.34 (0.67)
Time x CLASS CO 0.12 (0.46) -0.80 (0.46) -0.09 (0.05) -1.27 (0.75) -0.80 (0.70)
Time x CLASS IS 0.58 (0.32) -0.57 (0.32) 0.03 (0.03) 1.30* (0.51) 0.81 (0.47)
a Significance levels are *p< .05, **p< .01, ***p< .001. b Female=0, Male=1. c Non-White=0, White=1. d Non-Latino=0, Latino=1. e No IEP=0, IEP=1. f Category Two=0, Category One=1. g Public school site=0, Private site=1. h Teacher not certified=0, Teacher certified=1.

47
Figure 20. Growth in WJ-III Word Attack by CLASS Classroom Organization
Figure 21. Growth in WJ-III Word Attack by CLASS Instructional Support
360.00
370.00
380.00
390.00
400.00
410.00
420.00
430.00
Fall Pre-K Spring Pre-K Fall K Spring K
WJ-
III
Wo
rd A
ttac
kW
Sco
re
Assessment Period
Classroom Org Mean
Classroom Org -1SD
Classroom Org +1SD
360.00
370.00
380.00
390.00
400.00
410.00
420.00
430.00
Fall Pre-K Spring Pre-K Fall K Spring K
WJ-
III
Wo
rd A
ttac
kW
Sco
re
Assessment Period
Instructional Support Mean
Instructional Support -1SD
Instructional Support +1SD

48
Figure 22. Growth in SSiS Social Skills by CLASS Instructional Support
Figure 23. Growth in Naming Letters Task by CLASS Emotional Support
75.00
80.00
85.00
90.00
95.00
100.00
105.00
Fall Pre-K Spring Pre-K Fall K Spring K
SSiS
So
cial
Ski
lls
Sco
re
Assessment Period
Instructional Support Mean
Instructional Support -1SD
Instructional Support +1SD
0.00
5.00
10.00
15.00
20.00
25.00
30.00
Fall Pre-K Spring Pre-K Fall K Spring K
Nam
ing
Lett
ers
Tas
kSc
ore
Assessment Period
Emotional Support Mean
Emotional Support -1SD
Emotional Support +1SD
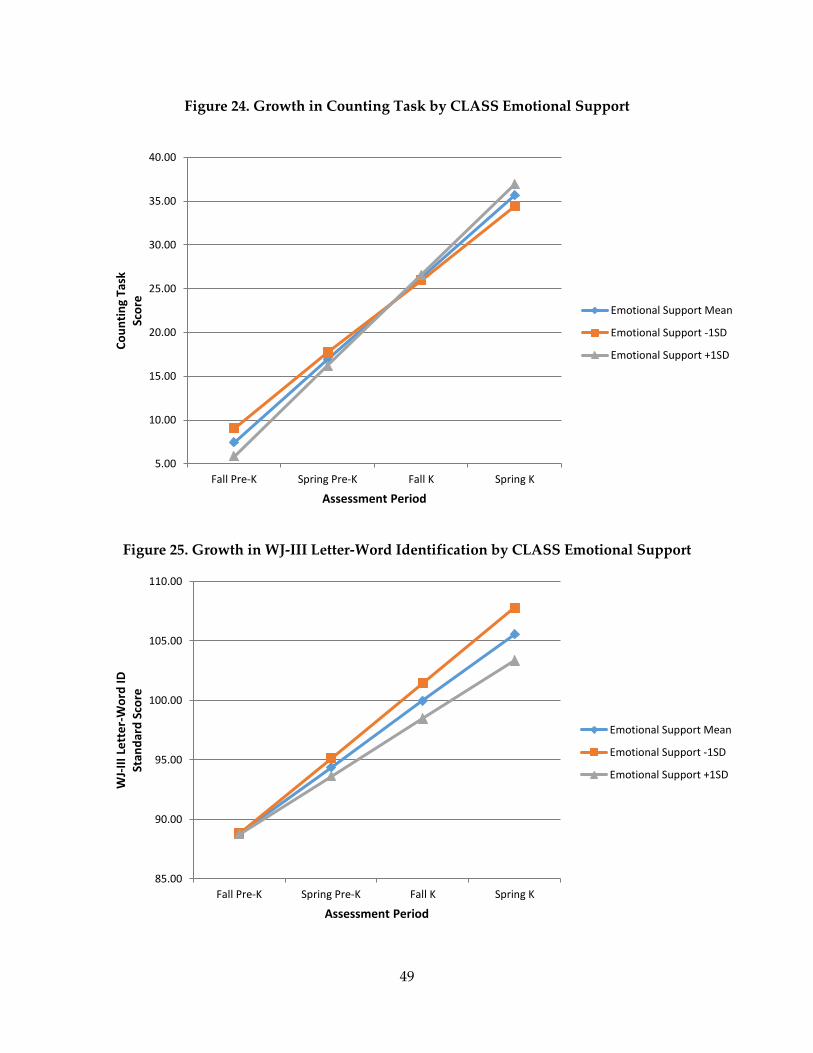
49
Figure 24. Growth in Counting Task by CLASS Emotional Support
Figure 25. Growth in WJ-III Letter-Word Identification by CLASS Emotional Support
5.00
10.00
15.00
20.00
25.00
30.00
35.00
40.00
Fall Pre-K Spring Pre-K Fall K Spring K
Co
un
tin
g Ta
skSc
ore
Assessment Period
Emotional Support Mean
Emotional Support -1SD
Emotional Support +1SD
85.00
90.00
95.00
100.00
105.00
110.00
Fall Pre-K Spring Pre-K Fall K Spring K
WJ-
III
Lett
er-
Wo
rd ID
Stan
dar
d S
core
Assessment Period
Emotional Support Mean
Emotional Support -1SD
Emotional Support +1SD

50
Figure 26. Growth in WJ-III Word Attack by CLASS Emotional Support
330.00
340.00
350.00
360.00
370.00
380.00
390.00
400.00
410.00
420.00
430.00
Fall Pre-K Spring Pre-K Fall K Spring K
WJ-
III
Wo
rd A
ttac
kW
Sco
re
Assessment Period
Emotional Support Mean
Emotional Support -1SD
Emotional Support +1SD
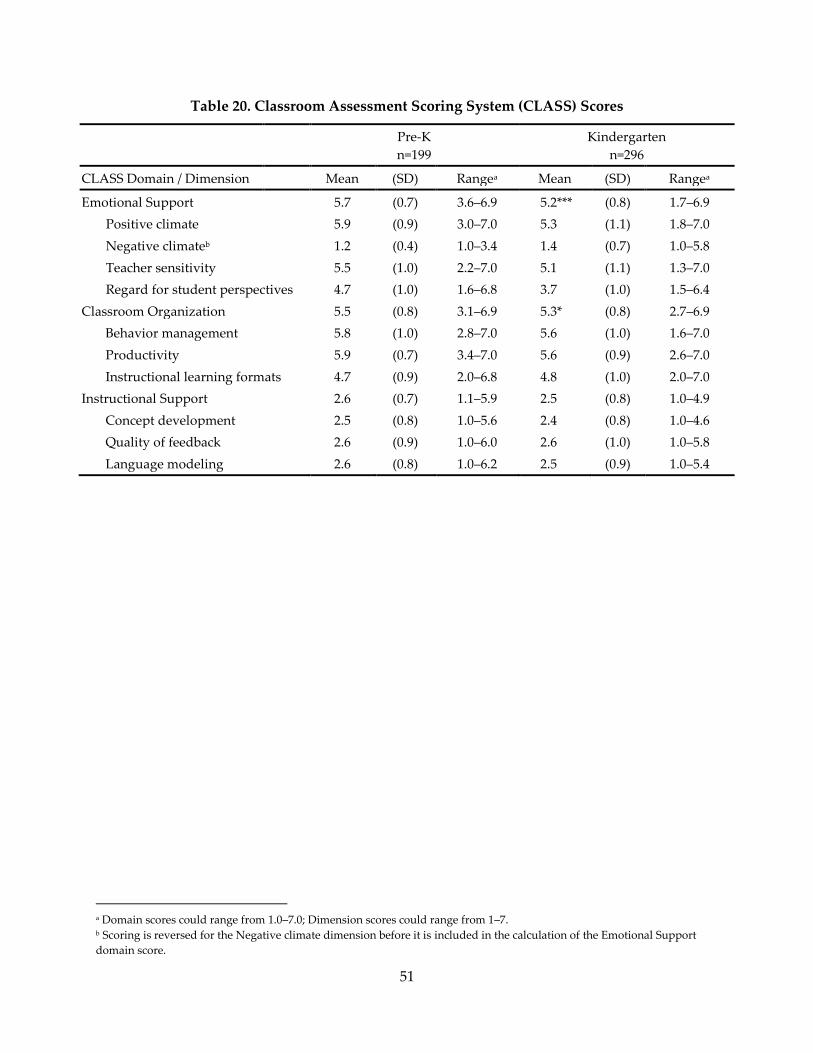
51
Table 20. Classroom Assessment Scoring System (CLASS) Scores
Pre-K
n=199
Kindergarten
n=296
CLASS Domain / Dimension Mean (SD) Rangea Mean (SD) Rangea
Emotional Support 5.7 (0.7) 3.6–6.9 5.2*** (0.8) 1.7–6.9
Positive climate 5.9 (0.9) 3.0–7.0 5.3 (1.1) 1.8–7.0
Negative climateb 1.2 (0.4) 1.0–3.4 1.4 (0.7) 1.0–5.8
Teacher sensitivity 5.5 (1.0) 2.2–7.0 5.1 (1.1) 1.3–7.0
Regard for student perspectives 4.7 (1.0) 1.6–6.8 3.7 (1.0) 1.5–6.4
Classroom Organization 5.5 (0.8) 3.1–6.9 5.3* (0.8) 2.7–6.9
Behavior management 5.8 (1.0) 2.8–7.0 5.6 (1.0) 1.6–7.0
Productivity 5.9 (0.7) 3.4–7.0 5.6 (0.9) 2.6–7.0
Instructional learning formats 4.7 (0.9) 2.0–6.8 4.8 (1.0) 2.0–7.0
Instructional Support 2.6 (0.7) 1.1–5.9 2.5 (0.8) 1.0–4.9
Concept development 2.5 (0.8) 1.0–5.6 2.4 (0.8) 1.0–4.6
Quality of feedback 2.6 (0.9) 1.0–6.0 2.6 (1.0) 1.0–5.8
Language modeling 2.6 (0.8) 1.0–6.2 2.5 (0.9) 1.0–5.4
a Domain scores could range from 1.0–7.0; Dimension scores could range from 1–7. b Scoring is reversed for the Negative climate dimension before it is included in the calculation of the Emotional Support
domain score.

52
Figure 27. CLASS Emotional Support Scores in Pre-K (n=199) and Kindergarten (n=296)
0 0 0 0 0
3.12.5
5
17.6
28.1
29.1
14.6
0 0.3 0.30.7
1.7
6.1
9.8
13.2
20.9
30.1
14.9
2
0
5
10
15
20
25
30
35
1.0-1.4 1.5-1.9 2.0-2.4 2.5-2.9 3.0-3.4 3.5-3.9 4.0-4.4 4.5-4.9 5.0-5.4 5.5-5.9 6.0-6.4 6.5-7.0
Pe
rce
nta
ge o
f C
lass
roo
ms
CLASS Emotional Support Scores
Pre-K Kindergarten
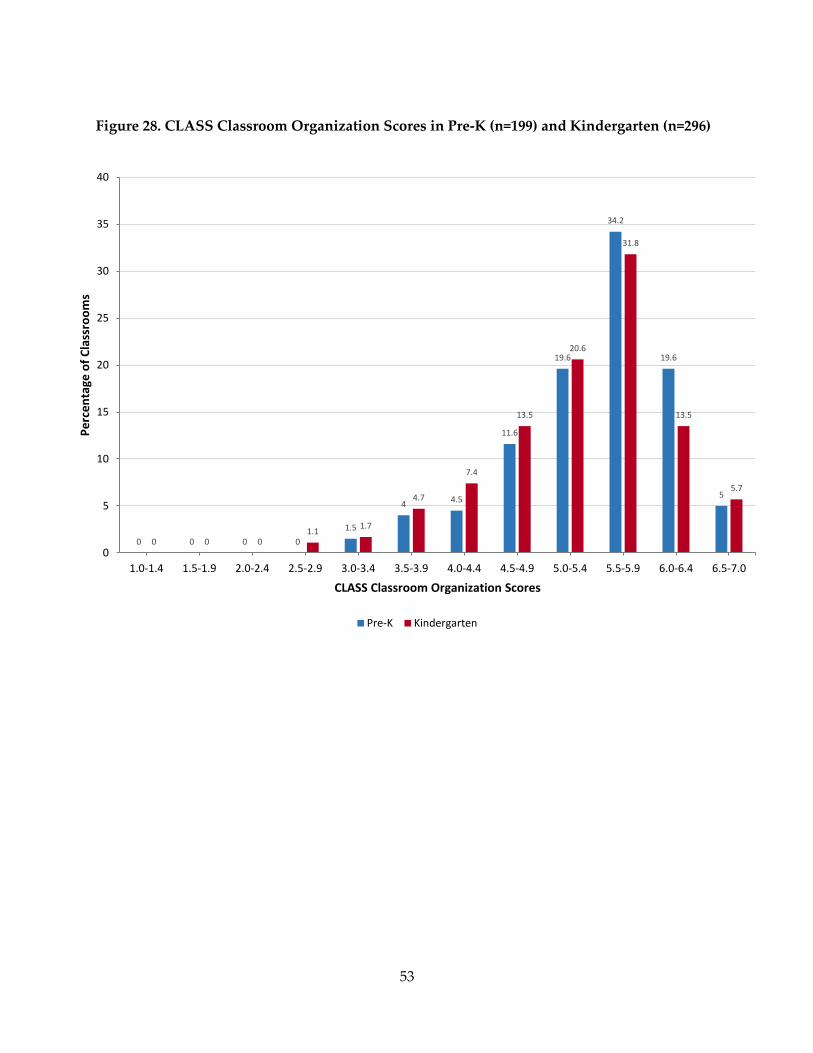
53
Figure 28. CLASS Classroom Organization Scores in Pre-K (n=199) and Kindergarten (n=296)
0 0 0 0
1.5
44.5
11.6
19.6
34.2
19.6
5
0 0 01.1
1.7
4.7
7.4
13.5
20.6
31.8
13.5
5.7
0
5
10
15
20
25
30
35
40
1.0-1.4 1.5-1.9 2.0-2.4 2.5-2.9 3.0-3.4 3.5-3.9 4.0-4.4 4.5-4.9 5.0-5.4 5.5-5.9 6.0-6.4 6.5-7.0
Pe
rce
nta
ge o
f C
lass
roo
ms
CLASS Classroom Organization Scores
Pre-K Kindergarten

54
Figure 29. CLASS Instructional Support Scores in Pre-K (n=199) and Kindergarten (n=296)
0
5
10
15
20
25
30
35
1.0-1.4 1.5-1.9 2.0-2.4 2.5-2.9 3.0-3.4 3.5-3.9 4.0-4.4 4.5-4.9 5.0-5.4 5.5-5.9 6.0-6.4 6.5-7.0
Pe
rce
nta
ge o
f C
lass
roo
ms
CLASS Instructional Support Scores
Pre-K Kindergarten

55
References
i Bright from the Start: Georgia Department of Early Care and Learning. (2015). Georgia Early
Learning and Development Standards (GELDS). Retrieved from
http://www.gelds.decal.ga.gov/Resources.aspx
ii Georgia Department of Education (2006, 2007, 2008, 2015). Georgia’s Performance Standards for
Kindergarten. Retrieved from
https://www.georgiastandards.org/standards/Pages/BrowseStandards/GPS_by_Grade_L
evel_K-8.aspx
iii Bright from the Start: Georgia Department of Early Care and Learning and Georgia State
University. (2013). Work Sampling Online training manual. Retrieved from
http://decal.ga.gov/documents/ attachments/WSO_Training_Manual2014.pdf
iv Meisels, S. J., Marsden D. B., Dichtelmiller, M. K., Dorfman, A. B., & Jablon, J. R. (2001). The
Work Sampling System 4th Edition. San Antonio, TX: Pearson
v Bright from the Start: Georgia Department of Early Care and Learning. (2015). 2015–2016
School year pre-k providers’ operating guidelines. Retrieved from
http://www.decal.ga.gov/documents/attachments/Guidelines.pdf
vi National Center for Early Development and Learning (2001). Naming Letters. Unpublished
instrument.
vii Woodcock, R. W., McGrew, K. S., & Mather, N. (2001). Woodcock-Johnson III Tests of
Achievement. Itasca, IL: The Riverside Publishing Company.
viii Muñoz-Sandoval, A. F., Woodcock, R. W., McGrew, K. S., & Mather, N. (2005). Batería III
Pruebas de aprovechamiento. Itasca, IL: Riverside Publishing.
ix National Center for Early Development and Learning (2001). Counting Task. Unpublished
instrument.
x FACES Research Team, modified from the Social and Communicative Competence tasks in:
Jana M. Mason and Janice Stewart (1989). The CAP Early Childhood Diagnostic Instrument
(prepublication edition). Iowa City, IA: American Testronics.
xi Gresham, F., & Elliott, S. (2008). Social Skills Improvement System. Minneapolis, MN: Pearson.
xii Duncan, S. E., & De Avila, E. A. (1998). PreLAS 2000. Monterey, CA: CTB/McGraw-Hill.
xiii Pianta, R. C., La Paro, K. M., & Hamre, B. K. (2008), Classroom Assessment Scoring System
(CLASS) Pre-K Manual. Baltimore, MD: Paul H. Brookes Publishing Co.
xiv Pianta, R. C., La Paro, K. M., & Hamre, B. K. (2008). Classroom Assessment Scoring System
(CLASS) K-3 Manual. Baltimore, MD: Paul H. Brookes Publishing Co.

56
xv Hallgren, K.A. (2012). Computing inter-rater reliability for observational data: An overview
and tutorial. Tutorials in Quantitative Methods for Psychology, 8(1), 23–34.
xvi Mashburn, A. J., Pianta, R. C., Hamre, B. K., Downer, J. T., Barbarin, O. A., Bryant, D. Howes,
C. (2008). Measures of classroom quality in prekindergarten and children’s development
of academic, language, and social skills. Child Development, 79, 732-749.
xvii Peisner-Feinberg, E. S., LaForett, D. R., Schaaf, J. M., Hildebrandt, L. M., Sideris, J., & Pan, Y.
(2014). Children’s outcomes and program quality in the North Carolina Pre-Kindergarten
Program: 2012–2013 Statewide evaluation. Chapel Hill: The University of North Carolina,
FPG Child Development Institute.
xviii Phillips, D. A., Gormley, W. T., & Lowenstein, A. E. (2009). Inside the pre-kindergarten door:
Classroom climate and instructional time allocation in Tulsa’s pre-K program. Early
Childhood Research Quarterly, 24, 213-228.