children out of school - unesco...
TRANSCRIPT

One hundred and fifteen million primary school-age children are out of school according to a joint global estimate by the UNESCO Institute forStatistics (UIS) and UNICEF cited in this report. This number equals 18% - or almost one in five - of the children worldwide in this age group.
This report aims to improve our understanding of how many children are out of school and who they are. It presents a new methodology forcounting the number of children who are out of school and explores the link between participation and the characteristics of children and thehouseholds in which they live. Data from across a large number of less developed countries reflect disadvantage in terms of participation inprimary schooling by gender, location of residence and household wealth.
The report also shows that efforts to widen access to primary education must recognise the different types of out-of-school children, e.g.,those who never enter a school, those who start late and those who leave school early. Different contexts call for different types of policies.And the profile of out-of-school children can vary widely across countries. Thus, understanding the proximate determinants of out-of-schoolstatus are important to planning policies aimed at reducing the number of children excluded from education.
The United Nations Children's Fund (UNICEF) is an agency that aims to help children living in poverty in developingcountries, including the care and stimulation they need in the early years of life, and protection from illness, war andnatural disasters.
Children Out of School:M
easuring Exclusion from Prim
ary EducationU
NE
SC
O IN
ST
ITU
TE
forS
TA
TIS
TIC
S
CHILDREN OUT OF SCHOOL:MEASURING EXCLUSION FROM PRIMARY EDUCATION
The UNESCO Institute for Statistics (UIS) is the statistical office of the United Nations Educational, Scientific and Cultural Organization (UNESCO)and is the UN depository for internationally comparable statistics in the fields of education, science and technology, and culture andcommunication.
UNESCO Institute for StatisticsP.O. Box 6128, Succursale Centre-VilleMontreal, Quebec H3C 3J7Canadahttp://www.uis.unesco.org

Measur ing Exclusion from Pr imary Education
UNESCO Institute for Statistics, Montreal, 2005
Children Out of School

UNESCO
The constitution of the United Nations Educational, Scientific and Cultural Organization (UNESCO) was adopted by 20 countries atthe London Conference in November 1945 and entered into effect on 4 November 1946. The Organization currently has 191Member States and six Associate Members.
The main objective of UNESCO is to contribute to peace and security in the world by promoting collaboration among nations througheducation, science, culture and communication in order to foster universal respect for justice, the rule of law, and human rights andfundamental freedoms that are affirmed for the peoples of the world, without distinction of race, sex, language or religion, by theCharter of the United Nations.
To fulfill its mandate, UNESCO performs five principal functions: 1) prospective studies on education, science, culture andcommunication for tomorrow’s world; 2) the advancement, transfer and sharing of knowledge through research, training and teachingactivities; 3) standard-setting actions for the preparation and adoption of internal instruments and statutory recommendations;4) expertise through technical co-operation to Member States for their development policies and projects; and 5) the exchange ofspecialised information.
UNESCO is headquartered in Paris, France.
UNESCO Institute for Statistics
The UNESCO Institute for Statistics (UIS) is the statistical office of UNESCO and is the UN depository for global statistics in the fieldsof education, science and technology, culture and communication.
UIS was established in 1999. It was created to improve UNESCO’s statistical programme and to develop and deliver the timely, accurateand policy-relevant statistics needed in today’s increasingly complex and rapidly changing social, political and economic environments.
UIS is based in Montreal, Canada.
United Nations Children's Fund (UNICEF)
As a vital member of the UN system, UNICEF works in more than 150 developing countries and territories, has National Committeesin 37 industrialized countries and more than 300 UNICEF Goodwill Ambassadors - all dedicated to improving the lives and well-beingof children and advancing the Millennium Development Goals.
Established in 1946, UNICEF is unique among world organizations, and unique among those working with the young. Through awide and diverse network of partners, UNICEF strives to protect and promote the rights of children through its policies, programmesand advocacy. Its yearly report on The State of the World's Children has presented the world's most comprehensive database on childrenfor the past quarter of a century.
Amongst its many initiatives, UNICEF is the lead agency and secretariat for the United Nations Girls' Education Initiative, launchedby the UN Secretary General in April 2000 at the World Education Forum in Dakar. With 13 core partners, UNGEI is the flagship ofEducation for All, emphasizing girls' education in the international effort to ensure the Millennium Development Goal of universalprimary education by 2015.
UNICEF is based in New York, United States of America.http://www.unicef.org
Published in 2005 by
UNESCO Institute for StatisticsP.O. Box 6128, Succursale Centre-VilleMontreal, Quebec H3C 3J7CanadaTel: (1 514) 343-6880Fax: (1 514) 343-6882Email: [email protected]://www.uis.unesco.org
ISBN 92-9189-026-X
© UNESCO-UIS 2005
Design: JCNicholls Design – www.jcnicholls.comPrinted by: Imprimerie L’EmpreinteRef: UIS/AP/05-03

3
Foreword
The Education for All Campaign and the Millennium DevelopmentGoals have focused the world’s attention on ensuring that no childis excluded from receiving a primary education. However, despiteglobal efforts to promote universal primary education, there werestill 115 million children of primary school age out of school in2001/02. Globally, 61.6 million girls of primary school age were notin school, accounting for 53% of the total number. The greatestabsolute numbers of out-of-school children were found in sub-Saharan Africa (45 million) and South Asia (42 million).
This report seeks to assess better the magnitude of the problem andmonitor progress towards the 2015 education targets. The need toproduce a single, authoritative figure on out-of-school children wasan important starting point for this joint UNESCO Institute forStatistics (UIS) and UNICEF effort. The new estimates presented in thisreport address deficiencies in both the methods and data usedpreviously. But, it also seeks to go much further. By recognising theneed to critically review existing data at the national level and toconfront or integrate data from different sources for more robustresults, it is hoped that this report will act as a catalyst for aproductive dialogue to improve the quality of national andinternational education measures.
Indeed efforts are needed in order to improve the way that childrenout of school are counted, but they are also needed to provide amore detailed picture of these children. The global count is importantfor monitoring progress. Yet at the same time, it is essential to viewthe child and household as units of analysis in order to reassess orformulate new national policies which will lead to change at thecommunity level. This perspective requires a range of data andindicators.
While this report pays great attention to numbers of out-of-schoolchildren, it is clearly not enough to simply enrol children into schoolbut to ensure that they complete primary schooling equipped witha comprehensive set of basic literacy and numeracy skills. Thus,measures of out-of-school children need to be studied alongsidemeasures of education quality and learning outcomes.

4
It is essential to better understand the reason whychildren are not in school in the first place. In manycountries, even those with high out-of-school rates,many of these children have had some contact withschooling. For example, in Malawi 91% of childrenhave been in school at some time, but only 31%reach grade 5. The report estimates that globally,one out of three children who are currently out ofschool will or have already received some primaryeducation. In other words, the education systemoften connects with the child but not at theintended age or for the intended duration.
It is therefore imperative to focus policy attentionon the key education transition points (entry,progression and completion) within the context ofstages of child development. In particular, thereport highlights the problem of children who startschool late for their age. This not only causeslearning difficulties for pupils but alsoorganisational difficulties for teachers in theclassroom. In the end, it appears that overagepupils, especially girls, are more likely to leaveprimary school before completion.
The report also illustrates the potential ofhousehold survey data for providing greaterinsights about the out-of-school population andthe demand for education. There are great gulfsbetween the relatively well-off and the poor,between those living in urban and rural areas, andbetween girls and boys. Together the interaction ofgender, rural under-development and povertycombine to keep some children out of school. Thereport also raises important questions about whatkeeps girls out of school – when is it gender andwhen is it poverty?
The joint estimates presented here serve as a newbaseline number for out-of-school children. For thefuture, we must build on this baseline to measuretrends over time. Further work is needed to presentannual updates of the estimates, or even retro-spective results, and to construct a methodology toproject change on the basis of survey data. TheUNESCO Institute for Statistics and UNICEF remaincommitted to moving this measurement processahead in order to better inform progress towardsthe goal of education for all.
Children Out of School: Measur ing Exclusion from Pr imary Education
Michael MillwardDirector a.i., UNESCO Institute for Statistics
Cream WrightChief of Education, UNICEF

5
Acknowledgements
This report is based on data provided to the UNESCO Institute forStatistics (UIS) by UNESCO Member States. We would like to expressour gratitude to all those statisticians who, in each country andterritory, made the effort to complete the UIS, UOE or WEIquestionnaires. In addition, national teams, partners and theagencies that have produced survey data, ORC Macro, fundedprimarily by the U.S. Agency for International Development(Demographic and Health Surveys), and UNICEF (Multiple IndicatorCluster Surveys, MICS) are recognised for their importantcontributions.
Chapter 1 was prepared by Michael Bruneforth (UIS) and Chapter 2by Edilberto Loaiza and Friedrich Huebler (UNICEF). The report wasreviewed extensively by both UNESCO and UNICEF teams.
Foster Kholowa and Sharmila Pillai provided valuable backgroundresearch. Other important input and contributions were provided byAurélie Acoca, Jane Foy, Alison Kennedy, Anuja Singh, MamadouThiam and other members of staff at the UNESCO Institute forStatistics and Cream Wright, Carol Watson and Trevor Croft at UNICEF.
Reviews of the methodology were carried out by Gordon Brackstoneand Tim Holt, and valuable comments were provided by Nicole Bellaand Denise Lievesley. Katja Frostell coordinated the production of thereport.


7
Table of contents
Foreword . . . . . . . . . . . . . . . . . . . . . . . . . . . . . . . . . . . . . . . . . . . . . . . . . . . . . . . . . . . . . . . . . . . . . . . . . . 3
Acknowledgements . . . . . . . . . . . . . . . . . . . . . . . . . . . . . . . . . . . . . . . . . . . . . . . . . . . . . . . . . . . . . . . . . 5
Table of contents . . . . . . . . . . . . . . . . . . . . . . . . . . . . . . . . . . . . . . . . . . . . . . . . . . . . . . . . . . . . . . . . . . . . 7
List of figures, tables and text boxes . . . . . . . . . . . . . . . . . . . . . . . . . . . . . . . . . . . . . . . . . . . . . . . . . . . . 8
Chapter 1 How many primary school-age children are excluded from education? . . . . . . . . . . . . . 11
1.1 Introduction . . . . . . . . . . . . . . . . . . . . . . . . . . . . . . . . . . . . . . . . . . . . . . . . . . . . . . . . . . . . . . . . 11
1.2 A new approach to estimate the number of out-of-school children . . . . . . . . . . . . . . . . . . . . 12
1.3 The global and regional estimates of primary school-age children who are out of school . . 17
1.4 A framework for classifying out-of-school children . . . . . . . . . . . . . . . . . . . . . . . . . . . . . . . . . 26
Chapter 2 Assessing the characteristics of out-of-school children . . . . . . . . . . . . . . . . . . . . . . . . . . . 33
2.1 Introduction . . . . . . . . . . . . . . . . . . . . . . . . . . . . . . . . . . . . . . . . . . . . . . . . . . . . . . . . . . . . . . . . 33
2.2 Demographic and socio-economic determinants . . . . . . . . . . . . . . . . . . . . . . . . . . . . . . . . . . . 35
2.3 Profiles of children in and out of school . . . . . . . . . . . . . . . . . . . . . . . . . . . . . . . . . . . . . . . . . . 50
Postscript Next steps and a measurement agenda . . . . . . . . . . . . . . . . . . . . . . . . . . . . . . . . . . . . . . . 58
References . . . . . . . . . . . . . . . . . . . . . . . . . . . . . . . . . . . . . . . . . . . . . . . . . . . . . . . . . . . . . . . . . . . . . . . . 59
Annex 1 The methodology for global and regional estimates . . . . . . . . . . . . . . . . . . . . . . . . . . . . . . 60
A. Methodology for the calculation of primary school-age children out of school . . . . . . . . . . 60
B. Methodology for the combination of administrative and household survey data . . . . . . . . 63
C. Administrative and household survey data: Why are they different? . . . . . . . . . . . . . . . . . . 66
D. Methodology to estimate the proportion of late entrants and dropouts . . . . . . . . . . . . . . . 67
Annex 2 Statistical tables . . . . . . . . . . . . . . . . . . . . . . . . . . . . . . . . . . . . . . . . . . . . . . . . . . . . . . . . . . . 69
Annex 3 Country groupings . . . . . . . . . . . . . . . . . . . . . . . . . . . . . . . . . . . . . . . . . . . . . . . . . . . . . . . . 116

8
FiguresFigure 1.1. Distribution of population and countries by starting age and duration of primary education, 2001/02 . . . 15Figure 1.2. Number of primary school-age children out of school by sex and region, 2001/02 . . . . . . . . . . . . . . . . . . 17Figure 1.3. Distribution of out-of-school children of primary school age by region, 2001/02 . . . . . . . . . . . . . . . . . . . . 17Figure 1.4. Primary school-age children out of school by region, 2001/02 . . . . . . . . . . . . . . . . . . . . . . . . . . . . . . . . . . 18Figure 1.5. Distribution of primary school-age children out of school by sex and region, 2001/02 . . . . . . . . . . . . . . . . 19Figure 1.6. Gender disparity among primary school-age children out of school by country, 2001/02 . . . . . . . . . . . . . . 20Figure 1.7. Primary school-age children out of school by country, 2001/02 . . . . . . . . . . . . . . . . . . . . . . . . . . . . . . . . . 22Figure 1.8. Out-of-school children of primary school age in countries with rates above 5%, 2001/02 . . . . . . . . . . . . . 23Figure 1.9. Out-of-school children by age and school exposure in Zambia, 2001/02 . . . . . . . . . . . . . . . . . . . . . . . . . . 26Figure 1.10. Out-of-school children by age and school exposure in selected countries . . . . . . . . . . . . . . . . . . . . . . . . . 27Figure 1.11. Children leaving school without completing primary education by age range . . . . . . . . . . . . . . . . . . . . . . 28Figure 1.12. A typology of out-of-school children with respect to exposure to education by region, 2001/02 . . . . . . . . 29Figure 1.13. Children of official school-entry age not in school by expected participation and region, 2001/02 . . . . . . 30Figure 1.14. Percentage of a single-year age cohort expected to never attend school, 2001/02 . . . . . . . . . . . . . . . . . . 31Figure 1.15. Percentage of a single-year age cohort expected to enter school delayed, 2001/02 . . . . . . . . . . . . . . . . . . 32Figure 2.1. Primary school-age children out of school by region based on household survey data, 1996-2003 . . . . . . 35Figure 2.2. Primary school-age children out of school by background characteristics, 1996-2003 . . . . . . . . . . . . . . . . 35Figure 2.3. Primary school-age children out of school by sex and region, 1996-2003 . . . . . . . . . . . . . . . . . . . . . . . . . 37Figure 2.4. Distribution of primary school-age out-of-school children by sex and region, 1996-2003 . . . . . . . . . . . . . 37Figure 2.5. School attendance by sex and age in India, 2000 . . . . . . . . . . . . . . . . . . . . . . . . . . . . . . . . . . . . . . . . . . . 38Figure 2.6. Overage and underage children by sex and age in India, 2000 . . . . . . . . . . . . . . . . . . . . . . . . . . . . . . . . . 38Figure 2.7. Primary school-age children out of school by place of residence and region, 1996-2003 . . . . . . . . . . . . . . 39Figure 2.8. Distribution of primary school-age children out of school by place of residence and region, 1996-2003 . . 40Figure 2.9. School attendance by place of residence in Indonesia, 2002/03 . . . . . . . . . . . . . . . . . . . . . . . . . . . . . . . . . 41Figure 2.10. Overage and underage children and youth by place of residence in Indonesia, 2002/03 . . . . . . . . . . . . . . 41Figure 2.11. Primary school-age children out of school by household wealth and region, 1996-2003 . . . . . . . . . . . . . . 42Figure 2.12. Distribution of children out of school by household wealth and region, 1996-2003 . . . . . . . . . . . . . . . . . . 43Figure 2.13. School attendance by household wealth in Mali, 2001 . . . . . . . . . . . . . . . . . . . . . . . . . . . . . . . . . . . . . . . 44Figure 2.14. Overage and underage children by household wealth in Mali, 2001 . . . . . . . . . . . . . . . . . . . . . . . . . . . . . 44Figure 2.15. Primary school-age children out of school by mother’s education and region, 1996-2003 . . . . . . . . . . . . . 46Figure 2.16. Distribution of out-of-school children by mother’s education and region, 1996-2003 . . . . . . . . . . . . . . . . 46Figure 2.17. Overage and underage children and youth by sex in Nigeria, 2003 . . . . . . . . . . . . . . . . . . . . . . . . . . . . . . 47Figure 2.18. School attendance by mother’s education in Nigeria, 2003 . . . . . . . . . . . . . . . . . . . . . . . . . . . . . . . . . . . . 48Figure 2.19. Overage and underage children by mother’s education in Nigeria, 2003 . . . . . . . . . . . . . . . . . . . . . . . . . . 48Figure A.1. Children in school: Administrative data compared to household survey data, primary school ages . . . . . . 66Figure A.2. Children in school: Administrative data compared to household survey data, 5 to 17-year-olds . . . . . . . . 66Figure A.3. Percentage of primary school-age pupils aged 5 to 17 years:
Household survey and administrative data . . . . . . . . . . . . . . . . . . . . . . . . . . . . . . . . . . . . . . . . . . . . . . . . 67Figure A.4. Estimates of the proportion of out-of-school populations by type . . . . . . . . . . . . . . . . . . . . . . . . . . . . . . . 68
List of figures,tables and text boxes
9
TablesTable 1.1. Primary school-age children out of school by region, 2001/02 . . . . . . . . . . . . . . . . . . . . . . . . . . . . . . . . . . . 18Table 2.1. School attendance by sex and age in India, 2000 . . . . . . . . . . . . . . . . . . . . . . . . . . . . . . . . . . . . . . . . . . . . . 39Table 2.2. School attendance by age and place of residence in Indonesia, 2002/03 . . . . . . . . . . . . . . . . . . . . . . . . . . . 42Table 2.3. School attendance by age and household wealth in Mali, 2001 . . . . . . . . . . . . . . . . . . . . . . . . . . . . . . . . . . 45Table 2.4. School attendance by age and mother’s education level in Nigeria, 2003 . . . . . . . . . . . . . . . . . . . . . . . . . . . 49Table 2.5. Net effects on the likelihood of school attendance . . . . . . . . . . . . . . . . . . . . . . . . . . . . . . . . . . . . . . . . . . . . 49
Statistical Tables (Annex 2)Table A1. Primary school-age children in and out of school. Administrative and household survey data . . . . . . . . . . . 70Table A2. Children in and out of school by age . . . . . . . . . . . . . . . . . . . . . . . . . . . . . . . . . . . . . . . . . . . . . . . . . . . . . . . 80Table A3. Net attendance rate and share of children out of school by background characteristics . . . . . . . . . . . . . . . . 86Table A4. Distribution of primary school-age population and out-of-school children by background characteristics . . 90Table A5. Net effects of children’s background characteristics on primary school participation . . . . . . . . . . . . . . . . . . 96Table A6. Patterns of school attendance in India, 2000 . . . . . . . . . . . . . . . . . . . . . . . . . . . . . . . . . . . . . . . . . . . . . . . 100Table A7. Patterns of school attendance in Indonesia, 2002/03 . . . . . . . . . . . . . . . . . . . . . . . . . . . . . . . . . . . . . . . . . 101Table A8. Patterns of school attendance in Mali, 2001 . . . . . . . . . . . . . . . . . . . . . . . . . . . . . . . . . . . . . . . . . . . . . . . . 102Table A9. Patterns of school attendance in Nigeria, 2003 . . . . . . . . . . . . . . . . . . . . . . . . . . . . . . . . . . . . . . . . . . . . . . 103Table A10. Child profiles by schooling status in India, 2000 . . . . . . . . . . . . . . . . . . . . . . . . . . . . . . . . . . . . . . . . . . . . . 104Table A11. Child profiles by schooling status in Indonesia, 2002/03 . . . . . . . . . . . . . . . . . . . . . . . . . . . . . . . . . . . . . . . 107Table A12. Child profiles by schooling status in Mali, 2001 . . . . . . . . . . . . . . . . . . . . . . . . . . . . . . . . . . . . . . . . . . . . . 108Table A13. Child profiles by schooling status in Nigeria, 2003 . . . . . . . . . . . . . . . . . . . . . . . . . . . . . . . . . . . . . . . . . . . 110Table A14. Likelihood to attend school among children aged 6 to 10 years in India and Indonesia . . . . . . . . . . . . . . . 112Table A15. Likelihood to attend school among children aged 6 to 10 years in Mali and Nigeria . . . . . . . . . . . . . . . . . 113Table A16. Sampling errors and confidence intervals for household survey data . . . . . . . . . . . . . . . . . . . . . . . . . . . . . 114
Text BoxesBox 1.1. Estimates of out-of-school children . . . . . . . . . . . . . . . . . . . . . . . . . . . . . . . . . . . . . . . . . . . . . . . . . . . . . . . . 13Box 1.2. Defining primary education . . . . . . . . . . . . . . . . . . . . . . . . . . . . . . . . . . . . . . . . . . . . . . . . . . . . . . . . . . . . . . 16Box 1.3. At which age do children drop out from school? . . . . . . . . . . . . . . . . . . . . . . . . . . . . . . . . . . . . . . . . . . . . . . 28Box 2.1. Case study - Sex, age and exclusion in India . . . . . . . . . . . . . . . . . . . . . . . . . . . . . . . . . . . . . . . . . . . . . . . . . 38Box 2.2. Case study - Place of residence, age and exclusion in Indonesia . . . . . . . . . . . . . . . . . . . . . . . . . . . . . . . . . . 41Box 2.3. Case study - Poverty, age and exclusion in Mali . . . . . . . . . . . . . . . . . . . . . . . . . . . . . . . . . . . . . . . . . . . . . . 44Box 2.4. Case study - Mother’s education, age and exclusion in Nigeria . . . . . . . . . . . . . . . . . . . . . . . . . . . . . . . . . . . 47Box 2.5. Regression analysis of school attendance . . . . . . . . . . . . . . . . . . . . . . . . . . . . . . . . . . . . . . . . . . . . . . . . . . . 50


11
CHAPTER 1How many primary
school-age children areexcluded from education?
1.1 Introduction
Education brings wide-ranging benefits to both individuals andsocieties. It is considered so important to individual developmentthat the right to primary education is legally guaranteed in mostcountries of the world. Moreover, international human rightsconventions also recognise the right to education. This right has beenestablished by a succession of UN Conventions, from the UniversalDeclaration of Human Rights (1948) to the Convention on the Rightsof the Child (1989), which acquired the status of international lawin 1990. According to Article 28 of the Convention, governmentshave the responsibility of making primary education compulsory andavailable free to all.
Education is also recognised as crucial to human development.Indeed the Education for All (EFA) movement and the MillenniumDevelopment Goals (MDG) have led to greater attention paid toeducational participation and completion. Universal primaryeducation is Goal 2 of both EFA (Jomtien, 1990; reaffirmed in Dakar,2000) and the MDGs, adopted by UN Member States in 2000(UNESCO, 2000; UN, 2003).
In the context of international goals and commitments, the numberof out-of-school children is one of the most frequently citededucation statistics. It is therefore crucial that, not only anappropriate definition and methodology are used, but that there isa good understanding of the results, their interpretation andlimitations. It is important to clearly recognise that the final goal isnot only to get children in school but to ensure schooling results ingood learning outcomes.

12
The main purpose of this report is to provide jointglobal and regional estimates of primary school-agechildren who are out of school. Until now,international organizations have released varyingfigures based upon various data and method-ologies. This report seeks to avoid this confusion byworking jointly on global and regional results basedupon a range of data sources. Table A1 in Annex 2presents national results from various data sourcesto enable the reader to better evaluate theestimates for a specific country.
This publication draws upon the following datasources: traditional education statistics collecteddirectly from Member States by the UNESCOInstitute for Statistics (UIS), hence referred to asadministrative data; household survey datacollected through the Multiple Cluster IndicatorsSurvey (MICS) conducted by national partners andUNICEF; and the Demographic and Health Survey(DHS) implemented by national partners and ORCMacro.
This chapter is divided into three sections. It beginswith a brief introduction of the new methodologydeveloped jointly by UNICEF and the UIS. Themethodology provides an improved definition ofout-of-school children and uses complementarydata from different sources in order to improvethe accuracy of the estimates.
The second section presents the results for the2001/02 school year. It presents the global andregional estimates for the number of out-of-schoolchildren, followed by global and regional results bygender and estimates for individual countries.
The third section sets out a framework fordistinguishing groups of children who are out ofschool, e.g. those who never participate in schooland those who participate only in part of theprimary education cycle.
1.2 A new approach to estimate thenumber of out-of-school children
Defining out of school
The various global figureson out-of-school childrenpublished in recent yearshave differed not onlywith respect to theirresults but also in termsof definitions (see Box 1.1). Thus, a robust andtransparent definition is crucial to achieve coherentand well-understood statistics. In order to countout-of-school children, five components should beclearly defined:
• What levels of education (e.g. pre-primary, primary, secondary) constitute school?
• What is primary education?
• What is the school-age population to beconsidered?
• How is ‘in school’ defined?
• How is ‘in school’ measured?
The definitions employed for each of thesecomponents are outlined in this section.
Children Out of School: Measur ing Exclusion from Pr imary Education
A robust and transparentdefinition is critical tocounting out-of-schoolchildren.
Chapter 1. How many primary school-age children are excluded from education?
13
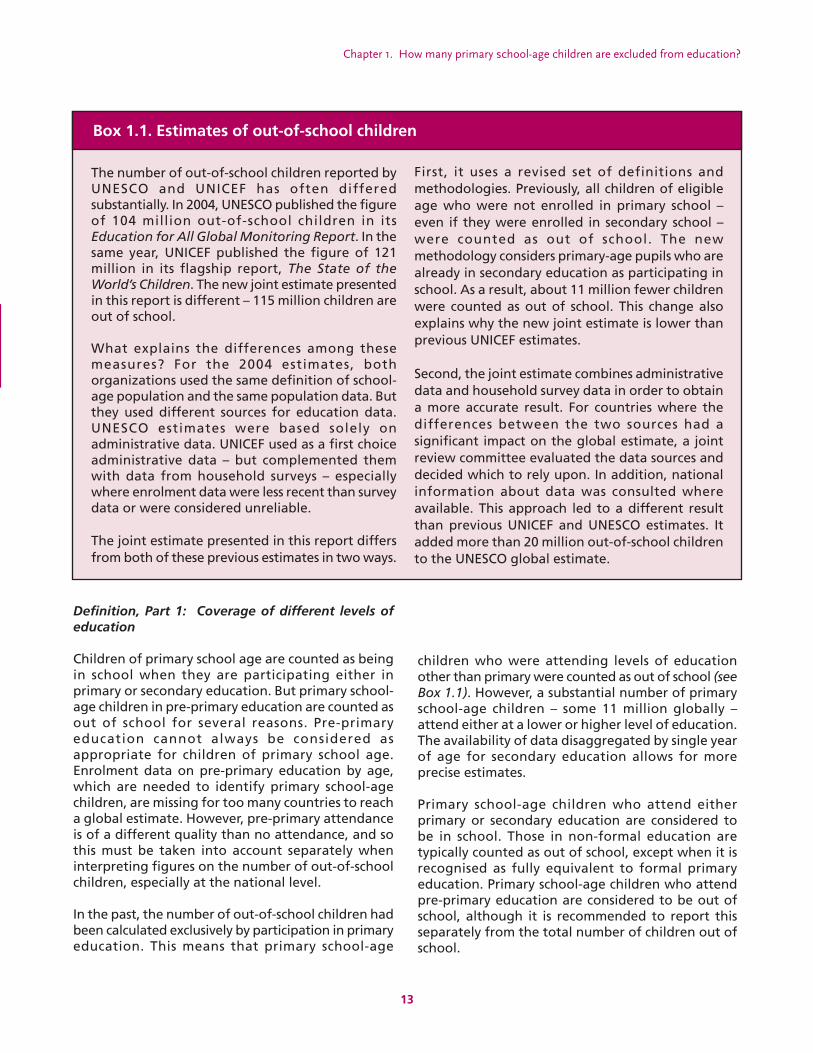
The number of out-of-school children reported byUNESCO and UNICEF has often differedsubstantially. In 2004, UNESCO published the figureof 104 million out-of-school children in itsEducation for All Global Monitoring Report. In thesame year, UNICEF published the figure of 121million in its flagship report, The State of theWorld’s Children. The new joint estimate presentedin this report is different – 115 million children areout of school.
What explains the differences among thesemeasures? For the 2004 estimates, bothorganizations used the same definition of school-age population and the same population data. Butthey used different sources for education data.UNESCO estimates were based solely onadministrative data. UNICEF used as a first choiceadministrative data – but complemented themwith data from household surveys – especiallywhere enrolment data were less recent than surveydata or were considered unreliable.
The joint estimate presented in this report differsfrom both of these previous estimates in two ways.
First, it uses a revised set of definitions andmethodologies. Previously, all children of eligibleage who were not enrolled in primary school –even if they were enrolled in secondary school –were counted as out of school. The newmethodology considers primary-age pupils who arealready in secondary education as participating inschool. As a result, about 11 million fewer childrenwere counted as out of school. This change alsoexplains why the new joint estimate is lower thanprevious UNICEF estimates.
Second, the joint estimate combines administrativedata and household survey data in order to obtaina more accurate result. For countries where thedifferences between the two sources had asignificant impact on the global estimate, a jointreview committee evaluated the data sources anddecided which to rely upon. In addition, nationalinformation about data was consulted whereavailable. This approach led to a different resultthan previous UNICEF and UNESCO estimates. Itadded more than 20 million out-of-school childrento the UNESCO global estimate.
Definition, Part 1: Coverage of different levels ofeducation
Children of primary school age are counted as beingin school when they are participating either inprimary or secondary education. But primary school-age children in pre-primary education are counted asout of school for several reasons. Pre-primaryeducation cannot always be considered asappropriate for children of primary school age.Enrolment data on pre-primary education by age,which are needed to identify primary school-agechildren, are missing for too many countries to reacha global estimate. However, pre-primary attendanceis of a different quality than no attendance, and sothis must be taken into account separately wheninterpreting figures on the number of out-of-schoolchildren, especially at the national level.
In the past, the number of out-of-school children hadbeen calculated exclusively by participation in primaryeducation. This means that primary school-age
children who were attending levels of educationother than primary were counted as out of school (seeBox 1.1). However, a substantial number of primaryschool-age children – some 11 million globally –attend either at a lower or higher level of education.The availability of data disaggregated by single yearof age for secondary education allows for moreprecise estimates.
Primary school-age children who attend eitherprimary or secondary education are considered tobe in school. Those in non-formal education aretypically counted as out of school, except when it isrecognised as fully equivalent to formal primaryeducation. Primary school-age children who attendpre-primary education are considered to be out ofschool, although it is recommended to report thisseparately from the total number of children out ofschool.
Box 1.1. Estimates of out-of-school children

14
Definition, Part 2: Primary education and theprimary school-age population
The concept of out-of-school children implies thatthere is a group of children that should be in schoolbut is not. This group is recognised both nationallyand internationally as primary school-age children.This provides the basis for determining whichchildren are excluded from education. Every countryhas its own definition of primary education thatneeds to be translated into a comparable standardin order to assess progress towards internationalgoals. For the purpose of international comparisons,primary education is defined by the InternationalStandard Classification of Education (ISCED 1997).Countries map their national education systems, inco-operation with international agencies, accordingto the levels of education defined by ISCED. Thisclassification should primarily be based oneducational content, although it is not possible todirectly assess and compare. Primary education ischaracterised by the introductory and systematicprovision of instruction in reading, writing andmathematics. The distinction between the end ofprimary and the beginning of lower secondaryeducation can be blurred. ISCED provides somedistinguishing criteria: for example, primary levelprogrammes are organised in units or projects ratherthan by subjects. Lower secondary education beginsinstruction by subject by teachers with more formalqualifications who conduct classes in their fields ofspecialisation. Lower secondary education also callsfor the full implementation of basic learning skills.
ISCED assumes that the duration needed for theprimary level content is six years. However, durationand starting age of educational programmes serveonly as subsidiary criteria for the classification. Theimplementation of ISCED leads to a cross-nationallycomparable classification, although the age rangefor the programmes can differ by country (see Figure1.1).
In order to define theworld’s school-agepopulation, cross-national comparisonsmust refer to ISCED.Cross-national sta-tistics on out-of-school
children are not based on a single age groupstandardised across countries, such as all childrenaged 6 to 11 years. Children in some countries startprimary education at age 6, while others start at age5, 7 or 8 elsewhere. Thus, a six-year-old child could
be considered out of school in one country and tooyoung to start school in another. This also applies forchildren beyond the ending age of primaryeducation, which would be between 9 and 13 yearsof age, depending on the educational system.
The national primary school-age populationcomprises all children of primary school age in thecountry – according to ISCED definitions. The globalprimary school-age population is the total of allnational primary school-age populations.
Definition, Part 3: Out of school and participationin school
The joint estimate of the number of children out ofschool considers the whole school year and not aspecific point in time. Children are considered to beout of school if they had no exposure to schoolduring the school year in question. All other childrenare considered to be participating in school if theyattended at any point during the reference period,no matter to what extent they were absent orwhether they later dropped out. To avoid confusionwith the concepts of enrolment and attendance, thisreport uses the term participation to denote beingin school.
Applying the definition of participationwith enrolment and attendance data
How can this definition of in school or participationlead to comparable results when applied toadministrative and household survey data?Enrolment data provide the number of childrenenrolled or registered in school. This is measureddifferently across countries. Definitions used forinternational data collections emphasise that theunit of measurement are pupils enrolled, meaningthat children registered more than once should becounted only once and that registration is linked toa pupil.1 Enrolment data potentially differ from thedefinition above in three ways. They can:
• overstate participation by counting registeredchildren who never attend school;
• underestimate participation by missing childrenwho attend school without being registered; and
• underestimate participation when enrolmentis counted at the beginning of the school yearwhile some children register later in the schoolyear.
Children Out of School: Measur ing Exclusion from Pr imary Education
In order to define the world’sschool-age population, cross-national comparisons mustrefer to ISCED.
1 The UNESCO-UIS/OECD/EUROSTAT data collection manual defines students enrolled asthose participating, i.e. registrations are expected to be linked to pupils who are participating.

Chapter 1. How many primary school-age children are excluded from education?
15
Household surveys allow the estimation of schoolattendance in two ways: current attendance2, themost commonly used estimate, and attendance atsome point during the school year, which is theestimate used for this methodology. The latter isbased on the parents’ or guardians’ report as towhether the child is currently atschool or, if not, whether the childattended school at some timeduring the school year. If theanswer to either question is “yes”,the child is considered to haveattended in the reference schoolyear, even if currently absent orout of school. This estimatecould be considered to beinter-changeable with currentattendance.
Various types of errors and biasesare inherent in administrativeand/or survey data, such assampling error, differences in howadministrative data are collectedacross countries, etc. (Samplingerrors and confidence intervals areprovided in Table A16 of Annex2.) In addition, the methodologyand implementation of datacollection for either data source isnot fully internationally standard-ised. Therefore, the errorsassociated with the data arecountry-specific and linked to thetype of data. The joint method-ology assumes that the variancesarising from conceptual differ-ences between the basic definitionand its implementation arenegligible compared to that fromerrors in cross-country comparisoninherent in the data sources. Inother words, errors in comparingacross countries using one datasource are likely to be moresubstantial than errors introducedby a mix of data sources.
Annex 1, Section 1.3 further discusses potentialreasons for differences between results from thetwo data sources. They seem to be linked toproblems associated with the measurement ofpupils’ ages rather than inconsistencies in the countof pupils.
2 Current attendance is based on the parents’ or guardians’ report whether the child attended school within the week prior to the interview. It is commonly used for the calculation of net attendance rates (NAR), but its comparability across countries or with enrolment data is limited. It does not permit the distinction between children permanently out of school and those temporarily not in school, e.g. due to sickness or for reasons such as the harvest season. Since temporary absenteeism, which varies among countries and across households within countries,changes substantially within the school year, the timing of interviews can affect the rates calculated. Interviews can be conducted during holiday periods, harvest season and either early orlate in the school year and lead to very different results. For example, the proportion of dropouts increases the later in the school year that the survey takes place. See also FASAF et al, 2004.
W
Starting age
Duration
orld’s children aged 6 - 11 Countries
World’s children aged 6 - 11 Countries
Figure 1.1. Distribution of population and countries by starting age and duration of primary education, 2001/02
Note: The distribution of the world’s children by starting age and duration shows the distribution of countries
weighted by the size of the population aged 6 to 11 years.
Source: UNICEF/UNESCO Institute for Statistics, Statistical Table A1.

16
The age range used for the calculation of indicatorsis defined at the national level, assuming that thestarting age, duration and ending age of primaryeducation is identical across the country. This maymask differences among regions or districts withincountries. Some children who are not of primaryschool age according to regional regulations maybe counted within the national primary school-agepopulation and thus be incorrectly considered asout of school. Sub-regional differences in primaryeducation structures exist in large, highly-populatedcountries, such as India and China, but also insmaller ones, including Bangladesh, Bolivia,Cameroon, Costa Rica, El Salvador, Haiti, Honduras,Liberia, Nicaragua, Slovakia, Slovenia, and Trinidadand Tobago.
Calculating the number of primary school-age children out of school
First, the number of out-of-school children iscalculated for each country. Wherever possible, thecalculation is made from both data sources. Themethod of calculation used depends on the datasource.
• With administrative data, the number of out-of-school children is calculated as the
difference between the total number of children in the primary school-age population and the number of those children reported asenrolled in either primary or secondaryeducation. (Total population of primary school-age children – number of primaryschool-age children enrolled in primary orsecondary education = number of out-of-school children.)
• With household survey data, the percentageof out-of-school children in the sampled school-age population is calculated. Then, the percentage is applied to the national numberof children of primary school age.
• In both cases, the primary school-agepopulation is based on data provided by theUN Population Division (UNPD).
The second step is to decide which data resultshould be selected for the global estimate.Annex 1 provides a detailed description of how theglobal and regional estimates were derived fromthe different data sources. It describes how thedata and metadata were evaluated to combine thetwo data sources to reach a single estimate.
Children Out of School: Measur ing Exclusion from Pr imary Education
Although cross-national data on primary educationare classified according to ISCED, the differences instarting and ending ages and the duration ofprogrammes remain. Figure 1.1 draws a basic globaloutline of starting ages and duration of primaryschool based on data for the 2001/02 school year.The top chart shows that in the majority of countriesprimary education starts at age 6 (119 countries) or7 (47 countries). These countries are home to 61%and 34%, respectively, of the world’s children inthis age group. The data thus show that 90% ofcountries make ages 6 and 7 the official startingages for primary school and 95% of children live inthese countries.
The global picture is more varied with respect to theduration of the primary cycle. As the bottom chartindicates, primary education ranges from three toeight years in duration. However, in 114 countriesprimary education lasts for six years. Another 29countries have four-year programmes, 22 countrieshave seven-year programmes, and 19 countries havefive-year cycles. Additionally, half of the globalpopulation aged 6 to 11 live in countries with five-year programmes. Slightly more than one-third ofthis age group is found in countries with six-yearprimary programmes. This is mainly due to theclassification of primary education in China andIndia.
Box 1.2. Defining primary education

Chapter 1. How many primary school-age children are excluded from education?
17
1.3 The global and regional estimatesof primary school-age childrenwho are out of school
Global estimates
The number of out-of-school children can beexpressed in several ways. This section draws largelyon two indicators: the absolute number and rate ofout-of-school children. The rate is the total numberof out-of-school children as a percentage of allprimary school-age children. It is useful forcomparisons across countries and regions ofdifferent population size. Chapter 2 explores therate of out-of-school children in relation to other
factors, such as place ofresidence and householdwealth.
A total of 115 million primaryschool-age children werefound to be out of school inthe year 2001/02 as a result ofthe joint methodology.
Figure 1.2 presents the total number of out-of-school children by region, based on the jointmethodology. The greatest numbers of out-of-school children (42 million) live in South Asia,followed by West and Central Africa with 24 million,and Eastern and Southern Africa with 21 million.Together these three regions account for three-quarters of the global total (see Figure 1.3).
In a world thatpromises universalprimary education,115 million childrenare excluded fromschool.
Figure 1.2. Number of primary school-age children outof school by sex and region, 2001/02
Figure 1.3. Distribution of out-of-schoolchildren of primary school age byregion, 2001/02
Note: Country groupings, see Annex 3.
Source: UNICEF/UNESCO Institute for Statistics, Table 1.1.
Source: UNICEF/UNESCO Institute for Statistics, Table 1.1.

18
Expressed in another way, 18% – or almost one infive – of the world’s 650 million children of primaryschool age are not in school. Clearly, there are somewidely different regional patterns behind thisglobal average (see Figure 1.4). Almost half of thechildren in West and Central Africa are out ofschool, and more than one-thirdin Eastern and Southern Africa. InSouth Asia, this proportionexceeds one-quarter. On thecontrary, not more than 6% ofchildren are out of school in EastAsia and the Pacific, Latin Americaand the Caribbean, in addition toindustrialised countries.
Children Out of School: Measur ing Exclusion from Pr imary Education
Figure 1.4. Primary school-age children out ofschool by region, 2001/02
Note: Regional results are weighted by the size of the school-age population.
Source: UNICEF/UNESCO Institute for Statistics, Table 1.1.
Source: UNICEF/UNESCO Institute for Statistics
Almost one in five (18%)of all primary school-agechildren in the world arenot in school.
F MF M F
Percentage of all children of primary school ageSchool-age population
(thousands)
Absolute number of children
TABLE 1.1. PRIMARY SCHOOL-AGE CHILDREN OUT OF SCHOOL BY REGION, 2001/02
Country or territory
MaleTotal Total Total Total Male Female %FemaleMale MaleFemale FemaleFemale
In school Out of school Out of school (thousands)
Central and Eastern Europe / CIS 24,998 12,751 12,247 88.3 89.5 87.1 11.7 10.5 12.9 2,922 1,339 1,583 54.2
Middle East and North Africa 47,116 24,077 23,039 81.3 84.6 77.9 18.7 15.4 22.1 8,797 3,705 5,092 57.9
Eastern and Southern Africa 55,706 27,919 27,787 61.5 62.2 60.9 38.5 37.8 39.1 21,421 10,566 10,855 50.7
West and Central Africa 53,061 26,771 26,289 54.7 58.7 50.7 45.3 41.3 49.3 24,024 11,052 12,972 54.0
South Asia 162,720 84,025 78,694 74.0 77.7 70.1 26.0 22.3 29.9 42,294 18,742 23,552 55.7
East Asia and the Pacific 176,287 91,651 84,636 94.3 94.4 94.2 5.7 5.6 5.8 10,029 5,158 4,870 48.6
Latin America and the Caribbean 58,064 29,565 28,499 94.3 93.9 94.7 5.7 6.1 5.3 3,286 1,789 1,497 45.6
Industrialised countries 70,595 36,247 34,348 96.3 96.0 96.6 3.7 4.0 3.4 2,602 1,433 1,169 44.9
World 648,545 333,006 315,539 82.2 83.8 80.5 17.8 16.2 19.5 115,375 53,784 61,590 53.4

Chapter 1. How many primary school-age children are excluded from education?
19
Gender
Countries made international commitmentstowards eliminating gender disparities in primaryeducation by 2005. Gender parity in primaryeducation is reflected in the fifth goal of the DakarFramework for Action 2000 and the thirdMillennium Development Goal. There are manycountries still far from reaching this goal as shown
by the following threeindicators: absolutenumbers; the share ofprimary school-age girlsamong the total numberof out-of-school children;and finally, differences inout-of-school ratesamong girls and boys.
In absolute terms, 61.6 million girls of primaryschool age around the world are not in school,compared to 53.8 million boys. In other words, girlsaccount for 53% of the world’s out of schoolchildren. While 16% of the world’s primary school-age boys are out of school, the figure is higher forgirls at 20%. In short, one in five eligible girls doesnot go to school.
Figure 1.5 shows the share of girls among out-of-school children which should be interpreted inconcert with Figure 1.4, which presents rates of
out-of-school children by sex. Both charts revealsubstantial differences in gender disparities acrossregions. The share of girls among out-of-schoolchildren is highest in the Middle East and NorthAfrica at 58%. In this region, 22% of eligible girlsare not in school, compared to 15% of eligibleboys.
The second-highest shareof out-of-school girls isfound in South Asia, theregion with the most out-of-school children inabsolute terms. In theregion, 56% of out-of-school children arefemale, or 23.5 million girls compared to 18.7million boys; 30% of girls are not in schoolcompared to 22% of boys.
In West and Central Africa, girls account for 54% ofout-of-school children. However, 49% of eligiblegirls are not in school, compared to 41% of eligibleboys. By comparison, in Eastern and SouthernAfrica, girls represent 51% of out-of-schoolchildren, with a small difference in rates: 39% ofgirls out of school compared to 38% of boys.
Despite the high proportions of children in school,Central and Eastern Europe has the third-highestshare of girls among out-of-school children – 54%.This is largely due to high gender disparities inTurkey, home to one-third of the region’s out-of-school children.
In East Asia and the Pacific, LatinAmerica and the Caribbean andthe industrialised countries, aslight majority of out-of-schoolchildren are male.
Although gender differences aresubstantial in some regions,gender is far from being themost important factor globallyto deter children from attendingschool. Chapter 2 draws onmicro-level data to betteridentify the characteristics ofout-of-school children, includinga more detailed discussion ofgender differences.
Globally, 61.6 milliongirls of primary schoolage are not in school,accounting for 53% ofthe total number ofchildren out of school.
The greatest genderdisparities in schoolparticipation can befound in the Middle Eastand North Africa regionas well as in South Asia.
Source: UNICEF/UNESCO Institute for Statistics, Table 1.1.
Figure 1.5. Distribution of primary school-age childrenout of school by sex and region, 2001/02

20
It is important to note that global and regionalresults mask high gender disparities in individualcountries. Figure 1.6 presents countries with thehighest gender gaps, e.g. where girls or boys are ata disadvantage. For example, there are twice asmany girls as boys out of school in EquatorialGuinea and Grenada. In Chad, Côte d'Ivoire, Egypt,Iraq, Liberia, Morocco, Turkey and Yemen, there arethree to four girls out of school for every two boys.The fact that India has the world’s largest numbersof out-of-school and primary school eligible
children has an enormous impact on the globallevels of gender disparity.
As expected, a few countries show genderdisparities that are weighted against boys (seesecond chart of Figure 1.6). There are 1.5 boys – ormore – for every girl who is out of school in theBahamas, Brazil, Lesotho, Mongolia, theNetherlands Antilles, Philippines and Saint Kittsand Nevis. Typically, these countries also have lowerrates of children out of school.
Children Out of School: Measur ing Exclusion from Pr imary Education
Figure 1.6. Gender disparity among primary school-age children out of school by country, 2001/02
2.1
1.8 1.8 1.8 1.7 1.7 1.7 1.71.6
1.5 1.4 1.4 1.4 1.3 1.31.3 1.3 1.3 1.3 1.3 1.3 1.2 1.2 1.2 1.2
2.6
1.0
1.2
1.4
1.6
1.8
2.0
Equ
at. G
uine
a
Gre
nada
2
Libe
ria 2
Yem
en 1, 2
Cha
d
Côt
e d'Ivoire
Mor
occo
Iraq1,
2
Egy
pt
Turk
ey
Guine
a
Lao
PDR
Ben
in 1
Kyr
gyzs
tan
Pak
ista
n 2
Guine
a-Bissa
u 2
Ang
ola 2
Gam
bia
India 1,2
Bur
undi
Togo
1, 2
Nep
al 1,2
Gua
tem
ala
Pap
ua N
ew G
uine
a
Com
oros
2
Brit
. Virg
in Is
l
1.2 1.2 1.3 1.3 1.3 1.3 1.31.4 1.4 1.5 1.5 1.5 1.6 1.6
1.9
2.4
1.0
1.2
1.4
1.6
1.8
2.0
Bot
swan
a
Cos
ta R
ica
Nam
ibia
Venez
uela
Trinidad
&To
bago
U.S
.A.
Jord
an
Sou
thAfri
ca
Vanua
tu
Bra
zil
Philip
pine
s
Mon
golia
Leso
tho
Net
h.Ant
illes
Bah
amas
St.K
itts &
Nev
is 2
Rat
io o
f girl
s to
boy
sR
atio
of b
oys
to g
irls
Note: 1) Results based on household surveys.
2) Data refer to a different school year. See source table.
The gender parity index (GPI) expresses the number of girls divided by the number of boys out of school. The top chart presents the GPI, the bottom chart the reciprocal value
of the GPI, so as to put disadvantages for each gender on a comparable scale.
The chart presents countries with a GPI greater than 1.2 or the reciprocal value above 1.2. Countries with less than 5% of their children out of school are excluded.
Source: UNICEF/UNESCO Institute for Statistics, Statistical Table A1.

Chapter 1. How many primary school-age children are excluded from education?
21
Regional profiles
The following section presents data on out-of-schoolchildren by region and for individual countries.Wherever data are available, the report distinguishesbetween the number of primary school-age childrencompletely out of school and those still in pre-primary education. This was possible for about halfof the countries, which were able to provide data byage for pre-primary school participation.
South Asia
South Asia is home to one-quarter of the world’sprimary school-age population. It is also the regionwith the highest absolute number of out-of-schoolchildren: 42 million of the 162 million school-age
children in the region (or26%) were out of school in2001/02. These boys andgirls account for 36% of theworld’s out-of-school
children. In relative terms, on average one out of fourschool-age children in the region did not attendschool in the reference year (see Figures 1.2-1.4).
The highest share in South Asia is found in Pakistan,where more than 8 million of almost 20 millionschool-age children (or 40%) are out of school.Nepal has the second-highest (34%) number ofout-of-school children in the region. Figure 1.8presents these proportions in countries for whichdata are available. It excludes countries with fewerthan 5% of children not participating in school.
Not surprisingly, India – the second most populouscountry in the world – has the highest absolutenumber of out-of-school children. According to theMICS 2000 survey, almost 27 million school-agechildren in India do not attend school, or one outof four. India alone accounts for 23% of the globaltotal. In Bangladesh, one out of five or 3.7 millionprimary school-age children are out of school.
Two of the region’s six countries with data availableshow near-universal primary school participation.Fewer than 5% of children are out of school in SriLanka and the Maldives (see Figure 1.7).
More than one-third ofout-of-school childrenlive in South Asia.

22
Children Out of School: Measur ing Exclusion from Pr imary Education
Fig
ure
1.7
. Pr
imar
y sc
ho
ol-
age
child
ren
ou
t o
f sc
ho
ol b
y co
un
try,
200
1/02
No
te:
Dat
a fr
om
ho
use
ho
ld s
urv
eys
for
Ban
gla
des
h, B
enin
, Bo
snia
an
d H
erze
go
vin
a, C
amb
od
ia, C
amer
oo
n, C
entr
al A
fric
an R
epu
blic
, Eth
iop
ia, H
aiti
, In
dia
, Ira
q, N
epal
, Nig
eria
, Sie
rra
Leo
ne,
So
mal
ia, T
og
o, U
gan
da,
Uzb
ekis
tan
an
d Y
emen
.
Sou
rce:
UN
ICEF
/UN
ESC
O In
stit
ute
fo
r St
atis
tics
, Sta
tist
ical
Tab
le A
1.
0 -
56
- 10
11 -
30
31 -
50
51 -
89
Chi
ldre
n o
ut o
f sc
hoo
l (%
)

Chapter 1. How many primary school-age children are excluded from education?
23
Figure 1.8. Out-of-school children of primary school age in countries with rates above 5%, 2001/02
Zimbabwe2
Malawi
Lesotho
Seychelles
South Africa
Rwanda
Botswana
Uganda1,2
Swaziland
Madagascar
Angola2
Comoros2
Burundi
Ethiopia1,2
Jordan
Bahrain
Kuwait
Iran, Isl. Rep.
Iraq1,2
Saudi Arabia
Sudan2
Zambia
Kenya
Namibia
Tanzania
Mozambique
Eritrea
Somalia1,2
Yemen1,2
Belarus
Romania
Ukraine
Russian Fed.
Armenia
Moldova
Azerbaijan
Oman
Un. Arab Emirates
Morocco
Lebanon
Egypt
Croatia
Djibouti
Bulgaria
Georgia
Bosnia & Herzegov.1,2
Turkey
Kyrgyzstan
Out of school of which, in pre-primary Regional average
NigerSerbia & Montenegro2
Uzbekistan 1,2
Congo, Dem. Rep2Burkina Faso
Mali 2Sierra Leone1,2
Cent. Afr. Rep.1,2Guinea-Bissau2
Benin1
ChadSenegal
GhanaNigeria1,2
GuineaTogo1,2
Côte d'IvoireMauritania
Liberia2
GambiaCameroon1,2
Gabon 2Equat. Guinea
Pakistan2
Nepal1,2
India1,2Bangladesh1,2
Cambodia1,2Papua New GuineaNauru2
MyanmarLao PDRMacao, ChinaThailand
MongoliaPhilippines
Haiti1,2
Viet Nam
Vanuatu
GuatemalaGrenada 2St.Kitts & Nevis2
NicaraguaHonduras
Colombia
Neth. Antilles
El SalvadorCosta Rica
Paraguay
Trinidad & Tobago
Turks & Caicos Is.
Bahamas
Brazil
Brit. Virgin Isl
Venezuela
0 20 40
Children out of school (%)
60 80 100 0 20 40
Children out of school (%)
60 80 100
West and Central Africa
South Asia
East Asia and the Pacific
Latin America and the Caribbean
Central and Eastern Europe/CIS
Middle East and North Africa
Eastern and Southern Africa
Note: 1) Results based on household surveys.
2) Data refer to a year different from 2001/02. For the exact year, see Statistical Table A1.
Countries with less than 5% of out-of-school children are not displayed in the chart.
Data on participation in pre-primary are presented for countries with available data. Otherwise it is included in the total of out-of-school children. See Statistical Table A1 for
the availability of data on pre-primary education.
Source: UNICEF/UNESCO Institute for Statistics, Statistical Table A1.

24
West and Central Africa
West and Central Africa has the highest prevalenceof primary school-age children out of school.Although the region’s primary school-age
population accounts forjust 8% of the global total,the region has 20% ofthe world’s out-of-schoolchildren – the secondhighest share after South
Asia. In absolute terms, 24 million out-of-schoolchildren live in the region. The proportion in theregion is 45% - or almost every second child (seeFigures 1.2-1.4).
In a number of countries, the majority of school-agechildren are not in school, reaching as high as two-
thirds of the relevant agegroup. As Figure 1.8 shows, inBurkina Faso, the CentralAfrican Republic, the Demo-cratic Republic of Congo,Guinea-Bissau, Mali, Niger and
Sierra Leone, the share of school-age children notin school ranges from 50% to 66%.
Virtually no country in this region is close touniversal primary education. The only exception isSao Tome and Principe, the small island republic inthe Gulf of Guinea, where administrative data showa participation rate of more than 95% (however,rates based on household survey data are muchlower; see Statistical Table A1).
Eastern and Southern Africa
Eastern and Southern
Africa has the third-
largest population of out-
of-school children in the
world – 21 million in all. In
terms of the rate of
children out of school, the region is second after
West and Central Africa. More than one-third of all
primary children in the region are not in school
(see Figures 1.2-1.4).
Somalia has the dismal distinction of having the
world’s highest proportion of primary school-age
children not in school. Here, 1.6 million out of 1.8
million eligible children – nine out of ten girls and
boys – are unable to access education. This is the
result of years of factional
conflict and the lack of a
national government. Out-
of-school rates exceed
50% in the neighbouring
countries of Eritrea and
Ethiopia, which have also experienced armed
conflict. Finally, Burundi, Comoros, Mozambique
and Tanzania have out-of-school rates greater than
40% (see Figure 1.8).
The effect of pre-primary school attendance varies
widely in sub-Saharan Africa. In Angola, more than
10% of primary school-age children are still
participating in pre-primary education (see Figure
1.8). In the Seychelles, over 95% of children
considered to be out of school are enrolled in pre-
primary education.
Middle East and North Africa
The Middle East and North Africa region is home to
8.8 million out-of-school children, or 20% of all
primary school-age children in the region (see
Figures 1.2-1.4). There is, however, marked variation
among countries. The highest proportions of out-
of-school children are found in Djibouti and Sudan,
with 65% and 51%, respectively. They are followed
by Yemen and Saudi Arabia, with more than 40%
each. On the other hand, the proportion is less
than 10% in nine countries, e.g. Algeria, Egypt,
Libya and Syria. Almost all countries in the region
report very low rates of primary school-age children
who are still in pre-primary education (see
Figure 1.8).
Children Out of School: Measur ing Exclusion from Pr imary Education
Almost every secondchild of primary schoolage in West and CentralAfrica is out of school.
In some countries,two-thirds of school-age children are notin school.
More than one-third ofall primary school-agechildren in Eastern andSouthern Africa are outof school.
Nine out of ten childrenare out of school inSomalia, the highestnational rate in theworld.

Chapter 1. How many primary school-age children are excluded from education?
25
East Asia and the Pacific
Participation rates are generally high in East Asiaand the Pacific. China is the most populous countryin the region – with more than 60% of the region’schildren – and it has a high participation rate (96%)for primary school. Eleven other countries alsoreport that more than 95% of all primary school-age children are in school (see Figure 1.7). However,there are several exceptions, such as Cambodia andPapua New Guinea, where some 30% of primaryschool-age children are out of school (see Figure1.8).
Latin America and the Caribbean
In Latin America and theCaribbean, only 5% of allprimary school-age children,about 3 million, are not inschool. About half of thecountries in the region reportmore than 95% of all children
in school (see Figures 1.2-1.4).
Haiti is the notable exception: almost every secondchild of primary school age is not in school, whichamounts to about 570,000 children. It has thesecond-largest out-of-school population in theregion – even after Brazil, which has 10 times morechildren.
There are several countries in the region that reportmore than 10% of primary school-age childrennot in school: Colombia, Grenada, Guatemala,Honduras, the Netherlands Antilles, Nicaragua andSaint Kitts and Nevis. However, in a number ofcountries, e.g. Brazil, British Virgin Islands, andCosta Rica, a substantial proportion of thesechildren are in fact participating in pre-primaryeducation (see Figure 1.8).
Central and Eastern Europe and the Common-wealth of Independent States
Central and Eastern Europe and the Common-wealth of Independent States is the region with thesmallest population of primary school-age children– 25 million. Nonetheless, almost 3 million are notin school. At a rate of 11%, the share is twice thatof Latin America and the Caribbean, as well as thatof industrialised countries (see Figures 1.2-1.4). Thisdemonstrates that the high participation ratestypical under Soviet and communist rule have not
been maintained in some countries. Countries withthe highest proportion – more than 15% – ofprimary school-age children not in school includeAzerbaijan, the Republic of Moldova, Serbia andMontenegro, as well as Uzbekistan (see Figure 1.8).
In terms of absolute numbers, most of the region’sout-of-school children live in its two most populouscountries, the Russian Federation (0.5 million) andTurkey (1 million). With exclusion rates of 12% and11%, respectively, both countries are close to theregional average.
Four countries in the region report participationrates greater than 95%: Albania, the formerYugoslav Republic of Macedonia, Kazakhstan andTajikistan. In Belarus and the Republic of Moldova,most of the primary school-age children consideredto be out of school are participating in pre-primaryeducation.
Industrialised countries
Not surprisingly, the lowest proportions of childrennot in school - less than 4% - can be found in theindustrialised countries, totaling 2.6 millionchildren. Of the 36 countries for which data areavailable, 30 countries report that more than 95%of the primary school-age cohort are participatingin primary or secondary education (see Figures 1.2-1.4).
However, exceptions do exist. In several countries,many children who start school late attend pre-primary education though they are of primaryschool starting age. Yet, for many industrialisedcountries, no reliable data exist on the exactenrolment rates for the first year of primary schoolage (see Annex 1, Section A for further details).
But, not all children out of school in these well-offcountries are in pre-primary education. In Latvia,10% of the primary-age cohort does not attendeither pre-primary or primary school. The UnitedStates also has a relatively high share of primaryschool-age children not attending either primary orpre-primary education (4.3%). There are severalpossible explanations: first, that children startprimary school late, and second, that theyparticipate in home-schooling as in the UnitedStates. But even these factors do not fully explainthe total number of out-of-school children in thosecountries.
In Latin Americaand the Caribbean,95% of all childrenare participating ineducation.

Children Out of School: Measur ing Exclusion from Pr imary Education
1.4 A framework for classifying out-of-school children
A typology of out-of-school children helps todistinguish the different types of out-of-school status.The framework distinguishes amongst groups interms of policies aimed at reducing the number ofout-of-school children. Different policies are neededin order to provide access to those excluded from theschool system, to ensure that children start school intime, or to ensure that they complete a full cycle ofprimary education.
Out-of-school children ofprimary school age fall intotwo main groups with respectto their exposure to edu-cation. The first group consistsof children who have yet tostart school. The second groupcomprises children who have
dropped out before reaching the theoreticalcompletion age for primary school.
The first group can be broken down further in termsof the probability of future school participation.There is a good chance that many of these children,especially those at younger ages, will start school atsome point in the future. Some, however, will neverbegin schooling. Examining rates of schoolparticipation for older primary school-age childrenallows one to judge the proportion of young out-of-school children that may be expected to enterprimary school late.
By way of illustration, Figures 1.9 and 1.10 highlightthe age profiles of out-of-school children for selectedcountries. The graphs show how the relative size ofeach of the three types of out-of-school childrendiffers across countries.
Figure 1.9 presents the case of Zambia. As many as61% of 7-year-olds and 44% of 8-year-olds had yetto attend school. This “never attended” group ismuch smaller among olderchildren. The proportion ofchildren who have never been toschool drops to below 10% bythe age of 15, which suggeststhat a considerable number ofthose 7- and 8-year-olds who were out of schoolcould be expected to start school later. In fact, giventhe participation rates for older children, theprobability that an out-of-school 7-year-old inZambia will eventually start school is six to one. Onthe other hand, 23% of 13-year-olds, the theoreticalage for completing primary school, are out ofschool. Half were never in school and the other halfdropped out.
The Zambian situation can be analysed from twoperspectives. The longitudinal perspective looks atchildren born in the same year and analyses theexposure of that group over the duration of theiryears of primary school age. Given the data available,the longitudinal perspective reflects a syntheticcohort, which is based on the assumption that theparticipation rates observed in the survey yearremain unchanged over time. Another perspectivetakes a “snapshot” of the whole primary school-agegroup at one point in time.
From the longitudinal perspective, there appears tobe a core group (12%) of children who never attendschool between the ages of 7 to 13. They grow upwithout any formal education. Another 49% of anage cohort starts education late. Finally, 11% appearto drop out before they reach the theoretical primarycompletion age.
A “snapshot” of primary school-agechildren in Zambia represents theaverage participation rate over theprimary school ages. It shows that in2001/02, 32% of primary school-agechildren were out of school. Withinthis group, 38% can be expected tonever go to school, 24% alreadydropped out, and another 38% can beexpected to enter school in years tocome.
A comparison of age profiles acrosscountries, as presented in Figure 1.10,helps to identify and illustratedifferent patterns of exclusion fromeducation.
Out-of-school childrencan be grouped intothose who have notyet entered schooland those who havedropped out.
Some out-of-schoolchildren will enterschool late, otherswill never benefit.
Source: DHS, 2001.
Figure 1.9. Out-of-school children by age andschool exposure in Zambia, 2001/02
26

Chapter 1. How many primary school-age children are excluded from education?
27
common and found in a number of countries,including Botswana, Georgia and the Philippines.
A third pattern emerges where children who havedropped out of school make up a substantialproportion of out-of-school children (e.g. Rwandaand Zambia). This pattern is less common but itmay pose a much bigger problem for education
Age Age
AgeAge
Age
Figure 1.10. Out-of-school children by age and school exposure in selected countries
Sources: Ethiopia: DHS, 2000; Mali: DHS, 2001; Rwanda: DHS, 2000;
Uganda: DHS, 2000-2001; Dominican Republic: DHS,2002.
Several main patterns emerge. One is where thevast majority of out-of-school children will never goto school (e.g. Burkina Faso and Mali). In Mali, theproportion of potential late entrants and dropoutsis comparatively small, i.e. just 4% of a single-yearage cohort.
A second pattern shows that most out-of-schoolchildren attend some school but usually start late.For example, in the Dominican Republic, 97% of 11-year-olds (the last year of primary school age) arein school. This indicates that almost all childrenhave access to primary education, although theymay start late. It is important to note, however,that a substantial proportion of children still startschool late or very late. Almost half of the childrenat the official age for starting school were not inschool, with 15% still not participating by thesecond year. Altogether, three-quarters of out-of-school children were expected to enter school late.The group of children who drop out or never go toschool is relatively small. This pattern is quite

28
Children Out of School: Measur ing Exclusion from Pr imary Education
Staying in school until the end of primary schoolage is not the same as completing primaryeducation. Due to late entry and/or graderepetition, a child may reach the expectedgraduation age without having completed primaryschool. Indeed, pupils who are overage for theirgrade have been shown to be at greater risk ofdropping out later (Wils, 2004).
Figure 1.11 presents data for pupils who did notcomplete primary education in selected countries.For each country, it presents the dropouts by agegroup – whether they were of primary school agewhen they left school or whether they were older.The graph shows that the majority of these children
were older than the typical ending age for primaryschool. Indeed, in 9 out of the 15 countriespresented, the majority of children left school whenthey were already three or more years older thanthe expected ending age for primary education.
These findings emphasise that focusing only on theprimary school-age group can mask the real scale ofdropout rates. Nevertheless, the high proportion ofoverage dropouts indicates the importance ofchildren starting school in time and movingsmoothly through the system. Indicators that trackchildren by age are needed to monitor these aspectsof education systems (see Langsten and Hassan,forthcoming).
Box 1.3. At which age do children drop out from school?
systems. It is worth noting that, in most countries,the majority of children who drop out do so afterthey have passed the end of primary school age.This does not mean, however, that they havecompleted primary school (see Box 1.3).
It is important to note that no single pattern ofexclusion predominates in countries with highnumbers of out-of-school children. All three out-of-school types – late entry, early dropout and neverattending – contribute to the total number.
Figure 1.11. Children leaving school without completing primary education by age range
Note: The figure presents data on children who were reported to be out of school during the reference school year but who
were in school the previous year.
Source: Calculations based on DHS and MICS. See Statistical Table A1.

Chapter 1. How many primary school-age children are excluded from education?
29
Global patterns
Of the world’s 115 million children who are out ofschool, what share can be expected to enter schoollate, to have dropped out or to never attendschool? The typology can be applied at the globallevel, although it should be noted that thisapproach provides only a rough indicator of thedistribution of out-of-school children. For furtherdetails on the calculation of this indicator, seeAnnex 1.
Figure 1.12 shows that two out of three childrenwho were not in school in 2001/02 will probablynever attend during their primary school-age years.In other words, the vast majority of these childrenare completely excluded from education.
On the other hand, one out of three children whoare currently out of school will or have alreadyreceived some primary education. In other words,the education system connects with the child butnot at the intended age or for the intendedduration.
Late-starters account for 29% of the total numberof out-of-school children. Children who drop outmake up just 6%. However, it should be emphasisedthat leaving school without completing a full cycle
of primary education is still problematic. Yet, becausethis occurs mainly among older ages, it is not fullycaptured by statistics on primary school-age children.
Figure 1.12 shows the variation inthe different types of out-of-school children by region. In Africa,South Asia, and Central and EastEurope and the Commonwealthof Independent States (CIS),children who are out of school willmost likely never attend – although the phenomenaof late entry or early dropout should not be ignored.The picture is different in East Asia and the Pacific,Latin America and the Caribbean and theindustrialised countries. Here out-of-school childrencan typically be expected to enter school late. Lessthan one-quarter of these children are completelyexcluded from education.
The following charts take a different perspective bylooking at cohorts of children born in the same year.Figure 1.13 shows the percentage of children ofofficial school entry age who are not in school. Theyare further disaggregatedaccording to the likelihood thatthey will enter school in thefuture. Globally, 28% of allchildren at official school-entry
age are not in school.This indicates that oneout of four children areout of school for oneor more years of theirprimary school-age span. Eventually, most ofthem attend school for more than one year.Nevertheless, 12% of children will neverattend school – or one in 10 children willgrow up excluded from education.
In West and Central Africa, as well as inEastern and Southern Africa, almost 60% ofall children at official school-entry age arenot in school. Most of them will neverattend. The same is true in South Asia, where36% of children at entry age are not inschool. The picture is quite different in EastAsia and the Pacific, Latin America and theCaribbean and the industrialised countries.Here, there is also a significant proportion ofchildren at entry age who are not in school(14%), but almost all of them can beexpected to start later.
Two-thirds of theworld’s out-of-school childrengrow up withoutany education.
Globally, more thanone in four childrenare out of schoolduring one or moreyears of primaryschool age. One inten will never attendprimary school.
Figure 1.12. A typology of out-of-school children with respectto exposure to education by region, 2001/02
Never in school Late entry Dropout
Note: For details on the methodology, see Annex 1.
Source: UNESCO Institute for Statistics database.

30
Figure 1.14 shows the percentage of children whowill likely never attend school by country. Highlevels of exclusion are found mainly in countries ofsub-Saharan Africa and to a lesser extent in Southand East Asia. Every second child in Burkina Faso,the Democratic Republic of the Congo, Djibouti,Eritrea, Ethiopia, Mali, Sierra Leone and Somalia willgrow up without any education if current trendscontinue. Every third child will grow up withoutgoing to school in Burundi, Central AfricanRepublic, Comoros, Guinea-Bissau, Niger and theUnited Republic of Tanzania. Outside Africa, suchhigh levels are found only in Pakistan and SaudiArabia.
With few exceptions, all other countries withexclusion rates greater than 10% are also found inAfrica or in South and East Asia, notably Nepal(17%), India (15%), Bangladesh (14%), Lao PDR(13%) and Cambodia (12%).The only exceptions,where data are available, are Haiti (19%) and PapuaNew Guinea (13%).
Figure 1.15 presents the proportion of out-of-schoolchildren of the official school-entry age who areexpected to enter later. The figure shows thatdelayed entry is widespread across all regions.Indeed, in East Asia and the Pacific, the Americasand Europe, it is the single-most important factorkeeping children out of school. It is estimated thatmore than 50% of children will enter at least oneyear later than the primary school-entry age in 13countries or more, including: Botswana, Gabon,Liberia, Namibia, and Uganda. Most notable arecountries that have high rates of late entry andnever entering, such as Cambodia, Haiti, Senegaland Uganda.
As mentioned earlier, some out-of-school childrenwho will enter primary school late are actuallystill in pre-primary education. This is the case formore than 5% of the primary school-age childrenin Liberia, St. Kitts and Nevis, and Thailand.
Children Out of School: Measur ing Exclusion from Pr imary Education
Figure 1.13. Children of official school-entry age not in schoolby expected participation and region, 2001/02
Chi
ldre
n at
sta
rtin
g ag
e (%
)
Note: For details on the methodology, see Annex 1.
Source: UNESCO Institute for Statistics database.

Chapter 1. How many primary school-age children are excluded from education?
31
Figu
re 1.14. Percentag
e of a sin
gle-year ag
e coh
ort exp
ected to
never atten
d sch
oo
l, 2001/02
No
te:Fo
r details o
n th
e meth
od
olo
gy, see A
nn
ex 1.
Sou
rce:U
NIC
EF/UN
ESCO
Institu
te for Statistics, Statistical Tab
le A2.
0 - 56 - 1011 - 2526 - 5051 - 90
Child
ren never in schoo
l(%
of sing
le year coho
rt)

32
Children Out of School: Measur ing Exclusion from Pr imary EducationFi
gu
re 1
.15.
Per
cen
tag
e o
f a
sin
gle
-yea
r ag
e co
ho
rt e
xpec
ted
to
en
ter
sch
oo
l del
ayed
, 200
1/02
No
te:
For
det
ails
on
th
e m
eth
od
olo
gy,
see
An
nex
1.
Sou
rce:
UN
ICEF
/UN
ESC
O In
stit
ute
fo
r St
atis
tics
, Sta
tist
ical
Tab
le A
2.
Chi
ldre
n ex
pec
ted
to
ent
er la
te(%
of
sing
le y
ear
coho
rt)
0 -
56
- 10
11 -
25
26 -
50
51 -
100
33
2.1 Introduction
This report presents a new global total for the number of out-of-school children – 115 million. This figure is the outcome of a jointcalculation by UNESCO and UNICEF, as described in detail inChapter 1. It sets a new common baseline for the number of childrenwho are of primary school age but who are not in primary orsecondary school. The collaboration by these two lead agencies hashelped to establish more authoritative estimates, not only on theglobal total of out-of-school children, but on their distribution byregion and country as well.
This chapter looks at these numbers from the perspective of thechild. We know how many out-of-school children there are andwhere they are; now we ask, who are they? The aim of this chapteris to add a more detailed portrait of out-of-school children bypresenting the socio-economic and demographic characteristics ofthese children, as well as their parents and households. Thisinformation is vital for effective policy development and appropriateprogrammes or interventions. Specifically, this chapter looks at out-of-school children by sex, mother’s education, household wealth andplace of residence (urban/rural). Age is presented as a cross-cuttingvariable. The analysis explores whether and how much eachcharacteristic influences the number of out-of-school children.
CHAPTER 2Assessing the characteristics
of out-of-school children

34
It should be noted that, in contrast to Chapter 1, theanalysis in this chapter is based on data fromhousehold surveys and does not include the groupof industrialised countries. The data, available for80 countries, were collected between 1996 and2003 as part of the Multiple Indicator ClusterSurveys (MICS), conducted by UNICEF, and theDemographic and Health Surveys (DHS), conductedby ORC Macro with funding from USAID. Results arepresented for each country and globally for thefollowing regions:
Central and Eastern Europe, Commonwealth of Independent States (CEE/CIS): 9/20 countries or territories
Armenia, Azerbaijan, Bosnia and Herzegovina, Kazakhstan, Kyrgyzstan, Moldova, Tajikistan, Turkey, Uzbekistan
Middle East and North Africa: 7/20 countries or territoriesAlgeria, Bahrain, Egypt, Iraq, Lebanon, Sudan, Yemen
Eastern and Southern Africa: 20/22 countries or territoriesAngola, Botswana, Burundi, Comoros, Eritrea, Ethiopia, Kenya, Lesotho, Madagascar, Malawi, Mozambique,Namibia, Rwanda, Somalia, South Africa, Swaziland, Tanzania, Uganda, Zambia, Zimbabwe
West and Central Africa: 21/24 countries or territoriesBenin, Burkina Faso, Central African Republic, Cameroon, Chad, Congo (Democratic Republic), Côte d'Ivoire,Equatorial Guinea, Gabon, Gambia, Ghana, Guinea, Guinea-Bissau, Mali, Mauritania, Niger, Nigeria, Sao Tomeand Principe, Senegal, Sierra Leone, Togo
South Asia: 4/8 countries or territoriesBangladesh, India, Nepal, Pakistan
East Asia and the Pacific: 7/30 countries or territoriesCambodia, Indonesia, Lao PDR, Mongolia, Myanmar, Philippines, Viet Nam
Latin America and the Caribbean: 12/41 countries or territoriesBolivia, Brazil, Colombia, Dominican Republic, Guatemala, Guyana, Haiti, Nicaragua, Peru, Suriname, Trinidadand Tobago, Venezuela
Overall, these 80 countries reflect 59% of theworld's primary school-age population. In Easternand Southern Africa, West and Central Africa, andSouth Asia, more than 96% of children are coveredby the surveys. In other regions, the coverageranges between 39% and 59%. Although the groupof industrialised countries is not included in thesurveys, they cover the countries where 83% ofout-of-school children live. Estimates presented areweighted averages of available country data.
Children Out of School: Measur ing Exclusion from Pr imary Education

Chapter 2. Assessing the characteristics of out-of-school children
35
2.2 Demographic and socio-economicdeterminants
Based on the available household survey data, it isestimated that 26% of primary school-age childrenin these 80 countries were out of school (Figure 2.1).The data from household surveys also indicate that,in relation to the existing primary school populationin each region, the highest proportions of childrenout of school are observed in Africa, South Asia andthe Middle East and North Africa. These estimatesare similar to the global estimates by regionpresented in Chapter 1. In 14 African countries,survey data show that one-half or more of primaryschool-age children are not attending school:Somalia (89%), Burkina Faso (72%), Niger (70%),Comoros and Ethiopia (69%), Mali and Chad (61%),Guinea (60%), Guinea-Bissau and Sierra Leone(59%), Central African Republic (57%), Mauritania(56%), Burundi (55%) and Senegal (52%) (seeStatistical Table A3).
However, since the population of primary school-age children differs by region, we also find that44% of out-of-school children live in Africa (23% inWest and Central and 21% in Eastern and
Southern), followed bySouth Asia with 40%. At thecountry level, India, Pakistan,Nigeria and Ethiopia havethe greatest numbers ofchildren out of school.
Figure 2.2 provides a profile of the global out-of-school population for the 80 survey countries by sex,mother’s education, household wealth, and placeof residence. It shows that in these countries:
• A greater share of girls is out of school – 28%compared to 24% of boys.
• More than twice as many children whosemothers have no education are out of school –36% compared to 16% for children of motherswith some education.
• More than three times as many children fromthe poorest 20% of households are out of school compared to those from the richest 20%of households – 38% compared to 12%.
• A much greater share of children who live inrural areas are out of school than those who livein urban areas – 30% compared to 18%.
Often, these factors interact with each other. Themulti-variate analysis presented in Section 2.3attempts to identify the net effects and relativesignificance of each factor.
Figure 2.1 Primary school-age children out of school by regionbased on household survey data, 1996-2003
Note: Based on surveys conducted in 80 countries.
Source: UNICEF/UNESCO Institute for Statistics, Statistical Table A3
Note: Based on surveys conducted in 80 countries.
Source: UNICEF/UNESCO Institute for Statistics, Statistical Table A3
India, Pakistan, Nigeriaand Ethiopia have thegreatest numbers ofout-of-school children.
Figure 2.2. Primary school-age children out of schoolby background characteristics, 1996-2003

36
Age
The age of a child is one of the most importantvariables to be considered when analysing patternsof school (non-)attendance. More specifically, asraised in Chapter 1, it matters whether childrenstart school at the prescribed entry age and,thereafter, whether they are in the appropriategrade for their age. When children start late orrepeat grades, it increases the likelihood that theywill drop out before completion. The analysisconsiders the effect of age as part of case studies infour countries: India, Indonesia, Mali and Nigeria.Each case study looks at one of the four keydeterminants – sex, mother’s education, householdwealth, place of residence – through the lens ofage. It is important to note that the analysis drawson data for the entire school-age range collected bythe individual surveys. For India, the data coverschool attendance for household members aged 5to 14 years; for Indonesia, Mali and Nigeria, forhousehold members aged 5 to 24 years.
For the purpose of the analysis, the children aredivided into three distinct groups:
• The first group covers children who arecurrently attending school, regardless of level(e.g. primary, secondary or tertiary education).
• The second group covers children who havenever attended formal education. However, thismay include children who are of school age butattend pre-primary programmes or non-standard forms of education.
• The third group covers children who haveattended primary, secondary or tertiaryeducation in the past but have since left school.
The second and third groups together comprisethe share of school-age children who are out ofschool.
The countries in the case studies represent a widerange of primary school-age participation levels,from 39% in Mali to 94% in Indonesia. Nigeria andIndia present intermediate values at 62% and 77%,respectively. It is important to note that most of the
remaining children have never gone to school and,therefore, the dropout rates for school are relativelylow in all four countries.
However, patterns become more complex whenviewed from a broader age perspective. Leavingschool is much more pronounced at the secondarylevel. In Indonesia, the dropout rate is particularlyhigh – 38% of secondaryschool-age youth leaveschool. Clearly, the factorsthat produce a very high rateof participation at theprimary level (94%) are nolonger present at the secondary school level, whereparticipation falls to 61%. What is hindering thetransition from primary to secondary school? Andwhat must change to keep those at the secondarylevel in school? Furthermore, it is important to lookat secondary school-age children who are still inprimary school. For example, in Mali, more thanone-half of the children of secondary school age arestill in primary school. What are their prospects andwhat can be done to ensure that they stay in schooland progress to secondary education?
Sex
Household survey data for the 80 countries indicatethat for every 100 boys of primary school age whoare not in school, there are117 girls out of school(Figure 2.3). Exclusion ofprimary school-age girls isparticularly marked in theMiddle East and North Africa(134 girls to 100 boys); SouthAsia (129:100); and West andCentral Africa (118:100); and in individual countrieslike Yemen (184:100), Iraq (176:100), India andBenin (136:100), Nepal (135:100), Egypt (131:100),Pakistan (129:100) and Togo (126:100).
On the other hand, the out-of-school ratio in LatinAmerica and the Caribbean is 96 girls to 100 boys.Nonetheless, some countries in the region still havehigh rates of exclusion of girls – Bolivia, Guatemalaand Peru all have ratios greater than 120:100 (seeStatistical Table A3).
Children Out of School: Measur ing Exclusion from Pr imary Education
38% of secondaryschool-age childrendrop out of school inIndonesia.
Exclusion of primaryschool-age girls ismarked in the MiddleEast and North Africa,South Asia, and Westand Central Africa.

Chapter 2. Assessing the characteristics of out-of-school children
37
Note: Based on surveys conducted in 80 copuntries.
Source: UNICEF/UNESCO Institute for Statistics, Statistical Table A3.
Figure 2.3. Children out of school by sex and region, 1996-2003
Note: Based on surveys conducted in 80 countries.
Source: UNICEF/UNESCO Institute for Statistics, Statistical Table A4.
Figure 2.4. Distribution of primary school-age out-of-school children by sex and region, 1996-2003

38
Children Out of School: Measur ing Exclusion from Pr imary Education
In India, the official age range for primary schoolis 6 to 10 years, and 11 to 17 years for secondaryschool. As Figure 2.5 shows, there are some childrenyounger than 6 years who attend primary schooland a much larger number who are still in primaryschool at older ages (11 to 14 years). The main
factors for the latter are late entry into school andgrade repetition. Figure 2.6 shows the substantialshare of children aged 8 years and older whoattend a grade lower than prescribed for their age.These pupils fall into the overage category.
Box 2.1. Case study - Sex, age and exclusion in India
Figure 2.5. School attendance by sex and age in India, 2000
Figure 2.6. Overage and underage children by sex and age in India, 2000
Note: Official primary school ages: 6 to 10 years; official secondary school ages: 11 to 17 years.Source: MICS, 2000.

(84%) and West andCentral Africa (81%), morethan 8 in 10 children whoare out of school live inrural households (seeFigure 2.8). This comparesto 60% in the LatinAmerica and Caribbeanregion. In some countries,the share of the rural out-of-school population is
very high: Ethiopia (96%), Burkina Faso (95%),Malawi (94%), India and Bangladesh (84%), andPakistan (81%). These high levels are shaped byvery large population sizes(e.g. India) or very low levelsof school attendance (e.g.Burkina Faso and Ethiopia)(see Statistical Table A4).
As concluded later in thischapter, the net effect ofplace of residence on the probability of a childbeing out of school is significant for only a limitednumber of countries once other socio-economicand demographic variables are taken intoconsideration.
Chapter 2. Assessing the characteristics of out-of-school children
39
As expected, the dropout rate is much higher atsecondary school ages (11%) than at primary schoolages (less than 2%). As Figure 2.5 indicates andTable 2.1 confirms, girls at older ages are slightlymore likely to drop out of school than boys (12%compared to 10%).
Place of residence
Place of residence (i.e. urban or rural location) alsoinfluences the likelihood that a child will be out ofschool. The proportion of children out of school isgreater in rural areas; in fact, almost double thatobserved in urban areas, 30% compared to 18%.Since most children of primary school age indeveloping countries live in rural areas, it is notsurprising that 82% of out-of-school children live inrural areas (see Figure 2.7).
In all regions,except CEE/CIS,the share ofchildren out ofschool is 1.5 to
almost 2 times higher amongchildren living in rural householdsthan their urban counterparts.In 24 countries, the ratio issubstantially greater than 2, e.g.Ethiopia (3.2), Eritrea (3.0),Burkina Faso and Nicaragua (2.9),Iraq (2.7), and (at 2.5) Guinea,Guinea-Bissau, Lao PDR andMalawi (see Statistical Table A3).
In three regions, Eastern andSouthern Africa (87%), South Asia
Note: A more complete description of the patterns of school attendance in India, Indonesia, Mali and Nigeria is included in
Statistical Tables A10 to A13.
Source: MICS, 2000.
Table 2.1. School attendance by sex and age in India, 2000
Age groupPre-primary
non-standardLeft
schoolNever inschool
Inschool
Out ofschoolPrimary Secondary TertiarySex
School-age children (%)
Primary school age Male 5.6 76.3 4.0 n 1.7 18.1 80.3 19.7
Female 5.3 69.6 3.6 n 1.7 25.1 73.2 26.8
Secondary school age Male 0.6 25.8 54.5 n 9.9 9.8 80.3 19.7
Female 1.0 18.8 46.4 n 12.3 22.5 65.2 34.8
82% of out-of-school childrenlive in rural areas.
More than 8 in 10 out-of-school children livein rural households inEastern and SouthernAfrica, South Asia,and West and CentralAfrica.
Note: Based on household surveys conducted in 80 countries.
Source: UNICEF/UNESCO Institute for Statistics, Statistical Table A3.
Figure 2.7. Primary school-age children out of school byplace of residence and region, 1996-2003

40
Children Out of School: Measur ing Exclusion from Pr imary Education
Figure 2.8. Distribution of primary school-age children out of school by place of residence and region, 1996-2003
Note: Based on household surveys conducted in 80 countries.
Source: UNICEF/UNESCO Institute for Statistics, Statistical Table A4.

Chapter 2. Assessing the characteristics of out-of-school children
41
The primary school cycle in Indonesia covers childrenaged 7 to 12 years, while secondary school coverschildren aged 13 to 18 years. In urban and ruralareas, the education system reaches bothpopulations, with only a small percentage ofchildren of primary and secondary school ages whohave never been in school (see Figure 2.9). It is alsonotable that, although almost all children inIndonesia attend school at some time, theproportion that leaves school increases greatly
during the secondary school ages. It appears thatrural children are more likely to drop out, with 48%of secondary school-age children leaving school,compared to 30% in urban areas (see Table 2.2).
A significant proportion of children attending schoolare in a lower grade than prescribed for their age(see overage bars in Figure 2.10) and, again, thisphenomenon is more common among children ofprimary school age living in rural areas.
Box 2.2. Case study - Place of residence, age and exclusion in Indonesia
Figure 2.9. School attendance by place of residence in Indonesia, 2002/03
Figure 2.10. Overage and underage children and youth by place of residence in Indonesia, 2002/03
Note: Official primary school ages: 7 to 12 years; official secondary school ages: 13 to 18 years.Source: DHS, 2002/03

42
Household wealth
A measure of household wealth, used here as aproxy for poverty, is constructed with data onhousehold assets that were collected in the MICSand DHS surveys. Filmer and Pritchett (2001) haveshown that an asset-based indicator of householdwealth can represent an alternative to those basedon household income and expenditures. The wealthindex classifies households and individuals inquintiles, making it possible to compare groupsliving in poverty in more than one way. For thepurpose of this analysis, comparisons are madebetween the poorest and richest 20% ofhouseholds in which children live and between thepoorest 60% and the richest 40%.
Household survey data show that children ofprimary school age who live in the poorest 20% ofhouseholds are three times more likely to be out ofschool than children living in the richest 20% (seeFigure 2.11). Behind thesefigures are a range of regionaland country values. Thegreatest disparities are foundin both the Middle East andNorth Africa region and LatinAmerica and the Caribbeanregion, where children in thepoorest quintile are 4.5 timesmore likely to be out of schoolthan those in the wealthiest quintile. Countries inthe CEE/CIS region, on the other hand, show muchlower levels of disparity (1.6 times).
Children Out of School: Measur ing Exclusion from Pr imary Education
Note: A more complete description of the patterns of school attendance in India, Indonesia, Mali and Nigeria is included
in Statistical Tables A10 to A13.
Source: DHS, 2002/03.
Table 2.2. School attendance by age and place of residence in Indonesia, 2002/03
Age groupPre-primary
non-standardLeft
schoolNever inschool
Inschool
Out ofschoolPrimary Secondary Tertiary
Place ofresidence
School-age children (%)
Primary school age Urban 0.0 86.7 9.4 0.0 2.2 1.7 96.0 4.0
Rural 0.2 87.9 5.2 0.0 3.2 3.6 93.2 6.8
Secondary school age Urban 0.0 4.1 64.0 1.9 29.6 0.5 70.0 30.0
Rural 0.0 7.9 43.9 0.2 46.6 1.5 51.9 48.1
Both dropout and repetition ratesappear to be important and biased
towards less-favoured populations. Amore detailed analysis of these two
issues is needed tobetter understand theirdeterminants, as well asappropriate policiesand interventions.Indeed, dropout ratesare higher in ruralareas, among thepoorest 20% of thepopulation and amonghouseholds wheremothers have noeducation.
Primary school-agechildren who live inthe poorest 20% ofhouseholds are threetimes more likelyto be out of schoolthan children in therichest 20%.
Figure 2.11. Primary school-age children out of school by household wealth and region, 1996-2003
Note: Based on household surveys conducted in 80 countries.
Source: UNICEF/UNESCO Institute for Statistics, Statistical Table A3.

Chapter 2. Assessing the characteristics of out-of-school children
43
However, in every region there are countries wherethe gap between rich and poor is great. Poorerprimary school-age children are far more likely tobe out of school than the richer children inNicaragua, Peru, Suriname and Venezuela (6 timesor more) in Latin America and the Caribbean;Indonesia (5.6) in East Asia and the Pacific;Cameroon (5) in West and Central Africa;Kazakhstan and the Republic of Moldova (5 ormore) in CEE/CIS; Eritrea, Madagascar and Zambia(4.9 and more) in Eastern and Southern Africa;Algeria, Bahrain and Sudan (4.9 or more) in the
Middle East and North Africa;and India (3.4) in South Asia(see Statistical Table A3).
Each wealth quintile makes anunequal contribution to theoverall number of out-of-
school children. The poorest 60% of householdsare home to 77% of out-of-school children in thecountries surveyed. At the regional level, in Latin
America and the Caribbean the poorest 60% ofhouseholds account for 84% of out-of-schoolchildren, followed by the Middle East and NorthAfrica and the East Asia and Pacific regions (bothat 80%) (see Figure 2.12).
At the country level, in Cameroon, Eritrea,Indonesia, Iraq, Nicaragua, Sudan (north), Surinameand Venezuela, the proportion of out-of-schoolchildren is highest in the poorest 60% ofhouseholds. For example, 90% of the total numberof out-of-school children in Eritrea, Nicaragua andVenezuela come from the poorest 60% ofhouseholds, although the overall total of out-of-school children varies widely across the threecountries – 7% in Venezuela, 20% in Nicaragua,and 37% in Eritrea. Beyond this group of countrieswith large differences, all other countries surveyed– with the exception of Trinidad and Tobago – showthat the poorest 60% of households account forsignificantly more than 60% of out-of-schoolchildren (see Statistical Table A4).
Note: Based on household surveys conducted in 80 countries.
Source: UNICEF/UNESCO Institute for Statistics, Statistical Table A4.
84% of out-of-schoolchildren in LatinAmerica and theCaribbean comefrom the poorest60% of households.
Figure 2.12. Distribution of children out of school by household wealth and region, 1996-2003

44
Children Out of School: Measur ing Exclusion from Pr imary Education
In Mali, 60% of primary school-age children are notonly out of school but have never been in school.Only 29% of secondary school-age childrenparticipate in school (16% in primary and 13% insecondary education). Children from the poorest20% of households rarely participate in theeducation system. Only 26% of primary school-agechildren attend primary school (see Figure 2.13),
and 13% of secondary school-age children alsoattend primary school (see Statistical Table A8). Yet,a significant proportion of the children in the richest20% of households are also out of school, eitherbecause they have never been in school or becausethey have dropped out. The richest quintile includesa high proportion of children attending a lowergrade for their age (see overage in Figure 2.14).
Box 2.3. Case study - Poverty, age and exclusion in Mali
Figure 2.14. Overage and underage children by household wealth in Mali, 2001
Note: Official primary school ages: 7 to 12 years; official secondary school ages: 13 to 18 years.
Source: DHS, 2001
Figure 2.13. School attendance by household wealth in Mali, 2001

Chapter 2. Assessing the characteristics of out-of-school children
45
Mother’s education
The educational level of a child’s parent is oftenrelated to the child’s own participation in schooling.The surveys ask whether mothers ever attendedschool and, if yes, the highest grade and levelattained. As presented earlier, the data indicatethat, overall, 26% of children of primary schoolage are identified as out of school; the same surveys
identify 36% ofmothers as having“no education”. Themothers of childrenof primary school agewho have nevercompleted at least
one year of education are classified as “motherswith no education”. Primary school-age childrenwhose mothers have no education are more thantwo times as likely to be out of school as childrenof mothers with some education (see StatisticalTable A3).
In West and Central Africa, more than half (54%)of the children of mothers with no education areout of school. In relative terms, greater disparitiesare found in South Asia and Latin America and theCaribbean, where children of mothers with noeducation are at least 2.5 times more likely to beout of school than those whose mothers havesome education (seeFigure 2.15). In eightcountries, the gapwidens to threefoldand greater: Venezuela(4.8), Suriname (4.4), Cameroon (3.9), Côte d’Ivoire(3.7), Guyana (3.4), Eritrea (3.4), India (3.3), andGuinea-Bissau (3.0). In Viet Nam, the Philippines,Iraq and Mongolia, the ratio is 2.8 (for othercountries, see Statistical Table A3).
Note: More complete descriptions of the patterns of school attendance in India, Indonesia, Mali and Nigeria are included in Statistical
Tables A10 to A13.
Source: DHS, 2001
Table 2.3. School attendance by age and household wealth in Mali, 2001
Age groupPre-primary
non-standardLeft
schoolNever inschool
Inschool
Out ofschoolPrimary Secondary Tertiary
Householdwealthquintile
School-age children (%)
Primary school age Richest 0.0 70.6 3.5 0.0 1.3 24.6 74.1 25.9
Poorest 0.0 26.0 0.0 0.0 2.0 72.0 26.0 74.0
Secondary school age Richest 0.0 18.4 34.6 0.4 9.3 37.3 53.4 46.6
Poorest 0.0 12.4 1.5 0.0 6.9 79.1 14.0 86.0
The proportion ofchildren who leaveschool increases afterage 9 among childrenin the poorest 20% ofthe population. Thisincrease contributessubstantially to theoverall number ofchildren out of school.There is a substantialdifference in terms ofparticipation rates in secondaryeducation (38%) from the richesthouseholds and only 2% from thepoorest (see Table 2.3).
In contrast with the other threecase studies, Mali faces a morefundamental challenge sinceonly a small proportion of thepopulation currently attends
school. This is due to lack ofaccess to school or to otherfactors restricting the ability ofthe population to enrol andattend primary and secondaryschool. Dropout and overagerates reflect late entry intoschool, as well as high repetitionrates. Policies and interventionsrequire a comprehensive
approach that responds not onlyto the needs of the population(including marginalised groups)but also to the limitationsimposed by current availableresources. It may also require agreater involvement of theaffected communities toenhance participation andaccountability.
Primary school-age childrenwith a mother with noeducation are two times morelikely to be out of school thanchildren with a mother withsome education.
54% of children whosemothers have no educationare out of school in Westand Central Africa.

46
The relative importance of maternal educationalattainment depends upon the proportion ofmothers with no education as well as the number
of their children who areout of school. Of all primaryschool-age children, 52%have mothers without anyeducation. However, 75% ofout-of-school children havemothers with no education(see Statistical Table A4 and
Figure 2.16). The CEE/CIS region is, once again, anexception: almost all mothers have some education(98%), and thus, virtually all out-of-school children(99%) have mothers with education. At the otherextreme, in West and Central Africa 44% of primaryschool-age children are out of school, and 81% ofthese children live with mothers with no education.A similar situation is observed in the Middle Eastand North Africa and South Asia. In Latin Americaand the Caribbean, almost 8 out of 10 mothers ofprimary school-age children have some educationbut are the parents of almost one-half of the out-of-school children in the region.
Children Out of School: Measur ing Exclusion from Pr imary Education
Note: Based on household surveys conducted in 80 countries.
Source: UNICEF/UNESCO Institute for Statistics, Statistical Table A3.
Note: Based on household surveys conducted in 80 countries.
Source: UNICEF/UNESCO Institute for Statistics, Statistical Table A4.
Figure 2.15. Primary school-age children out of school by mother’s education and region, 1996-2003
Figure 2.16. Distribution of out-of-school children by mother’s education and region, 1996-2003
44% of primary school-age children in Westand Central Africa areout of school, of which81% have a motherwith no education.
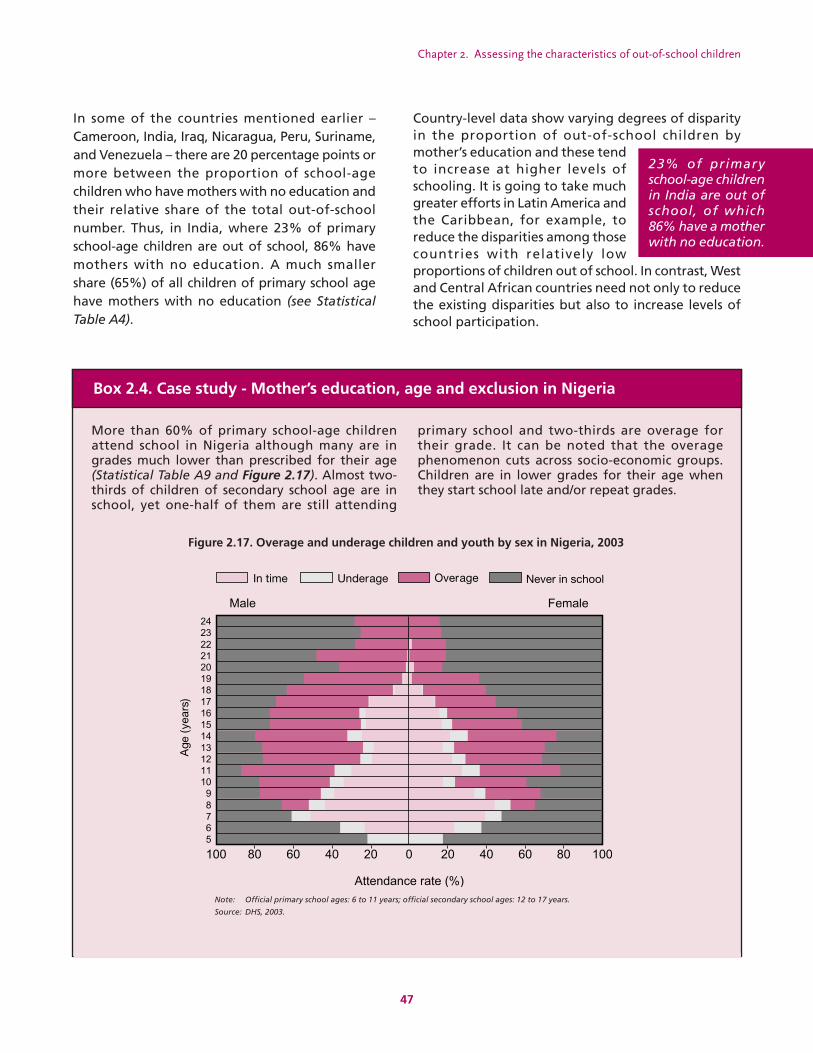
Chapter 2. Assessing the characteristics of out-of-school children
47
In some of the countries mentioned earlier –Cameroon, India, Iraq, Nicaragua, Peru, Suriname,and Venezuela – there are 20 percentage points ormore between the proportion of school-agechildren who have mothers with no education andtheir relative share of the total out-of-schoolnumber. Thus, in India, where 23% of primaryschool-age children are out of school, 86% havemothers with no education. A much smallershare (65%) of all children of primary school agehave mothers with no education (see StatisticalTable A4).
Country-level data show varying degrees of disparityin the proportion of out-of-school children bymother’s education and these tendto increase at higher levels ofschooling. It is going to take muchgreater efforts in Latin America andthe Caribbean, for example, toreduce the disparities among thosecountries with relatively lowproportions of children out of school. In contrast, Westand Central African countries need not only to reducethe existing disparities but also to increase levels ofschool participation.
23% of primaryschool-age childrenin India are out ofschool, of which86% have a motherwith no education.
Box 2.4. Case study - Mother’s education, age and exclusion in Nigeria
Figure 2.17. Overage and underage children and youth by sex in Nigeria, 2003
More than 60% of primary school-age childrenattend school in Nigeria although many are ingrades much lower than prescribed for their age(Statistical Table A9 and Figure 2.17). Almost two-thirds of children of secondary school age are inschool, yet one-half of them are still attending
primary school and two-thirds are overage fortheir grade. It can be noted that the overagephenomenon cuts across socio-economic groups.Children are in lower grades for their age whenthey start school late and/or repeat grades.
Note: Official primary school ages: 6 to 11 years; official secondary school ages: 12 to 17 years.
Source: DHS, 2003.

48
Children Out of School: Measur ing Exclusion from Pr imary Education
As shown, children whose mothers have attainedsome education tend to participate more in school,both at primary and secondary levels – and Nigeriais no exception (see Statistical Table A13). Amongprimary school-age children, more than 80% whohave a mother with some education are in school,compared to only 46% among children whosemother has no education. For children of secondaryschool age, the corresponding values are 94% and61%. However, around one-half of the children inboth groups still attend primary school, leaving only46% of children of mothers with some formaleducation and 10% of children of mothers with no
education attending secondary education (Figures2.18 and 2.19).
Almost all of the children in Nigeria who are olderthan primary school age but not in primary schoolhave never been in school. Less than 1% of the out-of-school population has dropped out. This isremarkable given the high proportion of childrenwho are in lower grades for their age, becausebeing overage can lead to early school leaving. Atthe same time, some of the children who havenever been in school may still start school. Only 8%of the children of secondary school age drop out,while 23% have never attended school.
Figure 2.18. School attendance by mother’s education in Nigeria, 2003
Figure 2.19. Overage and underage children by mother’s education in Nigeria, 2003
Note: Official primary school ages: 6 to 11 years; official secondary school ages: 12 to 17 years.
Source: DHS, 2003.

Multivariate analysis
A multivariate regression analysiswas used to identify the net effectson the likelihood of schoolattendance for each of the fivevariables. In the model, thedependent variable is current schoolattendance, and the independentvariables are age, sex, mother’seducation, household wealth andplace of residence. The model wastested with a logistic regression andthe results are summarised inTable 2.5. Complete results for all countries areprovided in Statistical Table A5, notably:
• Household wealth, mother’s education andchild’s age are significant and positive in 64 of the 68 countries, confirming the descriptiveresults presented in this chapter.
• Age did not significantly affect a child’sprobability of being out of school in Burkina Faso, Indonesia, Iraq and Kazakhstan.
• Similarly, low household wealth was not asignificant factor in school attendance in threeCIS countries (Azerbaijan, Kazakhstan andTajikistan). This result can also be explained by the fact that these three countries have out-of-school rates far below the average for the 80countries included in this analysis (9%, 2% and19% respectively).
• Finally, mother’s education was not significantly associated with the probability of being out of school in Armenia, Azerbaijan, Kazakhstan,Tajikistan and Uzbekistan – largely because almost all mothers in these CIS countries haveat least some education.
Interestingly, sex was not significantly associatedwith the probability of being out of school in 29 ofthe 68 countries (43%) for which data were analysed.
These results confirm the descriptive analysis,particularly when differences between boys and girlsare above or below 10 percentage points. In ninecountries, boys are at a comparative disadvantage,confirming the descriptive results (Botswana, Haiti,Kenya, Lesotho, Malawi, Nicaragua, Philippines, SouthAfrica and Suriname).
Finally, place of residence also produces mixed results.In 37 of the 68 countries studied, the urban/ruralvariable showed no direct association with theprobability of being out of school. In seven countries,the highest probability of an effect is observed amongchildren residing in urban areas (Bangladesh,Colombia, Dominican Republic,Egypt, Lesotho, Uganda andZambia). All of these countries(except the Dominican Republic)presented greater disadvantagefor children of rural areas in thedescriptive analysis above. Oneway of interpreting this shift isthat the association observed inthe descriptive analysis also captured the net effectsof poverty and mother’s education as part of place ofresidence. Once those two factors are kept constant,the effect of place of residence indicates a greaterdisadvantage for children living in urban areas in thesecountries.
Chapter 2. Assessing the characteristics of out-of-school children
49
Note: A more complete description of the patterns of school attendance in India, Indonesia, Mali and Nigeria
is included in Statistical Tables A10 to A13.
Source: DHS, 2003
Table 2.4. School attendance by age and mother’s education level in Nigeria, 2003
Age groupPre-primary
non-standardLeft
schoolNever inschool
Inschool
Out ofschoolPrimary Secondary Tertiary
Mother’seducation
level
School-age children (%)
Primary school age Mother ed. 7.1 78.6 2.8 0.0 0.8 17.8 81.4 18.6
Mother no ed. 2.4 45.1 0.7 0.1 0.7 53.4 45.9 54.1
Secondary school age Mother ed. 0.2 48.5 45.7 0.0 2.2 3.6 94.2 5.8
Mother no ed. 0.0 50.4 10.5 0.0 4.0 35.1 60.9 39.1
Note: * Significant at 5% level minimum.Source: UNICEF/UNESCO Institute for Statistics, Statistical Table A5.
Table 2.5. Net effects on the likelihood of school attendance
Backround variables Number ofcountries >1 and
significant*<1 and
significant*Not
significant
Odds ratio
Age 68 64 - 4
Male 68 30 9 29
Urban 68 24 7 37
Richest wealth quintile 68 64 1 3
Mother has formal education 68 63 - 5
In 37 of 68 countries,the urban/rural vari-able showed nodirect associationwith the probabilityof a child being outof school.
The findings make itclear that addressingthe overage problemrequires that a greatershare of children startschool at the officialentry age and thatefforts be made toreduce existing repeti-tion rates, which relieson increasing schoolreadiness for primaryeducation (see Table2.4).

50
2.3 Profiles of children in and out ofschool
The purpose of this section is to provide a moredetailed description of the characteristics ofchildren out of school using survey data for India,Indonesia, Mali and Nigeria. By identifying thecharacteristics of children out of school in as muchdetail as possible, this report hopes to point the wayto valuable information for policy-makers workingto achieve the goal of universal primary education.
The four case studies are:
• India: This country has the largest primaryschool-age population in the world and also the largest number of children out of school.
• Indonesia: The world’s fourth-most populouscountry reports that nearly all children attend school at some point.
• Mali: A country with a low attendance rate thatreflects the situation in many African countries.
• Nigeria: Africa’s most populous country and ninth-largest in the world, it has many out-of-school children and overage children in school.
The three groups of children are identified as:
• Children of primary school age: The baseline reference group.
• Children in school: A comparison between this group and the out-of-school group canhighlight key differences.
• Children out of school: Their characteristics areof great interest for policy-makers.
The analytical template
For each country, school attendance patterns areexplained by dividing the three groups of childreninto smaller groups according to their characteristicsand those of their households. The level ofdisaggregation depends on which data werecollected in each country: for example, data onchild labour were collected in India and Mali, butnot in Indonesia and Nigeria. Thus, labour-marketparticipation can be examined as a factor in schoolattendance in two of the case countries but not inthe other two.
The descriptive analysis is combined with aregression analysis. In the regression models, schoolattendance is explained with a set of variables thatdescribe the child and the household, againdepending on the availability of data within eachcountry. The results show which factors increase ordecrease the likelihood of school attendance. Theyalso serve as a test of statistical significance fordisparities that are observed at the descriptive level.
Children Out of School: Measur ing Exclusion from Pr imary Education
The regression analysis determines whether individual and householdcharacteristics have a statistically significant effect on schoolattendance, whether this effect is positive or negative, and itsmagnitude. In the model, school attendance (yes or no) is the dependentvariable that is tested on a set of independent variables that varies fromcountry to country. School attendance is explained with these variables,depending on which data were collected in the survey for each country:
• age of the child• sex of the child• place of residence (urban or rural)• household wealth• education of mother, father and household head• sex of the household head• orphan status of the child (one or both parents dead)• religion of the household head (only India)• membership of the household head in a scheduled caste or tribe
(only India)• native language of the survey respondent (only Nigeria)• household composition (number of household members aged less
than 5 years, 5 to 59 years, 60 years or older)• labour status of the child (only India and Mali)• sub-national region or state
Except for age and number of household members, all variables aredichotomous and take the value 0 or 1. The sample for each countryconsists of all primary school-age children in the survey data. Thesample size ranges from 5,917 children in Nigeria to 70,466 in India.
The results of a probit regression for the four countries are providedin Statistical Tables A14 and A15. For each variable, the marginal effectis shown, i.e. the increase or decrease of the likelihood of schoolattendance, measured in percentage points, that follows a change from0 to 1 in the independent variable. In the case of continuous variables(age, number of household members), the marginal effect is measuredat the mean of the independent variable. Statistical significance isindicated at the 5% and 1% levels. As an example, the marginal effect0.059 for the variable “male” in India means that boys are, on average,5.9 percentage points more likely than girls to be in school.
Box 2.5. Regression analysis of school attendance
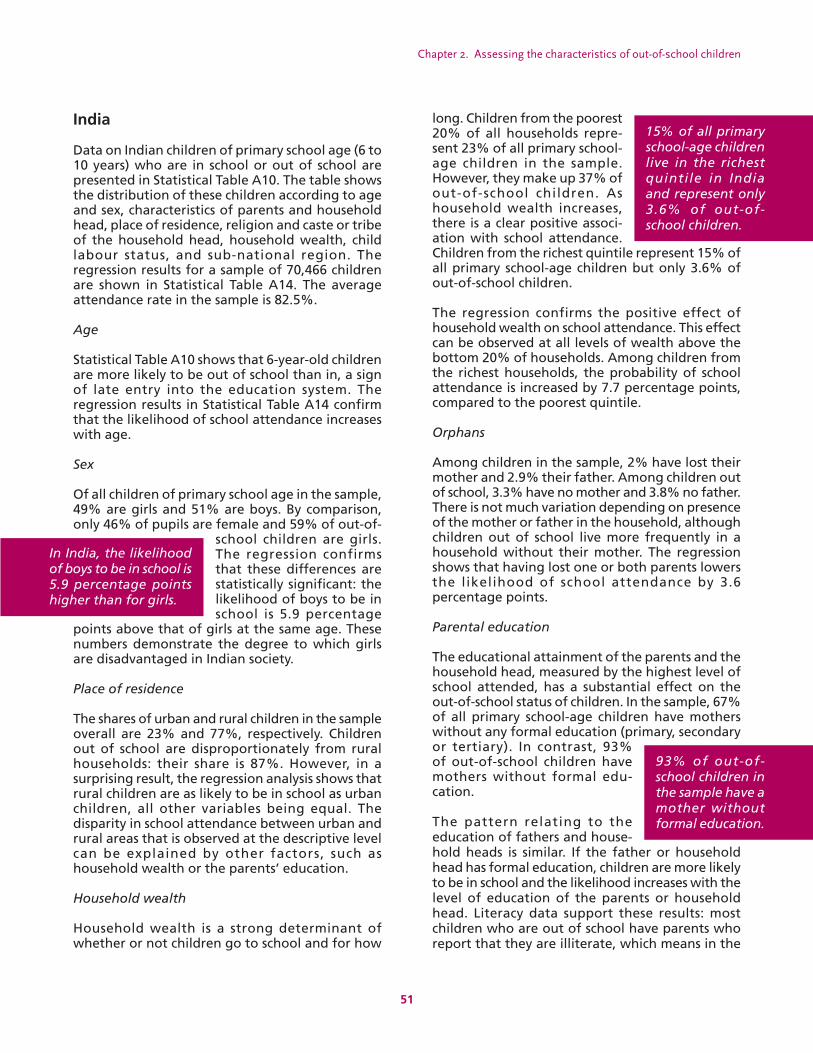
Chapter 2. Assessing the characteristics of out-of-school children
51
India
Data on Indian children of primary school age (6 to10 years) who are in school or out of school arepresented in Statistical Table A10. The table showsthe distribution of these children according to ageand sex, characteristics of parents and householdhead, place of residence, religion and caste or tribeof the household head, household wealth, childlabour status, and sub-national region. Theregression results for a sample of 70,466 childrenare shown in Statistical Table A14. The averageattendance rate in the sample is 82.5%.
Age
Statistical Table A10 shows that 6-year-old childrenare more likely to be out of school than in, a signof late entry into the education system. Theregression results in Statistical Table A14 confirmthat the likelihood of school attendance increaseswith age.
Sex
Of all children of primary school age in the sample,49% are girls and 51% are boys. By comparison,only 46% of pupils are female and 59% of out-of-
school children are girls.The regression confirmsthat these differences arestatistically significant: thelikelihood of boys to be inschool is 5.9 percentage
points above that of girls at the same age. Thesenumbers demonstrate the degree to which girlsare disadvantaged in Indian society.
Place of residence
The shares of urban and rural children in the sampleoverall are 23% and 77%, respectively. Childrenout of school are disproportionately from ruralhouseholds: their share is 87%. However, in asurprising result, the regression analysis shows thatrural children are as likely to be in school as urbanchildren, all other variables being equal. Thedisparity in school attendance between urban andrural areas that is observed at the descriptive levelcan be explained by other factors, such ashousehold wealth or the parents’ education.
Household wealth
Household wealth is a strong determinant ofwhether or not children go to school and for how
long. Children from the poorest20% of all households repre-sent 23% of all primary school-age children in the sample.However, they make up 37% ofout-of-school children. Ashousehold wealth increases,there is a clear positive associ-ation with school attendance.Children from the richest quintile represent 15% ofall primary school-age children but only 3.6% ofout-of-school children.
The regression confirms the positive effect ofhousehold wealth on school attendance. This effectcan be observed at all levels of wealth above thebottom 20% of households. Among children fromthe richest households, the probability of schoolattendance is increased by 7.7 percentage points,compared to the poorest quintile.
Orphans
Among children in the sample, 2% have lost theirmother and 2.9% their father. Among children outof school, 3.3% have no mother and 3.8% no father.There is not much variation depending on presenceof the mother or father in the household, althoughchildren out of school live more frequently in ahousehold without their mother. The regressionshows that having lost one or both parents lowersthe likelihood of school attendance by 3.6percentage points.
Parental education
The educational attainment of the parents and thehousehold head, measured by the highest level ofschool attended, has a substantial effect on theout-of-school status of children. In the sample, 67%of all primary school-age children have motherswithout any formal education (primary, secondaryor tertiary). In contrast, 93%of out-of-school children havemothers without formal edu-cation.
The pattern relating to theeducation of fathers and house-hold heads is similar. If the father or householdhead has formal education, children are more likelyto be in school and the likelihood increases with thelevel of education of the parents or householdhead. Literacy data support these results: mostchildren who are out of school have parents whoreport that they are illiterate, which means in the
In India, the likelihoodof boys to be in school is5.9 percentage pointshigher than for girls.
15% of all primaryschool-age childrenlive in the richestquintile in Indiaand represent only3.6% of out-of-school children.
93% of out-of-school children inthe sample have amother withoutformal education.

52
case of India that they are unable to read and writea simple sentence. This demonstrates the inter-generational effect of education: parents who have
attended school are morelikely to send their ownchildren to school.
The regression for Indiaconfirms these findings.
Formal education of the parents and the householdhead increases the likelihood of the child’s schoolattendance. An educated mother has a greaterpositive effect on school attendance than aneducated father or household head. The marginaleffect of 7.3 points for mothers with a primaryeducation indicates that the investment in girls’education carries positive effects into the futurebecause formally educated mothers are more likelyto send their own children to school.
Other characteristics of parents or household head
The sex of the household head also affects schoolattendance. If the household head is male, thechildren are somewhat more at risk of not being inschool. This finding is supported by the regressionanalysis.
The religion of the household head appearsto have a small effect on school attendance
when considered on its own(Statistical Table A10);however, this conclusionis not supported by themultivariate regressionresults. Whether thehousehold head is Hindu,
Muslim or adheres to another religion, it has nostatistically significant effect on a child’s schoolattendance.
Membership in a scheduled caste or tribe isnegatively correlated with school attendance.3 Inthe survey sample, 20% of all primary school-agechildren were in households whose head belongs toa scheduled caste. However, these children make up26% of children out of school. Children fromscheduled tribes are even less likely to be in school.
This group constitutes 8.5% of all primary school-agechildren but 14% of children out of school. Theregression analysis confirms a decreased likelihoodof school attendance for members of a scheduledtribe. In contrast, no statistically significantdifference in school attendance could be observedfor children from scheduled castes, relative to theremaining population, which means that their lowerparticipation in the education system may beexplained by other factors, such as poverty.
Household composition
Children from households with elderly members (60years or older) are more likely to attend schoolalthough the effect is small. The explanation couldbe that elderly household members perform tasks inthe household, which in turn gives children moretime for school-related activities. It is also possiblethat these households have stronger family ties andan environment which encourages children toattend school. In contrast, having more youngmembers (below 5 years of age) in the householdlowers the school attendance rate of childrenbetween 6 and 10 years, according to the regressionresults.
Child labour
The MICS survey in India collected data on economicactivity and domestic work performed by children.Those involved in child labour aremuch less likely to be in school thanchildren who do not work.4 Of allprimary school-age childrensurveyed, 10% were engaged inlabour, which means that they are economicallyactive or do household work for 28 or more hoursper week. Among out-of-school children, 21% work.
The magnitude of the marginal effect of child labouron school attendance is substantial (16.9%). Thus,there is a trade-off between child labour and schoolattendance, two activities that compete for a child’stime. The competition for children’s resourcesbetween immediate economic gains and longer-term individual and social development is notable inIndia and in many other countries.
Children Out of School: Measur ing Exclusion from Pr imary Education
An educated motherhas a greater effect onschool attendance thanan educated father.
The religion of thehousehold head hasno significant effecton a child’s schoolattendance in India.
21% of out-of-school childrenwork in India.
3 The terms “scheduled caste” and “scheduled tribe” date back to British rule of India, when the various groups of the Indian population were entered into lists or “schedules.” Scheduledcastes include the historically disadvantaged castes of lower rank, among them the “untouchables.” Scheduled tribes are communities that live in geographic isolation from the main population,in forests and mountains. Both scheduled castes and scheduled tribes are entitled to positive discrimination according to the Indian constitution, for example in the form of quotas for university students and government positions.
4 Child labour is work that harms children and should, therefore, be eliminated. Not all work performed by children is child labour. The definition used here comes from a joint research project,Understanding Children’s Work, by ILO, UNICEF and the World Bank. The defining parameters are the child’s age, type of work and number of hours spent working. Thus, the term “child labour” applies to: (a) all children aged 5 to 11 years who are economically active or do household work for 28 or more hours per week; (b) all children aged 12 to 14 years who are economically active for 14 or more hours per week (i.e. they do more than light work) or who do household work for 28 or more hours per week; and (c) all children aged 15 to 17 years who work for 43or more hours per week (i.e. they are engaged in hazardous work). In the case of India, only definition (a) applies because the analysis is restricted to children aged 6 to 11 years.
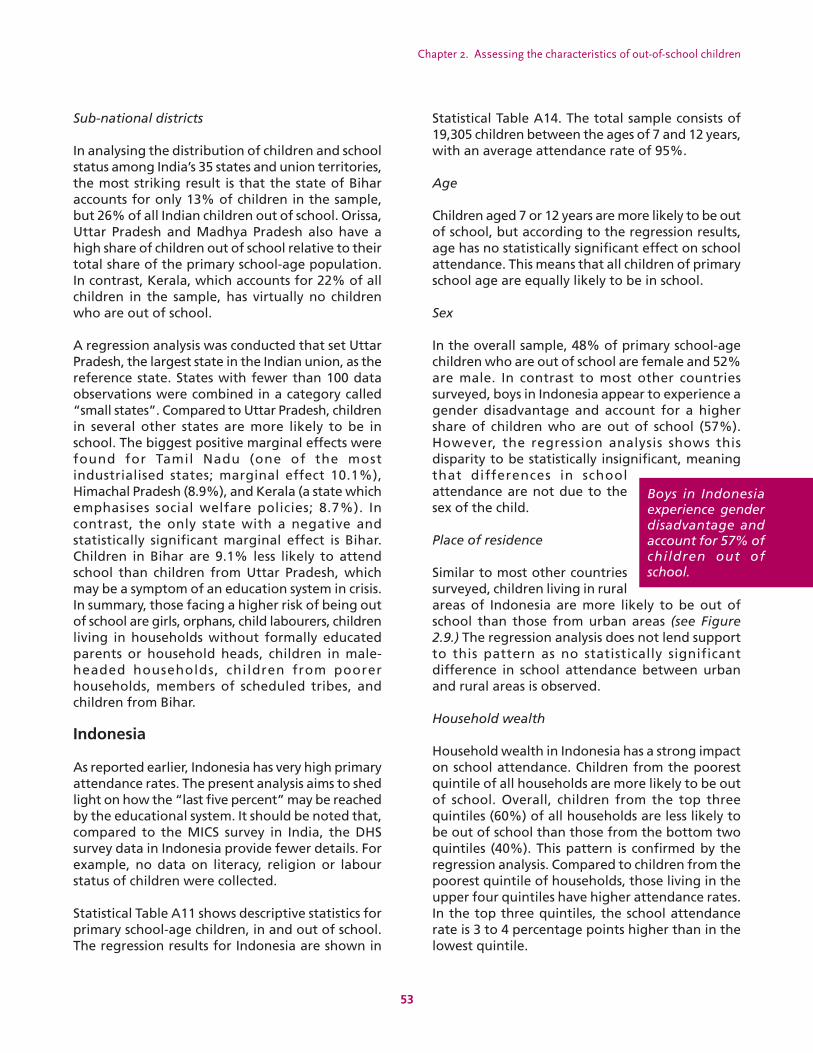
Chapter 2. Assessing the characteristics of out-of-school children
53
Sub-national districts
In analysing the distribution of children and schoolstatus among India’s 35 states and union territories,the most striking result is that the state of Biharaccounts for only 13% of children in the sample,but 26% of all Indian children out of school. Orissa,Uttar Pradesh and Madhya Pradesh also have ahigh share of children out of school relative to theirtotal share of the primary school-age population.In contrast, Kerala, which accounts for 22% of allchildren in the sample, has virtually no childrenwho are out of school.
A regression analysis was conducted that set UttarPradesh, the largest state in the Indian union, as thereference state. States with fewer than 100 dataobservations were combined in a category called“small states”. Compared to Uttar Pradesh, childrenin several other states are more likely to be inschool. The biggest positive marginal effects werefound for Tamil Nadu (one of the mostindustrialised states; marginal effect 10.1%),Himachal Pradesh (8.9%), and Kerala (a state whichemphasises social welfare policies; 8.7%). Incontrast, the only state with a negative andstatistically significant marginal effect is Bihar.Children in Bihar are 9.1% less likely to attendschool than children from Uttar Pradesh, whichmay be a symptom of an education system in crisis.In summary, those facing a higher risk of being outof school are girls, orphans, child labourers, childrenliving in households without formally educatedparents or household heads, children in male-headed households, children from poorerhouseholds, members of scheduled tribes, andchildren from Bihar.
Indonesia
As reported earlier, Indonesia has very high primaryattendance rates. The present analysis aims to shedlight on how the “last five percent” may be reachedby the educational system. It should be noted that,compared to the MICS survey in India, the DHSsurvey data in Indonesia provide fewer details. Forexample, no data on literacy, religion or labourstatus of children were collected.
Statistical Table A11 shows descriptive statistics forprimary school-age children, in and out of school.The regression results for Indonesia are shown in
Statistical Table A14. The total sample consists of19,305 children between the ages of 7 and 12 years,with an average attendance rate of 95%.
Age
Children aged 7 or 12 years are more likely to be outof school, but according to the regression results,age has no statistically significant effect on schoolattendance. This means that all children of primaryschool age are equally likely to be in school.
Sex
In the overall sample, 48% of primary school-agechildren who are out of school are female and 52%are male. In contrast to most other countriessurveyed, boys in Indonesia appear to experience agender disadvantage and account for a highershare of children who are out of school (57%).However, the regression analysis shows thisdisparity to be statistically insignificant, meaningthat differences in schoolattendance are not due to thesex of the child.
Place of residence
Similar to most other countriessurveyed, children living in ruralareas of Indonesia are more likely to be out ofschool than those from urban areas (see Figure2.9.) The regression analysis does not lend supportto this pattern as no statistically significantdifference in school attendance between urbanand rural areas is observed.
Household wealth
Household wealth in Indonesia has a strong impacton school attendance. Children from the poorestquintile of all households are more likely to be outof school. Overall, children from the top threequintiles (60%) of all households are less likely tobe out of school than those from the bottom twoquintiles (40%). This pattern is confirmed by theregression analysis. Compared to children from thepoorest quintile of households, those living in theupper four quintiles have higher attendance rates.In the top three quintiles, the school attendancerate is 3 to 4 percentage points higher than in thelowest quintile.
Boys in Indonesiaexperience genderdisadvantage andaccount for 57% ofchildren out ofschool.

54
Orphans
Orphans, i.e. children without a mother or father orwhose parents live in another household, are morelikely to be out of school than other children. Theregression confirms that orphans have an increasedlikelihood of being out of school compared tochildren with at least one living parent.
Parental education
The education of the parents and the householdhead is another determinant of school attendance.
In the sample, 9.6% of primaryschool-age children havea mother without formaleducation. However, 24% ofchildren out of school havea mother with no formaleducation. The education of
the father or the household head has a similar effecton a child’s school attendance.
The regression analysis confirms the findings fromthe descriptive analysis. If a mother has attendedprimary or secondary school, her children are morelikely to be in school than those of a mother withoutformal education. Compared to India, the effect ofthe mother’s education is small, with a marginaleffect of 1.5 percentage points for primaryeducation and 2.8 percentage points for secondaryeducation. The education of the father appears tohave no effect on the likelihood of a child attendingschool.
If the household head has at least primaryeducation, children are more likely to be in school.If the household head has secondary or tertiaryeducation, the same effect is observed.
Other characteristics of parents or household head
In contrast to India, the gender of the householdhead has no effect on school attendance inIndonesia.
Household composition
Household composition has the same effect onschool attendance as in India. A household with ahigher number of children under age 5 reduces thelikelihood that older siblings attend school, perhapsbecause they are charged with childcare or otherdomestic tasks. On the other hand, in a householdwith a higher number of household members overthe age of 60, the likelihood that children attend
school is increased, indicating that elders in anintergenerational household may take up domestictasks that might otherwisebe carried out by school-agechildren.
Sub-national districts
A sub-national analysisshows that residents of Baliand Nusa Tenggara, Kalimantan, and Sulawesi areat a disadvantage compared to residents ofSumatra and Java. The former are more likely to beout of school and to have never attended school,but the effect is smaller than those of householdwealth and parental education. The regressionresults confirm that, compared to other regions ofIndonesia, children living on Sulawesi havesignificantly lower attendance rates.
In summary, there is an increased probabilityof being out of school for children with a motheror household head without a formal education,children in households with a relatively largenumber of young children, children from thepoorest part of the population, orphans, andchildren from Sulawesi.
Mali
Data on out-of-school children from a DHS surveyin Mali are presented in Statistical Table A12. Theregression results are listed in Statistical Table A15.The Mali survey sample covered 12,184 children ofofficial primary school age (7 to 12 years) with anaverage attendance rate of 39%. The analysis coversthe same variables as in Indonesia, with theaddition of child labour.
Age
As in India, older children are more likely to be inschool in Mali, which is a sign of late entry into theeducation system.
Sex
In the overall sample, 51% of school-age childrenare female and 49% are male. Girls are more likelyto be disadvantaged: theyaccount for 56% of out-of-school children. The regressionresults confirm that boys havea much higher attendance rate.The likelihood of attending school for boys is 14.3percentage points higher than for girls.
Children Out of School: Measur ing Exclusion from Pr imary Education
24% of Indonesianchildren who are outof school have amother with noeducation.
The likelihood of achild attending schoolis decreased with ahigher number ofchildren under age 5in the household.
In Mali, girls accountfor 56% of childrenout of school.

Chapter 2. Assessing the characteristics of out-of-school children
55
Place of residence
Rural children are more likely to be out of schoolthan those from urban areas. In the survey sample,77% of all children live in rural areas but they accountfor 87% of those out of school. In India and Indonesia,the disparities between urban and rural areas recededwhen other factors were taken into account in theregression analysis. In Mali, however, the ruraldisadvantage remains, which means it existsindependent from household wealth or otherdeterminants of school attendance. Urban childrenare 10.2 percentage points more likely to be in schoolthan rural children.
Household wealth
Household wealth has a strong impact on schoolattendance in Mali. Children from the lower threequintiles (60%) of households are more likely tobe out of school than children from the richesthousehold quintile.
The regression analysis yields a much larger effect ofhousehold wealth on school attendance than in Indiaor Indonesia. This is a symptom of the inequality in thewealth distribution. Children from the bottom twoquintiles (40%) of the population have the samelikelihood of being out of school. In contrast, childrenfrom the richest quintile are 23 percentage pointsmore likely to be in school than those from thepoorest quintile.
Orphans
In Mali, orphans are not more likely to be out ofschool, which distinguishes this country from Indiaand Indonesia.
Parental education
The educational attainment of the parents and thehousehold head has a significant effect on the schoolattendance of children. Most children aged 7 to 12years in Mali (86%) have a mother with no formaleducation. Among children out of school, 93% havea mother with no formal education. The effect ofeducational attainment of the father or thehousehold head is similar.
The role of parental educational attainment isreflected in the regression analysis. Compared tochildren of a mother with no education, those whosemother had attended primary school are 12.3percentage points more likely to be in school. If themother has secondary or tertiary education, thelikelihood of school attendance is increased by astaggering 42.7 percentage points. By contrast, the
effects from a father’seducational attainment areobservable only at thesecondary education leveland it is still lower than theimpact of the mother’seducational attainment. Ahousehold head with formal education also has astrong positive effect on school attendance.
Other characteristics of parents or household head
The gender of the household head has no effect on achild’s likelihood to attend school.
Household composition
The composition of the household does not appear tobe a significant determinant of school attendance.
Child labour
The DHS survey in Mali collected data on workingchildren. The definition of child labour is the same asthat used in the India MICS survey. In the case of Mali,two in five primary school-age children (39%) areengaged in child labour. Among children out of school,45% are involved in child labour. The marginal effectof child labour on the likelihood of school attendanceis -11.6, meaning that working children are almost 12percentage points less likely to be in school than theirnon-working peers.
Sub-national districts
An analysis of school attendance by the eightadministrative regions in Mali shows that children inthe Kayes, Segou, Mopti and Tombouctou regionsappear more likely to be out of school than childrenin other regions (see Statistical Table A12). In theregression analysis, school attendance in Sikasso, whichhas the sample’s largest number of observations, iscompared with the remaining regions. Children fromKoulikoro are found to have higher attendance rates,whereas children from Tombouctou and Mopti areless likely to be in school.
In summary, there is an increased probability of beingout of school for younger children, girls, childlabourers, children with parents or household headswithout formal education,children from the pooresttwo- to three-fifths of thepopulation, rural residents,and children living in certainregions. The large disparities among different groupsand the low primary school attendance rate in thecountry as a whole pose serious challenges to policy-makers.
School attendance inMali is increased by 42.7percentage points if themother has secondaryor higher education.
45% of out-of-schoolchildren in Mali areinvolved in child labour.

56
Nigeria
Nigeria is the most populous country in Africa andone of its most diverse. The DHS survey in Nigeriaprovides similar data to the Indonesia and Malisurveys, with additional information on therespondent’s native language but without data onchild labour. The official primary school age isbetween 6 to 11 years (see Statistical Table A13).The sample for the regression analysis contains5,917 primary school-age children, with an averageattendance rate of 66.3%. The results of theregression are shown in Statistical Table A15.
Age
In Nigeria, children aged 6 to 7 years are morelikely to be out of school. The regression confirmsthat the likelihood of primary school attendanceincreases with age, which is a sign of delayed entry.
Sex
In the overall sample, 49% of children are femaleand 51% are male. However, girls account for 56%
of children out of school.Compared to girls, boys have ahigher likelihood of schoolattendance with a marginaleffect of 12.0 percentagepoints. Girls are clearly at a
disadvantage in Nigeria when it comes to primaryschool attendance.
Place of residence
Rural children are more likely to be out of schoolor to have never attended than those from urbanareas. In Nigeria, 68% of primary school-agechildren live in rural areas, but these childrenaccount for 80% of those who are out of school.However, this disparity disappears once otherfactors are considered. The regression analysis findsthat there is no statistically significant difference inschool attendance based solely on place ofresidence.
Household wealth
Higher levels of household wealth are associatedwith an increased probability of school attendance.Children from the poorest two quintiles ofhouseholds are more likely to be out of school, asStatistical Table A13 shows. The regression analysis
supports this finding: children from the poorestquintile of Nigerian households have a significantlylower likelihood of attending school than childrenfrom the remaining 80% of households. Comparedto the poorest quintile, the likelihood of schoolattendance is 25.6 percentage points higher forchildren from the richest quintile.
Orphans
There is no difference in school attendancebetween orphans and children who have at leastone living parent. Living apart from one’s parentsalso appears to have a limited effect on schoolattendance, which may be an indicator of thestrong role of the extended family in Nigeria.
Parental education
The educational attainment of the parents and thehousehold head is a strong determinant of schoolattendance. Of all children of primary school age,57% have a mother without formal education.However, 86% of children out of school have amother that lacks formal education. The results foreducational attainment of the father or householdhead are similar. If the parents or the householdhead report that they are literate, children have anincreased likelihood of being in school.
The regression analysis shows that the likelihood ofschool attendance rises by 6.7 percentage pointswhen the mother has primary education and by13.7 points when the mother has secondary ortertiary education. The respective values for thefather’s education are 10.0 points and 10.7 points.Nigeria thus differs from India, Indonesia and Mali,where the mother’s education has a strongerpositive effect on school attendance than thefather’s education. An effect of the educationallevel of the household head is observed only whenthe level is secondary or higher. In that case,children are 9.9 percentage points more likely to bein school than children from households headed bypersons with no education.
Other characteristics of parents or household head
Being in a female-headed household has a positiveeffect on school attendance. In the sample, 12% ofchildren live in a household headed by a woman,but only 5.9% of children out of school live with afemale household head. The regression confirmsthat children in male-headed households are
Children Out of School: Measur ing Exclusion from Pr imary Education
In Nigeria, girlsaccount for 56%of out-of-schoolchildren.

Chapter 2. Assessing the characteristics of out-of-school children
57
significantly less likely to bein school than children fromfemale-headed households.This is also observed in Indiabut with a smaller marginaleffect than in Nigeria.
In Nigeria, the survey collected data on the nativelanguage of the survey respondent, which can beused to examine differences between ethnic groups.Almost one in three children in the survey sample(31%) live in households where Hausa is the nativelanguage. The Hausa people live in thepredominantly Muslim northern part of Nigeria.However, these children account for more than one-half of the children (54%) out of school. Theregression finds that children from Hausahouseholds are 9.8 percentage points less likely toattend school than children from households whereother languages predominate. In contrast, Childrenliving in households where Yoruba and Igbo arespoken have higher attendance rates.
Household composition
The age composition of the household has no effecton school attendance in Nigeria.
Sub-national districts
The DHS survey in Nigeria was not designed to berepresentative at the state level. Instead results areavailable for six larger geographic regions. Data inStatistical Table A13 and in the regression output inStatistical Table A15 show that children in the NorthEast and North West regions are more likely to beout of school than those in other regions. Thismatches the results by native language of the surveyrespondent.
However, some caution should be exercised wheninterpreting this result. In the northern part ofNigeria, more children are out of school than in thesouth. But, due to limitations in the data, it is notpossible to establish whether children in the northare entirely out of school or whether they attendIslamic schools, which are not counted as formaleducation in the context of this study.
In summary, there is an increased probability ofbeing out of school for younger children, girls,children with parents or household head withoutformal education, children from male-headedhouseholds, children from poor households, andchildren living in northern Nigeria.
Conclusion
The preceding analysis described the situation infour countries that differ widely in their geography,demographics, economies and systems ofeducation. Some determinants of schoolattendance are specific to individual countries, butother characteristics of out-of-school children arecommon to India, Indonesia, Mali and Nigeria.
Household wealth is always strongly related toschool attendance, with children from the pooresthouseholds more likely to be out of school than therest of the population. This underlines theimportance of poverty reduction within policieswith the goal of education for all. Child labour,commonly a symptom of poverty in a household, isa related phenomenon that interferes with primaryschool attendance, progression and completion.
The strong effect of the parents’ or householdhead’s level of education illustrates the inter-generational effects of investment in education.The effect is particularlypronounced for childrenof educated mothers,which emphasises theimportance of educatinggirls. Girls are not alwaysdisadvantaged butgender gaps remain.
The effect of other factors on school attendance –having lost one or both parents, living in a male-headed household, the number and age of otherhousehold members – varies from country tocountry. In spite of shared characteristics amongout-of-school children, policies and interventionsmust be tailored to nationally-specific contexts.
Nigerian children infemale-headed house-holds are less likely tobe out of school.
Intergenerational effectsof investment in educationare proven by the strongeffects of the parents’ levelof education on the child’sattendance in school.

58
Postscript: Next steps anda measurement agendaIn order to monitor changes in the number of out-of-school children, reliable timeseries of the number of out-of-school children are needed. Global and regionalestimates are required on an annual basis, not only for the future, but also forpast years.
However, household-based measures of school participation from sample surveysare collected on an infrequent basis, typically every three to five years. This is amajor issue since the UIS/UNICEF joint methodology survey-based estimates mayhave a significant impact on regional and global estimates. A strong researchprogramme is needed to identify approaches that might be taken. The statisticalproperties of the possible approaches need to be evaluated – perhaps througha combination of statistical theory and data analysis. Given the pattern of dataavailability for administrative and household surveys, some sort of compositeapproach may be needed for estimating time series and producing estimates forthe most recent year.
Yet, developing new methodologies to produce time series data based on acombination of different data sources will not be sufficient to target the problemof inconsistent data sources and estimates. A strategy to develop a betterunderstanding of data quality issues and how to resolve them is needed. This willhave an important impact not only on estimates of out-of-school children butalso on other education statistics based on administrative data.
A strategy must lead to a better understanding of systematic bias, as well as helpto identify country-specific problems related to either data source. Therefore thework must have two directions.
First, it must include a theoretical framework for assessing the impact ofsystematic errors in the components of each measure. This will lead to a betterunderstanding of conceptual differences between enrolment and attendancedata and the impact of the timing of surveys and data collections.
Second, further analysis of national data should be undertaken when the twoestimates are inconsistent and this should focus on the quality of the estimatesand the underlying data, such as population estimates. Analysis should beundertaken especially to explore the quality of age breakdowns of administrativeenrolment counts to identify the wrongful inclusion of children who are not ofprimary age. This work should focus on countries having the biggest impact onglobal and regional estimates. Yet, the review of country cases should be usedto build up a portfolio of ‘case histories’ that should be reviewed periodically toensure that generally emerging lessons are applied to all countries.
For the longer term, the strategy is to work with more countries to develop theiradministrative systems so they can provide annual information conforming to theconcepts and definitions of international data collections. In addition,independent household-based measures of school participation should also befurther developed, even in countries with reliable administrative systems.Household surveys allow for the assessment of administrative data, but moreimportantly, they provide a perspective on children who are out of school thatadministrative data do not reflect.

59
ReferencesBangladesh Bureau of Educational Information and Statistics (BANBEIS) (2002),“Statistical profile on education in Bangladesh”, BANBEIS Publication No. 350, Dhaka:BANBEIS.
Bangladesh Institute of Development Studies (BIDS) (1998), Regional poverty profile anddevelopment indicators - A GIS-based analysis micro impacts of macroeconomic andadjustment policies in Bangladesh”, Technical Paper No. 8 accessed athttp://www.mdgbangla.org/mdg_issues/primary_education/primary_education_data_bids.htm.
Campaign for Popular Education (2002), Education Watch 2001 - Renewed HopeDaunting Challenges, Dhaka: The University Press Limited.
FASAF, UNESCO Institute for Statistics, UNICEF, USAID, and ORC Macro (2004), Guide tothe Analysis and Use of Household Survey and Census Education Data, Montreal: UIS.
Filmer, Deon and Lant H. Pritchett (2001), “Estimating wealth effects withoutexpenditure data - or tears: An application to educational enrollments in states of India”,Demography 38 (1).
Langsten and Hassan (forthcoming), “Monitoring education for all: an integratedstructure to assess progress and assist policy-making”, Social Research Centre, AmericanUniversity in Cairo.
Loaiza, Edilberto (2004), “Does data quality explain the differences in the currentglobal estimates for mortality and education?”, New York: UNICEF.
Mehta, A.C. (2004), Elementary Education in India – Analytical Report 2003, New Delhi:NIEPA.
MICS (1999), MICS Draft Report from Philippines, New York: UNICEF, accessed athttp://www.childinfo.org/MICS2/newreports/philippines/philippinestable.pdf.
Ministère de l'Enseignement Pre-Universitaire et de l'Education Civique (MEPU EC)(2002), Annuaire Statistique Enseignement Primaire – Année Scolaire 2001 – 2002,Conakry: MEPU EC.
UN (2003), Indicators for Monitoring the Millennium Development Goals, New York:United Nations.
UNESCO (2000), The Dakar Framework for Action, Paris: UNESCO.
UNESCO (2002), Is the World on Track? EFA Global Monitoring Report, Paris: UNESCO.
UNESCO (2003), Gender and Education for All: The Leap to Equality, EFA GlobalMonitoring Report. Paris: UNESCO.
UNICEF (2004), The State of the World’s Children 2004, New York: UNICEF.
Wils, A. (2004), “Late entrants leave school earlier: evidence from Mozambique”,International Review of Education. Volume 50, No. 1.
World Bank, Living Standards Measurement Study (LSMS), accessed athttp://www.worldbank.org/lsms/.

60
ANNEX 1.The methodology for globaland regional estimatesA. Methodology for the calculation of primary school-
age children out of school
Calculation based on administrative data
The number of out-of-school children can be considered the residual betweenthe number of pupils in a given age range and the number of children in thesame age range.
Let sc be the starting age of primary education and ec the last age year ofprimary education in country c. Further let Pop(age1,age2)c,g be thepopulation of gender g in the age range from age1 to age2 in c.
The primary school-age population is calculated as:
SchoolPopc,M+F = Pop(sc , ec )c,M+F
Let Pupil(age1,age2)c,g,l be the number of pupils of gender g aged age1 toage2 at level of education l. The number of pupils of primary school age inprimary (ISCED 1) or secondary education is (ISCED2 and 3) is:
Pupil( sc , ec )c,M+F,ISCED123 = Pupil( sc , ec )c,M+F,ISCED1 + Pupil( sc , ec )c,M+F,ISCED23
The rate of children, boys and girls, out of primary school is:
ROOPSc,M+F = 1 - (Pupil( sc , ec )c,M+F,ISCED123 / SchoolPopc,M+F)
The rate of children, boys and girls, out of primary school but in pre-primaryeducation (ISCED 0) is:
RPPSc,M+F = (Pupil( sc , ec )c,M+F,ISCED0 / SchoolPopc,M+F)
Before calculating the total number of out-of-school children, the underlyingdata may need to be adjusted. Using administrative data, the number of out-of-school children is based on two different data sources. The number ofstudents is obtained from the UIS Annual Education Survey and the populationsize is taken from the database of the UN Population Division (UNPD). The datafrom the two sources do not match perfectly, e.g. the reference date for theage and the reference period for the data are not identical - population datatypically use an end of year or beginning of year reference, while for manycountries enrolment data refer to the beginning of the school year (e.g. earlySeptember). This can lead to mismatches between the two sources and it caneven mean that, for countries with high participation rates, the total numberof primary school-age pupils in pre-primary to secondary education combinedexceeds the number of children for that age group as reported by the UNPDpopulation data.

Annex 1. The methodology for global and regional estimates
61
If the participation rate of children exceeds 100% foreither girls or boys, the rates for both sexes and thetotal are adjusted. The rate for the total and itscomponents by sex will be below 100%. In otherwords, if:
Pupil( sc, ec )c, Male,ISCED0123 > SchoolPopc, Male
or Pupil( sc, ec )c, Female,ISCED0123 > SchoolPopc, Female
then the following adjustment factor is calculated:
Adjc = maximum of [Pupil( sc, ec )c, Male,ISCED0123
/SchoolPopc, Male and Pupil( sc, ec )c, Female,ISCED0123
/SchoolPopc, Female ]
The factor is applied to both sexes and the total forall rates is calculated as:
ROOPSc,M+F = 1 - (Pupil( sc, ec )c, M+F,ISCED123
/ SchoolPopc,M+F )/AdjcRPPSc,M+F = (Pupil( sc, ec )c, M+F,ISCED0
/ SchoolPopc,M+F ) /Adjc
Following the adjustment, the number of childrenout of school is calculated as:
NOOPSc,M+F = ROOPSc,M+F * SchoolPopc,M+F
It should be noted that the number of pupils basedon administrative data can be subject to error. Aswell, the population count of primary school-agechildren is subject to uncertainty which increasesduring the period between censuses. The annualestimates are generally projections from the mostrecent census data subject to expected changes infertility, mortality and migration. Given that censusesare conducted about every 10 years, these initialassumptions about fertility, mortality and migrationrates can have a significant impact on the populationestimates for primary school-age children over thecourse of time.
Another source of error results from the estimationof population data for single years of age. Forexample, UNPD splits population data by five-yearage groups into single-year age groups using theSprague method. The magnitude of uncertaintyrelated to population estimates is reflected bycomparing the size of the estimated school-agepopulation for the year 2001 using two (2000 and the2002) revisions of the United Nations WorldPopulation Prospects. For the median country, theschool-age population changed by 1%. For one outof four countries, the differences were more than 3%.
This relatively small error associated with thepopulation data can have a great impact on the out-of-school children estimate, as shown in the followingexample.
The estimate of out-of-school children based onadministrative data is the difference between thepopulation estimate (X) and the enrolled pupil count(Y). Relatively small differences between two large,independently derived numbers can be notoriouslyuncertain in relation to the figure being estimated.Even if one assumed that the two large numbers werenot biased but simply subject to random error, thevariance of the difference may be relatively large [V(X-Y) = V(X) + V(Y) under independent errors]. Forexample, suppose a country has 1 million primaryschool-age children and 800,000 children in school,then the out-of-school count would be 200,000, or20%. If both large numbers are plus or minus 20,000(i.e. standard error = 10,000), the standard error of thedifference is 15,000 and a 95% confidence interval is200,000 plus or minus 30,000.
Another source of error results from differencesbetween the month in which the school year starts (orthe month in which age cut-offs for school entry apply)and the reference month to which the age of pupilsrefers. This error typically leads to an overstatement ofthe number of out-of-school children and late entrants.
For example, children in Germany are expected tostart primary school in the year in which they havereached the age of 6 years on or before 1 July.Enrolment numbers are counted at the beginning ofthe school year, in early October, but the ages of pupilsare reported as of the end of the year (31 December).Approximately 50 per cent of children who were 6-years-old on 31 December were only aged 5 on the cut-off date of 1 July and therefore were not required toenroll in primary school that year. These children aretherefore wrongly classified as being out of school.However, the data collection instrument jointly usedby UNESCO, OECD and EUROSTAT for the collection ofeducation statistics (UOE) requires that countries reportstudent ages as of 31 December and not in relation toan enrolment cut-off or the beginning of the schoolyear. The same instructions apply to countriesparticipating in the UIS World Education IndicatorsProject (WEI). Data for countries implementing theUOE/WEI data collection according to the internationaldefinitions are potentially affected by this error. Forthis reason, data for are Austria, Chile, Czech Republic,Germany, Latvia, Slovakia and Uruguay not presentedin this report.

62
Calculation based on household survey data
The number of children out of school is the shareof out-of-school children of primary school agebased on a nationally-representative sample survey,multiplied by the absolute population of primaryschool age in a country. The questions used toidentify the share of children out of school dependon the household survey.
MICS surveys contain an education module withthe following questions for all children aged 5 to17 years:
1. Is (NAME) currently attending school?2. [If no to question 1] Did (NAME) attend school
at any time during the current school year?3. [If yes to question 1 or 2] Which level and grade
is/was (NAME) attending?
Children are counted as being in school if (a) theresponse to questions 1 or 2 is ‘yes’; and (b) the levelof school attended is primary or subsequent levels.In different phases of the DHS, various educationquestions have been used. Recent DHS surveysprovide the same information as the MICS,including whether the child attended school at anytime during the school year. For earlier surveys,children in school can be identified from theresponses to the following questions:
1. Has (NAME) ever been to school?2. [If yes to question 1] What is the highest level
of school (NAME) attended? What is the highestgrade (NAME) completed at that level?
3. [If yes to question 1] Is (NAME) still in school?
Of the countries for which DHS data were used inproducing the UIS/UNICEF global estimate,Bangladesh used the earlier survey module. In thiscase, the number of out-of-school children may beoverestimated by temporary absenteeism anddropouts.
Usually the respondent is asked to respond to thefirst and second questions for all householdmembers aged 5 years or older, and the thirdquestion for all household members aged 5 to 24years. Children are counted as being in school if (a)the answer to questions 1 and 3 is ‘yes‘; and (b) thehighest level of school attended is primary or asubsequent level.
For the purpose of this study, missing values for anyeducation variable, in both MICS and DHS datasets,
are imputed as if the child is not attending school.If observations with missing values are excludedrather than imputed in this way, the share ofchildren out of school would decrease.
The calculation of the number of children out ofschool is similar to the method of calculation usedfor administrative data. Let sc be the starting ageof primary education and ec the exit age fromprimary education in country c. Further letPop(age1,age2)c,g be the population of gender g inthe age range from age1 to age2 in country c. Theprimary school-age population in country c is then:
SchoolPopc,M+F = Pop(sc,ec)c,g
The sample from the household survey contains agroup of children of primary school age. This groupshall be called SurveyPop(sc,ec)c,M+F. Children inschool are a sub-sample of this group that can beidentified with the responses to the surveyquestions. The number of pupils of primary schoolage in primary (ISCED 1) or secondary education(ISCED2 and 3) in the survey data is thenSurveyPupil(sc, ec )c, M+F,ISCED0123. The rate of childrenout of primary school in the sample is:
SurveyROOPSc,M+F =1 - (SurveyPupil( sc, ec )c, M+F,ISCED0123
/ SurveyPop(sc,ec)c,M+F
By definition, this rate cannot exceed 100%, and incontrast to the calculation based on administrativedata, no adjustment is necessary. The rate ofchildren out of school is applied to the primaryschool-age population in country c to yield theabsolute number of children out of school. Theprimary school-age population for the referenceyear is based on UNPD data.
NOOPSc,M+F = SurveyROOPSc,M+F * SchoolPopc,M+F
It should be noted that household surveys aresubject to sampling and non-sampling errors. Thesampling errors for the surveys used in this reportare provided in Statistical Table A16. Standarderrors range from below 0.3 percentage points tomore than 2 percentage points in Cameroon, Chad,Gambia, Mozambique, Nepal, Nigeria andSuriname. The difference between the lower andupper boundary of the 95% confidence interval is1 to 10 percentage points, with a median of 4.5percentage points.
Children Out of School: Measur ing Exclusion from Pr imary Education

Annex 1. The methodology for global and regional estimates
63
B. Methodology for the combinationof administrative and householdsurvey data
The overall goal of the joint UIS/UNICEF estimate isto produce a global statistic that reflects the bestinformation available on primary schoolparticipation. The global and regional estimatesare based on administrative data from the UISsurvey and are also informed by data from MICSand DHS surveys.
The calculation of global and regional averages isconducted in two steps:
1) A set of general rules is applied to the country-specific data in order to calculate the jointestimate: • use UIS data when no MICS/DHS data are
available;• use MICS/DHS data when no publishable UIS
data are available;• use UIS data when the participation rate
based on UIS data is not more than 5% pointshigher than that based on MICS/DHS.
Although the joint methodology needs furtherdevelopment in order to allow the production of time series, preference is given to administrative data which are available on an annual basis. This facilitates the regular update of the out-of-school children estimate and the calculation of reliable trend data.
2) After applying this set of rules, some countries are left for which administrative andhousehold survey data show substantiallydifferent results. For each country the absolutenumber of the difference in out-of-school children between the two sources is calculated. The following data review aims to reduce the sum of the absolute difference between the data sources below a given threshold. It was set as a target that the sum of the differences between the data sources caused by countries with different results (and not included in the process of joint data review by the organizations) must not exceed 3% of the presented global number of out-of-school children, and it must in any region either bebelow 250,000 or not exceed 4%. This range was set based upon the uncertainty relating tothe two measures.
In order to ensure greater coherence between data sources, the countries contributing mostto the difference in absolute terms were selected for a joint data review by UIS and UNICEF. The selection for the special data review was guided by the impact of the country’s result on the global or regionalestimates and is not based on a judgement of quality of the underlying data. An extensivereview of all data, although desirable, goes beyond the scope of this report. The review of the data sources for selected countries is based on different data sources and a literature review using other national and international documentation and survey results.
In order to produce the global estimate, datafor Bangladesh, Benin, Cambodia, Egypt, Ethiopia, India, Iraq, Philippines, Viet Nam and Yemen were examined. Additionally data forChad, Guatemala, Guinea, Nepal and Togowere reviewed in order to reach regional targets. The UIS also collected informationrelevant for the calculation of out-of-school children based on other sources. Based on these reviews, a decision was taken to use theUIS result, the MICS/DHS result, or to producea new estimate.
Bangladesh
Household survey data and administrative dataappear to be coherent with respect to the numberof pupils for all ages combined. However,differences between net enrolment and netattendance rates are caused by dissimilarities in theage distribution of pupils. The age distribution ofprimary students reflected by the administrativedata is based on a national estimate of primarypupils in secondary schools (BANBEIS, 2002). Theestimate was judged not to be representative of thewhole primary sector. Three household surveysconfirm the range of net attendance rates reflectedby the DHS 1999/00 data (MICS 2003, Campaignfor Popular Education, 2002; BIDS, 1998).
Conclusion: DHS (1999/00) were used for the jointestimate. Applying the DHS (1999/00) agedistribution to administrative data was notconsidered appropriate.

64
India
The age distribution for the administrative data isreported on the basis of data available fromprimary schools in 193 districts from the DistrictInformation System (DISE). The age distributionwas applied to the national level (593 districts). Itshould be noted that the 193 districts are not arepresentative sample but are those with availabledata. Furthermore, a number of primary educationprogrammes are not covered by DISE, such as theEducation Guarantee Scheme (EGS) programmes. Itis assumed that the pupils in those programmeshave the same age distribution as observed by DISE.
The UIS/UNICEF joint review considered thecoverage of the DISE age data as too low (193 outof 593 districts) to be reliable. The authors of aDISE analytical report stated that the age data werenot reliable enough to calculate net enrolmentrates (Mehta, 2004). Administrative data show thatthe participation rate for children aged 6 years is99.2% and that pupils begin to drop out of schoolfrom age 7. This picture is in contrast to otherinformation sources and survey data.
MICS and DHS data show lower levels ofparticipation which is verified for two regions (UttarPradesh and Bihar) on the basis of the World Bank'sLiving Standards Measurement Study carried out in1997/98 (World Bank).
Conclusion: National sources suggest that the agedata available from estimated administrative dataare not sufficiently reliable to produce age-basedindicators. MICS (2000) data are used for the globalestimate.
Ethiopia
According to administrative data, the number ofprimary pupils grew substantially since 1998 (a 40%increase). The age distribution of the administrativedata provided in 2001 was identical to the agedistribution in 1998 based on calculations from theUIS database. This does not appear to take intoaccount the changes due to increased enrolments.Therefore the UIS/UNICEF review team hadconcerns it might overstate the enrolment ofprimary age. The total number of students wasjudged as reliable.
Conclusion: Administrative data were used for thetotal number of pupils. The age distribution
obtained from DHS (2000) was used to re-estimatethe distribution of pupils by age.
Philippines
The MICS (1999) survey was conducted late in theschool year, creating potential problems in terms ofcalculating out-of-school figures. By adjusting theages of children by one year, the adjusted netattendance rate is more consistent with results fromadministrative data. The national report on MICSuses the age range 7 to 12 years and not the officialprimary school age according to ISCED (NSO-MICS,1999).
Conclusion: Administrative data were used for theglobal estimate.
Benin
The most recent administrative data available areconsiderably older than the most recent householdsurvey data. The age distribution used to calculateindicators is of uncertain quality. Newly-receivedadministrative data could not be verified before thisreport was finalised. However, they show a veryhigh level of participation (NER=93%, someparticipation rates for specific age groups exceed100%).
Conclusion: Until recent administrative data arevalidated, the more recent DHS (2001) results wereused for the global estimation. These data mayneed to be revaluated when more recentadministrative data have been reviewed.
Cambodia
Age-specific enrolment rates based onadministrative data reported by Cambodia oftenexceed 100%. Because of this, the data publishedby the UIS have been adjusted by the nationally-published net enrolment rates. The quality of theseadjustments is difficult to judge.
Conclusion: DHS (2000) data were used for theglobal estimate.
Egypt
The difference between the attendance rates fromDHS (2000) and administrative data for the sameschool year is 7%. This difference can be attributedalmost entirely to the differences in enrolmentrates for 6-year-olds (age at grade 1). The difference
Children Out of School: Measur ing Exclusion from Pr imary Education

Annex 1. The methodology for global and regional estimates
65
is partly explained by the timing of the DHSinterviews, which were conducted in the latter halfof the school year. Therefore a number of 6-year-olds counted as out-of-school children were actually5-year-olds at the beginning of the school year. Theattendance rate for 7- to 12-year-olds based onDHS data is higher than the rate based onadministrative data. The adjustment of the ages ofin DHS data leads to results which are moreconsistent to those of the administrative data.
Conclusion: Administrative data were used for theglobal estimate.
Iraq
No administrative data have been available since1998. UIS data estimates were last available in 1999,the quality of which are difficult to judge.
Conclusion: Until more recent administrative databecome available, the MICS (2000) data were usedfor the global estimate.
Viet Nam
The interviews for the MICS (2000) were conductedbetween May and June 2000, during the end of theschool year or over the school break. Afteradjustment for the ages of children by adding oneyear, the data sources appear more consistent.
Conclusion: Administrative data were used for theglobal estimate.
Yemen
Administrative data for Yemen have shown asubstantial increase in primary enrolments since1997. However, administrative data for 2001/02were deemed as unreliable. DHS data were used forthe global estimate.
Guinea
Administrative data for first-time entrants toprimary education show rates substantially lowerthan those for net enrolment rates. In other words,the intake into the education system cannot explainthe primary school-age participation rates. Theseinconsistencies are already present in national
statistics (net enrolment rate: 62%; net intake rate:23%; gross intake rate: 51%; (MEPU EC, 2002)). Apossible explanation is that the age distribution isinaccurate and the high participation rates are dueto repetition rather than intake.
Conclusion: DHS (1999) data, which were used,were more coherent with administrative data onprimary school intake.
Togo
Administrative data show that net enrolment ratesby single year of age can exceed 100%. Thereported number of school-age boys enrolled inprimary education exceeds the number of boysin the primary school-age population. The NERfor boys is 100%, while the NER for girls is as lowas 81% to 86%. The UIS/UNICEF review consideredthat problems with the population data werepotential sources of error. Population data fromother sources, such as estimates produced by theinternational programme of the U.S. Bureau of theCensus, reflects a total population which is morethan 10% higher. Results from the MICS (2000) arein line with earlier results from DHS (1998).
Conclusion: MICS (2000) data were used.
Nepal
Administrative data are based on estimates, usingnational estimates of net enrolment rates. Noobserved administrative data by age are availableafter 1997. The estimate was considered unreliablesince it shows the highest number of primarystudents at age 11, which is older than the expectedending age of the primary education cycle.
Conclusion: MICS (2000) data were used for theglobal estimate.
Chad and Guatemala
No evidence is available to judge the data sources.Both countries need further consideration in termsof updating the out-of-school children estimate.
Preliminary conclusion: MICS (2000) and DHS(1998/99) data were used for the global estimate.

66
C. Administrative and householdsurvey data: Why are they different?
The estimated numbers of primary school-age pupilsbased on administrative data and household surveydata differ substantially in many countries. How canthese differences between data sources beexplained?
A common explanation stresses the differencebetween the concepts of enrolment (administrativedata) and attendance (household survey data). Beingenrolled in school is not necessarily the same asattending school. Children may be recorded in schoolenrolment records and yet not actually be attendingschool.5 Concerns have been also raised thatenrolment rates can be overstated in educationsystems in order to meet goals or due to direct linksto levels of financing and resources.
Given the assumption that children may be enrolledbut not attending or that fictitious registrations arereported, it is of interest whether the number ofpupils overall based on administrative data issystematically higher than that from householdsurveys. This appears to be the case when lookingonly at the primary school-age population. However,
a different picture emerges when a wider age band,including secondary school-age children, is used.
Figure A1 compares the percentage of children inschool for the same reference year calculated fromeach data source. The horizontal axis shows theresult obtained from household survey data and thevertical axis shows the result from administrativedata. The chart on the leftconsiders just the age rangefrom primary school-agechildren. Among the 59countries with comparabledata, in 24 countriesparticipation rates drop byfive percentage points forthe primary school-age group when householdsurveys are used instead of administrative data.The opposite is true for 10 countries.
Figure A2 compares the data for the age group 5to 17 years. For 26 of the 59 countries, the resultsdiffer by more than five percentage points.However, the difference between sources is notsystematic. There is a tendency for household surveydata to cover a higher total number of children inschool than administrative data when a wider age
Children Out of School: Measur ing Exclusion from Pr imary Education
5 (FASAF et al, 2004). See also: (UNESCO, 2002); (UNICEF, 2004); and (Loaiza, 2004).
Pri
mar
y sc
hoo
l-ag
e ch
ildre
n in
sch
oo
l (%
), b
ased
on
adm
inis
trat
ive
dat
a
Primary school-age children in school (%), based on household survey data
Above this line: net enrolment rate
(administrative data) higher than net attendance rate
(household survey data)
Figure A1. Children in school: Administrativedata compared to household surveydata, primary school ages
Figure A2. Children in school: Administrativedata compared to household surveydata, 5 to 17-year-olds
Above this line: net enrolment rate
(administrative data) higher than net attendance rate
(household survey data)
5 to 17-year-olds in school (%), based on household survey data
5 to
17-
year
-old
s in
sch
oo
l (%
), b
ased
on
adm
inis
trat
ive
dat
a
Note: The reference year is the same for both sources. Data may, therefore, differ from the administrative data shown in Statistical Table A1.Countries with more than 10 points difference between the two sources are labelled.
Source: UNICEF/UNESCO Institute for Statistics, Statistical Table A1, UNESCO Institute for Statistics database.
Household surveys tendto show a higher totalnumber of pupils thanadministrative data,when considering abroader age group.

Annex 1. The methodology for global and regional estimates
67
range is being considered (18 countries), while theopposite is true for only eight countries. Of the 24countries which have higher participation ratesfor primary school-age children based onadministrative data, only seven show the samepattern for the 5 to 17-year-old age group.
Why are participation ratesbased on household surveysoften lower for the primaryage range but not for a widerage range? The explanation isrelated to the age distribution
of pupils. Figure A3 compares the percentage ofpupils aged 5 to 17 years who are of primary schoolage by source of data. Administrative data tend toreflect a higher proportion of primary school-agechildren than household survey data (37 out of 59countries). For example, in Bangladesh, the numberof pupils aged 5 to 17 years based on householdsurvey data is 28.5 million, compared to 27.2 millionbased on administrative data. However, usinghousehold survey data, only 49% of the 28.5 millionare estimated to be of primary school age,compared to 60% of the 27.2 million based onadministrative data. The number of pupils ofprimary school age according to administrativedata, 16 million, exceeds the survey estimate bytwo million.
D. Methodology to estimate the proportion of late entrants anddropouts
Chapter 1 provides a typology to classify childrenout of school according to their exposure toeducation. Out-of-school children are classifiedas:
• never attended school - likely to attend in the following years; or- will never attend school;
• has attended school but dropped out.
The allocation of children who have neverattended school to date into the two groupscannot be made on the basis of micro- or macro-level data. It is based on the probability of childrenattending school when they are older and cannotbe derived from the characteristics of individualchildren. Only the proportion of the children thatwill fall in each group can be estimated using anindication of participation rates by single year ofage at the global and regional levels. Nevertheless,the calculation is carried out on a country bycountry basis before aggregating the results.
Figure A4 illustrates the calculation. In a first step,the single age with the lowest non-participationrate is identified. The proportion not participatingat that age is used as a proxy for the rate ofchildren who will never participate across all ages.
In a second step, the size of the group of out-of-school children that is expected to participate inthe coming years is estimated. It is assumed thatall out-of-school children younger than the agewith the lowest levels of non-participation havesome chance to enter school in the coming years.The proportion is simply estimated as theproportion out of school minus the proportionestimated to never enter school.
In a last step, the proportion of drop-outs isestimated. The proportion of children droppedout is estimated as the proportion out of schoolminus the portion estimated as having neverparticipated.
% out of school, based on household survey data
% o
ut o
f sc
hoo
l, b
ased
on
adm
inis
trat
ive
dat
a
Above this line: Administrative data show higher % of out-of-school
children or 5 to 17-year-olds than household survey data
Figure A3. Percentage of primary school-age pupilsaged 5 to 17 years: Household survey andadministrative data
Note: The reference year is the same for both sources. Countries with more than 15 points difference between the two sources are labelled.
Source: UNICEF/UNESCO Institute for Statistics; UNESCO Institute for Statistics database.
Administrative datatend to overestimatethe share of pupils ofprimary school age

68
The following calculation formula is applied to countries separately.Regional and global estimates are calculated as the sum of country results.
Let Rage be the rate of out-of-school children for each age. Rmin is theminimum of all Rage. AGEmin is the age for which Rage is the minimum.POPage is the population by single year of age.
The number of out-of-school children that is expected to never enterschool is estimated as:
OOSCnever = Sum(Rmin * POPage) for all ages
The number of out-of-school children that is expected to enter school infuture years is estimated as:
OOSClate entry = Sum( (Rage - Rmin) * POPage) for ages < AGEmin
The number of out-of-school children that dropped out is estimated as:
OOSCdrop-out = Sum( (Rage - Rmin) * POPage) for ages > AGEmin
Inconsistencies between the population data and administrativeenrolment data can lead to participation rates exceeding 100%. In thiscase, non-participation rates (Rage) are assumed to be zero. AGEmin is theyoungest age for which Rage is zero.
Children Out of School: Measur ing Exclusion from Pr imary Education
Age with peak
attendance
Figure A4. Estimates of the proportion of out-of-school populations by type

69
ANNEX 2Statistical Tables

Children Out of School: Measur ing Exclusion from Pr imary Education
70
M F GPI MF M F GPI
Education system
School
year
Primary
school
age group
School-age
population
(thousands)
TABLE A1. PRIMARY SCHOOL-AGE CHILDREN IN AND OUT OF SCHOOL. ADMINISTRATIVE AND
Country or territory
Enrolment data (administrative sources)
In school Out of schoolIn secondary education(included in "in school")
Total Male Female Total Male Female Total Male Female
Source
for global
and regional
estimates
Children of primary school age (%)
Central and Eastern Europe / Commonwealth of Independent States (CIS)
Albania 2000/01 6 - 9 257 Enrolment1 97.2 97.3 97.0 - - - 2.8 2.7 3.0
Armenia 2001/02 7 - 9 149 Enrolment 87.5 87.9 87.0 2.9 3.1 2.8 12.5 12.1 13.0
Azerbaijan 2001/02 6 - 9 723 Enrolment 79.9 80.6 79.2 - - - 20.1 19.4 20.8
Belarus 2001/02 6 - 9 464 Enrolment 93.2* ... ... 1.0** ... ... 6.8 ... ...
Bosnia and Herzegovina 2001/02 6 - 9 193 Attendance ... ... ... ... ... ... ... ... ...
Bulgaria 2001/02 7 - 10 352 Enrolment 92.3 92.9 91.8 2.0 1.9 2.1 7.7 7.1 8.2
Croatia 2001/02 7 - 10 202 Enrolment 94.7 95.1 94.3 6.2 5.9 6.5 5.3 4.9 5.7
Georgia 2001/02 6 - 9 276 Enrolment 90.7 90.9 90.5 - - - 9.3 9.1 9.5
Kazakhstan 2001/02 7 - 10 1,166 Enrolment 95.7 94.8 96.7 6.2 4.8 7.7 4.3 5.2 3.3
Kyrgyzstan 2001/02 7 - 10 454 Enrolment 90.0 91.7 88.4 - - - 10.0 8.3 11.6
Moldova, Republic of 2001/02 7 - 10 267 Enrolment 82.2 82.5 81.9 3.9 3.8 4.1 17.8 17.5 18.1
Romania 2001/02 7 - 10 1,049 Enrolment 91.6 91.9 91.3 3.2 3.0 3.3 8.4 8.1 8.7
Russian Federation 2001/02 7 - 9 4,883 Enrolment 88.6 88.0 89.2 x x x 11.4 12.0 10.8
Serbia and Montenegro 2000/01 7 - 10 386 Enrolment1 76.2* 76.1* 76.4* 1.3** 1.3** 1.4** 23.8 23.9 23.6
Tajikistan 2001/02 7 - 10 641 Enrolment 96.0* 98.7* 93.3* 1.0** 1.3** 0.7** 4.0 1.3 6.7
The Former Yugoslav Rep. of Macedonia 2001/02 7 - 10 123 Enrolment 97.5 97.0 98.0 5.2 5.0 5.4 2.5 3.0 2.0
Turkey 2001/02 6 - 11 8,692 Enrolment 87.9** 91.0** 84.8** - - - 12.1** 9.0** 15.2**
Turkmenistan 2001/02 7 - 10 478 Enrolment2 … … … … … … ... ... ...
Ukraine 2001/02 7 - 9 1,754 Enrolment 90.2* 90.3** 90.1** 2.7** 2.7** 2.8** 9.8 9.7** 9.9**
Uzbekistan 2001/02 7 - 10 2,495 Attendance ... ... ... ... ... ... ... ... ...
Middle East and North Africa
Algeria 2001/02 6 - 11 4,326 Enrolment 96.9 98.0 95.7 1.8 1.6 1.9 3.1 2.0 4.3
Bahrain 2001/02 6 - 11 83 Enrolment 92.2** 91.9** 92.6** 1.2** 1.2** 1.3** 7.8** 8.1** 7.4**
Djibouti 2001/02 6 - 11 110 Enrolment 34.3** 38.7** 29.8** 0.3** 0.5** 0.2** 65.7** 61.3** 70.2**
Egypt 2001/02 6 - 10 8,103 Enrolment 92.5** 94.5** 90.4** 2.2** 2.3** 2.1** 7.5** 5.5** 9.6**
Iran, Islamic Republic of 2001/02 6 - 10 8,154 Enrolment 86.6* ... ... x ... ... 13.4 ... ...
Iraq 1999/00 6 - 11 3,683 Attendance 90.5 97.6 83.2 - - - 9.5 2.4 16.8
Jordan 2001/02 6 - 11 777 Enrolment 94.9 94.3 95.5 3.6 3.3 3.8 5.1 5.7 4.5
Kuwait 2001/02 6 - 9 158 Enrolment 88.9 89.1 88.7 4.3 4.2 4.4 11.1 10.9 11.3
Lebanon 2001/02 6 - 11 440 Enrolment 91.6** 91.7** 91.6** x x x 8.4** 8.3** 8.4**
Libyan Arab Jamahiriya 2001/02 6 - 11 657 Enrolment2 ... ... ... ... ... ... ... ... ...
Morocco 2001/02 6 - 11 3,764 Enrolment 88.5 91.7 85.2 0.1 0.1 0.2 11.5 8.3 14.8
Oman 2001/02 6 - 11 382 Enrolment 76.1 75.6 76.6 1.6 1.5 1.7 23.9 24.4 23.4
Palestinian Autonomous Territories 2001/02 6 - 9 386 Enrolment 98.6* 98.2* 99.0* 4.0** 3.9** 4.1** 1.4 1.8 1.0
Qatar 2001/02 6 - 11 61 Enrolment 98.8 >99 98.0 5.3 5.2 5.5 1.2 <1 2.0
Saudi Arabia 2001/02 6 - 11 3,442 Enrolment 59.6 62.1 57.0 0.7 1.0 0.5 40.4 37.9 43.0
Sudan 1999/00 6 - 11 4,710 Enrolment 48.9** 53.3** 44.4** x x x 51.1** 46.7** 55.6**
Syrian Arab Republic 2001/02 6 - 11 2,602 Enrolment 97.4 >99 94.7 2.8 3.0 2.6 2.6 - 5.3
Tunisia 2001/02 6 - 11 1,188 Enrolment 97.8* 98.0* 97.7* 1.0** 0.9** 1.1** 2.2 2.0 2.3
United Arab Emirates 2001/02 6 - 11 310 Enrolment 83.9* 84.9* 82.7* 3.0** 3.0** 3.0** 16.1 15.1 17.3
Yemen 2000/01 6 - 11 3,337 Attendance 67.6** ... ... x ... ... 32.4** ... ...

Table A1. Primary school-age children in and out of school. Administrative and household survey data
71
F% F
Country or territory
Central and East Europe / Commonwealth of Independent States (CIS)
... ... ... 7 4 4 50.9 … … … … … … … … … Albania
... ... ... 19 9 10 50.8 DHS 2000 3.0 3.3 2.6 4 3 2 43.3 Armenia
3.1 3.2 3.1 145 72 73 50.4 MICS 2000 9.1 9.2 9.0 66 34 32 48.3 Azerbaijan
5.7 ... ... 31 ... ... ... … … … … … … … … … Belarus
... ... ... ... ... ... ... MICS 2000 13.8 12.7 14.9 27 13 14 52.4 Bosnia and Herzegovina
0.5 0.5 0.5 27 13 14 52.2 … … … … … … … … … Bulgaria
0.7 0.7 0.7 11 5 6 52.7 … … … … … … … … … Croatia
1.0 1.0 1.0 26 13 13 49.8 … … … … … … … … … Georgia
0.5 0.5 0.5 50 31 19 38.4 DHS 1999 1.5 1.7 1.3 18 10 8 42.9 Kazakhstan
0.8 0.8 0.8 45 19 26 57.8 DHS 1997 5.1 4.9 5.2 23 11 12 51.2 Kyrgyzstan
10.9 11.2 10.6 47 24 24 49.8 MICS 2000 1.6 2.0 1.1 4 3 1 35.7 Moldova, Republic of
... ... ... 88 44 44 50.4 … … … … … … … … … Romania
... ... ... 558 301 257 46.1 … … … … … … … … … Russian Federation
1.0 1.0 0.9 92 47 44 48.4 … … … … … … … … … Serbia and Montenegro
1.2 1.3 1.2 26 4 21 83.2 MICS 2000 19.3 20.0 18.5 124 65 58 47.3 Tajikistan
1.8 1.7 1.8 3 2 1 38.0 … … … … … … … … … The Former Yugoslav Rep. of Macedonia
... ... ... 1,049** 397** 652** 62.2** DHS 2003 11.6 10.8 12.4 1,007 477 530 52.6 Turkey
... ... ... ... ... ... ... … … … … … … … … … Turkmenistan
... ... ... 172 87** 85** 49.2** … … … … … … … … … Ukraine
... ... ... ... ... ... ... MICS 2000 19.7 19.2 20.1 491 244 247 50.3 Uzbekistan
Middle East and North Africa
... ... ... 136 45 92 67.3 MICS 2000 6.5 6.2 6.9 282 136 146 51.7 Algeria
0.3** 0.4** 0.3** 6** 3** 3** 46.4** MICS 2000 13.7 14.0 13.4 11 6 5 47.8 Bahrain
... ... ... 72** 34** 38** 53.1** … … … … … … … … … Djibouti
0.2** 0.2** 0.2** 608** 226** 382** 62.8** DHS 2000 14.4 12.5 16.5 1,170 518 652 55.8 Egypt
... ... ... 1,095 ... ... ... … … … … … … … … … Iran, Islamic Republic of
... ... ... 348 46 303 86.9 MICS 2000 22.2 16.2 28.5 818 304 514 62.9 Iraq
... ... ... 40 23 17 42.8 … … … … … … … … … Jordan
... ... ... 17 9 9 49.8 … … … … … … … … … Kuwait
0.8** 0.9** 0.7** 37** 19** 18** 49.1** MICS 2000 3.1 2.7 3.4 13 6 7 54.7 Lebanon
... ... ... ... ... ... ... … … … … … … … … … Libyan Arab Jamahiriya
0.7 1.2 0.2 432 159 273 63.1 … … … … … … … … … Morocco
- - - 91 48 44 47.8 … … … … … … … … … Oman
0.9 0.7 1.0 6 4 2 34.2 … … … … … … … … … Palestinian Autonomous Territories
0.5 0.5 0.4 - - - 77.8 … … … … … … … … … Qatar
... ... ... 1,390 668 723 52.0 … … … … … … … … … Saudi Arabia
... ... ... 2,405** 1,120** 1,285** 53.4** … … … … … … … … … Sudan
- - - 67 - 67 >90 … … … … … … … … … Syrian Arab Republic
... ... ... 26 12 14 52.9 … … … … … … … … … Tunisia
0.6 0.6 0.6 50 24 26 52.5 … … … … … … … … … United Arab Emirates
... ... ... 1,081** ... ... ... DHS 1997 45.4 32.2 59.3 1,515 549 966 63.8 Yemen
HOUSEHOLD SURVEY DATA
Out of school (thousands)3
Number of children
Enrolment data (administrative sources) Attendance data (household surveys)
Total Male Female %Female TotalYearSurvey Male FemaleTotal Male Female Total Male Female %Female
Out of school(thousands)
Children of primaryschool age (%)
Out of schoolIn pre-primary education
(included in"out of school")
Number of childrenChildren of primary school age (%)

Children Out of School: Measur ing Exclusion from Pr imary Education
72
M F GPI MF M F GPI
Education system
School
year
Primary
school
age group
School-age
population
(thousands)
TABLE A1. PRIMARY SCHOOL-AGE CHILDREN IN AND OUT OF SCHOOL. ADMINISTRATIVE AND
Country or territory
Enrolment data (administrative sources)
In school Out of schoolIn secondary education(included in "in school")
Total Male Female Total Male Female Total Male Female
Source
for global
and regional
estimates
Children of primary school age (%)
Eastern and Southern Africa
Angola 1998/99 6 - 9 1,383 Enrolment1 61.5* 66.0* 56.9* x x x 38.5 34.0 43.1
Botswana 2001/02 6 - 12 319 Enrolment 81.1 79.3 82.9 0.2 0.1 0.2 18.9 20.7 17.1
Burundi 2001/02 7 - 12 1,151 Enrolment 53.5** 58.9** 48.1** - - - 46.5** 41.1** 51.9**
Comoros 1999/00 6 - 11 112 Enrolment1 55.1** 59.9** 50.2** x x x 44.9** 40.1** 49.8**
Eritrea 2001/02 7 - 11 546 Enrolment 42.9 46.1 39.6 0.4 0.3 0.4 57.1 53.9 60.4
Ethiopia 2001/02 7 - 12 11,285 Attendance 46.9 52.4 41.3 0.7 0.9 0.6 53.1 47.6 58.7
Kenya 2001/02 6 - 12 6,074 Enrolment 70.2** 69.7** 70.8** 0.3** 0.4** 0.3** 29.8** 30.3** 29.2**
Lesotho 2001/02 6 - 12 334 Enrolment 84.7 81.4 88.0 0.3 0.2 0.4 15.3 18.6 12.0
Madagascar 2001/02 6 - 10 2,311 Enrolment 69.0 68.6 69.4 0.4 0.3 0.5 31.0 31.4 30.6
Malawi 2001/02 6 - 11 1,952 Enrolment 81.5** 81.5** 81.5** 0.5 0.5 0.5 18.5** 18.5** 18.5**
Mauritius 2001/02 6 - 11 126 Enrolment >99 98.5 >99 7.1 6.3 7.8 <1 1.5 -
Mozambique 2001/02 6 - 10 2,585 Enrolment 59.7 63.5 56.0 - - - 40.3 36.5 44.0
Namibia 2001/02 6 - 12 376 Enrolment 78.4 75.9 80.9 0.2 0.1 0.2 21.6 24.1 19.1
Rwanda 2001/02 7 - 12 1,312 Enrolment 84.3* 83.1* 85.4* x x x 15.7 16.9 14.6
Seychelles 2001/02 6 - 11 8 Enrolment 94.8 94.9 94.7 7.6 7.4 7.8 5.2 5.1 5.3
Somalia 2001/02 6 - 12 1,772 Attendance ... ... ... ... ... ... ... ... ...
South Africa 2001/02 7 - 13 7,052 Enrolment 93.9* 92.9* 94.9* x x x 6.1 7.1 5.1
Swaziland 2001/02 6 - 12 211 Enrolment 77.0 76.6 77.4 0.3 0.3 0.4 23.0 23.4 22.6
Tanzania, United Republic of 2001/02 7 - 13 6,979 Enrolment 54.4* 54.3* 54.5* x x x 45.6 45.7 45.5
Uganda 2001/02 6 - 12 5,059 Attendance ... ... ... ... ... ... ... ... ...
Zambia 2001/02 7 - 13 2,063 Enrolment 66.6** 66.9** 66.3** 0.6** 0.5** 0.7** 33.4** 33.1** 33.7**
Zimbabwe 2002/03 6 - 12 2,555 Enrolment1 80.5 80.0 81.0 0.6 0.5 0.7 19.5 20.0 19.0
West and Central Africa
Benin 1999/00 6 - 11 1,070 Attendance 71.7** 85.0** 58.4** 0.4 0.5 0.3 28.3** 15.0** 41.6**
Burkina Faso 2001/02 7 - 12 2,127 Enrolment 35.5** 41.5** 29.4** x x x 64.5** 58.5** 70.6**
Cameroon 2001/02 6 - 11 2,570 Attendance ... ... ... ... ... ... ... ... ...
Cape Verde 2001/02 6 - 11 73 Enrolment 98.9 >99 98.3 0.3 0.3 0.3 1.1 <1 1.7
Central African Republic 2001/02 6 - 11 621 Attendance ... ... ... ... ... ... ... ... ...
Chad 2001/02 6 - 11 1,385 Enrolment 58.3** 69.8** 46.8** x x x 41.7** 30.2** 53.2**
Congo 2001/02 6 - 11 614 Enrolment2 ... ... ... ... ... ... ... ... ...
Côte d'Ivoire 2001/02 6 - 11 2,635 Enrolment 63.8* 73.5* 54.0* x x x 36.2 26.5 46.0
Democratic Republic of the Congo 1998/99 6 - 11 8,108 Enrolment1 34.8* 35.7* 33.8* 0.2** 0.3** 0.1** 65.2 64.3 66.2
Equatorial Guinea 2001/02 7 - 11 62 Enrolment 85.0* 91.6* 78.3* x x x 15.0 8.4 21.7
Gabon 2000/01 6 - 11 207 Enrolment1 79.6** 80.1** 79.2** x x x 20.4** 19.9** 20.8**
Gambia 2001/02 7 - 12 204 Enrolment 73.9** 77.1** 70.7** 1.1** 1.1** 1.0** 26.1** 22.9** 29.3**
Ghana 2001/02 6 - 11 3,177 Enrolment 61.0* 62.2* 59.7* 0.8** 0.8** 0.7** 39.0 37.8 40.3
Guinea 2001/02 7 - 12 1,294 Enrolment 61.9 69.5 54.0 0.4 0.5 0.3 38.1 30.5 46.0
Guinea-Bissau 1999/00 7 - 12 215 Enrolment1 45.4 53.1 37.7 0.2 0.2 0.1 54.6 46.9 62.3
Liberia 1999/00 6 - 11 471 Enrolment1 69.9 78.6 61.1 - - - 30.1 21.4 38.9
Mali 1998/99 7 - 12 1,966 Enrolment1 38.6** 44.8** 32.2** x x x 61.4** 55.2** 67.8**
Mauritania 2001/02 6 - 11 434 Enrolment 66.7** 68.2** 65.2** - - - 33.3** 31.8** 34.8**
Niger 2001/02 7 - 12 1,900 Enrolment 34.6 41.1 27.8 0.3 0.4 0.3 65.4 58.9 72.2
Nigeria 2001/02 6 - 11 20,093 Attendance ... ... ... ... ... ... ... ... ...

Table A1. Primary school-age children in and out of school. Administrative and household survey data
73
F% F
Country or territory
Eastern and Southern Africa
14.8 16.0 13.6 533 234 299 56.1 MICS 2000 42.0 42.6 41.4 581 293 288 49.5 Angola
... ... ... 60 33 27 44.9 MICS 2000 15.9 17.2 14.5 51 28 23 45.3 Botswana
... ... ... 536** 237** 299** 55.8** MICS 2000 53.3 50.5 56.0 613 291 322 52.6 Burundi
... ... ... 50** 23** 27** 54.8** MICS 2000 69.2 69.2 69.3 77 39 38 49.4 Comoros
- - - 312 148 164 52.5 DHS 2002 36.8 35.1 38.4 201 97 104 51.9 Eritrea
... ... ... 5,994 2,690 3,304 55.1 DHS 2000 69.4 66.9 72.0 7,835 3,783 4,053 51.7 Ethiopia
... ... ... 1,807** 924** 884** 48.9** DHS 2003 22.5 22.9 22.0 1,365 700 665 48.7 Kenya
... ... ... 51 31 20 39.0 MICS 2000 34.6 37.6 31.5 115 63 52 45.4 Lesotho
0.3 0.3 0.3 717 363 353 49.3 MICS 2000 37.7 39.0 36.3 871 451 420 48.2 Madagascar
... ... ... 362** 181** 181** 50.0** DHS 2000 24.3 25.7 22.9 474 251 223 47.0 Malawi
- - - - - - - … … … … … … … … … Mauritius
... ... ... 1,041 474 567 54.5 DHS 1997 50.0 46.8 53.2 1,293 608 685 53.0 Mozambique
... ... ... 81 45 36 44.1 DHS 2000 21.9 22.2 21.7 82 42 41 49.2 Namibia
... ... ... 206 109 97 46.9 MICS 2000 24.8 24.6 24.9 325 160 165 50.8 Rwanda
4.6 5.1 4.0 - - - 50.3 … … … … … … … … … Seychelles
... ... ... ... ... ... ... MICS 1999 89.2 88.4 89.9 1,580 785 795 50.3 Somalia
0.2 0.2 0.1 431 252 179 41.5 DHS 1998 6.5 7.2 5.9 461 255 206 44.7 South Africa
... ... ... 49 25 24 49.2 MICS 2000 28.5 28.3 28.7 60 30 30 50.3 Swaziland
... ... ... 3,181 1,599 1,582 49.7 DHS 1999 51.1 52.8 49.3 3,564 1,849 1,715 48.1 Tanzania, United Republic of
... ... ... ... ... ... ... DHS 2000/01 21.1 21.6 20.6 1,068 548 520 48.7 Uganda
... ... ... 689** 342** 347** 50.3** DHS 2001/02 32.0 32.0 32.0 660 331 329 49.9 Zambia
... ... ... 498 256 242 48.6 DHS 1999 14.5 15.2 13.7 369 194 175 47.4 Zimbabwe
West and Central Africa
0.2** 0.2** 0.1** 303** 81** 222** 73.4** DHS 2001 46.1 39.0 53.2 494 209 285 57.7 Benin
... ... ... 1,373** 626** 747** 54.4** DHS 1998/99 72.4 67.5 77.3 1,540 722 818 53.1 Burkina Faso
... ... ... ... ... ... ... MICS 2000 25.6 23.6 27.5 657 306 351 53.4 Cameroon
0.5 0.6 0.5 - - - 75.3 … … … … … … … … … Cape Verde
... ... ... ... ... ... ... MICS 2000 57.0 53.2 60.7 354 164 190 53.7 Central African Republic
... ... ... 577** 209** 368** 63.7** MICS 2000 60.7 54.3 67.2 841 376 465 55.3 Chad
... ... ... ... ... ... ... … … … … … … … … … Congo
... ... ... 955 350 605 63.3 MICS 2000 42.5 38.0 47.1 1,120 502 618 55.2 Côte d'Ivoire
... ... ... 5,290 2,609 2,682 50.7 MICS 2000 48.4 45.3 51.5 3,920 1,837 2,084 53.2 Democratic Republic of the Congo
... ... ... 9 3 7 72.0 MICS 2000 38.3 38.7 37.8 24 12 12 49.4 Equatorial Guinea
... ... ... 42** 21** 21** 50.8** DHS 2000/01 6.1 6.0 6.2 13 6 6 50.2 Gabon
... ... ... 53** 23** 30** 56.0** MICS 2000 47.2 44.9 49.6 96 46 50 52.3 Gambia
5.9 6.1 5.6 1,241 604 636 51.3 DHS 1998/99 24.9 24.9 25.0 792 398 394 49.8 Ghana
... ... ... 493 200 293 59.4 DHS 1999 60.3 54.3 66.5 780 356 424 54.3 Guinea
0.1 0.1 0.1 118 50 67 57.2 MICS 2000 58.8 55.6 62.0 127 60 67 52.9 Guinea-Bissau
7.6 8.0 7.1 142 50 91 64.4 … … … … … … … … … Liberia
... ... ... 1,207** 549** 658** 54.5** DHS 2001 60.6 55.0 66.4 1,192 547 645 54.1 Mali
... ... ... 145** 69** 75** 52.1** DHS 2000/01 55.9 54.1 57.6 243 118 125 51.5 Mauritania
... ... ... 1,244 569 675 54.3 MICS 2000 69.6 64.1 75.3 1,322 619 703 53.2 Niger
... ... ... ... ... ... ... DHS 2003 38.1 34.5 41.9 7,662 3,524 4,138 54.0 Nigeria
HOUSEHOLD SURVEY DATA
Out of school (thousands)3
Number of children
Enrolment data (administrative sources) Attendance data (household surveys)
Total Male Female %Female TotalYearSurvey Male FemaleTotal Male Female Total Male Female %Female
Out of school(thousands)
Children of primaryschool age (%)
Out of schoolIn pre-primary education
(included in"out of school")
Number of childrenChildren of primary school age (%)

Children Out of School: Measur ing Exclusion from Pr imary Education
74
M F GPI MF M F GPI
Education system
School
year
Primary
school
age group
School-age
population
(thousands)
TABLE A1. PRIMARY SCHOOL-AGE CHILDREN IN AND OUT OF SCHOOL. ADMINISTRATIVE AND
Country or territory
Enrolment data (administrative sources)
In school Out of schoolIn secondary education(included in "in school")
Total Male Female Total Male Female Total Male Female
Source
for global
and regional
estimates
Children of primary school age (%)
Sao Tome and Principe 2001/02 7 - 12 23 Enrolment 97.4** >99** 94.7** 1.6** 1.4** 1.8** 2.6** <1** 5.3**
Senegal 2001/02 7 - 12 1,590 Enrolment 58.4* 61.9* 54.8* x x x 41.6 38.1 45.2
Sierra Leone 2001/02 6 - 11 729 Attendance ... ... ... ... ... ... ... ... ...
Togo 2001/02 6 - 11 787 Attendance 91.4 >99 82.7 2.7 3.4 2.0 8.6 - 17.3
South Asia
Afghanistan, Islamic Republic of 2001/02 7 - 12 3,416 Enrolment2 ... ... ... ... ... ... ... ... ...
Bangladesh 2001/02 6 - 10 18,106 Attendance 90.0 88.8 91.2 3.4 3.1 3.7 10.0 11.2 8.8
Bhutan 2001/02 6 - 12 134 Enrolment 50.7 53.3 48.0 0.3 0.3 0.4 49.3 46.7 52.0
India 2001/02 6 - 10 116,032 Attendance 88.6* 95.7* 81.0* 5.9 6.3 5.4 11.4* 4.3* 19.0*
Maldives 2001/02 6 - 12 57 Enrolment 97.5* 97.0* 98.1* x x x 2.5 3.0 1.9
Nepal 2000/01 6 - 10 3,107 Attendance 73.2** 77.7** 68.4** x x x 26.8** 22.3** 31.6**
Pakistan 2000/01 5 - 9 19,894 Enrolment1 60.7** 67.6** 53.4** x x x 39.3** 32.4** 46.6**
Sri Lanka 2002/03 5 - 9 1,569 Enrolment1 >99* >99* >99* x x x <1 <1 -
East Asia and the Pacific
Brunei Darussalam 2001/02 6 - 11 42 Enrolment2 ... ... ... ... ... ... ... ... ...
Cambodia 2001/02 6 - 11 2,211 Attendance 86.4** 89.3** 83.4** 0.2 0.3 0.2 13.6** 10.7** 16.6**
China 2001/02 7 - 11 108,264 Enrolment 95.9** 95.6** 96.3** x x x 4.1** 4.4** 3.7**
Cook Islands 2000/01 5 - 10 … Enrolment1 ... ... ... ... ... ... ... ... ...
Democratic People's Republic of Korea 2001/02 6 - 9 1,639 Enrolment2 ... ... ... ... ... ... ... ... ...
Fiji 2001/02 6 - 11 106 Enrolment >99** >99** >99** 2.5** 2.4** 2.6** <1** <1** -
Indonesia 2001/02 7 - 12 26,082 Enrolment 96.3 96.7 95.9 4.2 4.1 4.2 3.7 3.3 4.1
Kiribati 2000/01 6 - 11 13 Enrolment1 98.9* 97.9* >99* x x x 1.1 2.1 -
Lao People's Democratic Republic 2001/02 6 - 10 743 Enrolment 82.8 86.1 79.4 - - - 17.2 13.9 20.6
Macao, China 2001/02 6 - 11 43 Enrolment 85.9 86.8 84.9 0.1 0.1 0.2 14.1 13.2 15.1
Malaysia 2001/02 6 - 11 3,178 Enrolment 95.2 95.1 95.3 - - - 4.8 4.9 4.7
Marshall Islands 2001/02 6 - 11 … Enrolment2 ... ... ... ... ... ... ... ... ...
Micronesia (Federated States of) 2001/02 6 - 11 17 Enrolment 95.8 91.9 >99 - - - 4.2 8.1 -
Mongolia 2001/02 8 - 11 244 Enrolment 90.1 88.2 92.0 3.5 2.9 4.1 9.9 11.8 8.0
Myanmar 2001/02 5 - 9 5,345 Enrolment 81.9 81.8 82.0 - - - 18.1 18.2 18.0
Nauru 1998/99 6 - 11 2 Enrolment1 81.0** 79.6** 82.4** - - - 19.0** 20.4** 17.6**
Niue 2001/02 5 - 10 .199 Enrolment 97.2 >99 94.1 - - - 2.8 - 5.9
Palau 2000/01 6 - 10 2 Enrolment1 96.6** >99 93.1** - - - 3.4** - 6.9**
Papua New Guinea 2001/02 7 - 12 856 Enrolment 73.0** 76.8** 68.9** - - - 27.0** 23.2** 31.1**
Philippines 2001/02 6 - 11 11,446 Enrolment 93.5 92.4 94.6 0.5 0.4 0.6 6.5 7.6 5.4
Samoa 2001/02 5 - 10 28 Enrolment 96.8 96.9 96.6 ... ... ... 3.2 3.1 3.4
Singapore 2001/02 6 - 11 384 Enrolment2 ... ... ... ... ... ... ... ... ...
Solomon Islands 2001/02 6 - 11 75 Enrolment2 ... ... ... ... ... ... ... ... ...
Thailand 2001/02 6 - 11 6,375 Enrolment 86.7** 88.0** 85.5** x x x 13.3** 12.0** 14.5**
Timor-Leste 2001/02 6 - 11 128 Enrolment2 ... ... ... ... ... ... ... ... ...
Tokelau 2001/02 5 - 10 … Enrolment2 ... ... ... ... ... ... ... ... ...
Tonga 2001/02 5 - 10 15 Enrolment 95.8 96.0 95.5 0.4 0.4 0.4 4.2 4.0 4.5
Tuvalu 2000/01 6 - 11 1 Enrolment1 97.9 >99 95.6 - - - 2.1 - 4.4
Vanuatu 2001/02 6 - 11 33 Enrolment 93.7 92.9 94.6 0.6 0.5 0.7 6.3 7.1 5.4
Viet Nam 2001/02 6 - 10 9,030 Enrolment 94.1** ... ... 0.1** ... ... 5.9** ... ...

Table A1. Primary school-age children in and out of school. Administrative and household survey data
75
F% F
Country or territory
- - - -** -** -** >90** MICS 2000 22.1 22.6 21.6 5 3 2 48.7 Sao Tome and Principe
... ... ... 661 305 356 53.8 MICS 2000 51.6 48.4 54.8 820 388 432 52.7 Senegal
... ... ... ... ... ... ... MICS 2000 59.1 57.2 61.0 431 207 224 52.0 Sierra Leone
- - - 68 - 68 >90 MICS 2000 36.6 32.3 40.9 288 128 160 55.7 Togo
South Asia
... ... ... ... ... ... ... … … … … … … … … … Afghanistan, Islamic Republic of
... ... ... 1,813 1,040 772 42.6 DHS 1999/00 20.7 21.6 19.8 3,756 2,009 1,747 46.5 Bangladesh
- - - 66 31 35 52.6 … … … … … … … … … Bhutan
... ... ... 13,186* 2,560 * 10,626 * 80.6 * MICS 2000 23.1 19.7 26.7 26,76211,798 14,964 55.9 India
1.3 1.4 1.3 1 - - 37.9 … … … … … … … … … Maldives
... ... ... 832** 358** 474** 56.9** MICS 2000 33.8 28.9 39.0 1,049 465 584 55.7 Nepal
... ... ... 7,813** 3,326** 4,487** 57.4** Survey 2000/01 43.4 38.1 49.1 8,641 3,914 4,728 54.7 Pakistan
- - - - - - - … … … … … … … … … Sri Lanka
East Asia and the Pacific
... ... ... ... ... ... ... … … … … … … … … … Brunei Darussalam
0.7** 0.6** 0.7** 301** 120** 181** 60.1** DHS 2000 34.7 34.2 35.3 768 383 385 50.1 Cambodia
... ... ... 4,447** 2,530** 1,917** 43.1** … … … … … … … … … China
... ... ... ... ... ... ... … … … … … … … … … Cook Islands
... ... ... ... ... ... ... … … … … … … … … … Democratic People's Republic of Korea
- - - -** -** - - … … … … … … … … … Fiji
... ... ... 962 434 528 54.9 DHS 2002/03 5.6 5.9 5.2 1,448 786 662 45.7 Indonesia
- - - - - - - … … … … … … … … … Kiribati
... ... ... 128 53 75 58.8 MICS 2000 37.9 35.5 40.4 282 134 147 52.3 Lao People's Democratic Republic
2.4 2.5 2.1 6 3 3 51.9 … … … … … … … … … Macao, China
... ... ... 153 80 73 47.7 … … … … … … … … … Malaysia
... ... ... ... ... ... ... … … … … … … … … … Marshall Islands
- - - - - - - … … … … … … … … … Micronesia (Federated States of)
... ... ... 24 15 10 39.5 MICS 2000 20.8 21.3 20.4 51 26 24 48.1 Mongolia
... ... ... 968 492 477 49.2 MICS 2000 20.5 20.6 20.5 1,096 555 541 49.4 Myanmar
... ... ... -** -** -** 46.0** … … … … … … … … … Nauru
- - - - - - >90 … … … … … … … … … Niue
- - - -** - -** >90** … … … … … … … … … Palau
... ... ... 231** 104** 127** 55.1** … … … … … … … … … Papua New Guinea
0.9 0.8 1.1 747 446 301 40.3 MICS 1999 18.1 19.3 16.9 2,072 1,127 944 45.6 Philippines
3.0 2.5 3.4 - - - 51.2 … … … … … … … … … Samoa
... ... ... ... ... ... ... … … … … … … … … … Singapore
... ... ... ... ... ... ... … … … … … … … … … Solomon Islands
7.0** 7.1** 6.8** 845** 388** 457** 54.1** … … … … … … … … … Thailand
... ... ... ... ... ... ... … … … … … … … … … Timor-Leste
... ... ... ... ... ... ... … … … … … … … … … Tokelau
2.5 4.0 0.9 - - - 51.2 … … … … … … … … … Tonga
- - - - - - >90 … … … … … … … … … Tuvalu
5.5 5.5 5.4 2 1 - 41.3 … … … … … … … … … Vanuatu
0.2** ... ... 532** ... ... ... MICS 2000 12.4 12.0 12.8 1,117 549 568 50.9 Viet Nam
HOUSEHOLD SURVEY DATA
Out of school (thousands)3
Number of children
Enrolment data (administrative sources) Attendance data (household surveys)
Total Male Female %Female TotalYearSurvey Male FemaleTotal Male Female Total Male Female %Female
Out of school(thousands)
Children of primaryschool age (%)
Out of schoolIn pre-primary education
(included in"out of school")
Number of childrenChildren of primary school age (%)

Children Out of School: Measur ing Exclusion from Pr imary Education
76
M F GPI MF M F GPI
Education system
School
year
Primary
school
age group
School-age
population
(thousands)
TABLE A1. PRIMARY SCHOOL-AGE CHILDREN IN AND OUT OF SCHOOL. ADMINISTRATIVE AND
Country or territory
Enrolment data (administrative sources)
In school Out of schoolIn secondary education(included in "in school")
Total Male Female Total Male Female Total Male Female
Source
for global
and regional
estimates
Children of primary school age (%)
Latin America and the Caribbean
Anguilla 2001/02 5 - 11 1 Enrolment 97.8 97.1 98.5 1.2 0.8 1.5 2.2 2.9 1.5
Antigua and Barbuda 2001/02 5 - 11 … Enrolment2 ... ... ... ... ... ... ... ... ...
Argentina 2001/02 6 - 11 4,098 Enrolment >99 >99 >99 0.5 0.5 0.5 <1 - <1
Aruba 2001/02 6 - 11 9 Enrolment 96.7 97.4 96.0 - - 0.1 3.3 2.6 4.0
Bahamas 2001/02 5 - 10 37 Enrolment 92.9** 90.9** 95.1** 6.6** 5.7** 7.5** 7.1** 9.1** 4.9**
Barbados 2001/02 5 - 10 22 Enrolment 97.7 97.4 97.9 - - - 2.3 2.6 2.1
Belize 2000/01 5 - 10 38 Enrolment1 97.9** 97.5** 98.2** 1.6 1.4 1.9 2.1** 2.5** 1.8**
Bermuda 2001/02 5 - 10 … Enrolment2 ... ... ... ... ... ... ... ... ...
Bolivia 2001/02 6 - 11 1,321 Enrolment 95.7* 95.5* 96.0* x x x 4.3 4.5 4.0
Brazil 2001/02 7 - 10 13,287 Enrolment 94.5 93.6 95.5 0.8 0.7 0.9 5.5 6.4 4.5
British Virgin Islands 2001/02 5 - 11 3 Enrolment 94.2* 94.8* 93.6* 3.2** 3.0** 3.5** 5.8 5.2 6.4
Cayman Islands 2001/02 5 - 10 … Enrolment2 ... ... ... ... ... ... ... ... ...
Chile 2002/03 6 - 11 1,754 Enrolment1 ... ... ... ... ... ... ... ... ...
Colombia 2001/02 6 - 10 4,684 Enrolment 89.4 89.7** 89.1** 2.7 2.5** 2.8** 10.6 10.3** 10.9**
Costa Rica 2001/02 6 - 11 510 Enrolment 90.8 90.0 91.5 0.1 0.1 0.2 9.2 10.0 8.5
Cuba 2001/02 6 - 11 969 Enrolment 97.1 97.4 96.7 1.4 1.2 1.5 2.9 2.6 3.3
Dominica 2001/02 5 - 11 … Enrolment2 ... ... ... ... ... ... ... ... ...
Dominican Republic 2001/02 6 - 11 1,110 Enrolment 97.3 98.5 96.0 13.2 12.6 13.7 2.7 1.5 4.0
Ecuador 2001/02 6 - 11 1,696 Enrolment >99 98.9 >99 1.8 1.7 1.9 <1 1.1 -
El Salvador 2001/02 7 - 12 866 Enrolment 90.7 90.6 90.9 1.8 1.6 2.0 9.3 9.4 9.1
Grenada 2000/01 5 - 11 17 Enrolment1 86.0** 91.0** 81.0** x x x 14.0** 9.0** 19.0**
Guatemala 2001/02 7 - 12 1,913 Enrolment 85.0 86.9 82.9 - - - 15.0 13.1 17.1
Guyana 2000/01 6 - 11 90 Enrolment1 98.1 98.5 97.7 4.1 3.9 4.3 1.9 1.5 2.3
Haiti 2001/02 6 - 11 1,254 Attendance ... ... ... ... ... ... ... ... ...
Honduras 2001/02 7 - 12 1,054 Enrolment 87.4** 86.7** 88.3** - - - 12.6** 13.3** 11.7**
Jamaica 2001/02 6 - 11 328 Enrolment 95.9 95.7 96.1 0.7 0.6 0.9 4.1 4.3 3.9
Mexico 2001/02 6 - 11 13,452 Enrolment >99* 98.3* >99* 2.1** 2.0** 2.3** <1 1.7 <1
Montserrat 1999/00 5 - 11 … Enrolment1 ... ... ... ... ... ... ... ... ...
Netherlands Antilles 2001/02 6 - 11 22 Enrolment 88.9 86.6 91.3 0.6 0.6 0.5 11.1 13.4 8.7
Nicaragua 2001/02 7 - 12 829 Enrolment 86.7 86.0 87.4 4.8 4.4 5.2 13.3 14.0 12.6
Panama 2001/02 6 - 11 371 Enrolment >99* >99* >99* 1.0** 0.9** 1.1** <1 <1 <1
Paraguay 2001/02 6 - 11 864 Enrolment 92.0* 91.6* 92.3* 0.5** 0.4** 0.5** 8.0 8.4 7.7
Peru 2001/02 6 - 11 3,600 Enrolment >99 >99 >99 1.9 1.9 2.0 <1 <1 -
Saint Kitts and Nevis 2000/01 5 - 11 6 Enrolment1 86.2 81.5 91.5 4.6 3.4 6.1 13.8 18.5 8.5
Saint Lucia 2001/02 5 - 11 22 Enrolment 99.0** >99** 98.4** 0.9** 0.6** 1.2** 1.0** <1** 1.6**
Saint Vincent and the Grenadines 2001/02 5 - 11 18 Enrolment 96.5** 95.9** 97.2** 4.6 3.6 5.6 3.5** 4.1** 2.8**
Suriname 2001/02 6 - 11 51 Enrolment 98.6* 97.3* >99* x x x 1.4 2.7 -
Trinidad and Tobago 2001/02 5 - 11 147 Enrolment 91.4** 90.5** 92.4** 4.6** 4.2** 5.1** 8.6** 9.5** 7.6**
Turks and Caicos Islands 2001/02 6 - 11 2 Enrolment 91.3 91.7 90.9 3.3 3.8 2.8 8.7 8.3 9.1
Uruguay 2001/02 6 - 11 332 Enrolment ... ... ... ... ... ... ... ... ...
Venezuela 2001/02 6 - 11 3,310 Enrolment 94.2 93.7 94.8 1.9 1.6 2.1 5.8 6.3 5.2

Table A1. Primary school-age children in and out of school. Administrative and household survey data
77
F% F
Country or territory
Latin America and the Caribbean
0.1 0.1 0.1 - - - 34.4 … … … … … … … … … Anguilla
... ... ... ... ... ... ... … … … … … … … … … Antigua and Barbuda
- - - 8 - 8 >90 … … … … … … … … … Argentina
2.8 2.6 3.1 - - - 60.5 … … … … … … … … … Aruba
0.7** 0.7** 0.6** 3** 2** -** 34.3** … … … … … … … … … Bahamas
2.1 2.6 1.7 - - - 44.4 … … … … … … … … … Barbados
0.2** 0.2** 0.2** -** -** -** 40.7** … … … … … … … … … Belize
... ... ... ... ... ... ... … … … … … … … … … Bermuda
3.5 3.5 3.5 56 31 26 45.8 MICS 2000 8.3 7.5 9.1 110 50 59 54.1 Bolivia
4.8 5.1 4.5 728 431 297 40.8 DHS 1996 4.5 4.5 4.5 599 305 294 49.1 Brazil
4.3 5.2 3.5 - - - 54.6 … … … … … … … … … British Virgin Islands
... ... ... ... ... ... ... … … … … … … … … … Cayman Islands
... ... ... ... ... ... ... … … … … … … … … … Chile
2.2 2.2** 2.2** 497 247** 250** 50.3** DHS 2000 7.5 8.0 7.0 352 190 162 45.9 Colombia
4.7 4.7 4.6 47 26 21 44.6 … … … … … … … … … Costa Rica
- - - 28 13 16 54.8 … … … … … … … … … Cuba
... ... ... ... ... ... ... … … … … … … … … … Dominica
1.4 1.5 1.3 30 9 22 71.2 MICS 2000 7.6 8.4 6.7 84 48 36 43.4 Dominican Republic
- - - 10 10 - - … … … … … … … … … Ecuador
1.9 2.0 1.9 80 41 39 48.4 … … … … … … … … … El Salvador
... ... ... 2** -** 2** 67.5** … … … … … … … … … Grenada
1.8 1.7 1.8 288 128 160 55.5 DHS 1998/99 22.2 20.2 24.2 424 198 227 53.4 Guatemala
1.4 1.5 1.4 2 - 1 61.0 MICS 2000 3.5 3.9 3.0 3 2 1 42.4 Guyana
... ... ... ... ... ... ... DHS 2000 45.7 47.8 43.4 572 304 269 46.9 Haiti
... ... ... 132** 72** 61** 45.9** … … … … … … … … … Honduras
0.3 0.3 0.3 13 7 6 46.6 … … … … … … … … … Jamaica
0.1 0.1 0.1 121 113 7 <10 … … … … … … … … … Mexico
... ... ... ... ... ... ... … … … … … … … … … Montserrat
1.2 1.5 1.0 2 1 - 38.8 … … … … … … … … … Netherlands Antilles
... ... ... 110 59 51 46.4 DHS 2001 19.6 22.7 16.5 163 96 67 41.3 Nicaragua
0.7 0.7 0.7 3 1 2 57.7 … … … … … … … … … Panama
1.8 1.9 1.7 70 37 33 47.2 … … … … … … … … … Paraguay
- - - 5 5 - - DHS 2000 4.5 4.1 4.9 163 76 88 53.7 Peru
6.3 4.2 8.5 - - - 29.6 … … … … … … … … … Saint Kitts and Nevis
0.5** 0.5** 0.5** -** -** -** 75.6** … … … … … … … … … Saint Lucia
- - - -** -** -** 39.6** … … … … … … … … … Saint Vincent and the Grenadines
- - - - - - - MICS 1999/00 10.5 11.8 9.0 5 3 2 42.4 Suriname
1.1** 1.4** 0.9** 13** 7** 6** 43.8** MICS 2000 4.5 4.9 4.1 7 4 3 44.9 Trinidad and Tobago
2.3 3.0 1.5 - - - 52.2 … … … … … … … … … Turks and Caicos Islands
... ... ... ... ... ... ... … … … … … … … … … Uruguay
2.4 2.5 2.4 191 107 84 43.9 MICS 2000 6.5 7.4 5.5 214 125 89 41.5 Venezuela
HOUSEHOLD SURVEY DATA
Out of school (thousands)3
Number of children
Enrolment data (administrative sources) Attendance data (household surveys)
Total Male Female %Female TotalYearSurvey Male FemaleTotal Male Female Total Male Female %Female
Out of school(thousands)
Children of primaryschool age (%)
Out of schoolIn pre-primary education
(included in"out of school")
Number of childrenChildren of primary school age (%)

Children Out of School: Measur ing Exclusion from Pr imary Education
78
M F GPI MF M F GPI
Education system
School
year
Primary
school
age group
School-age
population
(thousands)
TABLE A1. PRIMARY SCHOOL-AGE CHILDREN IN AND OUT OF SCHOOL. ADMINISTRATIVE AND
Country or territory
Enrolment data (administrative sources)
In school Out of schoolIn secondary education(included in "in school")
Total Male Female Total Male Female Total Male Female
Source
for global
and regional
estimates
Children of primary school age (%)
Industrialised countries
Andorra 2001/02 6 - 11 … Enrolment2 ... ... ... ... ... ... ... ... ...
Australia 2002/03 5 - 11 1,866 Enrolment1 95.2* 94.8* 95.6* 0.2** 0.1** 0.2** 4.8 5.2 4.4
Austria 2001/02 6 - 9 375 Enrolment ... ... ... - - - ... ... ...
Belgium 2001/02 6 - 11 730 Enrolment >99* >99* >99* 0.3** 0.2** 0.3** <1 <1 <1
Canada 2000/01 6 - 11 2,466 Enrolment1 >99** >99** >99** - - - <1** <1** <1**
Cyprus 2001/02 6 - 11 65 Enrolment 98.5 98.2 98.8 2.6 2.5 2.6 1.5 1.8 1.2
Czech Republic 2001/02 6 - 10 583 Enrolment ... ... ... - - - ... ... ...
Denmark 2001/02 7 - 12 397 Enrolment >99 >99 >99 - - - <1 <1 -
Estonia 2001/02 7 - 12 107 Enrolment 98.8 98.7 99.0 3.0 2.3 3.7 1.2 1.3 1.0
Finland 2001/02 7 - 12 385 Enrolment >99 >99 >99 0.1 - 0.2 <1 <1 <1
France 2001/02 6 - 10 3,638 Enrolment >99* >99* >99* 0.6** 0.6** 0.7** <1 <1 <1
Germany 1999/00 6 - 9 3,479 Enrolment1 ... ... ... - - - ... ... ...
Greece 2001/02 6 - 11 652 Enrolment >99* >99* >99* x x x <1 <1 <1
Hong Kong, SAR (China) 2001/02 6 - 11 461 Enrolment >99** >99** >99** 4.2** 4.1** 4.3** <1** <1** <1**
Hungary 2001/02 7 - 10 474 Enrolment 98.8 98.4 >99 8.0 7.0 9.1 1.2 1.6 <1
Iceland 2001/02 6 - 12 32 Enrolment >99 >99 >99 - - 0.1 <1 <1 <1
Ireland 2001/02 4 - 11 425 Enrolment 95.5 94.7 96.3 - - - 4.5 5.3 3.7
Israel 2001/02 6 - 11 671 Enrolment 98.0 97.9 98.1 - 0.1 - 2.0 2.1 1.9
Italy 2001/02 6 - 10 2,770 Enrolment >99 >99 >99 0.9 0.8 0.9 <1 <1 <1
Japan 2001/02 6 - 11 7,273 Enrolment >99 >99 >99 - - - <1 <1 -
Latvia 2001/02 7 - 10 119 Enrolment 89.2* 88.6* 89.8* 1.6** 1.3** 1.9** 10.8 11.4 10.2
Lithuania 2001/02 7 - 10 195 Enrolment 97.0 97.0 97.0 2.7 2.3 3.1 3.0 3.0 3.0
Luxembourg 2001/02 6 - 11 34 Enrolment 97.1 97.1 97.1 0.9 0.9 0.9 2.9 2.9 2.9
Malta 2001/02 5 - 10 31 Enrolment 95.4 95.4 95.5 - - - 4.6 4.6 4.5
Monaco 2001/02 6 - 10 … Enrolment2 ... ... ... ... ... ... ... ... ...
Netherlands 2001/02 6 - 11 1,195 Enrolment >99* >99* 98.8* 0.1** 0.1** 0.1** <1 - 1.2
New Zealand 2002/03 5 - 10 356 Enrolment >99** >99** >99** 0.2 0.2 0.2 <1** <1** <1**
Norway 2001/02 6 - 12 424 Enrolment >99 >99 >99 - - - <1 <1 <1
Poland 2001/02 7 - 12 3,114 Enrolment 98.2* 98.0* 98.3* x x x 1.8 2.0 1.7
Portugal 2001/02 6 - 11 663 Enrolment 99.0 98.7 >99 0.8 0.8 0.9 1.0 1.3 <1
Republic of Korea 2002/03 6 - 11 3,994 Enrolment1 >99 >99 >99 0.2 0.2 0.2 <1 <1 <1
San Marino 2001/02 6 - 10 … Enrolment2 ... ... ... ... ... ... ... ... ...
Slovakia 2001/02 6 - 9 280 Enrolment ... ... ... - - - ... ... ...
Slovenia 2001/02 7 - 10 83 Enrolment 95.3 95.2 95.3 2.2 1.8 2.6 4.7 4.8 4.7
Spain 2001/02 6 - 11 2,321 Enrolment >99 >99 >99 - - - <1 <1 <1
Sweden 2001/02 7 - 12 712 Enrolment >99 >99 >99 - - - <1 <1 <1
Switzerland 2001/02 7 - 12 500 Enrolment >99 >99 >99 4.1 3.7 4.4 <1 <1 <1
United Kingdom 2001/02 5 - 10 4,522 Enrolment >99 >99 >99 - - - <1 <1 <1
United States 2001/02 6 - 11 25,314 Enrolment 93.7 93.1 94.4 1.0 0.9 1.1 6.3 6.9 5.6

Table A1. Primary school-age children in and out of school. Administrative and household survey data
79
F% F
Country or territory
Industrialised countries
... ... ... ... ... ... ... … … … … … … … … … Andorra
4.4 4.4 4.4 90 50 40 44.3 … … … … … … … … … Australia
... ... ... ... ... ... ... … … … … … … … … … Austria
0.8 1.0 0.6 7 4 3 47.1 … … … … … … … … … Belgium
... ... ... 10** 6** 4** 36.3** … … … … … … … … … Canada
0.4 0.5 0.3 - - - 40.0 … … … … … … … … … Cyprus
... ... ... ... ... ... ... … … … … … … … … … Czech Republic
- - - - - - - … … … … … … … … … Denmark
... ... ... 1 - - 42.1 … … … … … … … … … Estonia
0.2 0.3 0.1 - - - 32.5 … … … … … … … … … Finland
0.3 0.3 0.2 11 8 3 31.3 … … … … … … … … … France
... ... ... ... ... ... ... … … … … … … … … … Germany
... ... ... 4 2 2 50.4 … … … … … … … … … Greece
0.5** 0.5** 0.4** 2** 1** 1** 47.9** … … … … … … … … … Hong Kong, SAR (China)
1.0 1.2 0.8 6 4 2 33.5 … … … … … … … … … Hungary
... ... ... - - - 66.7 … … … … … … … … … Iceland
0.4 0.3 0.4 19 12 8 39.8 … … … … … … … … … Ireland
1.8 2.1 1.6 13 7 6 45.8 … … … … … … … … … Israel
0.3 0.3 0.2 12 4 8 63.7 … … … … … … … … … Italy
- - - 2 2 - - … … … … … … … … … Japan
1.5 1.7 1.2 13 7 6 46.0 … … … … … … … … … Latvia
1.6 1.8 1.4 6 3 3 48.7 … … … … … … … … … Lithuania
0.8 0.9 0.7 - - - 49.4 … … … … … … … … … Luxembourg
4.4 4.6 4.2 1 - - 48.0 … … … … … … … … … Malta
... ... ... ... ... ... ... … … … … … … … … … Monaco
- - - 7 - 7 >90 … … … … … … … … … Netherlands
0.4** 0.4** 0.4** 3** -** 2** 67.6** … … … … … … … … … New Zealand
0.1 0.1 0.1 1 - - 28.1 … … … … … … … … … Norway
0.3 0.3 0.2 57 31 26 44.9 … … … … … … … … … Poland
0.6 0.5 0.7 7 4 2 35.6 … … … … … … … … … Portugal
- - - 6 - 6 >90 … … … … … … … … … Republic of Korea
... ... ... ... ... ... ... … … … … … … … … … San Marino
... ... ... ... ... ... ... … … … … … … … … … Slovakia
... ... ... 4 2 2 48.0 … … … … … … … … … Slovenia
- 0.1 - 9 1 8 85.7 … … … … … … … … … Spain
0.2 0.3 0.1 3 - 2 71.8 … … … … … … … … … Sweden
0.3 0.3 0.2 2 - - 48.5 … … … … … … … … … Switzerland
- - - 2 - 2 >90 … … … … … … … … … United Kingdom
2.0 2.6 1.4 1,593 897 695 43.7 … … … … … … … … … United States
HOUSEHOLD SURVEY DATA
Out of school (thousands)3
Number of children
Enrolment data (administrative sources) Attendance data (household surveys)
Total Male Female %Female TotalYearSurvey Male FemaleTotal Male Female Total Male Female %Female
Out of school(thousands)
Children of primaryschool age (%)
Out of schoolIn pre-primary education
(included in"out of school")
Number of childrenChildren of primary school age (%)
Notes:
1) Enrolment presented here differs from those used in global and regional estimates. The latter are adjusted to match the 2001/02 school year.2) Global and regional estimates are based on non-publishable UIS enrolment estimates.3) Adjusted to year of administrative data.** UIS estimation.* Secondary component is UIS estimation.- Magnitude nil or negligible. For % out of school: less than 1%. For out of school: less than 1,000.x Secondary education cannot be reported separtely but is included in total.
… Missing value.

Children Out of School: Measur ing Exclusion from Pr imary Education
80
F MF M F GPI
Children in school at Children out of school at Children per single-yearcohort expected to
TABLE A2. CHILDREN IN AND OUT OF SCHOOL BY AGE
Country or territory2 School starting ageAge with the highest
enrolment rateSchool starting age Age with the highest
enrolment rateEnter late Never enter
% % % %%%(Grade
correspondingto age)
Central and Eastern Europe / Commonwealth of Independent States (CIS)
Albania 81.9** >99** 4 18.1** - ** 18.1** -**
Armenia 84.7 89.3 2 15.3 10.7 4.6 10.7
Azerbaijan 58.4 87.5 3 41.6 12.5 29.0 12.5
Belarus 87.7 >99 2 12.3 - 12.3 -
Bosnia and Herzegovina … … … … … … …
Bulgaria 90.2 93.3 4 9.8 6.7 3.1 6.7
Croatia 95.9 >99 4 4.1 - 4.1 -
Georgia 76.6 97.9 4 23.4 2.1 21.3 2.1
Kazakhstan 97.6 >99 2 2.4 - 2.4 -
Kyrgyzstan 97.0 98.5 3 3.0 1.5 1.5 1.5
Moldova, Republic of 80.5 84.1 2 19.5 15.9 3.6 15.9
Romania 94.4 94.4 1 5.6 5.6 - 5.6
Russian Federation … … … … … … …
Serbia and Montenegro 8.1 >99 4 91.9 - 91.9 -
Tajikistan >99 >99 4 - - - -
The Former Yugoslav Rep. of Macedonia 95.1 >99 4 4.9 - 4.7 -
Turkey 81.6** 91.4** 2 18.4** 8.6 ** 9.9** 8.6 **
Turkmenistan … … … … … … …
Ukraine 60.9 90.5 3 39.1 9.5 29.6 9.5
Uzbekistan1 >99 >99 4 - - - -
Middle East and North Africa
Algeria 93.7 >99 2 6.3 - 6.3 -
Bahrain 83.0** >99** 6 17.0** - ** 16.4** - **
Djibouti 33.2** 38.1** 2 66.8** 61.9 ** 4.9** 61.9 **
Egypt 91.4** 95.1** 5 8.6** 4.9 ** 3.7** 4.9 **
Iran, Islamic Republic of 80.2 92.2 5 19.8 7.8 12.0 7.8
Iraq1 93.6 96.7 4 6.4 3.3 3.1 3.3
Jordan 98.3 98.3 1 1.7 1.7 - 1.7
Kuwait 83.2 92.7 2 16.8 7.3 9.5 7.3
Lebanon 90.4** 93.4** 4 9.6** 6.6 ** 3.0** 6.6 **
Libyan Arab Jamahiriya … … … … … … …
Morocco 86.3 92.9 3 13.7 7.1 6.6 7.1
Oman 68.5 80.4 6 31.5 19.6 11.9 19.6
Palestinian Autonomous Territories 94.6 >99 3 5.4 - 5.4 -
Qatar 96.3 >99 3 3.7 - 3.7 -
Saudi Arabia 47.3 63.5 4 52.7 36.5 16.2 36.5
Sudan 29.4** 58.6** 4 70.6** 41.4 ** 29.2** 41.4 **
Syrian Arab Republic >99 >99 1 - - - -
Tunisia 95.5 >99 3 4.5 - 4.5 -
United Arab Emirates 88.5 90.4 2 11.5 9.6 1.9 9.6
Yemen1 48.5** 75.2** 2 51.5** 24.8 ** 26.7** 24.8 **

Table A2. Children in and out of school by age
81
F MF M F GPI
Children in school at Children out of school at Children per single-yearcohort expected to
Country or territory2 School starting age Age with the highestenrolment rate
School starting age Age with the highestenrolment rate
Enter late Never enter
% % % %%%(Grade
correspondingto age)
Eastern and Southern Africa
Angola 17.3** 40.3** 4 82.7** 59.7 ** 23.0** 59.7 **
Botswana 26.1 94.0 6 73.9 6.0 67.9 6.0
Burundi 46.1** 58.7** 3 53.9** 41.3 ** 12.6** 41.3 **
Comoros 24.1** 65.7** 5 75.9** 34.3 ** 41.7** 34.3 **
Eritrea 37.0 45.4 2 63.0 54.6 8.4 54.6
Ethiopia 30.7 59.4 4 69.3 40.6 28.7 40.6
Kenya 37.3** 80.0** 5 62.7** 20.0 ** 42.7** 20.0 **
Lesotho 69.2 90.8 2 30.8 9.2 21.6 9.2
Madagascar 60.7 77.5 5 39.3 22.5 16.8 22.5
Malawi 68.3 89.9 4 31.7 10.1 21.6 10.1
Mauritius 96.2 >99 5 3.8 - 3.8 -
Mozambique 34.2 69.9 5 65.8 30.1 35.8 30.1
Namibia 34.3 98.1 6 65.7 1.9 63.9 1.9
Rwanda 83.2 86.8 4 16.8 13.2 3.7 13.2
Seychelles 66.8 >99 4 33.2 - 33.2 -
Somalia … … … … … … …
South Africa 86.5 >99 4 13.5 - 13.5 -
Swaziland 53.6 86.2 6 46.4 13.8 32.5 13.8
Tanzania, United Republic of 30.3 65.3 5 69.7 34.7 35.0 34.7
Uganda … … … … … … …
Zambia 46.0** 76.1** 4 54.0** 23.9 ** 30.1** 23.9 **
Zimbabwe 50.0 88.5 5 50.0 11.5 38.6 11.5
West and Central Africa
Benin1 64.1** 84.0** 2 35.9** 16.0 ** 19.9** 16.0 **
Burkina Faso 38.3** 40.1** 2 61.7** 59.9 ** 1.7** 59.9 **
Cameroon … … … … … … …
Cape Verde 74.5 >99 5 25.5 - 25.5 -
Central African Republic … … … … … … …
Chad 38.7 67.3 3 61.3 32.7 28.5 32.7
Congo … … … … … … …
Côte d'Ivoire 62.4 71.1 2 37.6 28.9 8.7 28.9
Democratic Republic of the Congo 29.2 38.6 5 70.8 61.4 9.5 61.4
Equatorial Guinea 97.6 97.6 1 2.4 2.4 - 2.4
Gabon 20.5** >99** 6 79.5** - ** 79.5** - **
Gambia 61.2** 79.3** 2 38.8** 20.7 ** 18.1** 20.7 **
Ghana 37.1 72.8 6 62.9 27.2 35.8 27.2
Guinea 43.2 71.6 4 56.8 28.4 28.5 28.4
Guinea-Bissau 34.7 54.0 4 65.3 46.0 19.4 46.0
Liberia 12.2 >99 4 87.8 - 87.8 -
Mali 33.4** 47.4** 3 66.6** 52.6 ** 14.0** 52.6 **
Mauritania 35.6** 80.7** 3 64.4** 19.3 ** 45.2** 19.3 **
Niger 51.1 51.1 1 48.9 48.9 - 48.9
Nigeria … … … … … … …

Children Out of School: Measur ing Exclusion from Pr imary Education
82
F MF M F GPI
Children in school at Children out of school at Children per single-yearcohort expected to
TABLE A2. CHILDREN IN AND OUT OF SCHOOL BY AGE
Country or territory2 School starting ageAge with the highest
enrolment rateSchool starting age Age with the highest
enrolment rateEnter late Never enter
% % % %%%(Grade
correspondingto age)
Sao Tome and Principe 90.2** >99** 4 9.8** - ** 9.8** - **
Senegal 28.9 77.5 6 71.1 22.5 48.6 22.5
Sierra Leone … … … … … … …
Togo1 82.2 >99 5 17.8 - 17.8 -
South Asia
Afghanistan, Islamic Republic of … … … … … … …
Bangladesh1 97.9 >99 2 2.1 - 2.1 -
Bhutan … … … … … … …
India1 >99 >99 1 - - - -
Maldives 85.5 >99 6 14.5 - 14.5 -
Nepal1 63.3** 74.0** 2 36.7** 26.0 ** 10.7** 26.0 **
Pakistan 65.5** 65.5** 1 34.5** 34.5 ** -** 34.5 **
Sri Lanka >99 >99 4 - - - -
East Asia and the Pacific
Brunei Darussalam … … … … … … …
Cambodia1 61.0** 95.0** 6 39.0** 5.0 ** 34.0** 5.0 **
China 88.9 99.0 5 11.1 1.0 10.1 1.0
Cook Islands … … … … … … …
Democratic People's Republic of Korea … … … … … … …
Fiji 95.7** >99** 3 4.3** - ** 4.3** - **
Indonesia 97.1 >99 2 2.9 - 2.9 -
Kiribati … … … … … … …
Lao People's Democratic Republic 75.2 87.5 2 24.8 12.5 12.3 12.5
Macao, China 74.1 89.3 2 25.9 10.7 15.2 10.7
Malaysia 92.9 97.4 5 7.1 2.6 4.6 2.6
Marshall Islands >99 >99 2 - - - -
Micronesia (Federated States of) … … … … … … …
Mongolia 80.4 93.2 3 19.6 6.8 12.9 6.8
Myanmar 93.2 93.2 1 6.8 6.8 - 6.8
Nauru 71.3** 95.4** 6 28.7** 4.6 ** 24.1** 4.6 **
Niue >99 >99 3 - - - -
Palau 97.2** >99** 4 2.8** - ** 2.8** - **
Papua New Guinea 87.2** 87.2** 1 12.8** 12.8 ** -** 12.8 **
Philippines 51.2 >99 4 48.8 - 48.8 -
Samoa 87.9 >99 4 12.1 - 12.1 -
Singapore … … … … … … …
Solomon Islands … … … … … … …
Thailand 54.1** 93.7** 3 45.9** 6.3 ** 39.6** 6.3 **
Timor-Leste … … … … … … …
Tokelau … … … … … … …
Tonga 96.6 >99 5 3.4 - 3.4 -
Tuvalu 95.7 >99 4 4.3 - 4.3 -
Vanuatu 66.3 >99 2 33.7 - 33.7 -
Viet Nam 88.6** 98.2** 3 11.4** 1.8 ** 9.7** 1.8 **

Table A2. Children in and out of school by age
83
F MF M F GPI
Children in school at Children out of school at Children per single-yearcohort expected to
Country or territory2 School starting age Age with the highestenrolment rate
School starting age Age with the highestenrolment rate
Enter late Never enter
% % % %%%(Grade
correspondingto age)
Latin America and the Caribbean
Anguilla 98.9 >99 5 1.1 - 1.1 -
Antigua and Barbuda … … … … … … …
Argentina >99 >99 4 - - - -
Aruba 87.1 >99 4 12.9 - 12.9 -
Bahamas 83.6** >99** 6 16.4** - ** 16.4** - **
Barbados 87.0 >99 5 13.0 - 13.0 -
Belize 92.0** >99** 6 8.0** - ** 8.0** - **
Bermuda >99** >99** 2 -** - ** -** - **
Bolivia 76.4 >99 5 23.6 - 23.6 -
Brazil 84.3 >99 2 15.7 - 15.7 -
British Virgin Islands 93.0 >99 6 7.0 - 7.0 -
Cayman Islands … … … … … … …
Chile … … … … … … …
Colombia 75.9 96.4 5 24.1 3.6 20.5 3.6
Costa Rica 61.3 98.7 3 38.7 1.3 37.3 1.3
Cuba 96.7 >99 6 3.3 - 3.3 -
Dominica 90.1 98.9 4 9.9 1.1 8.8 1.1
Dominican Republic 77.8 >99 5 22.2 - 22.2 -
Ecuador 98.8 >99 3 1.2 - 1.2 -
El Salvador 75.8 97.6 5 24.2 2.4 21.8 2.4
Grenada 55.3 >99 5 44.7 - 44.7 -
Guatemala 81.6 92.2 4 18.4 7.8 10.7 7.8
Guyana >99** >99** 1 -** - ** -** - **
Haiti … … … … … … …
Honduras 87.5** 97.3** 2 12.5** 2.7 ** 9.7** 2.7 **
Jamaica 96.9 >99 2 3.1 - 3.1 -
Mexico >99 >99 4 - - - -
Montserrat >99 >99 4 - - - -
Netherlands Antilles 78.2 94.1 6 21.8 5.9 15.9 5.9
Nicaragua 83.2 90.9 4 16.8 9.1 7.8 9.1
Panama 97.7 >99 2 2.3 - 2.3 -
Paraguay 73.9 98.5 5 26.1 1.5 24.6 1.5
Peru >99 >99 3 - - - -
Saint Kitts and Nevis 31.7 >99 6 68.3 - 68.3 -
Saint Lucia 98.7** >99** 6 1.3** - ** 1.3** - **
Saint Vincent and the Grenadines 59.4** >99** 3 40.6** - ** 40.6** - **
Suriname 97.0** >99** 4 3.0** - ** 3.0** - **
Trinidad and Tobago 94.7** >99** 3 5.3** - ** 5.3** - **
Turks and Caicos Islands 85.9 >99 6 14.1 - 14.1 -
Uruguay … … … … … … …
Venezuela 79.3 >99 3 20.7 - 19.9 -
Notes:
1) Household survey data. See Table A1 for source.2) Year of reference, see Table A1.** UIS estimation.
- Magnitude nil or negligible. For % out of school: less than 1%. For out of school: less than 1,000.… Missing value.

Children Out of School: Measur ing Exclusion from Pr imary Education
84
M F GPI MF M F GPI
Survey,
year
Net
attendance
rate (%)
TABLE A3. NET ATTENDANCE RATE AND SHARE OF CHILDREN OUT OF SCHOOL BY BACKGROUND
Country or territory
Share of primary school-age children out of school (%)
Total Male Urban Rural Poorestquintile
Secondquintile
Thirdquintile
Fourthquintile
Richestquintile
Mother hasno formaleducation
Mother hasformal
educationFemale
Central and Eastern Europe / Commonwealth of Independent States (CIS)
Armenia DHS 2000 97.0 3.0 3.3 2.6 2.3 3.7 2.7 2.9 4.0 1.9 3.9 0.9 3.0
Azerbaijan MICS 2000 90.9 9.1 9.2 9.0 8.4 9.8 11.3 8.1 10.7 8.2 6.4 16.3 9.0
Bosnia and Herzegovina MICS 2000 86.2 13.8 12.7 14.9 13.3 14.1 … … … … … 20.0 13.6
Kazakhstan DHS 1999 98.5 1.5 1.7 1.3 0.7 2.0 3.0 2.7 0.1 0.8 0.6 1.0 1.6
Kyrgyzstan DHS 1997 94.9 5.1 4.9 5.2 6.0 4.7 … … … … … … …
Moldova, Republic of MICS 2000 98.4 1.6 2.0 1.1 1.0 1.9 4.1 1.2 1.1 2.1 - - 1.6
Tajikistan MICS 2000 80.7 19.3 20.0 18.5 19.9 19.1 20.1 18.1 22.2 18.1 17.7 24.1 19.1
Turkey DHS 2003 88.4 11.6 10.8 12.4 … … … … … … … … …
Uzbekistan MICS 2000 80.3 19.7 19.2 20.1 16.5 21.0 23.0 21.0 19.2 19.7 14.6 33.3 19.6
Middle East and North Africa
Algeria MICS 2000 93.5 6.5 6.2 6.9 4.3 9.6 19.3 6.6 4.6 5.6 3.0 … …
Bahrain MICS 2000 86.3 13.7 14.0 13.4 … … … … … … … 15.5 12.9
Egypt DHS 2000 85.6 14.4 12.5 16.5 11.4 16.3 24.5 14.2 13.1 10.4 6.8 19.1 9.4
Iraq MICS 2000 77.8 22.2 16.2 28.5 14.2 38.4 45.4 22.1 17.9 10.4 9.4 33.6 12.2
Lebanon MICS 2000 97.0 3.0 2.7 3.4 … … … … … … … 5.2 2.7
Sudan MICS 2000 52.6 47.4 46.3 48.4 33.8 61.4 80.7 63.4 47.4 30.5 14.7 59.2 25.3
Yemen DHS 1997 54.6 45.4 32.2 59.3 23.2 51.8 68.3 56.7 43.4 34.2 19.7 47.3 25.4
Eastern and Southern Africa
Angola MICS 2000 58.0 42.0 42.6 41.4 36.2 55.3 64.4 55.0 47.9 36.1 18.0 57.5 33.0
Botswana MICS 2000 84.2 15.8 17.2 14.5 12.0 19.0 27.1 14.4 13.7 9.6 8.9 20.2 12.8
Burundi MICS 2000 46.7 53.3 50.5 56.0 31.6 54.8 64.5 62.5 58.1 49.3 37.5 58.4 38.4
Comoros MICS 2000 30.8 69.2 69.2 69.3 58.9 71.6 76.1 74.2 68.7 64.8 60.0 72.1 59.3
Eritrea DHS 2002 63.3 36.7 35.1 38.4 15.8 46.8 61.1 49.2 34.0 15.0 8.0 43.9 13.0
Ethiopia DHS 2000 30.6 69.4 66.9 72.0 23.6 75.7 82.8 78.9 78.1 68.1 32.1 72.4 38.9
Kenya DHS 2003 77.5 22.5 22.9 22.0 17.9 23.3 40.0 21.8 17.5 13.3 13.9 32.5 15.9
Lesotho MICS 2000 65.4 34.6 37.6 31.5 29.1 35.9 52.3 40.8 32.9 26.2 21.9 49.6 33.0
Madagascar MICS 2000 62.3 37.7 39.0 36.3 21.1 41.8 59.3 50.7 36.3 25.8 12.0 53.0 28.1
Malawi DHS 2000 75.7 24.3 25.7 22.9 10.5 26.3 34.2 30.9 26.6 18.8 9.3 30.8 16.6
Mozambique DHS 1997 49.9 50.1 46.8 53.2 23.9 57.2 65.8 61.0 58.1 42.1 21.1 58.1 44.7
Namibia DHS 2000 78.1 21.9 22.2 21.7 16.5 23.8 25.8 26.3 21.5 18.5 14.0 24.6 18.3
Rwanda MICS 2000 75.2 24.8 24.6 24.9 12.7 26.6 36.1 29.8 22.2 17.5 10.4 28.6 20.9
Somalia MICS 1999 10.9 89.1 88.4 89.9 84.7 92.5 96.0 94.7 91.2 86.1 75.5 92.5 78.7
South Africa DHS 1998 93.5 6.5 7.2 5.9 4.9 7.8 9.5 7.0 5.6 4.4 4.2 8.5 4.8
Swaziland MICS 2000 71.5 28.5 28.3 28.7 25.2 29.0 40.1 27.3 24.8 21.0 20.5 38.7 23.9
Tanzania, United Republic of DHS 1999 48.9 51.1 52.8 49.3 34.2 55.0 64.7 61.4 53.9 46.1 26.4 55.9 44.0
Uganda DHS 2000/01 78.9 21.1 21.6 20.6 17.8 21.5 28.4 25.1 20.3 17.4 14.8 22.2 19.9
Zambia DHS 2001/02 68.0 32.0 32.0 32.0 20.0 38.8 50.7 41.2 34.3 25.3 10.3 39.0 27.0
Zimbabwe DHS 1999 85.5 14.5 15.2 13.7 9.4 16.0 19.6 15.1 14.3 13.3 7.0 17.1 12.3

Table A3. Net attendance rate and share of children out of school by background characteristics
85
M F GPI MF M F GPI
Survey,
year
Net
attendance
rate (%)
CHARACTERISTICS
Country or territory
Share of primary school-age children out of school (%)
Total Male Urban Rural Poorestquintile
Secondquintile
Thirdquintile
Fourthquintile
Richestquintile
Mother hasno formaleducation
Mother hasformal
educationFemale
West and Central Africa
Benin DHS 2001 54.1 45.9 39.0 53.2 33.0 52.1 68.4 55.9 46.2 32.3 21.4 50.4 19.8
Burkina Faso DHS 1998/99 27.7 72.3 67.5 77.3 26.9 79.0 85.0 82.7 78.9 73.0 38.5 76.0 38.1
Cameroon MICS 2000 74.5 25.5 23.6 27.5 14.0 31.0 39.7 38.5 24.9 14.1 7.9 43.7 11.2
Central African Republic MICS 2000 43.1 56.9 53.2 60.7 39.1 67.6 77.7 65.1 61.5 44.5 34.0 67.3 40.6
Chad MICS 2000 39.3 60.7 54.3 67.2 44.6 65.4 78.5 62.2 58.6 55.7 43.5 65.7 33.1
Democratic Republic of the Congo MICS 2000 51.6 48.4 45.3 51.5 28.5 56.7 60.8 61.4 55.7 43.1 18.9 66.2 39.1
Côte d'Ivoire MICS 2000 57.8 42.2 38.0 47.1 31.8 51.2 60.4 48.7 46.7 31.4 16.4 51.1 13.7
Equatorial Guinea MICS 2000 61.7 38.3 38.7 37.8 25.3 48.3 45.6 47.5 36.1 34.7 24.0 43.8 36.1
Gabon DHS 2000/01 93.9 6.1 6.0 6.2 5.5 7.5 8.0 8.4 5.8 5.5 2.6 7.1 5.4
Gambia MICS 2000 52.7 47.3 44.9 49.6 34.3 54.0 62.3 51.3 48.7 36.9 21.9 50.1 28.0
Ghana DHS 1998/99 75.1 24.9 24.9 25.0 13.8 29.1 40.7 31.6 22.5 13.8 9.9 32.1 13.2
Guinea DHS 1999 39.6 60.4 54.3 66.5 29.4 72.9 84.0 80.4 67.6 48.9 21.3 64.0 22.7
Guinea-Bissau MICS 2000 41.3 58.7 55.6 62.0 29.8 75.8 79.5 75.6 70.0 47.7 22.6 66.3 21.8
Mali DHS 2001 39.2 60.8 55.0 66.4 33.8 69.1 74.0 71.6 68.6 57.7 25.9 67.4 30.4
Mauritania DHS 2000/01 44.2 55.8 54.1 57.6 41.0 64.6 70.1 64.6 56.2 47.7 31.7 60.4 40.6
Niger MICS 2000 30.3 69.7 64.1 75.3 32.5 76.5 81.8 77.2 77.9 75.7 39.2 73.8 33.1
Nigeria DHS 2003 61.9 38.1 34.5 41.9 27.8 43.1 58.5 51.3 38.0 24.0 12.4 47.8 18.6
Sao Tome and Principe MICS 2000 77.9 22.1 22.6 21.6 21.4 22.7 28.1 26.9 21.4 19.3 14.6 27.0 20.1
Senegal MICS 2000 48.4 51.6 48.4 54.8 31.9 62.8 68.8 65.8 57.7 37.1 24.5 58.8 20.2
Sierra Leone MICS 2000 40.9 59.1 57.2 61.0 38.5 66.6 74.2 71.1 62.1 52.2 32.4 65.1 31.1
Togo MICS 2000 63.5 36.5 32.3 40.9 19.8 43.5 51.9 44.6 36.8 26.7 13.0 43.0 19.7
South Asia
Bangladesh DHS 1999/00 79.3 20.7 21.6 19.8 20.3 20.8 35.9 21.7 16.3 10.4 13.6 27.9 14.8
India MICS 2000 76.9 23.1 19.7 26.7 15.9 25.3 33.2 30.2 20.1 16.8 9.8 30.6 9.1
Nepal MICS 2000 66.2 33.8 28.9 39.0 30.0 34.2 41.4 34.0 32.7 32.7 25.4 41.4 21.8
Pakistan Survey 2000/01 56.4 43.6 38.1 49.1 28.0 49.9 … … … … … 54.9 29.7
East Asia and the Pacific
Cambodia DHS 2000 65.3 34.7 34.2 35.3 26.4 36.0 52.4 43.0 33.0 26.0 14.3 43.0 29.0
Indonesia DHS 2002/03 94.4 5.6 5.9 5.2 4.0 6.8 11.2 5.6 4.3 3.2 2.0 9.6 4.8
Lao People's Democratic Republic MICS 2000 62.1 37.9 35.5 40.4 18.0 45.7 60.0 47.9 37.1 25.5 12.7 52.6 25.6
Mongolia MICS 2000 79.2 20.8 21.3 20.4 16.4 24.1 29.4 25.5 22.2 16.0 9.8 56.9 20.1
Myanmar MICS 2000 79.5 20.5 20.6 20.5 9.9 23.3 35.8 22.3 14.8 12.4 10.1 … …
Philippines MICS 1999 81.9 18.1 19.3 16.9 15.2 21.3 30.0 18.8 15.6 12.2 10.6 47.4 16.7
Viet Nam MICS 2000 87.6 12.4 12.0 12.8 6.7 13.6 21.3 13.5 9.1 6.8 7.0 28.9 9.9
Latin America and the Caribbean
Bolivia MICS 2000 91.7 8.3 7.5 9.1 6.5 11.0 13.8 9.7 6.0 5.0 4.5 14.0 7.1
Brazil DHS 1996 95.5 4.5 4.5 4.5 3.3 8.3 … … … … … … …

Children Out of School: Measur ing Exclusion from Pr imary Education
86
M F GPI MF M F GPI
Survey,
year
Net
attendance
rate (%)
TABLE A3. NET ATTENDANCE RATE AND SHARE OF CHILDREN OUT OF SCHOOL BY BACKGROUNDCHARACTERISTICS
Country or territory
Share of primary school-age children out of school (%)
Total Male Urban Rural Poorestquintile
Secondquintile
Thirdquintile
Fourthquintile
Richestquintile
Mother hasno formaleducation
Mother hasformal
educationFemale
Colombia DHS 2000 92.5 7.5 8.0 7.0 6.3 9.9 13.3 7.8 7.4 3.8 3.1 13.6 6.1
Dominican Republic MICS 2000 92.4 7.6 8.4 6.7 8.0 7.1 13.3 12.1 3.3 4.3 3.8 14.8 6.8
Guatemala DHS 1998/99 77.8 22.2 20.2 24.2 19.5 23.8 … … … … … … …
Guyana MICS 2000 96.5 3.5 3.9 3.0 2.1 4.0 5.5 3.4 3.8 2.1 1.6 11.0 3.3
Haiti DHS 2000 54.4 45.6 47.8 43.4 28.9 53.0 66.1 53.0 44.4 33.2 21.9 53.5 30.0
Nicaragua DHS 2001 80.4 19.6 22.7 16.5 10.4 29.6 42.7 21.0 13.3 6.5 4.5 31.8 12.0
Peru DHS 2000 95.5 4.5 4.1 4.9 2.7 6.8 9.1 4.3 3.1 2.1 1.0 9.2 3.2
Suriname MICS 1999/00 89.5 10.5 11.8 9.0 3.5 16.2 15.8 19.3 5.5 5.1 2.5 25.7 5.9
Trinidad and Tobago MICS 2000 95.5 4.5 4.9 4.1 … … 5.8 2.7 3.4 5.6 5.3 8.9 4.2
Venezuela MICS 2000 93.5 6.5 7.4 5.5 … … 14.6 6.3 4.2 1.8 1.6 23.9 5.0
Regional averages (survey countries)
Central/Eastern Europe, CIS 88.2 11.8 11.3 12.3 10.7 12.9 15.0 13.3 12.7 12.3 9.6 20.0 12.7
Middle East and North Africa 75.7 24.3 20.8 27.9 16.5 32.0 43.5 29.2 23.0 16.5 9.7 35.2 16.0
Eastern and Southern Africa 61.2 38.8 38.6 39.0 22.0 42.4 50.9 45.0 40.8 34.1 20.0 44.1 28.2
West and Central Africa 55.8 44.2 40.6 47.9 27.9 50.8 61.4 55.8 46.7 34.3 18.1 54.2 23.9
South Asia 74.3 25.7 22.4 29.0 18.2 28.1 33.7 29.2 19.9 16.3 10.6 33.6 12.6
East Asia and Pacific 87.6 12.4 12.7 12.1 8.4 14.3 21.5 13.4 10.1 7.8 6.0 24.1 9.9
Latin America and Caribbean 91.6 8.4 8.6 8.2 6.4 12.0 18.2 11.3 8.5 5.6 4.0 18.8 7.5
Total survey countries 74.0 26.0 24.1 28.1 17.5 30.0 38.3 32.1 25.3 19.9 12.1 36.1 16.2
Note:
… Missing value.


88
Children Out of School: Measur ing Exclusion from Pr imary Education
F MF M F GPI
Children out of school by sex Children out of school by place of residence
TABLE A4. DISTRIBUTION OF PRIMARY SCHOOL-AGE POPULATION AND OUT-OF-SCHOOL CHILDREN BY
Country or territory As % of primaryschool-age population
As % of totalout-of-school children
Male MaleFemale Female
% pointdifference in
female share oftotal and out-
of-schoolpopulations
As % of primaryschool-age population
As % of totalout-of-school children
Urban UrbanRural Rural
% pointdifference inrural share of
total and out-of-school
populations
Central and Eastern Europe / Commonwealth of Independent States (CIS)
Armenia 50.3 49.7 56.0 44.0 -5.6 53.0 47.0 41.6 58.4 11.4
Azerbaijan 52.8 47.2 53.2 46.8 -0.3 51.0 49.0 47.3 52.7 3.7
Bosnia and Herzegovina 51.2 48.8 47.2 52.8 4.0 36.1 63.9 34.9 65.1 1.2
Kazakhstan 51.2 48.8 57.4 42.6 -6.1 38.1 61.9 16.7 83.3 21.4
Kyrgyzstan 54.2 45.8 52.6 47.4 1.6 27.8 72.2 32.9 67.1 -5.0
Moldova, Republic of 51.4 48.6 64.5 35.5 -13.2 38.5 61.5 23.6 76.4 14.9
Tajikistan 51.1 48.9 53.2 46.8 -2.0 21.7 78.3 … … …
Turkey 49.8 50.2 46.3 53.7 3.5 … … … … …
Uzbekistan 52.2 47.8 51.0 49.0 1.2 30.2 69.8 25.3 74.7 4.8
Middle East and North Africa
Algeria 50.5 49.5 47.7 52.3 2.8 58.3 41.7 38.3 61.7 20.0
Bahrain 48.0 52.0 49.1 50.9 -1.1 … … … … …
Egypt 51.0 49.0 44.2 55.8 6.8 38.5 61.5 30.4 69.6 8.1
Iraq 51.2 48.8 37.3 62.7 13.9 67.2 32.8 43.1 56.9 24.1
Lebanon 52.3 47.7 46.6 53.4 5.7 … … … … …
Sudan 50.2 49.8 49.1 50.9 1.1 50.7 49.3 36.1 63.9 14.6
Yemen 51.1 48.9 36.2 63.8 14.9 22.4 77.6 11.5 88.5 10.9
Eastern and Southern Africa
Angola 50.1 49.9 50.8 49.2 -0.7 69.9 30.1 60.3 39.7 9.6
Botswana 48.9 51.1 53.2 46.8 -4.3 45.4 54.6 34.4 65.6 11.0
Burundi 48.6 51.4 46.0 54.0 2.6 6.4 93.6 3.8 96.2 2.6
Comoros 51.8 48.2 51.7 48.3 0.0 18.6 81.4 15.8 84.2 2.8
Eritrea 51.2 48.8 49.0 51.0 2.3 32.4 67.6 13.9 86.1 18.5
Ethiopia 51.0 49.0 49.2 50.8 1.8 12.1 87.9 4.1 95.9 8.0
Kenya 51.0 49.0 52.0 48.0 -1.1 14.7 85.3 11.7 88.3 3.0
Lesotho 50.9 49.1 55.3 44.7 -4.4 19.0 81.0 15.9 84.1 3.0
Madagascar 49.6 50.4 51.4 48.6 -1.8 19.7 80.3 11.0 89.0 8.7
Malawi 49.4 50.6 52.3 47.7 -2.9 12.9 87.1 5.6 94.4 7.3
Mozambique 49.4 50.6 46.2 53.8 3.2 21.4 78.6 10.2 89.8 11.2
Namibia 48.7 51.3 49.3 50.7 -0.6 25.7 74.3 19.3 80.7 6.4
Rwanda 48.4 51.6 48.1 51.9 0.3 13.0 87.0 6.7 93.3 6.4
Somalia 52.3 47.7 51.9 48.1 0.4 45.8 54.2 43.6 56.4 2.2
South Africa 49.4 50.6 54.5 45.5 -5.1 44.8 55.2 33.8 66.2 11.0
Swaziland 51.3 48.7 51.0 49.0 0.3 13.9 86.1 12.3 87.7 1.6
Tanzania, United Republic of 50.0 50.0 51.8 48.2 -1.7 18.9 81.1 12.7 87.3 6.2
Uganda 49.1 50.9 50.3 49.7 -1.2 10.5 89.5 8.9 91.1 1.7
Zambia 50.2 49.8 50.2 49.8 0.0 36.1 63.9 22.6 77.4 13.5
Zimbabwe 50.4 49.6 52.8 47.2 -2.5 23.1 76.9 15.0 85.0 8.0
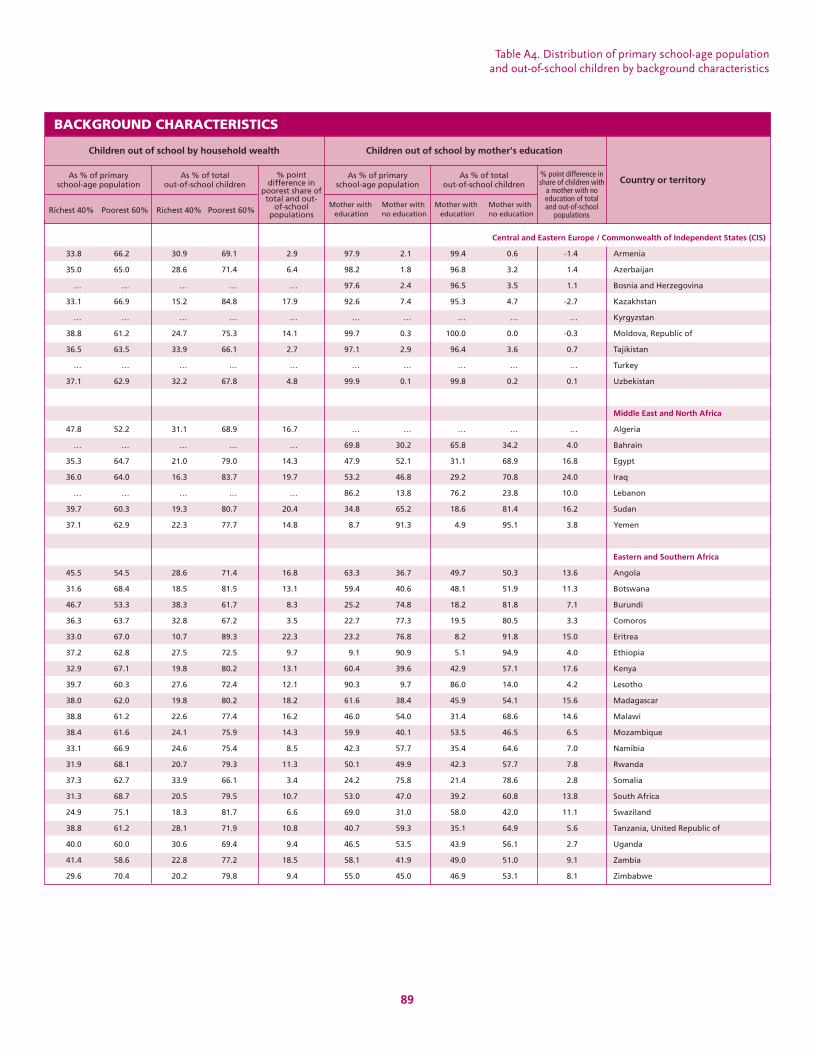
Table A4. Distribution of primary school-age populationand out-of-school children by background characteristics
89
F MF M F GPI
Children out of school by household wealth Children out of school by mother's education
BACKGROUND CHARACTERISTICS
Country or territoryAs % of primaryschool-age population
As % of totalout-of-school children
Richest 40% Richest 40%Poorest 60% Poorest 60%
% pointdifference in
poorest share oftotal and out-
of-schoolpopulations
As % of primaryschool-age population
As % of totalout-of-school children
Mother witheducation
Mother witheducation
Mother withno education
Mother withno education
% point difference inshare of children with
a mother with noeducation of totaland out-of-school
populations
Central and Eastern Europe / Commonwealth of Independent States (CIS)
33.8 66.2 30.9 69.1 2.9 97.9 2.1 99.4 0.6 -1.4 Armenia
35.0 65.0 28.6 71.4 6.4 98.2 1.8 96.8 3.2 1.4 Azerbaijan
… … … … … 97.6 2.4 96.5 3.5 1.1 Bosnia and Herzegovina
33.1 66.9 15.2 84.8 17.9 92.6 7.4 95.3 4.7 -2.7 Kazakhstan
… … … … … … … … … … Kyrgyzstan
38.8 61.2 24.7 75.3 14.1 99.7 0.3 100.0 0.0 -0.3 Moldova, Republic of
36.5 63.5 33.9 66.1 2.7 97.1 2.9 96.4 3.6 0.7 Tajikistan
… … … … … … … … … … Turkey
37.1 62.9 32.2 67.8 4.8 99.9 0.1 99.8 0.2 0.1 Uzbekistan
Middle East and North Africa
47.8 52.2 31.1 68.9 16.7 … … … … … Algeria
… … … … … 69.8 30.2 65.8 34.2 4.0 Bahrain
35.3 64.7 21.0 79.0 14.3 47.9 52.1 31.1 68.9 16.8 Egypt
36.0 64.0 16.3 83.7 19.7 53.2 46.8 29.2 70.8 24.0 Iraq
… … … … … 86.2 13.8 76.2 23.8 10.0 Lebanon
39.7 60.3 19.3 80.7 20.4 34.8 65.2 18.6 81.4 16.2 Sudan
37.1 62.9 22.3 77.7 14.8 8.7 91.3 4.9 95.1 3.8 Yemen
Eastern and Southern Africa
45.5 54.5 28.6 71.4 16.8 63.3 36.7 49.7 50.3 13.6 Angola
31.6 68.4 18.5 81.5 13.1 59.4 40.6 48.1 51.9 11.3 Botswana
46.7 53.3 38.3 61.7 8.3 25.2 74.8 18.2 81.8 7.1 Burundi
36.3 63.7 32.8 67.2 3.5 22.7 77.3 19.5 80.5 3.3 Comoros
33.0 67.0 10.7 89.3 22.3 23.2 76.8 8.2 91.8 15.0 Eritrea
37.2 62.8 27.5 72.5 9.7 9.1 90.9 5.1 94.9 4.0 Ethiopia
32.9 67.1 19.8 80.2 13.1 60.4 39.6 42.9 57.1 17.6 Kenya
39.7 60.3 27.6 72.4 12.1 90.3 9.7 86.0 14.0 4.2 Lesotho
38.0 62.0 19.8 80.2 18.2 61.6 38.4 45.9 54.1 15.6 Madagascar
38.8 61.2 22.6 77.4 16.2 46.0 54.0 31.4 68.6 14.6 Malawi
38.4 61.6 24.1 75.9 14.3 59.9 40.1 53.5 46.5 6.5 Mozambique
33.1 66.9 24.6 75.4 8.5 42.3 57.7 35.4 64.6 7.0 Namibia
31.9 68.1 20.7 79.3 11.3 50.1 49.9 42.3 57.7 7.8 Rwanda
37.3 62.7 33.9 66.1 3.4 24.2 75.8 21.4 78.6 2.8 Somalia
31.3 68.7 20.5 79.5 10.7 53.0 47.0 39.2 60.8 13.8 South Africa
24.9 75.1 18.3 81.7 6.6 69.0 31.0 58.0 42.0 11.1 Swaziland
38.8 61.2 28.1 71.9 10.8 40.7 59.3 35.1 64.9 5.6 Tanzania, United Republic of
40.0 60.0 30.6 69.4 9.4 46.5 53.5 43.9 56.1 2.7 Uganda
41.4 58.6 22.8 77.2 18.5 58.1 41.9 49.0 51.0 9.1 Zambia
29.6 70.4 20.2 79.8 9.4 55.0 45.0 46.9 53.1 8.1 Zimbabwe

90
Children Out of School: Measur ing Exclusion from Pr imary Education
F MF M F GPI
Children out of school by sex Children out of school by place of residence
TABLE A4. DISTRIBUTION OF PRIMARY SCHOOL-AGE POPULATION AND OUT-OF-SCHOOL CHILDREN BY
Country or territory As % of primaryschool-age population
As % of totalout-of-school children
Male MaleFemale Female
% pointdifference in
female share oftotal and out-
of-schoolpopulations
As % of primaryschool-age population
As % of totalout-of-school children
Urban UrbanRural Rural
% pointdifference inrural share of
total and out-of-school
populations
West and Central Africa
Benin 51.5 48.5 43.8 56.2 7.7 32.1 67.9 23.1 76.9 9.1
Burkina Faso 50.9 49.1 47.5 52.5 3.4 12.7 87.3 4.7 95.3 8.0
Cameroon 51.4 48.6 47.6 52.4 3.8 32.5 67.5 17.9 82.1 14.6
Central African Republic 51.6 48.4 48.3 51.7 3.3 37.7 62.3 25.9 74.1 11.8
Chad 50.2 49.8 44.8 55.2 5.3 22.7 77.3 16.7 83.3 6.0
Democratic Republic of the Congo 49.4 50.6 46.2 53.8 3.2 29.6 70.4 17.4 82.6 12.2
Côte d'Ivoire 53.2 46.8 47.8 52.2 5.4 46.4 53.6 35.0 65.0 11.4
Equatorial Guinea 51.2 48.8 51.7 48.3 -0.6 43.6 56.4 28.8 71.2 14.8
Gabon 48.7 51.3 48.1 51.9 0.6 71.5 28.5 65.1 34.9 6.4
Gambia 49.8 50.2 47.2 52.8 2.5 34.3 65.7 24.9 75.1 9.4
Ghana 51.5 48.5 51.4 48.6 0.1 27.4 72.6 15.2 84.8 12.2
Guinea 50.0 50.0 44.9 55.1 5.1 28.8 71.2 14.0 86.0 14.8
Guinea-Bissau 50.5 49.5 47.8 52.2 2.7 37.1 62.9 18.9 81.1 18.3
Mali 49.0 51.0 44.3 55.7 4.7 23.5 76.5 13.0 87.0 10.4
Mauritania 51.2 48.8 49.6 50.4 1.6 37.3 62.7 27.4 72.6 9.9
Niger 50.1 49.9 46.1 53.9 4.0 15.5 84.5 7.2 92.8 8.3
Nigeria 50.8 49.2 46.0 54.0 4.8 32.3 67.7 23.5 76.5 8.8
Sao Tome and Principe 51.0 49.0 52.2 47.8 -1.2 46.4 53.6 44.9 55.1 1.5
Senegal 50.2 49.8 47.1 52.9 3.1 36.2 63.8 22.4 77.6 13.9
Sierra Leone 50.7 49.3 49.1 50.9 1.6 26.6 73.4 17.3 82.7 9.3
Togo 50.9 49.1 45.1 54.9 5.8 29.6 70.4 16.0 84.0 13.5
South Asia
Bangladesh 50.1 49.9 52.3 47.7 -2.2 16.5 83.5 16.2 83.8 0.3
India 51.4 48.6 43.8 56.2 7.6 23.3 76.7 16.1 83.9 7.3
Nepal 51.7 48.3 44.2 55.8 7.5 10.1 89.9 9.0 91.0 1.1
Pakistan 50.3 49.7 44.0 56.0 6.3 28.9 71.1 18.6 81.4 10.3
East Asia and the Pacific
Cambodia 50.4 49.6 49.6 50.4 0.8 13.3 86.7 10.1 89.9 3.2
Indonesia 52.1 47.9 55.5 44.5 -3.4 44.7 55.3 31.9 68.1 12.8
Lao People's Democratic Republic 51.1 48.9 47.9 52.1 3.2 28.0 72.0 13.3 86.7 14.7
Mongolia 50.4 49.6 51.5 48.5 -1.1 42.6 57.4 33.5 66.5 9.1
Myanmar 51.0 49.0 51.1 48.9 -0.1 21.0 79.0 10.1 89.9 10.9
Philippines 51.4 48.6 54.7 45.3 -3.4 51.9 48.1 43.4 56.6 8.5
Viet Nam 52.0 48.0 50.4 49.6 1.6 17.8 82.2 9.7 90.3 8.1
Latin America and the Caribbean
Bolivia 50.0 50.0 45.0 55.0 5.1 59.2 40.8 46.1 53.9 13.0
Brazil 50.3 49.7 50.4 49.6 -0.1 75.1 24.9 54.2 45.8 21.0
Colombia 50.4 49.6 53.5 46.5 -3.1 67.5 32.5 57.0 43.0 10.5
Dominican Republic 51.1 48.9 56.8 43.2 -5.7 56.6 43.4 59.4 40.6 -2.8
Guatemala 51.4 48.6 47.0 53.0 4.5 37.5 62.5 33.0 67.0 4.5
Guyana 51.1 48.9 58.1 41.9 -7.0 27.6 72.4 16.9 83.1 10.7
Haiti 50.1 49.9 52.5 47.5 -2.4 30.6 69.4 19.4 80.6 11.2
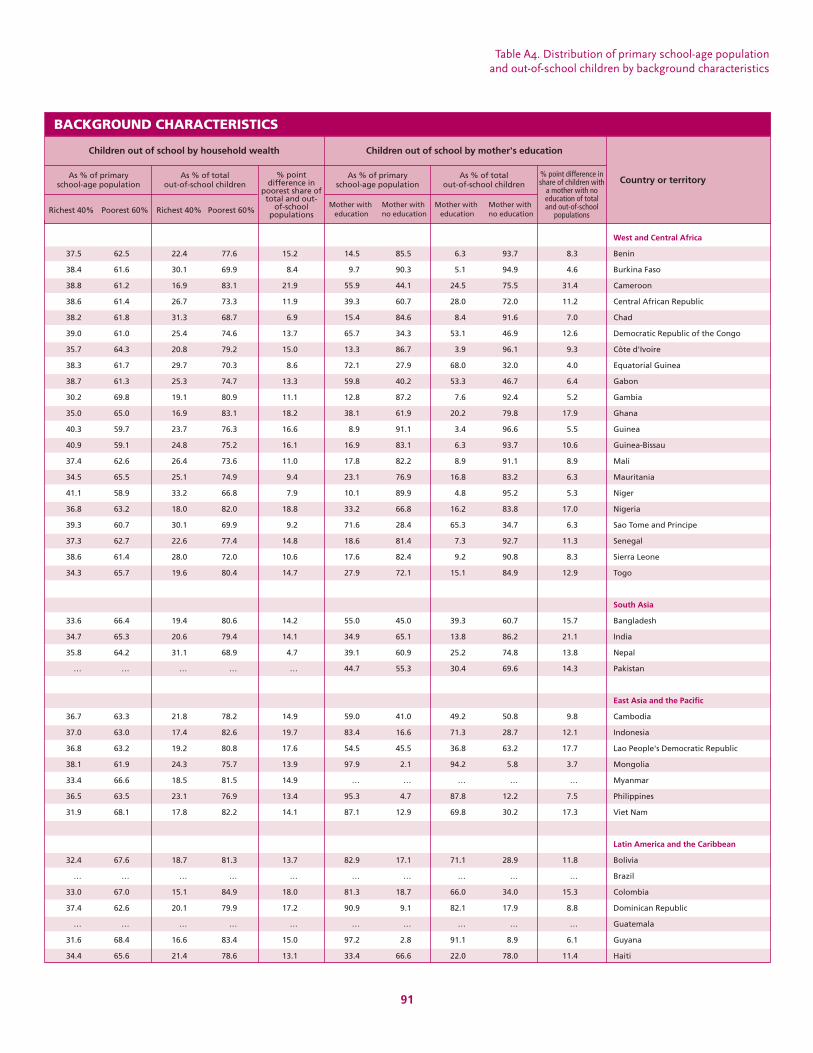
Table A4. Distribution of primary school-age populationand out-of-school children by background characteristics
91
F MF M F GPI
Children out of school by household wealth Children out of school by mother's education
BACKGROUND CHARACTERISTICS
Country or territoryAs % of primaryschool-age population
As % of totalout-of-school children
Richest 40% Richest 40%Poorest 60% Poorest 60%
% pointdifference in
poorest share oftotal and out-
of-schoolpopulations
As % of primaryschool-age population
As % of totalout-of-school children
Mother witheducation
Mother witheducation
Mother withno education
Mother withno education
% point difference inshare of children with
a mother with noeducation of totaland out-of-school
populations
West and Central Africa
37.5 62.5 22.4 77.6 15.2 14.5 85.5 6.3 93.7 8.3 Benin
38.4 61.6 30.1 69.9 8.4 9.7 90.3 5.1 94.9 4.6 Burkina Faso
38.8 61.2 16.9 83.1 21.9 55.9 44.1 24.5 75.5 31.4 Cameroon
38.6 61.4 26.7 73.3 11.9 39.3 60.7 28.0 72.0 11.2 Central African Republic
38.2 61.8 31.3 68.7 6.9 15.4 84.6 8.4 91.6 7.0 Chad
39.0 61.0 25.4 74.6 13.7 65.7 34.3 53.1 46.9 12.6 Democratic Republic of the Congo
35.7 64.3 20.8 79.2 15.0 13.3 86.7 3.9 96.1 9.3 Côte d'Ivoire
38.3 61.7 29.7 70.3 8.6 72.1 27.9 68.0 32.0 4.0 Equatorial Guinea
38.7 61.3 25.3 74.7 13.3 59.8 40.2 53.3 46.7 6.4 Gabon
30.2 69.8 19.1 80.9 11.1 12.8 87.2 7.6 92.4 5.2 Gambia
35.0 65.0 16.9 83.1 18.2 38.1 61.9 20.2 79.8 17.9 Ghana
40.3 59.7 23.7 76.3 16.6 8.9 91.1 3.4 96.6 5.5 Guinea
40.9 59.1 24.8 75.2 16.1 16.9 83.1 6.3 93.7 10.6 Guinea-Bissau
37.4 62.6 26.4 73.6 11.0 17.8 82.2 8.9 91.1 8.9 Mali
34.5 65.5 25.1 74.9 9.4 23.1 76.9 16.8 83.2 6.3 Mauritania
41.1 58.9 33.2 66.8 7.9 10.1 89.9 4.8 95.2 5.3 Niger
36.8 63.2 18.0 82.0 18.8 33.2 66.8 16.2 83.8 17.0 Nigeria
39.3 60.7 30.1 69.9 9.2 71.6 28.4 65.3 34.7 6.3 Sao Tome and Principe
37.3 62.7 22.6 77.4 14.8 18.6 81.4 7.3 92.7 11.3 Senegal
38.6 61.4 28.0 72.0 10.6 17.6 82.4 9.2 90.8 8.3 Sierra Leone
34.3 65.7 19.6 80.4 14.7 27.9 72.1 15.1 84.9 12.9 Togo
South Asia
33.6 66.4 19.4 80.6 14.2 55.0 45.0 39.3 60.7 15.7 Bangladesh
34.7 65.3 20.6 79.4 14.1 34.9 65.1 13.8 86.2 21.1 India
35.8 64.2 31.1 68.9 4.7 39.1 60.9 25.2 74.8 13.8 Nepal
… … … … … 44.7 55.3 30.4 69.6 14.3 Pakistan
East Asia and the Pacific
36.7 63.3 21.8 78.2 14.9 59.0 41.0 49.2 50.8 9.8 Cambodia
37.0 63.0 17.4 82.6 19.7 83.4 16.6 71.3 28.7 12.1 Indonesia
36.8 63.2 19.2 80.8 17.6 54.5 45.5 36.8 63.2 17.7 Lao People's Democratic Republic
38.1 61.9 24.3 75.7 13.9 97.9 2.1 94.2 5.8 3.7 Mongolia
33.4 66.6 18.5 81.5 14.9 … … … … … Myanmar
36.5 63.5 23.1 76.9 13.4 95.3 4.7 87.8 12.2 7.5 Philippines
31.9 68.1 17.8 82.2 14.1 87.1 12.9 69.8 30.2 17.3 Viet Nam
Latin America and the Caribbean
32.4 67.6 18.7 81.3 13.7 82.9 17.1 71.1 28.9 11.8 Bolivia
… … … … … … … … … … Brazil
33.0 67.0 15.1 84.9 18.0 81.3 18.7 66.0 34.0 15.3 Colombia
37.4 62.6 20.1 79.9 17.2 90.9 9.1 82.1 17.9 8.8 Dominican Republic
… … … … … … … … … … Guatemala
31.6 68.4 16.6 83.4 15.0 97.2 2.8 91.1 8.9 6.1 Guyana
34.4 65.6 21.4 78.6 13.1 33.4 66.6 22.0 78.0 11.4 Haiti

92
Children Out of School: Measur ing Exclusion from Pr imary Education
F MF M F GPI
Children out of school by sex Children out of school by place of residence
TABLE A4. DISTRIBUTION OF PRIMARY SCHOOL-AGE POPULATION AND OUT-OF-SCHOOL CHILDREN BY
Country or territory As % of primaryschool-age population
As % of totalout-of-school children
Male MaleFemale Female
% pointdifference in
female share oftotal and out-
of-schoolpopulations
As % of primaryschool-age population
As % of totalout-of-school children
Urban UrbanRural Rural
% pointdifference inrural share of
total and out-of-school
populations
Nicaragua 51.1 48.9 59.0 41.0 -7.9 51.9 48.1 27.5 72.5 24.4
Peru 51.0 49.0 46.5 53.5 4.5 55.0 45.0 32.3 67.7 22.7
Suriname 52.3 47.7 58.9 41.1 -6.7 44.8 55.2 14.9 85.1 29.8
Trinidad and Tobago 50.2 49.8 54.5 45.5 -4.4 … … … … …
Venezuela 49.9 50.1 57.4 42.6 -7.4 … … … … …
Regional averages (survey countries)
Central/Eastern Europe, CIS 50.7 49.3 48.7 51.3 2.0 34.4 65.6 27.2 72.8 7.1
Middle East and North Africa 50.8 49.2 43.5 56.5 7.4 47.0 53.0 30.4 69.6 16.6
Eastern and Southern Africa 50.1 49.9 50.2 49.8 -0.1 22.5 77.5 13.1 86.9 9.5
West and Central Africa 50.7 49.3 46.4 53.6 4.2 30.6 69.4 19.2 80.8 11.4
South Asia 51.1 48.9 44.6 55.4 6.5 23.0 77.0 16.5 83.5 6.6
East Asia and Pacific 51.7 48.3 52.7 47.3 -1.0 37.8 62.2 24.9 75.1 12.9
Latin America and Caribbean 50.5 49.5 51.6 48.4 -1.1 64.8 35.2 39.6 60.4 25.2
Total survey countries 50.9 49.1 46.9 53.1 4.0 31.1 68.9 18.4 81.6 12.6

Table A4. Distribution of primary school-age populationand out-of-school children by background characteristics
93
F MF M F GPI
Children out of school by household wealth Children out of school by mother's education
BACKGROUND CHARACTERISTICS
Country or territoryAs % of primaryschool-age population
As % of totalout-of-school children
Richest 40% Richest 40%Poorest 60% Poorest 60%
% pointdifference in
poorest share oftotal and out-
of-schoolpopulations
As % of primaryschool-age population
As % of totalout-of-school children
Mother witheducation
Mother witheducation
Mother withno education
Mother withno education
% point difference inshare of children with
a mother with noeducation of totaland out-of-school
populations
32.6 67.4 9.3 90.7 23.3 61.5 38.5 37.6 62.4 23.9 Nicaragua
28.7 71.3 10.5 89.5 18.2 77.6 22.4 54.7 45.3 22.9 Peru
32.8 67.2 12.3 87.7 20.5 76.7 23.3 42.9 57.1 33.8 Suriname
31.7 68.3 38.6 61.4 -6.9 93.1 6.9 86.4 13.6 6.7 Trinidad and Tobago
31.4 68.6 8.4 91.6 23.0 92.4 7.6 71.8 28.2 20.6 Venezuela
Regional Averages (survey countries)
35.8 64.2 31.7 68.3 4.2 97.6 2.4 98.7 1.3 -1.1 Central/Eastern Europe, CIS
38.8 61.2 20.5 79.5 18.3 40.8 59.2 19.6 80.4 21.2 Middle East and North Africa
36.5 63.5 26.7 73.3 9.8 42.1 57.9 26.4 73.6 15.7 Eastern and Southern Africa
37.5 62.5 22.8 77.2 14.7 34.3 65.7 19.5 80.5 14.8 West and Central Africa
34.6 65.4 20.8 79.2 13.8 38.5 61.5 20.0 80.0 18.5 South Asia
35.7 64.3 20.0 80.0 15.7 85.4 14.6 72.5 27.5 12.9 East Asia and Pacific
32.1 67.9 16.0 84.0 16.1 79.0 21.0 48.9 51.1 30.1 Latin America and Caribbean
35.7 64.3 22.6 77.4 13.1 48.0 52.0 25.4 74.6 22.6 Total survey countries
Note:
… Missing value.

94
Children Out of School: Measur ing Exclusion from Pr imary Education
F MF M F GPI
Survey Odds ratios
TABLE A5. NET EFFECTS OF CHILDREN’S BACKGROUND CHARACTERISTICS ON PRIMARY SCHOOL
Country or territoryNumber of
observations Age Male UrbanNet
attendancerate (%)
Survey,year
Central and Eastern Europe / Commonwealth of Independent States (CIS)
Armenia DHS 2000 1376 97.0 7.108** (4.65) 0.748 (0.85) 2.970* (2.32)
Azerbaijan MICS 2000 2417 90.9 3.105** (9.82) 1.039 (0.25) 0.913 (0.38)
Kazakhstan DHS 1999 1655 98.5 1.018 (0.09) 0.741 (0.57) 1.854 (1.11)
Tajikistan MICS 2000 2879 80.7 5.329** (13.66) 0.919 (0.80) 0.726 (1.37)
Turkey DHS 1998 4647 74.8 2.086** (18.25) 1.377** (3.55) 0.762 (1.93)
Uzbekistan MICS 2000 3093 80.3 5.150** (8.95) 0.956 (0.44) 1.229 (1.05)
Middle East and North Africa
Egypt DHS 2000 10563 85.6 1.943** (20.98) 1.503** (5.75) 0.726** (2.83)
Iraq MICS 2000 16978 77.8 1.028 (1.78) 2.285** (14.98) 1.645** (5.62)
Sudan MICS 2000 27114 52.6 1.676** (30.02) 1.137** (3.25) 1.474** (3.86)
Yemen DHS 1997 15203 54.6 1.598** (27.87) 4.379** (21.36) 1.499** (3.29)
Eastern and Southern Africa
Angola MICS 2000 3615 58.0 1.836** (17.46) 0.994 (0.07) 1.062 (0.50)
Botswana MICS 2000 4966 84.2 2.075** (15.26) 0.803* (2.10) 1.082 (0.58)
Burundi MICS 2000 3909 46.7 1.334** (13.74) 1.319** (3.73) 1.586 (1.51)
Comoros MICS 2000 4740 30.8 1.272** (10.83) 0.982 (0.26) 1.565* (2.29)
Eritrea DHS 2002 6735 63.3 1.852** (21.66) 1.219** (2.98) 1.180 (0.85)
Ethiopia DHS 2000 11431 30.6 1.373** (15.30) 1.478** (5.12) 3.279** (6.03)
Kenya MICS 2000 9998 72.4 1.704** (19.23) 0.846** (2.65) 0.657 (1.80)
Lesotho MICS 2000 5833 65.4 1.730** (29.36) 0.644** (6.82) 0.761* (2.53)
Madagascar MICS 2000 4335 62.3 1.350** (8.81) 0.861 (1.93) 1.429* (2.12)
Malawi DHS 2000 11118 75.7 1.639** (25.60) 0.815** (3.40) 1.596** (4.17)
Mozambique DHS 1997 6593 49.9 1.524** (7.99) 1.334** (2.99) 2.146** (3.12)
Namibia DHS 2000 6091 78.1 1.922** (13.13) 0.942 (0.75) 0.904 (0.53)
Rwanda MICS 2000 3506 75.2 1.105** (3.57) 1.006 (0.07) 1.633* (2.28)
Somalia MICS 2000 4599 10.9 1.264** (9.13) 1.222 (1.88) 0.853 (0.60)
South Africa DHS 1998 10135 93.5 1.139** (5.33) 0.807* (2.33) 1.024 (0.16)
Swaziland MICS 2000 5133 71.5 1.397** (16.94) 1.015 (0.23) 0.774 (1.63)
Tanzania DHS 1999 3768 48.9 1.722** (18.37) 0.835 (1.42) 1.159 (0.77)
Uganda DHS 2000/01 8111 78.9 1.922** (19.85) 0.947 (0.73) 0.737* (2.03)
Zambia DHS 2001/02 7683 68.0 1.425** (17.98) 1.017 (0.30) 0.727* (2.23)
Zimbabwe DHS 1999 5724 85.5 2.122** (17.25) 0.888 (1.23) 0.722 (1.21)
West and Central Africa
Benin DHS 2001 5664 54.1 1.396** (17.33) 2.083** (11.94) 1.194 (1.44)
Burkina Faso DHS 1998/99 6098 27.7 0.978 (1.11) 1.974** (8.46) 4.123** (6.47)
Cameroon MICS 2000 4297 74.5 1.505** (11.39) 1.281** (2.60) 0.956 (0.19)
Central African Republic MICS 2000 19344 43.1 1.402** (20.68) 1.480** (6.65) 1.765** (6.10)
Chad MICS 2000 5653 39.3 1.384** (10.35) 1.831** (8.18) 1.500* (2.47)
Congo (DR) MICS 2000 9692 51.6 1.495** (24.06) 1.362** (6.29) 1.429** (2.94)
Cote d'Ivoire MICS 2000 10161 57.8 1.261** (15.21) 1.621** (10.55) 1.010 (0.10)
Equatorial Guinea MICS 2000 2911 61.7 1.537** (11.98) 0.930 (0.82) 2.620** (7.60)
Gabon DHS 2000/01 5168 93.9 1.870** (9.78) 1.009 (0.06) 0.854 (0.78)

Table A5. Net effects of children’s background characteristics on primary school participation
95
F MF M F GPI
Odds ratios
PARTICIPATION
Country or territory
Second wealth quintile Third wealth quintile Fourth wealth quintile Richest wealth quintile Mother has formal education
0.664 (0.88) 0.279* (2.25) 0.415 (1.26) 0.222* (2.19) 0.328 (1.04)
1.399 (1.39) 1.086 (0.31) 1.432 (1.25) 1.771 (1.61) 2.467 (1.46)
1.119 (0.20) 29.155** (3.06) 2.382 (1.50) 3.164 (1.45) 0.511 (0.81)
1.091 (0.52) 0.804 (1.16) 1.291 (1.37) 1.493 (1.64) 1.497 (1.02)
1.754** (3.91) 4.044** (9.04) 5.155** (8.31) 4.786** (7.94) 2.565** (8.07)
1.107 (0.50) 1.207 (0.73) 1.054 (0.26) 1.655* (2.22) 3.554 (1.61)
2.047** (7.10) 2.262** (7.31) 2.792** (7.70) 4.540** (9.07) 1.862** (8.02)
2.140** (7.70) 2.417** (7.88) 3.648** (8.69) 3.809** (10.02) 2.606** (13.43)
2.294** (9.69) 3.999** (14.26) 7.519** (17.47) 15.477** (18.64) 2.142** (12.36)
1.846** (6.21) 3.559** (11.56) 4.842** (12.27) 9.148** (15.69) 1.535** (4.17)
1.430* (2.18) 1.643** (3.23) 2.694** (5.88) 6.408** (10.26) 2.007** (7.61)
2.396** (6.25) 2.637** (5.63) 3.689** (7.07) 3.724** (6.56) 1.314* (2.54)
1.101 (0.69) 1.262 (1.61) 1.834** (4.42) 2.574** (6.44) 2.019** (7.50)
1.117 (0.70) 1.418* (2.06) 1.533* (2.45) 1.667** (2.91) 1.706** (4.21)
1.739** (5.68) 3.392** (9.21) 8.362** (11.15) 13.237** (9.61) 2.519** (1.85)
1.332* (2.33) 1.407** (2.73) 2.279** (6.17) 4.715** (10.31) 2.647** (7.51)
1.449** (4.02) 1.705** (4.63) 3.139** (8.41) 2.605** (3.13) 2.752** (6.61)
1.724** (4.99) 2.588** (8.31) 3.875** (11.20) 5.953** (12.47) 1.952** (5.21)
1.402* (2.36) 2.305** (5.14) 3.597** (7.62) 7.682** (9.84) 2.375** (8.60)
1.117 (1.09) 1.369** (2.97) 2.150** (7.29) 3.785** (9.76) 2.399** (13.06)
1.219 (1.18) 1.350 (1.19) 2.226** (3.87) 5.108** (4.32) 1.509** (2.73)
1.010 (0.05) 1.355 (1.75) 1.709** (2.85) 2.276** (3.75) 1.558** (3.05)
1.322* (2.21) 1.915** (4.25) 2.349** (6.01) 2.971** (3.70) 1.268* (2.34)
1.266 (0.73) 2.214 (1.92) 3.515** (2.92) 6.725** (4.18) 2.451** (4.70)
1.351 (1.81) 1.609** (2.71) 2.007** (2.73) 1.902* (2.53) 1.638** (4.05)
1.684** (5.17) 1.900** (4.90) 2.367** (5.29) 2.506** (3.81) 1.902** (7.59)
1.125 (0.58) 1.699** (2.80) 2.468** (3.78) 6.287** (8.10) 1.785** (4.51)
1.238 (1.45) 1.529** (3.12) 2.046** (5.11) 2.713** (5.69) 1.390** (3.85)
1.466** (3.54) 2.108** (6.29) 3.873** (8.75) 12.753** (12.06) 1.779** (8.12)
1.476** (3.11) 1.502** (2.83) 2.195** (4.21) 5.431** (4.98) 1.735** (6.15)
1.764** (4.80) 2.653** (6.82) 4.505** (11.17) 6.029** (10.73) 2.914** (9.58)
1.178 (0.96) 1.521** (2.65) 1.842** (4.17) 3.443** (5.53) 2.659** (7.09)
0.908 (0.66) 1.662* (2.46) 2.652** (4.41) 3.595** (4.75) 5.318** (10.91)
1.758** (6.09) 1.912** (6.89) 2.781** (9.25) 3.741** (10.08) 2.308** (11.51)
2.388** (4.63) 2.669** (4.44) 2.354** (3.94) 3.140** (4.77) 3.365** (9.04)
0.957 (0.31) 1.161 (1.21) 1.750** (4.37) 4.501** (9.53) 2.559** (11.38)
1.555** (4.88) 1.697** (4.99) 2.986** (9.51) 5.818** (12.79) 3.102** (10.26)
0.881 (0.74) 1.045 (0.29) 0.999 (0.01) 1.379* (2.10) 1.282* (2.37)
0.932 (0.38) 1.475 (1.51) 1.538 (1.55) 3.414** (4.32) 1.511** (2.87)
Armenia
Azerbaijan
Kazakhstan
Tajikistan
Turkey
Uzbekistan
Middle East and North Africa
Egypt
Iraq
Sudan
Yemen
Eastern and Southern Africa
Angola
Botswana
Burundi
Comoros
Eritrea
Ethiopia
Kenya
Lesotho
Madagascar
Malawi
Mozambique
Namibia
Rwanda
Somalia
South Africa
Swaziland
Tanzania
Uganda
Zambia
Zimbabwe
West and Central Africa
Benin
Burkina Faso
Cameroon
Central African Republic
Chad
Congo (DR)
Cote d'Ivoire
Equatorial Guinea
Gabon
Central and Eastern Europe / Commonwealth of Independent States (CIS)

96
Children Out of School: Measur ing Exclusion from Pr imary Education
F MF M F GPI
Survey Odds ratios
TABLE A5. NET EFFECTS OF CHILDREN’S BACKGROUND CHARACTERISTICS ON PRIMARY SCHOOL
Country or territoryNumber of
observations Age Male UrbanNet
attendancerate (%)
Survey,year
Gambia MICS 2000 5294 52.7 1.296** (11.99) 1.322** (3.30) 1.328 (1.60)
Ghana DHS 1998/99 4029 75.1 1.306** (10.03) 1.023 (0.29) 0.959 (0.23)
Guinea DHS 1999 6525 39.6 1.228** (11.19) 2.150** (11.87) 1.774** (4.43)
Guinea-Bissau MICS 2000 5923 41.3 1.292** (12.40) 1.561** (5.81) 3.404** (7.72)
Mali DHS 2001 12206 39.2 1.054** (2.89) 1.781** (8.82) 1.861** (4.37)
Mauritania DHS 2000/01 6672 44.2 1.541** (19.44) 1.169* (2.21) 1.602** (3.11)
Niger MICS 2000 4634 30.3 1.061* (2.53) 1.921** (7.34) 2.799** (5.41)
Nigeria DHS 2003 5807 61.9 1.501** (15.03) 1.551** (4.78) 0.766 (1.75)
Sao Tome and Principe MICS 2000 2389 77.9 1.233** (6.22) 0.922 (0.83) 0.891 (0.76)
Senegal MICS 2000 11080 48.4 1.069** (5.28) 1.338** (4.67) 1.522 (1.95)
Sierra Leone MICS 2000 4337 40.9 1.077** (3.64) 1.221** (2.76) 1.671** (3.16)
Togo MICS 2000 4922 63.5 1.457** (14.78) 1.571** (5.75) 1.748** (4.18)
South Asia
Bangladesh DHS 1999/00 6722 79.3 1.243** (8.33) 0.920 (1.18) 0.592** (4.17)
India MICS 2000 70640 76.9 1.242** (17.85) 1.517** (11.64) 0.933 (0.85)
Nepal MICS 2000 8262 66.2 1.406** (12.00) 1.633** (7.81) 0.907 (0.27)
East Asia and the Pacific
Cambodia DHS 2000 13016 65.3 2.077** (36.53) 1.039 (0.76) 0.860 (1.57)
Indonesia DHS 2002/03 19299 94.4 1.018 (0.54) 0.871 (1.35) 0.856 (0.78)
Lao PDR MICS 2000 6088 62.1 1.817** (25.68) 1.227** (2.96) 1.898** (3.96)
Mongolia MICS 2000 2750 79.2 3.115** (14.76) 0.914 (0.81) 0.883 (0.67)
Philippines MICS 1999 5429 81.9 2.646** (16.09) 0.822* (2.48) 1.105 (0.81)
Viet Nam MICS 2000 4612 87.6 2.281** (10.69) 1.066 (0.49) 1.310 (1.22)
Latin America and the Caribbean
Bolivia MICS 2000 3191 91.7 2.783** (9.77) 1.258 (1.59) 0.838 (0.80)
Colombia DHS 2000 4998 92.5 1.765** (10.29) 0.873 (1.15) 0.594* (2.48)
Dominican Republic MICS 2000 2657 92.4 1.456** (5.79) 0.757 (1.67) 0.360** (3.61)
Guyana MICS 2000 2920 96.5 1.357** (3.43) 0.764 0.95 1.397 (0.77)
Haiti DHS 2000 7879 54.4 1.777** (15.21) 0.848* (2.15) 1.196 (1.10)
Nicaragua DHS 2001 10747 80.4 1.147** (7.51) 0.632** (7.60) 1.006 (0.05)
Peru DHS 2000 19682 95.5 1.506** (11.85) 1.188* (2.08) 0.971 (0.19)
Suriname MICS 2000 2073 89.5 1.297** (4.13) 0.742* (2.00) 2.952** (4.32)

Table A5. Net effects of children’s background characteristics on primary school participation
97
F MF M F GPI
Odds ratios
PARTICIPATION
Country or territory
Second wealth quintile Third wealth quintile Fourth wealth quintile Richest wealth quintile Mother has formal education
1.515** (2.61) 1.531* (2.12) 2.337** (3.43) 4.111** (6.77) 1.925** (4.14)
1.398* (2.34) 2.256** (4.94) 3.671** (6.15) 4.789** (6.57) 2.641** (7.68)
1.275 (1.76) 2.441** (6.37) 4.413** (9.75) 11.221** (13.99) 2.943** (9.39)
1.200 (1.25) 1.289 (1.54) 2.171** (4.59) 3.251** (5.93) 2.968** (9.11)
1.084 (0.73) 1.213 (1.96) 1.681** (4.56) 3.663** (7.03) 2.987** (11.98)
1.203 (1.07) 1.558** (3.08) 1.956** (3.41) 3.209** (6.05) 1.481** (4.06)
1.229 (0.87) 1.193 (0.86) 1.286 (1.30) 3.251** (4.98) 3.056** (7.67)
1.438** (2.65) 2.431** (4.64) 4.621** (7.92) 8.894** (10.83) 3.181** (9.69)
1.015 (0.10) 1.404 (1.85) 1.529* (1.99) 2.109** (3.61) 1.385* (2.32)
1.101 (1.04) 1.393** (2.68) 2.293** (3.99) 3.082** (4.72) 3.327** (11.51)
1.151 (0.87) 1.558** (2.84) 1.964** (4.04) 3.166** (5.71) 2.750** (7.89)
1.293* (2.08) 1.771** (3.68) 2.220** (4.96) 4.039** (6.58) 2.288** (7.52)
1.901** (6.67) 2.552** (8.83) 4.357** (10.98) 3.729** (8.18) 1.557** (5.58)
1.087 (1.35) 1.759** (8.21) 1.956** (7.59) 2.584** (10.53) 3.646** (26.22)
1.275 (1.66) 1.383* (2.26) 1.321 (1.71) 1.675* (2.46) 2.562** (8.61)
1.454** (4.20) 2.357** (8.90) 3.393** (12.69) 8.239** (20.16) 1.926** (9.88)
2.164** (5.09) 2.897** (5.14) 3.894** (3.96) 6.305** (6.80) 1.771** (4.63)
1.563** (3.02) 2.342** (6.42) 3.337** (7.99) 5.615** (9.81) 2.446** (9.15)
1.200 (1.09) 1.515* (2.15) 2.531** (4.73) 4.899** (5.82) 6.022** (4.86)
1.950** (5.15) 2.369** (5.84) 3.457** (8.01) 3.654** (7.95) 5.577** (5.70)
1.356 (1.61) 1.852** (3.27) 2.384** (3.75) 2.238** (3.09) 3.265** (5.05)
1.517* (2.02) 2.459** (3.50) 2.978** (3.82) 3.723** (3.47) 2.116** (3.73)
2.182** (4.06) 2.663** (3.90) 5.470** (5.87) 6.562** (5.85) 2.398** (6.53)
1.357 (1.37) 6.242** (5.43) 5.910** (4.62) 6.683** (3.69) 2.054** (2.69)
1.673 (1.62) 1.367 (0.89) 2.330 (1.86) 3.102* (2.43) 3.596** (3.53)
1.798** (4.42) 2.633** (4.88) 3.282** (5.77) 5.396** (6.98) 2.676** (9.73)
2.536** (7.91) 4.041** (10.00) 8.388** (10.47) 11.380** (9.18) 2.293** (11.02)
2.032** (5.97) 2.564** (4.88) 3.732** (4.92) 7.763** (5.78) 2.592** (8.95)
0.870 (0.43) 1.775 (1.60) 1.560 (1.23) 2.399* (2.03) 3.673** (5.67)
Gambia
Ghana
Guinea
Guinea-Bissau
Mali
Mauritania
Niger
Nigeria
Sao Tome and Principe
Senegal
Sierra Leone
Togo
South Asia
Bangladesh
India
Nepal
East Asia and the Pacific
Cambodia
Indonesia
Lao PDR
Mongolia
Philippines
Viet Nam
Latin America and the Caribbean
Bolivia
Colombia
Dominican Republic
Guyana
Haiti
Nicaragua
Peru
Suriname
Notes:
Robust z-statistics in parentheses.Logistic regression, odds ratio.* Significant at 5%.** Significant at 1%.

98
Children Out of School: Measur ing Exclusion from Pr imary Education
F MF M F GPI
Primary school-age children (6-10 years) (%)
TABLE A6. PATTERNS OF SCHOOL ATTENDANCE IN INDIA, 2000
In school
Totalin school Pre-primary Primary Secondary Tertiary Non-
standard None In time Underage Overage Total outof school Left school Never in
school
Out of school
Male 80.3 4.5 76.3 4.0 0.0 1.1 14.1 49.1 18.5 12.7 19.7 1.7 18.1
Female 73.2 3.9 69.6 3.6 0.0 1.4 21.5 44.2 17.7 11.3 26.8 1.7 25.1
Urban 84.0 4.8 78.2 5.9 0.0 1.3 9.8 51.4 24.3 8.3 16.0 1.6 14.4
Rural 74.6 4.0 71.5 3.2 0.0 1.2 20.1 45.3 16.2 13.2 25.4 1.7 23.7
Richest 90.2 5.0 82.9 7.2 0.0 0.5 4.3 56.7 27.2 6.4 9.8 0.9 8.9
Poorest 66.7 3.5 64.6 2.2 0.0 0.7 29.1 40.3 13.0 13.4 33.3 2.1 31.1
Mother has some ed. 91.6 4.8 85.4 6.2 0.0 0.2 3.3 57.5 27.7 6.5 8.4 0.7 7.7
Mother has no ed. 70.0 3.9 67.3 2.6 0.0 1.7 24.5 41.8 13.6 14.6 30.0 2.0 28.0
Total 76.8 4.2 73.0 3.8 0.0 1.2 17.7 46.7 18.1 12.0 23.2 1.7 21.5
F MF M F GPI
Secondary school-age children (11-17 years) (%)
In school
Totalin school Pre-primary Primary Secondary Tertiary Non-
standard None In time Underage Overage Total outof school Left school Never in
school
Out of school
Male 80.3 0.2 25.8 54.5 0.0 0.4 19.1 39.5 13.5 27.3 19.7 9.9 9.8
Female 65.2 0.1 18.8 46.4 0.0 0.9 33.8 33.2 12.5 19.5 34.8 12.3 22.5
Urban 82.9 0.1 16.7 66.3 0.0 0.4 16.6 45.5 20.1 17.3 17.1 9.1 7.9
Rural 69.1 0.2 24.4 44.7 0.0 0.7 30 33.1 10.4 25.6 30.9 11.8 19.1
Richest 92.3 0.1 13.3 79.0 0.0 0.2 7.4 52.7 26.2 13.4 7.7 4.2 3.4
Poorest 58.2 0.3 25.6 32.6 0.0 0.6 40.9 24.3 6.2 27.7 41.8 13.5 28.3
Mother has some ed. 93.7 0.1 15.0 78.7 0.0 0.1 6.1 54.4 24.7 14.7 6.3 4.7 1.6
Mother has no ed. 63.8 0.2 26.3 37.5 0.0 0.9 35.1 28.0 7.6 28.2 36.2 13.7 22.4
Total 72.8 0.2 22.3 50.4 0.0 0.6 26.5 36.4 13.0 23.4 27.2 11.1 16.1
Source: MICS.

99
F MF M F GPI
Primary school-age children (7-12 years) (%)
TABLE A7. PATTERNS OF SCHOOL ATTENDANCE IN INDONESIA, 2002/03
In school
Totalin school Pre-primary Primary Secondary Tertiary Non-
standard None In time Underage Overage Total outof school Left school Never in
school
Out of school
Male 94.1 0.1 87.8 6.3 0.0 0.0 5.8 67.5 15.7 10.7 6.1 3.1 2.8
Female 94.8 0.2 86.9 7.9 0.1 0.0 5.0 66.1 20.2 8.4 5.3 2.4 2.7
Urban 96.0 0.0 86.7 9.4 0.0 0.0 4.0 66.4 22.1 7.2 4.2 2.2 1.7
Rural 93.2 0.2 87.9 5.2 0.0 0.0 6.6 67.2 14.4 11.6 6.9 3.2 3.6
Richest 98.0 0.0 85.5 12.5 0.0 0.0 2.0 65.4 28.7 3.9 2.0 1.0 1.0
Poorest 88.8 0.0 85.8 3.0 0.0 0.0 11.1 63.4 9.9 15.1 11.6 4.6 6.6
Mother has some ed. 95.2 0.1 87.6 7.6 0.0 0.0 4.6 67.4 19.5 8.2 4.9 2.4 2.4
Mother has no ed. 87.3 0.2 83.8 3.6 0.0 0.0 12.5 59.8 7.5 20 12.7 6.1 6.6
Total 94.4 0.1 87.3 7.1 0.0 0.0 5.4 66.8 17.9 9.6 5.7 2.8 2.8
F MF M F GPI
Secondary school-age children (13-18 years) (%)
In school
Totalin school Pre-primary Primary Secondary Tertiary Non-
standard None In time Underage Overage Total outof school Left school Never in
school
Out of school
Male 60.5 0.0 6.7 53.1 0.8 0.0 39.5 40.4 6.3 13.7 39.5 38.4 1.1
Female 61.0 0.0 5.3 54.5 1.3 0.0 38.9 42.4 8.6 10.0 39.0 38.1 0.9
Urban 70.0 0.0 4.1 64.0 1.9 0.0 30.0 49.0 10.5 10.3 30.0 29.6 0.5
Rural 51.9 0.0 7.9 43.9 0.2 0.0 48.1 34.0 4.4 13.5 48.1 46.6 1.5
Richest 78.3 0.0 2.3 73.0 3.0 0.0 21.7 55.9 14.8 7.6 21.7 21.4 0.4
Poorest 39.9 0.1 10.3 29.5 0.2 0.0 60.0 23.9 2.2 13.6 60.1 57.3 2.8
Mother has some ed. 84.5 0.0 14.1 70.4 0.0 0.0 15.5 61.8 10.9 11.6 15.5 14.9 0.6
Mother has no ed. 58.5 0.1 18.9 39.7 0.0 0.0 41.3 38.0 3.5 17.0 41.5 39.1 2.4
Total 60.8 0.0 6.0 53.7 1.0 0.0 39.2 41.4 7.4 11.9 39.2 38.2 1.0
Table A7. Patterns of school attendance in Indonesia, 2002/03
Source: DHS.

100
Children Out of School: Measur ing Exclusion from Pr imary Education
F MF M F GPI
Primary school-age children (7-12 years) (%)
TABLE A8. PATTERNS OF SCHOOL ATTENDANCE IN MALI, 2001
In school
Totalin school Pre-primary Primary Secondary Tertiary Non-
standard None In time Underage Overage Total outof school Left school Never in
school
Out of school
Male 45.0 0.0 44.3 0.8 0.0 0.0 55.0 26.1 9.4 9.5 55.0 1.7 53.3
Female 33.6 0.0 32.9 0.7 0.0 0.0 66.4 19.1 7.3 7.1 66.4 1.7 64.7
Urban 66.2 0.0 63.6 2.7 0.0 0.0 33.8 36.3 21.6 8.3 33.8 1.5 32.2
Rural 30.9 0.0 30.8 0.1 0.0 0.0 69.1 18.3 4.3 8.3 69.1 1.8 67.3
Richest 74.1 0.0 70.6 3.5 0.0 0.0 25.9 38.3 28.1 7.7 25.9 1.3 24.6
Poorest 26.0 0.0 26.0 0.0 0.0 0.0 74.0 15.5 3.7 6.8 74.0 2.0 72.0
Mother has some ed. 69.2 0.0 65.4 3.8 0.0 0.0 30.8 33.1 27.4 8.8 30.8 1.7 29.0
Mother has no ed. 35.0 0.0 34.8 0.3 0.0 0.0 65.0 21.1 5.6 8.3 65.0 1.7 63.3
Total 39.2 0.0 38.5 0.7 0.0 0.0 60.8 22.6 8.4 8.3 60.8 1.7 59.1
F MF M F GPI
Secondary school-age children (13-18 years) (%)
In school
Totalin school Pre-primary Primary Secondary Tertiary Non-
standard None In time Underage Overage Total outof school Left school Never in
school
Out of school
Male 36.4 0.0 21.0 15.3 0.1 0.0 63.6 9.3 1.7 25.4 63.6 8.1 55.4
Female 22.6 0.0 12.0 10.4 0.1 0.0 77.4 6.7 1.6 14.3 77.4 7.9 69.5
Urban 49.7 0.0 19.5 29.9 0.3 0.0 50.3 17.0 4.5 28.1 50.4 9.7 40.7
Rural 18.6 0.0 14.9 3.7 0.0 0.0 81.4 3.2 0.1 15.3 81.4 7.1 74.3
Richest 53.4 0.0 18.4 34.6 0.4 0.0 46.6 20.0 5.6 27.6 46.8 9.3 37.3
Poorest 14.0 0.0 12.4 1.5 0.0 0.0 86.0 2.0 0.0 12.0 86.0 6.9 79.1
Mother has some ed. 69.1 0.0 40.3 28.8 0.0 0.0 30.9 24.1 14.4 30.6 30.9 7.5 23.3
Mother has no ed. 31.6 0.0 27.6 4.0 0.0 0.0 68.4 8.5 0.5 22.5 68.4 4.7 63.7
Total 29.4 0,0 16.5 12.9 0.1 0.0 70.6 8.0 1.6 19.8 70.6 8.0 62.5
Source: DHS.

101
F MF M F GPI
Primary school-age children (12-17 years) (%)
TABLE A9. PATTERNS OF SCHOOL ATTENDANCE IN NIGERIA, 2003
In school
Totalin school Pre-primary Primary Secondary Tertiary Non-
standard None In time Underage Overage Total outof school Left school Never in
school
Out of school
Male 65.5 4.8 63.7 1.7 0.1 0.0 29.7 37.4 9.0 19.0 34.5 1.0 33.5
Female 58.1 3.8 56.6 1.5 0.0 0.0 38.1 30.9 8.8 18.4 41.9 0.5 41.3
Urban 72.2 6.2 69.4 2.6 0.2 0.0 21.6 41.5 11.7 19.0 27.8 0.9 26.9
Rural 56.9 3.4 55.9 1.1 0.0 0.0 39.7 30.7 7.6 18.6 43.1 0.7 42.3
Richest 87.6 7.5 83.2 4.4 0.1 0.0 4.9 54.4 16.3 16.9 12.4 0.6 11.8
Poorest 41.5 2.8 40.7 0.5 0.2 0.0 55.7 21.0 3.3 17.2 58.5 0.9 57.7
Mother has some ed. 81.4 7.1 78.6 2.8 0.0 0.0 11.5 49.2 13.2 19.0 18.6 0.8 17.8
Mother has no ed. 45.9 2.4 45.1 0.7 0.1 0.0 51.7 23.3 6.0 16.6 54.1 0.7 53.4
Total 61.9 4.3 60.2 1.6 0.1 0.0 33.8 34.2 8.9 18.7 38.1 0.8 37.3
F MF M F GPI
Secondary school-age children (13-18 years) (%)
In school
Totalin school Pre-primary Primary Secondary Tertiary Non-
standard None In time Underage Overage Total outof school Left school Never in
school
Out of school
Male 74.2 0.1 37.0 37.2 0.1 0.0 25.7 21.0 4.4 48.9 25.8 7.1 18.6
Female 63.0 0.1 30.6 32.3 0.2 0.0 36.8 18.0 5.5 39.5 37.0 8.9 28.1
Urban 78.7 0.0 32.4 45.9 0.3 0.0 21.3 26.8 7.9 44.0 21.3 7.4 13.9
Rural 62.9 0.2 34.5 28.3 0.0 0.0 37.0 15.4 3.2 44.3 37.1 8.3 28.8
Richest 87.5 0.0 24.3 63.0 0.2 0.0 12.5 39.8 13.1 34.7 12.5 9.0 3.5
Poorest 47.8 0.3 34.3 13.5 0.0 0.0 51.9 6.6 1.6 39.6 52.2 7.1 45.1
Mother has some ed. 94.2 0.2 48.5 45.7 0.0 0.0 5.6 36.7 11.8 45.8 5.8 2.2 3.6
Mother has no ed. 60.9 0.0 50.4 10.5 0.0 0.0 39.1 10.3 2.5 48.1 39.1 4.0 35.1
Total 68.6 0.1 33.8 34.7 0.1 0.0 31.3 19.5 4.9 44.2 31.4 8.0 23.4
Table A9. Patterns of school attendance in Nigeria, DHS, 2003
Source: DHS.

102
Children Out of School: Measur ing Exclusion from Pr imary Education
F MF M F GPI
Children of primary school age
TABLE A10. CHILD PROFILES BY SCHOOLING STATUS IN INDIA, 2000
Category Total In school Out of school
% Freq. % Freq. % Freq.
Age 6 years 19.9 14,075 18.6 11,415 26.1 2,359
7 years 19.7 13,969 20.1 12,348 18.2 1,644
8 years 20.6 14,600 21.1 12,999 18.3 1,657
9 years 16.8 11,852 17.6 10,808 12.9 1,169
10 years 23.0 16,234 22.6 13,907 24.5 2,218
Sex Female 48.6 34,392 46.4 28,517 59.0 5,340
Male 51.4 36,337 53.6 32,960 41.0 3,706
Maternal status Mother deceased 2.0 1,407 1.7 1,058 3.3 293
Mother living 98.0 68,991 98.3 60,134 96.7 8,707
Mother’s presence Mother not in HH 7.2 5,059 7.0 4,309 7.8 703
Mother in HH 92.8 65,545 93.0 57,071 92.2 8,315
Mother’s highest None 66.5 43,604 60.8 34,755 93.4 7,682
education level Pre-primary 0.1 74 0.1 72 0.1 4
Primary 10.7 7,040 12.3 7,053 3.2 264
Secondary 19.2 12,598 22.7 12,984 2.7 221
Tertiary 2.6 1,725 3.2 1,813 0.1 7
Non-standard 0.8 530 0.8 485 0.6 47
Mother’s literacy Not literate 66.4 43,762 60.7 34,887 93.3 7,700
Literate 33.6 22,140 39.3 22,574 6.7 556
Paternal status Father deceased 2.9 2,012 2.7 1,629 3.8 342
Father living 97.1 68,269 97.3 59,467 96.2 8,637
Father’s presence Father not in HH 11.4 8,059 11.4 6,993 11.5 1,034
Father in HH 88.6 62,460 88.6 54,313 88.5 7,973
Father’s highest None 39.0 24,122 32.2 17,328 71.4 5,579
education level Pre-primary 0.3 206 0.3 173 0.3 27
Primary 15.8 9,800 16.5 8,878 12.7 994
Secondary 37.0 22,872 41.8 22,508 14.3 1,118
Tertiary 7.4 4,583 8.8 4,764 0.7 54
Non-standard 0.4 267 0.4 209 0.6 46
Father’s literacy Not literate 38.7 24,234 31.9 17,409 70.8 5,608
Literate 61.3 38,353 68.1 37,082 29.2 2,318
Household head’s sex Female 8.0 5,688 8.2 5,050 7.3 657
Male 92.0 65,041 91.8 56,427 92.7 8,389
Household head’s None 46.3 32,207 40.3 24,379 74.4 6,627
highest education level Pre-primary 0.4 265 0.4 225 0.4 35
Primary 16.6 11,566 17.6 10,626 12.0 1,072
Secondary 30.5 21,192 34.5 20,824 11.8 1,054
Tertiary 5.6 3,881 6.7 4,026 0.6 50
Non-standard 0.6 437 0.6 361 0.7 65
Household head’s literacy Not literate 45.9 32,383 40.0 24,511 73.9 6,663
Literate 54.1 38,141 60.0 36,791 26.1 2,354
Location Rural 76.7 54,224 74.4 45,753 87.1 7,881
Urban 23.3 16,505 25.6 15,724 12.9 1,165
Religion of household Hinduism 78.9 54,177 78.7 46,986 79.6 7,046
head Islam 16.5 11,369 16.2 9,643 18.2 1,612
Christianity 2.3 1,586 2.5 1,504 1.3 118

Table A10. Child profiles by schooling status in India, 2000
103
F MF M F GPI
Children of primary school age
Category Total In school Out of school
% Freq. % Freq. % Freq.
Sikhism 1.3 867 1.4 849 0.5 43
Buddhism 0.6 401 0.7 394 0.2 20
Jainism 0.3 201 0.4 210 0.0 2
Other 0.2 106 0.2 90 0.2 15
Caste or tribe of Scheduled caste 20.3 13,952 19.0 11,344 26.3 2,334
household head Scheduled tribe 8.5 5,823 7.2 4,309 14.3 1,270
None of the above 71.2 48,927 73.8 44,016 59.3 5,252
Total 100.0 70,729 100.0 61,477 100.0 9,046
Source: MICS.

104
Children Out of School: Measur ing Exclusion from Pr imary Education
F MF M F GPI
Children of primary school age
TABLE A10. CHILD PROFILES BY SCHOOLING STATUS IN INDIA, 2000
Category Total In school Out of school
% Freq. % Freq. % Freq.
Household wealth Poorest 22.7 15,932 19.5 11,943 37.3 3,358
Second poorest 22.5 15,825 20.8 12,694 30.6 2,756
Middle 20.1 14,147 20.9 12,784 16.4 1,473
Second richest 19.5 13,693 21.1 12,869 12.1 1,086
Richest 15.2 10,701 17.7 10,820 3.6 324
Child labour Not working 89.9 63,449 92.2 56,632 79.2 7,139
Working 10.1 7,147 7.8 4,821 20.8 1,874
Region Andhra Pradesh 7.6 5,406 8.1 5,005 5.4 487
Arunachal Pradesh 0.1 58 0.1 44 0.1 12
Assam 2.7 1,877 2.6 1,625 2.7 245
Bihar 12.8 9,064 10.1 6,220 25.5 2,306
Goa 0.1 50 0.1 51 0.0 1
Gujarat 4.0 2,800 4.0 2,442 3.9 355
Haryana 1.7 1,232 1.9 1,171 1.0 87
Himachal Pradesh 0.5 344 0.6 355 0.1 6
Jammu & Kashmir 0.8 592 0.9 541 0.6 54
Karnataka 4.5 3,177 4.8 2,947 3.0 272
Kerala 2.2 1,590 2.7 1,662 0.1 11
Madhya Pradesh 7.6 5,371 7.4 4,532 8.7 788
Maharashtra 6.8 4,787 7.7 4,746 2.3 205
Manipur 0.2 121 0.2 122 0.1 5
Meghalaya 0.3 229 0.3 199 0.3 30
Mizoram 0.1 40 0.1 38 0.0 3
Nagaland 0.1 91 0.1 87 0.1 6
Orissa 3.8 2,699 3.7 2,251 4.5 405
Punjab 1.8 1,277 2.0 1,213 1.0 87
Rajasthan 5.8 4,072 5.7 3,527 5.8 529
Sikkim 0.0 35 0.1 35 0.0 1
Tamil Nadu 4.9 3,499 5.8 3,547 1.1 103
Tripura 0.2 155 0.2 150 0.1 9
Uttar Pradesh 22.3 15,743 21.7 13,319 25.1 2,271
West Bengal 7.8 5,491 7.7 4,752 7.9 714
A & N Islands 0.0 18 0.0 18 0.0 0
Chandigarh 0.1 41 0.1 42 0.0 1
Dadra & Nagar Haveli 0.0 7 0.0 6 0.0 1
Daman & Diu 0.0 5 0.0 5 0.0 0
Delhi 1.2 826 1.3 795 0.6 51
Lakshadweep 0.0 3 0.0 3 0.0 0
Pondichery 0.0 29 0.0 29 0.0 0
Total 100.0 70,729 100.0 61,477 100.0 9,046
Source: MICS.

105
F MF M F GPI
Children of primary school age
TABLE A11. CHILD PROFILES BY SCHOOLING STATUS IN INDONESIA, 2002/03
Category Total In school Out of school
% Freq. % Freq. % Freq.
Age 7 years 16.9 3,259 16.3 2,943 29.4 329
8 years 16.4 3,161 16.6 2,993 11.4 127
9 years 16.3 3,143 16.7 3,022 8.1 91
10 years 17.0 3,278 17.4 3,148 9.9 110
11 years 15.9 3,062 16.1 2,913 11.0 123
12 years 17.6 3,396 17.0 3,066 30.1 337
Sex Female 47.9 9,246 48.1 8,706 43.4 485
Male 52.1 10,053 51.9 9,378 56.6 632
Maternal status Mother deceased 1.3 258 1.3 237 1.7 19
Mother living 98.7 19,020 98.7 17,829 98.3 1,095
Mother’s presence Mother not in HH 7.6 1,473 7.6 1,370 8.5 95
Mother in HH 92.4 17,825 92.4 16,713 91.5 1,022
Mother's highest None 9.6 1,717 8.9 1,490 24.3 244
education level Primary 58.4 10,433 58.1 9,742 64.9 650
Secondary 28.0 5,003 28.9 4,841 10.2 102
Tertiary 4.0 721 4.2 708 0.7 7
Paternal status Father deceased 3.2 620 3.1 559 5.6 62
Father living 96.8 18,628 96.9 17,481 94.4 1,048
Father’s presence Father not in HH 11.4 2,199 11.3 2,050 13.1 147
Father in HH 88.6 17,100 88.7 16,034 86.9 970
Father's highest None 5.7 975 5.3 843 14.7 140
education level Primary 55.2 9,418 54.6 8,744 69.1 656
Secondary 33.1 5,646 33.9 5,430 15.3 146
Tertiary 6.0 1,016 6.2 1,000 0.8 8
Household head's sex Female 6.8 1,306 6.8 1,223 7.0 78
Male 93.2 17,993 93.2 16,861 93.0 1,039
Household head's None 9.3 1,800 8.9 1,600 19.0 212
highest education level Primary 54.8 10,560 54.3 9,807 65.3 729
Secondary 30.5 5,886 31.3 5,649 14.5 162
Tertiary 5.3 1,026 5.6 1,004 1.1 13
Location Rural 55.3 10,680 54.6 9,882 70.2 784
Urban 44.7 8,619 45.4 8,202 29.8 333
Region Sumatra 22.5 4,347 22.5 4,071 22.0 246
Java 58.2 11,235 58.7 10,614 47.5 530
Bali & Nusa Tenggara 5.5 1,062 5.4 975 8.2 91
Kalimantan 5.7 1,102 5.6 1,004 9.5 106
Sulawesi 8.1 1,553 7.9 1,420 12.9 144
Household wealth Poorest 23.6 4,550 22.2 4,006 52.2 583
Second poorest 20.1 3,884 20.1 3,631 21.2 237
Middle 19.3 3,721 19.6 3,538 12.6 141
Second richest 19.4 3,741 19.9 3,604 8.0 89
Richest 17.6 3,403 18.3 3,305 6.0 67
Total 100.0 19,299 100.0 18,084 100.0 1,117
Table A11. Child profiles by schooling status in Indonesia, 2002/03
Source: DHS.

106
Children Out of School: Measur ing Exclusion from Pr imary Education
F MF M F GPI
Children of primary school age
TABLE A12. CHILD PROFILES BY SCHOOLING STATUS IN MALI, 2001
Category Total In school Out of school
% Freq. % Freq. % Freq.
Age 7 years 19.3 2,350 15.2 723 21.9 1,628
8 years 18.8 2,290 18.9 899 18.7 1,389
9 years 13.6 1,663 15.7 747 12.3 912
10 years 19.0 2,320 20.3 967 18.2 1,350
11 years 13.0 1,590 15.0 714 11.7 872
12 years 16.3 1,993 14.9 710 17.2 1,278
Sex Female 51.0 6,226 43.7 2,079 55.8 4,147
Male 49.0 5,978 56.3 2,679 44.2 3,282
Maternal status Mother deceased 3.3 398 3.0 142 3.5 257
Mother living 96.7 11,697 97.0 4,589 96.5 7,091
Mother’s presence Mother not in HH 19.2 2,346 18.1 861 20.0 1,484
Mother in HH 80.8 9,846 81.9 3,894 80.0 5,936
Mother's highest None 86.2 8,358 75.9 2,897 92.9 5,457
education level Primary 9.6 931 14.0 535 6.7 391
Secondary 3.7 361 8.8 334 0.4 23
Tertiary 0.5 50 1.3 50 - -
Paternal status Father deceased 5.0 602 4.9 232 5.0 369
Father living 95.0 11,478 95.1 4,498 95.0 6,965
Father’s presence Father not in HH 21.8 2,656 21.4 1,016 22.1 1,638
Father in HH 78.2 9,541 78.6 3,739 77.9 5,787
Father's highest None 82.5 7,698 68.8 2,507 91.2 5,184
education level Primary 8.7 810 11.8 430 6.7 379
Secondary 6.9 648 14.6 531 2.0 113
Tertiary 1.9 180 4.8 174 0.1 5
Household head's sex Female 8.3 1,008 8.3 392 8.3 615
Male 91.7 11,198 91.8 4,368 91.7 6,814
Household head's highest None 82.0 9,914 67.9 3,184 91.1 6,721
education level Primary 8.9 1,081 12.7 596 6.6 484
Secondary 7.0 851 14.5 682 2.2 164
Tertiary 2.0 244 4.9 231 0.2 11
Location Rural 76.5 9,342 60.4 2,874 87.0 6,461
Urban 23.5 2,864 39.6 1,886 13.0 968
Region Kayes 13.0 1,581 11.0 521 14.3 1,060
Koulikoro 16.7 2,037 19.0 905 15.2 1,129
Sikasso 21.0 2,560 18.8 897 22.3 1,659
Segou 19.9 2,425 16.1 765 22.4 1,662
Mopti 13.6 1,663 8.0 382 17.2 1,278
Tombouctou 2.8 347 2.0 96 3.4 250
Gao 1.9 232 2.4 114 1.6 117
Kidal 0.2 18 0.2 11 0.1 6
Bamako 11.0 1,344 22.5 1,068 3.6 268
Household wealth Poorest 21.5 2,624 14.2 677 26.2 1,943
Second poorest 20.8 2,544 15.2 721 24.6 1,824
Middle 20.3 2,472 16.2 772 22.9 1,699
Second richest 20.1 2,458 21.8 1,036 19.1 1,418
Richest 17.3 2,108 32.6 1,554 7.3 544
Child labour Not working 61.5 7,412 71.8 3,376 54.9 4,021
Working 38.5 4,633 28.2 1,325 45.1 3,306
Total 100.0 12,206 100.0 4,760 100.0 7,429
Note:- Magnitude nil or negligible.
Source: DHS.


108
F MF M F GPI
Children of primary school age
TABLE A13. CHILD PROFILES BY SCHOOLING STATUS IN NIGERIA, 2003
Category Total In school Out of school
% Freq. % Freq. % Freq.
Age 6 years 18.4 1,070 13.5 534 28.1 514
7 years 18.8 1,093 17.3 685 21.8 399
8 years 18.5 1,076 19.2 759 17.2 315
9 years 14.4 836 16.3 644 10.8 198
10 years 18.1 1,053 19.2 758 16.3 298
11 years 11.7 679 14.6 580 6.0 109
Sex Female 49.2 2,854 45.9 1,819 55.6 1,019
Male 50.9 2,953 54.1 2,141 44.4 813
Maternal status Mother deceased 3.6 207 3.7 143 3.4 62
Mother living 96.4 5,540 96.4 3,779 96.6 1,748
Mother’s presence Mother not in HH 21.4 1,244 22.5 891 19.3 353
Mother in HH 78.6 4,559 77.5 3,067 80.7 1,477
Mother's highest None 57.2 2,574 42.1 1,280 86.2 1,248
education level Pre-primary 0.2 9 0.3 9 0.0 0
Primary 22.5 1,014 28.7 872 10.9 158
Secondary 16.3 731 23.2 707 2.6 38
Tertiary 3.8 172 5.7 174 0.2 3
Mother’s literacy Not literate 63.9 2,881 51.5 1,570 87.9 1,272
Literate 36.1 1,626 48.5 1,481 12.1 174
Paternal status Father deceased 5.4 314 6.2 243 3.9 72
Father living 94.6 5,453 93.8 3,694 96.1 1,743
Father’s presence Father not in HH 23.5 1,361 26.4 1,047 17.6 321
Father in HH 76.5 4,441 73.6 2,913 82.4 1,506
Father's highest None 47.2 2,039 30.8 883 76.5 1,106
education level Pre-primary 0.2 6 0.1 4 0.2 2
Primary 24.5 1,060 30.5 873 14.1 204
Secondary 17.3 746 22.8 653 7.3 106
Tertiary 10.9 469 15.7 451 2.0 28
Father’s literacy Not literate 46.0 1,998 32.8 942 69.8 1,015
Literate 54.0 2,342 67.2 1,934 30.2 439
Household head's sex Female 12.0 694 15.0 593 5.9 109
Male 88.0 5,113 85.0 3,367 94.1 1,723
Household head's highest None 47.7 2,743 33.8 1,328 75.5 1,363
education level Pre-primary 0.2 9 0.1 5 0.3 4
Primary 24.2 1,389 29.1 1,145 14.4 260
Secondary 17.9 1,029 22.7 894 8.2 148
Tertiary 10.1 582 14.3 560 1.7 30
Household head’s literacy Not literate 47.7 2,755 36.5 1,440 70.1 1,273
Literate 52.3 3,021 63.5 2,505 29.9 543
Location Rural 67.7 3,933 61.8 2,446 79.8 1,462
Urban 32.3 1,874 38.2 1,514 20.2 370
Region North Central 15.9 925 18.9 747 10.2 187
North East 20.8 1,209 14.8 587 32.7 599
North West 30.1 1,749 20.0 792 50.0 915
South East 7.2 421 10.0 395 1.8 33
South South 15.7 910 21.8 865 3.6 66
South West 10.2 593 14.5 574 1.8 32
Children Out of School: Measur ing Exclusion from Pr imary Education

109
F MF M F GPI
Children of primary school age
Category Total In school Out of school
% Freq. % Freq. % Freq.
Native language of Hausa 31.2 1,767 19.6 756 54.2 965
respondent Yoruba 9.7 548 13.9 536 1.3 24
Igbo 9.2 520 12.8 494 2.0 36
English 0.9 50 1.3 49 0.2 3
Other 49.0 2,772 52.5 2,028 42.2 752
Household wealth Poorest 21.5 1,250 14.4 571 35.7 653
Second 21.2 1,233 16.3 647 31.0 567
Middle 20.5 1,189 20.4 806 20.8 380
Fourth 20.0 1,162 24.9 985 10.3 189
Richest 16.8 973 24.1 952 2.3 41
Total 100.0 5,807 100.0 3,960 100.0 1,832
Table A13. Child profiles by schooling status in Nigeria, 2003
Source: DHS.

110
Children Out of School: Measur ing Exclusion from Pr imary Education
F M F
India (MICS, 2000) Indonesia (DHS, 2002/03)
TABLE A14. LIKELIHOOD TO ATTEND SCHOOL AMONG CHILDREN AGED 6-10 YEARS IN INDIA AND INDONESIA
Variable Marginal effect (z-statistic) Variable Marginal effect (z-statistic)
Age 0.013 ** (9.5) Age 0 (0.2)
Male 0.059 ** (12.7) Male -0.006 (1.6)
Orphan (one or both parents deceased) -0.036 ** (3.6) Orphan (one or both parents deceased) -0.017 * (2.0)
Child labourer -0.169 ** (18.3)
Mother has primary education 0.073 ** (10.1) Mother has primary education 0.015 ** (2.6)
Mother has secondary or tertiary education 0.094 ** (13.2) Mother has secondary or tertiary education 0.028 ** (4.4)
Father has primary education 0.028 ** (3.0) Father has primary education -0.005 (0.7)
Father has secondary or tertiary education 0.071 ** (8.5) Father has secondary or tertiary education 0.009 (1.0)
HH head has primary education 0.048 ** (5.7) HH head has primary education 0.018 ** (2.6)
HH head has secondary or tertiary education 0.065 ** (7.6) HH head has secondary or tertiary education 0.018 * (2.0)
HH head male -0.031 ** (3.5) HH head male -0.011 (1.5)
Number of HH members <5 years old -0.016 ** (6.5) Number of HH members <5 years old -0.008 ** (2.9)
Number of HH members 5-59 years old -0.001 (0.7) Number of HH members 5-59 years old -0.002 (1.7)
Number of HH members 60+ years old 0.019 ** (5.0) Number of HH members 60+ years old 0.009 * (2.4)
HH in second poorest wealth quintile 0.020 ** (2.8) HH in second poorest wealth quintile 0.024 ** (5.1)
HH in middle wealth quintile 0.042 ** (5.6) HH in middle wealth quintile 0.032 ** (5.9)
HH in second richest wealth quintile 0.056 ** (6.4) HH in second richest wealth quintile 0.037 ** (5.6)
HH in richest wealth quintile 0.077 ** (7.2) HH in richest wealth quintile 0.036 ** (4.7)
HH head Muslim -0.011 (1.0)
HH head Christian 0.019 (1.2)
HH head Sikh 0.017 (0.8)
HH head Buddhist -0.004 (0.1)
HH head other religion -0.003 (0.1)
HH head in scheduled caste -0.008 (1.0)
HH head in scheduled tribe -0.035 ** (3.0)
Urban -0.009 (1.2) Urban -0.008 (1.3)
Andhra Pradesh 0.063 ** (6.1) Java 0.001 (0.1)
Assam 0.028 * (2.1) Sumatra 0.003 (0.4)
Bihar -0.091 ** (5.6) Kalimantan -0.01 (1.0)
Gujarat -0.003 (0.2) Sulawesi -0.017 * (2.5)
Haryana 0.043 ** (3.6)
Himachal Pradesh 0.089 ** (6.1)
Jammu and Kashmir 0.045 ** (3.6)
Karnataka 0.052 ** (3.6)
Kerala 0.087 ** (5.9)
Madhya Pradesh 0.008 (0.6)
Maharashtra 0.075 ** (6.7)
Manipur 0.081 ** (5.9)
Meghalaya 0.031 (1.6)
Orissa 0.008 (0.6)
Punjab 0.035 * (2.1)
Rajasthan 0.023 (1.9)
Tamil Nadu 0.101 ** (11.3)
Tripura 0.070 ** (3.7)
West Bengal -0.002 (0.1)
Delhi -0.01 (0.6)
Small states 0.048 ** (3.9)
Notes:
Robust z-statistics in parentheses.* Significant at 5%.
** Significant at 1%.

Table A15. Likelihood to attend school among children 6-10 years in Mali and Nigeria
111
M F
Mali (DHS, 2001) Nigeria (DHS, 2003)
TABLE A15. LIKELIHOOD TO ATTEND SCHOOL AMONG CHILDREN AGED 6-10 YEARS IN MALI AND NIGERIA
Variable Marginal effect (z-statistic) Variable Marginal effect (z-statistic)
Age 0.017 ** (3.7) Age 0.061 ** (11.3)
Male 0.143 ** (9.6) Male 0.120 ** (7.4)
Orphan (one or both parents deceased) -0.014 (0.5) Orphan (one or both parents deceased) -0.018 (0.6)
Child laborer -0.116 ** (6.8)
Mother has primary education 0.123 ** (4.6) Mother has primary education 0.067 * (2.3)
Mother has secondary or tertiary education 0.427 ** (7.4) Mother has secondary or tertiary education 0.137 ** (3.9)
Father has primary education -0.027 (0.4) Father has primary education 0.100 ** (2.7)
Father has secondary or tertiary education 0.184 ** (3.7) Father has secondary or tertiary education 0.107 * (2.3)
HH head has primary education 0.177 ** (3.1) HH head has primary education 0.058 (1.6)
HH head has secondary or tertiary education 0.207 ** (4.8) HH head has secondary or tertiary education 0.099 * (2.3)
HH head male -0.01 (0.4) HH head male -0.094 ** (3.2)
Number of HH members <5 years old -0.007 (1.2) Number of HH members <5 years old -0.001 (0.1)
Number of HH members 5-59 years old 0.005 (1.6) Number of HH members 5-59 years old -0.002 (0.5)
Number of HH members 60+ years old 0.014 (1.0) Number of HH members 60+ years old 0.029 (1.5)
HH in second poorest wealth quintile 0.02 (0.8) HH in second poorest wealth quintile 0.078 ** (3.1)
HH in middle wealth quintile 0.056 * (2.6) HH in middle wealth quintile 0.156 ** (5.1)
HH in second richest wealth quintile 0.104 ** (4.0) HH in second richest wealth quintile 0.220 ** (6.4)
HH in richest wealth quintile 0.230 ** (5.3) HH in richest wealth quintile 0.256 ** (7.0)
Native language Hausa -0.098 * (2.4)
Native language Yoruba 0.136 ** (2.8)
Native language Igbo 0.120 ** (2.6)
Native language English 0.077 (1.0)
Urban 0.102 ** (3.0) Urban 0.008 (0.2)
Kayes -0.066 (1.1) North Central 0.149 ** (3.6)
Koulikoro 0.098 * (2.4) North East -0.008 (0.2)
Segou -0.019 (0.5) South East 0.123 * (2.2)
Mopti -0.133 ** (2.9) South South 0.228 ** (6.0)
Tombouctou -0.145 * (2.4) South West 0.166 ** (3.3)
Gao 0.063 (1.1)
Kidal 0.057 (1.1)
Bamako 0.094 (1.9)
Notes:
Robust z-statistics in parentheses.* Significant at 5%.
** Significant at 1%.

Children Out of School: Measur ing Exclusion from Pr imary Education
112
F MF M F GPI
TABLE A16. SAMPLING ERRORS AND CONFIDENCE INTERVALS FOR HOUSEHOLD SURVEY DATA
Country or territory
Algeria MICS 2000 93.5% 1.00% 91.5% 95.5% 6.5% 1.00% 4.5% 8.5% 6215
Angola MICS 2000 58.0% 1.28% 55.5% 60.5% 42.0% 1.28% 39.5% 44.5% 3615
Armenia DHS 2000 97.0% 0.50% 96.0% 98.0% 3.0% 0.50% 2.0% 4.0% 1376
Azerbaijan MICS 2000 90.9% 0.69% 89.5% 92.3% 9.1% 0.69% 7.7% 10.5% 2417
Bahrain MICS 2000 86.3% 1.49% 83.2% 89.3% 13.7% 1.49% 10.7% 16.8% 976
Bangladesh DHS 1999/00 79.3% 0.89% 77.5% 81.0% 20.7% 0.89% 19.0% 22.5% 6722
Benin DHS 2001 54.1% 1.56% 51.0% 57.1% 45.9% 1.56% 42.9% 49.0% 5664
Bolivia MICS 2000 91.7% 0.59% 90.5% 92.9% 8.3% 0.59% 7.1% 9.5% 3191
Bosnia And Herzegovina MICS 2000 86.2% 0.78% 84.7% 87.7% 13.8% 0.78% 12.3% 15.3% 2058
Botswana MICS 2000 84.2% 0.78% 82.6% 85.7% 15.8% 0.78% 14.3% 17.4% 4966
Brazil DHS 1996 95.5% 0.36% 94.8% 96.2% 4.5% 0.36% 3.8% 5.2% 5204
Burkina Faso DHS 1998/99 27.7% 1.43% 24.8% 30.5% 72.3% 1.43% 69.5% 75.2% 6098
Burundi MICS 2000 46.7% 1.41% 43.9% 49.4% 53.3% 1.41% 50.6% 56.1% 3909
Cambodia DHS 2000 65.3% 0.84% 63.6% 66.9% 34.7% 0.84% 33.1% 36.4% 13016
Cameroon MICS 2000 74.5% 2.58% 69.4% 79.6% 25.5% 2.58% 20.4% 30.6% 4297
Central African Republic MICS 2000 43.1% 1.14% 40.9% 45.4% 56.9% 1.14% 54.6% 59.1% 19344
Chad MICS 2000 39.3% 2.05% 35.3% 43.3% 60.7% 2.05% 56.7% 64.7% 5653
Colombia DHS 2000 92.5% 0.44% 91.6% 93.4% 7.5% 0.44% 6.6% 8.4% 4998
Comoros MICS 2000 30.8% 1.80% 27.2% 34.3% 69.2% 1.80% 65.7% 72.8% 4740
Congo DRC MICS 2000 51.6% 1.29% 49.1% 54.1% 48.4% 1.29% 45.9% 50.9% 9692
Côte d'Ivoire MICS 2000 57.8% 1.22% 55.4% 60.2% 42.2% 1.22% 39.8% 44.6% 10161
Dominican Republic MICS 2000 92.4% 0.97% 90.5% 94.3% 7.6% 0.97% 5.7% 9.5% 2657
Egypt DHS 2000 85.6% 0.52% 84.5% 86.6% 14.4% 0.52% 13.4% 15.5% 10563
Equatorial Guinea MICS 2000 61.7% 1.33% 59.1% 64.3% 38.3% 1.33% 35.7% 40.9% 2911
Eritrea DHS 2002 63.3% 1.53% 60.3% 66.3% 36.7% 1.53% 33.7% 39.7% 6735
Ethiopia DHS 2000 30.6% 1.25% 28.2% 33.1% 69.4% 1.25% 66.9% 71.8% 11431
Gabon DHS 2000/01 93.9% 0.49% 92.9% 94.9% 6.1% 0.49% 5.1% 7.1% 5168
Gambia MICS 2000 52.7% 2.41% 48.0% 57.5% 47.3% 2.41% 42.5% 52.0% 5294
Ghana DHS 1998/99 75.1% 1.42% 72.3% 77.9% 24.9% 1.42% 22.1% 27.7% 4029
Guatemala DHS 1998/99 77.8% 1.39% 75.1% 80.6% 22.2% 1.39% 19.4% 24.9% 5308
Guinea DHS 1999 39.6% 1.30% 37.1% 42.2% 60.4% 1.30% 57.8% 62.9% 6525
Guinea-Bissau MICS 2000 41.3% 1.70% 37.9% 44.6% 58.7% 1.70% 55.4% 62.1% 5923
Guyana MICS 2000 96.5% 0.42% 95.7% 97.4% 3.5% 0.42% 2.6% 4.3% 2920
Haiti DHS 2000 54.4% 1.70% 51.0% 57.7% 45.6% 1.70% 42.3% 49.0% 7879
India MICS 2000 76.9% 0.62% 75.7% 78.1% 23.1% 0.62% 21.9% 24.3% 70640
Indonesia DHS 2002/03 94.4% 0.38% 93.7% 95.2% 5.6% 0.38% 4.8% 6.3% 19299
Iraq MICS 2000 77.8% 0.74% 76.4% 79.3% 22.2% 0.74% 20.7% 23.6% 17285
Kazakhstan DHS 1999 98.5% 0.35% 97.8% 99.2% 1.5% 0.35% 0.8% 2.2% 1655
Kenya DHS 2003 77.5% 1.17% 75.2% 79.8% 22.5% 1.17% 20.2% 24.8% 7277
Kyrgyzstan DHS 1997 94.9% 1.10% 92.8% 97.1% 5.1% 1.10% 2.9% 7.2% 1210
Lao PDR MICS 2000 62.1% 1.61% 58.9% 65.3% 37.9% 1.61% 34.7% 41.1% 6088
Lebanon MICS 2000 97.0% 0.37% 96.2% 97.7% 3.0% 0.37% 2.3% 3.8% 3610
Lesotho MICS 2000 65.4% 0.85% 63.7% 67.0% 34.6% 0.85% 33.0% 36.3% 5833
Madagascar MICS 2000 62.3% 1.77% 58.8% 65.8% 37.7% 1.77% 34.2% 41.2% 4335
Malawi DHS 2000 75.7% 0.79% 74.2% 77.3% 24.3% 0.79% 22.7% 25.8% 11118
Primary school-age children in school Primary school-age children out of school
Survey
Lower Upper
Rate (%) Standarderror
Number ofobservationsRate (%) Standard
error
95% confidenceinterval boundaries
Lower Upper
95% confidenceinterval boundaries

Table A16. Sampling errors and confidence intervals for household survey data
113
F MF M F GPI
Country or territory
Mali DHS 2001 39.2% 1.42% 36.4% 42.0% 60.8% 1.42% 58.0% 63.6% 12206
Mauritania DHS 2000/01 44.2% 1.41% 41.4% 47.0% 55.8% 1.41% 53.0% 58.6% 6672
Moldova MICS 2000 98.4% 0.30% 97.8% 99.0% 1.6% 0.30% 1.0% 2.2% 2065
Mongolia MICS 2000 79.2% 0.98% 77.2% 81.1% 20.8% 0.98% 18.9% 22.8% 2750
Mozambique DHS 1997 49.9% 2.47% 45.1% 54.8% 50.1% 2.47% 45.2% 54.9% 6593
Myanmar MICS 2000 79.5% 0.84% 77.8% 81.1% 20.5% 0.84% 18.9% 22.2% 15293
Namibia 2000 DHS 78.1% 1.23% 75.6% 80.5% 21.9% 1.23% 19.5% 24.4% 6091
Nepal MICS 2000 66.2% 2.14% 62.0% 70.4% 33.8% 2.14% 29.6% 38.0% 8262
Nicaragua DHS 2001 80.4% 0.91% 78.6% 82.1% 19.6% 0.91% 17.9% 21.4% 10747
Niger MICS 2000 30.3% 1.63% 27.1% 33.6% 69.7% 1.63% 66.4% 72.9% 4634
Nigeria DHS 2003 61.9% 2.09% 57.8% 66.0% 38.1% 2.09% 34.0% 42.2% 5807
Pakistan SURVEY 2000/01 56.4% 1.52% 53.4% 59.4% 43.6% 1.52% 40.6% 46.6% 7441
Peru DHS 2000 95.5% 0.26% 95.0% 96.0% 4.5% 0.26% 4.0% 5.0% 19682
Philippines MICS 1999 81.9% 0.90% 80.1% 83.7% 18.1% 0.90% 16.3% 19.9% 5429
Rwanda MICS 2000 75.2% 1.11% 73.1% 77.4% 24.8% 1.11% 22.6% 26.9% 3506
Sao Tome and Principe MICS 2000 77.9% 1.35% 75.2% 80.6% 22.1% 1.35% 19.4% 24.8% 2389
Senegal MICS 2000 48.4% 1.61% 45.2% 51.6% 51.6% 1.61% 48.4% 54.8% 11080
Sierra Leone MICS 2000 40.9% 1.70% 37.5% 44.3% 59.1% 1.70% 55.7% 62.5% 4337
Somalia MICS 1999 10.9% 1.32% 8.3% 13.5% 89.1% 1.32% 86.5% 91.7% 4599
South Africa DHS 1998 93.5% 0.44% 92.6% 94.3% 6.5% 0.44% 5.7% 7.4% 10135
Sudan MICS 2000 52.6% 1.19% 50.3% 55.0% 47.4% 1.19% 45.0% 49.7% 27114
Suriname MICS 1999/00 89.5% 2.14% 85.3% 93.7% 10.5% 2.14% 6.3% 14.7% 2073
Swaziland MICS 2000 71.5% 0.91% 69.7% 73.3% 28.5% 0.91% 26.7% 30.3% 5133
Tajikistan MICS 2000 80.7% 0.94% 78.9% 82.6% 19.3% 0.94% 17.4% 21.1% 2879
Tanzania 1999 DHS 48.9% 1.90% 45.2% 52.7% 51.1% 1.90% 47.3% 54.8% 3768
Togo MICS 2000 63.5% 1.66% 60.2% 66.8% 36.5% 1.66% 33.2% 39.8% 4922
Trinidad and Tobago MICS 2000 95.5% 0.53% 94.5% 96.5% 4.5% 0.53% 3.5% 5.5% 1956
Uganda DHS 2000/01 78.9% 0.85% 77.2% 80.6% 21.1% 0.85% 19.4% 22.8% 8111
Uzbekistan MICS 2000 80.3% 1.20% 78.0% 82.7% 19.7% 1.20% 17.3% 22.0% 3093
Venezuela MICS 2000 93.5% 0.71% 92.2% 94.9% 6.5% 0.71% 5.1% 7.8% 2672
Viet Nam MICS 2000 87.6% 0.83% 86.0% 89.3% 12.4% 0.83% 10.7% 14.0% 4612
Yemen DHS 1997 54.6% 1.02% 52.6% 56.6% 45.4% 1.02% 43.4% 47.4% 15203
Zambia DHS 2001/02 68.0% 1.14% 65.8% 70.3% 32.0% 1.14% 29.7% 34.2% 7683
Zimbabwe DHS 1999 85.5% 0.69% 84.2% 86.9% 14.5% 0.69% 13.1% 15.8% 5724
Primary school-age children in school Primary school-age children out of school
Survey
Lower Upper
Rate (%) Standarderror
Number ofobservationsRate (%) Standard
error
95% confidenceinterval boundaries
Lower Upper
95% confidenceinterval boundaries

114
The regions below follow UNICEF groupings of countries. Countrynames in italics indicate those for which data were available for theanalysis in Chapter 2.
Central and East Europe / Commonwealth ofIndependent States (20 countries or territories)
Albania; Armenia; Azerbaijan; Belarus; Bosnia and Herzegovina;Bulgaria; Croatia; Georgia; Kazakhstan; Kyrgyzstan; Republic ofMoldova; Romania; Russian Federation; Serbia and Montenegro;Tajikistan; The former Yugoslav Republic of Macedonia; Turkey;Turkmenistan; Ukraine; Uzbekistan.
Middle East and North Africa(20 countries or territories)
Algeria; Bahrain; Djibouti; Egypt; Iran, Islamic Republic of; Iraq;Jordan; Kuwait; Lebanon; Libyan Arab Jamahiriya; Morocco; Oman;Palestinian Autonomous Territories; Qatar; Saudi Arabia; Sudan;Syrian Arab Republic; Tunisia; United Arab Emirates; Yemen.
Eastern and Southern Africa(22 countries or territories)
Angola; Botswana; Burundi; Comoros; Eritrea; Ethiopia; Kenya;Lesotho; Madagascar; Malawi; Mauritius; Mozambique; Namibia;Rwanda; Seychelles; Somalia; South Africa; Swaziland; Uganda;United Republic of Tanzania; Zambia; Zimbabwe.
ANNEX 3Country groupings

Annex 3. Country groupings
115
West and Central Africa(24 countries or territories)
Benin; Burkina Faso; Cameroon; Cape Verde;Central African Republic; Chad; Congo; Côted'Ivoire; Democratic Republic of the Congo;Equatorial Guinea; Gabon; Gambia; Ghana; Guinea;Guinea-Bissau; Liberia; Mali; Mauritania; Niger;Nigeria; Sao Tome and Principe; Senegal; SierraLeone; Togo.
South Asia(8 countries or territories)
Afghanistan, Islamic Republic of; Bangladesh;Bhutan; India; Maldives; Nepal; Pakistan; Sri Lanka.
East Asia and the Pacific(30 countries or territories)
Brunei Darussalam; Cambodia; China; Cook Islands;Democratic People's Republic of Korea; Fiji;Indonesia; Kiribati; Lao People's DemocraticRepublic; Macao, China; Malaysia; Marshall Islands;Micronesia (Federated States of); Mongolia;Myanmar; Nauru; Niue; Palau; Papua New Guinea;Philippines; Samoa; Singapore; Solomon Islands;Thailand; Timor-Leste; Tokelau; Tonga; Tuvalu;Vanuatu; Viet Nam.
Latin America and the Caribbean(41 countries or territories)
Anguilla; Argentina; Antigua and Barbuda; Aruba;Bahamas; Barbados; Belize; Bermuda; Bolivia; Brazil;British Virgin Islands; Cayman Islands; Chile;Colombia; Costa Rica; Cuba; Dominica; DominicanRepublic; Ecuador; El Salvador; Grenada;Guatemala; Guyana; Haiti; Honduras; Jamaica;Mexico; Montserrat; Netherlands Antilles;Nicaragua; Panama; Paraguay; Peru; Saint Kitts andNevis; Saint Lucia; Saint Vincent and the Grenadines;Suriname; Trinidad and Tobago; Turks and CaicosIslands; Uruguay; Venezuela.
Industrialised countries(39 countries or territories)
Andorra; Australia; Austria; Belgium; Canada;Cyprus; Czech Republic; Denmark; Estonia; Finland;France; Germany; Greece; Hong Kong (China), SAR;Hungary; Iceland; Ireland; Israel; Italy; Japan; Latvia;Lithuania; Luxembourg; Malta; Monaco;Netherlands; New Zealand; Norway; Poland;Portugal; Republic of Korea; San Marino; Slovakia;Slovenia; Spain; Sweden; Switzerland; UnitedKingdom; United States.