children and young people with impairments
TRANSCRIPT

Page 1 Children and young people with impairments
CHILDREN AND YOUNG PEOPLE WITH IMPAIRMENTS June 2020

Page 2 Children and young people with impairments
Aurora Centre, 56 The Terrace, Wellington
The Oranga Tamariki Evidence Centre works to build the evidence base that helps us better understand wellbeing and what works to improve outcomes for New Zealand’s children, young people and their whānau.
Email: [email protected]
Authors: EY & Evidence Centre, Oranga Tamariki—Ministry for Children
Published: June 2020
ISBN: 978-0-9951239-9-1
If you need this material in a different version, please email us at [email protected] and we will provide it for you.
Citation guidance:
This report can be referenced as Oranga Tamariki—Ministry for Children. (2020). Children and young people with impairments. Wellington, New Zealand: Oranga Tamariki—Ministry for Children.
Copyright:
This document Children and young people with impairments is licensed under the Creative Commons Attribution 4.0 International License http://creativecommons.org/licenses/by/4.0/.
Please attribute © New Zealand Government, Oranga Tamariki—Ministry for Children 2020.
Disclaimer:
Oranga Tamariki has made every effort to ensure the information in this report is reliable, but does not guarantee its accuracy and does not accept liability for any errors.
Acknowledgements:
Thanks to the Oranga Tamariki staff and external reviewers who have contributed to this paper.

Page 3 Children and young people with impairments
CONTENTS
INTRODUCTION ................................................................................................................................... 4
Background ............................................................................................................................................................................. 4 Indicators of disability ......................................................................................................................................................... 5 Disability Support Services (DSS) disability types ..................................................................................................... 6 Key population groups ........................................................................................................................................................ 6
KEY FINDINGS ...................................................................................................................................... 8
Cohort summaries................................................................................................................................................................ 8 Wellbeing and service contact (DSS) ........................................................................................................................... 11
COHORT SUMMARIES ....................................................................................................................... 12
Overview of children aged 0-17...................................................................................................................................... 12 Overview of young people aged 18-25 ........................................................................................................................ 15 Overlap of indicators of disability .................................................................................................................................. 15 Principal disability and support needs levels ............................................................................................................ 17
WELLBEING AND DSS CHILDREN AND YOUNG PEOPLE .................................................................. 19
Overview of children aged 0-17...................................................................................................................................... 19 Key findings for children aged 0-17 .............................................................................................................................. 21 Young people aged 18-25 ................................................................................................................................................ 23
CONSIDERATIONS AND STATISTICS NZ DISCLAIMER ................................................................... 28
APPENDIX 1: DISABILITY INDICATORS ............................................................................................ 31
Ongoing Resourcing Scheme ......................................................................................................................................... 31 Child Disability Allowance ................................................................................................................................................ 31 Disability Support Services .............................................................................................................................................. 32
APPENDIX 2: COHORT SUMMARIES ................................................................................................ 35
APPENDIX 3: TRANSITION POPULATION COHORT SUMMARIES................................................... 42
APPENDIX 4: PRINCIPAL DISABILITY AND SUPPORT NEEDS LEVELS ........................................... 48
APPENDIX 5: TRANSITION POPULATION PRINCIPAL DISABILITY................................................. 54
APPENDIX 6: NUMBER OF CHILDREN EVER ALLOCATED DSS FUNDING ....................................... 58
APPENDIX 7: WELLBEING AND SERVICE CONTACT – DETAILED RATES....................................... 59
Page 4 Children and young people with impairments
INTRODUCTION Background The Disability Discrimination Act defines a disabled person as:
Someone who has a physical or mental impairment that has a substantial and long-term adverse effect on his or her ability to carry out normal day-to-day activities.
The World Health Organisation defines disability as:
An umbrella term, covering impairments, activity limitations, and participation restrictions. An impairment is a problem in body function or structure; an activity limitation is a difficulty encountered by an individual in executing a task or action; while a participation restriction is a problem experienced by an individual in involvement in life situations. Thus disability is a complex phenomenon, reflecting an interaction between features of a person's body and features of the society in which he or she lives.
Defining, identifying, and reporting on disability is a complex topic. Currently, Oranga Tamariki does not have an easy way of identifying disability for children in care and so has limited visibility over the extent to which children and young people in care are living with impairments.
This report provides an overview of children and young people in Out of Home care or with Oranga Tamariki involvement who are living with impairments and where this is identified by administrative data in Statistics NZ’s Integrated Data Infrastructure (IDI)1. This report:
• describes the profile of children (ages 0-17) and young people (ages 18-25) who have potential indicators of disability
• provides insights into differences in wellbeing and service contact indicators for children and young people with and without potential indicators of disability, with
• a particular focus on those currently or previously involved with Oranga Tamariki
The IDI contains a number of potential indicators of disability. The ensuing analysis has been based on the following indicators:
• Ministry of Social Development (MSD) Child Disability Allowance (CDA) payments2
• Ministry of Education (MoE) Ongoing Resourcing Scheme (ORS) funding3
1 https://www.stats.govt.nz/integrated-data/integrated-data-infrastructure/ 2 https://www.workandincome.govt.nz/products/a-z-benefits/child-disability-allowance.html#null 3 https://www.education.govt.nz/school/student-support/special-education/ors/ This is ORS funding linked to individual children within the MOE IDI data. This does not include ORS funding linked to schools (rather than individual children), other learning support services funded by MOE or by individual schools.

Page 5 Children and young people with impairments
• Ministry of Health (MoH) allocated Disability Support Services (DSS) funding4
The main limitation associated with administration data sources is that they only reflect known and met need of children and young people, as detected by their service contact. This excludes children and young people with an unknown and/or unmet need, such as those who have impairments which are not yet diagnosed, who do not meet thresholds for funding, or who are not in contact with services. Whilst exploration of unknown or unmet need is outside the scope of this study, it is an important concept to keep in mind when interpreting the results set out in this report.
Indicators of disability This section summarises the three support services used as indicators of disability in this report. A more detailed description, including criteria, can be found in Appendix 1. We emphasise that these services are proxy indicators for disability and that they will not capture all children and young people in New Zealand with impairments. Additionally, each of the services assesses disability in a different way. Further information can be found in the section on Considerations and Statistics NZ Disclaimer (page 28).
Child Disability Allowance
The Ministry of Social Development’s Child Disability Allowance (CDA) is a fortnightly payment made to the main carer of a child or young person with a serious disability. It is paid in recognition of the extra care and attention needed for that child.
Of the two other disability indicators, CDA is understood to have a lower eligibility threshold than DSS, while ORS is limited to school ages and the majority of children allocated ORS also have CDA and/or DSS.
Ongoing Resourcing Scheme
The Ministry of Education’s Ongoing Resourcing Scheme (ORS) is for students who have the highest ongoing levels of need for specialist support at school. Only a small number of students (about 1% of the school population at any one time) will have this highest level of need.
ORS support helps students to join in and learn alongside other students at school. Any student who meets the ORS criteria is included in the scheme. Once a student is in ORS, their funding and support stays with them throughout their time at school. ORS funding and resources are considered to be a contribution to supporting a student’s schooling.
Disability Support Services
Ministry of Health Disability Support Services (DSS) funding is allocated to people (generally under 65 years of age) with a long-term physical, intellectual and/or sensory impairment that will require ongoing support.
4 https://www.health.govt.nz/our-work/disability-services/about-disability-support-services

Page 6 Children and young people with impairments
Several different types of funding, described in Appendix 1, are available to people who have a physical, intellectual or sensory disability (or a combination) which meet the required criteria.
Disability Support Services (DSS) disability types The MoH has defined 6 principal disability types (impairment types), these are contained in the table below along with examples of disability-related conditions5.
Key population groups Oranga Tamariki identified several population groups where there was interest in better understanding children and young people who are disabled and exploring variations in wellbeing and service contact. Based on this information we have segmented our findings for the following population sub-groups:
• Oranga Tamariki population group (see below)
• Māori and/or Pacific children and young people6
• Age group (0-4, 5-14, 15-17, 18-25)
• Gender (male, female)
• Region (urban, regional and rural)
For children who have currently or previously been allocated DSS funding, we also segmented by:
• Principal disability (impairment) type, as defined by MoH (Intellectual, Sensory, Physical, Neurological, Autism Spectrum Disorder, Other)
• Support needs level, as defined by MoH (very high, high, medium, low, very low)7.
5 https://www.health.govt.nz/system/files/documents/publications/demographic-report-for-client-allocated-ministry-of-health-disability-support_services-2018-update14nov2019.pdf
6 Throughout this report, ‘other’ ethnicity includes all children who are of an ethnicity other than Māori or Pacific. 7 Support needs level refers to the ‘Support Package Allocation’ level (SPA) recorded by MoH for DSS clients. SPA is the
funding or range of disability support services allocated to a disabled client to address their disability support needs, as
Principal disability type Examples of disability-related conditions
Intellectual Down syndrome, developmental delay, intellectual disability, fragile X syndrome, Prader-Willi syndrome
Sensory Blind or vision impaired, deaf or hearing impaired, glaucoma
Physical Paralysis/paresis, cerebral palsy, amputation of limbs, multiple sclerosis, muscular dystrophy, stroke, rheumatoid arthritis
Neurological Meningitis, Parkinson’s disease, motor neuron disease
Autism spectrum disorder Includes autism spectrum disorder and Asperger’s syndrome
Other Epilepsy, osteoporosis, chronic fatigue syndrome

Page 7 Children and young people with impairments
identified by a NASC (Needs Assessment and Service Coordination services). SPAs are categorised by level, from ‘very low’ to ‘very high’.
Oranga Tamariki population group (ages 0-17)
Details
Out of home placement (Out of Home (OOH) Care)
Child or young person is currently in care in an out of home placement.
Potential Intensive Intervention (Potential II)
Child or young person has left care and/or had a Family Group Conference (FGC) within the last year.
Recent involvement with Oranga Tamariki (Recent Oranga Tamariki)
Child or young person has had a Report of Concern (ROC) within the last year.
Past involvement with Oranga Tamariki (Past Oranga Tamariki)
Child or young person has previously had involvement with Oranga Tamariki, but not within the last year.
Known to Oranga Tamariki Child or young person has had some previous involvement with Oranga Tamariki. This includes all children in the groups above.
Unknown to Oranga Tamariki Child or young person has had no previous involvement with Oranga Tamariki.
Oranga Tamariki population group (ages 18-25)
Details
Statutory involvement The young person has previously had Family Group Conferences (FGCs) and/or was previously in care.
Sub-statutory involvement The young person has previously been the subject of Reports of Concern (ROCs)
Unknown to Oranga Tamariki The young person has had no previous involvement with Oranga Tamariki

Page 8 Children and young people with impairments
KEY FINDINGS Cohort summaries 1 in 10 tamariki (children) aged 0-17 with current or previous Oranga Tamariki involvement have at least one indicator of disability8. This cohort is 2.6 times more likely to have at least one indicator of disability than children with no previous involvement with Oranga Tamariki (1 in 25 or 4% of those with no previous involvement with Oranga Tamariki have a disability indicator).
Tamariki with the following profiles are all more likely to have at least one indicator of disability, relative to other children with Oranga Tamariki involvement:
• Higher levels of Oranga Tamariki involvement
• Older ages
• Male
• Non-Māori and non-Pacific (NZ European, Asian and other ethnicities)9.
This is likely to be a reflection of several factors including diagnosis rates, behavioural developments at key childhood life stages, differing access to support services, agency interactions over childhood and potentially socioeconomic, cultural and other influences.
Children who have ever been allocated DSS funding, and have current or previous Oranga Tamariki involvement, are more likely to have intellectual impairment and high/very high support needs.
• 62% of children with current or previous Oranga Tamariki involvement with allocated DSS funding, have intellectual impairment as their principal disability, compared with 47% of children with no previous Oranga Tamariki involvement.
• 57% of children with current or previous Oranga Tamariki involvement with allocated DSS funding, have very high/high support needs levels. This is compared to 48% of children with no previous Oranga Tamariki involvement
8 It is important to note that these indicators do not mean a child or young person will then develop a formal diagnosable disability through developmental years.
9 This contrasts with the broader child population, where Māori children are more likely to have disability indicators than other children. See page 12 for additional information. The trends are, however, similar to findings in other research undertaken on the needs of children and young people known to Oranga Tamariki. For example, see ‘2018 Transitions Cohort Needs Assessment’.

Page 9 Children and young people with impairments
The chart below shows an overview of tamariki aged 0-17 in New Zealand as at January 2019. This chart looks at different populations of interest and provides a breakdown of tamariki with at least one disability indicator, different disability types, and funding that is received.
Figure 1: Overview of tamariki ages 0-17 at January 2019

Page 10 Children and young people with impairments
The chart below shows the split of all tamariki aged 0-17 in New Zealand at January 2019 by Oranga Tamariki and disability indicator status. This chart firstly splits children between those known to Oranga Tamariki (to the left) and those not known to Oranga Tamariki (to the right) For both of these groups disability breakdowns are given, allowing comparatives to be made between both.
Figure 2: Tamariki ages 0-17 at January 2019 with disability indicators.

Page 11 Children and young people with impairments
Wellbeing and service contact (DSS) We examined differences in wellbeing and service contact indicators for children and young people with and without potential indicators of disability, with a specific focus on:
• Tamariki with current or previous Oranga Tamariki involvement, particularly those in out of home care or potential intensive intervention, and
• Tamariki who were recently or previously allocated DSS funding, as this is a group of children who have met a high threshold for need10
Overall, children with Oranga Tamariki involvement and DSS funding have similar socioeconomic and wellbeing characteristics to other children with comparable levels of Oranga Tamariki involvement. However, there are some areas where children with Oranga Tamariki involvement and DSS funding show distinct differences in wellbeing and service contact indicators.
• A larger proportion have been involved with statutory Care & Protection
• They have more frequent health service interactions, including referrals as part of their B4 School Check vision and hearing checks, potentially avoidable hospitalisations, emergency department contact and mental health service contact and treatment.
• A larger proportion have experienced challenges at school including standdowns and suspensions. It is possible that challenges with school behaviour may contribute to school notifications and other reports to Oranga Tamariki and subsequent interactions.
• Similar or lower levels of offending, victimisations and involvement with Youth Justice. This may partly reflect alternative approaches applied by Police, Courts and other agencies to help support children with impairments involved in offending and divert cases away from the formal Youth Justice system where possible.
• A larger proportion remain in school to ages 17-21 but leave with lower levels of formal school qualifications and a smaller proportion enrol in tertiary education. This reflects differences in the education enrolment patterns of the broader DSS population.
• A smaller proportion are in employment and a larger proportion are in receipt of income support. This highlights broader challenges with employment and material wellbeing for disabled people in New Zealand.
These differences are larger for children with higher levels of Oranga Tamariki involvement.
In considering these differences it is important to acknowledge that administrative data does not reflect all aspects of children’s wellbeing, including their emotional and spiritual wellbeing, connection to culture, and the strength of their relationships with family/whānau, friends and their communities. These are important parts of children’s lives and further research to describe the experiences of children with impairments would be of significant value.
10 The wellbeing and service contact profiles of children who have never received DSS funding but have other disability indicators is set out in the appendix. Overall this group showed similar differences around health, education, employment and offending, although the size of the differences is smaller than for children with DSS indicators.

Page 12 Children and young people with impairments
COHORT SUMMARIES The following sections describe the profile of children who have at least one indicator of disability.
Overview of children aged 0-17 1 in 10 children with current or previous Oranga Tamariki involvement have at least one indicator of disability. This cohort is 2.6 times more likely to have at least one indicator of disability than children with no previous involvement with Oranga Tamariki (of whom 1 in 25 or 4% have a disability indicator).
The graph below and Table 1 in Appendix 2 show the proportion of children in each Oranga Tamariki population group who have at least one indicator of disability. A further breakdown of these populations by age group, gender, ethnicity and regional area is shown in the appendix.
Figure 3: Proportion of children, aged 0-17 at January 2019, with selected disability-related support services
Some population groups are more likely to have indicators of disability, as summarised in the table and graphs below:
0%2%4%6%8%
10%12%14%16%18%20%
Any indicator of disability DSS CDA ORS
In OOH care Potential II Known to OT Unknown to OT
Population group Insights
Children with higher levels of Oranga Tamariki interaction
Children who are currently in out of home care are 1.7 times more likely to have at least one indicator of disability than children who have had an FGC or ROC within the last year.
Older children Older children are more likely to have at least one indicator of disability, particularly over teenage years. This is likely to be a reflection of several factors including diagnosis rates, changing behaviour at key childhood development stages and agency interactions over childhood. Differences between ages increase at higher levels of Oranga Tamariki involvement. Relatively few children aged 0-4 have disability indicators. For example, 25% of children in out of home care aged 15-17 have at least one disability indicator, compared to 16% of children aged 5-14 and 4% of children aged 0-4 in out of home care.

Page 13 Children and young people with impairments
Proportion of children at January 2019, with any disability indicator by Oranga Tamariki population group and:
Figure 4: Age group Figure 5: Gender
11 https://www.stats.govt.nz/information-releases/disability-survey-2013, see table 2.01 Disability rate by age group, sex and ethnic group
Male children Male children are 1.7 times more likely to have at least one indicator of disability than female children. Differences between male and female children are consistent over different levels of Oranga Tamariki involvement and for the broader child population. For example: • 16% of male children in out of home care have at least one indicator of
disability, compared to 12% of female children in out of home care.
• 14% of male children in Potential II have at least one indicator of disability, compared to 8% of female children in Potential II.
Children with other ethnicities
For children known to Oranga Tamariki, those who are of an ethnicity other than Māori or Pacific are 1.5 times more likely to have at least one indicator of disability than Māori or Pacific children. This difference increases with higher levels of Oranga Tamariki interaction.
For example, 21% of children in out of home care with “other” ethnicity have at least one indicator of disability, compared to 11% of Māori/Pacific children in out of home care.
This contrasts with the broader child population unknown to Oranga Tamariki, where Māori children are slightly more likely to have disability indicators than children of Pacific or “other” ethnicity. Pacific children are slightly less likely to have a disability indicator than “other” children. (Refer to Appendix A for details.)
The 2013 Disability Survey also found that Māori children (0-14 years) have higher disability rates, while Pacific children have lower disability rates, than other ethnic groups11.
It is unclear from the administrative data as to why the proportion of “other” children with disability indicators increases with higher levels of Oranga Tamariki involvement relative to Māori and Pacific children. Possible factors may include:
• Differences in the profile of children who are reported to Oranga Tamariki and who become involved in statutory Care and Protection by ethnicity
• Differences in referral rates, diagnosis rates, funding application rates, health care access and other factors by ethnicity and for population groups who are more likely to have contact with Oranga Tamariki (e.g. for families experiencing financial hardship).
Further investigation into underlying disability prevalence for children known to Oranga Tamariki is required to identify potential drivers and understand the extent to which administrative disability indicators reflect the underlying population.

Page 14 Children and young people with impairments
Figure 6: Māori/Pacific or other ethnicity
0%
5%
10%
15%
20%
25%
30%
In OOH care Potential II Known toOT
Unknown toOT
Age 0-4 Age 5-14 Age 15-17
0%
5%
10%
15%
20%
25%
30%
In OOH care Potential II Known toOT
Unknown toOT
Female Male
0%
5%
10%
15%
20%
25%
In OOH care Potential II Known toOT
Unknown toOT
Māori / Pacific Other

Page 15 Children and young people with impairments
Overview of young people aged 18-25 For young people aged 18-25 with previous Oranga Tamariki involvement, young people previously in out of home care or involved in FGCs, males and young people of non-Māori and non-Pacific ethnicity have higher levels of disability indicators, a similar pattern to that observed for children.
The table and graph below show the proportion of young people aged 18-25 years in each Oranga Tamariki population group who have one or more indicators of disability. A further breakdown of these populations by age group, gender, ethnicity and regional area is shown in the appendix.
Figure 7: Proportion of young people, aged 18-25 at January 2019, with selected disability-related support services
Overlap of indicators of disability This section describes the extent of overlap between DSS, ORS and CDA disability indicators and how this differs for the Oranga Tamariki population groups.
The profile of children with disability indicators is broadly similar across those with and without Oranga Tamariki history. The exception is children with statutory Care & Protection involvement, who are significantly more likely to have ever been allocated DSS funding.
• 68% of children with at least one indicator of disability have only received CDA. This is likely to be a reflection of the lower eligibility threshold for CDA compared to DSS and ORS funding.
• The second most common combination is to have received CDA and be currently or have previously been allocated DSS funding.
• Tamariki in out of home care or potential II groups are 2 times more likely to have currently or previously been allocated DSS funding than other children with Oranga Tamariki contact (45% compared to 29%), and are also significantly more likely to have been allocated DSS funding without CDA. This is likely to reflect a number of factors, including the interaction between safety and disability-related needs, additional service contact as a result of involvement with Oranga Tamariki and the older age profile of children involved with statutory Care & Protection.

Page 16 Children and young people with impairments
The graph below shows the mix of disability indicators for all children with at least one disability indicator at January 2019. For further information around the overlap of different populations, refer to Figure 1 on page 9.
Figure 8: Overlap of disability indicators for children aged 0-17 at January 2019 with at least one disability indicator
The overlap of indicators is similar for adults aged 18-25 who have at least one indicator of disability and is presented in Appendix 3.

Page 17 Children and young people with impairments
Principal disability and support needs levels This section describes the range of impairment types and support needs levels for children and young people who are currently or have previously been allocated DSS funding12.
62% of children with current or previous Oranga Tamariki involvement with DSS funding have intellectual impairment as their principal disability, compared with 47% of children with no previous Oranga Tamariki involvement. Alongside this, 31% of children known to Oranga Tamariki have autism spectrum disorder as their principal disability, compared with 45% of children with no previous Oranga Tamariki involvement.
The graphs below and the tables in Appendix 4 show the proportion of children and young people in each Oranga Tamariki population group by principal disability13. A further breakdown of these populations by age group, gender, ethnicity and regional area is shown in the appendix.
Figure 9: Proportion of children aged 0-17 at January 2019 by principal disability (impairment) type
Figure 10: Proportion of young people aged 18-25 at January 2019 by principal disability (impairment) type
12 Tamariki and young people with only CDA or ORS funding have been excluded as this information is not available from MSD or MOE.
13 ‘Principal disability’ is recorded by MoH for DSS clients. Where a client is recorded as having more than one disability, the first disability has been selected based on a prioritisation list provided by MoH.
45%
31%
25%
11%
47%
62%
69%
87%
8%
7%
6%
3%
0% 10% 20% 30% 40% 50% 60% 70% 80% 90% 100%
Unknown to OT
Known to OT
Potential II
In OOH care
Autistic Spectrum Disorder Intellectual disability Physical, neurological, sensory or other disability
32%
21%
16%
53%
70%
78%
15%
10%
6%
0% 10% 20% 30% 40% 50% 60% 70% 80% 90% 100%
Unknown to OT
Known to OT
Statutory involvement
Autistic Spectrum Disorder Intellectual disability Physical, neurological, sensory or other disability

Page 18 Children and young people with impairments
Some groups of children are more likely to have an intellectual impairment, as summarised in the table below:
A higher proportion of children with current or previous Oranga Tamariki involvement have “very high” or “high” support needs (57%), compared to 48% of children with no previous Oranga Tamariki involvement.
The graph below shows the proportion of children and young people in each Oranga Tamariki population group with varying support needs. The proportion of children with high or very high level support needs is highest for those in potential intensive intervention.
Figure 11: Proportion of children aged 0-17 at January 2019 with varying support needs
Refer to Appendix 4 for the support needs profile of young people who have ever been allocated DSS funding.
48%
57%
74%
66%
52%
43%
26%
34%
0% 10% 20% 30% 40% 50% 60% 70% 80% 90% 100%
Unknown to OT
Known to OT
Potential II
In OOH care
Very High/High Medium/Low/Very Low
Children group Insights
Children with higher levels of Oranga Tamariki interaction
Children in out of home care are 4 times more likely to have an intellectual impairment than other children with past Oranga Tamariki involvement.
Māori/Pacific children Māori/Pacific children known to Oranga Tamariki are 1.6 times more likely to have an intellectual impairment than children with other ethnicities known to Oranga Tamariki.
Page 19 Children and young people with impairments
WELLBEING AND DSS CHILDREN AND YOUNG PEOPLE Overview of children aged 0-17 Overall, children with current or previous Oranga Tamariki involvement and DSS funding have similar socioeconomic and wellbeing characteristics to other children with comparable levels of Oranga Tamariki involvement.
However, there are some areas where children known to Oranga Tamariki with DSS funding show distinct differences, particularly around health service contact, employment and education pathways and, for a subset of children, school disengagement. These differences become more distinct at higher levels of Oranga Tamariki involvement.
A selection of indicators from these areas are shown in the graphs below, based on recent and historic indicators for all children aged 0-17 at January 2019 who have ever been allocated DSS funding.
Guide to interpreting the graphs below:
• The first section, “Proportion of children allocated DSS funding”, shows the proportion of children in each age group who have ever been allocated DSS funding. For example, 3% of children ages 0-17 who are known to Oranga Tamariki have ever been allocated DSS funding. Across all ages, children who are known to Oranga Tamariki are more likely to have had DSS funding allocated than other children with no previous Oranga Tamariki involvement.
• The second section shows the proportion of children who are known to Oranga Tamariki and ever allocated DSS funding with indicators of wellbeing and service contact and the differences across age groups. For example, 11% of these children aged 0-4 have been in placement over their lifetime to date. Note some indicators of wellbeing and service contact are not available across all ages, for example standdowns have only been shown for ages 10-15.
• The third section shows the “relative risk” of children known to Oranga Tamariki and currently or previously allocated DSS funding experiencing different levels of wellbeing and service contact compared to other children with Oranga Tamariki involvement. This is calculated as the proportion of children known to Oranga Tamariki and with DSS funding who have the indicator, divided by the proportion of children known to Oranga Tamariki without DSS funding who have the indicator. For example, children known to Oranga Tamariki with DSS funding are 2.2 times more likely to have been in placement over their lifetime than other children with Oranga Tamariki contact14.
Similar graphs for children with no previous Oranga Tamariki involvement can be found in Appendix 7.
14 Where likelihood is less than 1.0, children with DSS funding and Oranga Tamariki contact are observed to have a lower likelihood of the measure than children with Oranga Tamariki contact

Page 20 Children and young people with impairments
Proportion of children currently or previously allocated DSS funding
Proportion of DSS Oranga Tamariki children with indicators of wellbeing and service contact
Ages 0-17 Ages 0-4 Ages 5-14 Ages 15-17
Placement over lifetime to date
Family Group Conferences (FGC) or Family Whānau Agreements (FWA) over lifetime to date
2 or more potentially avoidable hospitalisations over lifetime to date
B4 School Check "referral" outcomes from vision and/or hearing checks at ages 4-5
Parental income in the lowest income quintile
Proportion supported by parental benefit for more than 50% of their childhood
Standdowns over lifetime to date (ages 10-15)
Low level seriousness offences over the last year (ages 10-15)
Mental health hospital and community provider service contact/treatment over lifetime to date (ages 5-17)
Relative risk of DSS Oranga Tamariki children having wellbeing and service contact indicators
Ages 0-17 Ages 0-4 Ages 5-14 Ages 15-17
Placement over lifetime to date 2.2 1.3 2.2 2.4
FGC/FWAs over lifetime to date 1.6 1.5 1.5 1.7 2 or more potentially avoidable hospitalisations over lifetime to date 2.5 2.7 2.4 2.4
B4 School Check "referral" outcomes from vision and/or hearing checks at ages 4-5 1.7 1.7 N/A N/A
Parental income in the lowest income quintile 0.9 0.8 0.9 1.1 Proportion supported by parental benefit for more than 50% of their childhood 1.0 0.9 1.0 1.1
Standdowns over lifetime to date (ages 10-15) 1.7 N/A 1.7 N/A
Low level seriousness offences over the last year (ages 10-15) 1.0 N/A 1.0 1.0
Mental health service contact/treatment over lifetime to date (ages 5-17) 2.7 N/A 3.1 2.1
3.0%1.1%
3.1% 3.6%
1.1%0.4%
1.5% 1.4%
All children aged 0-17 Ages 0-4 Ages 5-14 Ages 15-17
Known to Oranga Tamariki
Unknown to Oranga Tamariki
17%
37%
36%
27%
42%
48%
21%
6%
49%
11%
31%
26%
27%
53%
58%
16%
36%
35%
44%
49%
21%
5%
43%
23%
41%
41%
35%
45%
7%
65%

Page 21 Children and young people with impairments
Key findings for children aged 0-17 Children who are known to Oranga Tamariki and are currently or have previously been allocated DSS funding have broadly similar socioeconomic and household profiles to other children known to Oranga Tamariki, but have differing levels of wellbeing and service contact in some areas:
• A larger proportion have been involved with statutory Care & Protection.
• They have more frequent health service interactions, including referral as part of their B4 School Check vision and hearing checks (ages 4-5), potentially avoidable hospitalisations, emergency department contact and mental health service contact / treatment (ages 5-17).
• A larger proportion have experienced challenges at school including standdowns and suspensions (ages 10-15). It is possible that challenges with school behaviour may contribute to school notifications and other reports to Oranga Tamariki and subsequent interactions.
• Similar or lower levels of offending, victimisations and involvement with Youth Justice (YJ). This may partly reflect alternative approaches applied by Police, Courts and other agencies to help support children with impairments involved in offending and divert cases away from the formal Youth Justice system where possible.
• A larger proportion remain in school to ages 17-21 but leave with lower levels of formal school qualifications and a smaller proportion enrol in tertiary education. This reflects differences in the education enrolment patterns of the broader DSS population.
These differences are larger for children with higher levels of Oranga Tamariki involvement. The following table provides further insights, expanding on the charts and tables shown in the overview section above.
15 Mental health services include some disability specific mental health services funded by the Ministry of Health, as these are not explicitly identified in hospital and community provider data. The exception is Intellectual Disability teams which has been excluded from the above figures. As a result care should be taken when interpreting these results.
Wellbeing area Further insights
More frequent health service interactions, including potentially avoidable hospitalisations (PAHs), emergency department (ED) contact, higher proportion of ‘referred’ outcome for B4 school checks and mental health service contact and treatment
• ED contact and PAHs for ages 0-4: 26% of DSS Oranga Tamariki children had 2 or more ED contacts over the prior year and 26% had 2 or more PAHs over their lifetime to date. These rates are considerably higher than for other children with Oranga Tamariki involvement (roughly 2x higher) and slightly higher than for children ever allocated DSS funding with no Oranga Tamariki involvement.
• ED contact and PAHs for ages 5-17: 9% of DSS Oranga Tamariki children had 2 or more ED contacts over the prior year and 7% had a PAH in the prior year. These rates are higher than for other children with Oranga Tamariki involvement (6% had 2 or more ED contacts and 2% had PAHs in the prior year). ED contact rates were higher than for other children with DSS funding without Oranga Tamariki contact (6% had 2 or more ED contacts over the prior year) while PAH rates were similar.
• Mental health service contact and treatment15 for ages 5-17: 63% of children ever allocated DSS funding in out of home care, 60% of those in potential II and 49% of those known to OT have had mental health hospital or community provider contact or treatment over their lifetime to

Page 22 Children and young people with impairments
date. Children ever allocated DSS funding have higher rates of contact with mental health service providers, as this includes some disability specific mental health services: these rates are 1.6 times higher than for other young people in out of home care and potential II and nearly 3 times the rate of contact from other young people known to Oranga Tamariki. Lifetime rates of contact with mental health service providers are also higher than for other young people allocated DSS funding but without Oranga Tamariki involvement.
A larger proportion have experienced challenges at school including standdowns and suspensions
• Standdowns (ages 10-15): 21% of children ever allocated DSS funding and Oranga Tamariki involvement have had standdowns in their lives to date. These rates are higher than other children with Oranga Tamariki involvement (13%) and significantly higher than for other children allocated DSS funding with no Oranga Tamariki contact (7%).
For children in out of home care, children with DSS funding experienced similar levels of standdowns to other children in out of home care.
Young people with DSS funding are much more likely to remain in school to age 17 with lower levels of formal school leaving qualifications
• School enrolment: 75% of young people with DSS funding and Oranga Tamariki involvement remained enrolled in school at age 17, higher than the proportion of other young people with lifetime Oranga Tamariki involvement (65%) and considerably higher than other young people with lifetime statutory Care & Protection involvement (53%).
These enrolment rates were lower than for other young people with DSS funding but without Oranga Tamariki involvement (90%).
• Tertiary education enrolment: In line with higher school enrolment rates, a lower proportion of young people with DSS funding and Oranga Tamariki involvement were enrolled in tertiary education (14%) compared to other Oranga Tamariki young people (26%) at age 17.
• NCEA level 2+: Around 20% of young people with DSS funding and Oranga Tamariki involvement achieved NCEA level 2 or higher, compared with 57% of other young people with Oranga Tamariki involvement.
For young people previously involved with statutory Care & Protection, 15% of young people with current/previous DSS funding achieved NCEA level 2 compared with 43% of other young people with statutory Oranga Tamariki involvement.
Broadly similar socioeconomic and household profiles, with similar proportions showing signs of low income and financial stress
Children with DSS funding and Oranga Tamariki involvement have similar socioeconomic and household profiles to other children with Oranga Tamariki involvement. Overall socioeconomic levels are lower than for children with and without DSS funding in the broader population. • Parental income (ages 5-14): Around 44% of DSS Oranga Tamariki
children have parents/caregivers in the lowest income quintile, a similar proportion to other children with Oranga Tamariki contact. Around half of DSS Oranga Tamariki children have been supported by a main benefit for more than 50% of their childhood.
This proportion is higher for DSS Oranga Tamariki children in out of home care or in potential II with around 60% in the lowest parent income quintile. For other children in out of home care or potential II, 69% are in the lowest parent income quintile.
Around 70% of DSS Oranga Tamariki children are linked to one parent/caregiver, a similar proportion to other Oranga Tamariki children.
• Social housing (ages 5-14): 19% of DSS Oranga Tamariki children are in social housing and 6% are assessed as ‘at risk’ (priority A or B) on the

Page 23 Children and young people with impairments
Young people aged 18-25 At January 2019 around 3,200 young people aged 18-25 with lifetime Oranga Tamariki involvement had recently or previously been allocated DSS funding (‘DSS Oranga Tamariki young people’). An additional 4,200 young people aged 18-25 with no previous Oranga Tamariki involvement had ever been allocated DSS funding.
Key areas of differing wellbeing and service contact include:
• A significant proportion continue at school, with around 40% remaining in school at age 19 and just under 1 in 4 at school at age 21. In line with this, tertiary education enrolment rates are marginally lower than for other Oranga Tamariki young people. This reflects differences in the education enrolment patterns of the broader DSS population.
• Low employment levels with high rates of income support, reflecting challenges with employment and material wellbeing for the broader population of disabled people in New Zealand.
• More frequent health service interactions for potentially avoidable hospitalisations (PAHs) and mental health service contact/treatment. More than half (57%) of DSS young people previously in care or with FGCs had mental health hospital or community provider contact over ages 18-25.
More detailed observations are highlighted in the table below.
public housing register. These rates are broadly similar to other children with Oranga Tamariki contact (17% in social housing and 6% registered as priority on the register).
• Additional income support (ages 5-14): 60% of DSS Oranga Tamariki children were in households that accessed MSD third-tier payments over the prior year – one-off payments that may indicate financial stress.
• 85% received the Child Disability Allowance in the prior year, a similar proportion to other children with Oranga Tamariki contact.
Similar or lower levels of youth offending and victimisation
• Offences (ages 13-16): DSS Oranga Tamariki children have comparable or lower levels of involvement in offences to other Oranga Tamariki children. For DSS Oranga Tamariki children aged 13-16, 16% of those in out of home care and 26% of those in potential II were linked to low level seriousness offences in the prior year, compared with 15% of other children in out of home care and 30% of other children in potential II.
Offending rates for children with and without DSS funding and no Oranga Tamariki contact are very low (<1%).
• Youth Justice (ages 13-16): Levels of Youth Justice involvement were similar between DSS and other Oranga Tamariki children.
• Victimisations (ages 15-17): A similar proportion of DSS Oranga Tamariki young people were recorded by Police as victims of crime compared to other young people with Oranga Tamariki involvement. 7% were recorded as victims of crime in the prior year. A higher proportion of DSS young people in out of home care or potential II experienced crime, with 16% recorded by Police as being victimised in the prior year.
These rates were considerably higher for Oranga Tamariki young people than DSS and non-DSS young people in the broader population.

Page 24 Children and young people with impairments
Wellbeing area Insights
A significant proportion continue at school with lower tertiary education enrolment rates
• School enrolment: Around 40% of DSS Oranga Tamariki young people were enrolled in school at age 19, 4x the proportion of other young people with Oranga Tamariki involvement (7%). This reduces to 24% in school at age 21, with most leaving at this age.
For the broader population of DSS young people without Oranga Tamariki involvement, around 50% were in school at age 19 and 30% were in school at age 21.
• Tertiary education: Around 40% of DSS Oranga Tamariki young people were enrolled in tertiary education at some point over ages 18-21 and 25% over ages 22-25, with the majority of enrolments for courses at NZQA levels 1-3 (similar to NCEA levels). These enrolment rates were lower than other young people with prior Oranga Tamariki involvement, where around 60% enrolled in tertiary education over ages 18-21 and 45% over ages 22-25.
• These levels of tertiary education mirror the experiences of other DSS young people more broadly. For DSS young people with no Oranga Tamariki involvement, around 45% were enrolled in tertiary education at some point over ages 18-21 and 25% over ages 22-25.
Low employment levels and high rates of income support
• Employment: Around 20% of DSS Oranga Tamariki young people had employment income over $5k for at least one year over ages 18-21 and also ages 22-25. For other Oranga Tamariki young people, around 66% had employment income over $5k for at least one year over ages 18-21 (73% for ages 22-25).
Employment rates were similar across DSS young people known to Oranga Tamariki with/without statutory Care & Protection involvement and were lower than for DSS young people without Oranga Tamariki history (around 25% had employment income over $5k for some/all ages 18-21 and also ages 22-25).
• Income support - Main benefit: The majority of DSS Oranga Tamariki young people (95%) were supported by a main benefit at some point over ages 18-25, with the majority (80%) supported more than half of the time. Most payments (75%) were Supported Living Payments. For other Oranga Tamariki young people, around 60% were supported by a main benefit at some point over ages 18-25, with around 1 in 4 receiving benefit support for over 50% of the period.
• Income support – other support payments: Around half of DSS Oranga Tamariki young people received the Disability Allowance payment, while 50% accessed third-tier payments (payments intended to be one-off, such as special needs grants).
More frequent potentially avoidable hospitalisations and mental health service contact / treatment
• Potentially avoidable hospitalisations: 17% of DSS Oranga Tamariki young people had PAHs over ages 18-25. This was similar to other DSS young people without Oranga Tamariki involvement, and around 2.4x higher than the proportion of other young people with Oranga Tamariki involvement who had PAHs over the same age period (7%).
• Mental health service contact and treatment15:
− Around half of DSS Oranga Tamariki young people (57% of DSS young people previously in out of home care or with FGCs) had mental health service contact or treatment over ages 18-25. These rates are considerably higher than for other Oranga Tamariki young people; 28% of those with Oranga Tamariki involvement had mental health service contact or treatment (39% for those previously in out of home care or with FGCs).
− More broadly, around 29% of DSS young people and 10% of other young people without Oranga Tamariki involvement had mental health hospital/provider contact over ages 18-25.

Page 25 Children and young people with impairments
Proportion of DSS and other young people in schools and tertiary education at ages 18-24 for:
Figure 12: Young people with previous Oranga Tamariki involvement
Figure 13: Young people without previous Oranga Tamariki involvement
0%
10%
20%
30%
40%
50%
60%
70%
80%
90%
100%
18 19 20 21 22 23 24
Current or previous DSS funding: In school
Current or previous DSS funding: In Tertiaryeducation
Other: In school
Other: In Tertiary education
0%
10%
20%
30%
40%
50%
60%
70%
80%
90%
100%
18 19 20 21 22 23 24
Current or previous DSS funding: In school
Current or previous DSS funding: In Tertiaryeducation
Other: In school
Other: In Tertiary education
• Substance usage treatment: 13% of DSS Oranga Tamariki young people had treatment for substance usage over ages 18-25. These rates are marginally lower than other young people with Oranga Tamariki involvement over the same age period (16%).
Similar or lower levels of offending and victimisation
• Offences: Fewer DSS Oranga Tamariki young people were involved in offences compared to other young people with Oranga Tamariki involvement, with 7% involved in low level seriousness offences (12% for other Oranga Tamariki young people) over the 3 years to January 2019.
• Victimisations: 8% were recorded as victims of crime in the 3 years to January 2019. This was similar to other Oranga Tamariki young people but 2.5x higher than for other DSS young people who are not known to Oranga Tamariki.

Page 26 Children and young people with impairments
Proportion of DSS and other young people with employment and benefit income at age 18-24 for:
Figure 14: Young people with previous Oranga Tamariki involvement
Figure 15: Young people without previous Oranga Tamariki involvement
0%
10%
20%
30%
40%
50%
60%
70%
80%
90%
100%
18 19 20 21 22 23 24
Current or previous DSS funding: Recent benefit
Current or previous DSS funding: Employmentincome >$5k
Other: Recent benefit
Other: Employment income >$5k
0%
10%
20%
30%
40%
50%
60%
70%
80%
90%
100%
18 19 20 21 22 23 24
Current or previous DSS funding: Recent benefit
Current or previous DSS funding: Employmentincome >$5kOther: Recent benefit
Other: Employment income >$5k

Page 27 Children and young people with impairments
Proportion of DSS and other young people aged 18-25 with selected wellbeing indicators for:
Figure 16: Young people with previous Oranga Tamariki involvement
Figure 17: Young people without previous Oranga Tamariki involvement
0% 20% 40% 60% 80%100%
Potentially avoidablehospitalisations over ages
18-25
Mental health hospital andcommunity provider
service contact /treatment over ages 18-25
NCEA level 2 or higher (orequivalent) qualification -
includes both schoolleaving and tertiary
qualifications
Police recordedvictimisation over the last
3 years
Low level seriousnessoffences over the last 3
years
Known to OT: Current/previous DSS funding
Known to OT: No DSS funding
0% 20% 40% 60% 80%100%
Potentially avoidablehospitalisations over ages
18-25
Mental health hospital andcommunity provider
service contact /treatment over ages 18-25
NCEA level 2 or higher (orequivalent) qualification -
includes both schoolleaving and tertiary
qualifications
Police recordedvictimisation over the last
3 years
Low level seriousnessoffences over the last 3
years
Unknown to OT: Current/previous DSS funding
Unknown to OT: No DSS funding
Page 28 Children and young people with impairments
CONSIDERATIONS AND STATISTICS NZ DISCLAIMER Definition of disability and known/unknown populations with impairments
It is important to acknowledge that the disabled population of children and young people in New Zealand is broader than the population of those who have ever had CDA payments, been allocated DSS funding or received ORS funding. Reasons include (but are not limited to):
• Different definitions of disability are in use by agencies, organisations and communities, and these can vary over time, meaning that direct comparisons between agencies or across time periods may not be feasible.
• Not all children and young people with impairments will have had these types of service contact. Some may receive support from other services, such as the Accident Compensation Corporation (ACC) in respect of impairments caused by accident or injury, or District Health Board general health services. Others may not have service contact for other reasons, such as not being aware or eligible for these sources of support.
• Not all children and young people with impairments will have yet received a formal diagnosis. (This report shows how the proportion of children allocated DSS funding increases with age and varies by gender, and discusses the various potential reasons behind this pattern.)
• Disability arising from mental health conditions may have a lower degree of coverage from the above indicators for children.
The findings in this report should be interpreted as being specific to those children and young people with these service indicators, rather than the broader New Zealand disabled population, who have different characteristics and needs profiles and who may not access services to the same extent as the DSS client group.
Considerations with the use of administrative data
The service contact indicators described in this report are likely to be subject to some degree of variation by geography, between different population groups, and over time (for example). Administrative data will be affected by any changes in reporting and recording practices.
As a result, these indicators should be interpreted as highlighting areas of potential higher need – not as representing the entire population of need. For example, the number of households with disabled children and financial stress may be higher than the number accessing income support payments, reflecting varying service capacity as well as other factors such as eligibility, stigma, accessibility and affordability.
Disabled children with severe impairments may be ineligible for services if the service excludes specific impairment types, is means tested, if they are not formally diagnosed or are awaiting diagnosis. Disabled children may also be impaired and have support needs, but have an impairment that is not severe enough to meet the threshold to be eligible for the service.

Page 29 Children and young people with impairments
Furthermore, disabled children may be eligible for the service but not utilise it because they receive the funding or service privately. Analysis findings from the IDI will also be impacted by Statistics NZ’s linkage and matching process. Service usage indicators are more likely to be visible for children and parents/caregivers interacting with multiple agencies, but less visible for those who are more transient or have fewer/no agency interactions.
Finally, it is important to acknowledge that administrative data does not reflect all aspects of children’s wellbeing, including their emotional and spiritual wellbeing, connection to culture, and the strength of their relationships with family/whānau, friends and their communities. These are important parts of children’s lives and further research to describe the experiences of children with impairments would be of significant value.
Other data sources for future consideration
• Hospitalisation records, community provider treatments and prescriptions (including those specifically given to children). These data sources may highlight children who have impairments but have never received DSS, CDA or ORS.
• Other information on learning support funded by MOE, for example behavioural support
• MSD Adult Disability Allowance, Supported Living Payments and other disability payments. These payments could potentially be used to identify people who have impairments in adulthood that also were present during childhood, with the use of information around the type of impairment.
• Accident Compensation Corporation ongoing support payments for disability as a result of accidents (subject to investigations around data quality and completeness).
• 2013 Disability Survey responses. Note that there is limited overlap between survey respondents and the population involved with Oranga Tamariki.
• 2018 Census. For consideration once available for analysis.

Page 30 Children and young people with impairments
Stats NZ disclaimer
The results in this document are not official statistics, they have been created for research purposes from the Integrated Data Infrastructure (IDI) managed by Statistics New Zealand.
Access to the anonymised data used in this study was provided by Statistics NZ in accordance with security and confidentiality provisions of the Statistics Act 1975. Only people authorised by the Statistics Act 1975 are allowed to see data about a particular person, household, business or organisation and the results in this Excel workbook have been confidentialised to protect these groups from identification.
Careful consideration has been given to the privacy, security and confidentiality issues associated with using administrative and survey data in the IDI. Further detail can be found in the Privacy impact assessment for the Integrated Data Infrastructure available from www.stats.govt.nz.
The results are based in part on tax data supplied by Inland Revenue to Statistics NZ under the Tax Administration Act 1994. This tax data must be used only for statistical purposes, and no individual information may be published or disclosed in any other form, or provided to Inland Revenue for administrative or regulatory purposes.
Any person who has had access to the unit-record data has certified that they have been shown, have read, and have understood section 81 of the Tax Administration Act 1994, which relates to secrecy. Any discussion of data limitations or weaknesses is in the context of using the IDI for statistical purposes, and is not related to the data's ability to support Inland Revenue's core operational requirements.

Page 31 Children and young people with impairments
APPENDIX 1: DISABILITY INDICATORS This appendix provides a description of the disability indicators used for this analysis. Descriptions have been sourced from the Ministry of Education, Ministry of Social Development and Ministry of Health websites available at the date of this report.
Ongoing Resourcing Scheme The Ministry of Education’s Ongoing Resourcing Scheme (ORS) is for students who have the highest ongoing levels of need for specialist support at school. Only a small number of students (about 1% of the school population at any one time) will have this highest level of need.
ORS support helps students to join in and learn alongside other students at school. Any student who meets the ORS criteria is included in the scheme. Once a student is in ORS, their funding and support stays with them throughout their time at school. ORS funding and resources are considered to be a contribution to supporting a student’s schooling.
ORS has 2 levels of need: ‘very high needs’ and ‘high needs’. To meet the ORS criteria, students must have either ongoing extreme or severe difficulty in any of the following areas:
• learning
• hearing
• vision
• physical
• language use and social communication
Or they must have a moderate to high difficulty with learning, combined with 2 other areas of need at a moderate to high level. Together the 3 needs inter-relate to significantly reduce a student's ability to access learning. The other areas of difficulty at a moderate to high level are:
• hearing
• vision
• physical
• language use and social communication
Child Disability Allowance The Ministry of Social Development’s Child Disability Allowance (CDA) is a fortnightly payment made to the main carer of a child or young person with a serious disability. It is paid in recognition of the extra care and attention needed for that child.
To meet the CDA criteria, the child needs to be assessed by their health practitioner as needing constant care and attention for at least 12 months because of a serious disability. The child or

Page 32 Children and young people with impairments
young person must need constant care and attention, over and above the ordinary care and attention required by a child or young person of the same age.
Either the child or young person requires:
• frequent attention from another person in connection with their bodily functions, or
• substantially more attention and supervision than is normally required by a child of the same age and gender, or
• regular supervision from another person to avoid substantial danger to themselves or others.
Disability Support Services The Ministry of Health funds Disability Support Services (DSS) for people (generally under 65 years of age) with a long-term physical, intellectual and/or sensory impairment that will require ongoing support.
These are available to people who have a physical, intellectual or sensory disability (or a combination of these) which:
• is likely to continue for at least 6 months.
• limits their ability to function independently, to the extent that ongoing support is required.
The Ministry also allocates DSS funding for people with:
• some neurological conditions that result in permanent disabilities
• some developmental disabilities in children and young people, such as autism
• physical, intellectual or sensory disability that co-exists with a health condition and/or injury.
The Ministry of Health does not generally fund disability support services for people with:
• personal health conditions such as diabetes or asthma
• mental health and addiction conditions such as schizophrenia, severe depression or long-term addiction to alcohol and drugs
• impairments such as paraplegia and brain injury caused by accident or injury, as these are covered by ACC.
Key limitations in the context of children and young people with impairments include:
• People with Fetal Alcohol Syndrome Disorders (FASD) are not currently eligible for DSS, unless they have a co-occurring eligible disability. The Ministry of Health states that international studies suggest that around 3% of births may be affected by FASD16, and that about 21% of
16 https://www.health.govt.nz/our-work/diseases-and-conditions/fetal-alcohol-spectrum-disorder

Page 33 Children and young people with impairments
children in foster care have Fetal Alcohol Syndrome (FAS) and between 30% and 50% have a Fetal Alcohol Syndrome Disorder17.
• A high threshold is applied for DSS funding for intellectual disability; all children with developmental delay are eligible for Child Development Services but would need to have an IQ of 72 or less to be eligible for DSS.
The types of disability supports available are contained in the table below. Only information for children and young people who accessed supports through a Needs Assessment and Service Coordination (NASC) organisation are analysed in this report. Child development services, sensory services, equipment and modification services and assessment, treatment and rehabilitation services are not accessed through the NASC. Children and young people who only used these services are not included in the analysis.
17 Ministry of Health. 2015. “Taking Action on Fetal Alcohol Spectrum Disorder (FASD): A discussion document”
DSS Funding Subgroup Description
Autism spectrum disorder support People with autism spectrum disorder can access a range of disability support services to enable them to live everyday lives and to connect with the wider community.
Behaviour Support Services Behaviour Support Services work with a disabled person and their support network to reduce the impact of the person’s challenging behaviour.
Child Development Services Child Development Services provide early intervention for preschool children who have disabilities or are not achieving developmental milestones.
Community Day Services Community day services help disabled adults who can’t find work to take part in their community and improve their personal skills by providing access to regular meaningful social contact and stimulating activities.
Community Residential Support Services
Community Residential Support Services assist disabled people to live in a supported community environment.
Equipment and modifications for disabled people
The Ministry can provide different kinds of support if you have a disability. This includes equipment and modifications to your home or vehicle to help with your everyday activities.
Funded Family Care Funded Family Care is health funding for some eligible disabled people over the age of 18 with high or very high needs so that they can pay family members they live with to help you with personal care and/or household tasks.
Hearing and Vision Services The Ministry’s Hearing and Vision Services provide free or subsidised equipment to people with disabilities, such as hearing aids, cochlear implants and spectacles.
Home and Community Support Services
Home and Community Support Services are funded by the Ministry to support disabled people to live at home. They can help with both household management and personal care.

Page 34 Children and young people with impairments
Individualised Funding Individualised Funding enables disabled people to directly manage the resources they have been allocated for disability supports.
Respite Respite is taking a break from your caring responsibilities. Taking time out can help you feel rested and re-energised. If you are the full-time, unpaid carer for a person with a disability, then the Ministry of Health funded respite supports and services are available for you.
Supported Living Supported Living is a service that helps disabled people to live independently by providing support in those areas of their life where help is needed.

Page 35 Children and young people with impairments
APPENDIX 2: COHORT SUMMARIES Children with Oranga Tamariki involvement, and in particular statutory involvement, are more likely to have indicators of disability, including:
• Ministry of Health allocated Disability Support Services (DSS) funding
• Ministry of Social Development Child Disability Allowance (CDA) payments
• Ministry of Education Ongoing Resourcing Scheme (ORS) funding18
The tables below show the proportion for ages 0-17 and 18-25 in each Oranga Tamariki population group who have at least one indicator of disability for the cohort of tamariki defined in each row.
Table 1: Proportion of children, aged 0-17 at January 2019, with selected disability-related support services
Indicator / Oranga Tamariki (OT) population
Any19 (n=57,290)
Currently or previously allocated DSS funding
(n=16,300)
Currently or previously receives
MSD CDA (n=52,300)
Currently or previously enrolled in
MOE ORS (n=8,100)
In OOH care (n=4,600) 14% 7% 9% 3%
Potential II (n=7,300) 11% 5% 9% 2%
Recent OT (n=50,800) 9% 3% 7% 1%
Past OT (n=139,900) 10% 3% 9% 1%
Total known to OT (n=202,600)
10% 3% 9% 1%
Unknown to OT (n=922,200)
4% 1% 4% 1%
Total children (n=1,124,800)
5% 1% 5% 1%
18 This is ORS funding linked to individual children within the MOE IDI data. This does not include ORS funding linked to schools (rather than individual children), other learning support services funded by MOE or by individual schools.
19 Indicators are not mutually exclusive, so the sum of children across indicator types will be greater than the total number of children.

Page 36 Children and young people with impairments
Table 2: Proportion of young people, aged 18-25 at January 2019, with selected disability-related support services
Indicator/ Oranga Tamariki (OT) population
Any (n=32,200)
Currently or previously allocated DSS funding
(n=7,400)
Currently or previously receives
MSD CDA (n=30,400)
Currently or previously enrolled in
MOE ORS (n=4,100)
Statutory involvement (n=29,600)
19% 5% 17% 2%
Sub-statutory involvement (n=55,200)
12% 2% 11% 1%
Report of Concern (n=18,300)
9% 2% 9% 1%
Total known to OT (n=103,200)
13% 3% 13% 2%
Unknown to OT (n=370,700)
5% 1% 5% 1%
Total young people (n=473,800)
7% 2% 6% 1%
Cohort summaries by age
The tables below show the proportion of children in each Oranga Tamariki population group, split by age group, who have any or one of these disability indicators.
Table 3: Proportion of children, aged 0-4 at January 2019, with selected disability-related support services
Indicator/ Oranga Tamariki (OT) population
Any (n=5,600)
Currently or previously allocated DSS funding
(n=1,400)
Currently or previously
receives CDA (n=5,100)
Currently or previously enrolled in
MOE ORS (n=N/A)
In OOH care (n=1,200) 4% 1% 3% N/A
Potential II (n=1,800) 5% 1% 4% N/A Recent OT (n=12,600) 4% 1% 3% N/A
Past OT (n=11,000) 6% 1% 5% N/A
Total known to OT (n=26,600) 5% 1% 4% N/A
Unknown to OT (n=270,000) 2% 0% 1% N/A
Total children (n=296,700) 2% 0% 2% N/A

Page 37 Children and young people with impairments
Table 4: Proportion of children, aged 5-14 at January 2019, with selected disability-related support services
Table 5: Proportion of children, aged 15-17 at January 2019, with selected disability-related support services
Indicator/ Oranga Tamariki (OT) population
Any (n=39,400)
Currently or previously allocated DSS funding
(n=11,400)
Currently or previously
receives CDA (n=36,100)
Currently or previously enrolled in
MOE ORS (n=6,300)
In OOH care(n=2,800) 16% 8% 11% 4%
Potential II (n=4,100) 13% 5% 11% 2%
Recent OT (n=31,200) 10% 3% 9% 2% Past OT (n=94,700) 10% 3% 10% 1%
Total known to OT (n=132,800)
11% 3% 9% 2%
Unknown to OT (n=509,400) 5% 1% 5% 1%
Total children (n=642,200) 6% 2% 6% 1%
Indicator/ Oranga Tamariki (OT) population
Any (n=12,300)
Currently or previously allocated DSS funding
(n=3,500)
Currently or previously
receives CDA (n=11,000)
Currently or previously enrolled in
MOE ORS (n=1,900)
In OOH care(n=600) 25% 16% 15% 7%
Potential II (n=1,400) 16% 9% 12% 4%
Recent OT (n=7,000) 11% 4% 9% 2% Past OT (n=34,200) 10% 3% 9% 1%
Total known to OT (n=43,200) 1 1 % 3 % 9 % 2 %
Unknown to OT (n=143,800) 5% 1% 5% 1%
Total children (n=185,900) 7 % 2 % 6 % 1 %

Page 38 Children and young people with impairments
Cohort summaries by gender
The tables below show the proportion of children in each Oranga Tamariki population group, split by gender, who have any or one of these disability indicators.
Table 6: Proportion of female children, with selected disability-related support services
Table 7: Proportion of male children, with selected disability-related support services
Indicator/ Oranga Tamariki (OT) population
Any (n=21,600)
Currently or previously allocated DSS funding
(n=4,800)
Currently or previously
receives CDA (n=20,200)
Currently or previously enrolled in
MOE ORS (n=2,600)
In OOH care(n=2,200) 12% 6% 8% 3%
Potential II (n=3,400) 8% 2% 7% 1% Recent OT (n=25,200) 7% 2% 6% 1%
Past OT (n=68,000) 8% 2% 7% 1%
Total known to OT (n=98,700) 8% 2% 7% 1%
Unknown to OT (n=449,200) 3% 1% 3% 0%
Total children (n=547,900) 4% 1% 4% 0%
Indicator/ Oranga Tamariki (OT) population
Any (n=35,700)
Currently or previously allocated DSS funding
(n=11,500)
Currently or previously
receives CDA (n=32,100)
Currently or previously enrolled in
MOE ORS (n=5,500)
In OOH care(n=2,400) 16% 9% 10% 4%
Potential II (n=3,900) 14% 6% 12% 3% Recent OT (n=25,700) 10% 4% 9% 2%
Past OT (n=71,900) 12% 4% 11% 2%
Total known to OT (n=103,800)
12% 4% 10% 2%
Unknown to OT (n=473,100) 5% 2% 4% 1%
Total children (n=576,900) 7% 2% 6% 1%

Page 39 Children and young people with impairments
Cohort summaries by ethnicity
The tables below show the proportion of children in each Oranga Tamariki population group, by ethnicity, who have any or one of these disability indicators.
Table 8: Proportion of Māori children, aged 0-17 at January 2019, with selected disability-related support services
Indicator/ Oranga Tamariki (OT) population
Any (n=18,900)
Currently or previously
allocated DSS funding (n=4,500)
Currently or previously
receives CDA (n=17,200)
Currently or previously
enrolled in MOE ORS
(n=2,500)
In OOH care (n=3,000) 11% 5% 7% 2%
Potential II (n=4,500) 10% 3% 8% 1% Recent OT (n=26,400) 8% 2% 7% 1%
Past OT (n=65,700) 9% 2% 9% 1%
Total known to OT (n=99,600) 9% 2% 8% 1%
Unknown to OT (n=196,500) 5% 1% 5% 1%
Total children (n=296,100) 6% 2% 6% 1%
Table 9: Proportion of Pacific20 children, aged 0-17 at January 2019, with selected disability-related support services
Table 10: Proportion of non-Māori and non-Pacific ethnicity (NZ European, Asian and Other) children, aged 0-17 at January 2019, with selected disability-related support services
20 “Prioritised” ethnicity is used in these summary tables. This means that the ethnicity groups are mutually exclusive and each child is only included in one table. Māori ethnicity has been prioritised over Pacific, meaning that children with both Pacific and Māori ethnicity are shown in the Māori table but not the Pacific table.
Indicator/ Oranga Tamariki (OT) population
Any (n=4,400)
Currently or previously
allocated DSS funding (n=1,300)
Currently or previously
receives CDA (n=3,900)
Currently or previously
enrolled in MOE ORS
(n=800) In OOH care (n=400) 11% 6% 8% 4%
Potential II (n=800) 7% 4% 6% 2%
Recent OT (n=5,800) 6% 2% 5% 1% Past OT (n=18,700) 6% 2% 6% 1%
Total known to OT (n=25,600) 6% 2% 5% 1%
Unknown to OT (n=85,000) 3% 1% 3% 1%
Total children (n=110,500) 4% 1% 4% 1%
Indicator/ Oranga Tamariki (OT) population
Any (n=34,000)
Currently or previously
Currently or previously
receives CDA
Currently or previously

Page 40 Children and young people with impairments
Cohort summaries by region
The tables below show the proportion of children in each Oranga Tamariki population group, split by urban or regional/rural area, who have any or one of these disability indicators.
Table 11: Proportion of children, living in regional/rural areas, with selected disability-related support services
allocated DSS funding (n=10,500)
(n=31,200) enrolled in MOE ORS
(n=4,800)
In OOH care(n=1,200) 21% 13% 14% 5% Potential II (n=2,000) 16% 8% 14% 3%
Recent OT (n=18,600) 11% 4% 9% 2%
Past OT (n=55,500) 12% 4% 11% 2%
Total known to OT (n=77,400) 12% 4% 11% 2%
Unknown to OT (n=640,700) 4% 1% 4% 1%
Total children (n=718,200) 5% 1% 4% 1%
Indicator/ Oranga Tamariki (OT) population
Any (n=12,800)
Currently or previously
allocated DSS funding (n=3,300)
Currently or previously
receives CDA (n=11,900)
Currently or previously
enrolled in MOE ORS
(n=1,700)
In OOH care(n=1,200) 13% 6% 9% 2% Potential II (n=1,500) 10% 4% 8% 1%
Recent OT (n=11,300) 8% 2% 7% 1%
Past OT (n=32,500) 10% 3% 9% 1%
Total known to OT (n=46,400) 10% 3% 9% 1%
Unknown to OT (n=205,500) 4% 1% 4% 1%
Total children (n=251,900) 5% 1% 5% 1%

Page 41 Children and young people with impairments
Table 12: Proportion of children, living in urban areas, with selected disability-related support services
Indicator/ Oranga Tamariki (OT) population
Any (n=44,400)
Currently or previously
allocated DSS funding (n=13,000)
Currently or previously
receives CDA (n=40,400)
Currently or previously
enrolled in MOE ORS
(n=6,400) In OOH care(n=3,500) 14% 8% 9% 3%
Potential II (n=5,800) 12% 5% 9% 2%
Recent OT (n=39,500) 9% 3% 7% 1% Past OT (n=107,400) 10% 3% 9% 1%
Total known to OT (n=156,100)
10% 3% 9% 1%
Unknown to OT (n=714,400) 4% 1% 4% 1%
Total children (n=870,500) 5% 1% 5% 1%

Page 42 Children and young people with impairments
APPENDIX 3: TRANSITION POPULATION COHORT SUMMARIES Young people, who are transitioning to adulthood, with Oranga Tamariki involvement and in particular statutory involvement are more likely to have indicators of disability, including:
• Ministry of Health allocated Disability Support Services (DSS) funding
• Ministry of Social Development Child Disability Allowance (CDA) payments
• Ministry of Education Ongoing Resourcing Scheme (ORS) funding21
Cohort summaries by age
The tables below show the proportion of young people in each Oranga Tamariki population group, split by age group, who have any or one of these disability indicators.
Table 13: Proportion of young people, aged 18-21 at January 2019, with selected disability-related support services
21 This is ORS funding linked to individual children within the MOE IDI data. This does not include ORS funding linked to schools (rather than individual children), other learning support services funded by MOE or by individual schools.
Indicator/ Oranga Tamariki (OT) population
Any (n=16,600)
Currently or previously allocated
DSS funding (n=4,100)
Currently receives MSD Child Disability Allowance
(n=6,700)
Currently or previously
enrolled in MOE ORS
(n=2,200) Statutory involvement (n=15,200)
18% 5% 17% 2%
Sub-statutory involvement (n=30,100)
12% 3% 11% 1%
Report of Concern (n=10,000) 9% 2% 9% 1%
Total known to OT (n=55,300) 13% 3% 12% 2%
Unknown to OT (n=189,300) 5% 1% 5% 1%
Total population (n=243,600) 7% 2% 6% 1%

Page 43 Children and young people with impairments
Table 14: Proportion of young people, aged 22-25 at January 2019, with selected disability-related support services
Cohort summaries by gender
The tables below show the proportion of young people in each Oranga Tamariki population group, split by gender, who have any or one of these disability indicators.
Table 15: Proportion of female adults, aged 18-25 at January 2019, with selected disability-related support services
Indicator/ Oranga Tamariki (OT) population
Any (n=15,600)
Currently or previously allocated
DSS funding (n=3,300)
Currently receives MSD Child Disability Allowance
(n=6,200)
Currently or previously
enrolled in MOE ORS
(n=2,000) Statutory involvement (n=14,400)
19% 5% 18% 2%
Sub-statutory involvement (n=25,100)
12% 2% 12% 1%
Report of Concern (n=8,400) 9% 2% 9% 1%
Total known to OT (n=47,900) 14% 3% 13% 2%
Unknown to OT (n=182,400) 5% 1% 5% 1%
Statutory involvement (n=14,400)
7% 1% 6% 1%
Indicator/ Oranga Tamariki (OT) population
Any (n=13,100)
Currently or previously allocated
DSS funding (n=2,500)
Currently receives MSD Child Disability Allowance
(n=12,500)
Currently or previously
enrolled in MOE ORS
(n=1,500) Statutory involvement (n=14,600)
16% 4% 15% 2%
Sub-statutory involvement (n=28,800)
10% 2% 10% 1%
Report of Concern (n=8,900) 8% 1% 8% 1%
Total known to OT (n=52,300) 11% 2% 11% 1%
Unknown to OT (n=178,700) 4% 1% 4% 1%
Total population (n=231,000) 6% 1% 5% 1%

Page 44 Children and young people with impairments
Table 16: Proportion of male adults, aged 18-25 at January 2019, with selected disability-related support services
Cohort summaries by ethnicity
The tables below show the proportion of young people in each Oranga Tamariki population group, by ethnicity, who have any or one of these disability indicators.
Table 17: Proportion of Māori young people, aged 18-25 at January 2019, with selected disability-related support services
Indicator/ Oranga Tamariki (OT) population
Any (n=9,600)
Currently or previously allocated
DSS funding (n=1,800)
Currently receives MSD Child Disability
Allowance (n=9,100)
Currently or previously
enrolled in MOE ORS
(n=1,100) Statutory involvement (n=15,800)
16% 4% 15% 2%
Sub-statutory involvement (n=23,800)
11% 2% 10% 1%
Report of Concern (n=6,600) 9% 1% 8% 1%
Total known to OT (n=46,200) 12% 2% 11% 1%
Unknown to OT (n=67,400) 6% 1% 6% 1%
Total population (n=113,600) 8% 2% 8% 1%
Indicator/ Oranga Tamariki (OT) population
Any (n=19,100)
Currently or previously allocated
DSS funding (n=4,900)
Currently receives MSD Child Disability Allowance
(n=17,900)
Currently or previously
enrolled in MOE ORS
(n=2,600) Statutory involvement (n=15,100)
22% 6% 20% 3%
Sub-statutory involvement (n=26,400)
14% 3% 13% 2%
Report of Concern (n=9,400) 10% 3% 9% 1%
Total known to OT (n=50,900) 16% 4% 15% 2%
Unknown to OT (n=192,000) 6% 1% 5% 1%
Total population (n=242,800) 8% 2% 7% 1%

Page 45 Children and young people with impairments
Table 18: Proportion of Pacific20 young people, aged 18-25 at January 2019, with selected disability-related support services
Table 19: Proportion of non-Māori and non-Pacific ethnicity (NZ European, Asian and Other) young people, aged 18-25 at January 2019, with selected disability-related support services
Indicator/ Oranga Tamariki (OT) population
Any (n=1,900)
Currently or previously allocated
DSS funding (n=500)
Currently receives MSD Child Disability Allowance
(n=1,800)
Currently or previously
enrolled in MOE ORS
(n=400) Statutory involvement (n=3,300)
9% 3% 8% 2%
Sub-statutory involvement (n=6,800)
6% 1% 6% 1%
Report of Concern (n=2,200) 5% 1% 5% 1%
Total known to OT (n=12,300) 7% 2% 6% 1%
Unknown to OT (n=31,800) 3% 1% 3% 1%
Total population (n=44,100) 4% 1% 4% 1%
Indicator/ Oranga Tamariki (OT)population
Any (n=20,700)
Currently or previously allocated
DSS funding (n=5,100)
Currently receives MSD Child Disability Allowance
(n=19,600)
Currently or previously
enrolled in MOE ORS
(n=2,700) Statutory involvement (n=10,600)
26% 8% 24% 3%
Sub-statutory involvement (n=24,500)
15% 3% 14% 2%
Report of Concern (n=9,500) 10% 3% 10% 1%
Total known to OT (n=44,600) 16% 4% 16% 2%
Unknown to OT (n=271,400) 5% 1% 5% 1%
Total population (n=316,100) 7% 2% 6% 1%

Page 46 Children and young people with impairments
Cohort summaries by region
The tables below show the proportion of young people in each Oranga Tamariki population group, split by urban and regional/rural area, who have any or one of these disability indicators.
Table 20: Proportion of young people, living in regional/rural areas, and aged 18-25 at January 2019 with selected disability-related support services
Table 21: Proportion of young people, living in urban areas, and aged 18-25 at January 2019, with selected disability-related support services
Indicator/ Oranga Tamariki (OT) population
Any (n=6,100)
Currently or previously allocated
DSS funding (n=1,300)
Currently receives MSD Child Disability Allowance
(n=5,800)
Currently or previously
enrolled in MOE ORS
(n=800) Statutory involvement (n=5,600)
19% 4% 17% 2%
Sub-statutory involvement (n=11,100)
12% 2% 11% 1%
Report of Concern (n=3,100) 10% 2% 9% 1%
Total known to OT (n=19,800) 13% 3% 13% 1%
Unknown to OT (n=62,600) 5% 1% 5% 1%
Total population (n=82,500) 7% 2% 7% 1%
Indicator/ Oranga Tamariki (OT) population
Any (n=26,100)
Currently or previously allocated
DSS funding (n=6,100)
Currently receives MSD Child Disability Allowance
(n=24,700)
Currently or previously
enrolled in MOE ORS
(n=3,400) Statutory involvement (n=24,000)
19% 5% 17% 2%
Sub-statutory involvement (n=44,100)
12% 2% 11% 1%
Report of Concern (n=15,200) 9% 2% 8% 1%
Total known to OT (n=83,300) 13% 3% 13% 2%
Unknown to OT (n=307,700) 5% 1% 5% 1%
Total population (n=391,100) 7% 2% 6% 1%

Page 47 Children and young people with impairments
Overlap of indicators of disability Figure 18 shows the distribution of young people, aged 18-25, who have at least one indicator of disability, in any combination.
Figure 18: Profile of disability indicators for young people aged 18-25 with at least one disability indicator, split by level of Oranga Tamariki (OT) involvement

Page 48 Children and young people with impairments
APPENDIX 4: PRINCIPAL DISABILITY AND SUPPORT NEEDS LEVELS The tables below show the proportion of children and young people in each Oranga Tamariki population group who have currently or previously been allocated DSS funding by principal disability type.
Table 22: Proportion of children with current or previous allocated DSS funding aged 0-17 at January 2019 by principal disability type
Principal disability/ Oranga Tamariki (OT) population
Autism Spectrum Disorder (n=6,500)
Intellectual (n=8,600)
Physical, neurological, sensory or other
(n=1,200)
In OOH care (n=300) 11% 87% 3%
Potential II (n=300) 25% 69% 6%
Recent OT (n=1,400) 31% 63% 7%
Past OT (n=3,800) 34% 59% 8%
Total known to OT (n=5,800) 31% 62% 7%
Unknown to OT (n=10,500) 45% 47% 8%
Total children (n=16,300) 40% 53% 8%
Table 23: Proportion of young people with current or previous allocated DSS funding, aged 18-25 at January 2019 by principal disability type
Principal disability/ Oranga Tamariki (OT) population
Autism Spectrum Disorder (n=2,000)
Intellectual (n=4,500)
Physical, neurological, sensory or other
(n=900)
Statutory involvement (n=1,500)
16% 78% 6%
Sub-statutory involvement (n=1,700)
25% 62% 12%
Total known to OT (n=3,200) 21% 70% 10%
Unknown to OT (n=4,200) 32% 53% 15%
Total young people (n=7,400) 27% 60% 13%

Page 49 Children and young people with impairments
The table below shows the proportion of children and young people in each Oranga Tamariki population group who have currently or previously been allocated DSS funding with varying support needs22.
Table 24: Proportion of children with current or previous allocated DSS funding aged 0-17 at January 2019 with varying support needs
Principal disability summaries by age
Table 25: Proportion of children with current or previous allocated DSS funding, aged 0-4 at January 2019 by principal disability type
22 ‘Support needs level’ refers to the Support Package Allocation level recorded by MoH for DSS clients. The most recent support needs level is shown.
23 ‘s’ denotes groups whose counts are too small to show and have been suppressed.
Support needs level/ Oranga Tamariki (OT) population
Very high or high (n=8,400)
Medium, low or very low (n=7,900)
In OOH care (n=300) 66% 34%
Potential II (n=300) 74% 26%
Recent OT (n=1,400) 60% 40%
Past OT (n=3,800) 54% 46%
Total known to OT (n=5,800) 57% 43%
Unknown to OT (n=10,500) 48% 52%
Total population (n=16,300) 51% 49%
Principal disability type / Oranga Tamariki (OT) population
Autism Spectrum Disorder
(n=500)
Intellectual (n=800)
Physical, Neurological, Sensory, Other
(n=100)
In OOH care(n<20) s23 >75% s23 Potential II (n<30) 43% 57% N/A
Recent OT (n=100) 28% 64% 5%
Past OT (n=100) 31% 60% 12%
Total known to OT (n=300) 29% 64% 7%
Unknown to OT (n=1,100) 36% 55% 9%
Total population (n=1,400) 34% 57% 9%

Page 50 Children and young people with impairments
Table 26: Proportion of children with current or previous allocated DSS funding, aged 5-14 at January 2019 by principal disability type
Table 27: Proportion of children with current or previous allocated DSS funding, aged 15-17 at January 2019 by principal disability type
Principal disability summaries by gender
Table 28: Proportion of female children with current or previous allocated DSS funding, aged 0-17 at January 2019 by principal disability type
Principal disability type / Oranga Tamariki (OT) population
Autism Spectrum Disorder (n=4,800)
Intellectual (n=5,800)
Physical, Neurological, Sensory, Other
(n=800)
In OOH care(n=200) 13% 84% 3% Potential II (n=200) 25% 69% 6%
Recent OT (n=1,000) 32% 62% 6%
Past OT (n=2,600) 35% 57% 8%
Total known to OT (n=4,100) 33% 60% 7%
Unknown to OT (n=7,400) 47% 46% 7%
Total population (n=11,400) 42% 51% 7%
Principal disability type / Oranga Tamariki (OT) population
Autism Spectrum Disorder (n=1,200)
Intellectual (n=2,000)
Physical, Neurological, Sensory, Other
(n=3,500)
In OOH care(n=100) 10% 90% s23
Potential II (n=100) 23% 72% 5%
Recent OT (n=300) 28% 66% 7%
Past OT (n=1,000) 30% 63% 7%
Total known to OT (n=1,500) 28% 66% 6%
Unknown to OT (n=2,000) 41% 49% 10%
Total population (n=3,500) 36% 56% 8%
Principal disability type / Oranga Tamariki (OT) population
Autism Spectrum Disorder
(n=400)
Intellectual (n=3,000)
Physical, Neurological, Sensory, Other
(n=500)
In OOH care(n=100) 7% 93% s23
Potential II (n=100) 21% 71% 11% Recent OT (n=500) 22% 70% 8%
Past OT (n=1,100) 21% 68% 11%
Total known to OT (n=1,800) 20% 71% 10%
Unknown to OT (n=3,000) 29% 59% 12%
Total population (n=4,800) 26% 63% 11%

Page 51 Children and young people with impairments
Table 29: Proportion of male children with current or previous allocated DSS funding, aged 0-17 at January 2019 by principal disability type
Principal disability summaries by ethnicity
Table 30: Proportion of Māori children with current or previous allocated DSS funding, aged 0-17 at January 2019 by principal disability type
Principal disability type / Oranga Tamariki (OT) population
Autism Spectrum Disorder (n=5,300)
Intellectual (n=5,500)
Physical, Neurological, Sensory, Other
(n=700)
In OOH care(n=200) 13% 87% s Potential II (n=200) 27% 69% 5%
Recent OT (n=900) 35% 59% 6%
Past OT (n=2,600) 39% 55% 6%
Total known to OT (n=4,000) 36% 58% 6%
Unknown to OT (n=7,400) 51% 43% 6%
Total population (n=11,500) 46% 48% 6%
Principal disability type / Oranga Tamariki (OT) population
Autism Spectrum Disorder (n=1,500)
Intellectual (n=2,600)
Physical, Neurological, Sensory, Other
(n=400)
In OOH care(n=200) 9% 91% s23
Potential II (n=200) 24% 66% 10% Recent OT (n=500) 28% 63% 8%
Past OT (n=1,400) 28% 63% 9%
Total known to OT (n=2,200) 26% 66% 8%
Unknown to OT (n=2,200) 40% 52% 8%
Total population (n=4,500) 33% 59% 8%

Page 52 Children and young people with impairments
Table 31: Proportion of Pacific24 children with current or previous allocated DSS funding, aged 0-17 at January 2019 by principal disability type
Table 32: Proportion of non-Māori and non-Pacific ethnicity (NZ European, Asian and Other) children with current or previous allocated DSS funding, aged 0-17 at January 2019 by principal disability type
24 “Prioritised” ethnicity is used in these summary tables. This means that the ethnicity groups are mutually exclusive and each child is only included in one table. Māori ethnicity has been prioritised over Pacific, meaning that children with both Pacific and Māori ethnicity are shown in the Māori table but not the Pacific table.
Principal disability type / Oranga Tamariki (OT) population
Autism Spectrum Disorder
(n=300)
Intellectual (n=900)
Physical, Neurological, Sensory, Other
(n=100)
In OOH care(n=<100) s 100% s
Potential II (n=<100) s 100% s
Recent OT (n=100) 17% 83% s
Past OT (n=300) 19% 75% 6%
Total known to OT (n=500) 17% 79% 4%
Unknown to OT (n=800) 28% 64% 8%
Total population (n=1,200) 24% 70% 7%
Principal disability type / Oranga Tamariki (OT) population
Autism Spectrum Disorder (n=4,700)
Intellectual (n=5,100)
Physical, Neurological, Sensory, Other
(n=800)
In OOH care(n=200) 15% 79% 4% Potential II (n=200) 27% 73% s Recent OT (n=700) 34% 61% 5%
Past OT (n=2,100) 40% 53% 7%
Total known to OT (n=3,100) 36% 57% 6%
Unknown to OT (n=7,400) 48% 44% 8%
Total population (n=10,500) 45% 48% 7%

Page 53 Children and young people with impairments
Principal disability summaries by urban / regional area
Table 33: Proportion of children with current or previous allocated DSS funding living in rural areas, aged 0-17 at January 2019 by principal disability type
Table 34: Proportion of children with current or previous allocated DSS funding living in urban areas, aged 0-17 at January 2019 by principal disability type
Principal disability type / Oranga Tamariki (OT) population
Autism Spectrum Disorder (n=1,300)
Intellectual (n=1,700)
Physical, Neurological, Sensory, Other
(n=300)
In OOH care(n=100) 8% 92%
Potential II (n=100) 24% 76%
Recent OT (n=300) 32% 60% 7%
Past OT (n=900) 34% 57% 9%
Total known to OT (n=1,200) 44% 47% 9%
Unknown to OT (n=2,100) 32% 60% 7%
Total population (n=1,300) 40% 52% 8%
Principal disability type/ Oranga Tamariki (OT) population
Autism Spectrum Disorder (n=5,200)
Intellectual (n=6,800)
Physical, Neurological, Sensory, Other
(n=900)
In OOH care(n=300) 11% 85% 3% Potential II (n=300) 25% 70% 7%
Recent OT (n=1,100) 30% 64% 6%
Past OT (n=2,900) 33% 59% 7%
Total known to OT (n=4,600) 45% 47% 7%
Unknown to OT (n=8,400) 31% 62% 7%
Total population (n=13,000) 40% 53% 7%
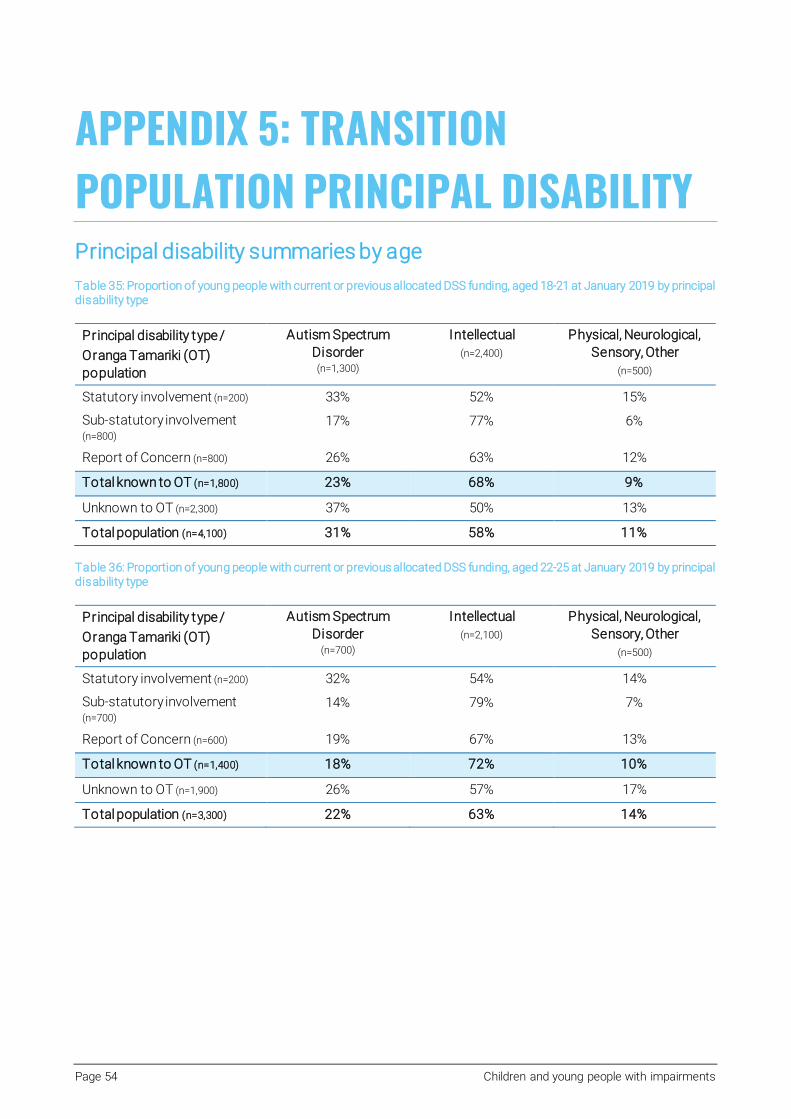
Page 54 Children and young people with impairments
APPENDIX 5: TRANSITION POPULATION PRINCIPAL DISABILITY Principal disability summaries by age
Table 35: Proportion of young people with current or previous allocated DSS funding, aged 18-21 at January 2019 by principal disability type
Table 36: Proportion of young people with current or previous allocated DSS funding, aged 22-25 at January 2019 by principal disability type
Principal disability type / Oranga Tamariki (OT) population
Autism Spectrum Disorder (n=1,300)
Intellectual (n=2,400)
Physical, Neurological, Sensory, Other
(n=500)
Statutory involvement (n=200) 33% 52% 15%
Sub-statutory involvement (n=800)
17% 77% 6%
Report of Concern (n=800) 26% 63% 12%
Total known to OT (n=1,800) 23% 68% 9%
Unknown to OT (n=2,300) 37% 50% 13%
Total population (n=4,100) 31% 58% 11%
Principal disability type / Oranga Tamariki (OT) population
Autism Spectrum Disorder
(n=700)
Intellectual (n=2,100)
Physical, Neurological, Sensory, Other
(n=500)
Statutory involvement (n=200) 32% 54% 14%
Sub-statutory involvement (n=700)
14% 79% 7%
Report of Concern (n=600) 19% 67% 13%
Total known to OT (n=1,400) 18% 72% 10%
Unknown to OT (n=1,900) 26% 57% 17%
Total population (n=3,300) 22% 63% 14%

Page 55 Children and young people with impairments
Principal disability summaries by gender
Table 37: Proportion of female young people with current or previous allocated DSS funding, aged 18-25 at January 2019 by principal disability type
Table 38: Proportion of male young people with current or previous allocated DSS funding, aged 18-25 at January 2019 by principal disability type
Principal disability type / Oranga Tamariki (OT) population
Autism Spectrum Disorder
(n=400)
Intellectual (n=1,800)
Physical, Neurological, Sensory, Other
(n=400)
Statutory involvement (n=100) 29% 53% 24% Sub-statutory involvement (n=500) 9% 86% 6%
Report of Concern (n=500) 12% 73% 15%
Total known to OT (n=1,100) 12% 77% 11%
Unknown to OT (n=1,400) 17% 64% 19%
Total population (n=2,500) 15% 70% 15%
Principal disability type / Oranga Tamariki (OT) population
Autism Spectrum Disorder
(n=500)
Intellectual (n=1,400)
Physical, Neurological, Sensory, Other
(n=200)
Statutory involvement (n=300) 36% 54% 11% Sub-statutory involvement (n=1,000) 20% 73% 7%
Report of Concern (n=900) 29% 60% 11%
Total known to OT (n=2,100) 26% 66% 9%
Unknown to OT (n=2,800) 39% 48% 13%
Total population (n=4,900) 33% 55% 11%

Page 56 Children and young people with impairments
Principal disability summaries by ethnicity
Table 39: Proportion of Māori young people with current or previous allocated DSS funding, aged 18-25 at January 2019 by principal disability type
Table 40: Proportion of Pacific24 young people with current or previous allocated DSS funding, aged 18-25 at January 2019 by principal disability type
Table 41: Proportion of non-Māori and non-Pacific ethnicity (NZ European, Asian and Other) young people with current or previous allocated DSS funding, aged 18-25 at January 2019 by principal disability type
Principal disability/ Oranga Tamariki (OT) population
Autism Spectrum Disorder
(n=300)
Intellectual (n=1,300)
Physical, Neurological, Sensory, Other
(n=200)
Statutory involvement (n=100) 25% 63% 13% Sub-statutory involvement (n=600) 8% 86% 6%
Report of Concern (n=400) 18% 69% 13%
Total known to OT (n=1,100) 13% 77% 9%
Unknown to OT (n=700) 21% 60% 19%
Total population (n=1,800) 16% 70% 13%
Principal disability/ Oranga Tamariki (OT) population
Autism Spectrum Disorder
(n=100)
Intellectual (n=300)
Physical, Neurological, Sensory, Other
(n=100)
Statutory involvement (n=<100) N/A 67% 22% Sub-statutory involvement (n=100) 7% 86% 7%
Report of Concern (n=100) 13% 75% 9%
Total known to OT (n=200) 13% 72% 14%
Unknown to OT (n=300) 16% 67% 16%
Total population (n=500) 9% 78% 10%
Principal disability/ Oranga Tamariki (OT) population
Autism Spectrum Disorder (n=1,700)
Intellectual (n=2,800)
Physical, Neurological, Sensory, Other
(n=600)
Statutory involvement (n=200) 40% 46% 13% Sub-statutory involvement (n=800) 22% 72% 6%
Report of Concern (n=800) 27% 61% 12%
Total known to OT (n=1,900) 26% 64% 10%
Unknown to OT (n=3,200) 36% 51% 14%
Total population (n=5,100) 32% 56% 12%

Page 57 Children and young people with impairments
Principal disability summaries by region
Table 42: Proportion of young people with current or previous allocated DSS funding living in regional/rural areas, aged 18-25 at January 2019 by principal disability type
Table 43: Proportion of young people with current or previous allocated DSS funding living in urban areas, aged 18-25 at January 2019 by principal disability type
Principal disability/ Oranga Tamariki (OT) population
Autism Spectrum Disorder
(n=300)
Intellectual (n=900)
Physical, Neurological, Sensory, Other
(n=100)
Statutory involvement (n=100) 24% 67% N/A Sub-statutory involvement (n=200) 15% 81% 5%
Report of Concern (n=300) 17% 72% 11%
Total known to OT (n=600) 17% 75% 7%
Unknown to OT (n=800) 25% 61% 14%
Total population (n=1,300) 22% 67% 11%
Principal disability/ Oranga Tamariki (OT) population
Autism Spectrum Disorder (n=1,700)
Intellectual (n=3,600)
Physical, Neurological, Sensory, Other
(n=800)
Statutory involvement (n=300) 34% 50% 15% Sub-statutory involvement (n=1,200) 16% 77% 7%
Report of Concern (n=1,100) 25% 63% 13%
Total known to OT (n=2,600) 22% 68% 10%
Unknown to OT (n=3,400) 33% 52% 15%
Total population (n=6,100) 28% 59% 13%

Page 58 Children and young people with impairments
APPENDIX 6: NUMBER OF CHILDREN EVER ALLOCATED DSS FUNDING Table 44: Number of children aged 0-4 by lifetime DSS client status
Table 45: Number of children aged 5-14 by lifetime DSS client status
Table 46: Number of children aged 15-17 by lifetime DSS client status
Oranga Tamariki (OT) population/DSS status
Currently or previously allocated DSS funding
Not currently or previously allocated
DSS funding
Proportion of children currently or previously allocated DSS funding
In OOH care 18 1,203 1.5%
Potential II 24 1,794 1.3%
Recent OT 117 12,492 0.9%
Past OT 126 10,869 1.1%
Total known to OT 285 26,358 1.1%
Unknown to OT 1,077 268,959 0.4%
Total children 1,362 295,317 0.5%
Oranga Tamariki (OT) population/DSS status
Currently or previously allocated DSS funding
Not currently or previously allocated
DSS funding
Proportion of children currently or previously allocated DSS funding
In OOH care 234 2,598 8%
Potential II 192 3,912 5%
Recent OT 993 30,168 3%
Past OT 2,631 92,070 3%
Total known to OT 4,050 128,748 3%
Unknown to OT 7,380 502,035 1%
Total children 11,430 630,783 2%
Oranga Tamariki (OT) population/DSS status
Currently or previously allocated DSS funding
Not currently or previously allocated
DSS funding
Proportion of children currently or previously allocated DSS funding
In OOH care 87 462 16%
Potential II 117 1,236 9%
Recent OT 270 6,780 4%
Past OT 1,020 33,189 3%
Total known to OT 1,494 41,667 3%
Unknown to OT 2,013 140,766 1%
Total children 3,507 182,433 2%

Page 59 Children and young people with impairments
APPENDIX 7: WELLBEING AND SERVICE CONTACT – DETAILED RATES Table 47: Proportion of children aged 0-4 with selected wellbeing indicators
Currently or previously allocated DSS funding
Not currently or previously allocated DSS funding
Proportion of children with indicator
OOH care or potential II
Known to OT
No OT involvement
OOH care or potential II
Known to OT
No OT involvement
(n=40) (n=285) (n=1 ,100) (n=3,000) (n=26,400) (n=269,000)
Placement over lifetime to date 43% 11% n/a 54% 8% n/a
FGC/FWAs (Family Whānau Agreement) over lifetime to date
100% 31% n/a 97% 21% n/a
Potentially avoidable hospitalisation over the prior year
n/a – suppressed 15% 15% 10% 8% 5%
Two or more potentially avoidable hospitalisations over lifetime to date
21% 26% 21% 10% 10% 4%
Parental income in the lowest quintile (for parents of all NZ children)
50% 53% 22% 80% 68% 21%
Parents supported by third-tier supplementary MSD payments in the prior year
43% 66% 20% 90% 75% 16%
Proportion supported by parental benefit for more than 50% of their childhood
64% 56% 17% 58% 62% 12%

Page 60 Children and young people with impairments
Table 48: Proportion of children aged 5-14 with selected wellbeing indicators
Currently or previously allocated DSS funding
Not currently or previously allocated DSS funding
Proportion of children with indicator
OOH care or potential II
Known to OT
No OT involvement
OOH care or potential II
Known to OT
No OT involvement
(n=425) (n=4 ,050) (n=7 ,400) (n=3,000) (n=128,700) (n=502,000)
Placement over lifetime to date
70% 16% n/a 58% 7% n/a
FGC/FWAs over lifetime to date
99% 36% n/a 99% 23% n/a
Potentially avoidable hospitalisation over the prior year
8% 8% 8% 3% 3% 2%
Two or more potentially avoidable hospitalisations over lifetime to date
37% 35% 27% 18% 15% 7%
B4 School Check "referral" outcome from vision and/or hearing checks at ages 4-5
26% 27% 23% 20% 16% 11%
Mental health hospital and community provider service contact / treatment over lifetime to date
52% 43% 28% 30% 14% 4%
Parental income in the lowest income quintile
56% 44% 17% 69% 47% 15%
Parents supported by third-tier supplementary MSD payments in the prior year
74% 60% 16% 86% 57% 11%
Proportion supported by parental benefit for more than 50% of their childhood
50% 49% 14% 65% 51% 9%
Standdowns over lifetime to date (ages 10-15)
36% 21% 7% 33% 13% 2%
Low level seriousness offences over the last year (ages 10-15)
20% 5% 1% 25% 5% 1%
High level seriousness offences over the last year (ages 10-15)
10% 3% <1% 18% 3% <1%

Page 61 Children and young people with impairments
Table 49: Proportion of young people aged 18-25 with selected wellbeing indicators
Currently or previously allocated DSS funding
Not currently or previously allocated DSS funding
Proportion of young people with indicator
OOH care or potential II
Known to OT
No OT involvement
OOH care or potential II
Known to OT
No OT involvement
(n=1 ,500) (n=3 ,200) (n=4 ,200) (n=28,100) (n=100,000) (n=366,400)
Potentially avoidable hospi-talisations over ages 18-25
17% 17% 17% 8% 7% 4%
Mental health hospital and community provider service contact / treatment over ages 18-25
57% 51% 29% 39% 28% 10%
NCEA level 2 or higher (or equivalent) qualification - includes both school-leaving and tertiary qualifications
24% 28% 40% 57% 68% 89%
Police recorded victimisation over the last 3 years
10% 8% 2% 10% 7% 3%
Low level seriousness offences over the last 3 years
13% 8% 2% 18% 11% 3%

Page 62 Children and young people with impairments
Table 50: Relative risk of children with current or previous allocated DSS funding, unknown to Oranga Tamariki experiencing different levels of wellbeing and service contact compared to other children without DSS funding unknown to Oranga Tamariki
Ages 0-17 Ages 0-4 Ages 5-14 Ages 15-17
Placement over lifetime to date N/A N/A N/A N/A
FGC/FWAs over lifetime to date N/A N/A N/A N/A
Potentially avoidable hospitalisation over the prior year 3.3 2.9 4.6 8.4
2 or more potentially avoidable hospitalisations over lifetime to date 4.7 5.8 3.9 4.7
B4 School Check "referral" outcomes from vision and/or hearing checks at ages 4-5
2.1 2.1 N/A N/A
Parental income in the lowest income quintile 1.1 1.0 1.2 1.3
Parents supported by third-tier supplementary MSD payments in the prior year
1.3 1.2 1.5 1.6
Proportion supported by parental benefit for more than 50% of their childhood 1.5 1.4 1.6 1.9
Standdowns over lifetime to date (ages 10-15) 3.2 N/A 3.2 N/A
Low level seriousness offences over the last year (ages 10-15) 1.2 N/A 1.2 1.1
Mental health service contact / treatment over lifetime to date (ages 5-17) 5.5 N/A 6.3 4.3