child survival and health india, 2009 - 'shyam'...
TRANSCRIPT

Child Survival and Health
India, 2009
Selected Papers ofBhopal Seminar 2009
Editor
Aalok Ranjan
‘SHYAM’ Institute

‘SHYAM’ Institute
82, Aradhana NagarBhopal, MP-462003, India
91-755-4222756
Registered Office
Mudian ka Kuan,
Datia, MP-475661, India91-752-2234422
www.shyaminstitute.in
Child Survival and Health India 2009
© 2009 ‘SHYAM’ InstituteAll rights reserved. No part of the publication can be reproduced or
transmitted in any form or by any means including photocopying, recordingor any information storage and retrieval system without permission in
writing from ‘SHYAM’ Institute.
ISBN 10: 81-902592-6-1
ISBN 13: 978-81-902592-6-2
Contents
Introduction
Aalok Ranjan
1
Determinants of Infant Mortality in India. A District Level
Analysis
SC GulatiRaghubansh Mani Singh
9
Child Survival and Health: Policies and Programmes
SS KushwahPankaj Prasad
23
Trends in Infant Mortality in Madhya Pradesh: Evidence
from DLHS-2
Rajiv Ranjan
39
Progress towards Child Survival in Madhya Pradesh: 1981-
2001
Aalok Ranjan
55
Progress of Child Survival Efforts in Districts of Madhya
Pradesh
Aalok RanjanArunand Murmu
81
Child Survival and Health among Urban Poor in Madhya
Pradesh
Siddarth AgarwalAradhana Srivastav
97
Infant Mortality, Fertility and Family Size: A District Level
Analysis
SRJ Singh
107
Determinants of Birth Weight and Early Neonatal Mortality
NK Tyagi
113
Correlates of Nutritional Status of Children in Madhya
Pradesh
PK VermaRajesh Tailor
135

Prevailing Breast Feeding Practices and Impact of
Educational Interventions on Benefits of Exclusive Breast
Feeding
Sanjay DixitUmesh SinhaGunjan Taneja
145
Household Environmental and Individual Risk Factors of
Acute Respiratory Infections in Madhya Pradesh and West
Bengal
Angan SenguptaH Lhungdim
155
Perception of Child Health, Immunisation and Breast
Feeding Practices among Lodha Tribes of West Bengal
Kalyan B SahaUma SahaHC Shrivastava
169
Success of Health and Nutrition Programme for Child
Survival in Andhra Pradesh
M UbaidullahS Krishna ReddyA Kusuma
181
Infant Mortality in the Gond Tribe of Raisen District,
Madhya Pradesh
Ajay Gharami
195
Health Emergencies among Neonates in Andhra Pradesh
Birachi M JenaAnuradha Dubey
203
Clinical Study of Trauma in Children
GP SrivastavaRS VermaVinod YedalwarManish Kumar
215
Nutritional Status of Women in Madhya Pradesh
Nalin S NegiAdil Hussain Khan
223
Nutritional Status in Madhya Pradesh: Evidence from
NFHS-2 and NFHS-3
AK TiwariRavindra KSS Sharma
237

Contributors
Siddarth Agarwal Executive Director,
Urban Health Resource Centre,New Delhi
Sanjay Dixit Professor,
MGM Medical College,Indore
Aradhana Dubey Assistant Partner,
Emergency Management ResearchCentre, Secundarabad
Ajay Gharami Research Associate,
Taleem Research Foundation,Ahmedabad
SC Gulati Professor,
Institute of Economic Growth,Delhi
Birachi N Jena Senior Partner,
Emergency Management ResearchCentre,
Secundarabad
Adil Hussain Khan Team Leader,GC-13 Health Matrix
King George Medical UniversityLucknow
S Krishna Reddy Academic Consultant,
SV University,Tirupati

Manish Kumar Resident Officer,SS Medical College,
Rewa
SS Kushwah Professor,SS Medical College,
Rewa
A Kusuma Academic Consultant,SV University,
Tirupati
M Lhungdim Reader,International Institute for Population
Sciences,Mumbai
Arunand Murmu Consultant,
United Nations Children’s Fund,Bhopal
Nalin S Negi PhD Scholar,
Indian Institute of Technology,Roorkee
Pankaj Prasad Resident Officer,
SS Medical College,Rewa
Aalok Ranjan Professor,
‘Shyam’ Institute,Bhopal
Rajiv Ranjan Advisor,
The Futures Group International,Dehradun
Ravindra K Faculty,
Indian Business School,Dehradun
Kalyan B Saha Scientist D,
Regional Medical Research Centrefor Tribals,
Jabalpur
Uma Saha Assistant Professor,Xavier Institute of Development
Action and Studies,Jabalpur
Angan Sengupta Research Scholar,
Institute of Social and EconomicChange,
Bangalore
SS Sharma Statistical Investigator,Directorate of Census Operations,
Lucknow
HC Shrivastava Professor,International Institute for Population
Sciences,Mumbai
Raghubansh Mani Singh Senior Research Analyst,
Institute of Economic Growth,Delhi
SRJ Singh Associate Professor,College of Agriculture,Sehore
Umesh Sinha Resident Officer,
MGM Medical College,Indore
Aradhana Srivastav Urban Health Resource Centre,
New Delhi
GP Srivastava Professor,SS medical College,
Rewa
Gunjan Taneja Resident Officer,MGM Medical College,
Indore
Rajesh Tailor Associate Professor,Vikram University,
Ujjain

Abhay K Tiwari Faculty,Indian Business School,
Dehradun
NK Tyagi Professor,Mahatma Gandhi Institute of
Medical Sciences,Sevagarm, Wardha
M Ubaidullah Professor,
SV University,Tirupati
PK Verma Research Associate,
‘Shyam’ Institute,Bhopal
RS Verma Associate Professor,
SS medical College,Rewa
Vinod Yedalwar Assistant Professor,
SS medical College,Rewa

Child Survival and Health
India 2009


Introduction
Aalok Ranjan
This monograph presents selected papers of the Bhopal Seminar 2009:
Contemporary Issues in Child Survival and Health organised by the
‘Shyam’ Institute. The institution of Bhopal Seminar was established in
the year 2000 to promote evidence-based discussion and debate on
contemporary issues in population and health in India and its constitu-
ent states. The Bhopal Seminar 2009 was the eighth in the series. Since
2007, selected papers of the Bhopal Seminar are published as a
monograph for wider discussions. Over the years, the Bhopal Seminar
has become an important platform for presenting and discussing
research on issues related to population and health.
More than 60 research papers were presented at the Bhopal Seminar
2009. The focus of the Seminar was on child survival and health. Issues
discussed during the Bhopal Seminar 2009 included progress towards
child survival, child survival policies and programmes, social class
differentials, determinants of child survival, child health and nutrition,
child survival efforts, and women’s health. In addition, there was a
symposium on child survival and health in urban areas and two open
sessions.
The monograph comprises of 18 papers presented at the Bhopal
Seminar 2009. They were selected through an open competitive process.
The participants of the Seminar were informed that at least two papers
would be selected for publication in the monograph from every
technical session by the session chair. The papers so selected were
subsequently reviewed and revised on the basis of the comments raised
at the time of presentation of the paper and by the reviewer. These
1

Child Survival and Health
papers present a broad perspective of child survival and health issues
in India.
The first paper of the monograph, by Gulati and Singh, analyses the
determinants of infant mortality in India on the basis of district level
data available from various sources including district level estimates of
the probability of death in the first year of life generated from the
information available through the 2001 population census. The analysis
highlights strong linkages between infant mortality rate and utilisation
of antenatal and obstetric care services, marriage patterns, women’s
empowerment enabling factors, health infrastructure and facilities, and
economic development, suggests that strict enforcement of minimum
age at marriage can bring about maximum impact towards reduction
in infant mortality. The paper also observes that poverty alleviation or
pro-poor women centred programme interventions directed towards
improving antenatal and obstetric may also bring about faster decline
in infant mortality.
The second paper, by Kushwah and Prasad, presents a concise of
child survival and health policies and programmes in India. The paper
argues that there is still a great deal that needs to be done, especially at
the policy level to accelerate improvements in child survival. There is
a need to put in place a protective environment for ensuring the
survival, growth and development of the child. This protective
environment should be addressed at the level of policy and legislation,
in terms of improving the efficiency and effectiveness of programme
interventions and at the level of advocacy and awareness generation.
Trends in infant mortality in Madhya Pradesh is the theme of the
third paper of the monograph. Using the information available through
the district level household survey 2007-08, Rajiv Ranjan, concludes that
infant mortality has decreased in Madhya Pradesh but it still remains
highest in the country. The paper also observes that rural-urban, social
class and inter-district differentials in infant mortality are quite
substantial in the state and they have persisted over time. It is argued
that a district-based approach and an effective behaviour change
communication strategy should be evolved for an accelerated reduction
in infant mortality in the state. The paper also stresses the need of
collaboration and synergistic cooperation between professional and non
government organizations, development partners, centres of excellence,
etc. to have maximum possible positive impact on child health.
The next paper, by Aalok Ranjan, analyses the progress towards
child survival in Madhya Pradesh on the basis of district level estimates
2

Introduction
of infant and child mortality generated from the information available
through 1981, 1991 and 2001 population census. The analysis suggests
that the progress towards child survival in Madhya Pradesh has not
been satisfactory in the context of either Millennium Development
Goals or objectives of the XI Five-year Development Plan of the state.
There has been improvement in the survival probability in the first year
of life but improvement in survival probability has faltered during the
1-4 years of life so that improvement in the child survival probability in
the age group 0-5 years has almost stagnated. The decrease in the
survival probability in children aged 1-4 years suggests an increase in
the prevalence of under nutrition in children. The paper stresses the
need to revisit current policies and programmes and argues that child
survival policies and programmes need to be designed in the broader
development context and quality of life and not in the narrow
perspective of health imperative that is the case at present.
The next paper of the monograph, by Aalok Ranjan and Arunand
Murmu, analyses the progress of child survival efforts in the districts of
Madhya Pradesh on the basis of the data available through district level
household survey. Using the factor analysis technique, authors found
that child survival efforts in the state can be grouped into four dimen-
sions and progress in terms of the four dimensions vary widely across
the districts of the state. In some dimensions, the progress has been
found to be better than other dimensions. The paper concludes that the
progress of child survival efforts in most of the districts of the state is
essentially lop-sided and this lop-sidedness appears to be an important
reason behind slower than expected transition in infant and child
mortality in the state.
Concern about the survival and health of the children of urban poor
is the focus of the sixth paper of the monograph. On the basis of a re-
analysis of the data available through the National Family Health
Survey 2005-06, Agarwal and Srivastav highlight the dichotomy that
exists between poor and the non-poor in the urban areas of Madhya
Pradesh. The paper argues that improving the health of the urban poor
is necessary to achieve the goals set out in national development
policies and Millennium Development Goals and stresses that efforts in
this direction should focus on a city specific approach, involving
communities and scaling up effective interventions for maximum
coverage.
An analysis of the impact of infant mortality on fertility is the theme
of the seventh paper of the monograph. This paper, by SRJ Singh, is
3

Child Survival and Health
based on a survey carried out in the rural areas of district Rewa in
Madhya Pradesh. The paper observes that, like other studies, there is a
direct relationship between infant mortality and fertility. The paper
argues that the influence of infant and child mortality on fertility is not
an instantaneous adjustment process. In the long run of demographic
transition, fertility decline normally lags the decline in mortality
including infant mortality. However, the time span of fertility decline
and the time span of mortality decline varies considerably from one
context to another. If, in a given set of circumstances, it is possible that
reduction in infant mortality induces a fall in fertility, then an under-
standing of the factors affecting the lag become highly pertinent, since
it may be possible to reduce the time lag through appropriate policy
measures.
The eighth paper of the monograph is directed towards analysing
the determinants of birth weight and neonatal mortality on the basis of
hospital data. The analysis suggests that the distribution of weight at
birth is essentially a Guassian, with additional births at lower end, that
divides the distribution in two components; I) a predominant distribu-
tion (Guassian) and ii) a residual distribution. It appears that predomi-
nant distribution is largely of term births, while the residual distribution
is composed of almost entirely of pre-term births. Further, it was
observed that the male babies suffer higher risk of perinatal death than
female babies, despite the fact that the prevalence of low birth weight
is lower in male than in female births. The analysis also reveals that the
relationship between neonatal mortality and a host of maternal
variables is linear, although the deviation from linearity is also
significant. The author argues that such a contradiction is possible
because of the large sample size.
Nutritional status plays a very important role in deciding the
survival and health status of children and ensuring their normal
growth. Using the data available from the latest round of the National
Family Health Survey, Verma and Tailor have analysed the correlates
of nutritional status of children in Madhya Pradesh. The analysis
reveals that nutritional status of children is influenced strongly by social
and cultural factors in addition to economic factors. The paper argues
that tackling the problem of rampant under nutrition in Madhya
Pradesh requires a broad, development oriented approach and not just
clinical interventions.
Breastfeeding plays a very important role in child survival and
health. Exclusive breast feeding for the first six months of life is
4

Introduction
recommended as essential for the survival, health and normal growth
of the new born. Dixit and others, in their paper, have analysed
prevailing perceptions about breast feeding in an urban community.
The paper based on infants attending the immunisation clinic in a city
in Madhya Pradesh has also explored the impact of educational
interventions to mothers related to the benefits of exclusive breast
feeding. The paper concludes that there is a need to formulate
innovative community based programs and novel health promotion
strategies to universalise breastfeeding for the benefit of infants and
young children.
The eleventh paper of the monograph is a comparative analysis of
household and environmental risk factors in acute respiratory infec-
tions, one of the major cause of childhood mortality, in Madhya Pradesh
and West Bengal. On the basis of the information available through the
third round of the National Family Health Survey, Sengupta and
Lhungdim conclude that analysis of the prevalence of acute respiratory
infections (ARI) from an epidemiological perspective should be a
priority in research. There is a need to identify social, cultural and
environmental factors and their relationship with acute respiratory
infections. The paper also emphasises a behavioural shift in terms of
promoting the use of stoves and chimneys and making people aware
about the importance of improving the quality of housing including
ventilation, separate kitchen, electricity, etc. Awareness about health
impacts of sanitation and healthy personal lifestyles needs to be
disseminated among people as a long-run mechanism to reduce the
prevalence of ARI among children and also among adults. The analysis
has, however, not been able to explain why despite poorer household
environmental and socio-economic conditions in Madhya Pradesh than
in West Bengal, the later continues to have a much higher prevalence of
ARI. Children in Madhya Pradesh appear to be relatively safe from the
risk of respiratory infections than children in West Bengal.
The next three papers of the monograph are related to child health
issues in Scheduled Tribes. The first of these three factors, by Saha and
others, analyses the perception of Lodha tribes of West Bengal about
child health, immunisation and breast feeding on the basis of a survey
carried out in 1997. The paper concludes that because of the prevailing
perceptions about child related diseases, majority of Lodha tribes do not
understand the importance of the utilisation of the available child health
facilities and thus make children vulnerable to childhood morbidity and
even death. This perception needs to be changed.
5

Child Survival and Health
The next paper, by Ubaidullah and others, describes the successful
provision of integrated comprehensive health services - general health,
reproductive and child health, prevention of sexually transmitted
infections (STI) including HIV/AIDS, and family planning - to
Lambadas, a tribal community living in the rural areas of Khammam
District in Andhra Pradesh in India. The authors conclude that it is
possible to bring down maternal, infant and child mortality and
morbidity to very low levels with programme interventions initiated for
the tribal population. Authors also suggest that similar approach may
also be replicated in Madhya Pradesh where a large population is tribal
and their health status is very poor.
The next paper of the monograph analyses correlates of infant
mortality in Gond tribes in Raisen district of Madhya Pradesh on the
basis of a survey carried out in 13 villages. The paper, by Gharami,
observes that a very high proportion of infant deaths in the Gond
families reflects their poor living conditions. It is suggested that
educating Gonad women can lead to a substantial reduction in the
proportion of infant deaths and improve child bearing as well as health
of the entire family.
Preventing deaths during the neonatal period is an important
strategy towards promoting child survival and health. Jena and Dubey,
in their paper, have discussed the important issue of health emergencies
among neonates in Andhra Pradesh. They have also developed a
methodology to estimate the prevalence of neonatal complications
which require emergency care including transport. The analysis
suggests two critical areas to reduce neonatal mortality. First, birth
asphyxia can be avoided if such cases are reported as pregnancy related
complications. Second, there is a need of early identification of neonatal
complications and good pre-hospital care. Facilitating quick and
effective transport system is critical in this regard.
Trauma in children is the focus of attention of the next paper of the
monograph by Shrivastava and others. Paediatric trauma is one of the
major threats to the health and well being of children. Based on the
paediatric trauma cases admitted in a teaching hospital in Madhya
Pradesh, the paper observes that even though the incidence of paediat-
ric trauma has remained stable, there has been an increase in the
number of cases of road traffic accidents and injuries due to mechanical
and electrical gadgets. The paper argues that management of paediatric
trauma is a specialised job and therefore requires tertiary centres for
proper treatment of paediatric trauma victims.
6
Introduction
The next two papers of the monograph are related to the nutritional
status of women which plays a critical role in child survival, health and
development. The paper by Negi and Khan analyses the nutritional
status of women in terms of anaemia and body mass index (BMI).
Nutritional status of woman is critical in survival, health and develop-
ment of the child. Using the information available through the National
Family Health Survey, the paper concludes that health and nutritional
status of women in Madhya Pradesh is largely shaped by socio-
economic and demographic factors, either at the individual or at the
household level and the number and type of variables and their
influence on health of the mother vary significantly across different
cultural and regional groups. The challenge before policy makers is to
develop institutions that can offer cost effective solutions to problems
of access and availability of health and nutrition facilities.
The paper by Tiwari and others, on the other hand, concentrates on
the nutritional status of women which is a major determinant of child
survival. Using the information available through the second and the
third round of the National Family Health Survey, authors conclude
that the problem of under nutrition in women of Madhya Pradesh is
quite substantial and this problem appears to have aggravated over
time. The problem is particularly serious in the rural areas and in
Scheduled Castes and Scheduled Tribes whereas in the urban areas of
the state, problem of obesity among women appears to be gaining
dangerous proportions. The authors have also observed a change in the
dietary pattern of the women surveyed.
Papers included in the monograph present an overview of
contemporary child survival and health scenario in India and pertinent
issues that need to be addressed at the policy and programme interven-
tion levels in the context of Millennium Development Goals and IX
Five-year Development Plan objectives. Using the latest data available
and innovative approaches of data analysis, these papers provide useful
insight into the very complex dynamics of child survival and health in
India, especially in those states where the process of demographic and
health transition remains slower than expected. This insight may be
useful for discussing and debating child survival and health related
issues facing India and in revisiting the current child survival and
health policies and programmes through the development perspective
in the context of the empirical evidence that is now available which may
contribute towards an acceleration in the transition in infant and child
mortality.
7

Child Survival and Health
8

Determinants of Infant Mortality in IndiaA District Level Analysis
SC GulatiRaghubansh M Singh
IntroductionIndia is transcending through interrelated demographic and epidemio-
logical transition and has recorded marked improvements in most of
the fertility, mortality and morbidity indicators since independence.
Cross country comparison of infant mortality rate (IMR) reveals that
one fourth of the global infant deaths are from India. As per the recent
estimates from the sample registration system, the infant mortality rate
in India was still around 55 infant deaths per 1000 live births in the year
2008 and the improvement has been slow in the recent past despite
massive spending of the Government of India on the National Rural
Health Mission launched in April 2005 (Government of India 2007,
UNICEF 2008). This stagnation in the decrease in the infant mortality
rate is haunting Indian development planners, public health policy
makers and program implementers. Infant mortality is viewed as a
proxy for overall socioeconomic development. Decrease in the infant
mortality rate also facilitates fertility reduction through voluntary
acceptance of family planning. Moreover, the successes of public health
initiatives gets reflected in the improvement in maternal, infant and
child health indicators. It appears that improvements in the infant
mortality rate in the past has predominantly been the result of the
decline in the post-neonatal deaths so that the proportionate contribu-
tion of neonatal deaths to infant deaths has now become predominant.
It is well known that preventing neonatal deaths is inherently more
difficult than preventing postnatal deaths as causative factors behind
neonatal deaths are generally endogenous factors like female marital
patterns and lower utilisation of antenatal and obstetric care services
9

Child Survival and Health
(Visaria 2004). In any case, stagnation in infant mortality decline in the
recent past is casting aspersions on the reproductive and public health
programs in India. The slowdown in the infant mortality decline has
been attributed to a decrease in the coverage of immunisation and other
basic health interventions (Claeson et al 1999, Measham et al 1999). The
national population policy 2000 called to bring down infant mortality
rate from almost 68 in 2000 to below 30 by 2010. Similarly, the X Five-
year Development Plan of India aimed at reducing infant mortality rate
to less than 45 by the year 2007 whereas the National Rural Health
Mission (NRHM) reiterated to bring down the infant mortality rate to
30 by 2012. The Mission recognises the importance of health in the
process of economic and social development and improvements in the
quality of life and emphasises to strengthen public health initiatives
through strengthening the reproductive and child health program
interventions, especially among the under-served and vulnerable
groups of the society. It is however clear that the progress made so far
in terms of reduction in infant mortality rate falls too short of the
perceived goals.
This study purports to highlight crucial determinants of infant
mortality in India. First, the study attempts to elicit strength and nature
of inter-linkages between infant mortality, utilisation of antenatal and
obstetric care services, marital patterns, factors that contribute to the
empowerment of women like women’s education and employment, and
socioeconomic development factors on the basis of district level
analysis. Second, the study attempts to highlight significant factors
impacting infant mortality and elicit relative significance of the selected
variables to evolve alternative strategic policy interventions towards
accelerating infant mortality decline in India.
MethodologyThe methodology of the study follows factorial investigations to
establish the inter-linkages between infant mortality and use of obstetric
and antenatal care services, marital patterns and other selected
socioeconomic variables to describe the nature of linkages and to
provide semi quantitative insights into the strength of the relationship.
Factorial investigations also facilitate selection of right kind of predictor
variables to obviate the econometric complications like multicollinearity
and right specification of the model in the multivariate analysis. The
relative significance of predictor variables has been elicited through
10
Determinants of Infant Mortality
multiple regression equation models to provide alternative strategic
framework towards accelerating reduction in infant mortality.
Data SourceThe analysis presented in this paper is based on a number of data
sources. District level estimates of infant mortality rate have been taken
from Rajan and others (2008). The historical perspective of infant
mortality rate in India and its constituent states has been derived
through the Sample Registration System. District level data on utilisa-
tion of obstetric care services, institutional and safe deliveries, propor-
tion of girls married before 18 years of age, proportion of third and
higher order births, etc. are drawn from the second round of the District
Level Household Survey conducted in 2002-04 (IIPS 1999). Data on
district level health infrastructure and human resources like auxiliary
nurse cum midwives and hospital and dispensary beds, etc. is drawn
from the database maintained by the Centre for the Monitoring
Economy and refers to the year 2000 (CMIE 2000). Data on women’s
education and labour force participation are drawn from the 2001
population census. Finally, data on district level overall economic
development index are drawn from author’s earlier study (Gulati 1998).
Trends in Infant MortalityInfant mortality rate in India decreased quite markedly from 114 during
1950s to 55 in 2007 (Figure 1). Nevertheless, the decrease in the infant
mortality rate decelerated during the 1990s as compared to 1980s.
Further, infant mortality rate decreased from 68 in 2000 to 58 in 2004
and to just 55 in 2007 which indicates that the infant mortality rate in
India almost stagnated at around 58 during the last four to five years.
Primary reason for this stagnation appears to be the neonatal mortality
rate which showed little decline during the recent past. Neonatal
mortality is expected to be difficult to reduce as key factors in neonatal
deaths are obstetric care and nutritional standards of the mother
(Visaria 2004).
It is obvious to presume that infant mortality rate varies widely
across the states and districts in India. The reason is that India is a very
large country. It has very diverse social, economic and cultural settings.
There is also wide variations in the accessibility and affordability of
health and family welfare services with the result that benefits of the
health system - public or private - have been very uneven between
better-endowed and the more vulnerable sections of society and their
11

Child Survival and Health
poor and deprived counterparts. It has been empirically substantiated
that infant deaths are caused by diseases, lack of utilisation of antenatal
and obstetric care services, child care, and malnutrition of pregnant
women (Bhatt 2004) All these medical factors are influenced by socio-
economic status of the person and their attitude towards health-care
practices. This is particularly true for women and children who are the
most vulnerable group of population and socially disadvantaged
sections of the society.
Inter state variations in the infant mortality rate, as obtained
through the Sample Registration System, are presented in table 1. These
estimates suggest that infant mortality rate varies not only across the
states and Union Territories of the country but also between rural and
urban areas within the state.
On the other hand, district level estimates of infant mortality rate
obtained on the basis of children ever born and children surviving data
collected at the 2001 population census suggest that the infant mortality
Figure 1
Trends in infant mortality rate in India
12

Determinants of Infant Mortality
rate varied from a high of 121 infant deaths per 1000 live births to a low
of only 13 infant deaths per 1000 live births.
Structural Linkages between Infant Mortality and
Selected VariablesSemi-quantitative insights into inter-linkages between infant mortality
rate and selected socioeconomic and reproductive health variables is
elicited through factorial investigations. The list of variables used in the
analysis and their descriptive statistics is given in appendix tables 1 and
2. Three factors could be retained for the analysis as per Kaiser’s
criterion of eigen values greater than 1 (Harman 1960). The Varimax
rotated factor structure is presented in table 2. The extent of
communality varies between 0.34 for religious composition (PMUS) to
0.88 for full antenatal care.
It may be seen from table 2 that utilisation of antenatal and obstetric
care services is negatively associated with the infant mortality rate. In
districts where utilisation of antenatal care and institutional deliveries
are high, the infant mortality rate is low. Similarly, higher is the
proportion of safe deliveries, the lower is the infant mortality rate. On
the other hand, the higher is the proportion of girls married before 18
years of age, the lower is the infant mortality rate and higher is the
fertility higher is the infant mortality rate. Factors that contribute to
women’s empowerment like literacy and labour force participation also
depict a negative impact on infant mortality; similar is the impact of
extent of urbanization and overall economic development. Poverty and
health infrastructure variables have been found to have a negative
association with infant mortality rate. Thus, we find that most of the
linkages between infant mortality and selected demographic and
socioeconomic variables used in the present analysis have been found
to be consistent with general expectations on the basis of the district
level information.
Parametric Estimates of Multiple Regression
Equation for Infant MortalityParametric estimates of the multiple regression equation with infant
mortality rate as dependent variable and selected variables related to
social and economic development and utilisation of obstetric care
services as predictor variables are presented in table 3. Selection of the
13

Child Survival and Health
predictor variables used in the regression was primarily facilitated by
scanning the correlation and factor structure matrix.
Perusal of table 3 suggests that age at marriage depicts significant
negative impact on the probability of survival in the first year of life.
Alternatively, districts with higher proportion of women marrying
below legal age at marriage of 18 years depict significantly higher levels
of infant mortality, while accounting for other socio-economic and
obstetric care utilisation variables.
Among obstetric care utilisation variables, we find that extent of full
antenatal care comprising of three antenatal checkups and
administration of requisite IFA tablets and tetanus injections, depict
significant negative impact on infant mortality. Similarly, we find that
districts with higher proportion of deliveries in health institutions,
private or public, also depict significantly lower levels of infant
mortality rate. Thus, both antenatal care and institutional deliveries
depict significant and negative impact on infant mortality. It has often
been viewed that obstetric care not only impacts maternal mortality but
also depicts significant impact on neo-natal component of infant
mortality and thus infant mortality.
Women’s empowerment enabling factors like female literacy and
education, and gainful employment are also found to depict significant
negative impact on infant mortality. Districts with more educated and
gainfully employed working as main-workers depict significantly lower
levels of infant mortality. Obviously, empowered women can exercise
their rights for seeking health care and better nourishment in the
households and thus depict higher chances of survival. We find that
districts with relatively higher proportion of population below poverty
line depict significantly higher levels of infant mortality. Thus, overall,
economic development would facilitate reduction in infant mortality.
Summary and Policy ImperativesThe factorial investigation exercise presented in this study highlights
strong linkages between infant mortality rate and utilisation of
antenatal and obstetric care services, marriage patterns, women’s
empowerment’s enabling factors, health infrastructure and facilities,
and economic development.
The study suggests that strict enforcement of minimum age at
marriage act can bring about maximum impact towards reduction in
infant mortality. Possibly, higher marriage age among girls would also
facilitate improvements in their educational standards, better
14

Determinants of Infant Mortality
employment opportunities, reduction in adolescent fertility. Motivating
and sensitising women, especially mothers, about the importance of
antenatal care towards the health of the mother and the child can also
bring around lot of impact on maternal and infant mortality. Women’s
education and gainful employment have been elicited to bring relatively
much higher impact towards reduction in infant mortality. Overall
poverty alleviation or pro-poor women centred program interventions
to enhance antenatal and obstetric care can bring around faster declines
in infant mortality.
ReferencesBhatt Manju (2004) Social Demography in India: A Study of Infant
Mortality. Delhi, Academic Excellence.
Centre for the Monitoring of Indian Economy (2000) District Level Data
for Key Indicators, 2000. Mumbai, Centre for the Monitoring of
Indian Economy.
Claeson M, Bos E, Pathmanathan I (1999) Reducing child mortality in
India. Keep up the pace. Washington DC, World Bank, Health,
Nutrition and Population Discussion Paper.
Measham AR, Chatterjee M, Rao KD, Jamison TD, Wang J (1999)
Reducing infant mortality and fertility, 1975-1990: Performance at
all-India and state levels. Economic and Political Weekly 34(2):1359-67.
Government of India (2000) National Population Policy 2000. New Delhi,
Ministry of Health and Family Welfare.
Government of India (2001) Census of India 2001. Final Population Totals.
New Delhi, Registrar General and Census Commissioner of India.
Government of India (2002) National Health Policy 2002. New Delhi,
Ministry of Health and Family Welfare.
Government of India (2005) National Rural Health Mission. New Delhi,
Ministry of Health and Family Welfare.
Government of India (2006) Status of Population Stabilization. New Delhi,
Ministry of Health and Family Welfare. Working Group on
Population Stabilization.
Government of India (2007) Provisional Estimates of Birth Rate, Death
Rate, Natural Growth and Infant Mortality Rate. New Delhi, Registrar
General and Census Commissioner.
Gulati SC (et al.) (1999) World Bank Project Report in Population and Health
in India: A Study of Demographic Impact at the District Level. New
Delhi, Population Foundation of India.
15

Child Survival and Health
Harman HH (1960) Modern Factory Analysis. Chicago and London,
University of Chicago Press.
International Institute for Population Sciences ( 2004) Reproductive and
Child Health: District Level Household Survey 2002-04. Mumbai,
International Institute for Population Sciences.
Rajan SI, Mohanchandran , Mishra NR (2008) Infant and Child Mortality
in India: District Level Estimates. New Delhi, Population Foundation
of India.
United Nations Children’s Fund (2008) Infant Mortality High in India.
CNN-IBN.
Visaria L (2004) Mortality trends and the health transition. in T Dyson
(et al.) (Eds) Twenty-first Century India. New Delhi, Oxford
University Press.
16

Determinants of Infant Mortality
Table 1
Estimated Infant Mortality Rates in India and states, Year-2007
India and states Total Rural Urban
India 55 61 37
Andhra Pradesh 54 60 37
Assam 66 68 41
Bihar 58 59 44
Chhattisgarh 59 61 49
Delhi 36 41 35
Gujarat 52 60 36
Haryana 55 60 44
Jammu and Kashmir 51 53 38
Jharkhand 48 51 31
Karnataka 47 52 35
Kerala 13 14 10
Madhya Pradesh 72 77 50
Maharashtra 34 41 24
Orissa 71 73 52
Punjab 43 47 35
Rajasthan 65 72 40
Tamil Nadu 35 38 31
Uttar Pradesh 69 72 51
West Bengal 37 39 29
Arunachal Pradesh 37 41 15
Goa 13 11 13
Himachal Pradesh 47 49 25
Manipur 12 13 9
Meghalaya 56 57 46
Mizoram 23 27 16
Nagaland 21 18 29
Sikkim 34 36 20
Tripura 39 40 32
Uttarakhand 48 52 25
Andaman and Nicobar Islands 34 38 23
Chandigarh 27 25 28
Dadra & Nagar Haveli 34 38 18
Daman & Diu 27 29 23
Lakshadweep 24 25 23
Puducherry 25 31 22
Note: Infant Mortality Rates for smaller States and Union
Territories are based on three-year average, 2005-07,
Source: Sample Registration System, 2007
17

Child Survival and Health
Table 2
Varimax rotated factor matrix of the selected variables
Variable Factor Loadings Communality
I II III
IMRT01 -0.589 -0.453 -0.059 0.556
GMB18 -0.401 -0.568 0.301 0.574
ANC 0.858 0.375 -0.046 0.878
InsDel 0.811 0.426 0.075 0.844
InsDelP 0.667 0.342 0.342 0.679
Sdel 0.821 0.435 0.05 0.866
WsRTISTD -0.591 0.178 0.205 0.423
BO3Plus -0.827 -0.316 0.06 0.787
LIT_F 0.447 0.698 -0.08 0.693
URBP 0.214 0.68 0.122 0.523
MWORK_F 0.386 0.573 -0.107 0.489
ANM 0.192 0.612 -0.444 0.609
HADBEDS 0.011 0.768 0.083 0.596
PPBPL -0.266 -0.024 -0.694 0.553
PMUS -0.169 0.022 0.559 0.342
DDIO 0.251 0.708 0.171 0.593
Eigen Values 4.648 4.031 1.328
18

Determinants of Infant Mortality
Table 3
Parametric estimates of multiple regression model
for infant mortality rate
Predictor
Variables
Parametric Estimates “t” p
Regression
Coefficient
(B)
Standard
Error
Standardized
Regression
Coefficient
(Beta)
(Constant) 69.482 8.194 8.48 0
GMB18 0.204 0.05 0.171 4.062 0
ANC -0.154 0.071 -0.185 -2.185 0.029
InsDel -0.14 0.072 -0.152 -1.938 0.053
Sdel 0.065 0.086 0.069 0.764 0.445
WsRTISTD 0 0.055 0 0 0.997
BO3Plus 0.107 0.095 0.067 1.123 0.262
LIT_F -0.202 0.072 -0.141 -2.8 0.01
MWORK_F -0.17 0.05 -0.128 -3.371 0
ANM -0.004 0.013 -0.011 -0.288 0.773
HADBEDS 0.005 0.016 0.011 0.287 0.774
DDIO -2.39 1.512 -0.064 -1.58 0.115
PPBPL 0.218 0.049 0.144 4.471 0
PMUS 0.031 0.066 0.014 0.462 0.644
R-Square = 0.704; N = 593
19

Child Survival and Health
Appendix Table 1
Description of variables used in the analysis
SN Abbreviations Description of the Variable (Source)
1 IMRT01 Infant Mortality Rate, 2001 (PFI)
2 GMB18 Girls Marriage below age 18 (DLHS 2)
3 ANC3P Three ANC check-ups (DLHS 2)
4 InsDel Institutional Delivery (DLHS 2)
5 InsDelP Institutional Delivery at Pvt. Hospital (DLHS 2)
6 Sdel Safe Delivery (DLHS 2)
7 WsRTISTD Women Suffering from RTI/STDs (DLHS 2)
8 BO3Plus Birth Order 3+ (DLHS 2)
9 LIT_F Female Literacy (Census 2001)
10 MWORK_F Female Work Participation as Main Workers
(Census 2001)
11 ANM Auxiliary Nurse cum Midwife (CMIE)
12 HADBEDS Hospitals and Dispensary Beds per Lakh
Population (CMIE)
13 PMUS Percent Muslim Population (Census 2001)
14 DDIO District Development index (Author's
Calculations)
15 PPBPL Percent Population below Poverty Line (CMIE)
20

Appendix Table 2
Descriptive statistics of variables used in the analysis
SN Abbreviations Minimum Maximum Mean Std.
Deviation
1 IMRT01 13 121 61.15 22.266
2 GMB18 0.6 85 29.519 18.6825
3 ANC3P 5.4 100 52.232 26.6763
4 InsDel 2.3 100 41.933 24.2061
5 InsDelP 0.1 79 20.059 16.2401
6 Sdel 9 100 56.836 23.529
7 WsRTISTD 1.9 78.4 32.428 14.1069
8 BO3Plus 6.8 76.1 40.432 13.9482
9 LIT_F 18.5 96.06 53.0978 15.50823
10 MWORK_F 13.2 94.79 55.1904 16.7941
11 ANM 3.4 456.54 101.5286 62.92625
12 HADBEDS 7.7 366.98 74.3034 50.56851
13 PMUS 0.04 94.31 10.6069 10.37886
14 DDIO -1.1 4 0.01 0.5955
15 PPBPL 7 99 52.16 14.669
Valid N 593
21

Child Survival and Health
22

Child Survival and Health
Policies and Programmes
SS KushwahPankaj Prasad
IntroductionChildren are principle assets of any country. They are the future of the
mankind. It is our responsibility to nurture, solicitude and protect
children. Development of the child should therefore be the first priority
on the development agenda of any country (Government of India 1974).
India is the home of the largest child population in the world. The
importance of children in India’s development is reflected in the X Five-
year Plan document which underlines the fact that the future of India
lies in the future of Indian children – across income groups,
geographical locations, gender and communities (Black, Morris and
Bryce 2003).
Government of India is making all out efforts for the development
and welfare of children. Significant progress has been made in many
fields towards assuring basic rights to children. However, much still
remains to be done. The country is committed and determined to give
the highest priority to the basic needs and rights of all children.
Children are the most vulnerable group of the population and are
most exposed to exploitation and abuse. Although, there has been some
significant improvement in the situation of children in the country, yet
a lot more is still to be done in terms of health, nutrition and education.
It is unfortunate that the girl child, in particular, face debilitating
discrimination at all stages. Therefore, specific concentration is being
given to efforts to improve the life and opportunities of girls.
23

Child Survival and Health
Child survival, growth and development need to be looked through
a holistic perspective as one cannot be achieved without the other.
There have to be balanced linkages between education, health and
nutrition for proper development of a child.
Survival of infants and young children remains one of the most
important issues in the developing world. Around the world, more than
10 million children under five years of age die every year. Levels of
under-5 mortality rate vary widely across countries from 4 to over 280
deaths per 1000 live births. About 41 per cent of under-5 deaths occur
in sub-Saharan Africa and another 34 per cent in South Asia.
Efforts have been directed to enhance child survival for several
decades. Although, infant and child mortality rates are decreasing, yet,
they still remain at unacceptably high levels in the developing
countries. Twenty to twenty-five per cent of children born in
developing countries die before their fifth birthday. This figure is very
high when compared to that in the developed countries where only
about 2 per cent of children die before the age of five years (Mosley
1985).
Diarrhea, pneumonia, and malaria are the leading killers of
children, accounting for nearly half of all child deaths globally. Three
of every ten deaths are due to neo-natal causes mainly as a result of
birth asphyxia, complications of pre-maturity, sepsis and tetanus. AIDS
accounts for 3 per cent of child deaths in the world. This proportion is
significantly high in a few African countries.
Overall trends in child survival have been positive in recent years.
However, the progress has been uneven with child mortality rate
increasing in under developed countries.
The good news is that for nearly all major causes of child death,
affordable and effective solutions are readily available. Experts
conclude that approximately two-thirds of child deaths can be
prevented by available and affordable interventions such as Vitamin A
supplements, oral rehydration therapy (ORT), and measles and tetanus
immunisation.
As per 2001 census, India has around 157.86 million children below
6 years of age that constitute around 15 per cent of India's population.
Out of these, 75.95 million children are girls. The sex ratio among
children (0-6 years) as per Census 2001 is 927 females per 1000 males.
A significant proportion of these children live in an economic and social
environment which impedes physical and mental development of the
child. These conditions include poverty, poor environmental sanitation,
24

Policies and Programmes
infections, inadequate access to primary health care, etc. In addition,
inappropriate child caring and child feeding practices, etc also influence
the growth and development of the child negatively (Government of
India 2008).
In India, about 2.1 million child deaths occur every year. This
number is the highest across countries (UNICEF 2004). The national
under-five mortality rate is around 85 per 1000 live births, but there are
wide variations across states. For example, in 1998-99, the under-five
mortality rate varied from 19 per 1000 live births in Kerala to 138 in
Madhya Pradesh (IIPS 2000). The World Summit for Children in 1990
called for a worldwide reduction in child mortality below 70 deaths per
1000 live births by the year 2000 (UNICEF 2001). Unfortunately this goal
could not be met. The Millennium Development Goal related to child
survival is to reduce child mortality by two-thirds between 1990 and
2015 (United Nations 2001). For developing countries, this means a
reduction from 105 to 35 under-five deaths per 1000 live births. For
South Asia, this implies a reduction from 126 to 42 under-five deaths
per 1000 live births by the year 2015. According to estimates prepared
by United Nations Children’s Fund, child mortality rates have reduced
by around 12 per cent between 1990 and 2002 (Jones et al 2006). Given
this average annual rate of reduction of 1 per cent per year, the pace of
progress will need to be accelerated significantly during the remaining
years. For India, attaining the millennium development goal of
reduction in child mortality would imply a reduction in the under-five
mortality rate to 41 by 2015. There has been a substantial decrease in
child mortality in the past two decades in India. The reduction was
more marked in the 1980's than in the 1990's. Despite these impressive
gains, India compares poorly in the pace of child mortality reduction to
several other countries in south and south-east Asia, including
Bangladesh. More disturbing are the data which indicate that the
decrease in the child mortality rate is slowing down in India (Claeson
et al 2000). Infant and child mortality rates in India remain well above
the global average. Within India, states like Madhya Pradesh has higher
than national infant and child mortality rates. Infant and child mortality
rates in Madhya Pradesh, in fact, are the highest amongst all states and
Union Territories of the country. This is in quite contrast to Kerala
which has the lowest infant and child mortality in the country. A
comparison of Madhya Pradesh vis-a-vis India and Kerala is presented
in table 1 which shows a very poor child survival scenario in Madhya
Pradesh.
25

Child Survival and Health
It may be pointed out here that United Nations Children’s Fund
considers the under-five mortality rate as the best indicator of social
development and well-being (Park 2007). On other hand, infant
mortality rate is an important indicator for planning public health
services. Major causes of infant deaths in India are:
1) Low birth weight and prematurity
2) Birth injury
3) Sepsis
4) Congenital anomaly
5) Hemolytic diseases of newborn
6) Diarrhoeal diseases
7) Acute respiratory infections
8) Tetanus.
On the other hand, major causes of death in children below five
years of age are:
Neonatal causes (37 per cent)
Acute respiratory infections (19 per cent)
Diarrhoeal diseases (17 per cent)
Malaria (8 per cent)
Measles (4 per cent)
HIV/AIDS (3 per cent)
Injuries (3 per cent)
Others including non-communicable diseases(10 per cent)
Child survival index (CSI) is often used to measure the progress
towards child survival. CSI is the proportion of those new born who
survive to their fifth birth day. It is defined as
Child Survival Index = (1000 – under 5 mortality rate)/10
India has a child survival index of 91.5 per cent as compared to 99.2
per cent in United States of America and 99.6 per cent in Japan.
Initiatives have been taken at international, national and state levels to
protect and safeguard the child. Internationally, there are various
organizations which are constantly working in this field. These include,
among others, UNICEF, WHO, CARE, FAO, etc. UNICEF has
supported India’s BCG vaccination programme right since its inception.
It has also assisted in environment sanitation programme emphasising
safe drinking water in the rural areas. In collaboration with FAO,
UNICEF is also aiding the applied nutrition programme. Currently,
UNICEF is promoting GOBI campaign that encompasses four child
survival strategies - growth monitoring, oral rehydration therapy,
breast feeding and immunisation. FAO, on the other hand, has
26

Policies and Programmes
organised the World Freedom from Hunger Campaign (FFHC) while
CARE-India is supporting a number of child survival related
interventions including Integrated Child Development Scheme,
Integrated Nutrition and Health Project, Anaemia Control Programme,
etc. WHO is supporting India’s Pulse Polio Immunisation Programme
(Park 2007).
Government of India has also initiated a number of projects to
promote child survival such as Integrated Child Development Scheme
and reproductive and child health programme. The Integrated Child
Development Scheme was launched in 1975. Its components are:
Supplementary Nutrition
Immunisation
Health Checkups & Medical Referral
Vitamin-A prophylaxis
Provision of IFA tablets
The Reproductive and Child Health Programme, on the other hand,
comprehensively integrates a range of interventions directed towards
improving child health (Park 2007). The programme is focussed on
major factors contributing to high infant and under-five mortality. Child
health care component of the Programme includes:
Essential Newborn Care
Universal Immunisation
Nutrition
Oral rehydration therapy
Control of acute respiratory infections
Prevention and control of Vitamin-A deficiency
Prevention and control of anaemia
Detection and management of growth faltering
The National Polio Surveillance Programme (NPSP) was started in
1997 with the assistance of DANIDA and USAID. It operates under the
managerial control of the World Health Organisation. It helps in
detection of cases, case investigation, laboratory diagnosis and mop up
immunisation (Park 2007).
Integrated management of neonatal and childhood illness (IMNCI)
has been evolved as an integrated package of child health care based on
WHO/UNICEF generic guidelines. Indian adaptation of the guidelines
includes home based care of new born. It is well known that with the
decrease in infant and under-five mortality, an increasing proportion of
child deaths are concentrated in the neonatal period (Park 2007). Core
components of IMNCI are:
27

Child Survival and Health
• Improvement in case management skills of the health staff through
provision of locally adapted guidelines on IMNCI.
• Improvement in health system required for effective management
of childhood illness.
• Improvement in family and community practices.
In 1998-99, Government of India launched the Child Line Service
which is a round the clock free phone service that can be accessed by a
child in distress or an adult on behalf of the child by dialling 1098. Child
Line Service provides emergency assistance to a child. Based upon the
need of the child, the child is referred to an appropriate health
institution for long-term follow up and care (Government of India
2006). The service focuses on the needs of children living alone on the
streets, child labours working in unorganised sector, domestic workers
and sexually abused children. The service is currently operational in 73
cities in the country.
The Government of Madhya Pradesh has also launched a number
of programmes for the welfare of children. These include:
• Janani Express Yojana which provides round the clock availability
of emergency transport named Janani Express for institutional
delivery and postnatal and other health emergencies. It is especially
available for any complication during pregnancy and for the
newborn (Government of Madhya Pradesh 2008).
• Bal Shakti Yojana which aims at severely malnourished children.
Nutritional Rehabilitation Centres (NRCs) has been established for
their intensive observation and medical treatment. Cost of
transport, stay and loss of wage earnings of the accompanying
person is also covered. At present 40 NRCs are operational
throughout the state and it is planned to increase them to 100
(Government of Madhya Pradesh 2008).
• Matri Shakti Yojana aims at tracking and providing care to women
with high risk pregnancies. These women are given ‘red card’
which entitles them for totally free treatment including medicines
and nutrition support (Government of Madhya Pradesh 2008).
• Ladli Laxmi Yojana has led to considerable increase in the number
of families who opt for family planning after two daughters. The
scheme was launched on January 1, 2006. The scheme is for the
benefit of the girl child belonging to below poverty line families.
Under the scheme, Rs 6,500 is deposited by the state government in
the name of a girl child on the day she is born, which would
accumulate to Rupees one lakh after 18 years. This money will be
28

Policies and Programmes
then handed over to the girl. Following the implementation of this
scheme, the negative tendency in the society towards girls has
undergone a change. Now, birth of a girl fills a family with
happiness and joy (Government of Madhya Pradesh 2008).
• Dhanwatri Block Development Scheme. This scheme is being
implemented in 50 high performing development blocks of the
state. In the Community Health Centres located in these
development blocks, model services are being provided
(Government of Madhya Pradesh 2008).
• Integrated Disease Surveillance Project (IDSP) was launched in
Madhya Pradesh in 2004 for the surveillance of communicable and
non-communicable diseases (Government of Madhya Pradesh
2008).
• Deen Dayal Antyoday Upchar Yojna. The Government of Madhya
Pradesh with its commitment to provide social security to the under
privileged section of the society launched the Din Dayal Antyoday
Upchar Yojana in 2004. Initially the scheme was limited to below
poverty line families belonging to Schedule Castes and Scheduled
Tribes. Later, the scheme was extended to cover all below poverty
line families. The objective of the scheme is to provide free
treatment and investigation facility to patients who are hospitalised
in government hospitals. The scheme seeks to provide social
security coverage to lower socio economic strata of the population
and safeguard them from indebtedness arising from illness
(Government of Madhya Pradesh 2008).
• Deendayal Chalit Aspatal. This scheme is meant especially for
Tribal Blocks of the state. It is run for the upliftment and betterment
of child health (Government of Madhya Pradesh 2008).
Constitutional Provisions. There are several provisions in the
Constitution of the Republic of India which are relevant for children
(Government of India 2008). These include:
• Article 15(3) which provides that, “Nothing in this article shall
prevent the state for making any special provision for women and
children.”
• Article 21 which provides that no person shall be deprived of his
life or personal liberty except according to procedure established by
law.
• Article 21A which directs the state shall provide free and
compulsory education to all children of the age of six to fourteen
years in such manner as the state may, by law, determine.
29

Child Survival and Health
• Article 23 which prohibits trafficking of human beings and forced
labour.
• Article 24 which prohibits employment of children below the age
of fourteen years in factories, mines or any other hazardous
occupation.
• Article 39(e) and (f) which provide that the State shall, in particular,
direct its policy towards securing to ensure that the health and
strength of workers, men and women and the tender age of
children are not abused and that the citizens are not forced by
economic necessity to enter avocations unsuited to their age or
strength and that the children are given opportunities and facilities
to develop in a healthy manner and in conditions of freedom and
dignity and that the childhood and youth are protected against
exploitation and against moral and material abandonment.
• Article 45 which envisages that the state shall endeavour to provide
early childhood care and education for all children until they
complete the age of six years.
Legislation. In addition to Constitutional provisions, there are
several legislations enacted from time to time that have relevance to the
survival, growth and development of children. These include:
1. The Child Marriage Restraint Act, 1929.
2. The Child Labour (Prohibition and Regulation) Act, 1986.
3. The Juvenile Justice (Care and Protection of Children) Act, 2000.
4. The Infant Milk Substitutes, Feeding Bottles and Infant Foods
(Regulation of Production, Supply and Distribution) Act, 1992.
5. The Pre-Conception and Pre-natal Diagnostic Technique
(Prohibition of Sex Selection) Act, 1994.
6. The Persons with Disabilities (Equal Opportunities, Protection of
Rights and Full Participation) Act, 1995.
7. The Immoral Traffic (Prevention) Act, 1956.
8. The Guardian and Wards Act, 1890.
9. The Young Persons (Harmful Publications) Act, 1956.
10. The Commissions for Protection of Child Rights Act, 2005
National Policy for Children. Keeping in view the Constitutional
provisions and United Nations Declaration of the Rights of the Child,
Government of India adopted National Policy for Children on 22
August 1974 which states that “It shall be the policy of state to provide
adequate services to children, both before and after birth and through
the period of growth, to ensure their full physical, mental and social
development. The state shall progressively increase the scope of such
30

Policies and Programmes
services so that, within a reasonable time, all children in the country
enjoy optimum conditions for their balanced growth”. It further spells
out various measures to be adopted and priorities to be assigned to
children’s programmes with focus on areas like child health, child
nutrition and welfare of handicapped and destitute children.
According to United Nations Declaration of the Rights of the Child,
development of children has been considered an integral part of
national development. The Policy recognises children as “nation’s
supremely important asset” and declares that the nation is responsible
for their “nature and solicitude”.
The Government of India has also constituted National Children’s
Board with Prime Minister as chairmen to look after problems relating
to child welfare and their purposeful development. The Board provides
policy and direction and reviews programmes for children.
Government of India has introduced a number of programmes
following announcement the National Policy for Children. These
include National Award for Child Welfare, Welfare of the
Handicapped, constitution of “National Children’s Fund” etc.
National Charter for Children. The Government of India adopted the
National Charter for Children which has been prepared after obtaining
the views/comments and suggestions of the state governments and
Union Territory Administrations, concerned Ministries and
Departments and experts in the field. The Charter is a statement of
intent embodying Government’s agenda for Children. The document
emphasises Government of India’s commitment to children’s right to
survival, health and nutrition, standards of living, play and leisure,
early childhood care, education, protection of the girl child,
empowering adolescents, equality, life and liberty, name and
nationality, freedom of expression, freedom of association and peaceful
assembly, the right to a family and the right to be protected from
economic exploitation and all forms of abuse. The document also
provides for protection of children in difficult circumstances, children
with disabilities, children from marginalised and disadvantaged
communities, and child victims. The document while stipulating the
duties of the state and the community towards children also emphasizes
the duties of children towards family, society and the Nation.
India acceded to the UN Convention on the Rights of the Child on
11 December 1992 to reiterate its commitment to the cause of children.th
The objective of the Convention is to give every child the right to
survival and development in a healthy and congenial manner.
31

Child Survival and Health
India is also a signatory to the Millennium Declaration, SAARC
Convention on Child Welfare and Combatting Trafficking of Women
and Children in the SAARC Region.
National Plan of Action for Children 2005. Ministry of Women and
Child Development has prepared a National Plan of Action for Children
in 2005 after harmonising the goals for children set in the UN General
Assembly Special Session on Children held in 2002, targets set in the X
F i v e - Y e a r P l a n , a n d g o a ls f o r c h i ld r e n in r e la t e d
Ministries/Departments. The Action Plan has been prepared in
consultation with concerned Ministries and Departments, States/Union
territory Governments, Non Government Organisations and experts. It
includes goals, objectives, strategies and activities for improving
nutritional status of children, reducing infant and maternal mortality,
increasing enrolment ratio and reducing drop out rates, universalization
of primary education, increasing coverage for immunisation, etc. The
Prime Minister’s Office monitors the implementation of the Plan of
Action on the basis of the following eight parameters:
1. Reduce infant mortality rate to below 30 per 1000 live births by
2010.
2. Reduction in the child mortality rate to below 31 per 1000 live births
by 2010.
3. To reduce maternal mortality ratio to below 100 per 100,000 live
births by 2010.
4. Universal equitable access and use of safe drinking water and
improved access to sanitary means of excreta disposal by 2010.
5. Universal access to basic sanitation facilities by the rural population
by 2012.
6. Elimination of child marriages by 2010
7. Elimination of disability due to poliomyelitis by 2007
8. Reduction in the proportion of infants infected with HIV by 20 per
cent by 2007 and by 50 per cent by 2010, by ensuring that 80 per
cent of pregnant women have access to ante natal care, and 95 per
cent of men and women aged 15-24 have access to care, counselling
and other prevention services.
The Commission for Protection of the Child Rights Act 2005.
Government of India has recently notified the Commissions for the
Protection of Child Rights Act 2005. The Act envisages setting up
National and State Commissions. These Commissions would be set up
for proper enforcement of child rights and effective implementation of
laws and programmes relating to children. The National Commission
32

Policies and Programmes
for Protection of Child Rights will be a statutory body to be set up
under the Commissions for Protection of Child Rights Act. The
proposed Commission will have a Chairperson and six other Members,
including two women members, a Member Secretary and other
supporting staff. The Chairperson would be a person of eminence in the
field of child development. The members would be experts in the field
of child health, education, child care and development, juvenile justice,
children with disabilities, elimination of child labour, child psychology
or sociology and laws relating to children. The officers and the staff of
the Commission will be provided by the Central Government.
Offences Against Children (Prevention) Bill: Child abuse involves
several aspects, such as, sexual exploitation, economic exploitation,
domestic violence, trafficking for prostitution, corporal punishment at
school, and others. Therefore, Government of India felt a need to have
a dialogue on the issue so as to ascertain views from all quarters and to
formulate a consensus in order to address the issue more adequately
and effectively. Accordingly, consultations have been carried out with
voluntary organizations and experts dealing with the subject. It has
been decided, after consultations, to constitute a small group consisting
of representatives from the Government, NGOs, legal experts and social
workers which will go into all aspects of the subject and, after
considering all existing legal provisions available on the subject, will
formulate draft legislation to address all issues pertaining to child
abuse. After wide consultations, a draft Bill for Offences Against
Children has been prepared and circulated to the State Governments for
their comments and views.
Proposed Integrated Programme for Child Services: As per the 2001
Census, there were 427 million children in the country. There are
millions of children living in the difficult circumstances. The child
protection programme in India is shared between various Ministries,
which have been implementing different schemes and programmes to
reach out to varied groups of vulnerable children with complex and
diverse needs. The important schemes and programmes for such
children include. Programme for Juvenile Justice, Integrated
Programme for Street Children, Shishu Griha Scheme, Scheme for
Working Children in Need of Care and Protection, General Grant-in-
Aid Scheme, Child Line Service, Rajiv Gandhi National Crèche Scheme
for the children of working mothers, Pilot Project to Combat the
Trafficking of women and Children for Commercial Sexual Exploitation
in Destination Areas, etc. However, experiences with the
33

Child Survival and Health
implementation of existing programmes and polices has brought out a
large number of shortcomings in the system.
In view of the gaps identified and recommendations and
suggestions received from various quarters, it has been decided to
combine the existing child protection schemes under one integrated
scheme titled “Integrated Child Protection Scheme”. The proposed
scheme aims to provide for care and protection of all the children in
conflict with law and children in need of care and protection. It would
involve steps to strengthen families and prevent them to break-up
leading children to become homeless and without care and protection.
At the same time, children outside the mainstream need to be provided
support beginning from emergency outreach services to final
rehabilitation with their families/society. Details of the Scheme are
being worked out which is proposed to be implemented in the Eleventh
Plan.
All over the world, recognition of child protection as a human
rights concept has been fairly recent. The literary works of the time have
only romanticised children and their conditions, and has viewed
children as their father’s property. Legally also, the father is seen as the
natural guardian of the child. Patriarchy and its structures approve of
this position and in fact justify extreme forms of chastisement of
children. The plight of working children, children in institutions and
orphans and destitute children living in inhuman conditions is not new
to any civilization. The child rights movement in itself is young, much
younger than the women’s movement. However, ever since the
movement for betterment of a child’s conditions started gaining
momentum and acquired strength, there has been a paradigm shift
from care and nurture to protection in a healthy and caring
environment. Social justice and the right to life and well-being form the
new ideological basis for action (Government of India 2006).
In India, the concept of child rights and the need to create a
protective environment has started gaining momentum. However, there
is still a great deal that needs to be done. The foremost requirement is
the understanding of the fact that for a country with the largest child
population in the world, and for the country that wishes to rest on the
laurels of its human resources, it is essential for India to put in place the
protective environment the child deserves without any further delay.
The prevailing economic and socio-political factors in the country
also leave certain groups of children more vulnerable and at risk. Such
children are dependent on the Government for providing support,
34

Policies and Programmes
education, health care, skills development, protection from violence and
freedom from exploitation and other needs. It cannot be denied that in
the entire South Asian region, they are a particularly neglected group
and need special attention. In this regard, the girl child is even more
vulnerable than others. It is essential that the creation of a protective
environment be addressed at three levels:
• Policy and legislation
• Schemes and funding for their implementation
• Advocacy and creation of a cadre of professionals to carry it
forward
Besides the role of the Government, the role of all individuals,
communities and families is also critical as the mind set must change for
any improvement to come about in the lives of our children. People
have now come to understand the importance and relevance of
education. Similarly, protection of children must also receive a priority.
All actors in civil society and the Government have to cooperate and
work towards a coordinated effort to make this movement a success.
ReferencesBlack RE, SS Morris, J Bryce (2003) Where and why are 10 million
children dying each year? The Lancet 361:2226-2234.
Claeson M, Bos ER, Mawaji T, Pathmanathan I. (2000) Reducing child
mortality in India in the new millennium. Bulletin of the World
Health Organisation 78:1192-1199.
Government of India (1974) National Policy for Children. New Delhi,
Department of Social Welfare.
Government of India (2005) SRS Statistical Report 2003. New Delhi,
Registrar General.
Government of India (2006) India: Building a Protective Environment for
Children. New Delhi, Ministry of Women and Child Development.
Government of India (2008) Integrated Child Development Services.
www.wcd.nic.in/icds.htm. Accessed 15 November 2008.
Government of India (2008) Common Review Mission of National Rural
Health Mission. www.mohfw.nic.in. Accessed on 20 November 2008.
Government of Madhya Pradesh (2008) Innovative schemes and
programme interventions under National Rural Health Mission.
www.mp.gov.in. Accessed 15 November 2008.
Government of Madhya Pradesh (2008) Ladly Laxmi Yojana a Success.
www.indiainfo.com. Accessed 15 November 2008.
35

Child Survival and Health
International Institute for Population Sciences (2000) National Family
Health Survey(NFHS-2) 1998-99. Mumbai, International Institute for
Population Sciences.
Jones G (2006) Child survival in India. India Journal of Pediatrics 73:479-
487.
Mosley H (1985) Child survival research and policy. World Health
Forum 6:352.
Park K (2007) Park’s Textbook of Preventive and Social Medicine. Jabalpur,
Banarasi Das Bhanot.
United Nations Children’s Fund (2004) State of the World’s Children 2005.
New York, United Nations Children’s Fund.
United Nations Children’s Fund (2001) Progress since the World Summit
for children: A Statistical Review . New York, United Nations
Children’s Fund.
United Nations Children’s Fund (2004) The State of World’s Children
2005. New York, United Nations.
United Nations (2001) Road Map Towards the Implementation of the United
Nations Millennium Declaration: Report of the Secretary General. New
York, United Nations.
World Health Organisation (2003) Health Status Statistics - Mortality,
Under-5 and Infant Mortality Rate - by WHO Region 2003.
36

Table 1
Child survival scenarios in India, Madhya Pradesh and Kerala.
S.No. Mortality rate
Per 1000 live births
India Madhya
Pradesh
Kerala
1 Infant mortality rate 57 74 12
2 Early Neonatal mortality rate 25 33 5
3 Neonatal mortality rate 37 50 7
4 Perinatal mortality rate 33 39 11
5 Post-Neonatal mortality rate 23 31 5
Source: Government of India (2005)
37

Child Survival and Health
38

Infant Mortality in Madhya Pradesh
Evidence from DLHS-2
Rajiv Ranjan
IntroductionInfant mortality rate is an accepted global indicator of the health and
socioeconomic status of the population (WHO 1981, WHO 1990). While
neonatal health is found to be dependent on the efficiency and
effectiveness of healthcare services, post-neonatal health is found to be
dependent largely on environmental factors. A high infant mortality
rate therefore can be taken to indicate unmet health needs and
unfavourable environmental factors.
The fourth Millennium Development Goal has underlined the
commitment to improve the health of infants and children. India, along
with many other countries have pledged to reduce mortality rate in
under-five children by two-thirds by the year 2015 from the baseline set
in the year 1990. This goal cannot be met until infant mortality rate is
reduced by one half. Although, the world has begun to see significant
improvements in child survival, yet mortality in the first year of life
virtually remains unchanged.
In the past two decades, there have been a number of initiatives in
India to address child survival issues. These include Child Survival and
Safe Motherhood Program (CSSM), Reproductive and Child Health
Program (RCH) and Integrated Management of Neonatal Childhood
Illness (IMNCI) initiative. However, irrespective of these initiatives, the
situation related to infant's health remains a major concern and a
daunting challenge (WHO 2005). Preventable morbidity such as
hypothermia, asphyxia, infections, diarrhoea, malnutrition and
respiratory infections continue to lead the table. Basic physiological
39

Child Survival and Health
support for safe deliveries, appropriate environmental conditions in the
labour room, resuscitation facilities, trained nursing staff and
pediatricians remain grossly inadequate (Pandey 1998).
India is the second most populous country in the world. One-fourth
population of the country is living below the poverty line. Average
income of these families is less than Rs 50 per day (UNDP 2004). Every
year, more than 27 million children are born in India and 4 million
babies die within one year of their birth (WHO 2005). Seventy per cent
of children are born at home and more than 50 per cent of the deliveries
are attended by unskilled persons. Ante-, intra- and post-natal coverage
remains below 50 per cent (Panday et al 1998).
The World Health Report 2005 estimated that only 12 per cent of
infants need intensive medical care globally. However, the Indian
policy towards child survival has always focussed on medical
interventions rather than community based health education or
preventative and health promotion activities (Claeson 2000). It is argued
that providing medical care to infants is beyond the capacity of
available financial, human and technical resources, although, it is
proved in a number of empirical studies that two thirds of child deaths
can be saved by providing better health information and preventative
health services to women and infants (Daly 2000). Major causes of infant
deaths are asphyxia, acute respiratory infections, diarrhoea, tetanus,
sepsis, injury and congenital defects. They account for 80 per cent of
infant deaths of which more than 70 per cent are preventable (WHO
2005).
In this paper, we analyse the trends and inter-district variations in
the infant mortality rate in India and explore some of the social and
economic correlates of infant deaths on the basis of district level
information in Madhya Pradesh.
Data and MethodsThe analysis presented in this paper is based on the information
available through the District Level Household Survey (DLHS-2) which
was carried out during 2002-04 in all the 45 districts of Madhya Pradesh
that existed at that time. The number of districts in the state have since
increased to 50. During the survey, the birth history of currently
married women in the age group 15-44 years was collected which
contains records of all live births to the currently married women
surveyed irrespective of whether they were alive or not at the time of
the survey. For each birth, information about age of the mother at birth,
40

Infant Mortality Trends
birth order, whether the child was alive at the time of the survey or not
and if not then the age at death was collected along with the family
level information about religion, caste, place of residence and standard
of living, etc. The infant mortality rate was estimated on the basis of
birth history data using Demographic and Health Surveys guidelines
(Rutstein, Rojas 2003). According to these guidelines, the following
measures were adopted for estimating the infant mortality rate:
Population base Live births to respondents.
Time Period Five-year periods of time preceding the
survey.
Live Births Complete expulsion or extraction from its
mother of a product of conception,
irrespective of the duration of the pregnancy,
which, after such separation, breathes or
shows any other evidence of life, such as
beating of hearts, pulsation of the umbilical
cord, or definite movement of voluntary
muscles, whether or not the umbilical cord has
been cut or the placenta is attached (WHO
1950, 1992).
Numerator Number of deaths among live born during
specified age range and specified time period.
Neonatal mortality Deaths within 30 days of live birth (also
includes deaths reported at zero month).
Post neonatal mortality Deaths at ages 1-11 months (also includes
deaths reported as age 31-59 days).
Infant mortality Deaths at ages 0-11 months (also includes
deaths reported as age zero year).
According to these definitions, infant mortality equals the sum of
neonatal mortality and post-neonatal mortality. Similarly, under-five
mortality is sum of infant mortality and child mortality.
Mortality rates presented in this paper are probabilities calculated
through the conventional life table approach. For any calendar period,
deaths and exposure are first tabulated for age intervals 0, 1-2, 3-5, 6-11,
12-23, 24-35, 36-47, and 48-59 months and then age-specific probabilities
of survival are calculated. On the basis of these probabilities for age
segment 0-1 year are produced by multiplying relevant age-specific
probabilities and subtracting the product from 1 as
iwhere I is the age interval in months, q are the sub interval probability
n xof dying, and q is the conventional probability of dying between age
41

Child Survival and Health
x to x + n months. Detailed description of the computation procedure
is given in Rutstein (1984).
Geographical Boundaries. Madhya Pradesh is one of the largest states
of India consisting of, from north to south, upland zones separated by
plains. The state straddles the Narmada river, which runs east to west
between the Vindhya and Satpura mountain ranges. These mountain
ranges and the river Narmada have traditionally separated the north
India from the south. The state is bordered on the west by Gujarat; on
the northwest by Rajasthan; on the northeast by Uttar Pradesh; on the
east by Chhattisgarh; and on the south by Maharashtra.
For the purpose of the present analysis, the 45 districts of the state
are grouped in to 6 regions as shown below:
Northern Region Sheopur , Morena, Bhind, Gwalior, Datia,
Shivpuri and Guna
Malwa Region Neemuch, Mandsaur, Ratlam, Ujjain,
Shajapur, Dewas, Jhabua, Dhar, Indore and
Rajgarh
South West Region West Nimar, Barwani, East Nimar, Betul,
Harda and Hoshangabad
South Central Region Katni , Jabalpur, Narsimhapur, Dindori
Mandla, Chhindwara, Seoni and Balaghat
Central Region Sagar , Damoh, Vidisha, Bhopal, Sehore and
Raisen
Vindhya Region Tikamgarh, Chhatarpur, Panna, Satna,
Rewa, Umaria, Shahdol and Sidhi.
Demographic, Socio-economic and Health Profile. Madhya Pradesh had
a population of 60.4 million at the 2001 population census; the rural
urban ratio being approximately 73:27 per cent. Scheduled Castes and
Scheduled Tribes accounted for approximately 15 per cent and 20 per
cent of the total population. Decennial population growth rate in the
state including Chattisgarh during 1991-2001 was 24.3 per cent about 2
per cent points higher than the national growth rate. The state is
relatively sparsely populated with an average population density of 196
per square km as against the national average of 274 per square
kilometre.
The sex ratio in Madhya Pradesh was 920 females per 1000 males
at the 2001 population census which was lower than the national
average of 933 females per 1000 males. The sex ratio is higher in rural
areas (927 females per 1000 males) compared to urban areas (899
females per 1000 males).
42

Infant Mortality Trends
Madhya Pradesh has made impressive advances in literacy during
the last decade. The literacy rate increased sharply from 44 per cent in
1991 to 64 per cent in 2001 against the national average of 65 per cent.
The female literacy rate is around 50 per cent somewhat lower than the
national average of around 54 per cent. Population below poverty line
in the state (including Chattisgarh) was estimated to be 43 per cent in
a survey carried out in 1987-88 while Planning Commission arrived at
a figure of 42.5 per cent in 1995. However, the Madhya Pradesh Human
Development Report, 1998 indicates a much lower figure of 31 per cent
(vis-à-vis national average of 33.5 per cent). This still means that about
18.8 million people in the state are classified as poor.
The death rate in Madhya Pradesh was 8.7 per 1000 population in
2007 according to the Sample Registration System which is higher than
the national average of 7.4 deaths per 1000 population. In 2007, total
fertility rate in Madhya Pradesh was 3.6 live births per woman which
was much higher than the national average of 2.3 and far from the
replacement fertility (total fertility rate of 2.1 live births per woman).
Results and DiscussionTrends in Infant Morality. Infant mortality has remained very high in
Madhya Pradesh currently as well as in the past. According to the
National Family Health Survey 2005-06, the infant mortality rate in the
state was around 70 infant deaths per 1000 live births around the year
2005 which is lower than the infant mortality rate of 88 infant deaths per
1000 live births estimated around the year 1998. There is a significant
difference in the infant mortality rate between rural and urban areas. of
the state However, the difference in the risk of death between male and
female infants has been found to be only marginal. In case of maternal
health care, women of the state are primarily dependent on government
maternal health services, especially in the rural areas. About 40 per cent
of the women received three antenatal care check up while two thirds
of them delivered at home. According to NFHS-3, complete
immunisation in children 12-23 months of age is 40 per cent.
Infant Mortality Rate by Selected Background Characteristics. Table 1
presents infant mortality rate in Madhya Pradesh by selected back
ground characteristics. The infant mortality rate in female infants was
71.2 per 1000 live birth which is about 13 per cent lower than the infant
mortality rate in male infants. The infant mortality rate is much higher
in infants with mother’s age below 25 years and above 35 years
compared to infants with mother’s age between 25 through 34 years.
43

Child Survival and Health
Studies suggest that the higher mortality risk in infants of younger
mothers may be related to socioeconomic factors as well as biologic
immaturity (Kirchengast and Hartmann 2003). It is also suggested that
young maternal age may be a marker for poverty (Phipps et al 2002).
In case of older mothers, especially those of low socioeconomic status,
infant mortality may be affected by pregnancy complications related to
higher maternal age such as gestational diabetes mellitus and
hypertensive disorders as well as such factors as multiple births and
low socio-economic status (Carolan 2003, WHO 1992, Bajaj et al 2002).
Infant mortality rate is generally higher for the first birth but lowest
for the second birth. After the second birth, infant mortality increases
with the increase in the birth order. However, in Madhya Pradesh, a
different pattern has been observed. The infant mortality rate for first
births was 24 per cent lower than that for the second birth. Similarly,
infant mortality for the third order births has been found to be 16 per
cent lower than that for the second order births.
Figure 1
Infant mortality rate in India and Madhya Pradesh
44

Infant Mortality Trends
Infant mortality rate has been estimated to be the highest in the
Scheduled Tribes infants (More than 92 infant deaths per 1000 live
births) followed by Scheduled Castes infants (More than 88 per 1000 live
births). Mortality in infants belonging to other backward classes is
estimated to be 1.5 times the mortality in infants belonging to other
castes category.
Infant mortality rate decreases with the increase in the education of
the mother and the standard of living as women with more education
tend to have higher income levels (US Census Bureau 2003). In Madhya
Pradesh, mortality in infants of illiterate mothers is more than 2 times
the mortality in infants of mothers having at least 10 years of education.
Similarly, mortality in infants belonging to families with low standard
of living index has been found to be more than two times the mortality
in infants belonging to families with high standard of living index.
Figure 2
Infant mortality in rural and urban areas of Madhya Pradesh
45

Child Survival and Health
Infant Mortality Rate by Region. There continues to be a wide
variation in infant mortality rates by the type of residence and sex of the
child by region (Table 2) with the highest infant mortality rate being
recorded in Vindhya region while the lowest in Malwa region. A large
Rural-urban differentials may also be observed across the regions of the
state. The rural infant mortality rate is very high in south-central region
of the state while the urban infant mortality rate is high in the Vindhya
region. Similarly, female infant mortality rate is the highest in the
Vindhya region.
Infant Mortality Rate by District. Infant mortality varies widely across
the districts of the state (Table 3). The risk of death during infancy is the
lowest in district Indore followed by Neemuch, Mandsaur, Jabalpur and
Bhopal districts. There are 12 districts in the state where the infant
mortality rate is estimated to be more than 100 infant deaths per 1000
live births.
In some of the districts of the state, male infant mortality is lower
than female infant mortality while in others, female infant mortality is
lower than the male infant mortality. The male infant morality rate is
found to be the lowest in district Indore while the female infant
morality rate is estimated to be the lowest in district Narsimhapur.
Concluding Remarks and RecommendationsInfant mortality has decreased in Madhya Pradesh but it remains the
highest in the country. Available evidence suggests that rural-urban,
social class and inter-district differentials in infant mortality are quite
substantial and they have persisted over time. These differentials
suggest that a district-based approach should be evolved for an
accelerated reduction in infant mortality. Besides, there is a need to
focus on the vulnerable groups of the population. An effective
behaviour change communication strategy should also be evolved and
adopted to accelerate reduction in infant mortality.
Government of India has recently launched the National Rural
Health Mission in selected states of the country and Madhya Pradesh
is one of them. Under the Mission, many on going health program have
been geared towards improving maternal health and reducing maternal
and child mortality. There is a need to explore new ways of scaling up
quality services by ASHA while food supplementation and other child
survival issues should get enough attention under the Mission. At the
same time collaboration and synergistic cooperation with professional
ad non government organizations, development partners and centres
46

Infant Mortality Trends
of excellence, among others, should be actively sought and embraced
to have maximum possible positive impact on child health.
ReferencesAkhter R (1991) An Introduction to Health Patterns and Planning in
Developing countries. Connecticut, Green Wood Press.
Bai J, Wong FWS, Bauman A, Mohsin M (2002) Parity and pregnancy
outcomes. American Journal of Obstetrics and Gynaecology 186(2):
274–8.
Bandyopadhyay M, McPherson S (1997) Women and Health: Tradition and
Culture of Rural India. England, Ashgate Publishing Ltd.
Carolan M (2003) The graying of the obstetric population: implications
for the older mother. JOGNN 32: 1927.
Conway KS, Deb P (2005) Is prenatal care really ineffective? Or, is the
‘devil’ in the distribution? J Health Economics 24:489–513.
Government of Uttarakhand (2002) Uttarakhand Population and Health
Policy. Dehradun, Health and Family Welfare Department.
Green A (1994) An Introduction to Health Planning in Developing
Countries. New York, Oxford University.
Grossman DC, Baldwin L-M, Casey S, et al. (2002) Disparities in infant
health among American Indians and Alaska Natives in U.S.
metropolitan areas. Pediatrics 109(4): 627–33.
Key P (1987) Women, Health and Development, with special reference
to Indian Women. Health Policy and Planning 2(1):58-69.
Kirkham C, Harris S, Grzybowski S (2005) Evidence-based prenatal
care: Part 1. General prenatal care and counselling issues. American
Family Physician 71:1307–16.
Kirkham C, Harris S, Grzybowski S (2005) Evidence-based prenatal
care: Part II. Third-trimester care and prevention of infectious
diseases. American Family Physician 71:1555–60.
Kirchengast S, Hartmann B (2003) Impact of maternal age and maternal
somatic characteristics on newborn size. American Journal of Human
Biology 15: 220–8.
Kramer MS, Liu S, Lou Z, Yuan H, Platt RW (2002) Analysis of parental
mortality and its components: Time for change. American Journal of
Epidemiology 156(6):493-497.
Kaboru BB, Flkenberg T, Ndubni P, Hojer B, Vongo R, Brugha R,
Faxelid (2006) Can biomedical and traditional health care providers
work together? Zambian practitioners experiences and attitudes
47

Child Survival and Health
towards collaboration in relation to STI and HIV/ AIDS care: A
cross sectional Study. Human Resources for Health 4(16).
Mathews TJ, Ventura SJ (1997) Birth and fertility rates by educational
attainment: United States, 1994. Monthly Vital Statistics Report 45(10
supp) Hyattsville MD, National Center for Health Statistics.
Mukopdhyay S, Ray S, Bhatia J (2004) Mothers perceptions and
attitudes towards maternal morbidity in rural West Bengal:
Findings from focus group discussions. Indian Journal of Gender
Studies 11:369-387.
Phipps MG, Blume JD, DeMonner SM (2002) Young maternal age
associated with increased risk of postneonatal death. Obstetrics and
Gynecology 100:481–6.
Rosenberg HM, Maurer JD, Sorlie PD, Johnson NJ, et al. (1999) Quality
of death rates by race and Hispanic origin: A summary of current
research. Vital Health Statistics Report 2(128), National Centre for
Health Statistics.
Shea Oscar Rustian, Guillermo Rojas (2003) Demographic and Health
Surveys. Calverton, Maryland, ORC Macro.
Sibley LM, Sipe TA (2006) Transition of skilled births attendants: Is
there a future role for trained traditional births attendants? Journal
of Health Policy 24(4): 472-478.
United States Census Bureau. Table 8. Income in 2003 by educational
attainment of the population 18 years and over, by age, sex, race
only, and Hispanic origin: 2004. http://www.census.gov/
population/socdemo/education/cps2004/tab08-1.pdf.
United Nations Development Programme (2003) Human Development
Report 2002- Millennium Development Goals: A Compact among Nations
to end Human Poverty. New York: Oxford University Press.
Vintzileos AM, Ananth CV, Smulian JC, Scorza WE, Knuppel RA (2002)
The impact of prenatal care on neonatal deaths in the presence and
absence of antenatal high-risk conditions. American Journal of
Obstetrics and Gynecology 186(5):1011–6.
World Health Organization (1992) International Statistical Classification
of Diseases and Related Health Problems, Tenth Revision. Geneva,
World Health Organization.
World Health Organisation (2005) World Health Report: Make every
Mother and Child Count. Geneva, World Health Organization.
World Health Organisation (1981) Development of Indicators for
Monitoring Progress Towards Health for All by the Year 2000. Geneva,
World Health Organisation. Health for All series, Number 4.
48

Infant Mortality Trends
Table 1
Selected demographic indicators for Madhya Pradesh and India
Indicators MP India
Total population (Census 2001) (in million) 60.4 1028.7
% Urban 26.7 27.8
Decadal Growth (Census 2001) (%) 24.3 21.5
Crude Birth Rate (SRS 2007) 28.5 23.1
Crude Death Rate (SRS 2007) 8.7 7.4
Total Fertility Rate (SRS 2005) 3.6 2.3
Infant Mortality Rate (SRS 2007) 72 55
Maternal Mortality Ratio (SRS 2001 - 2003) 379 301
Sex Ratio (Census 2001) 919 933
Population below poverty line (%) 43 26.1
Schedule Castes population (%) 15.2 16.2
Schedule Tribes population (%) 20.3 8.3
Female Literacy Rate (Census 2001) (%) 50.3 53.7
49

Child Survival and Health
Table 2
Infant mortality rate for 5-years preceding the survey by region
according to place of residence and sex of the child, Madhya
Pradesh
Region Total Place of Residence Sex of the Baby
Rural Urban Male Female
Vindhya 90.9 93.4 78.7 96.3 84.9
Central 72.6 83.6 51.2 77.2 67.6
Malwa 59.8 66.7 42.6 64.5 54.5
Northern 81.5 89.5 59.4 79.7 83.5
South Central 82.8 94.8 42.4 88.8 76.4
South West 69.9 77.4 41.4 76.5 62.3
50

Infant Mortality Trends
Table 3
Infant, mortality rate during five years preceding the survey by
background characteristics, Madhya Pradesh
Characteristics Infant mortality rate
Sex of the baby
Male 80.2
Female 71.2
Mother's age
Below 25 80.1
25-34 68.0
35+ 72.2
Birth order
1 61.7
2 81.6
3 73.3
4+ 77.4
Education
Illiterate 87.7
0-9 years 63.8
10 & above 37.7
Caste/tribe
Schedule castes 88.6
Scheduled Tribes 92.7
Other Backward Classes 74.2
Others 47.8
Standard of living Index
Low 90.5
Medium 62.5
High 40.5
Note: Rates are specified on a per-thousand basis.
51

Child Survival and Health
Table 4
Infant mortality rates for 10 years preceding the survey by district
and sex of the child, Madhya Pradesh
District Total Male Female
Barwani 74.3 77.3 70.6
Betul 67.1 78.0 54.9
Bhopal 61.6 54.6 68.5
East Nimar 85.0 87.3 82.3
Harda 76.5 85.9 66.5
Mandla 108.4 105.4 111.4
Raisen 82.9 99.1 64.7
Rajgarh 74.4 89.1 59.1
Ratlam 64.0 60.0 68.5
Sehore 81.4 85.6 76.6
Ujjain 74.7 69.6 80.2
West Nimar 67.6 71.8 63.2
Balaghat. 97.3 76.5 116.8
Bhind 94.9 92.8 97.5
Chhatarpur 98.6 97.7 99.7
Chhindwara 86.9 87.6 86.2
Damoh 91.7 102.3 80.7
Datia 104.7 112.5 96.2
Dewas 77.8 66.5 91.2
Dhar 75.9 80.1 71.4
Dindori 89.3 98.1 80.2
Guna 101.9 106.2 97.7
Gwalior 62.0 58.1 66.6
Hoshangabad 100.4 104.7 95.5
Indore 51.4 45.4 57.5
Jabalpur 61.5 70.5 52.0
Jhabua 90.6 97.4 83.9
Katni 110.1 123.6 95.6
Mandsaur 61.2 64.7 57.9
Morena 109.9 90.0 133.7
Narsimhapur 64.8 80.1 48.2
Neemuch 60.0 59.2 60.9
Panna 123.7 130.6 116.3
Rewa 80.9 88.3 72.3
Sagar 107.6 108.9 106.0
Satna 102.0 116.7 87.1
52
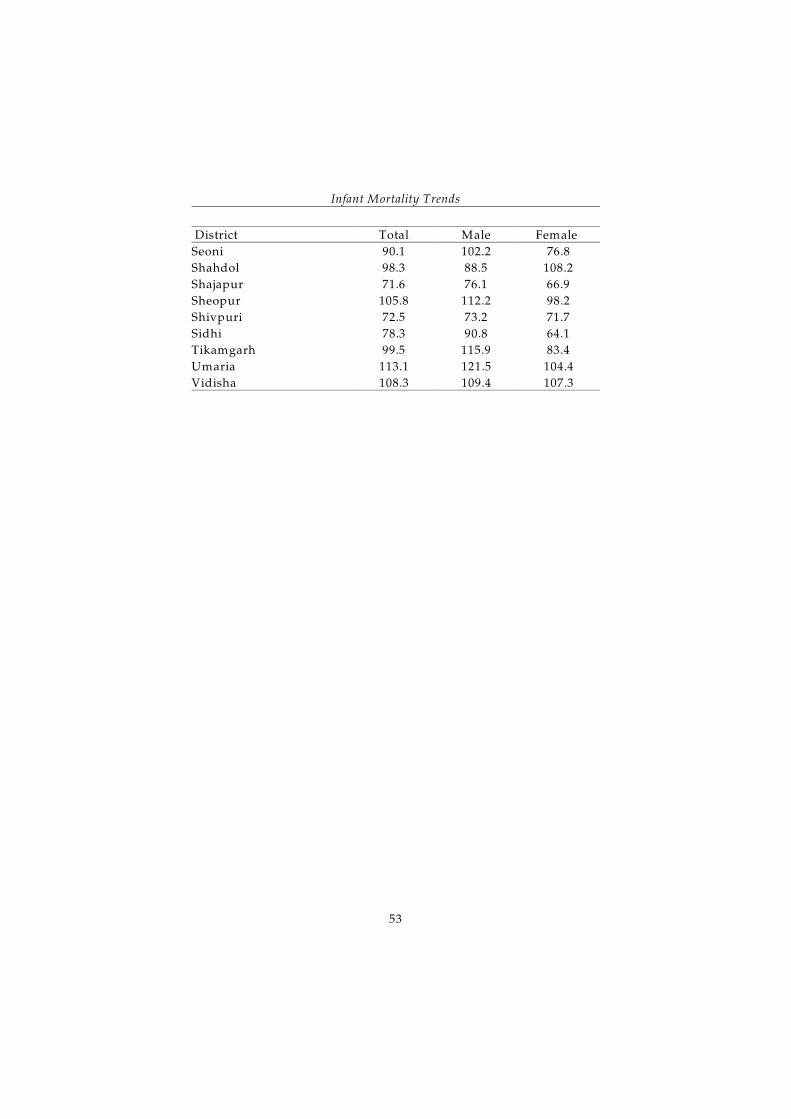
Infant Mortality Trends
District Total Male Female
Seoni 90.1 102.2 76.8
Shahdol 98.3 88.5 108.2
Shajapur 71.6 76.1 66.9
Sheopur 105.8 112.2 98.2
Shivpuri 72.5 73.2 71.7
Sidhi 78.3 90.8 64.1
Tikamgarh 99.5 115.9 83.4
Umaria 113.1 121.5 104.4
Vidisha 108.3 109.4 107.3
53

Child Survival and Health
54

Progress towards Child Survival
in Madhya Pradesh: 1981-2001
Aalok Ranjan
IntroductionMadhya Pradesh has the dubious distinction of having the lowest
probability of survival in the first five years of life among the
constituent states of India. Although, infant mortality in the state
decreased from around 145 infant deaths per 1000 live births during
1971-73 to around 74 infant deaths per 1000 live births during 2007, yet
the state has always been ranked amongst the poorest state of the
country in terms of child survival (Government of India 1999, 2008).
Persistence of very high infant and child mortality in the state has a
reflection in terms of life expectancy. During the period 1970-75, the
expectation of life at birth in Madhya Pradesh was the fourth lowest
among the major states of the country (Government of India 1999a).
However, during the period 2001-05, the expectation of life at birth in
the state was the lowest in the country (Government of India 2007). An
accelerated improvement in child survival remains a major
development challenge in Madhya Pradesh.
In this paper, we analyse progress towards child survival in
Madhya Pradesh between 1981 and 2001 through a district-based
approach. Adoption of the district-based approach is important from at
least two counts. First, inter-district diversity in almost all aspects of
social and economic development is very strong in Madhya Pradesh. It
has been argued that reducing the inter-district disparity may be an
optimal yet feasible strategy for accelerated improvement in child
survival probability in the state.
55

Child Survival and Health
The second reason for a district-based approach for analysing the
progress towards child survival is the recent emphasis on
decentralisation of the public health care delivery system in India as
articulated in the National Rural Health Mission which has recently
been launched by the Government of India to bring about architectural
corrections in the health care delivery system (Government of India
2005). One of the objectives of the Mission is the decentralisation of the
public health care delivery system so that it can effectively address the
health needs of the people. The Eleventh Five-Year Development Plan
of the Government of Madhya Pradesh also emphasises a decentralised
approach for achieving its goals one of which is the reduction in infant
and child mortality (Government of Madhya Pradesh 2007).
A district-based approach in analysing the progress towards child
survival in Madhya Pradesh is also required because of the changes in
the administrative boundaries of the state. The erstwhile state of
Madhya Pradesh that existed before 1 November 2000 was divided into
the states of Chhattisgarh and the present state of Madhya Pradesh. As
such estimates of infant and child mortality for Madhya Pradesh prior
to 1 November 2000 are not comparable to the estimates of infant and
child mortality for Madhya Pradesh that existed after 1 November 2000.
There has also been a reorganisation of the districts within the state that
has resulted in the change in the administrative boundaries of many
districts of the state. In 1981 and 1991, there were 45 districts in the
state. As the result of the reorganisation of districts in 1998, the number
of districts in the state increased to 60. However, with the division of the
erstwhile state of Madhya Pradesh into the states of Chhattisgarh and
existing Madhya Pradesh, the number of districts in the existing
Madhya Pradesh again reduced to 45, although the administrative
boundaries of these new districts were not the same as the
administrative boundaries of old districts. There are, however, 29
districts in the existing Madhya Pradesh where there has been no
change in the administrative boundaries since 1981. The analysis
presented here is therefore confined to these 29 districts. These 29
districts accounted for more than 70 per cent population of the state at
the 2001 population census.
Data SourceThe most commonly used source of data on mortality in India is the
Sample Registration System (Government of India 2008). However, the
system does not provide district level estimates of the probability of
56

Progress Towards Child Survival
survival or probability of death by age. District level estimates of child
survival probabilities are also not available either from the National
Family Health Survey or from the District Level Household Survey. The
only source of information at the district level that can be used for
estimating child survival probabilities in India is the population census.
Information about children ever born and children surviving collected
from every currently married women in the reproductive age group at
the time of the population census can be used to estimate the
probability of survival in the first year of life as well as in the first five
years of life (United Nations 1988). Using this approach, the Registrar
General of India has prepared estimates of probability of death in the
first year of life and in first five years of life on the basis of the
information available through 1981 and 1991 population census for all
districts in the country (Government of India 1997). Using the same
approach, estimates of probability of death in the first year of life and
in first five years of life have been prepared by the author on the basis
of 2001 population census for the 45 districts of Madhya Pradesh as they
existed before 1 November 2000 (Ranjan 2008). Out of these 45 districts,
there has been no change in the administrative boundaries since 1981
in 29 districts. It is therefore possible to analyse the progress towards
child survival in Madhya Pradesh by measuring the change in the child
survival probabilities in these 29 districts. These estimates constitute the
basis for the present analysis.
MethodologyThe key variable used in the present analysis is the probability of
5 0survival from birth to age 5 years ( p ) which is related to the probability
5 0of death in the first five years of life ( q ) through
5 0 5 0p = 1- q (1)
The probability of survival up to 5 years may also be written as
5 0 1 0 4 1p = p * p (2)
or
5 0 1 0 4 11- q = (1- q )*(1- q ) (3)
5 0 1 0 4 1Denoting p by u, p by I and p by c, the change in u over time can
be decomposed as
2 1 2 1 1 2 1 1 2 1 2 1Lu = u -u = (i -i )*c + (c -c )*i + (i - i )*(c - c ) (4)
The first term on the right hand side of equation (4) gives the
1 0 5 0contribution of the change in p to the change in p on the assumption
4 1that there is no change in p whereas the second term gives the
4 1 5 0contribution of the change p to the change p on the assumption that
57
Child Survival and Health
4 1there is no change in p . The third term on the right side of equation (4)
1 0is the interaction term. It takes into account simultaneous changes in p
4 1 1 0and p . Interaction effects arise because the change in p and the change
4 1 5 0in p do not add up to the change in p . Interaction effects are generally
difficult to explain (Horiuchi, Wilmoth and Pletcher 2008). They
1 0represent incomplete separation of the contribution of the change in p
4 1 5 0and the change in p to the change in p . As such, it has usually been
considered desirable to allocate them among the main effects (Das
Gupta 1993). One way is to follow the Goldfield’s rule of “allocating
interactions to various individual factors on the principle of equal
distribution of all variables involved in each interaction” (Durand 1948).
Alternatively, let
1 2c = (c + c )/2, and
1 2I = (i + i )/2,
then, it is easy to show that (Kitagawa, 1955)
2 1 2 1 2 1Lu = u -u = (i -i )*c + (c -c )*I
Lu = LI + Lc (5)
We shall be using equation (5) to analyse the contribution of the
1 0 4 1 5 0change in p and in p to the change in p .
The change in the probability of survival in different age groups
also varies by districts. This variability can be captured through the
variance of the distribution of the change in the survival probability
across the districts. It is easy to show that
Var(Lu) = Var(LI) + Var(Lc) + 2Cov(Li,Lc) (6)
where Var stands for variance and Cov stands for covariance between
the variables under consideration. This decomposition reveals how
1 0 4 1inter-district variation in the change in p and in p contribute to the
5 0inter-district variation in the change in p . This approach moves the
analysis in the direction of the causal analysis, which aims at
5 0understanding the sources of variation in p across the districts.
5 0 1 0The decomposition of the change in p into the change in p and
4 1the change in p is necessary to analyse the progress towards child
survival. The reason is that causes of death responsible for mortality in
the first year of life are radically different from causes of death that are
responsible for mortality in the age group 1-4 years. Information
available from the Registrar General of India on causes of death on the
basis of medical certification of the cause of death suggests that certain
conditions originating in the perinatal period were responsible for 67
per cent of the deaths in the age group 0-1 year in India during the year
1998. This proportion was 87 per cent in Madhya Pradesh (Government
58

Progress Towards Child Survival
of India 2003). By contrast, infectious and parasitic diseases and
diseases of the respiratory system were responsible for majority of the
deaths in the age group 1-4 years (46 per cent in India and 74 per cent
in Madhya Pradesh). The different causes of death pattern in the age
group 0-1 year as compared to the age group 1-4 years suggests that
1 0 4 1factors influencing p are different from the factors that influence p .
During the first year of life, the child is exposed to particular stresses
and hazards which are not faced by a child in the life after one year
(Wills and Waterlow 1958). During the first year of life, key factors that
influence the probability of survival are physiological factors, quality of
medical care to the mother and the child, especially during pregnancy,
at the time of delivery and immediately after delivery and a host of
social, economic and cultural attributes (Hijazi 1979). Maternal factors
such as nutritional status of the mother, parity, age at pregnancy, etc.
1 0also play a very significant role in deciding p . On the other hand, key
4 1factors that influence p are mainly acute respiratory infections,
diarrhoeal diseases, vaccine preventable diseases, especially measles
and poor nutritional status of the child (Pan American Health
Organisation 1979). Effects of poor nutritional status have been found
to be the most severe in young growing children. It has been estimated
that almost 60 per cent of deaths in children below five years of age are
due to poor nutritional status of children and its interactive effects on
diseases that can be prevented easily such as measles, acute respiratory
4 1infections, etc. Because of the very strong impact of malnutrition on p ,
4 1 4 1it has been advocated that p or, equivalently, q should always be
taken to indicate widespread malnutrition among children (Bengoa et
al 1959).
Child Survival in Madhya PradeshAlthough child survival probability in Madhya Pradesh has shown an
improving trend during the 20 years under reference, yet, it has always
remained lower than the national average. Estimates based on the
children ever born and children surviving data available through 1981,
1991 and 2001 population census support this observation (Government
5 0of India 1997, Ranjan 2008). These estimates suggest that p in Madhya
Pradesh increased from 0.803 to 0.859 between 1981 and 2001 as
compared to the increase from 0.848 to 0.903 in India. During the same
1 0period, p increased from 0.850 to 0.906 in Madhya Pradesh and from
4 10.885 to 0.931 in India while p increased from 0.945 to 0.948 in Madhya
4 1Pradesh but from 0.958 to 0.970 in India. The increase in p has however
59

Child Survival and Health
been confined to the period 1981 through 1991 as, in both Madhya
4 1Pradesh and India, p actually decreased, instead of increasing
4 1between 1991 and 2001. As the result of the increase in p , the increase
5 0in p nearly stagnated in Madhya Pradesh whereas it increased in India
during the period 1991 through 2001.
Estimates of child survival probability obtained through the
children ever born and children surviving information available
through population census suggest that, out of every 1000, 197 live born
failed to survive to their fifth birth day around the year 1981. This
number reduced to 141 around the year 2001. This means that, between
1981 and 2001, for every 1000 live born, about 56 deaths of children 0-5
years could be saved in Madhya Pradesh (Table 2). In India, by contrast,
about 55 deaths of children in the age group 0-5 years could be saved
for every 1000 live births. Among the 56 deaths saved for every 1000
live born, 50 were saved during the period 1981 through 1991. By
contrast, during the period 1991 through 2001, only about 6 deaths for
every 1000 live births could be saved. Moreover, out of the 50 under five
deaths saved for every 1000 live births in Madhya Pradesh during 1981
through 1991, about 17 or about one third were confined to the first year
of life whereas 33 or about two-third were confined to the age group 1-4
years. During the period 1991 through 2001, however, all the under-five
deaths saved were confined to the first year of life. In fact, the number
of deaths in the age group 1-4 years increased during the period
1991through 2001 as compared to the period 1981 through1991. Because
of this increase in the number of deaths in the age group 1-4 years for
every 1000 live born, the number of under five deaths saved during the
1990s decreased substantially compared to under five deaths saved
during the 1980s. Interestingly, the number of 1-4 years deaths saved
during the period 1981 through 1991 for every 1000 live births were
equal to the increase in the number of 1-4 years deaths during the
4 1period 1991-2001 as the result of the decrease in p so that there had
been neither increase nor decrease in the number of 1-4 years deaths for
every 1000 live births during the period 1981 through 2001.
5 0It may also be seen from table 2 that improvement in p during the
4 1period 1981 through 2001 was primarily due to the improvement in p .
5 0However, during the period 1991 through 2001, improvement in p was
1 0 4 1due to the improvement in p as p decreased, instead of increasing
during this period. Obviously, transition in child survival in Madhya
Pradesh had a different characterisation in the period 1981 through 1991
as compared to the period 1991 through 2001.
60

Progress Towards Child Survival
Figure 1
Trends and inter-district variations in child survival probability
Deaths in 1-4 years of age for every 1000 live births increased in
India also during the period 1991 through 2001. During the 1980s,
around 20 deaths for every 1000 live births could be saved in India as
4 1a whole as the result of the improvement in p (Table 2). However,
4 1during the period 1991 through 2001, p decreased so that the number
of deaths in the age group 1-4 years increased by around 11 for every
4 1 5 0,1000 live births. As the result of the decrease in p , p instead of
increasing, decreased marginally in the country as a whole around 2001
as compared to 1991.
Within Madhya Pradesh, level and trend in the child survival
probability varied widely across the districts. Summary measures of
5 0 1 0 4 1inter-district variation in p , p and p in Madhya Pradesh are given in
61
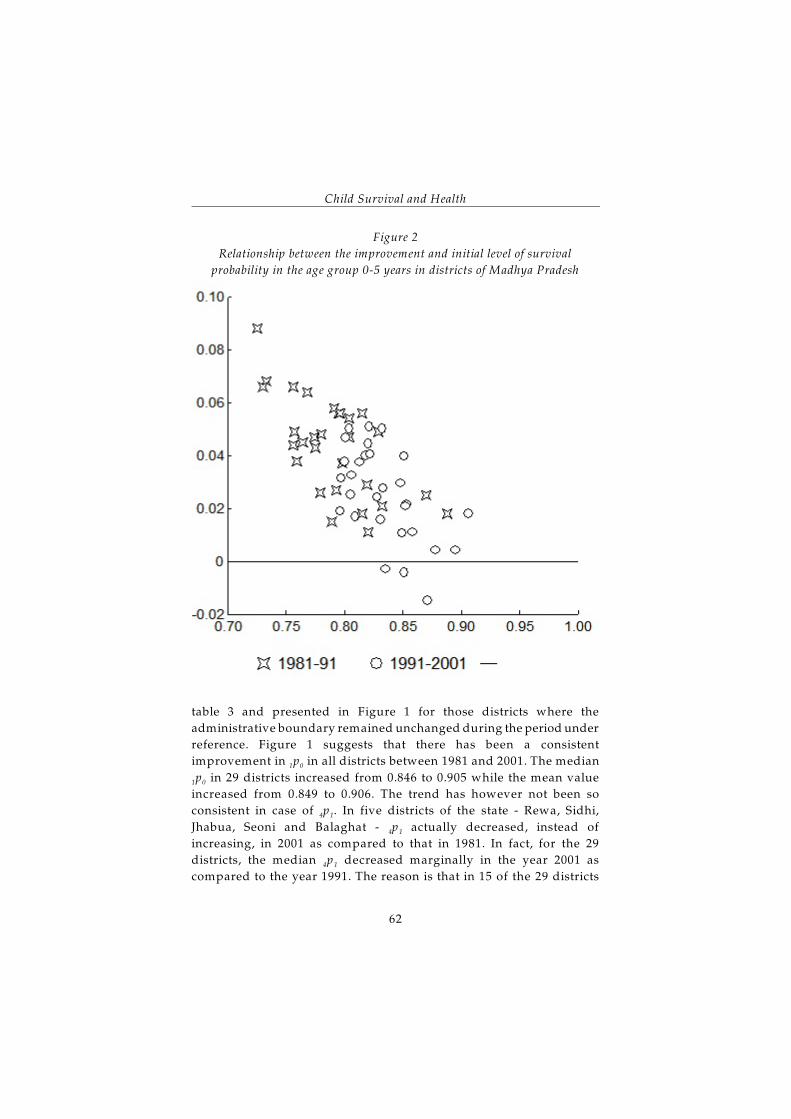
Child Survival and Health
table 3 and presented in Figure 1 for those districts where the
administrative boundary remained unchanged during the period under
reference. Figure 1 suggests that there has been a consistent
1 0improvement in p in all districts between 1981 and 2001. The median
1 0p in 29 districts increased from 0.846 to 0.905 while the mean value
increased from 0.849 to 0.906. The trend has however not been so
4 1consistent in case of p . In five districts of the state - Rewa, Sidhi,
4 1Jhabua, Seoni and Balaghat - p actually decreased, instead of
increasing, in 2001 as compared to that in 1981. In fact, for the 29
4 1districts, the median p decreased marginally in the year 2001 as
compared to the year 1991. The reason is that in 15 of the 29 districts
Figure 2
Relationship between the improvement and initial level of survival
probability in the age group 0-5 years in districts of Madhya Pradesh
62

Progress Towards Child Survival
4 1included in this analysis, p decreased during the 1990s. Because of the
4 1 5 0decrease in p , improvement in p slowed down during the period
1991-2001 compared to the period 1981-2001 in most of the districts.
The good sign, however, is that the inter-district disparity or
inequality in the three survival probabilities is reducing over time as
may be seen from decreasing values of the Gini index and coefficient of
variation (Table 3). This implies that the improvement has been faster
in districts having relatively low levels of child survival probability as
compared to districts having relatively higher level of survival
probability. This observation is supported by figure 2 which presents
5 0the increase in p during the period 1981-91 and 1991-2001 by the level
Figure 3
Relationship between the improvement and initial level of survival
probability in the age group 0-1 year in districts of Madhya Pradesh
63

Child Survival and Health
in 1981 and 1991 respectively. It is well known that mortality during
childhood can be classified into the ‘soft’ rock of childhood mortality
and the ‘hard’ rock of childhood mortality. When child survival
probability is low, most of the child deaths are due causes which
constitute the ‘soft’ rock of childhood mortality. As the child survival
probability improves, an increasing proportion of child deaths are due
to causes which constitute the ‘hard’ rock of childhood mortality. The
‘soft’ rock of childhood mortality can be eroded through low cost
appropriate technology such as immunisation and oral rehydration
therapy but eroding the ‘hard’ rock of childhood mortality requires
advanced medical technology.
Figure 4
Relationship between the improvement and initial level of survival
probability in the age group 1-4 years in districts of Madhya Pradesh
64

Progress Towards Child Survival
5 0Figure 2 also indicates that improvement in p slowed down during
the period 1991-2001 as compared to the period 1981-1991 in most of the
5 0districts. During the 1980s, p improved in all the 29 districts of the state
included in this analysis, although at varying pace. However, during
1990s, this probability decreased in three districts whereas it improved
5 0only marginally in two districts. The very fact that p remained less
than 0.900 in all but one district of the state around the year 2001
suggests that the ‘soft’ rock of under-five mortality is still quite
substantial and the state has still to go a long way to achieve levels of
child survival as articulated in the Millennium Development Goals.
What is even more concerning is the fact that despite prevailing low
levels, the pace of improvement in the probability of survival during
childhood appears to have slowed down in many districts. It appears
that existing child survival efforts in the state have not been able to
5 0 4 1maintain the pace in the improvement in p , especially in p which has
actually decreased in the state and in a number of districts during the
period 1991-2001.
The foregoing analysis suggests that improvements in the child
survival probability in the state has not been uniform. There has been
5 0considerable slowdown in the improvement in p during the 1990s as
4 1compared to the 1980s because, instead of increasing, p actually
decreased in the state as a whole and in many of its districts. Moreover,
the pace of improvement in all the three survival probabilities varied
widey across the districts. Very little is currently known about the
4 1factors and conditions that may be responsible for the increase in p in
the state as a whole and in many of its districts during the 1990s. In any
case, it appears obvious from the present analysis that the ongoing child
survival interventions and programmes have not been able to address
causes and conditions that are primarily responsible for the deaths in
children in the age group 1-4 years. It is however clear that the factors
and conditions that influence the risk of death in the first year of life are
essentially different from the factors and conditions that influence the
risk of death in 1-4 years of life.
Decomposition of the Change in Survival
Probability
1 0 4 1The contribution of the change in p and the change in p to the change
5 0in p can be measured through the decomposition analysis based on
equation (5). Results of the decomposition analysis are presented in
65

Child Survival and Health
table 4 and depicted in figures 5 through 7. For the state as a whole,
5 0almost 95 per cent improvement in p between 1981 and 2001 was the
1 0 4 1result of the improvement in p . Improvement in p accounted for just
5 0about 5 per cent of the increase in p . The contribution of the increase
1 0 4 1 5 0in p and in p to the increase in p has however been different in the
5 01980s as compared to 1990s. In the 1980s, improvement in p was
4 1largely the result of the improvement in p whereas, in the 1990s,
5 0 1 0 4 1improvement in p was the result of the improvement in p as p
decreased instead of improving during this period.
Inter-district variations in the improvement in the probability of
survival during childhood have also been found to be very strong.
Figure 5
Decomposition of the change in the probability of survival in the age group
0-5 years in districts of Madhya Pradesh during 1981-2001
66

Progress Towards Child Survival
5 0Absolute improvement in p between 1981 and 2001 ranged from 0.126
to 0.027 across the districts. In four districts the improvement was more
than 0.100 whereas in 8 districts it was less than 0.050. Moreover, in
5 0most of the districts, at least two-third of the improvement in p was the
1 0result of the improvement in p . The decomposition analysis also
4 1confirms that, compared to the period 1981-91, p decreased during
1991-2001 not only in the state but also in most of its districts.
5 0The inter-district variability in the change in p can be explained in
1 0terms of the inter-district variability in the change in p and inter-
4 1district variability in the change in p . It may be seen from table 5 that
1 0inter-district variability in the change in p and inter-district variability
Figure 6
Decomposition of the change in the probability of survival in the age group
0-5 years in the districts of Madhya Pradesh during 1981-91
67

Child Survival and Health
4 1in the change in p contributed almost equally to the inter-district
5 0variability in the change p . During the period 1981-91, however, inter-
5 0district variability in the change in p was largely the result of inter-
4 1district variability in the change in p but, during the period 1991-2001,
5 0the inter-district variability in the change in p was the result of inter-
1 0district variability in the change in p .
1 0The decomposition analysis also reveals that, in general, p
improved in the state and in most of the districts except in district
Bhopal during the 1980s and Ujjain, Jhabua and Vidisha districts,
1 0during the 1990s. Reasons for the increase in p in these districts are not
known. However, it appears that the consistency in child survival
Figure 7
Decomposition of the change in the probability of survival in the age group
0-5 years in the districts of Madhya Pradesh during 1991-2001
68

Progress Towards Child Survival
efforts over time as well as across the districts is lacking in the state.
1 0Among the districts where p increased either during 1981-91 or during
1991-2001, Bhopal and Ujjain are regarded as comparatively better
developed districts with a high proportion of urban population, better
literacy levels and a high concentration of health care facilities,
especially private health care facilities. On the other hand, Jhabua and
Vidisha districts are amongst the most poorly developed districts with
low urbanisation, very low level of literacy and near absence of private
health care delivery institutions. Similarly, some of the districts where
4 1p increased either during 1981-1991 or during 1991-2001 are relatively
better developed districts whereas other are relatively poorly developed
ones. Obviously, the level of social and economic development in the
district may not be the only factor in deciding the levels and trends in
child survival probability across the districts. Unfortunately, there has
been little systematic attempt to explore the factors that explain the
inter-district variations in child survival probability in the state.
Child Survival PoliciesThe pattern of transition in child survival in Madhya Pradesh,
highlighted above, is a reflection of child survival policies adopted by
the Government of India and implemented by the Government of
Madhya Pradesh. Health and survival of children has been a priority
development issue in India even before Independence. The First Health
Survey and Development Committee constituted during the colonial
rule has devoted one full chapter on health services for mothers and
children and another chapter on health services for school children
(Government of India 1946). The Committee recommended that all new
born should be kept under observation for up to five years and their
weight and progress records should be kept in order to ensure their
survival, growth and development. After Independence, concern for
child survival and health at the policy level is reflected in all Five-year
Development Plans. However, issues related to child survival and
health were always tagged with issues related to the health of the
mother. A prophylaxis schemes was also launched during the 4th Five-
year Development Plan to combat nutritional anaemia among pregnant
and lactating women as well as children up to five years of age, and
prophylaxis against blindness due to vitamin-A deficiency among
children under 5 years of age. In the Fifth Five-year Development Plan
(1974-78), child survival and health became a component of the
Minimum Needs Programme of the Government of India along with
69

Child Survival and Health
family planning activities. A pilot programme was also launched during
the Seventh Five-year Development Plan period for the control of acute
respiratory infections, primarily pneumonia, through standard case
management practices by paramedical workers.
The real push to child survival efforts in India was given in 1975
when Integrated Child Development Services were launched. The
Scheme primarily focussed on weight recording of children and
nutrition supplementation to all children who were found to be low
weight for age (Government of India, 1975). Subsequently, the
Expanded Programme of Immunisation was launched in 1978 which
dealt specifically with the disease conditions of children 0-6 years of age
and focussed on reducing morbidity and mortality in children through
immunisation against vaccine preventable diseases - Diphtheria,
Pertussis, Tetanus, Poliomyelitis, childhood tuberculosis and typhoid.
The goal was to provide immunisation services to all eligible children
and women by 1990 (Sokhey, Kim-farley, Bhargava 1989). The
Expanded Programme of Immunisation was replaced by the Universal
Immunisation Programme in 1985 which aimed at providing high
quality immunisation services to all communities in order to prevent
mortality, morbidity and disability from diseases that are preventable
through the optimum use of vaccines that are currently available and
vaccines that become available from time to time. In addition, the Oral
Rehydration Therapy Programme was also launched in the year 1986-87
for reducing mortality due to dehydration caused by diarrhoea among
children.
As the result of these programmes and interventions, there has been
4 1a marked improvement in p as revealed through the present analysis.
1 0 4 1Improvement in p was however not as sharp as p because many of
these interventions were directed towards children 1-4 years of age.
1 0They had only a limited impact on p as they were not designed to
effectively address the factors that contribute to the risk of death during
infancy, especially factors related to pregnancy and child birth with the
1 0 4 1result that the gains in p were not as remarkable as the gains in p .
The Universal Immunisation Programme and other child survival
interventions introduced during the 1980s got subsumed in the Child
Survival and Safe Motherhood Programme launched in the year 1992.
Although, child survival and health remained one of the key
components of this new programme, yet the emphasis was clearly on
meeting the reproductive health needs of the people. This shift became
more evident and more dominating when the Child Survival and Safe
70

Progress Towards Child Survival
Motherhood Programme was replaced by the Reproductive and Child
Health Programme in 1997, although there had been little change in
programme objectives and programme goals. Child survival continued
to be one of the important interventions of the programme but the shift
in the programme implementation strategy towards reproductive
health including neonatal care at the cost of child survival interventions
4 1appears to have resulted in a decrease in p in India as well as in
Madhya Pradesh and the resulting decrease in India and near
stagnation in Madhya Pradesh in the probability of survival in the age
group 0-5 years.
Current child survival efforts in Madhya Pradesh are organised
under the reproductive and child health component of the National
Rural Health Mission which was launched by the Government of India
in the year 2007. The Mission aims at architectural corrections in the
public health care delivery system. One of the goals of the Mission is the
reduction in the infant mortality rate. The Mission is however silent
about the risk of death in the age group 1-4 years. Similarly, the XI Five-
year Development Plan of Madhya Pradesh aims at reducing the infant
mortality rate to 40 infant deaths per 1000 live births but there is no
reference to mortality in children 1-4 years of age (Government of
Madhya Pradesh 2007). The National Population Policy, announced in
the year 2000, does not have any reference to mortality in children 1-4
years of age (Government of India 2000).
The unacceptably high levels of the risk of death in children aged
1-4 years and the increase in this risk in many districts of the state
appears to be a reflection of the poor nutritional status of children. It is
argued that mortality in children 1-4 years of age is high in populations
where post weaning nutrition is poor (Le Gros Clark 1951). On the basis
of the relationship between the risk of death and the nutritional status
of children aged 1-4 years, it is also argued that mortality in 1-4 years of
age can be equated to some extent with under nutrition in early
childhood and the death rate in the age group 1-4 years may be treated
as an index of under nutrition among children (Wharton 1971, Wills and
Waterlow 1958). It has also been estimated that nearly 60 per cent of
deaths in children under 5 years are due to under nutrition and its
interactive effects on preventable diseases like diarrhoea and
pneumonia. Most of these deaths are confined to the age group 1-4
years as effects of poor nutrition are the most severe in young growing
children.
71

Child Survival and Health
4 1The decrease in p , in the context of the above arguments suggest
that the prevalence of malnutrition in children below 5 years of age in
Madhya Pradesh and in Many districts of the state has increased over
time. This conjecture is supported by the information available through
the National Family Health Survey according to which, the proportion
of low weight for age children in the state increased from around 51.1
per cent in 1992 to almost 58 per cent in 2005-06 (International Institute
for Population Sciences 1995, 2007). The National Family Health Survey
also suggests that more than 60 per cent of the children aged 1-4 years
were low weight for age.
The state response to the problem of malnutrition in children below
five years of age has been in the form of Bal Sanjivani Campaign
(Government of Madhya Pradesh 2009). Launched in the year 2001, the
Bal Sanjivani Campaign essentially comprised of weighing of all
children below five years of age and grading of children according to
their nutritional status on the basis of Gomez scale. The severely
malnourished children identified through the campaign or otherwise
were given a rehabilitation package comprising of hospitalisation for a
period of 14 days. Nutrition Rehabilitation Centres have been
established in the public health care delivery institutions for the
purpose. However, there is no intervention for children with mild and
moderate grade malnutrition.
Since 2001, twelve Bal Sanjivani campaigns have been organised
throughout the state and it is claimed that the Campaign has resulted
in a significant decrease in the prevalence of low weight for age
children. However, results of the Bal Sanjivani campaign do not conform
to the findings of the National Family Health Survey which suggests
that the prevalence of low weight for age children in the state has
increased between 1998-99 and 2005-06. There are some serious
concerns about the quality of data on nutritional status of children
available through the Bal Sanjivani campaign. A process evaluation of
the campaign carried out in 2004 reported that one third of the
Aanganwadi workers were not able to identify the nutritional grade of
the child and 30 per cent were not having the record of the weight of
children who were not enrolled at the Aanganwadi centre (Government
of Madhya Pradesh 2004). Although, Bal Sanjivani campaign was
designed to increase the awareness of the community about nutritional
status of children and how to monitor the normal growth of the child,
yet, there have been little substantial efforts to address the issue other
than hospitalisation of children with severe under nutrition. There has
72

Progress Towards Child Survival
also been little followup of those severe under nourished children who
were discharged from hospitals/nutritional rehabilitation centres.
One of the major drawbacks of the official approach towards child
survival in India and in Madhya Pradesh is that child survival efforts
have not been designed, planned and implemented in the context of the
disease burden in children. Rather, they have increasingly been driven
by the medical technology and associated supply side push and
implemented in a normative manner (Madhvi, 2003). There is little
empirical evidence in India and in Madhya Pradesh about the pattern
of morbidity and mortality in children that may constitute the basis for
child survival efforts. Epidemiological considerations such as
prevalence rates of common childhood illnesses and causes of child
deaths are simply not available. Since, morbidity and mortality in
childhood is strongly conditioned by local conditions, it is imperative
that this information must be available at the grass roots level so that
the local context of child survival is imbedded into child survival
efforts. However, there has hardly been any noteworthy attempt in this
direction. The only source of information for estimating child mortality
below the state level continues to be the information on children ever
born and children surviving collected during the decennial population
census. Even this information is available up to the district level only.
Below the district level, no information on child mortality is available.
On the other hand, there is hardly any information about childhood
morbidity even at the state level that may constitute the basis for child
survival and child health interventions.
Another concern is that there is no mechanism to measure the
impact of child survival efforts on morbidity, disease burden and
mortality of children. Performance of child survival efforts is generally
measured in terms of output indicators like coverage rates of different
child survival interventions but the link between output indicators and
the impact indicators remains ill-defined, especially at the grass roots
level - the interface with the people - primarily because information
related to morbidity and mortality among children is missing.
It is obvious that policies and programmes towards child survival
and health in the state needs reinvigoration in view of the fact that the
risk of death in the age group 1-4 years continues to be unacceptably
high and appears to have increased over time. Since, both levels and
trends in child survival probability varies widely across the districts, a
decentralised, district based approach is required to plan for child
survival and child health interventions which may be extended right up
73
Child Survival and Health
to the village level in due course of time. This is a tall order as the
district level capacity to organise these efforts does not exist at present.
Building a reliable and efficient child survival and child health
information system, especially at the district level appears to be the key
to reinvigorate child survival efforts and to accelerate the improvement
in the child survival probability in the state. This will ensure evidence-
based planning for child survival and an objective assessment of the
impact of child survival interventions. There is, however, little initiative
in this direction.
ConclusionsThe analysis presented here suggests that the progress towards child
survival in Madhya Pradesh does not appear to be satisfactory in the
context of either the Millennium Development Goals or XI Five-year
Development Plan objectives. There has been improvement in the
survival probability in the first year of life but improvement in survival
probability in the age group 1-4 years has faltered so that improvement
in the child survival probability in the age group 0-5 years almost
stagnated in Madhya Pradesh during the 1990s. The decrease in the
survival probability in children aged 1-4 years suggests an increase in
the prevalence of malnutrition in children, an observation which is also
supported by the information available from other sources. It is in this
context that the current policies and programmes directed towards
survival of children in the state need to be revisited. It is important that
child survival policies and programmes are designed in the broader
development context and improvements in the quality of life and not in
the narrow perspective of health imperative that is the case at present.
Child survival needs to be viewed as perhaps the most sensitive
indicator of social and economic development and the quality of life.
Improving the survival chances of the new born is not only a human
rights imperative but also a sound economic decision.
ReferencesBengoa JM, Jelliffe DB, Perez C (1959) Some Indicators for a Broad
Assessment of the Magnitude of Protein-Calorie Malnutrition in
Young Children in Population Groups. America Journal of Clinical
Nutrition, 7:714-720.
Das Gupta P (1993) Standardization and Decomposition of Rates. A User’s
Manual. Washington DC, US Bureau of the Census.
74

Progress Towards Child Survival
Durand JD (1948) The Labor Force in the United States: 1890-1960.
Appendix B: Methods of Analyzing Factors of Labor Force Change. New
York, Social Science Research Council.
Government of India (1946) Report of the Health Survey and Development
Committee. Delhi, Manager of Publications.
Government of India (1984) SRS Based Abridged Life Tables 1970-75. New
Delhi, Office of the Registrar General, India. Occasional Paper 1 of
1984.
Government of India (1997) District Level Estimates of Fertility and Child
Mortality for 1991 and their Inter Relations with other Variables. New
Delhi, Registrar General, India. Occasional Paper No. 1 of 1997.
Government of India (1999) Compendium of India’s Fertility and Mortality
Indicators 1971-97 based on The Sample Registration System. New
Delhi, Registrar General.
Government of India (2000) National Population Policy. New Delhi,
Ministry of Health and Family Welfare.
Government of India (2003) Medical Certification of Causes of Death 1998.
New Delhi, Registrar General.
Government of India (2005) National Rural Health Mission. New Delhi,
Ministry of Health and Family Welfare.
Government of India (2007) SRS based Abridged Life Tables 2001-05. New
Delhi, Registrar General.
Government of India (2008) Sample Registration Bulletin 43(1). New
Delhi, Registrar General.
Government of Madhya Pradesh (2004) Bal Sanjeevani: An impetus to
the prevention and reduction of malnutrition in Madhya Pradesh.
Bhopal, RCVP Noronha Academy of Administration and
Management. Women Resource Centre.
Government of Madhya Pradesh (2007) Eleventh Five Year Plan 2007-
2012. Bhopal, State Planning Commission.
Government of M adhya Pradesh (2009) Bal Sanjivani.
www.mpwcd.nic.in/Balsanjivani.htm. Accessed on 22 July 2009.
Hijazi SS (1979) Mortality patterns in infant and young children in rural
Amman. Journal of Tropical Pediatrics, 26(6): 165-167.
Horiuchi S, Wilmoth JR, Pletcher SD (2002) A decomposition method
based on a model of continuous change. Demography 45:785-601.
International Institute for Population Sciences (1995) National Family
Health Survey (MCH and Family Planning) Madhya Pradesh 1992.
Mumbai, International Institute for Population Sciences.
75

Child Survival and Health
International Institute for Population Sciences (2001) National Family
Health Survey, India 1998-99: Madhya Pradesh. Mumbai, International
Institute for Population Sciences.
International Institute for Population Sciences (2008) National Family
Health Survey (NFHS-3), India, 2005-06: Madhya Pradesh. Mumbai,
International Institute for Population Sciences.
Kitagawa EM (1955) Components of a difference between two rates.
Journal of the American Statistical Association, 50:1168-94.
Le Gros Clark F (1951) Four Thousand Million Mouths. Scientific
Humanism and the Shadow of World Hunger. London, Oxford
University Press.
Madhvi Y (2003) Manufacture of consent? Hepatitis B vaccination.
Economic and Political Weekly, June 14: 2417-24.
Pan American Health Organisation (1979) Mortality in Children in 1-4
years of Age in the Americas. Epidemiological Bulletin, 4(2):1-4.
Ranjan, Aalok (2008) District level estimates of child mortality in
Madhya Pradesh. Based on 2001 population census. Datia, Shyam
Institute.
Sokhey J, Kim-Farley RJ, Bhargava I (1989) The expanded programme
of immunization. A decade of progress in India. Annals of Tropical
Paediatrics, 9(1): 24-29.
United Nations (1988) Manual X: Indirect Techniques of Demographic
Estimation. New York, United Nations.
Wharton BA (1971) The mortality of malnutrition in early childhood.
Journal of Tropical Pediatrics, 17(Suppl): 17-24.
Wills VG, Waterlow JC (1958) The death rate in the age group 1-4 years
as an index of malnutrition. Journal of Tropical Pediatrics, 3(4): 167-
170.
76

Progress Towards Child Survival
Table 1
Survival probability in different age groups of the childhood period
in Madhya Pradesh and India.
Year Madhya Pradesh India
1981 1991 2001 1981 1991 2001
5 0p 0.803 0.853 0.859 0.848 0.906 0.903
1 0p 0.85 0.867 0.906 0.885 0.923 0.931
4 1p 0.945 0.984 0.948 0.958 0.982 0.97
Source: Government of India (1997) and Ranjan (2008)
Remarks: Estimates for the year 1981 and 1991 are for undivided
Madhya Pradesh whereas estimates for the year 2001
are for the existing Madhya Pradesh.
Table 2
Distribution of under-five deaths (for every 1000 live births) in
Madhya Pradesh and India by age
Age
group
(years)
Madhya Pradesh India
Number of deaths
for every 1000 live
births
Number
of deaths
saved for
every
1000 live
births
between
1981 and
2001
Number of
deaths for every
1000 live births
Number
of deaths
saved for
every
1000 live
births
between
1981 and
2001
1981 1991 2001 1981 1991 2001
39813 150 133 94 56 115 77 69 46
39816 47 14 47 0 37 17 28 9
39817 197 147 141 56 152 94 97 55
Source: Author’s calculations.
77

Child Survival and Health
Table 3
1 0 4 1 5 0Estimates of p , p and p in districts of Madhya Pradesh, 1981, 1991
and 2001
1 0 4 1 5 0Districts p p p
1981 1991 2001 1981 1991 2001 1981 1991 2001
Bhind 0.871 0.895 0.924 0.913 0.951 0.964 0.795 0.851 0.891
Shivpuri 0.821 0.880 0.894 0.921 0.909 0.937 0.756 0.800 0.838Guna 0.850 0.876 0.890 0.916 0.919 0.933 0.779 0.805 0.830
Tikamgarh 0.805 0.858 0.901 0.901 0.948 0.944 0.725 0.813 0.851Chhatarpur 0.818 0.864 0.900 0.896 0.927 0.942 0.733 0.801 0.848
Panna 0.815 0.868 0.882 0.896 0.917 0.924 0.730 0.796 0.815Sagar 0.836 0.862 0.902 0.933 0.961 0.945 0.780 0.828 0.852
Damoh 0.811 0.834 0.895 0.933 0.966 0.937 0.757 0.806 0.839Satna 0.819 0.858 0.889 0.927 0.929 0.932 0.759 0.797 0.829
Rewa 0.827 0.851 0.903 0.954 0.945 0.946 0.789 0.804 0.854Sidhi 0.839 0.889 0.891 0.951 0.939 0.934 0.798 0.835 0.832
Ratlam 0.857 0.872 0.899 0.938 0.976 0.942 0.804 0.851 0.847Ujjain 0.894 0.923 0.915 0.931 0.924 0.956 0.832 0.853 0.875
Shajapur 0.851 0.884 0.919 0.902 0.941 0.960 0.768 0.832 0.882Dewas 0.881 0.903 0.904 0.925 0.965 0.947 0.815 0.871 0.856Jhabua 0.856 0.908 0.899 0.958 0.915 0.942 0.820 0.831 0.847Dhar 0.884 0.901 0.919 0.938 0.974 0.960 0.829 0.878 0.882
Indore 0.916 0.929 0.944 0.969 0.975 0.979 0.888 0.906 0.924East Nimar 0.839 0.871 0.906 0.943 0.975 0.949 0.791 0.849 0.860
Rajgarh 0.830 0.875 0.905 0.934 0.935 0.948 0.775 0.818 0.858Vidisha 0.856 0.893 0.888 0.893 0.906 0.930 0.764 0.809 0.826
Bhopal 0.909 0.906 0.929 0.957 0.988 0.968 0.870 0.895 0.899Sehore 0.854 0.875 0.908 0.885 0.939 0.950 0.756 0.822 0.863
Raisen 0.843 0.859 0.913 0.918 0.956 0.955 0.774 0.821 0.872Betul 0.842 0.854 0.909 0.942 0.960 0.951 0.793 0.820 0.864
Narsimhapur 0.838 0.880 0.914 0.950 0.968 0.955 0.796 0.852 0.873Chhindwara 0.862 0.881 0.911 0.933 0.974 0.954 0.804 0.858 0.869
Seoni 0.851 0.874 0.916 0.962 0.970 0.958 0.819 0.848 0.878Balaghat 0.846 0.859 0.907 0.963 0.970 0.949 0.815 0.833 0.861
Gini Index 0.018 0.014 0.008 0.014 0.014 0.007 0.026 0.019 0.015CV (x1000) 0.04 0.02 0 0.02 0.02 0 0.11 0.04 0.03
Source: Government of India (1997), Ranjan (2008)
78

Progress Towards Child Survival
Table 4
5 0 1 0 4 4Decomposition of the change in p into the change in p and p in
districts of Madhya Pradesh, 1981 through 2001
District 1981-91 1991-2001 1981-2001
Lu LI Lc Lu LI Lc Lu LI Lc
Bhind 0.06 0.022 0.034 0.040 0.028 0.012 0.096 0.05 0.046
Shivpuri 0.044 0.054 -0.010 0.038 0.013 0.025 0.082 0.068 0.014Guna 0.026 0.024 0.002 0.025 0.013 0.012 0.051 0.037 0.014
Tikamgarh 0.088 0.049 0.039 0.038 0.041 -0.003 0.126 0.089 0.037Chhatarpur 0.068 0.042 0.026 0.047 0.034 0.013 0.115 0.075 0.039
Panna 0.066 0.048 0.018 0.019 0.013 0.006 0.085 0.061 0.024Sagar 0.048 0.025 0.023 0.024 0.038 -0.014 0.072 0.062 0.010
Damoh 0.049 0.022 0.027 0.033 0.058 -0.025 0.082 0.079 0.003Satna 0.038 0.036 0.002 0.032 0.029 0.003 0.070 0.065 0.004
Rewa 0.015 0.023 -0.008 0.050 0.049 0.001 0.065 0.072 -0.007Sidhi 0.037 0.047 -0.010 -0.003 0.002 -0.005 0.034 0.049 -0.015
Ratlam 0.047 0.014 0.033 -0.004 0.026 -0.030 0.043 0.039 0.003Ujjain 0.021 0.027 -0.006 0.022 -0.008 0.029 0.043 0.020 0.023
Shajapur 0.064 0.030 0.034 0.050 0.033 0.017 0.114 0.063 0.051Dewas 0.056 0.021 0.035 -0.015 0.001 -0.016 0.041 0.022 0.020Jhabua 0.011 0.049 -0.038 0.016 -0.008 0.024 0.027 0.041 -0.014Dhar 0.049 0.016 0.033 0.004 0.017 -0.013 0.053 0.033 0.020
Indore 0.018 0.013 0.005 0.018 0.015 0.004 0.036 0.027 0.009East Nimar 0.058 0.031 0.027 0.011 0.034 -0.023 0.069 0.063 0.005
Rajgarh 0.043 0.042 0.001 0.040 0.028 0.012 0.083 0.071 0.012Vidisha 0.045 0.033 0.012 0.017 -0.005 0.021 0.062 0.029 0.033
Bhopal 0.025 -0.003 0.028 0.004 0.022 -0.018 0.029 0.019 0.010Sehore 0.066 0.019 0.047 0.041 0.031 0.009 0.107 0.050 0.057
Raisen 0.047 0.015 0.032 0.051 0.052 -0.001 0.098 0.066 0.032Betul 0.027 0.011 0.016 0.044 0.053 -0.008 0.071 0.063 0.008
Narsimhapur 0.056 0.040 0.016 0.021 0.033 -0.012 0.077 0.072 0.004Chhindwara 0.054 0.018 0.036 0.011 0.029 -0.018 0.065 0.046 0.019
Seoni 0.029 0.022 0.007 0.030 0.040 -0.011 0.059 0.062 -0.004Balaghat 0.018 0.013 0.005 0.028 0.046 -0.02 0.05 0.058 -0.013
Source: Author’s calculations.
79

Child Survival and Health
Table 5
5 0Decomposition of inter-district variation in the change in p into
1 0 4 1inter-district variation in the change in p and the change in p in
Madhya Pradesh
Inter-district
variation
1981-91 1991-2001 1981-2001
Var (Lu) 0.000337 0.000261 0.000698
Var (LI) 0.000361 0.000299 0.000348
Var (Lc) 0.000191 0.000322 0.000344
Cov(LI, Lc) -0.000108 -0.000142 0.000003
Source: Author’s calculations
80

Progress of Child Survival Efforts
in Districts of Madhya Pradesh
Aalok RanjanArunanand Murmu
IntroductionThe purpose of this paper is to measure the progress of child survival
efforts in districts of Madhya Pradesh. It is well known that infant and
child mortality can be reduced substantially just by ensuring that
proven interventions are delivered to all children and mothers who
need them (Jones et al 2003). It has been estimated that nearly two-third
of the global under-five child deaths can be prevented just by achieving
universal coverage of selected low cost interventions such as breast
feeding, oral rehydration therapy, immunisation against vaccine
preventable diseases, proper spacing between successive births, proper
complimentary feeding, etc. Application of this approach to India
suggests that in a state like Madhya Pradesh where child survival
continues to be alarmingly poor, more than 70 per cent of the deaths in
children below 5 years of age can be prevented through these low cost
interventions (Jones, Schultink and Babille 2006). What is important for
the success of these interventions is that these interventions can be
delivered at the household level. These interventions limited external
material or technical inputs so that child survival remains essentially a
low cost, affordable to all, affair. The critical issue in this approach
towards child survival is the universalisation of these low cost
interventions. In India, these interventions are implemented through
the Reproductive and Child Health Programme which is the lead
programme of the National Rural Health Mission launched in the year
2005 (Government of India 2005).
81

Child Survival and Health
Madhya Pradesh is one of those states of India where the risk of
death during childhood has remained amongst the highest in the
country currently as well as in the past. Although, infant and child
mortality rates are declining in the state, yet, there is a need to
accelerate the decline by scaling up such interventions like
immunisation, use of oral rehydration salt, practice of family planning
methods, etc. At present, coverage of these interventions is well below
the desired level and there is ample scope for improvement. An analysis
of the progress towards scaling up of these interventions is therefore
necessary through the programme perspective. Since infant and child
mortality rates in Madhya Pradesh vary widely across its constituent
districts, it is obvious that such an analysis needs to be carried out at the
district level.
It may however be emphasised that child survival efforts are not the
only determinants of infant and child mortality. There are a host of
social, cultural, economic and environmental factors which also
influence the risk of death during infancy and childhood. Many of these
factors are beyond the control of programme managers. The importance
of child survival efforts, however, lies in the fact that they are subject to
managerial control and most of these efforts do not require advanced
medical technology or an advanced level of social and economic
development for there successful and effective implementation.
Data and MethodologyThe analysis is based on the data related to selected indicators of child
survival efforts available through the District Level Household Survey
2002-04 and 2007-08 initiated by the Government of India in 1997 to
provide district level estimates of selected health indicators to assist
policy makers and programme managers in decentralised planning,
monitoring and evaluation. The first district level household survey was
carried out in 1998-99. Since then, the survey has been repeated in 2002-
04 and 2007-08. Incidently, this survey is the only source of information
about key health related indicators at the district level. A comparison of
the estimates based on 2002-04 survey with that carried out in 2007-08
provides an idea about the progress of child survival efforts in the
districts of the state. In Madhya Pradesh, the 2002-04 survey covered
46,413 households whereas in the 2007-08 round, 51,419 households
were covered which were distributed across all the districts as they
existed at the 2001 population census. In each district, approximately
1000-1100 households were selected through a multi stage sampling
82

Progress of Child Survival Efforts
scheme to collect information related to key indicators of reproductive
and child health.
The methodology of measuring and analysis the progress of child
survival efforts comprised of measuring the change in the level of
selected indicators of child survival efforts between 2002-04 and 2007-
08. The analysis focusses on the following five most common
interventions for preventing child deaths:
• Care of the mother during pregnancy.
• Care at the time of delivery.
• Immunisation against vaccine preventable diseases
• Family planning
• Oral rehydration therapy for prevent deaths due to dehydration
during diarrhea
In order to measure the progress in terms of the above five
interventions, we have used the following nine indicators for which
information is available through 2002-04 and 2007-08 rounds of district
level household survey:
1. Proportion of mothers who had at least three antenatal check-up
(ANC)
2. Proportion of institutional deliveries (DEL)
3. Proportion of children 12-23 months of age fully immunised (IMM)
4. Prevalence of IUD (IUD)
5. Prevalence of Pill (PIL)
6. Prevalence of Condom (CON)
7. Prevalence of female sterilisation (FST)
8. Prevalence of male sterilisation (MST)
6. Proportion of child used ORS at the time of diarrhoea. (ORS)
ResultsFigure 1 shows the inter-district variations in the level of achievement
in Madhya Pradesh in terms of the nine variables used in the analysis
for the period 2002-04 and 2007-08. It may be seen from the figure that
the level of achievement varies widely not only across the districts of
the state but also in terms of different indicators used in the analysis.
More specifically, achievement remains abysmally poor in case of
spacing methods of family planning which, the use of which ensures
proper spacing between successive births, a critical intervention for
preventing child deaths. It is also clear from the figure that the goal of
universalisation of key interventions directed towards improving child
survival still remains elusive in all but a few districts of the state.
83

Child Survival and Health
Obviously, there is very substantial scope of scaling up these
interventions. There is every likelihood that scaling up of these
interventions will contribute to an accelerated reduction in infant and
child mortality in the state.
Another discerning feature of the figure 1 is that the improvement
in different indicators used in the analysis has not been uniform.
Improvement appears to be the maximum in case of institutional
deliveries whereas in case of the prevalence of IUD and pill, there has
actual been a decrease in the prevalence. On the other hand, there has
been virtually no increase in the prevalence of condoms while the
prevalence of male sterilisation has increased only marginally between
2002-04 and 2007-08, according to the information available through the
district level household survey. Obviously, progress of child survival
efforts in the districts of the state has not been uniform.
Another important observation of the figure 1 is that with the
increase in the level of achievement, the inter-district variability in the
Figure 1
Inter-district variations in selected indicators
related to child survival in Madhya Pradesh
84

Progress of Child Survival Efforts
level of achievement has also increased. This means that in some
districts, progress of child survival efforts has been relatively faster
while other districts appear to have lagged behind because of slower
than expected progress. For example, during the period 2002-04, the
proportion of institutional deliveries ranged from less than 15 per cent
in district Shahdol to almost 66 per cent in district Indore. However,
during the period 2007-08, it ranged from just around 13 per cent in
district Dindori to almost 80 per cent in district Indore. An increase in
the inter-district variability in the performance of other indicators
related to child survival may also be seen from figure1. These
observations are also supported by the summary measures of inter-
district variation in the achievement of selected child survival efforts
which are presented in table 1 for the total population and in table 2 for
the rural population. Moreover, in case of some of the indicators, the
coefficient of variation - an indicator of inter-district inequality in the
level of achievement - has increased over time whereas it has decreased
in others. This means that in some of the dimensions of child survival,
the achievement inequality across the districts of the state has decreased
while in other dimensions, it has increased over time. Obviously,
progress of child survival efforts in the state has not been uniform
across the districts as well as across different indicators.
The district level household survey provides information about
selected indicators related to child survival for the rural areas also.
Inter-district variations in selected indicators of related to child survival
in the rural areas are presented in figure 2. It is clear from the figure that
levels, trends and inter-district variations in nine indicators in the rural
areas are very much similar to that in the total population. Most
importantly, the change in terms of the proportion of women who had
at least three antenatal check up during their last pregnancy has been
disturbing. The median value of this proportion has decreased but the
range and the inter-quartile range has increased over time. As the
result, the inter-district inequality in antenatal coverage in the rural
areas of the state has increased.
In view of the fact that not only the level but also the improvement
in the nine indicators used in the analysis vary widely across the
districts, we have made an attempt to combine the indicators by
applying the factor analysis procedure. Application of the factor
analysis procedure suggests that the nine variables can be grouped into
four factors in the total as well as in the rural population. In the total
population, the four factors accounted for more than 63 per cent of the
85

Child Survival and Health
total variation in the original data set whereas in the rural population,
the four factors explained more than 66 per cent of the total variation.
The variables having significantly high loadings in each factor are
shown in table 3. It may be seen from the table that the factor structure
is not the same in the total population and in the rural population,
although the difference in the structure is only marginal. In any case,
table 3 suggests that the four factors broadly represent the four
dimensions of child survival efforts. The first factor is related to efforts
focussed on delivery and infancy. This factor essentially reflects the
state of institution-based services. The second factor is related to birth
spacing which has a direct relevance to child survival and which
primarily reflects the progress of extension or community-based
services. The third factor, on the other hand, is related to birth limitation
which reflects the progress of camp-based services. Finally, the fourth
factor is related to the use of oral rehydration therapy to combat deaths
due to dehydration during diarrhoea which are basically related to
Figure 2
Inter-district variations in selected indicators
related to child survival in Madhya Pradesh (Rural)
86

Progress of Child Survival Efforts
services available at grass-roots level primary health care institutions -
primary health centres and sub-health centres. In any case, the factor
analysis solution suggests that child survival efforts are essentially
multidimensional. As such, the progress of child survival efforts should
be analysed in the context of these four factors.
The factor analysis solution also provided factors scores for each of
the 45 districts of the state for each of the four factors extracted through
the factor analysis procedure. These factor scores summarise the
progress of a district in terms of four dimensions of child survival
efforts. These factor scores were than used for ranking the districts in
terms of progress in the four factors related to child survival. These
rankings are given for the total population in table 4 and for the rural
population in table 5. These rankings suggest that progress of child
survival efforts in the districts of the state vary widely across the four
dimensions of child survival efforts. There is no district where the
progress has been the best in all the four dimensions of child survival
efforts. Similarly, there is no district where the progress has been the
poorest in all the four dimensions. This shows that the progress of child
survival efforts in all the districts of the state has essentially been lop-
sided. Very good progress in one dimension has been associated with
poor to very poor progress in other dimension of child survival in most
of the districts of the state.
Since the four factors extracted through the application of the factor
analysis procedure are mutually independent, a straightforward
approach of developing a composite index of progress of child survival
is to take the simple average of the score of each of the four factors. On
the basis of this average score the districts of the state can be classified
into five categories - very good progress, good progress, average
progress, poor progress and very poor progress - on the basis of the
rank of the district in terms of the average score. This exercise has been
carried out for the total as well as the rural population. This analysis
suggests that in 16 districts of the state the progress of child survival
efforts in the total and in the rural population has virtually been the
same (Table 5). Among these districts, the poorest performing districts
are Dindori, Guna, Morena, Rajgarh and Sheopur. On the other hand in
progress of child survival efforts has been very good in West Nimar,
Ujjain and Dewas districts. In Sehore district also, the progress has been
good whereas in Mandla and Umaria districts the progress has been
poor. On the other hand, in Jabalpur and Raisen districts, the progress
may be termed as average. In other districts of the state, the progress of
87

Child Survival and Health
child survival efforts has been different in total and rural population. In
14 districts of the state, the progress has been relatively better in the
rural population as compared to the total population whereas in the
remaining 18 districts, the progress has been relatively poor in the rural
population as compared to the total population.
The foregoing analysis suggests that the progress of child survival
efforts in the districts of the state has varied widely. This variability in
the progress appears to be a reflection of the lack of comprehensiveness
and complementarity in child survival efforts It appears that this lack
of comprehensiveness and complementarity may be one of the reasons
for relatively slow transition in infant and child mortality in most of the
districts of the state and even an increase in the risk of death during
childhood in some of the districts. Reasons behind this lop-sidedness of
child survival efforts in most of the districts of the state are not known
at present. However, it appears obvious that these efforts lack objective
planning, result-based management of child survival interventions and
objective monitoring and evaluation. There is near total lack of
information about child survival, its differentials and determinants at
the district level. Similarly, there is virtually no information about
causes of infant and child deaths and how the causes of death pattern
varies across the districts. Planning and execution of child survival
efforts is virtually normative in terms of contexts and contents and the
local context of infant and child mortality is sadly missing in this
planning and implementation process. Similarly, there is no
comprehensive yet objective system of monitoring and evaluation of
child survival efforts at the district level. The only information available
at the district level is the provider-based information about services
delivered. These programme service statistics are known for a number
of errors and are grossly inadequate for objective assessment of child
survival efforts.
ConclusionsInformation available through the district level household survey
makes it possible for the first time to have an objective assessment of the
progress of child survival efforts at the district level in Madhya Pradesh.
This assessment suggests that the progress of these efforts is at best lop-
sided in most if not all the districts of the state. This lop-sidedness
appears to be one of the reasons for relatively slow transition in infant
and child mortality in the state. It appears that child survival efforts in
the state lack need-based planning, efficient implementation and
88

Progress of Child Survival Efforts
objective monitoring and evaluation. One reason for such a situation
appears to be a near total absence of evidence and understanding about
different social, economic, environmental and cultural factors of infant
and child mortality in the state, especially at lower tiers of
administration. At present, there is no objective, yet transparent system
of assessing the progress of child survival efforts at the district level.
The district level household survey has been able to fill up this void
only to a limited extent. For example information available through the
district level household survey does not permit an assessment of the
progress across different social groups as it is well known that infant
and child mortality varies widely across social groups even within the
district. Institutionalising an objective evidence-based system of
assessing the progress of child survival efforts may go a long way in
effective implementation and scaling up of child survival efforts in the
state which are critical for hastening the pace of improvement in child
survival.
ReferencesGovernment of India (2005) National Rural Health Mission. New Delhi,
Ministry of Health and Family Welfare.
Jones G, W Steketee R, Black RE, Bhutta ZA, Morris SS, Bellagio Child
Survival Study Group (2003) How many deaths can we prevent this
year? The Lancert 362:65-71
Jones G, Schultink W, Babille M (2006) Child Survival in India. Indian
Journal of Pediatrics 73:479-487.
89

Child Survival and Health
Table 1
Summary measures of indicators of child survival efforts
in Madhya Pradesh - Total Population
IMM ORS FST MST IUD PIL CON ANC DEL
2007-08
Minimum 11.4 4.3 30.3 0.0 0.0 0.3 0.7 12.5 13.1
1Q 25.6 23.2 39.2 0.3 0.2 1.1 2.0 22.9 41.2
Median 37.5 31.4 43.8 0.6 0.4 1.3 3.8 37.3 46.3
3Q 50.3 35.0 48.5 1.4 0.6 2.3 5.3 45.4 53.6
Maximum 75.1 59.9 60.5 6.0 1.9 5.1 11.8 66.3 79.7
IQR 24.7 11.8 9.3 1.1 0.4 1.2 3.3 22.5 12.4
Mean 38.2 30.3 44.6 1.0 0.5 1.7 4.1 36.0 47.8
SD 16.3 11.7 6.8 1.1 0.4 1.1 2.5 15.8 12.8
CV 0.426 0.385 0.152 1.132 0.774 0.616 0.605 0.438 0.27
2002-04
Minimum 5.4 8.8 24.7 0.0 0.1 0.7 0.2 17.4 14.5
1Q 18.5 16.8 32.3 0.2 0.5 1.1 2.7 26.4 20.7
Median 30.9 24.0 38.5 0.4 0.7 1.7 3.8 32.1 25.4
3Q 40.0 29.4 43.3 1.1 1.0 2.6 6.2 42.0 30.7
Maximum 65.5 57.1 52.0 3.8 3.8 7.7 16.8 64.1 65.6
IQR 21.5 12.6 11.0 0.9 0.5 1.5 3.5 15.6 10.0
Mean 30.4 24.1 38.0 0.8 0.9 2.2 4.6 34.3 27.2
SD 13.8 9.7 7.4 0.7 0.6 1.5 2.9 11.0 10.1
CV 0.453 0.403 0.194 0.965 0.744 0.690 0.639 0.322 0.37
1Q = First quartile
3Q = Third quartile
IQR = Inter quartile range
SD = Standard deviation
CV = Coefficient of variation
90

Progress of Child Survival Efforts
Table 2
Summary measures of indicators of child survival efforts
in Madhya Pradesh - Rural Population
IMM ORS FST MST IUD PIL CON ANC DEL
2007-08
Minimum 6.4 4.5 30.2 0.0 0.0 0.2 0.2 5.4 12.0
1Q 23.3 18.4 40.5 0.1 0.0 0.6 1.3 18.3 34.7
Median 34.3 27.6 45.9 0.6 0.1 0.9 1.9 25.1 41.5
3Q 46.0 34.0 51.1 1.2 0.4 1.5 3.0 39.0 47.8
Maximum 78.2 55.9 66.7 5.8 2.0 3.8 6.1 60.9 66.0
IQR 22.7 15.6 10.6 1.1 0.4 0.9 1.7 20.7 13.1
Mean 35.0 26.8 46.4 1.0 0.3 1.2 2.3 29.4 41.8
SD 15.7 11.8 7.8 1.2 0.4 0.8 1.4 13.8 11.2
CV 0.449 0.439 0.168 1.213 1.405 0.704 0.625 0.467 0.27
2002-04
Minimum 3.8 5.8 24.0 0.0 0.0 0.2 0.0 12.7 2.8
1Q 15.1 13.1 32.3 0.1 0.2 0.8 1.2 21.3 14.8
Median 21.5 19.3 39.6 0.3 0.3 1.1 1.9 26.4 17.6
3Q 29.4 24.5 46.4 1.0 0.6 1.8 3.0 32.8 21.4
Maximum 61.3 39.4 57.1 4.1 2.3 5.3 7.3 45.1 44.4
IQR 14.3 11.4 14.1 0.9 0.4 1.0 1.8 11.5 6.6
Mean 24.2 19.6 39.1 0.6 0.4 1.4 2.5 27.7 18.4
SD 13.6 8.3 8.4 0.8 0.4 0.9 1.8 8.8 7.0
CV 0.560 0.424 0.215 1.205 0.918 0.672 0.727 0.316 0.378
91

Child Survival and Health
Table 3
Factor structure in total and rural population
Factor Total population Rural population
I • Proportion of children
12-23 months fully
immunised
• Proportion of women
received at least 3
antenatal check up
• Proportion of
institutional deliveries
• Proportion of children
12-23 months fully
immunised
• Proportion of women
received at least 3
antenatal check up
• Proportion of
institutional deliveries
II • Prevalence of IUD
• Prevalence of Pill
• Prevalence of Condom
• Prevalence of Pill
• Prevalence of Condom
III • Prevalence of female
sterilisation
• Prevalence of male
sterilisation
• Prevalence of female
sterilisation
• Prevalence of IUD
IV • Use of ORS during
diarrhoea
• Use of ORS during
diarrhoea
• Prevalence of male
sterilisation
92

Progress of Child Survival Efforts
Table 4
Ranking of districts in terms of factor scores in four dimensions of
progress of child survival efforts and in terms of average factors
score
District Total population Rural population
I II III IV C I II III IV C
Balaghat 1 19 33 45 23 2 15 4 45 10
Betul 6 36 15 20 12 9 23 41 35 32
Bhind 15 2 8 22 4 25 2 30 24 13
Bhopal 16 45 44 5 42 12 1 36 9 4
Chhatarpur 11 17 13 19 10 21 33 31 22 33
Chhindwara 28 21 35 9 25 29 24 21 10 15
Datia 25 16 10 3 7 23 18 34 3 12
Dewas 4 7 6 40 9 6 11 9 31 6
Dhar 29 26 19 24 21 27 28 33 27 35
East Nimar 38 34 9 7 19 32 4 13 6 5
Guna 27 44 7 25 41 28 22 45 41 45
Gwalior 37 20 29 10 22 20 6 17 13 7
Indore 14 3 45 11 37 22 12 1 12 1
Jhabua 21 29 5 2 3 18 30 28 2 14
Narsimhapur 22 18 37 16 24 26 36 20 17 29
Raisen 31 13 30 30 27 30 20 14 25 19
Sagar 36 43 1 27 31 35 38 42 18 39
Satna 8 12 11 18 5 8 16 35 33 20
Sehore 5 27 12 34 13 5 10 39 21 11
Seoni 32 25 18 21 20 36 32 25 16 31
Sidhi 43 24 39 44 45 37 9 2 44 26
Ujjain 2 32 40 1 2 1 40 15 1 2
Vidisha 10 8 21 13 6 17 31 29 14 22
Barwani 44 9 41 17 36 44 35 3 8 27
Damoh 34 15 4 14 11 41 14 44 23 41
Dindori 45 23 16 33 38 45 13 32 38 42
Harda 24 6 42 6 15 31 42 7 15 25
Hoshangabad 20 28 27 43 40 15 34 8 43 36
Jabalpur 23 33 28 28 26 13 26 27 28 23
Katni 26 40 3 32 28 19 7 43 26 17
Mandla 41 5 36 15 29 42 39 5 11 34
Mandsaur 9 39 34 31 35 11 43 38 29 40
Morena 42 4 25 42 39 43 5 16 42 38
Neemuch 17 22 32 37 32 10 19 10 40 16
93

Child Survival and Health
District Total population Rural population
I II III IV C I II III IV C
Panna 30 14 2 12 8 33 17 40 5 18
Rajgarh 33 41 43 36 43 38 45 19 36 44
Ratlam 13 31 17 26 17 14 37 37 34 37
Rewa 18 38 24 8 18 16 27 11 7 9
Shahdol 12 37 20 41 34 7 29 12 39 21
Shajapur 7 35 31 39 30 3 44 18 30 24
Sheopur 40 42 38 38 44 39 41 24 37 43
Shivpuri 35 1 22 29 16 34 8 6 20 8
Tikamgarh 19 10 14 35 14 24 25 22 32 30
Umaria 39 30 26 23 33 40 21 23 19 28
West Nimar 3 11 23 4 1 4 3 26 4 3
94

Progress of Child Survival Efforts
Table 5
Progress of child survival efforts in districts of Madhya Pradesh.
Total
population
Rural population
Very poor Poor Average Good Very Good
Very poor Morena
DindoriRajgarh
GunaSheopur
Hoshangabad Sidhi Indore
Bhopal
Poor SagarMandsaur
MandlaUmaria
ShajapurShahdol
Barwani
KatniNeemuch
Average East Nimar Seoni
DharNarsimhapur
Jabalpur
Raisen
Balaghat
Chhindwara
Gwalior
Good DamohRatlam
ChhatarpurBetulTikamgarh
Harda Sehore ShivpuriRewa
Very good Chhatarpur Satna
Vidisha
Jhabua
BhindDatia
Panna
West Nimar
UjjainDewas
95

Child Survival and Health
96

Child Survival and Health Among the
Urban Poor in Madhya Pradesh
Siddarth AgarwalAradhana Srivastav
IntroductionMadhya Pradesh is the home of about 18 million urban population
around 2008 according to population projections prepared by the
National Population Commission (Government of India 2006) and
accounts for more than one fourth (27 per cent) of its total population.
The urban population in the state grew by 31 per cent during the
decade, 1991-2001, while the total population grew by 24 per cent
(Government of India 2001). It is estimated that the urban population
of Madhya Pradesh will rapidly increase to 40.4 million comprising one
third of the state population by the year 2026.
Madhya Pradesh is also a state with high proportion of urban
poverty. It is estimated that 42.1 per cent of the urban population of the
state, comprising 7.4 million people, is poor (Government of India
2007). This proportion is much higher than the national average of 25.7
per cent. The proportion of urban population below the poverty line in
the state is the second highest in the country, next only to Orissa.
Further, urban poverty in the state is marginally higher than the rural
poverty which is estimated to be 37 per cent. Healthcare for the urban
poor is, therefore, a key priority as the number of the urban poor
increases rapidly with the increasing urbanisation.
The urban poor are vulnerable to many health risks as a
consequence of living in conditions characterised by cramped, low-
quality housing with limited sanitation, limited access to affordable
quality health care, widespread illiteracy, social isolation, and a lack of
97

Child Survival and Health
negotiating capacity to demand improved public services. Studies
across the world have shown a trend of higher malnutrition, childhood
illness and mortality in urban slums as compared to non-slum
environment (Agarwal and Taneja 2005).
Children of the urban poor, living in slum environment, suffer
accentuated vulnerability to outbreaks of diseases such as diarrhoea,
measles, jaundice and typhoid, owing to high population density and
continuous influx of new pool of infective agents with immigrating
population (Agarwal, Bhanot and Goindi 2005, Awasthi and Agarwal
2003). Most of these diseases are preventable through relatively simple
hygiene behaviour and through complete immunisation of infants.
Madhya Pradesh has the highest IMR in the country (74 per
thousand, much higher than national average of 57, as per 2006
estimates (Government of India 2007). Several child survival and
newborn health care schemes are in progress in the state to address high
infant mortality. In this paper, we analyse the impact of these schemes
on the health and survival of urban poor children who constitute a
high-risk population. It is difficult for the state to achieve the goal of
reduction in infant mortality as described in the XI Five-year
Development Plan without addressing the needs of the urban poor.
Child Health Status among Urban PoorMadhya Pradesh has some of the most alarming child health indicators
in India. Health indicators of the urban poor in the state are even worse
than national averages and are very similar to those in rural population.
In order to unravel the existing intra-urban disparities, data from
NFHS-3 were re-analysed by the Urban Health Resource Centre. The
Wealth Index, an asset based indicator was used to identify the urban
poor households. Households with the lowest Wealth Index quartile
were classified as poor. Key findings of the analysis are discussed
below.
Place of Delivery. Nearly 64 per cent of the urban poor births in
Madhya Pradesh took place at home compared to 25 per cent among
the non-poor. If not attended by skilled professionals or not adhering
to safe delivery practices, these births pose maximum risk to survival
of mothers and infants.
Immunisation. Immunisation coverage among urban poor children
was only 54 per cent compared to 81 per cent among the urban non-
poor. Urban poor children are difficult to reach on account of residence
in slums, migrant status or culturally-influenced resistance.
98

Child Health among Urban Poor
Under Nutrition. About 65 per cent of urban poor children in
Madhya Pradesh are underweight, much higher than non-poor children
(40 per cent). Malnutrition among urban poor children is caused by
inadequate or improper food intake due to poverty compounded by
repeated episodes of parasitic and other childhood diseases such as
diarrhoea as a result of poor sanitation and hygiene and improper care
during illness (Ruzicka and Kane 1985, Pelletier et al 1995).
Neonatal, Infant and Child Mortality. Limited access to health care
services, lack of adequate nutrition, inadequate sanitation and poor
hygiene among the urban poor result in high infant and child mortality
which is considerably higher among the urban poor compared to urban
non-poor. As seen from figure 4, an alarming 98 new born per 1000 live
births do not survive to their fifth birth day in the urban slums of the
state. This proportion is substantially higher than the national under-
five mortality rate of 73 under-five deaths per 1000 live births in India.
Figure 1
Poor and non-poor difference in coverage of services
in urban areas of Madhya Pradesh
99

Child Survival and Health
Factors affecting Child Health among Urban Poor
in Madhya PradeshDebilitating environmental conditions, high population density and
poor hygiene behaviour expedite disease transmission among slum
dwellers in the urban areas, while irregular and insufficient food intake
contributes to under nutrition of children. All these factors, together,
adversely affect survival and health of children and impede their
normal growth and development. Factors affecting survival and health
of children can be classified into three categories - those which arise
from the community; those related to access to healthcare services; and
those relating to the environmental conditions of slums. These factors
are discussed at some length in the following pages in the context of
Madhya Pradesh.
Figure 2
Neonatal, infant and under five mortality in poor and non-poor
in urban areas of Madhya Pradesh
100

Child Health among Urban Poor
Community level FactorsPoverty/Vulnerability Pockets. Poverty is the major underlying cause
of a number of aspects which further affect the survival and health
status of children in slums of the urban areas. These include, among
others, type of housing, level and regularity of food intake and
affordability of such services like immunisation against vaccine
preventable diseases and basic healthcare services all of which
ultimately bear upon child health. A section of the urban poor also
suffer greater vulnerability because of migratory status (seasonal
migrants), type of occupation (scavenging) or environmental conditions
(living within factory premises). They are often left out of even existing
efforts such as immunisation drives or community counselling on
feeding.
Livelihood and Housing Insecurity. Most slums and urban poor
habitations are encroachments on public or private land. Unauthorised
occupations are not served by any civic amenities, which affect the
quality of life of the residents and make them more prone to infections.
Livelihood insecurity affects the food intake of poor families. The
compulsion for wage earning also forces women to resume wage labour
soon after delivery, leaving the newborn often in the neglect.
Poor Health and Hygiene Behaviour. Urban slum environment poses
a huge challenge to human health in terms of poor hygiene conditions.
Relatively simple but essential hygiene behaviours such as good hand
washing practices can save a substantial number of disease episodes
and deaths due to diarrhoeal diseases among the urban poor. Similarly
maintaining safe and hygienic delivery practices can also bring down
the maternal and neonatal mortality associated with home deliveries.
Such behaviour is, however, sub-optimal among the urban poor on
account of ignorance as well as culturally influenced misconceptions,
which accentuate the burden of maternal, neonatal and child morbidity
and mortality among them.
Poor Demand and Weak Negotiating Capacity of the Community.
Residents of slums have limited knowledge on appropriate health
behaviours and they are likely to be unaware of the location and
services provided by health facilities, out-reach visits of health workers
etc. This results in poor demand and utilisation of health services Slums
are also socially excluded communities, often left out of the social fabric
and therefore suffer from lack of confidence to express their
requirements and very poor negotiating power to demand better
services and entitlements.
101
Child Survival and Health
Poor access to existing child health servicesUnlisted Slums. Slums, in the urban areas, generally remain
unrecognised for many years owing to delay in updating of the slum
list. Such unlisted slums are usually not covered by such essential
services like water supply and sanitation. They are also not covered by
public health services and are left out of routine outreach programmes
such as immunisation camps. It has been found that in the Indore city,
immunisation services against vaccine preventable diseases scarcely
reached those slums which were not notified while notified slums
received all the benefits of repeated interventions (Agarwal and Taneja
2005). When basic infrastructure and services are lacking, urban
settlements are amongst the world's most life threatening environment
(WHO 1999).
Inadequate and Ineffective Public Health Services. Slums and squatter
settlements are poorly covered by primary health care services. These
facilities have not grown in proportion to the explosive growth of urban
population especially the urban poor. Even the available facilities may
not be in the physical proximity to urban slum clusters. One primary
health care facility in an urban area caters to a much higher population
compared to the norm of 1 centre for every 50,000 population (Shekar
and Ram 2005). Though health facilities in the private sector have a
wide presence in urban areas, yet, they are often not accessible to the
poor because of the high cost. The poor are therefore forced to fall back
on the unqualified private providers who provide poor quality services.
Moreover, these informal providers do not provide preventive health
services such as immunisation, antenatal care, and counselling on
proper child care and nutrition, as these services do not generate any
profit. Other problems related to primary healthcare services in slum
areas include unsuitable timings, inadequate staffing, unfriendly
behaviour towards poor patients and high staff absenteeism.
Poor Service Coverage and Pockets of Exclusion. Some slums are
situated on the border of two urban health centres, with neither taking
responsibility of inhabitants of these slums. Health centres are often
located at large distance from their slum catchments, making it difficult
for people to access them. Similarly, peri-urban slums are also at a
disadvantage as neither rural nor urban health centres take the
responsibility of serving them. Even within slums, certain pockets are
not served, such as migrants who are highly mobile, are difficult to
reach (Agarwal, Bhanot and Goindi 2005).
102

Child Health among Urban Poor
Environmental ConditionsSlums are mostly informal settlements and usually illegal in status.
These settlements are not served by civic amenities of any kind. Their
situation is worse if they are located near nallahs, river banks, on low-
lying lands, steep slopes, near railway lines or at peri-urban locations.
Such environmental factors are conducive to collection of waste and
transmission of infectious pathogens. Outbreaks of diseases such as
cholera, diarrhoea, jaundice and typhoid are common in such
environments. Moreover, the overcrowding in slums results in
prolonged exposure to infections and greater severity of infections in
such cases (Lodha 2000). Slums are therefore ideal breeding grounds for
infectious diseases and the worst victims of these maladies are children.
Strategies for Addressing Child Health Challenges
among Urban PoorSeveral approaches have been used to target neonatal and child health
among the urban poor through government programmes and through
civil society initiatives. This section examines main approaches and
highlights their effectiveness.
Breastfeeding. Breast milk provides optimal nutrition and promotes
child's growth and development; it is associated with improved growth
during the first months of life. Initiation of breastfeeding immediately
after birth or within an hour of birth is essential for good health of the
newborn. Nutrients in the breast milk, especially essential fatty acids,
increase immunity leading to reduced infant morbidity, and help build
closer mother-child relations (Walker 2007). Exclusive breast feeding for
the first six months of life helps in protecting the newborn and the
infant from diseases, reduces the risk of mortality and encourages
healthy child development (UNICEF 2009). Activities promoting early
and exclusive breastfeeding target behaviour change, and, therefore,
often make a difficult progress. NFHS-3 data show that early and
exclusive breastfeeding is currently practised by less than one fifth of
urban poor women, and only about 28-29 per cent of non-poor women.
This shows low adherence to recommended breastfeeding practices,
possibly under influence of traditional wisdom. In spite of the slow
progress associated with behaviour promotion efforts, it is absolutely
essential to target breastfeeding as one of the most crucial interventions
for influencing child health, nutrition and survival.
103

Child Survival and Health
Behaviour Promotion. A wide range of favourable behaviours
influencing newborn and child health can be targeted under behaviour
promotion strategies. The RCH-II has focussed on a range of behaviours
which influence infant and child health under its BCC strategy. These
include newborn care practices (recognition of danger signs, proper
cleaning, warming and feeding of the baby, early and exclusive breast
feeding), immunisation, management of sick child (recognition of
ARI/diarrhoea symptoms and timely treatment including use of ORS
for treating diarrhoea). Evidence from research has shown that washing
hands with soap can reduce the risk of diarrhoeal diseases by 42–47 per
cent (Curtis and Cairncross 2003). Good hand-washing practices have
also been shown to reduce the incidence of other diseases, notably
pneumonia, trachoma, scabies, skin and eye infections and diarrhoea-
related diseases like cholera and dysentery (UNICEF 2008).
Timely Immunisation. The urban poor areas are marked by higher
incidence of vaccine preventable diseases such as measles and
diphtheria, which are highly contagious. However, reach of
immunisation services among the urban poor is weak on account of
gaps in coverage, resistance of families against immunisation due to
traditional beliefs, low birth registration leading to non-targeting of
eligible children and mobility of communities. Higher immunisation
dropout rates in the urban areas highlight the fact that though physical
reach/access may be easier in urban areas, regular outreach sessions,
follow-up and consistent quality of services need definitive action.
Immunisation outreach is a significant component of urban RCH-II.
Increasing coverage of children through immunisation camps and
follow-up through community-based health volunteers (as seen in the
Indore urban health programme) have proven to be successful
strategies and should be replicated for wider benefit.
Diarrhoea Prevention. Diarrhoea is the second most important killer
of children below five years of age world wide following Acute
Respiratory Infections (Urban Health Resource Centre 2006). Promotion
of basic hand washing behaviour, such as washing hands with soap
after defecation, before feeding and before preparing food helps reduce
the prevalence of diarrhoea significantly. Oral Rehydration Therapy
(ORT) can prevent about 90 per cent child deaths from diarrhoeal
dehydration. Knowledge and use of ORS is low among the urban poor
and needs to be focussed as a key priority under behaviour change
communication activities, especially since diarrhoea prevalence is so
high among children in urban poor communities.
104

Child Health among Urban Poor
ConclusionsThe analysis presented in this paper clearly brings out the dichotomy
that exists between poor and the non-poor children in the urban areas.
High under-nourishment, high morbidity, ineffective health services
along with poverty form a vicious cycle which adversely affect neonatal
and child survival among urban poor communities. Improving the
health of the urban poor is necessary to achieve the goals set out in the
national development policies and Millennium Development Goals
(MDGs), especially MDG 4 (reduction in child mortality by three fourth
between 1990 and 2015).) Efforts in this direction should ensure:
1. Adapting to city-specific situations through city-specific urban
health planning and implementation. This is already being
implemented in Indore, Bhopal and Jabalpur, and is expected to be
scaled up to more cities once National Urban Health Mission is
launched.
2. Involving communities as equal partners in ushering change.
Experience of NGOs as well as government run programs have
shown that training slum based health volunteers or Community
Based Organizations (CBOs) can be an important strategy for
improving health of the urban poor. The can help in strengthening
the demand as well as supply of healthcare and help build linkages
between the two aspects.
3. Scaling up effective approaches for maximum coverage. Successful
strategies being implemented on a limited scale in cities can be
scaled up for greater impact. Similarly approaches can be replicated
in other cities as well to maximize coverage of urban poor
communities across the state.
ReferencesAgarwal S, Bhanot A, Goindi G (2005) Understanding and addressing
childhood Immunisation coverage in urban slums. Indian Pediatrics
42: 653-63.
Agarwal S, Taneja S (2005) All slums are not equal: Child health
services among the urban poor. Indian Pediatrics 42: 233-244.
Awasthi S, Agarwal S (2003) Determinants of childhood mortality and
morbidity in urban slums in India’, Indian Pediatrics 40: 1145-61.
Curtis V, Cairncross S (2003) Effect of washing hands with soap on
diarrhea risk in the community: A systematic review. The Lancet –
Infectious Diseases 2003. 3:275-281.
Government of India (2001) Census of India 2001. Primary Census
105

Child Survival and Health
Abstract. Total Population: Table A -5. New Delhi, Registrar General
and Census Commissioner.
Government of India (2006) Population Projections for India and the States
2001-26. New Delhi, of the Registrar General and Census
Commissioner.
Government of India (2007) Poverty Estimates based on 61st round,
2005-06. New Delhi, National Sample Survey Organisation.
Government of India (2007) SRS Bulletin, Oct 2007. New Delhi, Registrar
General and Census Commissioner.
Lodha R, et al. (2000) Diphtheria in urban slums of North India. The
Lancet 355:204.
Pelletier DL et al. (1995) The effects of malnutrition on child mortality
in developing countries. Bulletin of the World Health Organisation
73:443-448.
Ruzicka LT, Kane P (1985), Nutrition and child survival in south Asia.
In K. Srinivasan and S. Mukerji (eds). Dynamics of Population and
Family Welfare. Bombay, Himalaya Publishing House.
Shekhar C, Ram F (2005) National Report on Evaluation of Functioning of
Urban Health Posts/Urban Family Centres in India. Mumbai,
International Institute for Population Sciences.
United Nations Children’s Fund (2008) The Importance of Hygiene.
http://www.unicef.org/wes/index_hygiene.html. Accessed on 5
September 2008.
United Nations Children’s Fund (2009) The State of World’s Children
2009. New York, United Nations.
Urban Health Resource Centre (2006) State of Urban Health in Madhya
Pradesh. New Delhi, Urban Health Resource Centre.
Walker SP (2007) Child development – Risk factors for adverse
outcomes in developing countries. Lancet Series on Child Development
in Developing Countries 2. 369:145-57
World Health Organisation (1999) Creating healthy cities in the 21st
century. In David Satterwaite (ed) The Earthscan Reader on
Sustainable Cities. London, Earthscan Publications.
106

Infant Mortality, Fertility and Family
Size: A District Level Analysis
SRJ Singh
IntroductionAn investigation into the association between infant mortality and
fertility has long been of great demographic, social and economic
significance especially in the developing countries where population
growth rate continues to be high. The demographic transition theory
presumes that the long run decline in mortality sets into motion forces
that eventually lead to a decline in fertility. In India, infant mortality
still continues to be quite high and, it is argued that, high infant
mortality is an obstacle in accelerating the decline in fertility. A study
of fertility decline in the context of varying levels of infant mortality
would, therefore, reinforce our ideas to understand the phenomenon of
fertility transition. Several studies dealing with the role of socio-
economic and demographic variables affecting fertility in relation to the
varying levels of infant mortality have emerged out of research findings
(Barmal et al 1982)
The aim of this paper is to analyse the relationship between fertility
and infant mortality in the rural population of district Rewa in Madhya
Pradesh. Available evidence suggests that mortality, especially infant
mortality, has declined considerably during the last twenty years in the
rural areas of district Rewa, although, infant mortality in the district is
still very high compared to state and national averages. On the other
hand, fertility rates in the district remain consistently at a high level so
that the population of the district may be classified as a population in
the early stages of demographic transition. It is in this context, it is
107
Child Survival and Health
relevant to investigate the effect of infant mortality on the fertility in the
rural population of the district. The child replacement hypothesis
argues that couples who lose their child during infancy are expected to
make up the loss by having more births which keeps fertility high.
Incidently, the child replacement hypothesis is relevant only in the
context of deliberate efforts to control fertility. Otherwise, couples
would continue to bear children until one of the spouses becomes
permanently sterile, or dies. Any evidence of the 'replacement’ effect
operating in the rural population would therefore suggest the existence
of some indirect control of fertility.
DataThe present paper is based on the information available through
Demographic Survey of Rewa (Rural), Madhya Pradesh which was
carried out in the year 2003. During the survey, information on various
aspects relating to household structure, household facilities, fertility,
mortality, migration, etc, was collected from about 442 households,
selected from 14 villages in the Rewa sub-district of district Rewa
following a two stage stratified random sampling procedure. For the
sake of convenience, only villages situated at a distance of 15 kms or
less from Rewa city, the headquarters of district Rewa and sub-district
Rewa were considered as the population universe. In each of the
selected villages, a listing of all the households was carried out and a
random sample of 30 household was taken from each of the selected
villages. Information from the selected households was collected on the
basis of a pre-designed and pre-tested questionnaire through personal
interview method.
ResultsInformation available through the survey suggests that individual
experience of child loss (infant deaths) has some effect on fertility, that
is attributed to replacement effect. Table 1 presents average number of
children ever born to eligible couples by the age of the mother and
different levels of infant deaths. It is clear that as number of infant
deaths increases, the average number of children ever born to females
also increases. Findings of several other studies (Taylor et al 1976, Singh
and Berman 1975, Westoff 1974, Heer and Smith 1968) also suggest that
reduction of infant and child mortality is one of the necessary
precondition for the reduction in fertility and acceptance of the small
family norm.
108

Infant Mortality and Fertility
Table 2 presents the average number of surviving children to
eligible couples according to number of infant deaths and the current
age of the mother. It is evident from the table at the end of reproductive
period, the number of infant deaths does not affect the average number
of surviving children substantially.
To see the simultaneous effect of infant mortality and the age at the
consummation of marriage on fertility, we divided each group into two
parts according to the age of the woman at the consummation of her
marriage. In group I, we include all those women whose age at the
consummation of marriage was less than or equal to 14 years and in
group II, we included all those women whose age at the consummation
of marriage was between 15 to 19 years. The average number of
children ever born by the number of infant death and the current age of
the mother are shown in Table 3.
An examination of Table 3 reveals that the average number of
children born to eligible couple is more in group I in comparison to
group II irrespective of the number of infant deaths. From this, we
conclude that if the consummation of marriage is delayed, the average
number of births per woman decreases irrespective of the number of
infant deaths.
ConclusionsSimilar to the findings of earlier studies, in the present analysis too, we
observe that in the rural population of district Rewa, the higher is the
infant mortality, the higher is the fertility.
The analysis also indicates that a decrease in infant mortality
contributes to lowering fertility. As such, the same number of births
would result in more children surviving at any given age and there may
be greater demand of fertility control through contraception. Besides,
the presence of an infant or young child and the strain of child rearing
may reduce the frequency of sexual intercourse and hence low fertility.
The influence of infant and child mortality on fertility is not an
instantaneous adjustment process. In the long run of demographic
transition, fertility decline normally lags mortality decline as well as
infant mortality decline. However, the time span of fertility decline and
the time span of mortality decline varies considerably from one context
to another. If, in a given set of circumstances, it is possible that
reduction in infant mortality induces a fall in fertility, then an
understanding of the factors affecting the lag become highly pertinent.
109

Child Survival and Health
References
Berman D, Singh KK, Singh TB (1982) Infant mortality trends in
Varanasi (Rural) during 1940-1979. Rural Demography 9(1&2): 77.
Heer DM (1966) Economic development and fertility. Demography 3:423.
Heer DM, Smith DO (1968) Mortality level, desired family size and
population increase. Demography 6:141.
Raina BL (1969) Population Problems of India. Family Size Norms. New
Delhi, Central Family planning Institute. Monograph Series II.
Singh SN, Chakraborty KC (1975) Trends in infant mortality in Varanasi
(Rural). Paper presented at All India Multi-disciplinary Seminar on
Problems and Perspectives of Population. Varanasi, Benaras Hindu
University.
Taylor ECE, Newman LS, Kelly NU (1976) The child survival
hypothesis. Population Studies 30:263.
Westoff CF (1974) Population, and the family: An overview. Bucharest,
World Population Conference. Background Paper.
110

Infant Mortality and Fertility
Table 1
Distribution of average number of children ever born according to
number of infant deaths and present age of women
Present age of
Women
Infant deaths
0 1 2 3+
<15 0.00(8) - - -
15 -- 19 0.33(63) 0.41(5) - 2.00(1)
20 - 24 1.43(72) 1.60 (18) 2.76(4) 3.00(2)
25 - 29 2.88(46) 3.95 (22) 3.61(8) 4.46(4)
30 - 34 3.14(26) 4.17 (21) 4.74(10) 5.33(5)
35 - 39 4.00(22) 4.19 (18) 5.45(8) 5.89(8)
40 - 44 4.82(15) 5.40 (10) 6.22(9) 6.07(7)
45 - 49 5.06(9) 6.16( 9) 6.52(4) 6.08(4)
Note Figures in parentheses refer to number of
observations.
Table 2
Distribution of average number of children alive according to
number of infant deaths and present age of wife
Present age of
Women
Infant deaths
0 1 2 3+
<15 0.00(8) - - -
15 -- 19 0.30(63) 0.45(5) - 0.00(1)
20 - 24 0.34(72) 1.54(18) 0.48(4) 0.91(2)
25 - 29 1.59(46) 1.61(22) 2.03(8) 1.85(4)
30 - 34 2.54(26) 2.77(21) 2.19(10) 2.33(5)
35 - 39 3.04(22) 3.66(18) 3.98(8) 2.79(8)
40 - 44 3.34(15) 4.47(10) 4.55(9) 3.47(7)
45 - 49 4.03(9) 4.81(9) 4.62(4) 4.52(4)
Note Figures in parentheses refer to number of
observations.
111

Child Survival and Health
Table 3
Distribution of average number of children ever born according to
mother’s age and number of infant deaths considering the age at
consummation of marriage
Present
age of
Women
Infant deaths
0 1 2 3+
14 15-19 14 15-19 14 15-19 14 15-19
<15 0.00
(8)
- - - - - - -
15 -- 19 0.50
(24)
0.22
(39)
1.57
(3)
1.15
(2)
- - - 2.00
(1)
20 - 24 1.96
(19)
1.32
(53)
1.95
(7)
1.45
(11)
1.80
(1)
1.32
(3)
2.25
(1)
2.00
(1)
25 - 29 3.32
(16)
2.87
(30)
3.30
(8)
2.87
(14)
3.03
(4)
3.33
(4)
3.91
(1)
3.25
(3)
30 - 34 3.96
(9)
3.12
(17)
4.53
(8)
4.09
(13)
4.02
(5)
3.64
(5)
5.73
(2)
4.25
(3)
35 - 39 4.85
(8)
3.86
(14)
4.45
(6)
5.10
(12)
4.56
(2)
4.51
(6)
6.25
(3)
5.66
(5)
40 - 44 4.93
(5)
4.62
(10)
5.96
(3)
4.02
(7)
5.48
(4)
5.33
(5)
6.64
(3)
6.76
(4)
45 - 49 4.76
(2)
5.45
(5)
6.24
(3)
6.00
(6)
6.46
(1)
5.12
(3)
6.2
(2)
5.44
(2)
Note Figures in parentheses refer to number of observations.
112

Determinants of Birth Weight
and Early Neonatal Mortality
NK Tyagi
IntroductionAll over the World, major changes are taking place in the area of
maternal and child health to achieve the goals set out in international
declarations and country wise commitments. The need for information
and evaluation has, therefore, become increasingly apparent.
The causes and determinants of neonatal deaths and still births
differ from those causing and contributing to post neonatal and child
deaths. Neonatal deaths and still births largely stem from poor maternal
health, inadequate care during pregnancy, inappropriate management
of complications during pregnancy and at the time of delivery, poor
hygiene practices during delivery, the first few critical hours after birth,
and lack of newborn care. Several factors such as women’s status in the
society, their nutritional status at the time of conception, early child
bearing, too many closely spaced pregnancies etc. are deeply rooted in
the cultural fabric of the society, and their interactions are not clearly
understood (WHO 2006, Salilu, Williams and Emusu 2005, Pastore and
Williams 2004).
Birth weight is an extremely powerful predictor of the survival of
the newborn. In general, the lower is the weight of the baby at birth, the
higher is the risk of death during infancy so that the mean birth weight
is strongly correlated with the infant mortality (Arifen et al 2000,
Forssas et al 1999).
Collins and David (1990), in their study, have observed that low
birth weight is caused by either pre-term delivery or fetal growth
113

Child Survival and Health
retardation. Thus, birth weight provides an opportunity for
interventions to improve infant survival and further growth and
development of the child.
The low weight of the baby at birth is largely due to the parents’
socio-economic-cultural and genetic make-up. Further, health of the
mother during her childhood and during pregnancy contributes
significantly to the intrauterine growth of the newborn (Hediger et al.
1995, Wilcox 1981).
Wilcox and Russell (1983) observed that perinatal mortality was
closely related to weight at birth. Their analysis has established that the
distribution of weight at birth is essentially Guassian with additional
births at lower ends that divides the distribution in two components; i)
a predominant distribution (Guassian) and ii) a residual distribution.
Finding shows that predominant distribution is largely of term births,
while the residual distribution is almost entirely composed of pre-term
births. Further, it was observed that male babies suffer a higher
perinatal mortality than female babies, despite being fewer low weight
male births.
Barker and Lackland (2003) observed that the birth weight is also
associated with health outcomes later in the life. Asthma, low IQ, and
hypertension have been reported to be more common among those who
were low weight at birth. The usual approach assumes that the weight
at birth is the casual pathway to the health of an individual latter in life.
Thus, there has been a resurgence of interest in the association between
birth weight and diseases of adulthood e.g. cardiovascular diseases,
diabetes, certain cancers, and impairment of hearing or vision. It is a
fascinating finding that, when weight-specific data are available, the
risk of later endpoints often echo the reverse J-shaped curve with infant
mortality.
In the present study, an attempt has been made to study the
maternal determinants of birth weight and mortality in the early days
of life. Suitable models to estimate weight at birth, classification of the
newborn with low weight at birth and mortality in early days of life
have been established. The ROC curve for low birth weight and early
neonatal mortality have been prepared to identify mothers and
neonates for necessary care.
Materials and MethodsIn the present paper, 27,979 mothers and 35,279 babies delivered at a big
rural hospital in central India, during January 1990 through December
114

Low Birth Weight and Early Neonatal Mortality
2005 formed the study sample. The data on the age of the mother,
period of gestation, parity, Haemoglobin level of the mother, duration
of hospital stay, causes of maternal death, weight of the newborn, sex
of newborn and cause of death of the newborn were retrieved from the
hospital records. ANOVA (Analysis of variance) is used to test the
difference between means and to uncover main and interaction effects
of categorical independent variables (called ‘factors’) on an interval
scale variable. Methodological details of the analysis are given below:
Proportion of Variance explained (Eta ): Eta is computed to study the2 2
proportion of variation explained by the categories of independent
variable ‘x’ in dependent variable ‘y’ and can be defined as:
Eta =Between sum of squares (BSS)/Total sum of squares (TSS)2
Eta is the proportion of variation explained by the categories of2
independent variable ‘x’.
Proportion of Variation Unexplained =(TSS-BSS)/TSS
Linearity SS=TSS×(Cov(x,y)) /{V(x)×V(y)}2
Linearity SS has been computed as the variation explained by the
linear relationship of independent variable ‘x’ in dependent variable ‘y’,
so that concerned variable can be used in multivariate analysis.
Deviation from Linearity SS = BSS - Linearity SS
Deviation from linearity SS is the variation explained by the
categories but not by the linear relationship of variable ‘x’ with the
dependent variable ‘y’.
Significance in ANOVA is tested by F-test using appropriate
degrees of freedom (df).
1 2F(df ,df ) = Mean between sum of squares (MBSS)/Mean error
sum of squares (MESS)
1 2where df =(K-1) and df =N-K.
Principal component analysis has been used to find latent variables
so that the multi collinearity can be avoided in multiple variable
analysis/models, and they can be used in developing models to
estimate the birth weight and the probabilities of the mothers likely to
deliver low weight babies and mortality in early days of life.
To estimate mothers likely to deliver low birth weight babies and
the standardised effect of the other maternal variables, the logistic
regression model has been used as under:
e 0 1 1 k k+log {P(Y=Bwt<2000gm)/(1- P(Y= Bwt<2000gm))}= B +B X +..+B X ,,
Odds Ratio = Exp(B), where B is the regression coefficient.
115
Child Survival and Health
Since, the intrauterine growth of the baby is determined
physiologically by the gestational age, the Cox Proportional Hazard
model has been used to study the effect of other covariates standardised
for gestation.
Care has been taken while coding categorical data for analysis so
that the reference categories for respective categorical variables is with
(i) lower standard error (for stability of the estimate), and (ii) least risk
to be of low weight at birth if possible. These two conditions imply well
defined, standardised and stable odds ratios (OR), and it makes easy to
suggest corrective measures to improve the response condition.
For the categorical data, the group size is kept large enough to get
the estimate of P(y=1 or y=0), because in the initial solution, regression
coefficients are estimated from group specific rates. Further, if P(y=1 or
y=0)=0 or 1 then the computing package replaces it by P =(Sy+c)/(n+2c)*
for that group, where ‘c’ takes a fixed value in the range of 0<c #0.5,
hence such situations were avoided if possible.
Correctly classified subjects by the model in the two groups of the
response variable, that is sensitivity and specificity of the model,
depends on the cut off points selected for the purpose. Usually, the
analysis is repeated many times to reach at an appropriate cut off point
for balanced sensitivity and specificity. However, the cut off point
arrived in this manner may not be relevant for the users of research
findings. In such situations, it is advisable to use the co-ordinates of
ROC curve at relevant cut off points which also makes it easy to
compute Likelihood Ratios (LR) and posterior probabilities if the
probability associated with other risk variables is known.
ResultsWeight at Birth of Newborn and Age of Mother. Table 1 reveals that the
mean birth weight increased from 2494 gm. with SD 463 gms to 2588
gms with SD 512 gms as the age of the mother increased from < 20 years
to 30-39 years and, thereafter, a decrease in weight at birth was
observed which was found to be statistically significant (p#0.001). The
proportion of low birth weight babies was the highest (13.8 per cent) in
mothers aged 40 years and above, followed by mothers aged <20 years
(10.2 per cent, p=#0.05). Further, the birth weight was found to be
linearly related with the age of the mother (p#0.001) but the deviation
from linearity has also been found to be significant (p#0.001). These
findings of linearity and deviation from linearity are contradictory, but
statistically speaking this can happen because of the large sample size.
116

Low Birth Weight and Early Neonatal Mortality
Birth Weight and Parity. Table 2 reveals that the mean birth weight
varied from 2540 gms with SD 464gms in primi-para mothers to 2531
gms with SD 519 gms in mothers with parity 4 and above and the
differences were statistically highly significant (p<0.001). The
proportion of low birth weight babies was 9.3 per cent in primi-para
mothers which decreased to 7.5 per cent in mothers with parity one but
increased in higher party mothers reflecting the classical ‘U’ type curve.
Further, the birth weight was also found to be linearly related with
parity (p#0.001), and the deviation from linearity was also statistically
significant (p#0.001).These findings of linearity and deviation from
linearity need to be taken into consideration while analysing the birth
weight data.
Birth Weight and Haemoglobin. Table 3a reveals that the mean birth
weight is directly related to the Haemoglobin level but the mothers with
Haemoglobin level <7.0 gms/dl and 7.02-8.9 gms/dl did not show any
relationship with birth weight. The low birth weight babies showed a
clear cut off point of mother’s Haemoglobin level at <9 gms/dl and $9
gms/dl with 11 per cent and 8.2 per cent newborn respectively. Table
3b again exhibited the similar linear and nonlinear but significant
(p<0.001) relationship of birth weight and level of haemoglobin of the
mother.
Birth Weight and Period of Gestation. Table 4a reveals that the birth
weight increases consistently with increase in the period of gestation -
from 1387 gms with SD 553 gms in newborn with the period of
gestation 28-29 weeks to 2732 gms with SD 395 gms in newborn with
period of gestation $40 weeks. The proportion of low birth weight
babies was 87 per cent in newborn with period of gestation of 28-29
weeks which decreases consistently to 2.4 per cent in newborn with
period of gestation $40 weeks. The table 4b, on the other hand, exhibits
that around 29 per cent of the variation was explained by the variation
in the period of gestation groups, and around 20 per cent their linear
relationship, though, here again, the linearity and deviation from
linearity were found to be statistically significant (p<0.001).
Birth Weight and Day at Discharge. Table 5 shows the relationship of
birth weight with the day at discharge from the hospital. Though, the
differences in birth weight by the day at discharge were statistically
significant but absolute differences cannot be said to be of any clinical
importance. However, the SD of the birth weight on first and second
day of discharge was the highest which indicates that the newborn who
were discharged from the hospital on the first and second day had
117

Child Survival and Health
extreme birth weight i.e., very low and very high weight at birth. This
is confirmed by the fact that the prevalence of low weight was highest
in newborn discharged(including death) on the first and second day
(p<0.001).
Principal Component Analysis. In table 6, rotated principal
component matrix for gestational age, birth weight, parity and maternal
age is given. The table reveals that almost 72 per cent of the total
variation in these four variables could be explained by the two principal
components - 36.8 per cent and 34.8 per cent respectively. The first
principal component is constituted by gestational age (r=0.857) and
birth weight (r=0.855). This principal component is subject to
monitoring and can be improved by better antenatal care. The second
principal component is formed by parity (r=0.831) and maternal age
(r=0.830) which cannot be changed during pregnancy.
Regression Model to Estimate Weight at Birth: In table 7, results of the
regression model for estimating birth weight on the basis of period of
gestation, Haemoglobin level, age of the mother, parity and duration of
the stay in the hospital is given. All the predictor variables have
significant slope coefficient ‘B’, although, the coefficient of
determination ‘R ’ was only 0.212 (p<0.001). 2
Logistic Regression Model to Estimate low Weight Newborn Babies: In
table 8, the logistic regression model to estimate low weight babies on
the basis of gestational age, duration of stay in the hospital, mother’s
age, parity and Haemoglobin level is given. The table suggests that
regression coefficient of the period of gestation, duration of hospital
stay, parity and Haemoglobin level are statistically significant. The
Odds Ratio of delivering a low birth weight baby with a period of
gestation of 28-29 weeks is found to be 289 times as compared to the
baby with a period of gestation of $40 weeks. This Odds Ratio decreases
consistently with the increase in the period of gestation. Similarly, the
probability of having a low birth weight baby with a hospital stay of
less than two days was 2 to 3 times higher than the probability of a
newborn with the duration of stay of 4-5 days. The probability of low
birth weight babies again increased when the duration of stay in the
hospital was six days and more.
The age of the mother did not show any significant effect on the
birth weight. However, primi-para mothers had 1.2 times higher chance
of having a low weight baby as compared to mothers with at least
parity one. The Odds Ratio of having a low birth weight baby decreased
with the increase in the Haemoglobin level.
118
Low Birth Weight and Early Neonatal Mortality
The model has the sensitivity 91.6 per cent and the specificity of 56.5
per cent. The model was able to correctly classify 88.5 per cent of the
low weight babies with cut off probability 0.15.
Early Neonatal Mortality by Sex, and Birth Weight: Table 9 reveals that
males had significantly higher probability of neonatal death (1.8 per
cent) as compared to females (1.4 per cent) (RR=1.29). T h e e a r l y
neonatal mortality was the highest (71.3 per cent) (RR=237.7) in babies
with birth weight <1000 gms. It decreases consistently with the increase
in the birth weight up to babies with birth weight 3000-3500 gms but
increases again thus making a reverse ‘J’ type curve.
Age specific early neonatal mortality was highest 5.31/1000
(RR=6.4) in babies available at the beginning of the 1 day andst
3.22/1000 (RR=3.9) in babies available at the beginning of the 2 day. nd
The early neonatal mortality decreases consistently up to the 8 day inth
hospital and thereafter, it increases (as babies with relatively better
health were discharged early).
Multivariate Models and Analysis: In table 10a, details of logistic
regression model to estimate early neonatal mortality on the basis of age
at death, sex and birth weight are given. The slope coefficients ‘B’ for
age at death are in comparison of weight at birth 3000-3500 gm and age
at death 7 days and onwards. The Odds Ratio of mortality decreased
sharply from 242.4 to 2.1 in newborn discharged from the hospital on
the first day as compared to newborn discharged at the sixth day. The
Odds Ratio of mortality was as high as 982.5 in newborn with birth
weight <1000 gm and decreased consistently to 1.4 in newborn with
birth weight 2500-3000 gm and then to 2.5 in babies with birth weight
$3500 gm with respect to the mortality in newborn with birth weight
3000-3500 gm. The Odds Ratio of mortality in male newborn was 1.7
times that of mortality in newborn females.
The model identified 98.4 per cent of the newborn babies’ survival
and mortality correctly with sensitivity 60.9 per cent and specificity of
99.0 per cent at 0.15 cut off point. In figure 1, ROC curve for early
neonatal mortality of the logistic regression model along with its co-
ordinates in table 10b are given, so that the model can be used to
estimate early neonatal mortality with different cut off points.
In table 11, the results of the Cox regression model of early neonatal
mortality are given. The Relative Risk (RR) of early neonatal mortality
in the newborn with birth weight <1000 gms was 327.8 as compared to
that in new born with birth weight 3000-3500 gms, and then, RR
decreased consistently till the birth weight reached 3500 gms.
119

Child Survival and Health
Thereafter, mortality increased, making a classical ‘U’ type curve. The
male newborn babies had 1.4 times early neonatal mortality as
compared in female newborn babies.
Table 11b reveals that the early neonatal mortality was highest in
the first day of life and thereafter, it decreased consistently. In figures
4 and 5, plots of survival function and hazard function at mean of
covariates have been given.
DiscussionThe weight at birth of newborn babies was least of the babies born to
mothers of age <20 years and then it increased consistently up to 30-39
years of maternal age and, thereafter, a decrease in weight at birth was
observed P#0.001. The low weight babies of weight at birth <2000gm
were highest in the maternal age group 40 years and above followed by
to mothers of age <20 years; P#0.05.
The birth weight of the newborn babies born to primi-para mothers
was the least followed by babies born to mothers of parity 4+; the
differences were highly significantly P<0.001.
The newborn babies with low weight at birth <2000gm were 9.3 per
cent in primi-para mothers and then decreased to 7.5 per cent in parity
one, and again it increased consistently, making classical ‘U’ type curve,
P<0.001.
The mean weight at birth, though, significant at P<0.001 increased
with increasing Haemoglobin but the mothers with Haemoglobin
groups <7.0gm/dl and 7.02-8.9gm/dl did not show any relationship
with weight at birth. The weight at birth increased consistently with the
period of gestation; from 1387gms with SD 553gms in gestation group
28-29 wks to 2732gms with SD 395gms in gestation group $40wks, the
differences were highly significant P<0.001.
The low weight at birth <2000gms was 87 per cent in the babies
born with gestation 28-29 wks and decreased consistently and
significantly P<0.001 to 2.4 per cent in gestation group $40 wks.
Forssas and Gissler (1999) had similar findings that maternal
characteristics e.g., age, primi-para parity, high parity, smoking, low
socio-economic status, being unmarried and earlier perinatal mortality
are the important determinants of low weight at birth and perinatal
mortality.
The slope ‘B’ coefficients of regression model to estimating the
weight at birth using gestation, Haemoglobin, age of the mother, parity
and hospital stay were statistically significant (P<0.001), however, the
120

Low Birth Weight and Early Neonatal Mortality
coefficient of determination ‘R ’ was only 0.212; P<0.001. The histogram2
and super-imposed standardised normal curve of regression’s
standardised residuals exhibited perfect normal distribution.
The Slope ‘B’ coefficients of gestational age, hospital stay, parity
and Haemoglobin in logistic regression model to estimate low weight
babies at birth of weight <2000gm were statistically significant. The age
of mothers did not show any significant effect on delivery of low weight
babies
The early neonatal mortality was as high as 71.3 per cent
(RR=237.7) in birth weight group <1000gms and then, decreased
consistently with weight at birth to 0.3 per cent in birth weight group
3000-3500 gms, thereafter it again increased with weight at birth;
making a reverse ‘J’ type curve. The males had significantly higher
P<0.001 early neonatal mortality 1.8 per cent as compared to females 1.4
per cent (RR=1.29).
The model had the sensitivity 91.6 per cent and specificity 56.5 per
cent classifying correctly 88.5 per cent low birth weight babies with
weight <2000gms at cut off probability 0.15.
Hosmer and Lemeshow statistics showed that the model had a very
good fit. The ROC curve and its coordinates have also been given to
estimate the sensitivity and specificity at different cut off points to
estimate the low weight at birth <2000 gms, so that model can be used
efficiently by the health care providers.
Age specific early neonatal mortality was highest 5.31/1000
(RR=6.4) in babies available at the beginning of the 1 day andst
3.22/1000 (RR=3.9) in babies available at the beginning of the 2 day. nd
The early neonatal mortality decreased consistently till the 8 day inth
hospital and thereafter, it increased (as the babies of better health were
discharged early).
Wilcox (1983) has confirmed that the perinatal mortality was
closely related to weight at birth. Results established that the
distribution of weight at birth is essentially Guassian, with additional
births at lower ends, that divides the distribution in two components;
i) a predominant distribution (Guassian) and ii) a residual distribution.
Findings show that predominant distribution is largely of term births,
while the residual distribution is composed almost entirely of pre-term
births. Further, it is observed that the male babies are at a higher risk of
dying during the perinatal period than female babies, despite the fact
that the prevalence of low birth weight is higher in male babies than in
female babies.
121
Child Survival and Health
The differences in birth weight by the day of discharge were
statistically significant but absolute differences cannot be said of any
clinical importance. However, SD of the weight at birth of newborn
babies on first and second days were the highest, indicating that
newborn babies who left the hospital on the first and the second day
had very low or very high birth weight. This has been confirmed by the
fact that babies with weight at birth <2000gms were the highest when
they were discharged on the first or on the second day from the hospital
P<0.001 (due to higher mortality in early days of life).
The 71.6 per cent of the total variation of four variables viz. age,
weight at birth, parity and maternal age were explained by the two
principal components. The 1 Principal component is formed byst
gestational age (r=0.857) and baby weight at birth (r=0.855). This
principal component is subject to monitoring and can be improved by
better antenatal care. The 2 principal component is formed by paritynd
(r=0.831) and maternal age (r=0.830), and cannot be changed during a
given pregnancy.
The Logistic regression model to estimate early neonatal mortality
using age at death, sex and weight at birth revealed that the OR of
mortality was as high as 982.5 in newborn babies born with weight at
birth <1000gms and decreased consistently to 1.4 born with weight at
birth 2500-3000gms and again increased to 2.5 in weight group
$3500gms with respect to the mortality in babies born with weight at
birth 3000-3500gms. The OR of mortality in male newborn babies was
1.7 times as compared to in females.
The model identified 98.4 per cent of the newborn babies’ survival
and mortality correctly with sensitivity 60.9 per cent and specificity 99.0
per cent at 0.15 cut of point. The ROC curve for early neonatal
mortality of Logistic regression model along with its co-ordinates have
been provided, so that the model can be used to estimate early neonatal
mortality at different cut of points.
The Cox regression model of early neonatal mortality affected by
groups of weight at birth as compared to weight group 3000-3500gms
and in sex-male of the newborn has been given. The Relative Risk (RR)
of early neonatal mortality in the newborn babies of weight at birth
<1000gms was 327.8 as compared in the babies of weight at birth 3000-
3500gms, and then, RR decreased consistently till the weight at birth
reached 3500gms, thereafter, mortality increased, making a classical
reverse ‘J’ type curve. The early neonatal mortality in male newborn is
found to be 1.4 times that in female newborn.
122

Low Birth Weight and Early Neonatal Mortality
The Cox Regression model reveals that the early neonatal mortality
was highest in the 1 day of life and thereafter, it decreased consistently. st
The analysis of variance reveals a linear relationship between birth
weight and all maternal variables. Results also indicate significant
deviation from linearity. These findings of linearity and deviation from
linearity are contradictory, but statistically speaking this can happen
because of large sample size.
ReferencesAgustin Conde-Agudelo, Belizan JM (2000) Epidemiology of fetal
deaths in Latin America. Acta Obstet Gynaecol Scand 79:371-378.
Arifeen SE, Black RE, Caulfield LE, Antelman G, Baqui AH, Nahar Q,
Alamgir S, Mahmud H (2000) Infant growth patterns in the slums
of Dhaka in relation to birth weight, intrauterine growth
retardation, and prematurity. Am J Clin Nutr 72(4):1010–7.
Collins JW Jr, David RJ (1990) Differential survival rates among low
birth weight black and white infants in a tertiary care hospital.
Epidemiology 1:16-20.
Erja F, Gissler M, Sihvonen M, Hemminki E (1999) Maternal predictors
of Perinatal Mortality: The role of birth weight. International Journal
of Epidemiology 28:475-478.
Hediger ML, Scholl TO, Schall JL, Miller LW, Fischer RL (1995) Fetal
growth and the etiology of preterm delivery. Obstetrics Gynecology
85:175-82
Pastore LM, Williams CD (2004) Perinatal outcomes in singletons
following in-vitro fertilization: A meta-analysis. Obstetrics
Gynecology 104: 411-411.
Salihu HM, Williams MJ, Emusu D (2005) Perinatal mortality in the
normal siblings of anomalous triplets. Obstetrics Gynecology 105:
1419-1423.
Wilcox AJ, Russell T (1983) Birth weight and perinatal mortality: On the
frequency distribution of birth weight. International Journal of
Epidemiology 12: 314-318.
Wilcox AJ (1981) Birth weight, gestation and the fetal growth curve.
American Journal of Obstetrics and Gynecology 139:863-67.
World Health Organization (2006) Neonatal and Perinatal Mortality-
Country, Regional and Global Estimates. Geneva, World Health
Organisation.
123

Child Survival and Health
Table 1
Birth weight by age of mother
Age in
Years
N
(%)
<2000
(%)
RR Mean SD
<20 1016
(3.6)
104
(10.2)
1.19 2494 463
20-29 24566
(87.8)
2116
(8.6)
1.00 2574 469
30-39 2339
(8.4)
229
(9.8)
1.14 2588 512
40- 58
(0.2)
8
(13.8)
1.60 2529 448
Total 27979
(100.0)
2457
(8.8)
- 2572 473
P2;(DF=3)=8.34;
P=0.039
F(3,27975)=10.3;
P=0.001
124

Low Birth Weight and Early Neonatal Mortality
Table 2
Birth weight by parity
Parity N
(%)
<2000gm
(%)
RR Mean SD
0 16128
(57.6)
1493
(9.3)
1.24 2540 464
1 9218
(32.9)
692
(7.5)
1.00 2624 471
2 2112
(7.5)
203
(9.6)
1.28 2600 501
3 400
(1.4)
55
(13.8)
1.84 2528 547
4- 121
(0.4)
14
(11.6)
1.55 2531 519
Total 27979
(100.0)
2457
(8.8)
- 2572 473
P2;(DF=4)=38.6;
P=0.000
F(4,27974)=50.2;
P=0.000
Table 3a
Birth weight by the level of Haemoglobin
Hb N
(%)
<2000gm
(%)
RR Mean S D
<7.0 1819
(6.5)
204
(11.2)
1.37 2528 486
7.0-8.9 3472
(12.4)
382
(11.0)
1.37 2518 489
9.0-10.9 19884
(71.1)
1640
(8.2)
1.00 2582 466
11- 2804
(10.0)
231
(8.2)
1 2594 482
Total 27979
(100.0)
2457
(8.8)
- 2572 473
P2;(DF=3)=42.9;
P=0.000
F(3,27975)=25.3;
P=0.000
125

Child Survival and Health
Table 3b
Results of analysis of variance between birth weight and
haemoglobin level
Source of Variation SS DF F Sig.
Between Combined 16.9 3 25.3 0
Linearity 12.9 1 58 0
Deviation from
linearity
4 2 9.0 .000
Within Groups 6230.7 27975 Eta =0.0032
Total 6247.6 27978 R =0.0022
Table 4a
Birth weight by period of gestation
Period of
gestation
(months)
N
(%)
<2000gms
(%)
RR Mean S D
28-29 154
(0.6)
134
(87.0)
36.25 1387 553
30-31 226
(0.8)
180
(79.6)
33.17 1585 546
32-33 491
(1.8)
358
(72.9)
30.38 1718 508
34-35 1149
(4.1)
447
(38.9)
16.21 2091 510
36-37 4203
(15.0)
531
(12.6)
5.25 2418 442
38-39 17739
(63.4)
711
(4.0)
1.67 2650 404
40- 4017
(14.4)
96
(2.4)
1 2732 395
Total 27979
(100.0)
2457
(8.8)
- 2572 473
P2=7203;DF=3;
P=0.000
F(6,27972)=1309.9;
P=0.000
126

Low Birth Weight and Early Neonatal Mortality
Table 4b
Analysis of variance between birth weight and period of gestation
Source of Variation SS DF F Sig.
Between
Combined 1370.4 6 1309.9 0
Linearity 1263.8 1 7248.3 0
Deviation from
linearity106.6 5 122.3 0
Within Groups 4877.2 27972 Eta =0.2192
Total 6247.6 27978 R =0.2022
Table 5
Newborn babies with low birth weight
Days at
Discharge
Total Weight at Birth in gm.
<2000 gms
(%)
RR Mean S D
141
(0.1)
6
(14.6)3.11 2532 558
2135
(0.5)
19
(14.1)3 2504 569
31543
(5.5)
84
(5.4)1.15 2599 434
42261
(8.1)
107
(4.7)1 2599 422
52638
(9.4)
124
(4.7)1 2595 424
62893
(10.3)
170
(5.9)1.26 2588 429
7 18468
(66.0)
1947
(10.5)
2.23 2561 493
Total 27979
(100.0)
2457
(8.8)
- 2572 473
P2=231.0
DF=6
P=0.000
F=5.992
DF=6,27972
P=0.000
127

Child Survival and Health
Table 6
Rotated principal Component matrix (Varimax)
Extraction Component
(Variance explained=71.6)
Score Coefficient
Component 1
(36.8)
Component 2
(34.8)
1 2
GEST (0.74) 0.857 0.586 -0.069
BW (0.74) 0.855 0.582 0.062
Parity (0.69) 0.831 -0.009 0.595
Age (0.69) 0.83 0.002 0.594
Table 7
Regression model for birth weight
R =0.212; P=0.0002
Model B SE $ Sig. 95% CI of B
Constant 1.141 0.025 - .000 1.092 1.189
Gestation 0.228 0.003 0.443 .000 0.223 0.234
Hb 0.022 0.004 0.031 0 0.015 0.029
Age Groups 0.022 0.007 0.016 .003 0.007 0.036
Parity 0.050 0.004 0.078 .000 0.043 0.057
Hospital stay -0.003 0 -0.045 0 -0.003 -0.002
128

Low Birth Weight and Early Neonatal Mortality
Table 8
Logistic regression model to estimate low birth weight
Variables B S.E. Sig. OR 95% C.I. for OR
Gestation wrt 40+; P=0.000
28-29 5.666 .264 .000 288.9 172.3 484.5
30-31 5.016 .196 .000 150.8 102.6 221.7
32-33 4.631 .146 .000 102.6 77.0 136.6
34-35 3.196 .121 .000 24.4 19.3 31
36-37 1.747 .114 .000 5.7 4.6 7.2
38-39 .517 .111 .000 1. 7 1.4 2.1
Hospital Stay wrt 4-5 days; P=0.000
1 .812 .581 .162 2. 3 0.7 7
2 1.052 .321 .001 2.9 1.5 5.4
3 0.037 .150 .807 1.0 0.8 1.4
6 .244 .116 .035 1.3 1.0 1.6
7+ .667 .081 .000 1.9 1.7 2.3
Age wrt 20-29 years; P=0.824
<20 .058 .126 .648 1.1 0.8 1.4
30-39 .053 .089 .549 1.1 0.9 1.3
40+ .286 .463 .538 1.3 0.5 3.3
Parity wrt 4+; P=0.000
0 .191 .347 .581 1.2 0.6 2.4
1 -.163 .348 .640 0.9 0.4 1.7
2 -.075 .355 .833 0.9 0.5 1.9
3 .111 .389 .776 1.1 0.5 2.4
Haemoglobin wrt 11+;P=.002
<7 .341 .118 .004 1.4 1.1 1.8
7-9 .236 .103 .022 1.3 1.0 1.5
9-11 .058 .085 .492 1.1 0.9 1.3
Constant -4.363 0.377 .000 0.01
Sensitivity=91.6; Specificity=56.5; Correctly Classified=88.5;
Cut of Point=0.15
Hosmer and Lemeshow Test; P2=5.2; DF=7; P=0.641
129

Child Survival and Health
Table 9
Sex, birth weight and early neonatal mortality
a) Sex P =8.0, DF=1 Died (%) RR Total (%)2
Total 568 (1.6) - 35151 (100.0)
Male 331 (1.8) 1.29 18417 (100.0)
Female 237 (1.4) 1.00 16734 (100.0)
b) Prognosis by birth weight P =6058.6, DF=62
<1000 77 (71.3) 237.7 108 (100.0)
1000- 171 (24.8) 82.7 689 (100.0)
1500- 131 (5.4) 18.0 2439 (100.0)
2000- 97 (1.0) 3.3 9509 (100.0)
2500- 69 (0.4) 1.3 15552 (100.0)
3000- 19(0.3) 1.0 6076 (100.0)
3500- 6 (0.7) 2.3 819 (100.0)
c) Age specific early neonatal mortality/1000 babies available in the
beginning of the day
Actual
1 187(5.31) 6.40 35192
2 112(3.22) 3.88 34815
3 70(2.05) 2.47 34164
4 44(1.40) 1.69 31491
5 33(1.17) 1.41 28221
6 23(0.98) 1.18 23490
7 18(0.94) 1.13 19197
8 13(0.83) 1.00 15579
9 11(1.02) 1.23 10747
10 12(1.68) 2.02 7122
11+ 47(9.89) 11.92 4752*
*It is assumed that all babies those were available at the beginning of
the 11 day were discharged after 11 day for the computation ofth
mortality at 11 day, when it was not so. th
130

Low Birth Weight and Early Neonatal Mortality
Table 10a
Logistic regression model to estimate mortality using
age at death, sex and weight at birth (R =0.514)2
Variables B S.E. Sig. OR 95.0% C.I.
Age at Death (in days) wrt 7+ days
1 5.491 0.191 .000 242.4 166.6 352.8
2 4.170 0.182 .000 64.7 45.3 92.5
3 2.367 0.182 .000 10.7 7.5 15.2
4 1.716 0.202 .000 5.6 3.7 8.3
5 1.075 0.218 .000 2.9 1.9 4.5
6 0.742 0.245 .003 2.1 1.3 3.4
SEX (Male) 0.527 0.112 .000 1.7 1.4 2.1
Weight at Birth wrt 3000-3500
<1000 6.890 0.369 .000 982.6 476.5 2026.4
1000- 5.024 0.273 .000 152.1 89 259.8
1500- 3.189 0.262 .000 24.3 14.5 40.6
2000- 1.307 0.259 .000 3.7 2.2 6.1
2500- .370 0.266 .164 1.4 0.9 2.4
3500- 0.931 0.489 0.057 2.5 1 6.6
Constant -7.706 0.277 0 Correctly identified=98.4
Sensitivity=60.9; Specificity=99.0); Cut of point P=0.15
Hosmer and Lemeshow Test; P2=18.4; DF=7; P=0.010
131

Child Survival and Health
Table 10b
Coordinates of the ROC curve of logistic model
with birth weight, age at death and sex as predictors
Area= 0.941; SE=0.006; 95%CI=0.929-0.953
Positive if Sensitivity 1 - Specificity
0.009 0.903 0.168
0.021 0.842 0.063
0.034 0.815 0.046
0.039 0.808 0.042
0.054 0.778 0.035
0.065 0.748 0.026
0.081 0.731 0.022
0.101 0.695 0.019
0.118 0.632 0.012
0.145 0.609 0.010
Table 11a
Variables in Cox regression
Variables
P2=5750
DF=7
B SE Sig. Exp(B) 95.0% CI for
Exp(B)
Lower Upper
BW wrt 3000-3500
<1000 5.792 0.257 .000 327.8 198.2 542.0
1000- 4.411 0.242 .000 82.4 51.2 132.4
1500- 2.853 0.246 .000 17.3 10.7 28.1
2000- 1.235 0.251 .000 3.4 2.1 5.6
2500- 0.398 0.259 .125 1.5 0.9 2.5
3500- 0.817 0.468 .081 2.3 0.9 5.7
Sex (Male) 0.352 0.085 .000 1.4 1.2 1.7
132

Low Birth Weight and Early Neonatal Mortality
Table 11b
Cox regression survival table
Days Baseline
Cumulative
Hazard
At mean of covariates
Survival SE Cumulative
Hazard
1 0.001 0.998 0 .002
2 .001 .996 0 0.004
3 .002 .995 .000 0.005
4 .002 .995 .000 0.005
5 .002 .994 .000 0.006
6 .002 .994 .000 0.006
7 .003 .992 .001 0.008
133

Child Survival and Health
Figure 1
ROC curve for logistic regression model
using birth weight, sex and age at death
134

Correlates of Nutritional Status
of Children in Madhya Pradesh
Pramod Kumar VermaRajesh Tailor
IntroductionIn the developing countries, children are vulnerable to under nutrition
because of low dietary intake, prevalence of infectious diseases, lack of
appropriate care and inequitable distribution of food within the
household. Adequate nutrition is critical to child development. The
period from birth to two years of age is important for optimal growth,
health and development of the child. At this age, children are
particularly vulnerable to growth retardation, micro-nutrient
deficiencies and common childhood illnesses such as diarrhoea,
anaemia and acute respiratory infection. According to Winikoff (2000),
diarrhoea is a serious disease in developing countries, are known to be
the immediate precipitant of such nutritional disorders as Marasmius,
Kwashiorkor and xerophthalmia. It is also well known that poor
nutritional status plays a major role in increasing both the susceptibility
to and the severity of infection.
The nutritional status of the child is strongly related to the
nutritional status of the mother. Under nutrition in children is more
prevalent in children whose mother’s body mass index is below 18.5 as
compared to children whose mother’s body mass index is above 18.5.
The nutritional status of children is also directly related to the standard
of living index. Children from households with low standard of living
index are twice as likely to be under nourished as children from
households with a high standard of living index.
Inadequate nutrition is a problem throughout India but in Madhya
Pradesh under nutrition is more pronounced. According to the National
135

Child Survival and Health
Family Health Survey 2005-06, about 58 per cent of children below five
years of age in Madhya Pradesh were found to be low weight for age
while about 40 per cent were low weight for height while about 47 per
cent were small height for age. This means that both chronic and short
duration under nutrition is quite substantial in the state (IIPS 2007).
In this paper, we attempt to give a brief outline of the under
nutrition in children below five years of age in Madhya Pradesh as well
as the risk of diarrhoea and acute respiratory infections.
Data and MethodologyThe analysis is based on the information available through the National
Family Health Survey 2005-06. In Madhya Pradesh, the survey covered
2730 children below five years of age. The survey collected information
related to the anthropometric measurement of all children below five
years of age included in the sample along with information related to
a range of social, economic and demographic variables including age,
sex, birth order, residence, mother’s education, religion, caste and
standard of living. The survey also collected information about the
prevalence of diarrhoea and acute respiratory infections in children. The
anthropometric data available through the survey was used to assess
the nutritional status of the child. Actual calculations were based on the
application of the ANTHRO software developed by the World Health
Organisation which is based on the new global standard (WHO ). Using
this software, three indices commonly used for measuring the
nutritional status - weight-for-age, height-for-age and weight-for-height
- were calculated for each child included in the sample. The three
indices reflect the three dimensions of nutritional status in children. The
low height-for-age, for example reflects the chronic, long term under
nutrition and is generally termed as stunting. On the other hand, low
weight-for-height reflects the short duration under nutrition of
immediate context and is generally termed as wasting. Finally, the low
weight-for-age reflects the combined effect of height-for-age and
weight-for-height and is the most widely used indicator of the
nutritional status of the child.
Actual assessment of the nutritional status of the child is done by
converting the observed values of age, weight and height of the child
into standard normal variate (Z) by comparing them with the mean and
standard deviation of the standard population. The nutritional status of
the child was classified as normal if the Z-score ranged between 0.00
136

Correlates of Nutritional Status of Children
and -2, moderately under nourished if the Z-score ranged between =2
and -3, and severely under nourished if the Z-score was mor than -3.00.
The National Family Health Survey also provides information
about the prevalence of diarrhoea and acute respiratory infections in
children. The prevalence rate is estimated on the basis of the
information provided by the parents or other elder members of the
child. Details about the methodology for identifying cases of diarrhoea
and acute respiratory infections applied during the National Family
Health Survey is available elsewhere and not repeated here (IIPS 2007).
Results and DiscussionNutritional Status of Children. The level of under nutrition in children
below five years in the state is reflected in table 1. Among the 2730
children below five years of age covered during the National Family
Health Survey 2005-06, about 52 per cent were stunted, more than 38
per cent were wasted while more than 58 per cent were low weight for
age according to the standards laid down by the World Health
Organisation. It is also clear from the table that most of the under
nutrition in children below five years of age in the state was mild, a
small proportion was moderate and an almost negligible proportion
having severe under nutrition which requires hospitalisation.
Table 1 also presents prevalence of stunting, wasting and under
weight by basic characteristics of children and their families. The
prevalence of stunting and under weight has been found to be the
highest in the age group 24-35 months whereas the prevalence of
wasting has been found to be the highest in the age group 6-11 months.
It is clear from table 1 that the age pattern of stunting and under weight
follows a reverse U shape curve whereas the prevalence of wasting
decreases monotonically after 6-11 months of age. The table also
suggests that even during the first six months of life, when most babies
are breastfed, the prevalence of under nutrition is quite high. It is also
interesting to observe from the table that the prevalence of severe under
nutrition is the highest in children less than 6 months of age. This
suggests that the growth of the child has not been normal during
pregnancy which may be due to the poor nutritional status of the
mother.
As regards sex differentials in the prevalence of under nutrition,
there appears very little difference in the prevalence of stunting,
wasting and under weight between boys and girls. On the other hand,
there is a clear indication that prevalence of under nutrition as defined
137

Child Survival and Health
in terms of the three indices increases with the increase in birth order;
the prevalence has been found to be the highest in children with birth
order 6.
Overall, prevalence of under nutrition has been found to be high in
girls than in boys. Under nutrition is generally lower for first births than
for subsequent births and consistently increases with the increase in the
birth order for all measures of nutritional status. Short birth intervals
are associated with higher levels of under nutrition, except in the case
of wasting. Children who are judged by their mother to have been small
or very small at the time of birth are more likely to be under nourished.
Under nutrition has been found to be substantially higher in rural
areas than in urban areas of the state. Even in the urban areas, 56 per
cent of children have been found to be stunted, 69 per cent wasted, and
52 per cent underweight. As compared to urban children, rural children
are more under nourished due to the economic and social
backwardness. Under nutrition has a strong positive relationship with
the education of the mother. The proportion of children who have been
found to be severely stunted is almost one to two times as high for
children whose mother has no education as compared to children
whose mother has 12 or more years of education. Hindu and Muslim
children are about equally likely to be under nourished, but children
from other communities (Christian, Sikh, and Jain) are considerably
better nourished. Children belonging to Scheduled Castes, Scheduled
Tribes, and other backward classes have relatively high levels of under-
nutrition in terms of all the three measures of nutritional status.
Children belonging to Scheduled Tribes have the poorest nutritional
status. The prevalence of all of the three measures of nutritional status
decrease steadily with an increase in the living standard of the family
living. Children from households with a low standard of living are
twice as likely to be under nourished as children from households with
a high standard of living.
Prevalence of Diarrhea and Acute Respiratory Infection. Diarrhoea is the
single most common cause of death among children below five years of
age. The prevalence of diarrhoea is estimated to be around 13 per cent
while that of acute respiratory infections (ARI) is estimated to be 6 per
cent in Madhya Pradesh. Deaths from acute diarrhoea are usually
caused by dehydration due to loss of water and electrolytes. Early
diagnosis and treatment with antibiotics can prevent a large proportion
of deaths caused by ARI. In National Family Health Survey, the
prevalence of ARI was estimated by asking mothers whether their
138

Correlates of Nutritional Status of Children
children below five years of age had cough accompanied chest related
short, rapid breathing in the two weeks preceding the survey.
Results of the multinomial regression analysis are given in tables 2
through 4 with the dependent variable being stunting, wasting and
underweight respectively. The regression coefficients are in expected
direction. For example, the odds of a child being stunted are the highest
in children aged 12-35 months and lowest in children aged 0-11 months.
Male children have relatively lower odds of being stunted compared to
female children although the difference is not statistically significant.
However, in case of wasting, the sex difference is found to be
statistically significant. In case of underweight, odds of being severely
underweight is statistically significantly higher in males as compared
to females. The probability of a child getting stunted increases with the
birth order, whereas Scheduled Castes/Tribes children are more likely
to be stunted than the upper castes children. Similarly, mother’s
education has a strong impact on the nutritional status of children.
In case of wasting and underweight also, a similar situation appears
to prevail in the state. The results of the regression analysis confirm that
the nutritional status of the child is strongly influenced by the social,
economic and demographic characteristics of the child and the mother.
This means that reduction in the prevalence of under nutrition requires
a multi-dimensional, development oriented approach.
ConclusionsThe analysis presented here highlights the complexities involved in
tackling the problem of under nutrition in children which is so
pervasive in the state. Given the very strong social, economic and
cultural dimensions of under nutrition in children, the techno-clinical
approach of reducing under nutrition may not be a viable preposition.
Nutritional status of the child is a reflection of the broad social and
cultural milieu of the society which is conditioned by the economic
status of households. As such, more pragmatic and culturally acceptable
approaches are needed to tackle the problem of under nutrition in
children.
ReferencesAustin et. al(2008) Population and nutrition. The Milbank Memorial Fund
Quarterly. Health and Society 52(2):169.
139

Child Survival and Health
Calloway HD (2008) Functional consequences of malnutrition. Review
of Infectious Diseases Vol 4(4), The Biology of Parasitic Infection:
Workshop on Interactions of Nutrition and Parasitic Diseases (Jul. -
Aug., 1982), pp. 742-43.
Chkhaidze I, et. at (2006) Serodiagnosis of acute respiratory infections
in children in Georgia. Indian Journal of Pediatrics 73:4.
Greiner TH (1977) Infant food advertising and malnutrition in St.
Vincent thesis, Cornell University.
Gupta N. et. al (2007) An evaluation of diarrheal diseases and acute
respiratory infections control programmes in a Delhi slum. Indian
Journal of Pediatrics 74.
Harriss B et. al (1990) Poverty and malnutrition at extremes of south
Asian food systems. Economic and Political Weekly, pp 2798.
International Institute for Population Sciences (IIPS) (2007) National
Family Health Survey 2005-06, India Report. Mumbai, International
Institute for Population Sciences.
Menon T, et al (2004) Group A streptococcal infections of the pharynx
in a rural population in south India. Indian Journal of Medical
Research 119 (Suppl):171.
140

Correlates of Nutritional Status of Children
Table 1
Nutritional status of children in Madhya Pradesh, 2005-06
Stunting Wasting Underweight
Moderate Severe N Moderate Severe N Moderate Severe N
Age (in months)
<6 15.0 16.2 234 20.0 29.5 220 23.9 23.9 234
6-11 15.8 9.6 311 23.8 21.5 311 27.3 20.9 311
12-23 26.3 29.6 520 20.4 17.0 519 30 29 520
24-35 24.7 35.3 515 19.7 13.6 513 30.3 30.9 515
36-47 23.1 27.8 589 19.2 12.6 588 33.4 27.3 589
48-59 22.8 23.5 553 18.5 13.2 552 32.4 25.9 553
Sex of child
Male 21.5 26.1 1424 21.0 17.6 1417 29.6 28.1 1424
Female 23.4 25.2 1298 18.9 14.5 1286 31.4 25.8 1298
Birth order
1 20.8 19.2 787 17.6 17.0 784 27.8 22.5 787
2-3 22.9 23.3 1190 21.6 15.6 1178 31 24.9 1190
4+ 23.2 36.2 745 20.0 16.2 741 32.3 35.2 745
Residence
Urban 21.1 19.6 1169 18.4 16.0 1160 28.7 21 1169
Rural 23.4 30.2 1553 21.1 16.3 1543 31.7 31.6 1553
Mothers education
Nill 23.4 32.9 1278 20.6 17.1 1269 31.1 34.8 1278
Primary 22.4 23.3 460 23.8 13.8 458 35.2 23.5 460
Primary+ 21.1 17.3 984 17.4 16.1 976 27.3 18.5 984
Religion
Hindu 22.6 26.0 2415 19.9 16.2 2398 30 27.7 2415
Muslim 21.6 23.9 259 21.0 16.7 257 33.6 23.6 259
Others 16.7 14.6 48 18.8 12.5 48 35.4 8.3 48
Caste
SC/ST 24.6 31.0 1032 20.6 18.2 1028 30.8 35.6 1032
OBC 21.4 26.3 1098 20.0 13.4 1089 32.5 23 1098
Others 20.4 15.0 592 18.8 17.7 586 26 19.6 592
Family living standard
Low 21.7 32.0 998 20.7 19.3 993 30.6 34.7 998
Medium 25.6 28.6 761 21.5 15.0 755 31.5 30.1 761
High 20.6 16.7 963 18.0 13.8 955 29.5 16.6 963
Total 22.4 25.6 2722 20.0 16.2 2703 30.5 27 2722
Source: Computed from NFHS 2005-06 data.
141
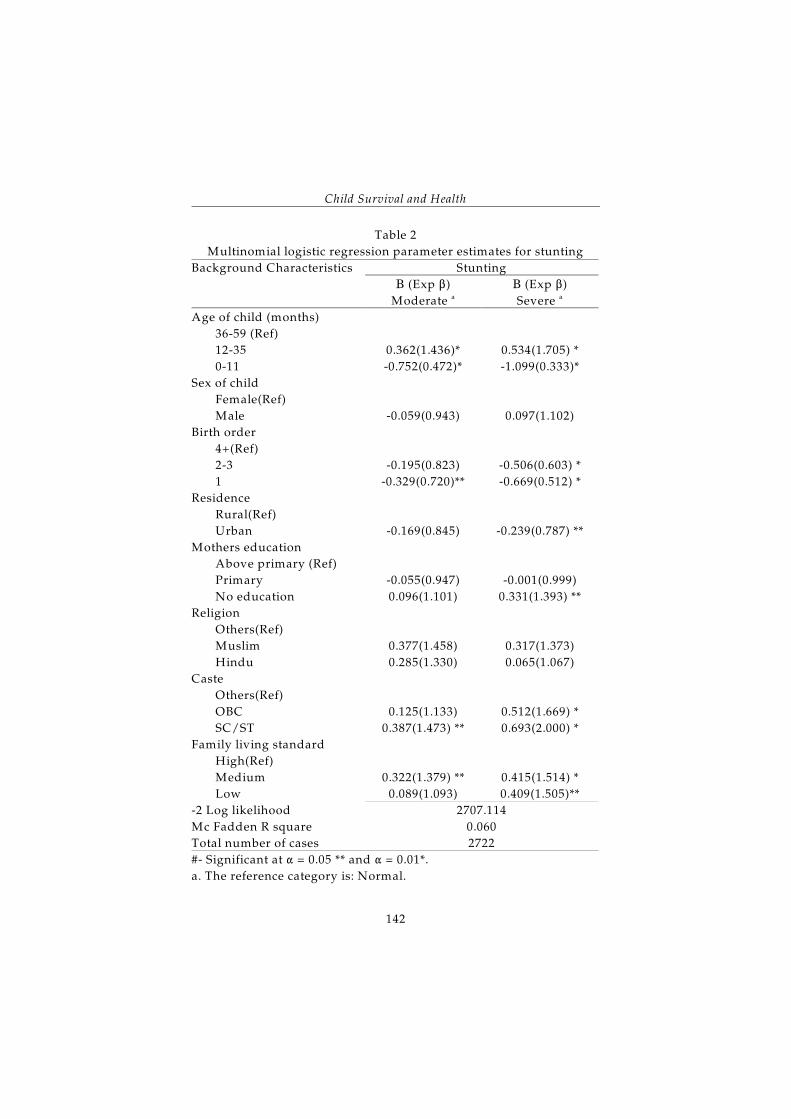
Child Survival and Health
Table 2
Multinomial logistic regression parameter estimates for stunting
Background Characteristics Stunting
# (Exp $) # (Exp $)
Moderate Severe a a
Age of child (months)
36-59 (Ref)
12-35
0-11
0.362(1.436)*
-0.752(0.472)*
0.534(1.705) *
-1.099(0.333)*
Sex of child
Female(Ref)
Male -0.059(0.943) 0.097(1.102)
Birth order
4+(Ref)
2-3
1
-0.195(0.823)
-0.329(0.720)**
-0.506(0.603) *
-0.669(0.512) *
Residence
Rural(Ref)
Urban
-0.169(0.845) -0.239(0.787) **
Mothers education
Above primary (Ref)
Primary
No education
-0.055(0.947)
0.096(1.101)
-0.001(0.999)
0.331(1.393) **
Religion
Others(Ref)
Muslim
Hindu
0.377(1.458)
0.285(1.330)
0.317(1.373)
0.065(1.067)
Caste
Others(Ref)
OBC
SC/ST
0.125(1.133)
0.387(1.473) **
0.512(1.669) *
0.693(2.000) *
Family living standard
High(Ref)
Medium
Low
0.322(1.379) **
0.089(1.093)
0.415(1.514) *
0.409(1.505)**
-2 Log likelihood
Mc Fadden R square
Total number of cases
2707.114
0.060
2722
#- Significant at " = 0.05 ** and " = 0.01*.
a. The reference category is: Normal.
142

Correlates of Nutritional Status of Children
Table 3
Multinomial logistic regression parameter estimates for wasting
Background Characteristics Wasting
# (Exp $) # (Exp $)
Moderate Severe a a
Age of child (months)
36-59 (Ref)
12-35
0-11
0.128(1.136)*
0.435(1.545)
0.221(1.248)**
0.901(2.462)*
Sex of child
Female(Ref)
Male 0.201(1.222) ** 0.275(1.316) **
Birth order
4+(Ref)
2-3
1
0.160(1.174)
-0.060(0.941)
0.058(1.059)
0.073(1.076)
Residence
Rural(Ref)
Urban -0.093(0.911) 0.098(1.103)
Mothers education
Above primary (Ref)
Primary
No education
0.308(1.361) **
0.130(1.139)
-0.126(0.882)
0.008(1.008)
Religion
Others(Ref)
Muslim
Hindu
0.138(1.149)
-0.021(0.979)
0.406(1.501)
0.324(1.383)
Caste
Others(Ref)
OBC
SC/ST
-0.081(0.922)
0.006(1.006)
-0.412(0.662) **
-0.087(0.917)
Family living standard
High(Ref)
Medium
Low
0.150(1.162)
0.161(1.175)
0.249(1.282)
0.541(1.717) *
-2 Log likelihood
Mc Fadden R square
Total number of cases
2511.328
0.020
2703
143
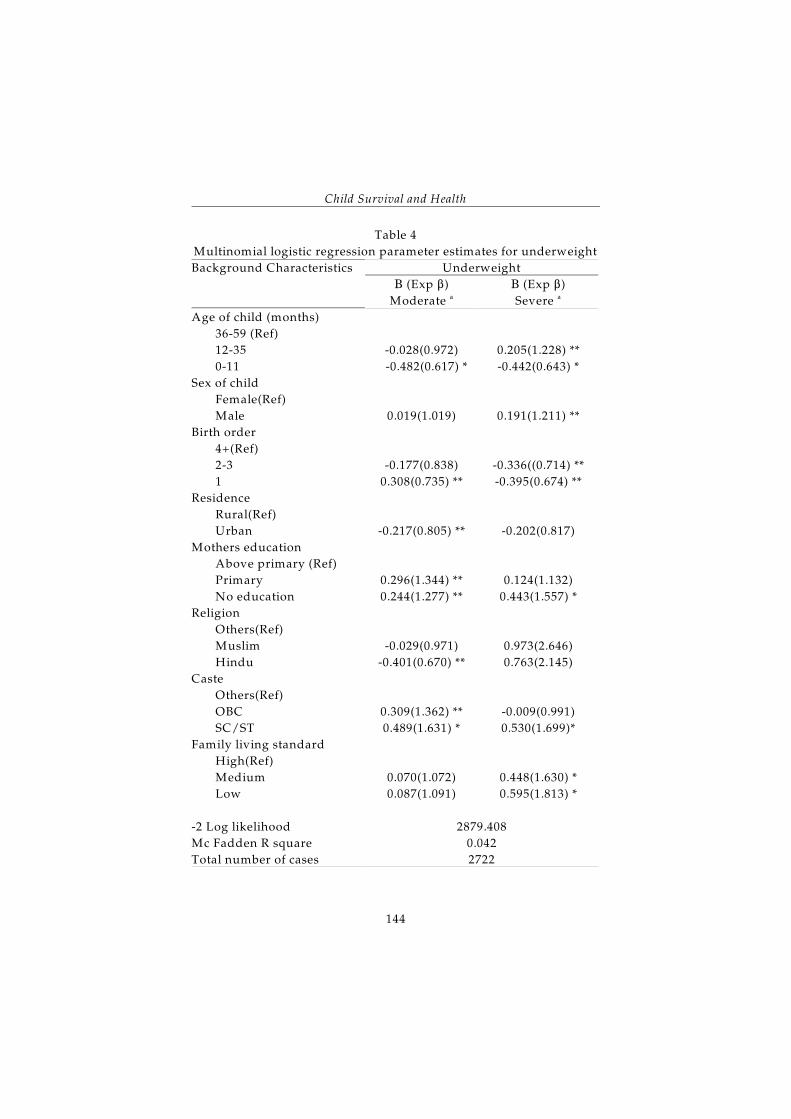
Child Survival and Health
Table 4
Multinomial logistic regression parameter estimates for underweight
Background Characteristics Underweight
# (Exp $) # (Exp $)
Moderate Severe a a
Age of child (months)
36-59 (Ref)
12-35
0-11
-0.028(0.972)
-0.482(0.617) *
0.205(1.228) **
-0.442(0.643) *
Sex of child
Female(Ref)
Male 0.019(1.019) 0.191(1.211) **
Birth order
4+(Ref)
2-3
1
-0.177(0.838)
0.308(0.735) **
-0.336((0.714) **
-0.395(0.674) **
Residence
Rural(Ref)
Urban -0.217(0.805) ** -0.202(0.817)
Mothers education
Above primary (Ref)
Primary
No education
0.296(1.344) **
0.244(1.277) **
0.124(1.132)
0.443(1.557) *
Religion
Others(Ref)
Muslim
Hindu
-0.029(0.971)
-0.401(0.670) **
0.973(2.646)
0.763(2.145)
Caste
Others(Ref)
OBC
SC/ST
0.309(1.362) **
0.489(1.631) *
-0.009(0.991)
0.530(1.699)*
Family living standard
High(Ref)
Medium
Low
0.070(1.072)
0.087(1.091)
0.448(1.630) *
0.595(1.813) *
-2 Log likelihood
Mc Fadden R square
Total number of cases
2879.408
0.042
2722
144

Prevailing Breast Feeding Practices and
Impact of Educational Intervention on
Benefits of Exclusive Breast Feeding
Sanjay DixitUmesh Sinha
Gunjan Taneja
IntroductionThe importance of breast milk for infants is unparallel. It is the most
effective and complete source of nutrition for the new born. Nutritional
elements present in human milk not only provide optimal nutrition and
prevent diarrhoeal and respiratory tract infections in infants but also
favour an optimal psycho-social development. They also play an
important role during the adult life by preventing obesity, diabetes,
arterial hypertension and atherosclerosis. Exclusive breast feeding
during the first six months of life has been recommended by health
agencies the world over. It has been estimated that improved breast-
feeding practices can save up to 1.5 million lives every year.
Unfortunately, the goal of universal exclusive breast feeding in India
still remains elusive in spite of various programmes and policies
adopted by the Government of India. According to the National Family
Health Survey 2005-06, only about 24.5 per cent of mothers in India
initiate breastfeeding within one hour after birth, about 46 per cent
breastfeed exclusively for the first six months and about 57 per cent
nurse the baby beyond six months with the introduction of
complementary food (IIPS 2007). Early cessation of breastfeeding,
needless supplementation and poorly timed complementary feeding
practices are the major stumbling blocks in the normal growth and
development of the child. The present study has been carried out to
analyse patterns of infant feeding practices adopted by mothers
attending an immunisation clinic in Madhya Pradesh and to determine
145

Child Survival and Health
the beneficial effects of breast milk on infants. Specific objectives of the
study are as under:
• To assess the knowledge, attitude and practice regarding breast
feeding.
• To compare the frequency of diarrhoeal and respiratory tract
infections between breast fed and top fed infants.
• To compare the length and weight of breast fed and top fed infants.
MethodologyThe study was undertaken at Chacha Nehru Bal Chikitsalya, Indore
over a period of three months during October through December 2007.
A total of 75 randomly selected male infants aged 6 weeks attending the
immunisation clinic of the hospital were recruited for the study. The
infants selected for the study were divided into two groups - infants
exclusively breast fed (EBF group) and infants who had received top
feeding. There were 25 infants in the first group and the remaining 50
infants were in the second group. The top feed group was randomly
divided into two groups of 25 infants each. Educational intervention
regarding the benefits of breast feeding was provided to one group
(intervention group) while no intervention was made in the other group
which served as the control group. Infants in experimental groups were
followed at 10 weeks and 14 weeks of age. The incidence of diarrhoea
and respiratory tract infections were noted in the three groups at the
end of the intervention period and weight and length of the infants was
also recorded on the basis of a pre-designed and pre-tested information
schedule. The data collected during the study were analysed using SPSS
version 11.
ResultsKnowledge, Attitude and Practice Regarding Breast Feeding. It was observed
that 17 (68 per cent) of mothers in the EBF group were aware regarding
the initiation of breast-feeding within one hour of birth as compared to
26 (52 per cent) in the top fed group. The difference, however, was not
found to be statistically significant. Moreover, 56 (74.7 per cent) mothers
recognised the importance of colostrum feed and fed the infants with
colostrum. Knowledge regarding colostrum was significantly higher in
the EBF group (96 per cent) as compared to the top fed group (66 per
cent) and the difference was statistically significant (P2= 4.66, p=0.03).
None of the mothers in the EBF group had practised pre-lacteal feeding
whereas 24 (48 per cent) mothers in the top fed group had done so (P2=
146

Breastfeeding Practices
15.51, p <0.001). Generally, breast feeding was on demand as 49 (65.3
per cent) mothers practised on demand feeding. Knowledge about
correct positioning of the child during breastfeeding was higher (72 per
cent) in the EBF group as compared to in the top fed group (62 per
cent). The median period of breast feeding was 10-15 minutes. Just 4 (5.3
per cent) respondents informed that they breast fed the infant for more
than 15 minutes in one sitting. On the other hand, 45 (60 per cent)
mothers informed that they used to breast feed the infant 8-10 times
during the day and this proportion was higher (76 per cent) in EBF
group as compared to the top fed group(52 per cent). About one third
of the respondents reported that they breastfed the child for more than
10 times per day.
Mothers covered in the study were also inquired about the method
they adopted for top feeding. Majority of the women (64 per cent)
informed that they used bottle/tumbler for feeding purposes whereas
18 (36 per cent) reported that they used spoon and bowl.
Morbidity due to Diarrhoea and Respiratory Tract Infections in Infants.
The infants in the three groups were followed up for a period of eight
weeks for episodes of diarrhoea and respiratory tracts infections.
During this period, number of infectious spells were recorded.
Maximum number of episodes of diarrhoea (14) were reported in the
control group: 6 between 6-10 weeks and 8 between 10-14 weeks. The
number of episodes of diarrhoea in the intervention group were 4; 1
between 6-10 weeks and 3 between 10-14 weeks while only one episode
was reported between 6-10 weeks in the EBF group and none in the
succeeding month. In all 14 infants were reported to have suffered from
diarrhoea. Out of these, 10 were from the control group, 3 were from
the intervention group one was from the EBF group. The difference in
the intervention and control group was statistically significant (P2= 5.09,
p <0.05).
On the other hand, a total of 13 episodes of respiratory tract
infections were reported in the infants included in the study during the
study period out of which 10 were in the control group, 3 were in the
intervention group and one in the exclusive breast feeding group. A
total of 11 infants suffered from respiratory tract infections during the
study period. Out of these 8 were in the control group, 2 were in the
intervention group and 1 in the EBF group. The difference in the
proportion of children suffered from reproductive tract infections
between the intervention and control group was statistically significant
(P2= 4.50, p <0.05).
147

Child Survival and Health
Weight and Length of Infants. The mean weight of infants covered in
the study was 4.5 kg, 4.2 kg and 4.0 kg at 6 weeks of age in the EBF,
intervention and control groups respectively. At the end of the
intervention period, the mean weight in the three groups was 6.4 kg, 5.8
kg and 5.0 kg respectively. The difference in the weights of the infants
in the intervention and control groups was found to be statistically
significant (t=8.914, p<0.001).
The mean length of infants in the three groups at the initiation of
the study was 56.02 cm, 54.07 cm and 55.08 cm respectively and at the
end of the study was 61.92 cm, 59.90 cm and 57.83 cm respectively. The
difference in lengths between the intervention and control groups was
statistically significant (t=14.9, p<0.001).
DiscussionThe findings of the present study suggest that adequate knowledge
regarding practices and benefits of breast feeding is still lacking among
mothers. Overall 43 (57.3 per cent) mothers in the study had initiated
breast feeding within one hour of birth and this proportion is higher
than that reported in the National Family Health Survey 2005-06 as well
as in other studies (Singh et al 1997, Banapurmath et al 19962,
Chaturvedi et al 2007, Krishi Gram Vikas Kendra 2006). The difference
might be attributed to the fact that the study was carried out in a
tertiary health care set-up with majority of mothers coming from an
urban setting. The suckling reflex is very strong in the first half hour of
birth (Pandit 2000) and helps the release of hormone oxytocin resulting
in uterine contraction that facilitates expulsion of placenta and reduces
the risk of postpartum haemorrhage (IIPS 2000). Studies have also
concluded that early breast feeding reduces the diarrhoeal episodes in
the first six months of life (Clements et al 1999). Hospital staff and
health care workers have to be vigilant and facilitate initiation of breast
feeding within one hour of the birth. Dais should also be educated on
this aspect to promote early feeding for home deliveries.
Colostrum feeding remains inconsistent in our society. A study by
Srivastava et al on 1000 women reported that more than 82 per cent of
mothers discarded colostrum (9). Studies in other parts of the country
have also reported poor colostrum feeding (Singh et al 1997, Krishi
Gram Vikas Kendra 2006). Pre-lacteal feeding is also widely prevalent
(Singh et al 1997, Banapurmath et al 19962, Chaturvedi et al 2007,
Srivastava et al 1994). A study in 28,630 households in Bihar revealed
that half of the women had discarded colostrum on the advice of elders
148

Breastfeeding Practices
(Yadav and Singh 2004). In this study an association has been observed
between EBF and colostrum feeding. Colostrum is the welcome food for
the newborn. It has a number of immunising properties. Efforts have to
be made to universalize colostrum feeding. Faulty traditions and beliefs
in the society have to be tackled to universalise colostrum feeding
immediately after birth. Pre lacteal feeds not only increase the risk of
infections but also decrease the duration of breast feeding which in turn
suppresses milk production (Government of India 2006). Programmes
should be devised to promote colostrum feeding and minimise pre-
lacteal feeding.
The present study has revealed that only 49 per cent mothers
practised demand feeding and just about 5 per cent breast feed the baby
for more than 15 minutes in a single sitting. Proper period of breast
feeding is important. Shorter period of breast feeding deprives the child
of the hind milk which is a rich source of fat. Optimally, feeding should
be continued from one breast until the child itself leaves the breast. In
the top fed group, bottle feeding was being practised by 64 per cent of
the respondents. Bottle feed is to be avoided as it not only makes the
infant more prone to infections but also decreases the supply of the milk
of the mother and the baby starts refusing the breast because of nipple
confusion.
Several studies have reported that EBF tends to lower episodes of
diarrhoea and reproductive tract infections in infants (Rama Ram et al
2000, Mihirshahi et al 2007, Mihirshahi et al 2008). The benefits of EBF
are not limited to diarrhoea and respiratory tract infections alone. They
also provide protection against diseases like atopic dermatitis, asthma
(young children), obesity, type 1 and 2 diabetes and childhood
leukemia. Relative better growth of infants in the EBF group is yet
another benefit of exclusive breast feeding as observed by the findings
of the present study. The average weight of infants in the intervention
group has been found to be statistically significantly different from that
in the control group (t = 8.9, p<0.001). Similarly, the average length of
infants in the intervention group has been found to be statistically
significantly different from that in the control group (t = 14.9, p<0.001).
ConclusionsA number of initiatives have been taken to universalise EBF, yet a lot is
still desired. It is estimated that nearly 77 per cent (1.06 million) child
deaths in the world attributable to sub-optimal breastfeeding are due to
non-exclusive breastfeeding during 0-6 months of life (Krithika 2008).
149

Child Survival and Health
The benefits of breast feeding are well established. The is a need to
formulate innovative community based programmes and novel health
promotion strategies to universalise breastfeeding for the benefit of
infants and young children.
ReferencesBanapurmath CR, Nagaraj MC, Banapurmath S, Kesaree N (1996)
Breastfeeding practices in villages of central Karnataka. Indian
Pediatrics 33(6):477-9.
Chaturvedi M, Nandan D, Gupta SC (2007) Rapid assessment of infant-
feeding practices in Agra district. Indian Journal Community Medicine
32:227.
Clemens J, Elyazeed RA, Rao M, Savarino S, Morsy BZ, Kim Y, Wierzba
T, Naficy A, Lee YJ (1999) Early initiation of breast-feeding and the
risk of infant diarrhoea in rural Egypt. Paediatrics 104: 3.
Government of India (2006) National Guidelines on Infant and Young Child
Feeding. New Delhi, Ministry of Human Resources Development.
Department of Women and Child Development (Food and
Nutrition Board).
International Institute for Population Sciences and Macro International
(2000) National Family Health Survey (NFHS-II) 1998-99. Mumbai,
International Institute for Population Sciences.
International Institute for Population Sciences and Macro International
(2007) National Family Health Survey (NFHS-III), 2005-06. Mumbai,
International Institute for Population Sciences.
Krishi Gram Vikas Kendra (2006) Baseline Study Findings-3. Nutritional
Status and Behavioural Practices among Infants and Young people.
ICICI Bank, Social Initiatives Group, Child in Need Initiative.
Ranchi Low Birth Weight Project.
Krithika R (2008) Dismal breastfeeding rates hampering infant health.
http://www.indiatogether.org/2008/aug/hlt-bfeeding.htm.
Mihrshahi S, Ichikawa N, Shuaib M, Oddy W, Ampon R, Dibley MJ,
Kabir AK, Peat JK (2007) Prevalence of exclusive breastfeeding in
Bangladesh and its association with diarrhoea and acute respiratory
infection: results of the multiple indicator cluster survey 2003.
Journal of Health Population and Nutrition 25:195-204.
Mihrshahi S, Oddy WH, Peat JK, Kabir I (2008) Association between
infant feeding patterns and diarrhoeal and respiratory illness: A
cohort study in Chittagong, Bangladesh. International Breastfeed
Journal 24:3-28
150

Breastfeeding Practices
Pandit N, Yeshwanth M, Albuquerque SR (1994) Factors influencing
initiation of breast-feeding in an urban setup. Indian Journal
Paediatrics 31(12): 1558-1560.
Ram R, Ghosh MN, Saha JB, Bhattacharyya SK, Halder A, Chatterjee C.
(2000) Breast feeding practices in the rural community of district
Darjeeling, West Bengal. Indian Journal of Community Medicine 25:79-
82
Singh MB, Haldiya KR, Lakshminarayana J (1997) Infant feeding and
weaning practices in some semi-arid rural areas of Rajasthan.
Journal of Indian Medical Association 95(11):576-8.
Srivastava SP, Sharma VK, Kumar V (1994) Breast feeding pattern in
neonates. Indian Pediatrics 31:1079-82.
Yadav RJ, Singh P (2004) Knowledge, attitude and practices of mothers
about breast-feeding in Bihar. Indian Journal of Community Medicine
29:130-31.
151

Child Survival and Health
Table 1
Knowledge about time of initiation of Breast Feeding
S.N. Time of
initiation
EBF group Top fed group Total
1 Within 1 hour of
birth
17
(68.0)
26
(52.0)
43
(57.3)
2 After 1 hour of
birth
08
(32.0)
24
(48.0)
32
(42.7)
P = 1.744, p=0.1872
Remarks: Figures in parentheses denote percentages.
Table 2
Knowledge about Colostrum feeding
S.N. Colostrum
feeding
EBF group Top fed group Total
1 Yes 23
(96.0)
33
(66.0)
56
(74.7)
2 No 02
(4.0)
17
(34.0)
32
(25.5)
P = 4.66, p=0.032
Remarks: Figures in parentheses denote percentages.
152

Breastfeeding Practices
Table 3
Feeding practice in the study groups
S.N. Feeding practice EBF group Top fed group Total
1 On demand 18
(72.0)
31
(62.0)
49
(65.3)
2 Pre-decided time 7
(28.0)
19
(38.0)
26
(34.7)
Table4
Prelacteal feeding in the study groups
S.N. Colostrum feeding EBF group Top fed
group
Total
1 Yes 0
(0)
24
(48.0)
24
(32.0)
2 No 25
(4.0)
26
(52.0)
51
(68.5)
Table 5
Knowledge about duration of Breast feeding
S.N. Duration EBF group Top fed
group
Total
1 < 10 minutes 04
(16.0)
21
(42.0)
25
(33.3)
2 10 – 15 minutes 19
(76.0)
27
(54.0)
46
(61.4)
3 >15 minutes 02
(8.0)
2
(4.0)
4
(5.3)
153

Child Survival and Health
154

Household Environment and Individual
Risk Factors of Acute Respiratory
Infections in Madhya Pradesh
and West Bengal
Angan SenguptaH. Lhungdim
IntroductionFor the past couple of decades, environment has increasingly become
an important area of concern as it impacts on the climate change and
health status of the people. Both developed and developing countries
are reeling under various environmental stress. Poverty entities as well
as rapid urbanisation and the resulting pollution act as catalyst to
environmental degradation and cause of several diseases. Pollution is
the silent killer at the micro level but brings about destruction to the
ecology at the macro level. Besides environmental factors, individual
lifestyle factors such as tobacco smoking also aggravate health in the
form of respiratory infections.
Respiratory infections are caused both by outdoor and indoor air
pollution. The indoor air pollution can originate from both outdoor and
indoor sources. Generally, outdoor pollutants get modified or diluted
within the house by various physical and chemical processes. The
household environment is also characterised by indoor pollutants
generated through the type of fuel/fire used primarily for cooking and
also for heating, source of lighting, ventilation, etc. It also gets polluted
by human activities and lifestyle patterns such as tobacco smoking and
tobacco chewing and crowding as indicated by number of persons
sharing a room. Most importantly, when indoor sources or human
activities emit pollutants at rates exceeding their removal rates by
155

Child Survival and Health
ventilation or surface reactions, the indoor pollution level becomes
more toxic than outdoor concentrations (Kumar 2001).
Acute Respiratory Infections afflict infants and children aged 1-4
years more than older children and adults. These infections are of two
types - upper respiratory tract infection (AURI) and lower respiratory
tract infection (ALRI). The former include common cold, pharyngitis
and otitis media, while epiglottitis, laryngitis, laryngotracheitis,
bronchitis and pneumonia constitute the latter. These infections which
also include asthma, are global health concern, caused by genetic or
environmental factors. Difficulty in breathing and coughing for long
duration, shortness of breath and breathlessness are the common
symptoms.
The air pollution is increasing day by day, intensifying the
susceptibility of acute respiratory infections. In general, the association
between exposure to environmental tobacco smoke (ETS) and the
prevalence of acute respiratory infections is stronger in young children
than in adults. Epidemiological studies have linked passive smoking in
children to increased occurrence of lower respiratory tract infections
during infancy and early childhood. Investigations throughout the
world have demonstrated an increased risk of bronchitis and
pneumonia during the first year of life in infants with smoking parents.
Maternal (rather than paternal) smoking alone can increase the
incidence of lower respiratory illness (Kumar et al 2001). According to
the World Health Organisation (2004), worldwide, about 1.3 billion
people were smokers and in India 29.4 per cent of adult men and 2.5 per
cent of adult women were smoking. Although women smokers
constitute a very small proportion of total smokers, yet, their smoking
habit may cause life threatening respiratory infections to their children,
especially those who are still nursing or more dependent on them.
Thick acrid smoke associated with fire inside the home is estimated
to be accountable for around 1.6 million deaths per year in developing
countries. This implies that one life is lost every 20 seconds to the killer
kitchen. Nearly half of the households in the world continue to cook
with solid fuels such as dung, wood, agricultural residues and coal
(WHO/UNDP 2004). The figure is even higher for India, nearly 70 per
cent (IIPS 2007). People in developing countries are regularly exposed
to very high levels of pollution for 3–7 hours daily over many years.
During winter and in cold and mountainous areas, exposure may occur
over a substantial period daily. Because of their customary involvement
in cooking, women are more exposed and vulnerable to smoke
156

Acute Respiratory Infections
generated infections than men. Young children are often carried on
their mother’s back while cooking is in progress and, therefore, spend
many hours breathing smoke (WHO 2000).
Acute Respiratory Infections account for about 25 per cent of all
deaths due to communicable diseases (HII 2004). About 4.1 million
children in the world died due to these infections in 1998 and 40 per
cent of them were from India, Bangladesh, Nepal and Indonesia (WHO
1999). In India, 13 per cent of all deaths in the hospitals are ascribed to
acute respiratory infections. In absolute numbers, this amounts to
around 987 thousand deaths in 1998 alone (WHO 2007). More recent
data from the third round of the National Family Health Survey suggest
that proportion of children having symptoms of acute respiratory
infections is around 5.8 per cent (IIPS 2007).
Dense crowding in indoor sleeping quarters during cold and wet
seasons has also been found to be one of the important factors
responsible for the transmission of respiratory virus in children in a
comparative study of village, peri-urban and crowded urban
environments of West Bengal (Bang et al 1975). It is observed that with
the rise in pollution level and population density, the situation may
deteriorate. Home dampness was found to be significantly associated
with symptoms of respiratory infections in primary school going
children in rural Taiwan (Yang et al 1997b). Traditional houses with no
windows have been found to be an environmental risk factor for under-
five mortality in a case reference study in rural Ethiopia (Shaembo et al
1993).
In this paper, we attempt to analyse effects of household
environment and individual life style patterns on the respiratory health
of children aged 0-5 years, as indicated by the prevalence of acute
respiratory infections (ARI) in two states of India - Madhya Pradesh
(MP) and West Bengal (WB). More specifically, the paper attempts to
associate the prevailing household environment and individual life
style patterns with the prevalence of acute respiratory infections in
children of the two states to elaborate how household environment and
individual life style patterns impact upon the respiratory health of
children.
Data and MethodologyThe analysis presented in the following pages is based on the third
round of the National Family Health Survey (NFHS-3) that was carried
out during 2005-06. NFHS-3 covered 109,041 households, 124,385
157

Child Survival and Health
women aged 15-49 years and 74,369 men aged 15-54 years throughout
the country. The present analysis is restricted to two states of India -
Madhya Pradesh and West Bengal. The prevalence of acute respiratory
infections in Madhya Pradesh has been estimated to be quite low (3.7
per cent) as compared to West Bengal (13 per cent) despite the fact that
household characteristics and socio-economic profile are poorer in
Madhya Pradesh than in West Bengal. In West Bengal, the prevalence
of acute respiratory infections has been found to be the second highest
in India after Tripura.
During the National Family Health Survey, information on acute
respiratory infections in children below five years of age was obtained
from the mother of the child. The information collected during the
survey included whether the child has had cough in the two weeks
preceding the survey and was experiencing short and rapid breathing
faster than usual or facing any difficulty in breathing and at the same
time whether the child was suffering from a problem in the chest. Based
on these questions related to breathing problems a child had, it was
decided whether the child was having acute respiratory infections or
not. In order to measure the differentials in the prevalence of acute
respiratory infections in children, prevalence rates with respect to
different background and household characteristics were computed for
each region through bivariate analysis. Finally, binary logistic
regression analysis was carried out to estimate the odds of the risk of
acute respiratory infections in different social, economic and cultural
settings.
Results and FindingsCharacteristics of Households. The distribution of household by different
household characteristics such as cooking fuel used, type of house,
wealth index, and other items owned, etc. are given in table 1 for
Madhya Pradesh, West Bengal and India. Both the states are high bio-
fuel user states, although bio-fuel use is much higher in Madhya
Pradesh (88 per cent) than in West Bengal (77 per cent). In case of type
of fire place used (stove or chullah), most households use chullah/open
fire. A very small proportion of households used stove in both the states
and this proportion was lower than the national average of 5 per cent.
In Madhya Pradesh, about 2 per cent of households used stove as
compared to only about 1 per cent in West Bengal.
Over half of the households in both the states were living in semi-
pucca houses (53 per cent in Madhya Pradesh and 52 per cent in West
158

Acute Respiratory Infections
Bengal). Pucca house dwellers were comparatively slightly less in West
Bengal, than in Madhya Pradesh, although this proportion was more
than the national average of 46 per cent in both the states. In nearly
three-quarters of households in Madhya Pradesh, there were more than
3 persons sharing a room and this proportion was higher than that in
West Bengal. Similarly, in less than half of the households in the two
states, the kitchen was separate. This proportion, at the national level,
was 57 per cent. The availability of electricity was more appalling in
West Bengal where 57 per cent of households were relying on
traditional means of lighting and endangering their lives. In Madhya
Pradesh, by contrast, 70 per cent of households had electricity.
In case of other household items such as windows, chimney and
mattress, the majority of the households in the two states were not
having them. These house materials have direct health implications
from the point of view of proper air circulation in the house
(ventilation) and protection from insects/bacteria, etc. Only 1 per cent
of households in Madhya Pradesh and 3 per cent of households in West
Bengal had chimney (8 per cent in case of India). Likewise, use of
mattress or having windows in the house also varied greatly. Mattress
can prevent household members from being exposed to dampness of
the mud floor or other effects of climatic variation through the floor and
dusts. However, about 60 per cent of the households in Madhya
Pradesh and 28 per cent households in West Bengal did not have
windows. Windows are especially important in households using solid
fuels for cooking and oil for lighting as they let the polluted air to go out
of the house. Windows also act as a ventilator.
In terms of level of living, two-thirds of the total households in
Madhya Pradesh and 61 per cent in West Bengal belonged to the lowest
and second lowest wealth quintiles compared to the national average
of 33 per cent. The proportion of households falling in the highest
wealth quintiles category were about the same in the two states.
However, this proportion was substantially lower than the national
average of 24 per cent.
Prevalence of ARI among Children Aged 0-5 Years. The prevalence of
ARI has been estimated to be very high among children aged less than
two years as immunity is low at this age. In India, there is no significant
disparity in the prevalence of ARI by sex, but in Madhya Pradesh,
contrary to the West Bengal, male children are at higher risk than their
female counterparts. Interestingly, West Bengal shows a prevalence rate
three times higher than that of Madhya Pradesh. In both the states, rural
159

Child Survival and Health
children are more vulnerable than urban children. At the national level
also, prevalence of ARI in the rural areas is higher than that in the urban
areas. The prevalence of ARI is much lower in children of highly
educated mothers as well as in children belonging to high income
households.
Table 2 does not depict any notable difference in the vulnerability
to ARI by religion, but in West Bengal, Muslim children show higher
risk as compared to the Hindu children. Also, Scheduled Caste children
in Madhya Pradesh had the highest risk of ARI whereas in West Bengal,
the prevalence has been found to be higher in Scheduled Tribes children
and children belonging to other backward class categories. In the West
Bengal, the smoking status of the mother does not seem to be a very
important determinant of ARI in children but the impact is very much
visible in Madhya Pradesh and in India. Prevalence of ARI also appears
to be directly related to the level of income of the family. Children in
lowest, second lowest and middle wealth stratum appear twice more
likely to have ARI compared to those in the highest stratum in West
Bengal. In Madhya Pradesh, the gap is even higher.
Prevalence of ARI by Household Environment Characteristics. Children
living in the semi-pucca and kachcha houses had a higher prevalence
of ARI as compared to children living in pucca houses (Table 3). The
prevalence of ARI was higher in houses without electricity in West
Bengal and India but not in Madhya Pradesh. Bio-fuel is one of the most
important contributors to the risk of respiratory infections. Provision of
separate room for cooking is essential to arrest the pace of transmission
of ARI. Windows in the house and usage of mattress show their relation
with control of diseases. Unlike West Bengal, in Madhya Pradesh, ARI
is found to be more prevalent in households with more than three
people sharing one room. Use of chullah and open fire for cooking
appears to be dangerous for children in Madhya Pradesh. Children
living in pucca households with windows and using clean fuel and
mattress have been found to be having lower prevalence of ARI.
Results of Logistic Regression Analysis. Children living in households
using bio-fuels for cooking have been found to be 19 times more likely
to have acute respiratory infections in Madhya Pradesh (p<0.01) but
only two times more likely in West Bengal compared to children living
in households using clean fuels (Table. 4). Similarly, room density
appear to be directly related to the risk of acute respiratory infections.
In West Bengal, children living in kachcha houses are at much higher
threat than those living in semi-pucca and pucca houses. Mothers’
160

Acute Respiratory Infections
smoking behaviour appears to increase the risk of ARI in the children
by 22 per cent.
Use of electricity in the house appears to reduce the hazard of
respiratory infections by 24 per cent in West Bengal. Having a separate
room for kitchen and windows in the house shows a statistically
significantly negative relation with the prevalence of ARI. Female
children are 14 per cent less likely to be affected with ARI in Madhya
Pradesh but they are relatively more vulnerable in West Bengal. In rural
Madhya Pradesh, the risk of ARI among children is 14 per cent less than
that in the urban areas but in West Bengal, the difference is statistically
insignificant. Children aged at least 2 years are 31 per cent less likely to
have ARI in Madhya Pradesh. This proportion is 34 per cent in West
Bengal. Also, possessing and using mattress seems to reduce the
vulnerability to ARI by 17 per cent.
Summary and ConclusionThe analysis affirms the relationship between household environment
and risky individual behaviour with the prevalence of ARI among
children. However, as other studies indicate, there are other importance
factors for ARI such as genetic factors (family history of asthma),
extreme temperature, high humidity, use of particular medicines, and
keeping livestock in the premises of the house, etc., which are not
addressed in this study due to data constraints.
Children less than 2 years are more likely to suffer from ARI than
that of their older counterparts, since there is an inverse relation
between the age of the children and the vulnerability to general
diseases. The reason is immunity in children remains really low at the
younger ages. There appears to be little effect by sex and place of
residence on the prevalence of ARI. Bio-fuels, type of housing,
crowding in the house, mother’s smoking behaviour, type of fire used,
etc, have impact on the respiratory health of young children. Use of
chimney, mattresses and presence of windows in the house can
contribute significantly in reducing the risk of ARI
The analysis suggests that examination of the prevalence of ARI
from an epidemiological perspective should be a priority in research.
There is a need to identify factors and their relationship with respiratory
infections. Public health programmes in India should be more specific
to address acute respiratory infections. There is also a need to
emphasise upon a behavioural shift in terms of promoting the use of
stoves and chimneys and making people aware about the importance
161

Child Survival and Health
of improving the quality of housing including ventilation, separate
kitchen, electricity, etc. Awareness about health impacts of sanitation
and healthy personal lifestyles should also be disseminated among
people as a long-run mechanism to reduce the prevalence of ARI among
children and also among adults.
The present analysis has not been able to explain why despite
poorer household environmental and socio-economic condition in
Madhya Pradesh than in West Bengal, the later continues to have a
much higher prevalence of ARI. Children in Madhya Pradesh appear
to be relatively safer from the risk of respiratory infections than children
in West Bengal. However, the study has been able to suggest some of
the risk factors associated with acute respiratory infections in children
below 5 years of age. These include: the age of the child (younger
children are at higher risk), type of fuel used, housing materials,
residence, education of the mother and wealth status. Preventive
strategies need to address these socio-economic factors.
ReferencesAgnihotram VR (2005) Reviewing respiratory disease burden in Rural
India: household environment matters. Rural and Remote Health 5:
357. (http://rrh.deakin.edu.au).
Arokiasamy P, Karthick K, Pradhan J (2007) Environmental risk factors
and prevalence of asthma, tuberculosis and jaundice in India.
International Journal of Environment and Health 1(2).
Bang FB, Bang MG, Bang BG (1975) Ecology of respiratory virus
transmission: A comparison of three communities of West Bengal.
American Journal of Tropical Medicine and Hygiene 24(2): 326-346.
Government of India (2004) Health Information of India. New Delhi,
Central Bureau of Health Intelligence.
Down to Earth (2004) Inside Asthma. Poor kids suffer more. March 15.
Gopalan HNB, Saksena S (1999) Domestic Environment and Health of
Women and Children. UNEP, TERI.
Hazra A, Dutta S, Guha M (2007) Effect of household environment on
women’s health in Northeast India. In CP Prakasam and RB Bhagat
(Eds) Population and Environment Linkages. Jaipur, Rawat
Publication.
162

Acute Respiratory Infections
International Institute for Population Sciences (2000), National Family
Health Survey -2 (1998-99). Mumbai, International Institute for
Population Sciences.
International Institute for Population Sciences and Macro International
(2007) National Family Health Survey-3 (2005-06), Mumbai,
International Institute for Population Sciences.
Kilabuko HJ, Nakai S (2007) Effects of cooking fuels on Acute
Respiratory Infection in children in Tanzania. International Journal
of Environmental Research and Public Health. 4(4):283-288.
Kumar H (2001) Environmental Health Hazards. Delhi, IVY Publishing
House.
Kumar Santosh, Mehra S (2007) ARI and indoor air pollution: Its
burden and correlation. The Internet Journal of Pulmonary Medicine
8(2).
Misra RP (2007) Geography of Health, a treatise on Geography of Life and
Delth in India. New Delhi, Concept Publishing Company.
Shaembo D, Sandstorm A, Muhe L, Freji L, Krantz I, Lonnberg G, Wall
S (1993) The Butajira Project in Ethiopia: A nested case reference
study of under five mortality and its public health determinants.
Bulletin of the WHO 71: 389-96.
WHO (2000) Indoor air pollution in developing countries: a major
environmental and public health challenge. Bulletin of the World
Health Organisation 78(9).
WHO (2004) Indoor air pollution. The killer in the kitchen. Joint Statement.
WHO/UNDP/5.
WHO (2004) World Health Statistics Report, 2004. Geneva, World Health
Organisation.
WHO (2007) World Health Report, 2007. Geneva, World Health
Organisation..
Yang CY, Chiu JF, Cheng MF, Lin MC (1997) Damp housing condition
and respiratory symptoms in primary school children. Paediatric
Pulmonology 24(3): 73-77.
163

Child Survival and Health
Table 1
Selected household environment characteristics in Madhya Pradesh,
West Bengal and India, NFHS-3 (2005-06)
Madhya
Pradesh
West
Bengal
India
Fuel Clean fuel 13.2 22.8 31.1
Bio-fuel 87.8 77.2 68.9$
Fire Stove 2.3 1.2 5
Chullah/Open fire 97.7 98.8 95
Type of housing Kachcha 25.9 19.0 13.8
Semi-pucca 53.1 52.3 40.1
Pucca 20.8 28.5 46.1
Persons per room <=3 26.2 37.0 56.6
>3 73.8 63.0 43.4
Separate kitchen Available 40.3 45.6 57.1
Electricity Yes 70.4 43.0 67.9
Wealth Index Lowest 42.3 34.3 15.78
Second 24.5 26.8 18.08
Middle 13.4 17.7 20.39
Fourth 11.5 13.7 22.16
Highest 8.2 7.6 23.59
Chimney Yes 1.4 3.3 8.4
Mattress Yes 37.3 46.7 57.4
Windows Yes 39.6 72.4 67.1
Note: # Electricity, gas, kerosene, coal and charcoal; $ Dung,
shrubs, grasses, wood and others
164

Acute Respiratory Infections
Table 2
Prevalence of ARI (per 100,000 populations) by selected background
characteristics in Madhya Pradesh, West Bengal and India, NFHS-3
(2005-06)
Background Madhya West Bengal India
Age in months
< 2 4190 15405 6918
>=2 3034 10652 4549
Sex
Male 3747 11555 5599
Female 3146 13138 5221
Residence
Urban 2613 10399 4831
Rural 3697 12838 5618
Mother's Education
Illiterate 2544 12249 5475
Primary 5023 12587 6150
Secondary 4849 12570 5325
Higher 1424 8808 3372
Religion
Hindu 3468 10989 4901
Muslim 3744 14484 8121
Caste / Tribe
Scheduled Caste 4056 10020 4900
Scheduled Tribe 3688 15302 4246
OBC 3509 15886 5116
Others 2226 11861 6132
Mother's current smoking status
Yes 5156 11275 6727
No 3181 12480 5270
Wealth Index
Lowest 3850 13160 5460
Second 4306 12492 6362
Middle 3302 14309 5814
Fourth 1959 9836 4875
Highest 1196 7892 4001
Total 3451 12332 5418
165

Child Survival and Health
Table 3
Prevalence of ARI (per 100,000 populations) by household
environment characteristics in Madhya Pradesh, West Bengal and
India, NFHS-3 (2005-06)
Household
environment
characteristics
Madhya
Pradesh
West Bengal India
Type of House
Kuchcha 3058 12442 5413
Semi-pucca 4310 14151 6170
Pucca 1784 8972 4461
Electricity
No 3272 13107 6327
Yes 3526 11304 4799
Cooking Fuel
Cleaner fuel 1809 8706 4238
Bio fuel 3700 13403 5744
Separate room for cooking
No 4184 12937 5064
Yes 3249 10468 4873
Cooking done under chimney
No 12535 3705 5815
Yes 18527 0 4424
Any window
No 13833 4011 5340
Yes 11760 2598 5467
Using mattress
No 3970 13513 5704
Yes 2860 10352 5204
Persons per room
<=3 2728 13566 5352
>3 3708 11609 5452
Type of fire
Stove 165 13318 4100
Chullah/open fire 3694 12717 5766
Total 3451 12332 5418
166

Acute Respiratory Infections
Table 4
Odds ratios from logistic regression
analysis of characteristics associated with ARI
Covariates Categories Exp (B)
Madhya
Pradesh
West
Bengal
Fuel used Clean fuel ® - -
Bio fuel 19.44** 2.15**
Number of persons
sharing a room
<=3 ® - -
>3 1.19** 0.53**
Mother smoking No ® - -
Yes 0.78* 1.22**
Type of housing Kachcha ® - -
Semi-pucca 1.49 0.60**
Pucca 1.06 0.25**
Electricity No ® - -
Yes 1.16 0.76**
Separate room for
kitchen
No ® - -
Yes 0.86** 0.84**
Sex of child Male ® - -
Female 0.86** 1.14**
Place of residence Urban ® -
Rural 1.12** 0.40
Age of the child <2 years ® - -
>=2 years 0.69** 0.66**
Windows No ® - -
Yes 0.86** 0.62**
Chimney No ® - -
Yes 0.00* 1.96**
Using mattress No ® - -
Yes 0.88** 0.78**
Note: ** p<0.01 and *p<0.05; ® = reference category
167

Child Survival and Health
168

Perception of Child Health,
Immunisation and Breast Feeding
Practices among the Lodha Tribe of
West Bengal
Kalyan B SahaUma C Saha
HC Shrivastava
IntroductionInvestment in children is investment in human resources development
which is crucial to the social and economic development of a nation
(Saha et al 2003). Healthy children are the real wealth of any community
(Narahari et al 2009). Government of India has been taking steps to
strengthen maternal and child health services since First Five-year
Development Plan (IIPS 2007). The initiation of Integrated Child
Development Services (ICDS) added fillip to national child health
services. However, these services are not uniformly utilised by all
sections of the population particularly among the tribal population.
Different studies have tried to establish that health status of the tribal
population, by and large, is very poor (Basu 1987, Basu et al 1989, Basu
1990, Bardhan and Sinha 1989, Roy Burman 1986, Roy Burman 1990,
Swain et al 1990, Mukherjee 1990, Mahapatra 1990, Rizvi 1986, Haque
1990). This possesses a potential challenge for the health system to
improve the situation.
In the tribal population, child health care practices are not solely
related with the biological understanding of the problem but are also
influenced by their age old perception and cultural ways of approaches.
The pediatric health care practices have become vital issue for the
developing countries where high foetal and child mortality have been
reported. Studies (Ghosh 1989, Sinha and Pandey 1998) revealed that,
for the baby, mother’s milk is the easiest to digest than any other
substance. It is safe and complete food for infants. Further, breast
feeding has its socioeconomic, psychological, biological and
169

Child Survival and Health
immunological advantages (Neetimakanti 1991). In spite of its
importance, breast feeding is not practised uniformly in all groups and
subgroups of the population and needs investigation and intervention.
Another basic child health care practice involves child
immunisation. Universal immunisation of children against six vaccine
preventable diseases (tuberculosis, diphtheria, whooping cough,
tetanus, poliomyelitis and measles) is crucial to reducing infant and
child mortality (IIPS 2007). Information on differences in vaccination
coverage among different sections of the population are useful for
programme planning and targeting resources to areas most in need. It
is also useful for monitoring and evaluation of immunisation services.
These services, again, remain grossly underutilised in most of the tribal
areas.
There is a general feeling among the rural women that once the
child is born there is no need for any checkup either for the mother or
for the child except in case of serious problem only (Kapoor 1994).
Information about routine post-natal care and child care is not readily
available in many developing countries and there is still fairly limited
survey experience (Graham et al 1995). Such studies are very few
among the aboriginal population particularly primitive tribes and most
of these studies have not been undertaken systematically. This
prompted us to undertake this study among the Lodha tribe which is
one of the primitive tribes of West Bengal. It may be mentioned here
that no systematic study on perception and pattern of child health care
has ever been conducted among the Lodhas. To the best of our
knowledge, only one ethnographic study was conducted way back in
1952 by Bhowmick (1994). Therefore, an endeavour is made to study the
perception on child health, utilisation of child immunisation services
and pattern of breast feeding among the Lodhas of Medinipore district
in West Bengal. It is believed that results of the study will be useful for
micro-planning for improving the utilisation of post natal care
particularly care related to child health care in the Lodhas.
Material and MethodsThe survey was carried out in the year 1997. Lodhas of West Bengal are
overwhelmingly conglomerated in the Medinipore district of the state
(Risley 1891, Government of India 1951, Gupta 1959, Bhomick 1994, Das
et al 1964, Singh 1994, Jain 1995). Hence, the survey was restricted to
Medinipore district only. Official records suggested that the population
of Lodhas was 36,069 in 1990. A sample of 500 ever- married Lodha
170

Perception of Child Health in Tribals
women in the age group 15-49 years was drawn from six blocks of the
district proportionally to its size. The six blocks were selected randomly
and they, together, constituted about 60 per cent of the total Lodha
female population in the district. Villages predominated by Lodha were
identified and listed. A sub sample of randomly selected women from
20 households per village was interviewed by canvassing a pre-
designed interview schedule. The short fall in the sub sample of a
village was adjusted from the next selected village. A total of 29 villages
were covered in the study.
The PeopleThe Lodha tribe, by and large, is culturally homogenous. Not much
variation was found in the level of education and standards of living.
Even though these variables are important, yet we have dropped them
in our analysis and considered only occupation, duration of married life
and index of religiosity as the background variables, Occupation was
broadly categorised into two categories depending on the subsistence
levels of the family and activities during the major part of the year. The
two occupational categories viz., ‘Agricultural’ refers to cultivating
one’s own land while ‘Gatherers’ subsists on collection and selling of
forest produce. The index of religiosity was computed by using scaling
technique and for this purpose following questions were asked to the
respondents: believe in god; observe religious symbol; pray daily; visit
religious places daily; impart religious education to children; believe in
hell and heaven and Lodha ritual superior than others. The responses
for each statement were recorded either Yes=1 or No=0. Test of
significance was done by computing Cramer’s value (Hadderson, 1987).
Information on child health care perception of the respondents was
also obtained by asking their views on the following statements related
to superstition about child heath care:
• Angry deities punish wrong doers in the form of disease to their
children,
• Sorcerers and witches are responsible for all type of incurable
diseases among the children in the society,
• Childhood diseases are also caused by spirit of intrusion of
supernatural object into the body of the child, and
• Children lose equilibrium due to entry of excessive heat or cold into
their body.
Thereafter, arbitrary score was assigned to perceptions about each
of the above statements and thus child health care perception with
171

Child Survival and Health
respect to superstition was worked out as low, medium and high
according to the score secured by each women in the following the way:
1. Low superstitious perception was assigned to a woman who
secured a total score 7 or less;
2. Medium superstitious perception was assigned to a women who
secured a total score 8 to 10, and
3. High superstitious perception was assigned to a women who
secured a total score 10 and above.
Once the scoring was done in the above manner, the child health
superstitious perceptions were then examined with respect to their
selected background characteristics.
Findings and Discussion Perception on Child Health. Table 1 shows the association between
perceptions about child health and some background variables. It may
be seen from the table that older women were relatively more
superstitious than younger ones and the association between women’s
age and their superstitious belief on child health was significant with
Cramer value of 0.098, p<0.05. The same was true with the educational
status of the women with Cramer's Value of 0.272, p<0.001. It is obvious
that education of women significantly influences the superstition
pertaining to child health among the Lodhas.
As regard occupation of women, ‘gatherers’ were found to be
highly superstitious compared to `others' (housewives and those
engaged in agricultural activities). The difference between the women
having highest and lowest child health perception score among the
‘gatherers’ was the highest compared to other categories. This could be
one of the important factors acting as barrier in the utilisation of health
services among the ‘gatherers’. The association between the perception
of the child health and occupation of the respondents was found to be
highly significant with a Cramer's Value of 0.183, p<0.001.
Out of 491 ever married women who gave at least one birth, 58 per
cent were having 1-2 children while the rest were having 3 or more
children. It may be seen from the table that women with at least 3
children were more superstitious despite the fact that they had long
exposure to child bearing and rearing practices.
The association between the perception about child health and
index of religiosity was found to be highly significant with a Cramer's
value of 0.264, p<0.001. It was found that more a woman was religious,
the higher she was superstitious about child health.
172

Perception of Child Health in Tribals
Awareness and Utilisation of Child Immunisation Services. The objective
of immunisation is to prevent the child six widely common diseases by
developing body resistance. In India, the Expanded Programme on
Immunisation (EPI) was launched in 1978 with the objective of reducing
morbidity and mortality due to diphtheria, pertussis, tetanus,
poliomyelitis and tuberculosis by making vaccination services available
to all eligible children and pregnant women by the year 1990. Measles
was included in the programme in 1985-86 when it was expanded to
Universal Immunisation Programme (UIP) with the target of achieving
one hundred per cent immunisation coverage of infants by 1995. It also
aimed at achieving self sufficiency in the production of vaccines.
In view of the importance of child immunisation, an attempt has
been made to study the knowledge and utilisation of child
immunisation services among the Lodhas. The mothers interviewed
during the survey were asked if they had ever heard about the different
vaccinations and if their youngest child was under five years of age had
received any injection or drop to protect them against the preventable
childhood diseases. The information was collected for the youngest
child only to minimise the error due to recall lapse. Since vaccination
card was not available with majority of the mothers, the type and dose
of the vaccine administered to the youngest child was probed in the
following way:
(i) If there was any scar mark on the left arm of the child, the probing
was done for BCG vaccination.
(ii) If any injection was given to the child after 6 weeks of birth,
probing was done for DPT vaccination.
(iii) If three oral doses were also given along with the injection, probing
was doe for oral polio vaccination.
(iv) If any injection is administered during late infancy, probing was
done for measles vaccination.
It was found that an overwhelming majority of the respondents (86
per cent) were aware of OPV, followed by BCG (67 per cent), DPT (48
per cent) and measles (42 per cent). This high level of awareness
regarding immunisation among this primitive community could be
because of the IEC activities. The data in detail is presented in Table 2
Further, when mothers were asked about the necessity of child
immunisation, about 74 per cent agreed that immunisation could save
the child from childhood morbidities. However, as regards utilisation
of the immunisation services, only 35 per cent of the ever married
women who had given at least one birth had their youngest child fully
173

Child Survival and Health
immunised. A sizeable number of women surveyed (21 per cent) did
not immunise their youngest child at all (Table 3).
Breast Feeding Practices. Breast milk contains at least six infective
agents against some of the common illness of infancy (Caldwell 1981).
During the first few months of life, breast milk acts as the best possible
protection and balanced nutritious food for the health and growth of the
child. Breastfeeding also serves as a natural contraception because of
prolonging of the lactational amenorrhea and hence the birth interval
(Carneiro 1988, Gangadharan et al 1982).
Breastfeeding was found to be universally practised by the Lodha
women. The perceived mean duration of breast feeding was estimated
to be 26.4 months against 42.6 months of actual duration of
breastfeeding for the youngest child. This duration was much higher
than the national average of 24.4 months and 32.8 months for West
Bengal (IIPS 1995). Gangadharan (1982), in his study among the
Chenchu, a food gathering tribe of Andhra Pradesh, estimated a mean
duration of breastfeeding of 20.64. It appears that the longer duration
of lactation among the Lodhas was not just because of social and
cultural practices but also because of the lack of alternative source of
food supplementation to children.
It is recommended that the first breast milk should be given to
every newborn children because it contains colostrums which provide
natural immunity and important nutrients to children. However, a
substantial majority (64 per cent) for the mothers in India squeeze the
first milk before they begin breast feeding (IIPS,1995). Among the
Lodhas, only 16.0 per cent of the women breast fed their babies
immediately after birth and 40 per cent breast fed their babies the next
day. This indicates that there is a need to educate mothers regarding the
importance of early initiation of breast feeding. It was also found that
majority of the Lodha women (62 per cent) breast fed their infants 8 or
more times a day. Gangadharan and others (1982) have also estimated
that Chenchu women fed their infants, on an average, fed their infants
9.7 times a day. At the same time, the sex difference in the frequency of
breastfeeding per day was not found to be statistically significant
(Cramer’s value = 0.087, p>0.1) (Table 4). Similarly, although, girls
enjoyed a larger duration of breastfeeding compared to boys but the
difference was not found to be statistically significant (Cramer's value
= 0.115, p>0.1) (Table 4). However, the study conducted by Carneiro
(1988) among the Warli tribe observed that male children were
breastfed longer period as their welfare was perceived more important.
174

Perception of Child Health in Tribals
ConclusionsTo conclude, the study points out to the fact that due to wrong
perceptions of child health care among the Lodhas, majority of them do
not understand the importance of the utilisation of the available child
health facilities and thus make children vulnerable to childhood
morbidities and even death. There is need to change this perception in
the interest of improving the child survival, health, and growth.
Regarding child immunisation services, majority of the respondents
were aware of it but utilisation of the full services was meager and the
drop out was quite high. This indicates that there is a need for
community specific IEC programme on immunisation to bring about a
behavioural change for better utilisation of the services in future. Breast
feeding patterns indicate that it was universal among the Lodhas. A
longer duration of breast feeding is a good indication but the Lodhas
need to be educated regarding the early initiation of breast feeding and
the colostrums should not be discarded.
ReferencesBardhan A, Sinha SK (1989) A Diagnostic Study of Factors Responsible
for Lesser or No Utilization of Health Facilities among the Bhils of
Madhya Pradesh. New Delhi, National Institute of Health and
Family Welfare. PCA Report.
Basu SK, Kshatriya G (1989). Fertility and mortality in tribal population
of Bastar district, Madhya Pradesh, India. Biological Society 6: 100.
Basu SK (1987) Genetic, socio-cultural and health care among tribal
groups of Jagdalpur and Kota tehsil of Bastar district of Madhya
Pradesh. In AK Kall and S Singh (ED) Anthropology, Development and
Nation Building. New Delhi, Concept Publishing Company.
Basu SK (1990) Genetic, socio-cultural determinants of tribal health:
Bastar tribal group of Madhya Pradesh. In B Choudhury (Ed)
Cultural and Environmental Dimension on Health. New Delhi, Inter-
India Publication.
Bhomick PK (1994) The Lodhas of West Bengal: A Socio-Economic Study .
Bidisha, West Bengal, Rarh Samshriti Sangrahalaya.
Caldwell JC (1982) Theory of Fertility Decline. New York, Academic
Press.
Carneiro P (1988) Breast feeding patterns and lactational amenorrhoea
among the Warli tribals: A socio-anthropological inquiry.
International Journal of Fertility suppl :pp 35-39.
175

Child Survival and Health
Government of India (1951) District Census Handbook. Medinipur.
New Delhi, Registrar General and Census Commissioner.
Das AK, Banerjee SK, Raha M (1964) Lodha settlement: An evaluation.
Bulletin of the Cultural Research Institute 3 (2).
Gangadharan V, Reddy BV, Reddy GP (1982) Subsistence activities,
breast-feeding and birth-spacing among the Chenchu - a food-
gathering community in Andhra Pradesh. Journal of Family Welfare,
28(3): 63-69.
Ghosh S (1989). You and your child, New Delhi, Voluntary Health
Association of India, New Delhi, cited from S Narahari, M
Narasinga, BS Bhaskara, A Aparna A (2009) The porja: A study on
pediatric practices. Anthropologist 11(2): 147-149.
Graham WJ, Ronsmans CCA, Filippi VGA, Campbell OMR, Goodburn
EA, Marshall TF, Sulman C, Davis JL (1995). Asking questions
about women’s reproductive health in community based surveys:
guidelines on scope and content. London, London School of
Hygiene and Tropical Medicine.
Gupta R(1959). Lodhas revisited. Man in India 39: 210.
Hadderson J (1987) SPSS Made Simple. , Belmont California,X
Wadsworth Publishing Company.
Haque M (1990) Height, weight and nutrition among the six tribes of
India. In B Choudhury (Ed) Cultural and Environmental Dimensions
on Health. New Delhi, Inter-India Publication.
Jain BC (1995) The Lodhas: A study of their contemporary social milieu
with special reference to Farrukhabad City (U.P.). Man in India
21(3&4).
Kapoor R (1994) Women, Work and Reproduction: A Study of Muslim
Chicken Workers. PhD Thesis. Mumbai, International Institute for
Population Sciences.
Mahapatra S (1990) Cultural pattern in health care: A view from Santhal
world. In B Choudhury (Ed) Cultural and Environmental Dimensions
on Health. New Delhi, Inter-India Publication.
Mukherjee BM (1990) Health status of Manipur women with special
reference to the tribals. In B Choudhury (Ed) Cultural and
Environmental Dimensions on Health. New Delhi, Inter-India
Publication.
Narahari S, Narasinga M, Bhaskara Babu S, Aparna A (2009) The porja:
a study on pediatric practices. Anthropologist 11(2):147-149.
176

Perception of Child Health in Tribals
International Institute for Population Sciences (1995) National Family
Health Survey (NFHS), India 1992-93, Summary Report (1992-93).
Mumbai, International Institute For Population Sciences.
International Institute for Population Sciences (1995) National Family
Health Survey (NFHS) 1992-93, West Bengal, Summary Report (1992-
93). Mumbai, International Institute For Population Sciences.
International Institute for Population Sciences (2007) National Family
Health Survey (NFHS-3) 2005-06, India, Vol 1. Mumbai, International
Institute For Population Sciences.
Neetimakanti (1991) Care and development of children in tribal areas.
ICCW News Bulletin 39:39-44.
Risley HM (1891) The Tribes and Caste of Bengal. Calcutta, Bengal
Secretariat Press (reprint 1981).
Rizvi SNA (1986) Health practices of the Jaunsaries - A socio-cultural
analysis. In B. Choudhury (Ed) Tribal Health: Socio-Cultural
Dimensions. New Delhi, Inter-India Publication.
Roy Burman BK (1986) Morbidity and nutritional status of the
Scheduled Tribes of India. In B. Choudhury (Ed) Tribal Health: Socio-
Cultural Dimensions. New Delhi, Inter-India Publication.
Roy Burman BK (1990) Development hazards in health in tribal India.
In B. Choudhury (Ed) Tribal Health: Socio-Cultural Dimensions. New
Delhi, Inter-India Publication.
Saha KB, Saha U, Shajy KI (2003). Child care and utilization of health
services in some north Indian states. The Eastern Anthropologist
56(1):75-91.
Singh KS (1994) The Scheduled Tribes: People of India vol III. New Delhi,
Anthropological Survey of India and Oxford University Press.
Sinha A, Pandey H (1998) Maternal and infant feeding practices of Ho
tribe women in Bihar. Indian Journal Nutrition and Diet 35(12):325-
328.
Swain S, Jena SC, Singh P (1990) Morbidity status of the Kondha tribes
of Phulbani (Orissa). In B. Choudhury (Ed) Cultural and
Environmental Dimensions on Health. New Delhi, Inter-India.
177

Child Survival and Health
Table 1
Superstitious belief on child health perception by background
characteristics
Background
characteristics
Base Number of respondents (%)
Superstitious perception on child
health
Low
(4-7)
Medium
(8-9)
High
(10+)
Age
15-24
25-34
35-49
1.8e+08 52 (29.7)
58 (27.6)
17 (14.8)
58 (33.1)
69 (32.9)
42 (36.5)
65 (37.1)
83 (39.5)
56 (48.7)
Total 127 169 204
Education
Illiterate
Literate
344156 66 (19.2)
61 (39.1)
109 (31.7)
60 (38.5)
169 (49.1)
35 (22.4)
Total 127 169 204
Occupation
Others
Gatherer
195305 63 (32.3)
64 (21.0)
77 (39.5)
92 (30.2)
55 (28.2)
149 (48.9)
Total 127 169 204
No. of children born
1-2
3+
283208 76 (26.9)
48 (23.1)
100 (35.3)
66 (31.7)
107 (37.8)
94 (45.2)
Total 124 166 201
Index of religiosity
Low
Medium
High
1.1e+08 52 (47.7)
70 (25.0)
5 (4.5)
23 (21.1)
112 (40.0)
34 (30.6)
34 (31.2)
98 (35.0)
72 (64.9)
Total 127 169 204
178

Perception of Child Health in Tribals
Table 2
Distribution of the respondents according to awareness on different
immunisation scheme
Name of the Vaccination of
different Immunisation
Schemes
No. of Respondents(%)
N=491
(Multiple responses)
OPV
BCG
DPT
Measles
420 (85.5)
328 (66.8)
235 (47.9)
207 (42.2)
Table 3
Distribution of the mothers according to their perception and
utilisation of immunisation services
I. Perception: immunisation is
necessary to save the child during
infancy
No. of Respondents (%)
N=491 (Multiple Response)
Agreed
Neutral
Disagree
363 (73.9)
41 (8.4)
96 (19.6)
II. Utilisation of the immunisation
services
No. of women who utilized the
immunisation services
Fully vaccinated
Partially vaccinated
Not vaccinated
173 (35.2)
215 (43.8)
103 (21.0)
Note: Only 491 ever married sample women in the reproductive
age group gave at least one birth at the time of survey.
179
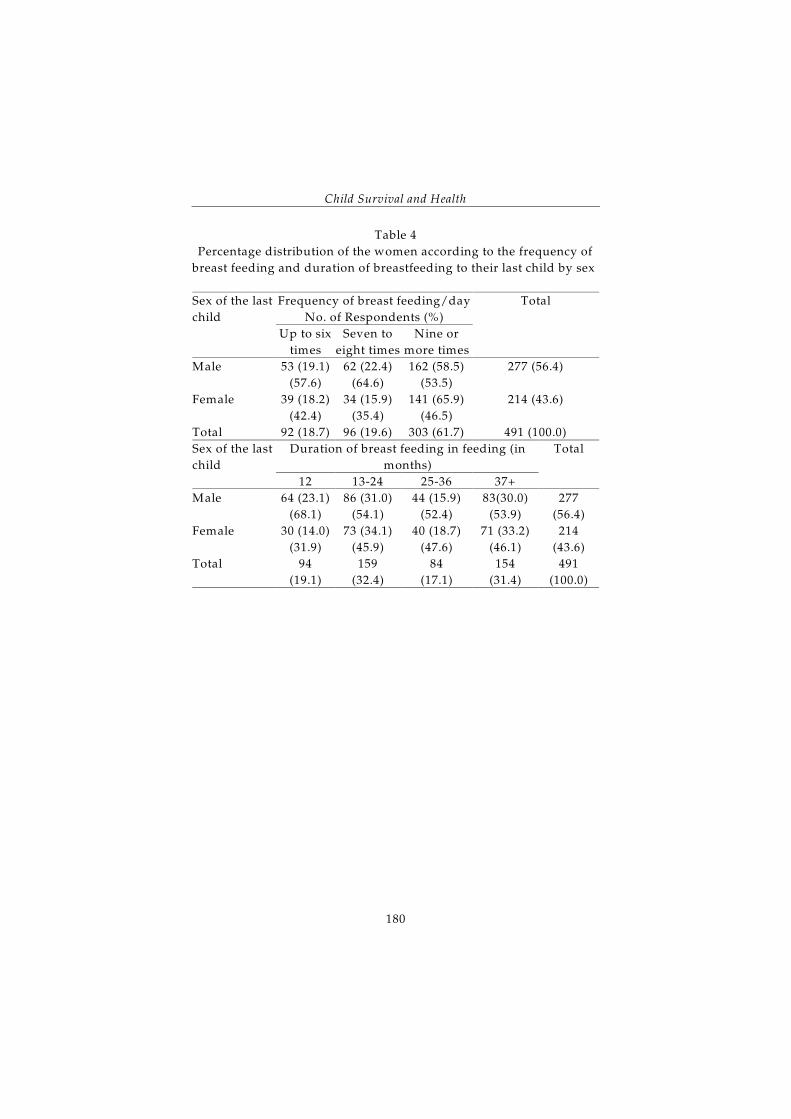
Child Survival and Health
Table 4
Percentage distribution of the women according to the frequency of
breast feeding and duration of breastfeeding to their last child by sex
Sex of the last
child
Frequency of breast feeding/day
No. of Respondents (%)
Total
Up to six
times
Seven to
eight times
Nine or
more times
Male
Female
53 (19.1)
(57.6)
39 (18.2)
(42.4)
62 (22.4)
(64.6)
34 (15.9)
(35.4)
162 (58.5)
(53.5)
141 (65.9)
(46.5)
277 (56.4)
214 (43.6)
Total 92 (18.7) 96 (19.6) 303 (61.7) 491 (100.0)
Sex of the last
child
Duration of breast feeding in feeding (in
months)
Total
12 13-24 25-36 37+
Male
Female
64 (23.1)
(68.1)
30 (14.0)
(31.9)
86 (31.0)
(54.1)
73 (34.1)
(45.9)
44 (15.9)
(52.4)
40 (18.7)
(47.6)
83(30.0)
(53.9)
71 (33.2)
(46.1)
277
(56.4)
214
(43.6)
Total 94
(19.1)
159
(32.4)
84
(17.1)
154
(31.4)
491
(100.0)
180

Successful Health and Nutrition
Programme for Child Survival
in Andhra Pradesh
M UbaidullahS Krishna Reddy
A Kusuma
IntroductionThe focus of this paper is on the successful provision of integrated
comprehensive health services - general health, reproductive and child
health, prevention of Sexually Transmitted Infections (STI) including
HIV/AIDS, and family planning - to Lambadas, a tribal community
living in the rural areas of Khammam District in the state of Andhra
Pradesh in India. The word Lambada is derived from the word Lamba
which means tall (Census of India 1961). The Lambadas seems to have
been one of the ancient tribes in India since their name is found in old
literary works like Dasakumara Charitam written by Dandi in 11 andth
12 Century. They are supposed to be the descendent of original Aryanth
gypsies or Roman Banjaras of North-west India whose descendent are
also found in various parts of the South Europe, Central Asia and
America. Lambadas were chiefly traders. They are also known as
Sugalis or Banjaras. There are many mythologies regarding the origin
of Lambadas. (Thurston 1975). Based on these mythologies, Lambadas
also consider themselves as Kshatriyas (Kamala Manohar Rao 1950).
Many scholars like Thurston, Kamala Manohar Rao, Siraj-Ul-Hassain,
Aiyer, etc. opine that Lambadas were chiefly traders dealing with salt
or rice or betel nut. The Lambadas are aware that their forefathers were
migrants from the Deccan with the Moghul armies which had been
linked with Asaf Jah the Vazir of Shajahan. It is also traced out in the
history that after the conquest of Warangal by Mohammed Tughlak,
most of the Lambadas stayed in Warangal and started trading in the
181

Child Survival and Health
south. Marriages among the Lambadas are based on the principles of
community endogamy and the clan exogamy.
By and large, the Lambadas are a beautiful tribe. They are basically
intelligent, faithful, honest and brave. Once they are gained over, they
remain as devoted followers. A typical Lambadas is dolichocephalous,
with oval face, black or brown eyes, long hair and strait nose
(Nanjundayya and Iyyer 1928). Both men and women are strong and
are capable of enduring long and fatiguing marches. They still retain
their fair complexions despite the beastly summer of the Deccan.
Since the Lambadas are nomadic, they live in detached clusters of
rule huts called ”thandas” at some distance from established villages.
They eat all kinds of fowls and pork. Lambadas feel that the institution
of marriage is used as social mechanism to create and foster social
solidarity and hence they have supposed the marriage institution. The
dress and ornaments of Lambadas denote their utility and importance
and protects them from all types of climatic disorders. These people
can easily be identifide by the traditional dress and ornaments. Some
Lambada women treat their dress and ornaments with their social
values and they also preserve them as their ancestral property. Some of
the old Lambadas are of the view that tattooing gives relief from the
pain in the body and joints and protects from the evil looks of others.
Both male and females are addicted to heavy drinking. Their culture
regulates the mode, kind and quantum of drinking. Lambadas have
adopted many festivals of Hindus. They have shown greater interest in
preserving and continuing their traditional religious beliefs and
festivals. With the exception of these festivals, under normal conditions
of life, there is a very little spiritual or devotional activity in the
community. Poor health, especially, diseases are interpreted in terms of
supernatural interferences, and are sought to be remedied by magico-
religious procedures and witchcraft.
The Lambadas are mostly illiterate. They live under abject poverty
conditions. Child marriages are common among them. Pre-marital and
extra-marital sexual relations and liquor addiction are also quite
common among both men and women. Usually, Lambadas do not seek
medical help whenever somebody falls ill in the family. They approach
an allopathic doctor only when the condition of the patient becomes
serious. A Lambada couple, on average, has 6-7 children. Only less
than one third of Lambada children (30 per cent) go to school. The vast
majority of Lambada couples do not practice family planning; the
couple protection rate is only around 22 per cent. Most of the deliveries
182

Health and Nutrition Programme for Child Survival
(80 per cent) take place at home. Only one fourth of them (25 per cent)
make use of hospital facilities during pregnancy and delivery. The
incidence of HIV among the Lambada men and women is found to be
very high (6 per cent) as against the national (0.91 per cent) and state
(2.75 per cent) averages. Infant and child rate and maternal mortality
ratio in Lambadas have been found to be well above the national and
state averages (Table 1). Similarly, mother-to-child transmission of HIV
has been found to be very high in Lambadas. Almost three-fourth of
new born are low birth weight babies, weighing less than 2.5 kgs.
Severe malnutrition has been found to be widely prevalence in infants,
young children, pregnant women and lactating mothers.
Against the above demographic and health backdrop, a
comprehensive health package was designed to improve the general
health status, prevent the spread of STI/HIV and mother-to-child-
transmission (MTCT) of HIV, bring down maternal, infant and child
morbidity and mortality and improve the nutritional status of the
Lambada community. The comprehensive health package so designed
was implemented by a non government organisation with the help of
trained social workers. This organisation has been running a
hospital/clinic. The programme is still in operation.
Methods and MaterialsKhammam is a socially and economically background district in
Andhra Pradesh. It has the highest proportion of Scheduled Tribes
population in the state. For the present operational research study, a
cluster of 100 villages with a population of about 2,00,000 was selected.
The Lambadas constituted majority of the population in the selected
villages. Men and women in the selected villages were encouraged and
persuaded to make use of services being provided under the
programme in the villages and at the hospital/clinic. The programme
was carried-out with the help of trained social workers, paramedics and
a doctor at the village level. At the hospital/clinic level, paramedics,
social workers and doctors provided a range of health care and other
supportive services to the Scheduled Tribes people in a very friendly
and cordial atmosphere.
Social Workers and their Role. In all, 10 social workers were
appointed and they were trained for a period of two months well before
the commencement of the programme. All of them were post-graduates
in Social Work and had a minimum of five years experience in
conducting similar programmes. They were trained thoroughly about
183
Child Survival and Health
STI/HIV/AIDS, maternal and child health, family planning, etc. as well
as in the use of different educational techniques to bring about
attitudinal change among the Lambadas regarding pre-marital and
extra-marital sexual behaviour, if any, and use of condom for safe sex.
They were also trained in rapport building and counselling techniques
etc.
Social workers involved in the programme performed multiple
roles. Initially, they built-up very good rapport with the Scheduled
Tribes community using counselling techniques. The counselling
sessions were conducted in Telugu, the local language which the
Lambadas understood easily. Subsequently, they judiciously used other
educational strategies (posters, group discussions, meetings and
counselling) to provide scientific knowledge to the respondents thus
sharpening their awareness about health and family welfare related
issues. The importance of using condom to avoid the risk of HIV/AIDS
infection and the correct procedure to use condom was also explained
to them. These counselling sessions contributed significantly in
enhancing the knowledge of Lambadas about STI/HIV/AIDS, maternal
and child health, nutrition, family planning, use of condom for safe sex,
the importance of attending the MCH clinic regularly for pre-natal,
natal and pos-natal care and Voluntary Counselling and Testing (VCT)
of HIV. The counselling programme had the desired impact and the
Lambadas started attending hospitals whenever they fell ill. The
pregnant women learnt to visit the MCH clinic regularly. The HIV
positive pregnant women not only visited the MCH clinic regularly but
also modified their infant-feeding practices and had deliveries in the
clinic. Some of the HIV positive pregnant women accepted medical
termination of their pregnancy and a few opted for family planning
after delivery. The impressive success achieved in the prevention of
HIV transmission was largely due to the dedicated efforts of the social
workers in conducting the intervention programmes. They richly
deserve thanks of all concerned.
Programme interventions. The programme included a range of
interventions of varied nature. These interventions are discussed below
at some length:
Community Education and Mobilization. Social workers initiated the
community education programme on STI/HIV to create a clear
understanding of the magnitude of the problem in a holistic way,
especially among the Lambadas and in Khammam district and Andhra
Pradesh, in general. The programme was organised for a period of six
184

Health and Nutrition Programme for Child Survival
months in all the 100 villages covered under the programme and
covered such issues as high infant and child mortality, nutrition, etc. As
the result of the programme, people living in these villages were able
to get a clear understanding of the problems of STI, reasons for high
infant and child mortality and mortality, importance of nutrition,
availability of health facilities, etc. Posters were put up in all villages
explaining STI, family planning, maternal and child health, balanced
diet, immunisation etc., to create mass awareness on all the programme
components.
Information, Education and Communication. A variety of information,
education and communication (IEC) activities were organised in
villages for about one year through group discussions, meetings,
distribution of literature and pictures, folk media, one-to-one meetings
and counselling. As part of information, education and communication
programmes, the Lambadas both men and women were explained
about prevention of mother-to-child Transmission of HIV, signs and
symptoms of STI/HIV, its dangers, the prevention of STI/HIV,
importance of treating STI, availability of health services, importance of
immunisation of pregnant women, infants and children, importance of
nutrition and applied nutrition programme initiated in the community,
need, importance and advantages of family planning and small family.
These activities were directed primarily towards enhancing the
knowledge of Lambadas community about critical issues related to their
health.
Enactment of Plays. Selected folk were trained in enacting plays in
the villages to communicate messages on STI, methods of family
planning, advantages of family planning, utilisation of maternal and
child health services, applied nutrition programme etc.
Folk Media. Traditional folk media is still very popular in rural areas
of India. A variety of folk media programmes were organised in the
project villages to provide information about availability of general
health services, maternal and child health and applied nutrition
programme for women and children. The folk media messages were
well received by the people in rural and semi-urban areas. They were
found to be an inexpensive way of reaching the people at large. Folk
media was also found to be a very useful tool to have an immediate
impact on the audience.
Distribution of Literature on Maternal and Child Health/STI and Family
Planning. Literature with pictures on STI, its dangers, its symptoms, its
mode of transmission, spread of the disease, its prevention, compulsory
185

Child Survival and Health
treatment of STI, to men and women in these villages. Also, pamphlets
explaining the importance of the utilisation of maternal and child health
services and places where maternal and child health services were
available were also distributed.
Group discussions. Group discussions for the young married men
and women were organised by the Social Workers to discuss symptoms
of STI, spread of the disease, disease prevention, compulsory treatment
of STI, etc. In addition, the need and importance of family planning,
concept of small family norm, availability of maternal and child health
services, need to make use of maternal and child health and applied
nutrition programmes services were also discussed. All explanations
were given through pictorial illustrations to the extent possible. The
participants were given ample opportunity to discuss their doubts with
regard to STI and all other related issues such as MCH services, applied
nutrition programme etc.
Meetings. In village under the project, a meeting was organised once
in two months. The meetings were arranged generally during the night,
between 7.00 to 9.00 PM which was very convenient for the villagers.
The date and venue of the meeting was informed well in advance to
men and women of each village and were requested to make it
convenient to attend them. In these meetings, villagers were explained
in detail about the prevalence of high maternal, infant and child
morbidity and mortality in the tribal communities, the need and
importance of family planning, the concept of small family norm, the
availability of reproductive and child health and applied nutrition
programme services. Men and women who attended these meetings
were also given equal opportunities to discuss frankly their sexual,
health and other related issues and problems and all their doubts were
clarified.
One-to-one meetings. Usually, several rural people both men and
women feel shy in the village meeting and group discussions to raise
their doubts with regard to STI, family planning and other related
issues. Such people prefer to have personal meeting. For such people,
social workers and paramedics working under the project arranged
one-to-one personal meeting to provide the desired information, to clear
the doubts and to bring about the behavioural change. These meetings
were found to be very much effective in infusing a positive orientation
in the people about issues related to health and survival of children and
women.
186

Health and Nutrition Programme for Child Survival
Involvement of father in maternal and child health programme.
Traditionally, in the Indian society, whenever a woman becomes
pregnant, it is the elderly women who used to accompany her when she
goes to a doctor for availing the maternal and child health services. The
situation appears to be changing in the urban areas as men are
increasingly found to accompany women to the hospital. However, this
change is rarely visible in the rural areas. In order to promote
involvement of the father or the husband, social workers and
paramedics emphasised the role and contribution of men in
reproductive health and family planning issues. This emphasis has
resulted in a positive attitude in men about health related problems of
women. Men have slowly started accompanying their wives whenever
they to go to the clinic for ante-natal check up. They have been found
to support their wife to adopt family planning, encourage them to have
adequate nutrition during pregnancy, and provide the needed physical,
financial and emotional support during pregnancy, at the time of
delivery and during the post-partum period. Men who were more
involved in the health of their family members were not only able to
provide better health to them but also had close relationship with all the
family members.
Pre-natal, Natal and Post-natal Care at the Doorstep of the People and at
the Clinic. Pre-natal, natal and post-natal care services are provided both
at the clinic and in the village. All pregnant women are advised to visit
the hospital for routine check-up. Pregnant women who cannot attend
the hospital and who intended to have services at their residence were
taken care off by the paramedics. However, HIV-testing was done only
in the clinic. If the paramedics felt that a particular case was to be seen
by the doctor, she was referred/taken to the hospital. Further, all the
HIV-positive pregnant women were strongly advised to have deliveries
in the clinic. If at all, any woman expresses her inability to have delivery
in the clinic for one reason or the other, then the local trained
dais/paramedics conducted the delivery and administered Nevirapine
both to the mother and the infant at the time of delivery at their
residence to prevent mother-to-child-transmission of HIV.
Prevention of Mother-to-children Transmission of HIV . All the
pregnant women were screened for their HIV-status. Women, who
were found to be HIV positive were given single oral doses of
Nevirapine at the time of delivery along with the new born to prevent
mother-to-child-transmission of HIV. In case of hospital-based
deliveries, the staff at the hospital administered the drug to both the
187

Child Survival and Health
mother and the new born. The few HIV-positive home deliveries were
attended by traditional birth attendants/paramedics who were trained
in conducting deliveries and a single oral dose of Nevirapine was kept
ready for self-medication at the onset of labour and to the infant within
72 hours of delivery.
Applied Nutrition Program for Pregnant and Lactating mothers and
Children. Nutritious food was provided to pregnant women, lactating
mothers and children in the community as part of the applied nutrition
programme through paramedics, social workers and self-help groups
in every village to enhance their nutritional status.
Food Supplementation to Under-weight Women. The criteria was
weight for age and weight for height. To identify the undernourished
potential mothers, the body mass index (BMI) was used for girls
between 13-20 years of age. All girls having a BMI less than the 10 th
percentile curve were considered as undernourished and were
provided nutritional supplements. Similarly, children aged 5-14 years
and having a BMI less than 5 percentile curve were classified as underth
nourished and were given nutritional supplements.
Food Supplementation to Pregnant Women. All pregnant women were
given food supplementation for a period of eight months equalling 4
kgs of nutrition powder per month. In addition to this, milk, eggs,
vegetables, etc. were also provided.
Food Supplementation to Lactating Mothers. Each lactating mother was
given a food supplementation equivalent to 13,500 calories per month
during the lactation period – equalling 4 kgs nutrition powder per
month, out of which 2 kgs nutrition powder was cooked and given. In
addition, milk, eggs, vegetables were provided free of cost.
Weaning of Infants between 4 Months and 1 Year. Infants were given
1 kg of cereal food made of ragi, Bengal gram and broken dried gram
per month from the fourth month to one year, as weaning food.
Supplementary Nutrition for Children of 1-2 Years of Age. Children of
1-2 years of age were given 1 kg of dried nutrition powder mixed with
grains such as ragi, Bengal gram and broken dried gram in equal
proportion. The powder was cooked and served to the children by
women’s groups.
Supplementary Nutrition for Children between 2-5 Years. Children aged
2-5 years were given calorie supplementation made of boiled and salted
Bengal gram/green gram at the rate of 1 kg for the 2 year old, 2 kg for
3 year old and 3 kg for 4 year old in all nursery schools in the study area
covering 100 villages.
188

Health and Nutrition Programme for Child Survival
Supplementary Nutrition for Severely Malnourished Children aged 5-14
Years. About 87 per cent of the children in this age group were
undernourished. On average, a child in this age group needs 2,500
calories per day. Hence, supplementary nutrition was given to children.
It was estimated that they needed 15,000 calories per month.
Accordingly, a total calorie supplementation of 15,000 calories which
was rounded to 2 kgs of nutrition powder and groundnut. The nutrition
powder consisted of Bengal gram and jaggery mixed with roasted
groundnut.
Micronutrients for Infants, Children, Pregnant Women and Lactating
Mothers and Undernourished Mothers. In addition to food
supplementation to combat protein-calorie under nutrition, micro-
nutrients were given to all infants, children, pregnant women, lactating
mothers and under nourished mothers. Children who were below one
year were given Vitamin A, B and D in the form vitamin drops.
Children between 1 and 15 years were given 50,000 units of Vitamin A,
every three months. Children between 2 and 5 years of age were given
iron supplementation every month. They were also given, once a week,
ginger and groundnut sweets to add oil content to their food. In
addition, calcium supplementation was also given (half a tablet) daily.
Each pregnant woman was given one iron tablet and one B-Complex
tablet per day. On the other hand, each undernourished mother was
given one iron capsule and one multi-vitamin tablet daily while .
Lactating mothers were given one iron tablet and one calcium tablet
daily.
Immunisation of Pregnant Women, Infants and Children. Facilities were
made available both at the village and the clinic. At the clinic,
immunisation was given on every Monday and Tuesday and in the
villages it was on every Thursday and Friday. All the pregnant women,
infants and children were immunized as per the immunisation
schedule. Every pregnant woman, infant and child were given an
immunisation card to ensure that all of them were immunized as per
the schedule without fail. The paramedics also maintained a record of
pregnant women, infants and children and kept their track and saw to
it that all were immunized as per the immunisation schedule.
Medical Termination of Pregnancy. Some of the pregnant women
having less than 20 weeks of pregnancy who wanted to abort the
pregnancy were advised the medical termination of pregnancy by the
doctor. The grounds for advising medical termination of pregnancy
included:
189

Child Survival and Health
1. Women who were anaemic, under weight and were not capable of
bearing the pregnancy.
2. Women who were HIV-positive and who had more than two
children.
3. Women who had more than four children.
Immunisation Schedule
Age Vaccine
Pregnant women TT 2 doses
Birth BCG (injection) and 0 dose polio
6 weeks 1 dose DPT (injection)st
1 dose oral polio vaccine (drops)st
1 dose hepatitis B vaccine (injection)st
10 weeks 2 dose DPT (injection)nd
2 dose oral polio vaccine (drops)nd
2 dose hepatitis B vaccine (injection)nd
14 weeks 3 dose DPT (injection)rd
3 dose oral polio vaccine (drops)rd
3 dose hepatitis B vaccine (injection)rd
9 months Measles vaccine (injection)
18-24 months Booster dose of DPT & OPV
5 years DT (injection)
10 years TT (injection)
16 years TT (injection)
ResultsThe result of the above interventions was a marked improvement in
almost all dimensions of the demographic and health situation in
Lambada community as may be seen from table 2. These achievements
are discussed below:
Utilisation of Health Services. In the year 2003, only 1265 women of
the Lambada community utilised the available maternal and child
health services in the project area. As the result of programme, this
number increased to 4903 in 2007 which shows the effectiveness of the
interventions under the programme.
Perinatal Transmission of HIV . Before the commencement of the
programme, perinatal transmission of HIV was estimated to be as high
as 4 per cent in the year 2003. This proportion came down to 1.4 per
cent in 2007 as the result of very intensive counselling programme.
190

Health and Nutrition Programme for Child Survival
Infant and child mortality. The infant mortality rate was 102/1000 live
births in the year 2003. By the year 2007, the infant mortality rate
reduced to 43/1000 live births. Similarly, the under 5 mortality rate
decreased from 123 in 2003 to 73/1000 live births in 2007.
Maternal mortality. Before the commencement of the programme
maternal mortality rate was 580/1,00,000 live births due to poor
nutrition, poor health, under-utilisation of health facilities, poor
sanitation, frequent child births, under weight etc. As the result of
programme interventions, maternal mortality decreased to 392/1,00,000
live births in 2007.
Institutional deliveries. Initially, only about one-fourth of Lambada
women delivered in the hospital. As the result of programme
interventions, the proportion of institutional deliveries increased to 84
per cent in 2007.
Low birth weight babies. The proportion of low birth weight babies
came down from about 70 per cent before the start of the project to only
23 per cent in the year 2007.
Under-weight children. Like the proportion of low birth weight
babies, the proportion of children having low weight for age decreased
from 60 per cent in 2003 to 17 per cent in 2007.
ConclusionsThe achievement of the programme clearly shows that it is possible to
bring down maternal, infant and child mortality and morbidity to very
low level with the programme interventions initiated for the tribals.
Similarly, institutional deliveries became popular among the tribal
community. The percentage of low birth weight babies and under-
weight child born to these tribes has decreased considerably. In Madhya
Pradesh a large percentage of tribals are living. Their health status is
very poor Thus, the programme intervention are worth replicating in
all the tribal areas where similar situation exist.
ReferencesAiyer AD (1963) The Banjaras - Their Manners and Customs. The
Mirror, December 1963.
Government of India (1961) Census of India Vol. I. Monograph Series Part
V B (IV) Lambadi . New Delhi, Office of the Registrar General India,
Ministry of Home Affairs.
191

Child Survival and Health
Krishna Reddy B (1991) The Sugalis: The Study of Transition. Ph.D
Dissertation. S.V. University, Tirupati.
Manohar Rao MJ, Kabra KN, Ravikumar T, Badr R (1985) Political
Economy of Tribal Development. Warangal, Indian Institute of Public
Administration.
Nanjundayya HV, Iyyer LKA (1928) The Mysore Tribes and Castes Vol II.
Mysore, University of Mysore.
Russel RV, Hiralal (1975) Tribes and Castes of Central Province of India Vol
II. New Delhi, Rajdhani Book Centre. (Originally published by Mac
Millan & Co, London in 1916).
Siraj-Ul-Hassain S (1920) The Caste and Tribes of HEH. The Nizam
Dominions Vol. I. Hyderabad.
Thurston E (1975) Caste and Tribes of Southern India Vol IV. New Delhi,
Cosmo Publications.
World Health Organisation and United Nations Children’s Fund (2004)
Global Strategy for Infant and Young Child Feeding. Geneva, World
Health Organisation.
World Health Organisation (2003) Diet, Nutrition, and the Prevention of
Chronic Diseases: Report of a Joint World Health Organization and FAO
Expert Consultation. Geneva, World Health Organisation Technical
Report Series 916.
192

Table 1
Key demographic and health indicators in Lambadas as compared to
Andhra Pradesh and India, 2003.
Indicator Lambadas Andhra Pradesh India
Infant mortality rate 102 52 62
Under 5 mortality
rate
121 98 91
Maternal mortality
ratio
540 420 436
Mother to child
transmission of HIV
4 2 0.9
Source: NFHS-3
Table 2
Achievements of the programme.
Utilisation of Health
Services
2003 2004 2005 2006 2007
Maternal and child health 1265 2872 3896 4658 4803
Prenatal transmission of
HIV
4 4 3 2 1
Infant mortality 102 94 89 54 43
Under 5 mortality 123 116 109 87 73
Institutional deliveries 23 38 45 70 84
Low birth weight babies 70 65 59 26 23
Underweight children
(0-5) years
60 53 41 21 17
193

Child Survival and Health
194

Infant Mortality in the Gond Tribe of
Raisen District, Madhya Pradesh
Ajay Kumar Gharami
Introduction“Children’s health is tomorrow’s wealth” is a very well known saying.
In reality, birth of a child occupies a special position in people’s life as
children are loved all over the World. As per WHO (1981, 1990), infant
mortality rate is an accepted global indicator of health and
socioeconomic status of the population. Infant mortality has long been
used as a marker of the socio-economic development of a nation
(Gubhaju et al 1992) and a reliable indicator of health status and well-
being of children.
Unfortunately, a large number of children die every year in India
due to various kind of disease conditions. In order to prevent these
premature deaths, a number of programmes have been implemented in
India over the last two decades. These include Child Survival and Safe
Motherhood Program (CSSM), Reproductive and Child Health Program
(RCH). At present, Integrated Management of Neonatal Childhood
Illness (IMNCI) approach is being implemented under the National
Rural Health Mission to address the problem of infant and child
mortality. However, irrespective of these interventions, the situation
related to infant's health remains a major concern and a daunting
challenge. There has been a decrease in the infant mortality rate in India
but this decrease has been slow by international standards. Analysing
the slow decrease in India’s infant mortality rate, Sandhya (1991) has
opined that there are certain socio-cultural factors which play some
important role in determining the level of infant mortality rate
195

Child Survival and Health
including such factors as public health engineering, control of certain
communicable diseases such as malaria, cholera, etc. Sandhya (1991) has
also observed that one hardly finds details on socio-cultural and
demographic characteristics of infant deaths from secondary sources of
information.
It is well established that many a social and biological factors are
associated with survival and well being of the child during infancy and
early childhood. The determinants of infant mortality, however, vary
between regions, between cultural groups, and also between
geographical regions of different economic status. However, very few
anthropological studies have been carried out on this aspect in tribal
population in Madhya Pradesh (Basu 1989, Talwar 1988, Sharma 1999,
Adak et al. 2004). Tribal population in Madhya Pradesh constituted
more than one fifth of the state population at the 2001 population
census. In the present paper, we make an attempt to analyse infant
mortality and analyse its key determinants in the Gond Tribe of Raisen
District of the state.
Material and MethodsThe present study focuses on the Gond tribe residing in villages
surrounding Bhimbetka in district Raisen of Madhya Pradesh. The
information used in the present analysis was derived from a survey of
all Gond households in 13 villages in the area. An exhaustive schedule
was prepared for data collection. The survey was carried out during the
months of January through June in the year 2007. It covered 370 ever
pregnant Gond tribe women from 13 villages. The present analysis is
based on the information available through these 370 ever pregnant
women.
The Gond in Madhya Pradesh speaks the ‘Gondi’ dialect, which
belongs to the Dravidian family of languages. Though, the traditional
marriage i.e. marriage by capture is not prevalent among them yet,
cross-cousin marriage, marriage by exchange and marriage by service
is prevalent in the Gond tribes. The primary source of livelihood for the
Gond tribes is agro-forestry. The Tribe is organised into a number of
clans and members of each clan worship their own deity described as
‘persa pen’ (Adak et al., 2003).
ResultsThe survey has revealed that the Gond tribes live in abjectly poor
conditions. In more than 63 per cent of the Gond families surveyed, the
196

Infant Mortality in Gond Tribes
head of the family earned their livelihood as daily wage labour with the
result that more than 82 per cent of the Gond families surveyed were
low income families. Poor economic status of Gond families was found
to be associated with mass illiteracy. More than 83 per cent of women
and than 64 per cent of men in the surveyed population were illiterate.
In the demographic context, the population of Gond tribes surveyed
may be classified in the very early stage of demographic transition with
high levels of fertility and high levels of mortality, especially infant and
child mortality. Teenage pregnancies were quite common in the
population surveyed which may be one reason for very high number of
infant deaths.
The infant mortality rate (IMR) in the surveyed population is
estimated to be 129 per 1000 live births which is higher than the state
(72 per 1000 live births) and national (55 per 1000 live births) averages
(Government of India 2007). Infant mortality rate in the Gond tribe has
also been found to be higher than that for the tribal population in the
state as a whole estimated on the basis of the information available
through the 2001 population census.
Because of the small number of ever pregnant women covered in
the survey, it is not possible to estimate infant mortality rate for
different subgroups of the population. However, in order to get some
idea of differentials in infant mortality in the Gond tribe, we have based
the analysis on the basis of the proportion of children dead (CD) out of
total children ever born (CEB). It is well known that it is possible to
estimate the infant mortality rate from the proportion of children dead
if the information is available by the age of the mother.
Table 1 summarises the variation in the proportion of children ever
born dead at the time of the survey (CD/CEB) by six independent
variables used for the analysis. This variation is discussed at some
length below.
Mother’s Education and Infant Mortality. The proportion of children
ever born dead has been found to be very high among illiterate mothers
(14.90 per cent). By contrast, the proportion of children ever born dead
has been found to be very low in mothers having at least primarily level
education (4.50 per cent).
Father’s Education and Infant mortality. Like the educational status of
mothers the proportion of children ever born dead has been found to be
very high in illiterate fathers (14.90 per cent) and decreases rapidly with
the increase in the educational status of the father.
Family Size and Infant Mortality. Interestingly, the proportion of
197

Child Survival and Health
children ever born dead has been found to be the highest (24.61 per
cent) in small families. This proportion has been found to decrease with
the increase in the size of the family.
Economic Status of Family and Infant Mortality. The proportion of
children ever born dead has been found to be the lowest (10.18 per cent)
in high income families but the highest in the low income families (14
per cent).
Occupation of the Father and Infant Mortality. The proportion of
children ever born dead has been found to be the highest in labourers
followed by farmers. This proportion has been found to be the least in
those families where the father was engaged in other or miscellaneous
occupational activities.
Mother’s Age at First Birth and Infant Mortality. The proportion of
children ever born dead has been found to decrease with the increase
in the age of the mother at the time of the first birth except in case of
mothers who had their first birth at least at the age of 25 years.
Fertility and Infant Mortality. The proportion of children ever born
dead has been found to be positively correlated with the number of
pregnancies (r = +0.437). This indicates towards a direct relationship
between fertility and infant mortality. On the other hand, it has also
been observed that fertility was very high in the families who had
experienced more than one infant deaths.
Status of women and infant mortality. In order to analyse the impact
of the participation of the woman in the family decision making process
on infant mortality, we used a seven point scale to measure the
participation in family decision making. The methodology suggested by
Guru (1997) was followed for the purpose. The women surveyed were
asked about their participation in deciding:
1. The desired number of children the family should have.
2. The care during pregnancy and at the time of delivery.
3. Child rearing and child feeding.
4. The treatment of the sick child.
5. The expenditure in the family.
6. The choice about family food.
7. Working outside the house.
For each variable the degree of participation was categorised as low,
moderate and high on the basis of the response given by the women.
The low category was given a score of 1; moderate, a score of 2 and
high, a score of 3. For each women, scores of all the seven variables
were combined. On the basis of this combined score, woman’s
198

Infant Mortality in Gond Tribes
participation index was calculated as follows:
Low participation (score 7-11),
Moderate participation (score 12-16), and
High participation (score 17-21).
The participation index was calculated for only 106 Gond women
who had completed their fertility at the time of the survey. The analysis
suggests that about 20 per cent of the women surveyed had a greater
say in the family decision making while about half of the women
surveyed enjoyed only a low level of autonomy in the family decision-
making. Rest of the women had a moderate level of autonomy in the
family. The analysis also suggests that women who enjoyed a high level
of participation in the family decision-making experienced relatively
low proportion of infant deaths (16.67 per cent). By contrast, the
proportion of infant deaths has been found to be the highest (30.56) in
women who had little participation in the family decision making. In
fact, even moderate level of participation in family decision making has
been found to have considerable effect on the proportion of children
ever born dead.
DiscussionIt is well known that infant mortality is directly related to the level of
socio-economic development. At the family level, this implies that the
poor is the living status of the family, the higher is the proportion of
infant deaths in the family. The analysis carried out in this paper
supports this hypothesis. The living condition of the Gond families
surveyed may be termed as deplorable, characterised by marked
poverty, lack of sanitation, poor housing, etc. A very high proportion
of infant deaths in Gond families amply reflects their poor living
condition. The analysis suggests that educating Gond women can lead
to a substantial reduction in the proportion of infant deaths and
improve child bearing as well as health of the entire family. Side by
side, the surroundings of a man and his occupation from which he
earns his livelihood play an important role in his health habit.
The theory of demographic transition which is based on the
experience of today’s low birth rate in the developed or industrialized
countries holds that the trends in birth rate and family size in a
population are determined by the trends of economic production (Misra
1982). It is apparent from the present investigation that the Gond
couples are motivated for keeping the level of fertility high order to
cope with the high level of infant mortality due to their low levels of
199

Child Survival and Health
living. It can, therefore, be inferred that to reduce infant mortality,
efforts should be made to improve the living status of these families by
raising their active participation in economic activities for better
employment. At the same time, there also appears to be the need for
educating Gond women so that they can participate more actively in the
family decision making.
ReferencesAdak DK, Bhattacharya BN, Ghosh R, Pal M, Bharati P, Vasulu TS
(2003) The tribes of Madhya Pradesh: A brief ethnographic note. In
DA Adak, BN Bhattacharya, R Ghosh, M Pal, P Bharti, TS Vasulu
(Eds) Demography and Health Profile of the Tribals. New Delhi, Anmol
Publications Pvt. Ltd.
Adak DK, Gharami AK, Chakraborty R, Mandal H (2004) Factors
affecting infant mortality among the Ladiya of Sagar District,
Madhya Pradesh. South Asian Anthropologist 4:13-19.
Basu SK (1989) Factors affecting fertility and mortality behaviour
among tribal population groups of Bastar district (Madhya
Pradesh). In B Jena, RN Pati (Eds) Health and Family Welfare Services
in India. New Delhi, Ashish Publishing House.
Gubhaju BK, Streatfield K, Majumder A (1992) Socio-economic,
demographic and environmental determinants of infant mortality
in Nepal. J. Biosocial Sciences 23:425-435.
Gupta RP (1998) Health facilities and health achievements in four most
backward states of India. Madhya Pradesh Journal of Social Sciences
3:44-63.
Guru SS (1997) Status of women and infant mortality among the Saora
of south Orissa. In G Preffer, DK Behera (Eds) Contemporary Society:
Tribal Studies. Vol I. New Delhi, Concept Publishing Company.
Kulkarni S, Kumar BS (1991) Socio-economic development and
population growth of various states of India: The experience of two
decades. The Journal of Family Welfare. XXXVII:44-51.
Misra BD (1982) The Study of Population. New Delhi, South Asian
Publishers Pvt. Ltd.
Pandey GD, Tiwary RS (2000) A study of vital rates in the primitive
tribes of Madhya Pradesh. In R Choubey, KN Sharma (Eds) Tribal
Health. Allahabad, K.K. Publications.
Sandhya S (1991) Socio-economic and Cultural Correlates of Infant
Mortality. New Delhi, Concept Publishing Company.
Government of India (2007) SRS Bulletin. Sample Registration System .
200

Infant Mortality in Gond Tribes
New Delhi, Registrar General and census Commissioner.
Sharma KKN (1999) The Khairwars. New Delhi, Northern Book Centre.
Talwar PP (1988) Infant mortality: Some evidences from rural Madhya
Pradesh. In AK Jain, P Visaria (Eds) Infant Mortality in India:
Differentials and Determinants. New Delhi, Sage Publications.
Table 1
Proportion of infant deaths by different family characteristics
S.N. Literacy level No. of
mothers
Live
births
Infant deaths
No. %
Mother’s education
1 Illiterate 308 1396 208 14.9
2 Primary 52 222 10 4.50
3 Middle and above 10 20 -- –
Father’s education
1 Illiterate 220 980 146 14.90
2 Primary school 64 282 26 9.22
3 Middle school 40 150 10 6.67
4 High school and above 16 56 2 3.57
Family size
1 Small (up to 3) 76 260 64 24.61
2 Medium (4-6) 216 882 126 14.28
3 Large (7and above) 78 496 28 5.64
Occupation of the Father
1 Labourer 236 1008 150 14.88
2 Farmer 100 476 54 11.34
3 Govt. Services 16 86 8 9.30
4 Miscellaneous 18 70 6 8.57
Mother’s age at first birth
1 <15 years 12 78 16 20.51
2 15-18 years 200 908 129 14.21
3 19-21 years 134 552 62 11.23
4 22-24 years 20 87 9 10.34
5 25 years and above 4 13 2 15.38
201

Child Survival and Health
Table 2
Mean number of pregnancies by number of infant deaths
Families with different
number of infant deaths
No. of families
(n=106)
Mean number of
pregnancies per
mother
0-1 69 5.26±0.65
2-3 24 7.31±0.74
4 and above 13 10.10±1.63
t-values :
0-1 vs 2-3= 2.09* (d.f.=91)
0-1 vs 4 and above= 2.76* (d.f.=80)
2-3 vs 4 and above= 1.56 (d.f.=35)
* Significant at .05 level of probability
Table 3
Mother’s degree of Participation proportion of infant deaths
Level of
autonomy
Total births Infant deaths
Number %
Low 216 66 30.56
Moderate 93 20 21.5
High 42 7 16.67
Total 351 93
202
Health Emergencies among Neonates in
Andhra Pradesh
Biranchi N. JenaAnuradha Dubey
IntroductionFive million annual neonatal deaths (98 per cent of the world total)
occur in developing countries. Worldwide 37 per cent of under-five
deaths are attributed to neo-natal causes. About 75 per cent of under
five deaths in India are infant deaths and about half of the under five
children die within four weeks of their birth i.e neonatal period
(UNICEF 2007). India accounts for 27 per cent of the global burden of
neonatal deaths every year (Deorari and Chellani 2007). According to
National Family Health Survey-3, the neonatal mortality rate of Andhra
Pradesh (40 per 1000 live births) was higher than the national average
(39 per 1000 live births) in 2005-06 (IIPS 2007). Neonatal mortality rate
in the state varied with the wealth index and level of education of the
mother. In the population with lowest wealth index, it was estimated to
be around 48 per 1000 thousand live births as against 22.0 per 1000
thousand live births in population with highest wealth index. Education
of the mother plays an important role in deciding the level of neonatal
mortality as the neonatal mortality rate was highest (46 per 1000 live
births) in neonates whose mother had no schooling compared to just 20
per 1000 live births in neonates whose mothers had at least 12 years of
schooling (IIPS 2007).
It has been observed in many research studies that prompt
recognition and management of complications of the new born can
reduce the neonatal mortality rate substantially. The reality, however,
is that better access to quality neonatal care remains a major issue in
India. The experience of the community-based maternal and neonatal
203

Child Survival and Health
care programme in Nepal is that even after counselling clients
regarding recognition of danger signs and promotion of the message
that a woman or newborn should seek care from a qualified service
provider immediately if a danger sign is observed, care-seeking for
emergencies actually increased only marginally. Such marginal changes
are because of many factors including financial, geographic and
cultural barriers (USAID 2007). Sometimes service seeking behaviour is
constrained because of the non availability of emergency transportation
with quality pre hospital care or due to lack of coordination and sharing
of responsibility among different service providers. It is therefore
important to have a good emergency transportation system to ensure
better care seeking behaviour in emergency situation pertaining to
neonatal complications.
One of the objectives of the National Population Policy (NPP) 2000
is the reduction in infant mortality rate to less than 30 per 1000 live
births by the year 2010. Given the high visibility of neonatal deaths and
lack of progress, preventing neonatal death remains a high priority for
the government. In view of this, an attempt has been made in this paper
to examine and understand the patterns of neonatal deaths in Andhra
Pradesh as exhibited by the reported neonatal emergencies through
Emergency Management and Research Institute (EMRI).
ObjectivesMain objectives of this study are:
• To find out major health emergencies among the neonates and the
underlying factors influencing these emergencies.
• To look into trends and patterns of neonatal deaths in Andhra
Pradesh.
• To estimate the prevalence of neonatal complications which require
emergency care including transport to definite care unit.
Data and MethodologyThe study is based on the neonatal emergencies reported to Emergency
Management and Research Institute (EMRI) from January 2007 to
December 2007. Total number of neonatal emergencies received by
EMRI during this period were 563. These emergencies have been
studied by using descriptive statistics. Apart from the data from EMRI,
information about neonatal mortality rate from sources like SRS, NFHS-
3 and WHO Statistics has also been analysed in the context of neonatal
complications which require emergency care including transport to an
204

Health Emergencies in Neonates
appropriate health care institution. In Andhra Pradesh, district wise
estimates of neonatal deaths are not available. The Directorate of
Economics and Statistics, Government of Andhra Pradesh has derived
district level estimates of neonatal deaths and neonatal emergencies on
the basis of district level estimates of infant mortality rate (Government
of Andhra Pradesh 2007). These estimates have been used in the present
analysis.
Analysis and DiscussionFive hundred sixty three cases of neonatal emergencies were reported
to EMRI in the year 2007. If we look at month wise distribution of
reported cases, it appears that cases reported to EMRI had increased
significantly from June 2007 onwards. The reason is that EMRI had
completed its operations in the whole state of Andhra Pradesh by
covering the entire rural segment. This trend in the reporting also
indicates towards a huge demand for emergency services pertaining to
neonatal complications. Only a small proportion of these cases (7 per
cent) were from the urban areas. The NFHS-3 has found that the
neonatal mortality rate in the rural areas of Andhra Pradesh is twice
that in urban areas. It may be inferred from this observation that the
prevalence of neonatal complications is significantly higher in rural
than in urban areas. This means that provision of emergency medical
care services in the rural areas of the state would result in an accelerated
reduction neonatal mortality rate.
Out of total cases report 61 per cent were males and 67 per cent
from Scheduled Castes, Scheduled Tribes and other backward classes.
It has been observed that the neonatal mortality rate is the highest
among Scheduled Castes, followed by Scheduled Tribes and other
backward classes.
Neonatal deaths decreased significantly with the increase in the
education of the mother. Although education of mother plays a
significant role in the neonatal mortality according to NFHS-3, yet
reporting of neonatal emergencies and seeking the health care through
emergency services has been found to be statistically insignificantly
related to female literacy rate. Even the level of awareness about the
availability of emergency services was not found to be statistically
significantly correlated to the reporting of the neonatal emergencies.
Globally, three major causes of neonatal deaths are: infections
(sepsis, pneumonia, diarrhoea, and tetanus (accounting for 36 per cent
of neonatal deaths), premature birth (28 per cent) and problems related
205
Child Survival and Health
to complications during childbirth (23 per cent) (Save the Children
Fund). Infections are the major cause of death after the first week of life.
In India also, a similar trend may be witnessed with 23 per cent of the
neonatal deaths arising due to birth asphyxia, 25 per cent due to
preterm births and 36 per cent due to severe infections while the rest
due to congenital abnormalities (4 per cent), neonatal tetanus (4 per
cent), diarrhoeal diseases (2 per cent) and other neonatal complications
(6 per cent) (WHO 2007). In the neonatal emergencies reported to EMRI,
the major causes of neonatal emergencies reported were acute
respiratory distress syndrome (ARDS)/shortness of breathing (SOB)
(60.9 per cent), unconscious (7.5 per cent) tetanus (4.6 per cent) and
convulsions (4.6 per cent). The neonatal emergencies reported to EMRI
indicate that majority of the emergencies were cases of birth asphyxia.
These emergencies and probable neonatal deaths could be avoided if
such complications would have been reported as pregnancy related
emergencies. Thus, it is important to educate the community to avail
emergency services for all pregnancy related complications, as 5-10 per
cent of all newborn need resuscitation at birth. Moreover, about 5 per
cent deaths were observed out of total emergencies related to
ARDS/SOB those were reported to EMRI. Majority of deaths occurred
at home before arrival of the ambulance.
If it is assumed that 5-10 per cent of the newborn require
resuscitation, then the entire coverage of emergency services for the risk
group of 75,000 to 1,50,000 pregnant women would ensure a significant
reduction in neonatal mortality rate in Andhra Pradesh because of birth
asphyxia. Though currently EMRI is handling 22% of the total
pregnancy cases in Andhra Pradesh, it is difficult to estimate the current
coverage of the maternal complication cases which pose risk for the
neonatal mortality through birth asphyxia. If it is assumed that EMRI
handles the same proportion for the risky segment of maternal
complication, it is estimated that EMRI handled 16500 to 33000
pregnancy cases in 2007 which required the resuscitation to the new
born. Again considering one third of the cases of non-institutional
delivery which are of high risk for birth asphyxia, EMRI intervention
has ensured proper medical management including resuscitation either
through quality pre hospital care and transporting to a suitable health
facility.
Apart from birth asphyxia, infections viz. sepsis, pneumonia,
diarrhoea etc. contribute significantly to the neonatal mortality.
Neonatal sepsis constituted nearly one third of the health problems in
206

Health Emergencies in Neonates
neonates and majority of them are early onset infections (Choudhury et
al 2007). This requires specific emergency management and medical
management unlike birth asphyxia. The prevention and curative
strategy for neonatal infections require clean childbirth, cord care,
hygienic baby care, skilled birth attendant, early identification of
complication and medical management through antibiotics. An effective
emergency management system would ensure the fulfilment of such
conditions to a great extent.
District wise neonatal deaths in Andhra Pradesh had been
estimated on the basis of district level infant mortality rate (IMR) and
the state level neonatal mortality rate by the following formula
i NMR = i A P A PIMR * (NMR / IMR ),
iwhere NMR = Neonatal mortality rate in i districtth
iIMR = Infant mortality rate in i districtth
APNMR = Neonatal mortality rate in whole Andhra Pradesh
APIMR = Infant mortality rate in whole Andhra Pradesh
The exercise indicates that neonatal mortality rate was high in
Mahabubnagar (51 per 1000 live births), Medak (46 per 1000 live births)
and Adilabad (45 per 1000 live births) districts but low in Hyderabad
(18) and West Godavari (25) districts.
The estimated neonatal death Rate out of the all emergencies
reported to EMRI was calculated by dividing the total deaths up to 48
hours of reporting of the emergency and served by EMRI by total
number of cases reported to EMRI. This death rate has been estimated
to be around 78 deaths per 1000 emergencies being reported. If the
urban and rural difference is taken into consideration, it is found that
the neonatal death rate in rural areas was 66 per 1000 neonatal
emergencies reported, where as this rate was as high as 234 per 1000
emergencies reported from urban areas. Such a difference may be due
to the wide variations in the onset of neonatal complications and
reporting of such cases to EMRI. However this difference in the
neonatal death rate in rural and urban areas requires further
investigation.
Based on the neonatal mortality rate of 40.3 deaths per 1000 live
births (IIPS 2007) and death rate of 78 per 1000 reported emergencies,
it may be inferred that 51 per cent of the live births in Andhra Pradesh
require emergency care services including emergency transport to the
appropriate health facility. The causes of the neonatal mortality suggest
that 48 per cent of neonatal deaths were due to pre-term births and birth
asphyxia which could have effectively been managed by ensuring cent
207

Child Survival and Health
per cent safe deliveries. It is important to note that 52 per cent of the
neonatal deaths are due to infections which could effectively be
managed through a good emergency response service system like
EMRI.
The paper also estimated total number of emergencies that would
occur after controlling causes like pre-term delivery and birth asphyxia.
The estimation was done in the following way
l eNEOEMIi= [NDi*(NMR /NMR )]*[1-0.48]
Where NEOEMIi = Estimated Neonatal Emergencies because of
Infections in i districtth
NDi = Total neonatal Deaths in i districtth
lNMR = Neonatal Mortality Rate per 1000 live births
eNMR = Neonatal Mortality Rate per 1000 neonatal
emergencies reported
Results of the exercise indicate that there were 1092 neonatal
emergencies which are occurring every day across Andhra Pradesh
because of infections only. In other words, the prevalence rate of
neonatal emergencies because of infections was 260 per 1000 live births.
District level estimates of neonatal emergencies per day which
require hospitalisation are shown in figure 1. The figure shows that per
day neonatal emergencies was high in Mehbub Nagar (62), Anantapur
(59), Kurnool (59) and East Godavari (54) districts as compared to
Nizamabad (33), Vizianagaram (33), Khammam (32) and Hyderabad
(29) districts. It was found that districts having high neonatal mortality
report high neonatal emergencies and vice versa.
It is obvious from the foregoing discussions that an early
identification of complications and good pre hospital care would reduce
the neonatal mortality rate to a significant extent. If neonates requiring
care are identified and referred to appropriate facility at appropriate
time, they can be effectively treated and it will be possible to achieve
substantial decline in the neonatal mortality rate (Government of India
no date). The effectiveness of facilitating access to the appropriate health
facility largely depends on the availability of quick and effective
transport system. Distance from health outlets and logistic difficulties
such as finding an intermediate or motorised vehicle for patient transfer
are linked with inhibited use of biomedical services (Ensor and Cooper
2004, Hodgkin 1996, Raghupathy 1996) and delayed health-seeking
behaviour both of which are factors implicated in reduced health
outcomes and increased morbidity and mortality in studies from
Vietnam (Ensor 2004) and Zimbabwe (Fawcus et al 1996).
208

Health Emergencies in Neonates
Neonates with a long duration of transport had 79 per cent higher
odds of death than those transported for a short duration after adjusting
the confounding effects. The study found that neonatal health
emergencies which took more than 90 minutes of transport had more
than two times higher risk of death than those who were transported in
less than 60 minutes while the risk was 80 per cent more in those
transported between 60 and 89 minutes. A study in Himachal Pradesh
estimated that government hospital was accessible at the travel distance
of less than an hour in 20 per cent cases, 1-2 hours in 49 per cent cases
and more than 2 hours in 19 per cent cases and transport were in the
form of bus or other motorised transport facility (Rintaro Mori et al
2006). The EMRI takes, on average, less than 45 minutes to transport a
neonatal emergency to a hospital to the hospital with pre-hospital care
in 40 per cent of cases, between 45-60 minutes in 28 per cent of the cases
and more than 60 minutes in rest of the 32 per cent cases. Obviously,
Figure 1
Estimated daily prevalence of neonatal emergencies
in districts of Andhra Pradesh, 2007
209

Child Survival and Health
EMRI contributes to a significant decline in the risk of death in neonates
who require emergency health care.
ConclusionsAlthough, neonatal mortality rate in Andhra Pradesh is 40 per 1000 live
births, yet reported neonatal emergencies are very low and are not
significantly correlated to awareness level of emergency services. There
exists a huge demand of neonatal emergency services in the rural areas.
The findings of our analysis suggest two critical areas to reduce
neonatal mortality rate. First, one of the major causes of neonatal
emergency - birth asphyxia - can be avoided if such cases were reported
as pregnancy related complications. There is a need to educate the
community to avail the emergency services for all pregnancy related
complications. Second, more than 1000 neonatal emergencies are
estimated to occur every day across Andhra Pradesh due to infections
which can be prevented and cured by early identification of
complications and good pre hospital care. Facilitating quick and
effective transport system is critical in this regard. EMRI ensures an
effective pre hospital care with quick and free transport facility.
ReferencesDeorari AK, Chellani M (2007) Clinico-epidemiological profile and
predictors of severe illness in young infants (<60 days) reporting to
a hospital in north India.
Ensor T (2004) Health Sector Reform in Asian Transition Countries: Study
on Social Sector Issues in Asian Transitional Economies. York,
University of York.
Ensor T, Cooper S (2004) Overcoming barriers to health service access:
influencing the demand side. Health Policy and Planning 19(2):69-79.
Fawcus S, Mbizvo M, Lindmark G, Nystrom L (1996) A community-
based investigation of avoidable factors for maternal mortality in
Zimbabwe. Studies in Family Planning 27: 319-327.
Government of Andhra Pradesh (2007) Districts at Glance. Hyderabad,
Directorate of Economics and Statistics.
Government of India (no date) Report on Child Health
w w w.planningcom m ission.gov.in . N ew D elhi, Planning
Commission.
Hodgkin D (1996) Use of antenatal services and delivery care among
women in rural western Kenya: a community based survey.
Reproductive Health 3:2.
210

Health Emergencies in Neonates
International Institute for Population Sciences (IIPS) and Macro
International (2007) National Family Health Survey (NFHS-3),
2005–06: India. Volume I. Mumbai, International Institute for
Population Sciences.
National Neonatalogy Forum ( ) Newborn Health in India. Newborn
care. NNF teaching Aids.
http://www.newbornwhocc.org/pdf/teaching-aids/newborn.pdf
Raghupathy S (1996) Education and the use of maternal health care in
Thailand. Social Science and Medicine 43:(4):459-471.
Rintaro Mori et al (2006) Duration of inter-facility neonatal transport
and neonatal mortality. Systematic review and cohort study.
Unpublished manuscript.
Save the Children Fund ( ) Emergency Health and Nutrition Training.
www.savethechildren.org.
United Nations Children’s Fund (2007) Progress for Children Report - A
Statistical Review . New York, United Nations Children’s Fund.
United States Agency for International Development (2007) Report on
Community-Based Maternal and Neonatal Care Program (CB-
MNC). www.jsi.com. Accessed on 21 November 2008.
World Health Organization (no date) Child Health Profile. www.who.int.
Accessed on 20 November 2008.
211

Child Survival and Health
Table 1
Estimated neonatal deaths in districts of Andhra Pradesh
District Live
births
Infant
deaths
Estimated Reported cases
NMR Neonatal
Deaths
Total Per cent
toneonatal
deathsAdilabad 54896 3508 50.8 2788 22 0.79
Anantapur 77942 4700 47.9 3736 28 0.75
Chittoor 70149 3255 36.9 2587 20 0.77
East Godavari 93736 4265 36.2 3390 33 0.97
Guntur 81451 3429 33.5 2726 42 1.54
Hyderabad 87427 2308 21 1835 16 0.87
Kadapa 53498 2712 40.3 2156 41 1.9
Karim Nagar 75298 3780 39.9 3005 10 0.33
Khammam 42413 2549 47.8 2026 13 0.64
Krishna 81763 2674 26 2125 11 0.52
Kurnool 79317 4624 46.3 3676 37 1.01
Mahabub Nagar 67759 4879 57.2 3878 34 0.88
Medak 56681 3690 51.7 2933 16 0.55
Nalgonda 55586 3496 50 2779 24 0.86
Nellore 57014 2725 38 2166 15 0.69
Nizamabad 41271 2608 50.8 2096 18 0.86
Prakasam 55942 2797 39.7 2223 29 1.3
Rangareddy 77748 3429 35.1 2725 20 0.73
Srikakulam 46860 2901 49.2 2306 29 1.26
Vishakapatnam 63725 3339 41.7 2654 28 1.05
Vizianagaram 43691 2608 47.5 2073 14 0.68
Warangal 66068 3429 41.3 2726 27 0.99
West Godavari 82744 3004 28.9 2387 36 1.51
Total 1512979 76709 32 60997 563 0.92
212

Health Emergencies in Neonates
Table 2
Neonatal mortality rate and cases requiring hospitalisation
District IMR Estimated Per day
hospitalised
NMR Total
neonatal deaths
Emergencies
requiring hospitalisation
Adilabad 64 45 2480 31172 85
Anantapur 60 43 3323 41764 114
Chittoor 46 33 2301 28924 79
East Godavari 46 32 3015 37898 104
Guntur 42 30 2424 30470 83
Hyderabad 26 19 1632 20509 56
Kadapa 51 36 1917 24099 66
Karim Nagar 50 35 2673 33589 92
Khammam 60 42 1802 22650 62
Krishna 33 23 1891 23761 65
Kurnool 58 41 3269 41089 113
Mahabub Nagar 72 51 3450 43354 119
Medak 65 46 2609 32789 90
Nalgonda 63 44 2472 31065 85
Nellore 48 34 1927 24214 66
Nizamabad 63 45 1844 23174 63
Prakasam 50 35 1978 24854 68
Rangareddy 44 31 2424 30470 83
Srikakulam 62 44 2051 25778 71
Vishakapatnam 52 37 2361 29670 81
Vizianagaram 60 42 1844 23174 63
Warangal 52 37 2424 30470 83
West Godavari 36 26 2124 26693 73
Total 57 40 60973 766320 2100
213

Child Survival and Health
Table 3
Requirements of neonatal emergency services
District Neonatal
deaths which
can be
managed
Emergencies
requiring
hospitalisation
Per day
Emergencies
Adilabad 1290 16209 44
Anantapur 1728 21717 59
Chittoor 1197 15040 41
East Godavari 1568 19707 54
Guntur 1261 15844 43
Hyderabad 849 10665 29
Kadapa 997 12531 34
Karim Nagar 1390 17466 48
Khammam 937 11778 32
Krishna 983 12356 34
Kurnool 1700 21366 59
Mahabub Nagar 1794 22544 62
Medak 1357 17050 47
Nalgonda 1285 16154 44
Nellore 1002 12591 34
Nizamabad 959 12051 33
Prakasam 1028 12924 35
Rangareddy 1261 15844 43
Srikakulam 1067 13405 37
Vishakapatnam 1228 15428 42
Vizianagaram 959 12051 33
Warangal 1261 15844 43
West Godavari 1104 13881 38
Total 31706 398487 1092
214

Clinical Study of Trauma
in Children
GP ShrivastavaRS Verma
Vinod YedalwarManish Kumar
IntroductionTrauma is leading cause of morbidity and mortality in paediatric
patients. Paediatric trauma is one of the major threats to the health and
well being of children. Factors influencing childhood injuries include
age, sex, behaviour of child and parents, cause of injury and
environment. Of these, age, sex and cause are the most important
factors affecting patterns of injuries.
Males below 15 years have higher injury and mortality rates than
females probably because of their more aggressive behaviour and
exposure to contact sports. Tragically, home environment is the next
most common scene of paediatric injury. About 36 per cent of injuries
occur in very environment that should be sheltering and nurturing
children. In India, children less than 15 years of age comprise about 40
per cent of the total population; they constitute a high risk group as far
as trauma is concerned. It has been reported that 50 per cent of all
deaths occurring in developing countries like India is contributed by 0-
14 years age group.
The morbidity and mortality in paediatric and adolescent age
groups are also indicators of the health of the population like the infant
mortality rate. It is, therefore, important that preventive and
rehabilitation measures are taken at different tiers of health care in the
management of trauma and other diseases in paediatric patients.
The present paper reports the findings of a study about the socio-
epidemiology of trauma in paediatric patients aged 0-14 years who
were admitted in surgical wards of Sanjay Gandhi Memorial Hospital,
215

Child Survival and Health
Rewa, Madhya Pradesh during the period August 2006 through July
2007. Patients were admitted to surgical wards from either the Out
Patient Department or casualty or they were transferred from other
wards. On admission, a detailed history including time, date, place,
cause, mode of injury and whether first aid was received or not were
obtained from either the patient or from the person accompanying the
patient. In addition, information about the age, sex, religion, date and
time of admission, date of discharge/referral/death were also collected
in addition to eliciting the history of symptoms specific to any organ
system injured. Based on this information, a provisional diagnosis was
made and resuscitation was started. An intra-veins access was secured
and appropriate antibiotics and analgesics were administered.
Subsequently, a thorough assessment of the general condition of the
child and the status of injuries was carried out and appropriate
management was instituted. Every attempt was made to stabilise the
vitals of the child – airway, breathing and circulation.
The study focussed on the following aspects of socio-epidemiology
of trauma in children:
• To find out the incidence of traumatic lesions in the paediatric age
group.
• To find out age and sex distribution of various traumatic lesions in
paediatric patients.
• To find out the most common causes of trauma in paediatric
patients.
• To find out the morbidity and mortality in paediatric patients with
traumatic lesions.
Review of LiteratureA World Health Organisation advisory group in 1956 defined accident
as an “unpremeditated event resulting in a recognisable damage”
(WHO 1957). Traumatic lesions are main causes of morbidity and
mortality in childhood and adolescence accounting for 37-68 per cent
deaths in boys and 25-43 per cent deaths in girls.
Sharma and others (1981) found a gradually increasing trend with
age in the incidence of trauma in children. The prevalence of trauma
was found to be 7.5 per cent in the age group 0-4 years which increased
to 15.9 per cent in children 5-14 years of age. Across the entire paediatric
age group, trauma constituted about 22.5 per cent of the reported
morbidity. Most common causes of trauma in children were fall, vehicle
accidents and burns in that order.
216

Trauma in Children
Traumatic injuries continue to be the leading cause of death in
children (Bamaniya 2005, Theissen and Woolridge 2006). Major causes
of childhood morbidity and mortality are:
1) Head Injury. It is one of the most common causes paediatric
trauma for attending emergency and account for half of the patients
below 15 years of age. It includes fractures, intra cranial haemorrhages,
contusions, lacerations, etc. Among children, CNS is the most
commonly injured isolated system. Because CNS is the leading cause of
death among injured children, it is the principal determinant of the
outcome. However, numerous observations have shown that children
recover more frequently and fully than similarly injured adults. In
children younger than 2 years, physical abuse is the most common
cause of serious head injury whereas, in children aged 3 years and
older, fall and road accidents are responsible for most traumatic brain
injuries.
2) Thoracic Injury. It is the second leading cause of death in
paediatric trauma. The chest wall is very compliant in children.
Therefore, significant intra-thoracic injuries can occur without fracture
of ribs or significant external injuries. Aspiration of gastric contents is
very common following paediatric trauma and the resultant
pneumonitis contributes markedly to any chest injury.
3) Abdomino-pelvic Injuries. Following the head and extremities, the
abdomen is the third most commonly injured anatomical region in
children. It can be associated with significant morbidity and may have
mortality rate as high as 8.5 per cent. Children with abdominal trauma
secondary to assault or abuse have the highest mortality rate out of all
causes of abdominal trauma.
4) Burns. Burns are the third leading cause of mortality in patients
younger than 5 years. Overall morbidity from thermal injury has
decreased markedly in the recent years, with an aggressive
multidisciplinary approach of the care. Approximately 90 per cent of
the burn injuries are caused by household accidents or child abuse. In
children below 3 years of age, scalds are responsible for most of the
burns while in children aged at least 3 years, flame burns have been
found to be more common.
5) Child Abuse. It includes physical abuse, sexual abuse, emotional
abuse and child neglect. Child abuse involves children of all ages
crossing all socioeconomic boundaries, although poverty, a young
single parent, and substance abuse, are the major risk factors. Most of
the abused children are younger than 3 years with one third being
217

Child Survival and Health
younger than 6 months. One of the unique varieties of paediatric
trauma is battered baby syndrome.
Advanced trauma and life support system (ATLS)The advanced trauma and life support system, essentially, comprises of
four steps:
Step 1 Consists of focused primary survey aimed at rapidly
assessing the airway, breathing, and circulation (ABCs). In
addition, abbreviated neurological assessment (D) and
completely exposing (E) the child to thoroughly search for
injuries is also done.
Step 2 Consists of resuscitation in which an intra-veins line is
secured and appropriate crystalloids or colloids or blood is
given.
Step 3 Consists of a secondary survey, which consist of a head to
toe physical examination to identify all traumatic injuries.
Step 4: consist of definitive management of the patient.
ObservationsDuring the period under reference, a total of 6073 patients were
admitted in the surgical wards of the Sanjay Gandhi Memorial Hospital
Rewa. Out of these 6073 patients, 993 or about 16.35 per cent patients
were paediatric patients - patients below 15 years of age and 367
paediatric patients were related to paediatric trauma. This amounts to
almost 37 per cent of the paediatric patients and about 6 per cent of the
total patients admitted in the surgical wards of the hospital.
The age wise distribution of the paediatric patients with trauma
admitted to the hospital suggests that maximum paediatric trauma
patients were in the age group 1-4 years closely followed by patients in
the age group 5-9 years. There appears to be a substantial decrease in
the incidence of paediatric trauma in the age group 10-14 years. The
most common cause of paediatric trauma is the fall from a height which
was found to be the reason behind trauma in about 42 per cent of the
paediatric trauma patients admitted in the hospital followed by road
traffic accidents (RTA). Fall and RTA accounted for more than 70 per
cent of the paediatric trauma patients. On the other hand, during
infancy, burn injuries appear to be a major cause of trauma.
Nearly two-third of the paediatric trauma patients admitted in the
hospital were male while only around 33 per cent were females. It
appears that male children are more prone to trauma (63 per cent) as
218

Trauma in Children
compared to their female counterpart (36 per cent), although use of
hospital services has often been found to be sex selective, especially in
case of children. Female children appear to have a higher risk of
sustaining burn injuries (59 per cent) as compared to male children (41
per cent). By contrast, male children appear to have higher risk of
trauma from fall, assault and RTA.
The overall fatality among paediatric patients with trauma admitted
in the hospital was approximately 14 per cent. Fatality was the highest
in infants - children below one year of age (70.6 per cent) followed by
children aged 10-15 years (17 per cent). Interestingly, fatality from
trauma was comparatively low in the age group 1-10 years. Fatality
increased with the increase in the time between sustaining trauma and
admission in the hospital. The prevalence was the least in children aged
1-10 years. In paediatric patients admitted in the hospital within 6 hours
of sustaining trauma, the fatality rate was estimated to be around 13 per
Figure 1
Distribution of paediatric trauma cases by age
and type of trauma
219

Child Survival and Health
cent which increased to around 16 per cent in paediatric trauma patients
who were admitted in the hospital after sustaining trauma more than
6 hours ago. Moreover, fatality was found to be higher in female
paediatric patients as compared to female paediatric patients.
ConclusionsThis study has shown that, even though the incidence of paediatric
trauma has remained stable in this part of India, there has been an
increase in the number of RTA and injuries due to mechanical and
electrical gadgets. Due to better transport facilities more number of
children now receives definitive treatment early. This however has not
translated into a significant decrease in morbidity and mortality rates.
This is because management of paediatric trauma is a specialised job
and requires a paediatric surgeon and a paediatric anesthetic among
others. Establishment of Paediatric Trauma Care Centres at all nodal or
Figure 2
Distribution of trauma cases by sex
and type of trauma
220

Trauma in Children
tertiary centre is a must for proper treatment of paediatric trauma
victims.
Trauma in children dramatically affects the economy because of the
expenses for medical care, rehabilitation and costs related to the
inability of children to function independently in society. Therefore,
injury prevention should be the priority for everyone.
ReferencesBamaniya R (2005) A Clinical Study of Surgical Problems of Children.
Unpublished MS Thesis. APS University, Rewa.
Theissen ML, Woolridge DP (2006) Pediatric minor closed head injury.
Pediatric Clinics of North America 53:1-26.
Sharma AK, Rao PLNG, Yadav K,Mitra SK, Pathak IC (1981) Blunt
abdominal trauma in children. Indian Journal of Surgery 43:204-209.
World Health Organisation (1957) Report of WHO Advisory Group on
Accident in Children. Geneva, World Health organisation. Technical
Report Series No. 118
221

Child Survival and Health
Table 1
Age distribution of causes of paediatric injury
Age Group Fall RTA Assault Burns Others Total
0-1 6 1 0 8 2 17
1-5 56 35 5 25 6 127
5-10 54 46 5 10 8 123
10-15 40 24 9 21 6 100
Table 2
Sex wise distribution of paediatric trauma patients
Cause of Injury Male Female
Fall 106 53
RTA 73 32
Assault 16 2
Burns 25 36
Others 13 11
Total 233
(63.48%)
134
(36.52%)
Table 3
Mortality rates in different age groups
Age group
(Years)
Total patients Total deaths Proportion of
deaths
(Per cent)
0-1 17 12 70.60
1-5 127 14 11.02
5-10 123 8 6.50
10-15 100 17 17.00
Total 367 51 13.89
222

Nutritional Status of Women in
Madhya Pradesh
Nalin Singh NegiAdil Hussain Khan
IntroductionIn this paper, we analyse the nutritional status of women in Madhya
Pradesh as measured through anaemia and body mass index (BMI).
There exists a two way relationship between the nutritional status of
women and their health status. The poor health status of women
resulting from a host of social, cultural, economic, environmental and
services delivery factors aggravates the problem of under nutrition as
reflected through high prevalence of anaemia and low body mass index
in women. In turn, poor nutritional status of women contributes to poor
health status of women as reflected through high morbidity and
mortality. Adequate nutrition influences women’s ability to cope with
diseases and rigours of everyday life.
Both nutrition and health status of women are intrinsically linked
to their status in the society. Research on women’s status has found that
contributions women make to families are often overlooked and,
instead, they are viewed as economic burdens. There is a strong son
preference in the society, as sons are expected to care for parents as they
age. This son preference, along with high dowry costs for daughters,
sometimes results in the mistreatment of daughters. Further, women
have low levels of education and formal labour force participation. This
situation typically leads to little autonomy for women. They first live
under the control of first their father, then their husband, and finally
their sons (Chatterjee 1990, Desai 1994, Horowitz and Kishwar 1985).
All these factors exert a negative impact on the level of health and
223

Child Survival and Health
nutrition of women. There are several studies that conclude that one of
the reasons for the poor health and nutritional status of Indian women
is the discriminatory treatment girls and women receive compared to
boys and men in the family and the society (Das Gupta 1994, Desai
1994). Anaemia in women is a serious concern as it can result in
abortions, low birth weight babies, poor immune system, pregnancy
complications and make women vulnerable towards various diseases.
According to NFHS-3 (2005-06) less than 45 per cent pregnant women
in the state received ante-natal care, 36 per cent had institutional
deliveries while around 61 per cent children below 3 years and 47.6 per
cent ever married women suffered from anaemia. Anaemia is a major
outcome of malnutrition among women in Madhya Pradesh.
Methods and MaterialsThe analysis presented here is based on the information available
through the National Family Health Survey 2005-06 which covered 6427
women across Madhya Pradesh. The paper uses body mass index (BMI)
and anaemia as key indicators of women’s nutritional health. The body
mass index (BMI) is a widely used indicator of nutritional status. It is
defined as the weight in kilograms divided by the height in metres
squared (kg/m ). According to WHO, a cut-off point of 18.5 is used to2
define thinness or acute underweight and a BMI of 25 or above indicates
overweight or obesity. A BMI ranging between 18.5 to 24.9 refers to
normal weight. The sample for analysis of BMI excludes women who
were pregnant at the time of the survey and women who gave birth
during the two months preceding the survey, as estimation of
anthropometric indices for measuring BMI will be over estimated.
Therefore for BMI analysis is based on 5906 women.
Anaemia in women, on the other hand, is calculated by dividing
weight of haemoglobin by per decilitre of blood. According to WHO,
anaemic women are identified and appropriate adjustments were made
for respondents living at altitudes above 1000 metres and respondents
who smoke, since both of these groups require more haemoglobin in
their blood. Three levels of anaemia are distinguished: mild anaemia
(10-10.9 grams/decilitre for pregnant women, 10.0-11.9 g/dl for non
pregnant women), moderate anaemia (7.0-9.9 g/dl) and severe anaemia
(less than 7.0 g/dl). However, for further analysis, women surveyed
were classified into categories - anaemic and non-anaemic. Irrespective
of BMI, for assessing anaemia in women, all the women were included
in the analysis.
224

Nutritional Status of Women
In order to assess the effect of a number of social, economic and
demographic factors on anaemia, logistic regression has been applied.
The dependent variable used in the analysis was whether the women
surveyed were anaemic or not. If the woman was anaemic at the time
of the survey, a value of 0 was given. If the woman was not anaemic, a
value of 1 was given. On the other hand, BMI has three categories -
underweight, normal and overweight. As such instead of logistic
regression, multinomial regression analysis has been carried out.
Predictors of Anaemia and BMI. A number of variables are considered
to represent dimensions of socio-economic and demographic
characteristics of women. Taking into account theoretical considerations
as well as results from a series of exploratory models, independent
variables considered in the analysis included: women’s present age (15-
24/24-34/35-49), total children ever born (0/1-2/3 and above), caste
(general/SC or ST/ OBC), religion (Hindu/non-Hindu), residential
s t a t u s ( r u r a l / u r b a n ) , e d u c a t i o n o f w o m a n ( n o
education/primary/secondary/higher), marital status (currently
married/never or ever married), standard of living index
(low/medium/high), occupation of woman (not working/non
agriculture/agriculture), mass media exposure (no/yes), decision on
health (alone/others), fuel used for cooking (smokeless fuel/smoke
producing fuel), and violence faced (yes/no).
Findings and discussionsBackground Characteristics of Women in Madhya Pradesh. Table 1 gives
details about basic characteristics of women included in the analysis.
About 28 per cent of women did not have any child whereas about 29
per cent had 1-2 children. About one third of the women belonged to
either Scheduled Castes or Scheduled Tribes. Most of the women
surveyed were Hindus; 48 per cent belonged to rural areas and 40 per
cent were illiterate while 77 per cent were currently married. Half of the
women surveyed belonged to families with high standards of living
while 53 per cent were not working anywhere whereas 22 per cent
women are working in agricultural sector. Three fourth of the women
had exposure to mass media. However, three fourth women reported
that they did not take decisions regarding their health at their own.
More than half of the women reported that they used fuel which
produced smoke which was harmful for their health. Domestic violence
was not found to be a serious problem in the surveyed women as 75 per
cent of them reported that did not face any kind of violence.
225

Child Survival and Health
Prevalence of Anaemia and BMI . Overall 55 per cent women aged 15-
49 years surveyed were found to be anaemic (Table 2). The prevalence
of anaemia was found to be the highest in the age group 35-49 years and
in women having at least 2 children. The prevalence of anaemia has also
been found to be comparatively high in Scheduled Castes, Scheduled
Tribes and other backward class women as compared to women from
upper castes. Similarly, prevalence of anaemia has been found to be
higher in Hindu women compared to women of other religions and in
women from rural areas as compared to their urban counterparts. The
prevalence of anaemia has been found to be inversely related to the
level of education and the standard of living index while non-working
women were found to be less anaemic than working women and
woman working in the agricultural sector. Factors like marital status,
exposure to mass media and autonomy in decision making were found
to have little impact on the prevalence of anaemia. Finally, prevalence
of anaemia was found to be significantly higher among women with
BMI <18.5 (kg/m ) as compared to women with BMI>18.5 (kg/m ).2 2
The BMI among the women surveyed suggests that chronic energy
deficiency was more in younger women (less than 25 years of age) than
in older women. Similarly, chronic energy deficiency was more in
Scheduled Castes and Scheduled Tribes women than in women
belonging to other backward classes and upper castes. In the rural areas
of the state, about 37 per cent women were having a BMI<18.5
compared to only 28 per cent in the urban areas which suggests that
chronic energy deficiency is higher in the rural areas. Like anaemia,
BMI has also been found to vary inversely with the level of education
and standard of living. Women having exposure to mass media had a
higher BMI as compared to women not exposed to mass media. On the
other hand, work status of women and the fuel used for cooking had an
impact on BMI.
Factors Determining Nutrition Status of Women. Logistic regression
was applied to explore statistically significant determinants of anaemia
in women whereas multinomial regression analysis was carried out to
find out the determinants of BMI in the surveyed women. The
regression coefficients were converted into percentages in the multiple
classification analysis. The results are given in table 3. For this purpose
anaemia has been categorized as 0 (not anaemic) and 1 (anaemic).
Significant factors of anaemia in women have been found to be the age,
caste, place of residence, exposure to mass media, children ever born
and BMI. Women in the age group 25-34 are 21 per cent more likely to
226

Nutritional Status of Women
be anaemic compared to women aged 15-24 years. Women having 1-2
children were found to be 24 per cent less likely to have anaemia
compared to women with zero parity. On the other hand, Scheduled
Castes/Tribes women were found to be 37 per cent more likely to be
anaemic compared to women from upper castes. Women who did not
have exposure to mass media were 1.2 times more likely to be anaemic
as compared to exposed to mass media exposure. The odds of being
anaemic were found to be higher in women working in the agricultural
as compared to non-working women. Women who used fuel which did
not produce smoke were 2 per cent less likely to be anaemic.
Across different age group, there are similar proportion of women
with low BMI but 18 per cent women in the age group 35-49 were obese.
About 34 per cent SC/ST women were having a low BMI whereas this
proportion for general women was only 27 per cent. Women of other
religions are more underweight and obese than Hindu women. Women
with low BMI are found to be more in rural area and obese women are
found to be in urban areas. As education and SLI is increasing women
are found to be more obese. Women working in agricultural sector are
thinner than non working women and working in non-agricultural
sector. Decision on their own about their own health and violence has
no impact on BMI.
ConclusionsDrudgery and workload is associated with women from their very
childhood. Apart from the routine work, women hardly get any time for
personal development. As both anaemia and BMI reflect the nutritional
status of women therefore it can be said that nutritional status is poor
among women of Madhya Pradesh. The substantial variation in the
nutritional status of women in Madhya Pradesh appears to be due to
differences in age, caste, mass media exposure and children ever born.
There is a need to appraise rural women, especially those with many
children about the importance of health. The social, economic and
cultural dimensions embedded within the Indian social system may in
turn govern the health-seeking behaviour.
The present analysis reveals that the health and nutritional status
of women in Madhya Pradesh is largely shaped by socio-economic and
demographic factors, either at the individual or at the household level.
Health and nutrition interventions should therefore be made according
to the culture of the population. Educated women are better placed to
break away from the tradition to utilise modern means of safeguarding
227

Child Survival and Health
their own health and health of their children and are better able to
utilise what is available in the community. As health programmes are
the source of strength to all other schemes of social and economic
development, effective measures need to be initiated to improve health
performance in Madhya Pradesh. There is a need of formulating
policies and programmes on the basis of realistic estimates and
parameters and more meaningfully in a decentralised manner.
Identification of regions and broad cultural groups within each region
on the basis of their performance in health programme should be
initiated.
In conclusion, it is observed that the number and types of variables
and their extent of influence on health across different cultural and
regional groups vary significantly. In spite of so many years of planned
development for the upliftment of women, the status of women in
Madhya Pradesh has not changed significantly. Issues related to
women’s health and nutrition, particularly in the backward states like
Madhya Pradesh where access to basic health facilities is still poor need
to be addressed. Partnership with communities and non-government
organisations as well as committed private enterprises could be
fruitfully engaged but public expenditure would continue to play a
leading role. The challenge before policy makers is to develop
institutions that can offer cost effective solutions to problems of access
and availability of health and nutrition facilities.
ReferencesAlambusha R(2001) http://www.popline.org/docs/1464/169137.html.
Accessed on 20 December, 2008th
Census 2001 http://cyberjournalist.org.in/census/censex0.html.
Accessed on 24 December, 2008)th
Census 1991 http://cyberjournalist.org.in/census/censex0.html.
Accessed on 24 December, 2008th
Chatterjee M (1990) Indian women: Their health and economic
productivity. Washington DC, World Bank, World Bank Discussion
Paper.
Das Gupta M (1994) Fertility decline and gender differentials in
mortality in India. Paper presented at the International Symposium
on Issues Related to Sex Preference for Children in the Rapidly Changing
Demographic Dynamics of Asia, Seoul.
Desai S (1994) Gender Inequalities and Demographic Behaviour. India, New
228

Nutritional Status of Women
York.
International Institute for Population Sciences (2008) District Level
Household and Facility Survey. District Fact Sheet: Madhya Pradesh.
Mumbai, International Institute for Population Sciences.
Horowitz B, Kishwar M (1985) Family life - The unequal deal. In Madhu
Kishwar and Ruth Vanita (eds) In Search of Answers: Indian Women’s
Voices from Manushi. London.
Government of India (2007) Sample Registration System Statistical Report
2006. New Delhi, Registrar General. Report No. 4.
International Institute for Population Sciences and Macro International,
(2007) National Family Health Survey (NFHS-3), 2005-2006: India:
Volume I. Mumbai, International Institute for Population Sciences.
Rajan SI, James KS (2004) Demographic Change Health Inequality and
Human Development in India. Hyderabad, Centre for Economic and
Social Studies.
Government of India (2006) Maternal Mortality in India 2001-03. New
Delhi, Registrar General.
World Health Organisation (1996) Revised 1990 Estimates of Maternal
Mortality: A New Approach by WHO and UNICEF. Geneva, World
Health Organisation.
229

Child Survival and Health
Table 1
Percentage distribution of women according to different background
characteristics. Madhya Pradesh, 2005-2006
Background
characteristics
% Background
characteristics
%
Age of Women Standard of Living
15-24 36.1 Low 21.9
25-34 30.9 Medium 27.3
35-49 32.9 High 50.3
Total Children Ever Born Occupation
0 27.4 Not working 52.7
1-2 29.1 Non-agriculture 24.9
3 and above 43.5 Agriculture 22.4
Caste Mass Media Exposure
General 28.3 No 24.6
SC/ST 33.6 Yes 75.4
OBC 38.1 Decision on health
Religion Respondent alone 24.4
Hindu 87.6 Others 75.6
Non-Hindu 12.4 Fuel used for cooking
Place of Residence Smoke less fuel 44.6
Rural 47.5 Smoke producing fuel 55.4
Urban 52.5 Violence
Education No violence 75
No education 39.5 Faced violence 25
Primary 15.5 Body Mass Index
Secondary 34 <18.5 34.5
Higher 11 18.5-24.9 57.3
Current Marital Status >25 8.2
Currently married 76 Anaemia
Not currently married 23.4 Anaemic 51.1
Not anaemic 48.9
230

Nutritional Status of Women
Table 2
Percentages of anaemic women and BMI according to various
background characteristics. Madhya Pradesh, 2005-2006.
Background
Characteristics
Per cent
Anaemic
Body Mass Index (N=4268)
(N=6427) <18.5 18.5-24.9 >25
Age of Women
15-24 55.4 37.9 58.9 3.3
25-34 55.3 34.3 59.4 6.3
35-49 57.2 30.9 53.9 15.2
Total Children Ever Born
0 49.8 37.4 58.4 4.2
1-2 57.5 32.6 56.6 10.8
3 and above 58.5 33.8 57.1 9.1
Caste
General 46.3 23.2 58.1 18.7
SC/ST 66.2 39.1 56.8 4.1
OBC 51.1 36.1 57.4 6.5
Religion
Hindu 57.2 34.9 58.1 7.0
Non-Hindu 44.6 30.8 49.8 19.4
Place of Residence
Rural 59.6 37.0 59.5 3.5
Urban 46.9 28.1 51.8 20.1
Education
No education 61.0 37.1 58.0 4.9
Primary 56.7 35.9 55.8 8.4
Secondary 49.9 32.0 57.5 10.5
Higher 37.8 18.7 55.5 25.8
Current Marital Status
Currently married 57.9 33.2 57.5 9.3
Never/formerly
married
49.0 38.6 56.8 4.6
Standard of Living
Low 61.8 40.8 56.8 2.5
Medium 59.1 38.5 57.6 3.8
High 47.9 24.8 57.6 17.6
231

Child Survival and Health
Background
Characteristics
Per cent
Anaemic
Body Mass Index (N=4268)
(N=6427) <18.5 18.5-24.9 >25
Occupation
Not working 51.9 31.4 55.7 12.9
Non-agriculture 57.2 35.5 57.5 7.0
Agriculture 60.8 37.9 59.4 2.7
Mass Media Exposure
No 62.8 39.2 57.9 2.9
Yes 52.1 31.8 57.0 11.2
Decision on health
Respondent alone 57.6 29.7 57.1 13.2
Others 58.0 34.1 57.6 8.2
Fuel used for cooking
Smokeless 46.0 22.3 54.0 23.7
Smoke producing 58.5 37.6 58.2 4.2
Violence
No violence 54.2 34.4 56.4 9.2
Faced violence 60.6 34.7 59.7 5.6
Body Mass Index
<18.5 59.5 - - -
18.5-24.9 56.2 - - -
>25 39.4 - - -
Total 56.0 34.5 57.3 8.2
232

Nutritional Status of Women
Table 3
Factors determining prevalence of anaemia among women, Madhya
Pradesh, NFHS-3 (2005-2006)
Background
characteristics
Odds
Ratio
Background
characteristics
Odds
Ratio
Age of Women Standard of Living
15-24 ® 1 Low ® 1
25-34 ** 1.21 Medium 1.02
35-49 1.05 High 1.16
Total Children Ever Born Occupation
0 ® 1 Not working ® 1
1-2 ** 0.76 Non-agriculture 1.14
3 and above 0.83 Agriculture 1.07
Caste Mass Media Exposure
General ® 1 No ® 1
SC/ST * 1.37 Yes * 1.24
OBC * 1.13 Decision on health
Religion Respondent alone ® 1
Hindu ® 1 Others 0.93
Non-Hindu 0.99 Fuel used for cooking
Place of Residence Smoke less fuel ® 1
Rural ® 1 Smoke producing fuel 1.02
Urban *** 1.22 Violence
Education No violence ® 1
No education ® 1 Faced violence 0.94
Primary 0.87 Body Mass Index
Secondary 1.05 <18.5 (CED) ® 1
Higher 1.27 18.5-24.9 (Normal)* 1.24
Current Marital Status >25 (Overweight)* 1.75
Currently married ® 1
Not currently married 1.22
***p<0.01 **p<0.05 *p<0.10; ®= Reference category
233

Child Survival and Health
Table 4
Multinomial logistic regression of BMI according to various
background characteristics. Madhya Pradesh, NFHS 2005-2006
Background
Characteristics
Energy
deficiency
Normal Overweight
Age of Women
15-24 33.5 63.1 3.4
25-34 31.9 61.9 6.2
35-49 27.4 53.9 18.8
Total Children Ever Born
0 29.7 61.9 8.4
1-2 33.9 59.0 7.2
3 and above 31.3 61.3 7.4
Caste
General 27.4 63.5 9.1
SC/ST 34.1 58.6 7.2
Other Backward Caste 32.5 60.5 6.9
Religion
Hindu 31.0 61.8 7.2
Non-Hindu 35.5 53.6 10.9
Place of Residence
Rural 33.0 62.0 5.0
Urban 30.0 59.1 10.9
Education
No education 32.4 61.3 6.4
Primary 33.5 58.5 8.0
Secondary 29.5 61.6 8.8
Higher 31.5 58.8 9.6
Standard of Living
Low 39.4 56.1 4.5
Medium 36.4 59.2 4.5
High 25.9 62.0 12.1
Occupation
Not working 30.8 59.4 9.8
Non-agriculture 32.2 61.0 6.8
Agriculture 32.1 63.2 4.7
Mass Media Exposure
No 31.8 60.3
Yes 30.7 62.4
234
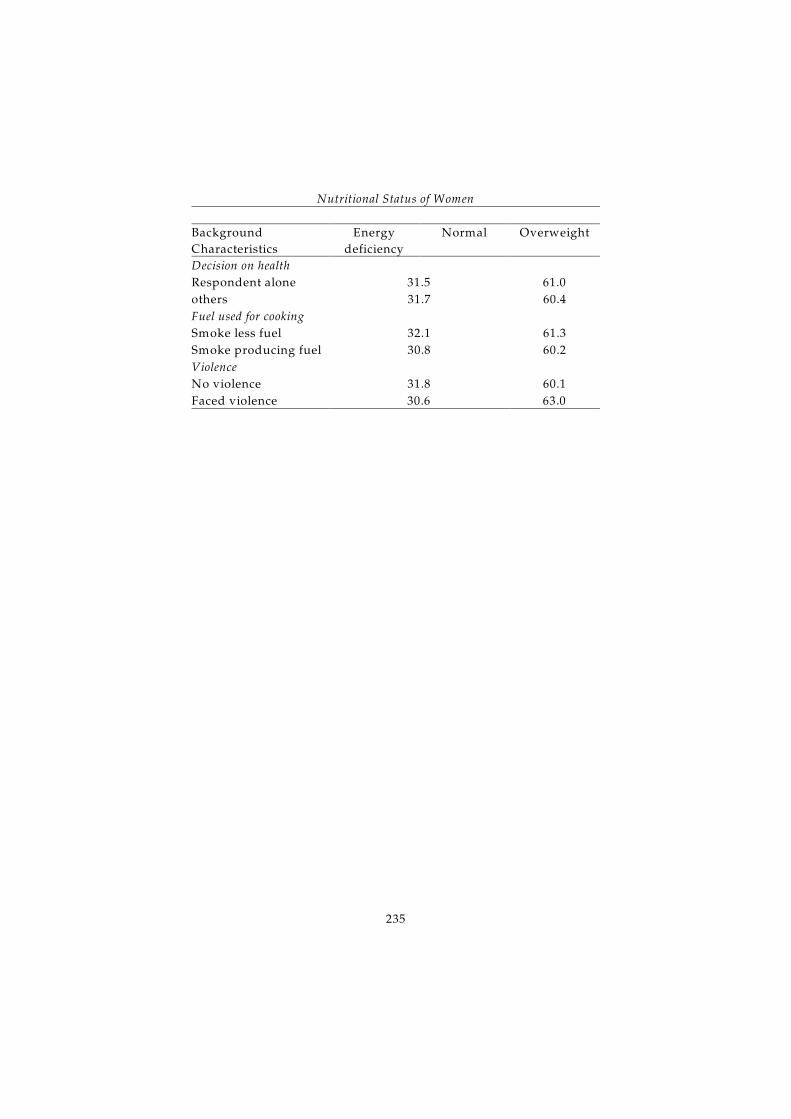
Nutritional Status of Women
Background
Characteristics
Energy
deficiency
Normal Overweight
Decision on health
Respondent alone 31.5 61.0
others 31.7 60.4
Fuel used for cooking
Smoke less fuel 32.1 61.3
Smoke producing fuel 30.8 60.2
Violence
No violence 31.8 60.1
Faced violence 30.6 63.0
235

Child Survival and Health
236

Nutritional Status in Madhya Pradesh
Evidence from NFHS-2 and NFHS-3
A K TiwariRavindra KS S Sharma
IntroductionIndia is home to the largest number of severely malnourished people in
the world. The malnourished people in India are located in urban, but
more so in rural areas where income and food security is low. Around
26 per cent of the Indian population is below poverty line while 70 per
cent live in rural areas.
Life expectancy at birth is higher in women than in men in most of
the developed countries and in some of the developing countries. In
India, however, women and men have nearly the same life expectancy
at birth. The fact that the typical female benefit in the life expectancy is
not seen in India suggests there are systematic problems with women’s
health. Indian women have high mortality rates, particularly during
childhood and during their reproductive years. The poor nutritional
status of women has repercussions not only for them but also for their
families.
Nutritional status refers to the health condition of an individual as
it is identified by nutrients’ intake and their utilisation. A person can be
classified as normal or malnourished on the basis of his or her
nutritional status. Malnutrition can further be characterised into under
nutrition, specific nutrient deficiency, over nutrition, and nutritional
imbalance (Jelliffe, 1966).
Anthropometric measurements provide an indirect assessment of
body composition and nutritional status. Rao (1980) has shown that
among anthropometric measurements, height and weight are the most
237

Child Survival and Health
important indicators of nutritional status. Arokiasamy (1997) argues
that weight-for-age is a measure of current nutritional status, while
height-for-age is a measure of chronic nutritional status. The Body Mass
Index (BMI) is widely regarded as a good measure of nutritional status
of an individual. It can be used to measure both thinness and obesity.
Mohanty and others (1992) have mentioned that BMI is a good indicator
of nutritional status as well as an indicator of the energy stored in the
body. Height and weight are the measurements used to compute the
Body Mass Index.
In this paper, we attempt to analyse the change in the nutritional
status of women and food intake patterns in Madhya Pradesh in the
recent past on the basis of the information available through different
rounds of the National Family Health Survey (NFHS).
DataThe present study is based on the information available through the
National Family Health Survey. NFHS provides information about
family planning, and reproductive and child health programs, both
nation wide and in individual states along with estimates of various
demographic parameters. It also provides information about the food
intake, height and body mass index (BMI) of women. For this study we
have considered the data available through NFHS-2 and NFHS-3 which
refer to the year 1995 and 2005 respectively.
Changes in Consumption Patterns The consumption of nutritious food is very important for a person to
maintain good health. Agriculture progress in the last two decades has
made India self-sufficient in food grains. Yet, under nutrition continues
to be a major concern, especially in rural population and in states like
Bihar, Madhya Pradesh, Orissa, West Bengal, Rajasthan, etc. The food
intake of individuals varies by demographic and socioeconomic
conditions. Many studies have analysed food consumption patterns in
India (Chatterjee et al 2006, Kumar 1998, Radhakrishna and Ravi 1992).
These studies have observed that there has been a clear shift from grain
consumption towards consumption of non-grain food and animal
products in recent decades. Consumption of special food such as milk,
fruits, vegetables etc. during pregnancy has also been observed in
several studies (Mishra and Tiwari 1990, Chawla et al 1997). Turan and
Sardan (2001) have observed that the consumption expenditure in
cereals and cereal substitutes have decreased which indicates an overall
238

Nutritional Status of Women
improvement in the income level of the masses. Indians living in rural
areas appear to have started spending more on pulses, milk and milk
products, edible oils, meat, egg, fish and vegetables.
Changes in consumption patterns between NFHS-2 and NFHS-3
can be compared for women in Madhya Pradesh. Married women aged
15-49 years were asked during the survey about the frequency of
consumption of specific food items such as milk, pulses or beans, green
leafy vegetables, other vegetables, fruits, meat or fish, egg and chicken,
etc. Tables 1a and 1b show the proportionate distribution of women by
the frequency of consumption of specific food items in Madhya Pradesh
and in India. At NFHS-2, about one fifth of the women surveyed in
India reported that they consumed milk/curd daily whereas this
proportion increased to more than 26 per cent at NFHS-3. In Madhya
Pradesh, this proportion was lower than that in India. The proportion
of women reporting consumption of pulse/beans and green leafy
vegetables also increased over time. By contrast, the proportion of
women reporting consumption of fruits in Madhya Pradesh and in
India was not only poor but have also decreased over time. The
proportion of women surveyed who reported consumption of fruits
occasionally has also reduced significantly between NFHS-2 and NFHS-
3. Similarly, consumption of eggs/chicken/meat/fish has also
decreased in NFHS-3 compared to NFHS-2.
Change in the Nutritional StatusAccording to the International Dietary Energy Consultative Group of
United Nations, BMI is a good index to grade chronic energy deficiency
in adults. The group has classified chronic energy deficiency in adults
into three categories on the basis of BMI - less than 16; 16-17 and 17-18.5
(Government of India 1995). A BMI<18.5 is a reflection of chronic
energy deficiency. Females with BMI between 18.5 and 20.0 are
considered as undernourished while those having a BMI in the range
20 to 25 are considered to be in balance. On the other hand, women with
a BMI of more than 25 are termed as overweight while those with a BMI
>30 are termed as obese (Griffiths and Bentley 2001).
There are many studies that have analysed the nutritional status of
women in different parts of India (Thimmayamma et al. 1981; Busi and
Sai Leela 1996, Arokiasamy 1997, Bhargava and Kawatra 1999,
Nutrition News 1997). Srivastava and others (1998), and Nigam (1999)
have studied the nutritional status of females in Uttar Pradesh and
reported high prevalence of under nutrition. Relatively poor nutrition
239

Child Survival and Health
situation has also been reported by Krishneswamy and others (1997)
and Rao (1996) in studies conducted in South India. Tiwari and
Satyanarayana (2008) in their comparative analysis of nutritional status
of BIMARU states and five other developed states of India have
concluded that the proportion of women with balanced nutrition is
comparatively higher in the BIMARU states than in other states.
Table 2 shows the distribution of women surveyed according to
BMI in Madhya Pradesh. More than 38 per cent of women surveyed had
a BMI of less than 18.5 in NFHS-2 which increased to almost 42 per cent
in NFHS-3. This indicates that the nutritional deficiency in women of
Madhya Pradesh is not only very high but it has increased over time
also. It is also clear from the table that proportion of women with BMI
ranging from 18.5 to 20.0 increased marginally in the state between
NFHS2 and NFHS-3. By contrast, the proportion of women having a
BMI of 20-25 decreased from 34 per cent in NFHS-2 to 29 per cent in
NFHS-3 which again reflects that the nutritional status of women in the
state has deteriorated over time. At the same time, the proportion of
overweight women - woman with a BMI ranging from 25 through 30
increased from about 1 per cent in NFHS-2 to more than 5 per cent in
NFHS-3.
Rural-urban differentials in under nourished and obese women are
significant. The proportion of under nourished women was found to be
high in rural women as compared to their urban counter part whereas
proportion of obese women was higher in urban than in rural women.
What is even more concerning is the observation that the proportion of
under nourished as well as obese women increased in NFHS-3 as
compared to NFHS-2 (Table 3). On the other hand, the proportion of
under nourished women in Scheduled Tribes was found to be twice as
high as in other categories (Table 4). It may also be seen from table 4
that in all social categories, proportion of under nourished women as
well as proportion of obese women appears to have increased over
time. Similarly, the proportion of under nourished women was found
to be the highest in Hindus and, once again, this proportion has
increased between NFHS-2 and NFHS-3.
Conclusions In this paper an attempt has been made to study the change in the
nutritional status of women in Madhya Pradesh between NFHS-2 and
NFHS-3. The analysis reveals that the problem of under nutrition in
women of Madhya Pradesh is quite substantial and it appears to have
240

Nutritional Status of Women
aggravated over time. The problem is particularly serious in the rural
areas and in Scheduled Castes and Scheduled Tribes. In the urban areas,
the problem of obesity appears to be gaining dangerous proportions.
There are also indications of change in the dietary pattern. The
consumption of milk and milk products appears to have increased that
of fruits, eggs and chicken/meat/fish, etc. appears to have decreased.
ReferencesArokiasamy P (1997) Poverty, Nutrition and Fertility: A Micro Study. New
Delhi, BR Publishing Corporation.
Bhargava A, Kawatra BL (1999) Energy and iron status of farm women
belonging to middle income group. Journal of Dairying, Foods and
Home Science.
Busi BR, and Sai Leela M (1996) Comparison of nutritional status and
health care of women residing in urban and slum areas of
Vishakapatnam. The Indian Journal of Nutrition and Dietetics.
Chatterjee S, Rae A, Ray R (2006). Food consumption, trade reforms and
trade patterns in contemporary India: How do Australia and New
Zealand fit in? Conference paper, Massy University, New Zealand;
Department of Applied and International Economics.
Chawla S, Boora P, Kapoor AC, Kaur YP, Veena Kumar (1997) Food
consumption pattern of pregnant and lactating mothers in rural
Haryana. The Indian Journal of Nutrition and Dietetics 34: 40-47.
Christakis G (1973) Nutritional assessment in health programmes.
American Journal of Public Health 63: 80-82.
Government of India (1995) Present nutrition situation. In National Plan
of Action on Nutrition. New Delhi, Ministry of Human Resource
Development, Department of Women and Child Development,
Food and Nutrition Board.
Jelliffe DB (1996) The assessment of the nutritional status of the
community. Geneva, World Health Organisation.
Krishneswamy K, Vijayaraghavan K, Shastry JG(1997) 25 years of
National Nutrition Monitoring Bureau. Hyderabad, Indian Council of
Medical Research, National Institute of Nutrition.
Kumar, P (1998) Food demand and supply projections for India. New
Delhi, Indian Agricultural Research Institute. Agriculture
Economics Policy Paper 98-01.
241

Child Survival and Health
Mishra CP, Tiwari IC (1990): A study on information, education and
communication through village social functionaries. Varanasi,
Institute of Medical Sciences, Benaras Hindu University.
Mohanty AK, Sahu PN, Jana GC(1992): Nutritional anthropometry of
tribal adults. In PD Tiwari and RS Tripathi (eds) Dimensions of
Scheduled Tribes Development in India (Problems and Prospects).New
Delhi, Uppal Publishing House.
International Institute for Population Sciences NFHS (National Family
Health Survey) (1998-99): India and Madhya Pradesh, Data and
reports, International Institute for Population Sciences, Bombay.
NFHS (National Family Health Survey) (2005-06): India and Madhya
Pradesh, Data and reports, International Institute for Population
Sciences, Bombay.
Nigam AK (1999) Nutritional status of women and children in Uttar
Pradesh. In Nutritional Report, Uttar Pradesh. Lucknow, Government
of Uttar Pradesh, Department of Women and Child Development.
National Institute of Nutrition (1997) Food consumption pattern in rural
sedentary adults and also nutrient intake of rural sedentary adults.
Nutrition News 18, No. 4.
Radhakrishna R, Ravi C (1992) Effects of growth, relative price and
performances of food and nutrition. The Indian Economic Review 27:
303- 23
Rao D Hanumantha (1996) Nutrition profile of Indian tribes. Nutrition
News. 17, No. 2.
Rao KV (1980) Efficiency of anthropometric indices for the diagnosis of
malnutrition. Currier (New York) 30 : 113-121.
Srivastava M, Agrawal DK, Agrawal S, Agrawal KN (1998) Nutritional
status of rural non-pregnant non-lactating women in reproductive
age. Indian Pediatrics 35: 975-983.
Tiwari AK, Satyanarayana TVVG (2008) BIMARU is healthy. Journal of
Empirical Research in Social Sciences 3(1-2):55-59.
Turan MS, Sardana S (2001) Economic analysis of shifts in food
consumption patterns in India. Paper presented at the International
Conference on Statistics, Combinatrics and Related Areas and the Eighth
International Conference of Forum for Interdisciplinary Research, School
of Mathematics and Applied Statistics, Wollongong, University of
Wollongong, Australia.
Thimmayamma BVS, Rau P, Rao KV (1981) Fertility pattern of mothers
in a changing rural environment. The Indian Journal of Nutrition and
Dietetics 18: 328-332.
242

Nutritional Status of Women
Table 1
Per cent distribution of women by frequency of consumption of
specific foods (NFHS -2, NFHS-3) Madhya Pradesh.
Food item Daily Weekly Occasionally Never
NFHS-2 (1998-99)
Milk/Curd 20.4 12.2 50.2 17.3
Pulse/Beans 42.9 37.2 19.3 0.6
Green leafy vegetable 41.1 40 18.6 0.3
Other vegetable 53 33.2 13.4 0.4
Fruit 4.9 17.7 71.8 5.5
Eggs 0.9 10.7 36.9 51.5
Chicken/Meat/Fish 0.5 10.5 40.2 48.8
NFHS-3 (2005-06)
Milk/Curd 26.3 21.7 42.6 9.4
Pulse/Beans 54.5 38.8 6.6 0.1
Green leafy vegetable 38.1 50.1 11.6 0.3
Other vegetable 7.8 27.1 60.9 4.1
Fruit 0.4 11.7 31.9 56
Eggs 0.2 7.5 31.7 60.7
Chicken/Meat/Fish 0.2 6.4 33.8 59.6
243

Child Survival and Health
Table 2
Per cent distribution of women by frequency of consumption of
specific foods (NFHS -2, NFHS-3) India.
Food items Daily Weekly Occasionally Never
NFHS-2
Milk/Curd 37.5 17.4 34.1 10.9
Pulse / Beans 46.9 40.8 11.6 0.6
Green leafy vegetables 41.8 43.3 14.3 0.4
Other vegetable 65.1 28 6.6 0.2
Fruit 8.1 24.9 62.2 4.7
Eggs 2.8 25 37.9 34.2
Chicken/Meat/Fish 5.8 26.1 37.3 30.8
NFHS-3
Milk/Curd 39.8 15.6 33.2 11.4
Pulse/Beans 52.7 36.8 9.6 0.9
Green leafy vegetables 64.2 28.7 6.8 0.3
Other vegetable 12.7 27.2 56.6 3.5
Fruit 3.5 28.8 32.9 34.8
Eggs 39.8 15.6 33.2 11.4
Chicken/Meat/Fish 6.8 28.5 32 32.6
244

Nutritional Status of Women
Table 3
Proportion of women in different category of body mass index.
BMI
NFHS-2 NFHS-3
Madhya
PradeshIndia
Madhya
PradeshIndia
<18.5 38.7 36.3 41.7 35.6
18.5-20.0 21.2 20.1 21.8 19.2
20.0-25.0 34 32.9 29.0 32.6
25.0-30.0 4.9 8.4 6.2 9.8
>30 1.2 2.3 1.4 2.8
Mean 19.77 20.26 19.69 20.47
BMI NFHS-2 NFHS-3
< 16.00 15.9 19 18.9 19.3
Madhya
PradeshIndia
Madhya
PradeshIndia
16.00-17.00 24 25.2 26.8 25.6
17.00 -18.50 60.1 55.8 54.4 55.2
Mean 17.07 16.96 16.98 16.96
Minimum 12.08 12.03 12.83 12.04
Table 4
Distribution of women by body mass index and place of residence.
BMINFHS-2 NFHS-3
Urban Rural Urban Rural
<18.5 28.3 42.3 32.5 45.4
18.5-20.0 17 22.7 16.6 23.9
20.0-25.0 38.7 32.7 32.3 27.6
25.0-30.0 12.6 2.2 14.4 2.9
>30 3.4 0.4 4.2 0.2
Mean 21.09 19.32 21.14 19.1
245

Child Survival and Health
Table 5
Distribution of women by body mass index and caste.
BMINFHS-2 NFHS-3
SC ST OBC Others SC ST OBC Others
<18.5 40.8 49.4 37.9 27.7 46.5 50.6 42.0 28.9
18.5-20.0 22.8 24.4 20.5 18.3 17.7 23.7 23.9 19.4
20.0-25.0 34.0 24.9 36.7 38.5 30.2 24.0 28.2 34.2
25.0-30.0 2.1 1.4 3.7 12.4 4.9 1.4 5.3 13.3
>30 0.3 0.0 1.1 3.1 0.7 0.2 0.7 4.3
Mean 19.4 18.82 19.77 21.03 19.39 18.76 19.49 21.18
SC Scheduled Castes
ST Scheduled Tribes
OBC Other backward classes
Table 6
Distribution of women by body mass index and religion
BMINFHS-2 NFHS-3
Hindu Muslim Others Hindu Muslim Others
<18.5 39.1 33.6 35.9 42.4 37.4 28.7
18.5-20.0 21.7 18.2 12.1 22.2 19.6 14.3
20.0-25.0 33.9 36.6 32.7 29 24.7 37.7
25.0-30.0 4.4 8.0 16.3 5.2 14.7 15.6
>30 1.0 3.7 3.1 1.1 3.6 3.8
Mean 19.7 20.57 20.88 19.56 20.68 21.17
246