child survival a in our time? - svenska barnläkarföreningen · child survival – a success or...
TRANSCRIPT

Child survival – a success or failure
in our time?
Dr. Mariam Claeson
Director, MNCH
© 2014 Bill & Melinda Gates Foundation
April 2014

0
10
20
30
40
50
60
70
80
90
100
1990 1995 2000 2005 2010 2015 2020 2025 2030 2035
A PROMISE RENEWED TARGET • 2 million deaths by 2035 • Every country reaches U5MR of
20/1000 • Requires U5M ARR 5.2%
MDG 4
6.9 m child deaths in 2011 3m are neonatal (43%)
U5M current trajectory: ARR 2.5%
Child survival target by 2035 in A Promise Renewed Under 5 mortality = 20/1000
Source: UNICEF State of the World’s Children 2012; The UN Inter-agency Group for Child Mortality Estimation, Levels and Trends in Child Mortality: Report 2011, 2011; Team analysis from 2035 onward based on straight-line ARR reduction from UNICEF numbers 1990-2035
NMR current trajectory: ARR 2.2%
2
Mo
rtal
ity
rate
(p
er 1
,00
0 li
ve b
irth
s)
9.6 m deaths in 2000
Unless we achieve major acceleration for newborn survival, we cannot reach our goal for ending preventable child deaths by 2035

Under-five causes of death, 2000
Source: MCEE/WHO/UNICEF, 2014, in preparation
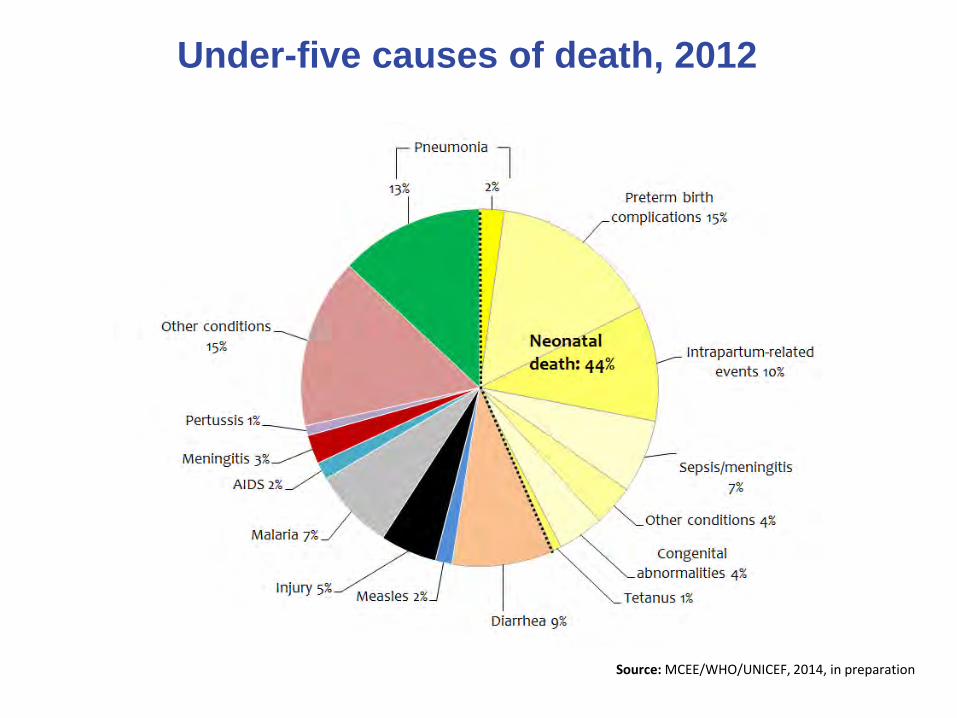
Under-five causes of death, 2012
Source: MCEE/WHO/UNICEF, 2014, in preparation


How has Niger reduced deaths among children by 40% in a decade?
Landlocked; 80% Sahara desert
Population 15.7 million
World’s highest fertility rate (7.1 per woman)
Poor:
o GDP per capita: US$278
o 59.5% of population below poverty line
o In 2011, ranked186 of 187 countries on the Human Development Index

Three major child survival strategies since 2000
1. Increased access to primary health care for major child killers (malaria, pneumonia, diarrhea, measles)
2. Mass campaigns for rapid scale-up of insecticide-treated nets (ITNs), measles vaccination, and vitamin A supplementation
3. Intensified efforts to address child undernutrition

0
50
100
150
200
250
300
1996 1998 2000 2002 2004 2006 2008 2010
De
ath
s p
er
10
00
live
bir
ths
Year
U5MR NNMR
Percent annual rate of decline in U5MR: 5.1%
Under-five mortality declined; no significant change in neonatal mortality

Wasting is down sharply; only small decline in stunting
0.0%
2.0%
4.0%
6.0%
8.0%
10.0%
12.0%
0.0%
10.0%
20.0%
30.0%
40.0%
50.0%
60.0%
70.0%
1998 1999 2000 2001 2002 2003 2004 2005 2006 2007 2008 2009
% c
hild
ren
sev
ere
ly w
aste
d
% c
hild
ren
mo
de
rate
ly o
r se
vere
ly s
tun
ted
Moderate or severe stunting Severe wasting

New policies were effectively implemented
Health service indicator 1998 2009
Number of functioning health posts 0 1938
% population living within 5km of health post or health center
48% 80%
CHWs trained in management of childhood illness
0 2308
% of children with fever/cough for whom care was sought outside the home
23% 54%

0
20
40
60
80
100
Dramatic increases in coverage across the continuum of care, 1998 to 2009
1998 2009

Coverage Estimates for Interventions Across the Continuum of Care in 68 Priority Countries (2000-
06)
Source: Lancet Countdown Coverage writing group, Lancet Countdown special issue, 2008 12

Proportion of child lives saved in 2009, by intervention or risk factor reduction
ITN ownership
25%
Others (<2% each)
11%
Reduction in stunting
10%
Reduction in wasting
9%
Careseeking for malaria
9% Vit A supp.
9%
Careseeking for pneumonia
8%
ORS + Zinc 5%
Measles vaccine
5%
Hib vaccine 4%
Changes in BF practices 3%
TT in preg 2%
19% lives saved
Almost 60,000 children’s lives saved in 2009!

Neonatal as a proportion of child mortality
• Despite 40% reduction in child deaths over past two decades, 2.9 million newborns still die each year
• One million newborns die on their birth day, closely linked to 1.2 million intrapartum stillbirths
• Neonatal mortality reduction is still slower than under five and maternal mortality
14

50-year mortality trends in children and young people: a study of 50 low-income, middle income and high-income countries. Viner et al, Lancet 2011
Reductions in mortality over time – yet rates of reduction
vary by age strata U5 consistent rapid reduction Adolescent and newborn slower

IMAGINE THE LIFE OF
A TYPICAL
BANGLADESHI
ADOLESCENT GIRL
• Married on average at 16.7
years, first child within 1.7 years
• 82% sexually active => 42% using modern contraception
• ~10% have had their first child by 15 years
• Mean BMI (15-19 years): 20.9; 25-35% BMI < 18.5; 49% anemic

Childhood Newborn/postnatal Pre-pregnancy Pregnancy
Risk of Mortality Peaks Around Childbirth
Birth
Maternal deaths
Stillbirths Newborn deaths
Child Deaths
17


Maternal Mortality Rates The Maternal Risk View
19

Global Maternal Deaths, 1990-2011
Source: Lozano R et al. Progress towards Millennium Development Goals 4 and 5 on maternal and child mortality: an updated systematic analysis. Lancet 2011; 378: 1139-65
Mortality decline: 2.8%/y 273,500
217,400
56,100
20
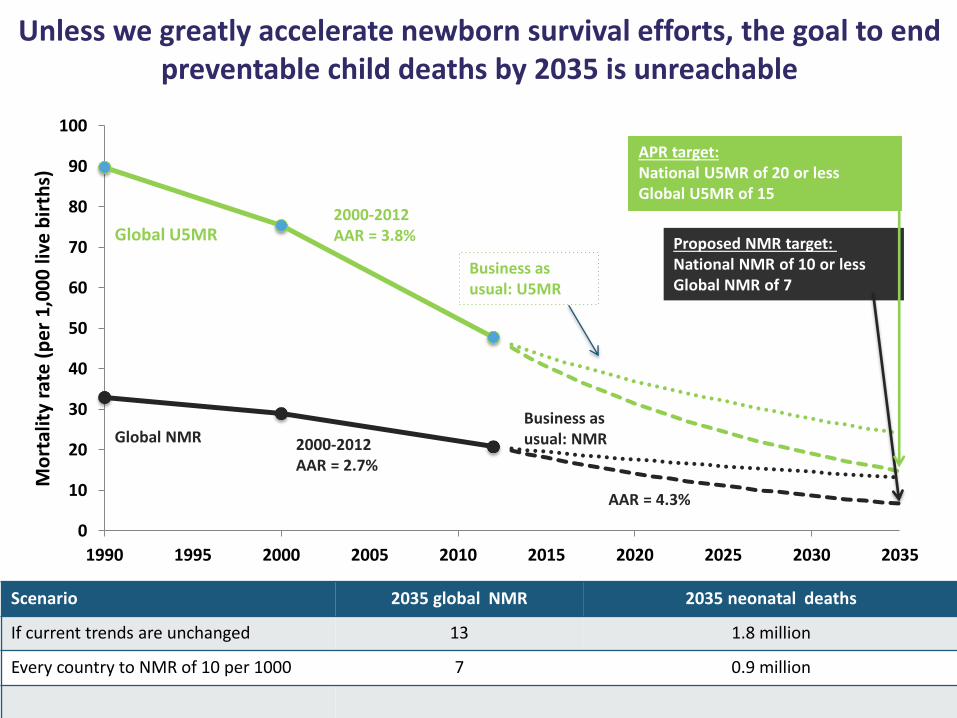
Unless we greatly accelerate newborn survival efforts, the goal to end preventable child deaths by 2035 is unreachable
0
10
20
30
40
50
60
70
80
90
100
1990 1995 2000 2005 2010 2015 2020 2025 2030 2035
Mo
rtal
ity
rate
(p
er
1,0
00
live
bir
ths)
2000-2012 AAR = 2.7%
Proposed NMR target: National NMR of 10 or less Global NMR of 7
2000-2012 AAR = 3.8% Global U5MR
Global NMR
APR target: National U5MR of 20 or less Global U5MR of 15
Business as usual: U5MR
AAR = 4.3%
Business as usual: NMR
Scenario 2035 global NMR 2035 neonatal deaths
If current trends are unchanged 13 1.8 million
Every country to NMR of 10 per 1000 7 0.9 million

From To
No targets and limited data to monitor progress
Global targets for NMR and intervention coverage
Limited in-country political will and resource allocation
High-level political buy-in from high-burden countries to scale-up newborn interventions
Newborns lost between maternal and child health
Global organizations mobilized for newborns (e.g. UNICEF)
A fragmented and uncoordinated in-county civil society voice
A mobilized and active civil society implementing and tracking accountability
Lack of accountability Defined mechanism for accountability and monitoring
Small group of technocratic champions
Champions keep maternal and newborn health on the agenda
21 newborn deaths per 1,000 live births (2012)
7 newborn deaths per 1,000 live births (2035)
The Every Newborn Action Plan (ENAP) is our window of opportunity to accelerate newborn health gains
Every Newborn Action Plan
© 2013 Bill & Melinda Gates Foundation | 22 Confidential

The build up to ENAP launch is galvanizing international and country-level support around evidence-based interventions
April 2013
KMC Consensus Statement
Afrinest results and
dissemination
Solution Pathway for
Preterm Birth
December 2013
CHX and antenatal
steroids added to WHO Essential
Medicines List
Zambia CHX trial results
Newborn Research Funder Consensus
Every Newborn
Action Plan
Policy and
Evidence on
Newborn Health
June 2014 August 2013
Lancet ENAP series
published
ENAP Stakeholder
Meeting
World Health Assembly Geneva
Partners Forum Johannesburg
WHO Executive Board Meeting
Bottleneck Analyses Draft WHA Document Global Outreach
© 2013 Bill & Melinda Gates Foundation |
23
Sept 2014
UN General Assembly
Confidential

BOY DRINKING WATER LETS NOT FORGET WHAT OTHER SECTORS CAN DO FOR CHILD HEALTH

Child Survival – a success
when no more preventable
deaths

THANK YOU