child poverty and homelessness: key context and potential...
TRANSCRIPT

Child Poverty and Homelessness:Key Context and Potential ApproachesESI HUTCHFUL, STATE POLICY FELLOW
APRIL 30, 2018
JEWISH FAMILY AND CHILDREN’S SERVICES IN
SAN RAFAEL, PUBLIC ISSUES COMMITTEE
calbudgetcenter.org

| 2
How Can We Measure Poverty?
Examining rates and trends in child poverty and deep poverty in California through different lenses:
• Official Poverty Measure
• Supplemental Poverty Measure
• California Poverty Measure

| 3
Under the Official Poverty Measure, California’s Child Poverty and Deep Poverty Rates Are Similar to the US Percentage of Children in Official Poverty and Deep Poverty, 2016
Note: Deep poverty is defined as family income equal to less than half of the poverty threshold.Source: Budget Center analysis of US Census Bureau, Current Population Survey microdata downloaded from IPUMS, University of Minnesota
0
5
10
15
20
USCalifornia
Child Deep Poverty Rate
Child Poverty Rate
16.8%
8.2%7.6%
18.0%18.6%

| 410
Official Poverty Measure Supplemental Poverty Measure
• Poverty threshold is based on 1960s food expenditures
• Poverty threshold is based on current spending on basic needs
• Same threshold for all parts of the country • Threshold is adjusted for cost of
living
• Only counts cash income
• Does not account for non-discretionary expenses
• Counts cash income plus non-cash benefits like CalFresh and EITC
• Subtracts non-discretionary expenses like child care and medical bills
| 5
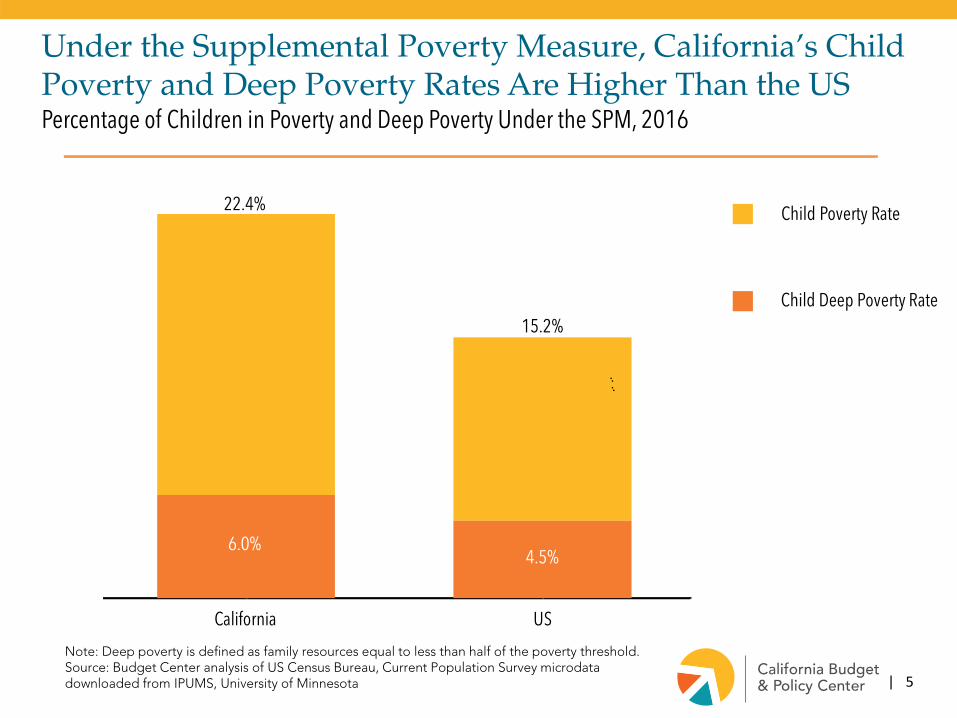
Under the Supplemental Poverty Measure, California’s Child Poverty and Deep Poverty Rates Are Higher Than the USPercentage of Children in Poverty and Deep Poverty Under the SPM, 2016
Note: Deep poverty is defined as family resources equal to less than half of the poverty threshold.Source: Budget Center analysis of US Census Bureau, Current Population Survey microdata downloaded from IPUMS, University of Minnesota
0
5
10
15
20
25
USCalifornia
Child Deep Poverty Rate
Child Poverty Rate
16.8%4.5%
6.0%
15.2%
22.4%
| 6
California Poverty Measure
• Modeled after the Supplemental Poverty Measure
• Accounts for state-specific policy context and demographics
• Unlike the SPM, can be used to examine poverty at the sub-state level (e.g., by region or county) and for some demographic subgroups
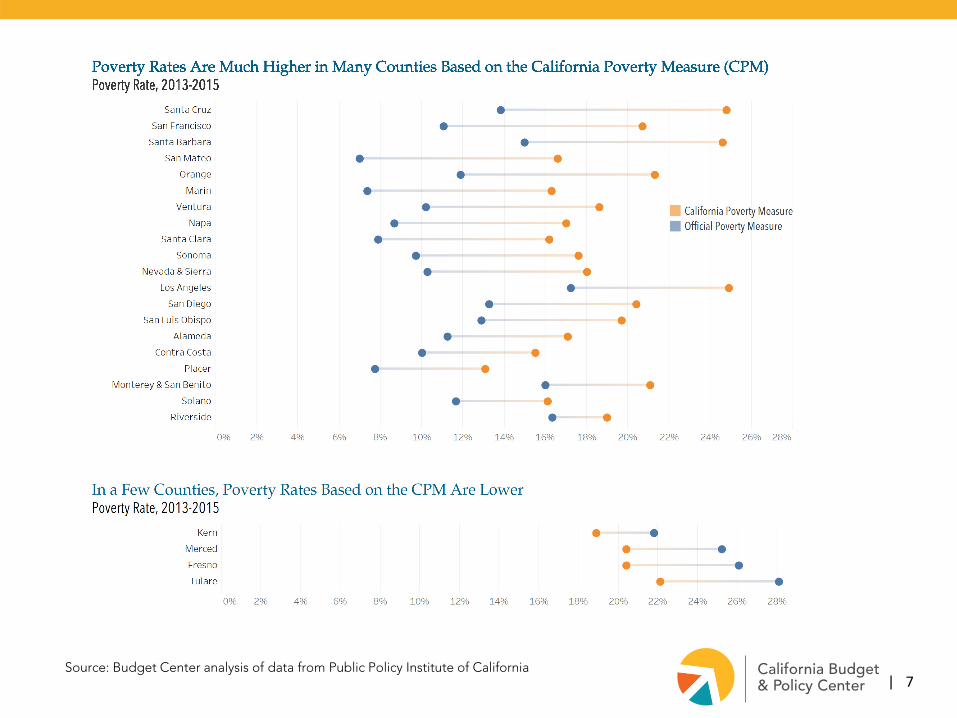
| 7Source: Budget Center analysis of data from Public Policy Institute of California
| 8
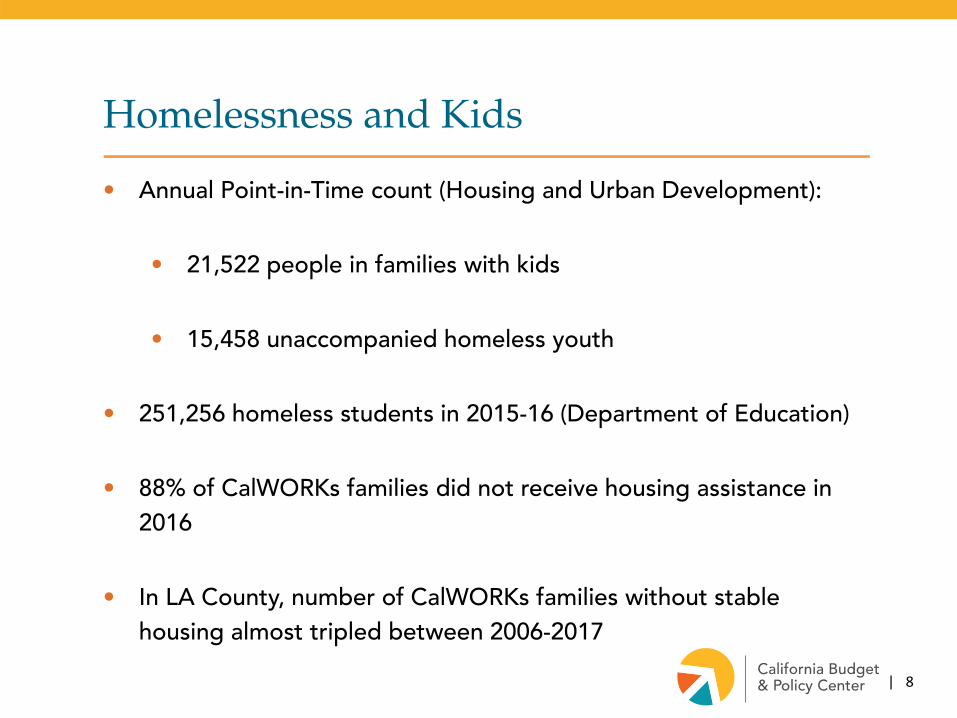
Homelessness and Kids
• Annual Point-in-Time count (Housing and Urban Development):
• 21,522 people in families with kids
• 15,458 unaccompanied homeless youth
• 251,256 homeless students in 2015-16 (Department of Education)
• 88% of CalWORKs families did not receive housing assistance in 2016
• In LA County, number of CalWORKs families without stable housing almost tripled between 2006-2017

| 9
What Does This Mean for California?
• For people who spent at least half their childhood in poverty:
• 64% attained a high school diploma by age 20 compared to 93% of people who never lived in poverty as children.
• Only 35% were consistently employed between ages 25 and 30, compared to 70% of people who never fell into poverty as kids.
• Nearly half (45%) were living in poverty at age 35, compared to just 0.6% of people who never endured poverty as a child.

| 10
Some Social and Economic Context
Despite eight years of sustained economic growth, the recovery remains uneven and elusive for many Californians.

| 11
Most Families in Poverty Are Working
• In 2015, 83% of poor children in California lived in families with at least one working adult.
• Three-fifths of poor children (62%) lived in families with at least one full-time worker.
• One-fifth (21%) had at least one adult in the family working part-time.
| 12
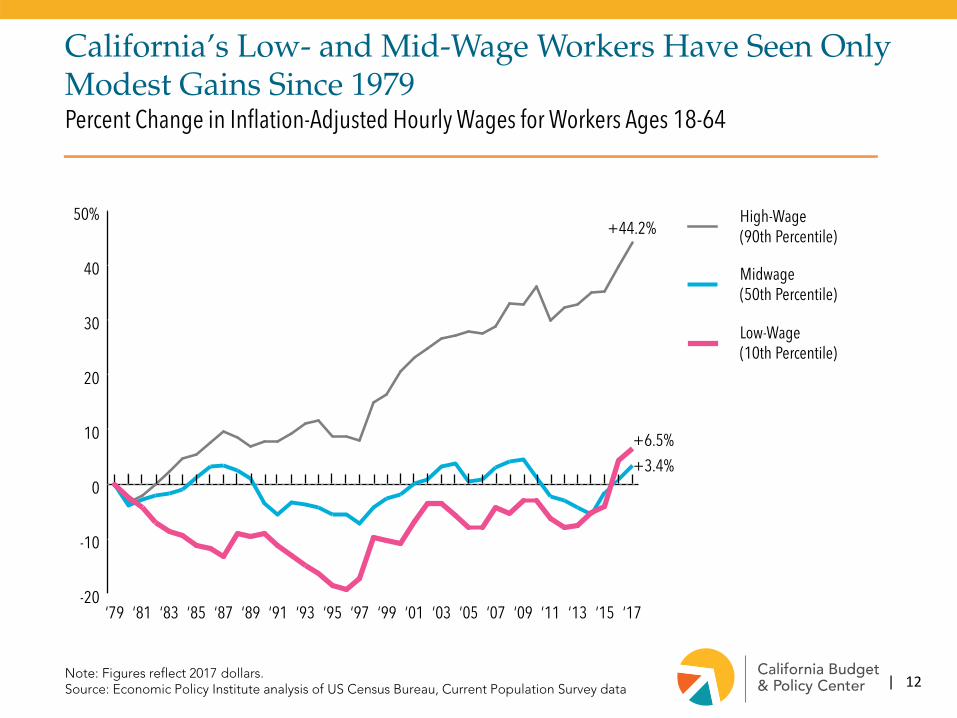
California’s Low- and Mid-Wage Workers Have Seen Only Modest Gains Since 1979Percent Change in Inflation-Adjusted Hourly Wages for Workers Ages 18-64
Note: Figures reflect 2017 dollars.Source: Economic Policy Institute analysis of US Census Bureau, Current Population Survey data
High-Wage(90th Percentile)
Midwage(50th Percentile)
Low-Wage(10th Percentile)
-20
-10
0
10
20
30
40
50%
‘17‘15‘13‘11‘09‘07‘05‘03‘01‘99‘97‘95‘93‘91‘89‘87‘85‘83‘81‘79
+3.4%
+6.5%
+44.2%

| 13
High Cost of Living: Housing and Child Care

| 14
Workers’ Earnings Have Not Kept Pace With Rents in CaliforniaPercent Change in Inflation-Adjusted Median Rent and Median Annual Earnings Since 2006
Note: Median annual earnings for individuals working at least 35 hours per week and 50 weeks per year. Excludes workers with $0 or negative total earnings.Source: Budget Center analysis of US Census Bureau, American Community Survey data
Median Household Rent
Median Annual Earnings
-5
0
5
10
15%
20162015201420132012201120102009200820072006
+13.2%
+4.1%

| 15
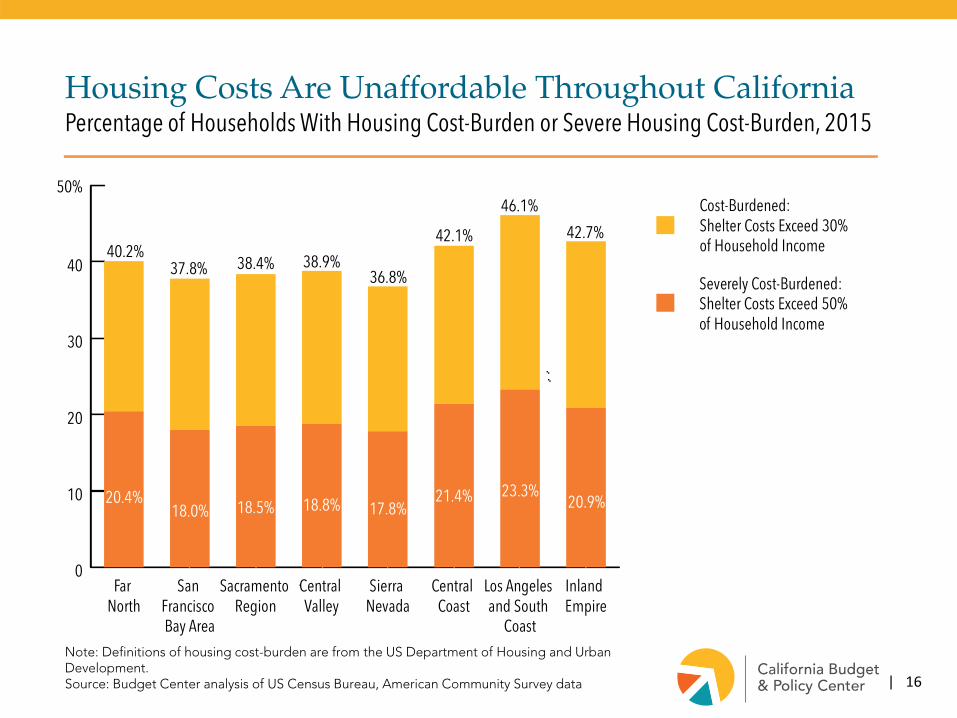
Californians in all parts of the state pay more than they can afford for housing.
Renters, low-income households, and people of color are especially affected by housing cost-burden.
| 16
Housing Costs Are Unaffordable Throughout CaliforniaPercentage of Households With Housing Cost-Burden or Severe Housing Cost-Burden, 2015
Note: Definitions of housing cost-burden are from the US Department of Housing and Urban Development.Source: Budget Center analysis of US Census Bureau, American Community Survey data
0
10
20
30
40
50%
�Inland Empire
Los �Angeles �and South
Coast
Centr �al Coast
Sierr �a Nevada
Centr �al Valley
Sacr �amento Region
�San Fr �ancisco Bay Area
F �ar North
Severely Cost-Burdened:Shelter Costs Exceed 50%of Household Income
Cost-Burdened:Shelter Costs Exceed 30%of Household Income
20.4%
38.9%
46.1%
40.2%37.8% 38.4%
36.8%
42.1% 42.7%
18.0% 18.5% 18.8% 17.8%21.4% 23.3%
20.9%
| 17
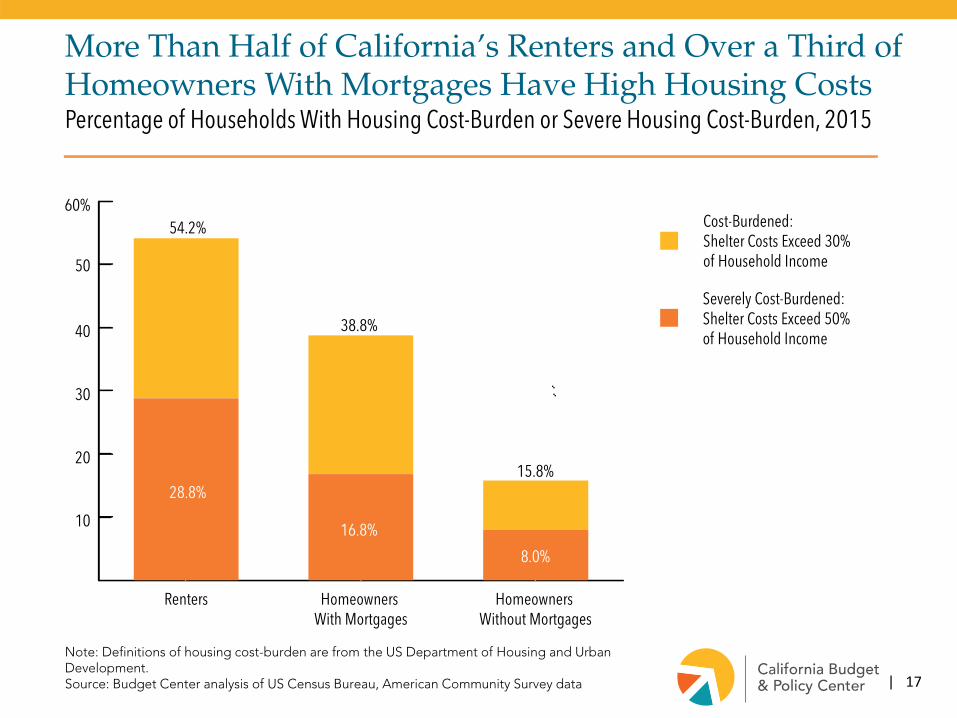
More Than Half of California’s Renters and Over a Third of Homeowners With Mortgages Have High Housing CostsPercentage of Households With Housing Cost-Burden or Severe Housing Cost-Burden, 2015
Note: Definitions of housing cost-burden are from the US Department of Housing and Urban Development.Source: Budget Center analysis of US Census Bureau, American Community Survey data
10
20
30
40
50
60%
HomeownersWithout Mortgages
HomeownersWith Mortgages
Renters
Severely Cost-Burdened:Shelter Costs Exceed 50%of Household Income
Cost-Burdened:Shelter Costs Exceed 30%of Household Income
16.8%
8.0%
28.8%
38.8%
15.8%
54.2%

| 18
Affordable child care and preschool helps families make ends meet.
Without access to affordable care, many families face difficult choices about where to leave their children while they are working.

| 19
Note: Figures are rounded to the nearest hundred. Cost of care is full-time for infants and preschoolers and prorated according to the school year for a school-age child. Costs are based on counties' median cost of care weighted to reflect each county's child population. Source: Budget Center analysis of California Department of Education data, 2016 Regional Market Rate Survey
The Cost of Child Care Is Prohibitively High in CaliforniaMedian Cost of Care Statewide, 2016
Licensed Child Care Center
Licensed FamilyChild Care Home
School-Age (Ages 6 to 12)Preschoolers (Ages 2 to 5)Infants (Under Age 2)
$9,400$10,000
$8,800
$15,100
$5,700 $5,800

| 20
The Cost of Child Care in California Is a Large Share of Family Budgets, Especially for Single-Parent FamiliesChild Care Costs for an Infant and a School-Age Child as a Share of Annual Family Income, 2016
Note: Cost of care is for a licensed center in California in 2016 (full-time for an infant and prorated according to the school year for a school-age child). Costs are based on counties' median cost of care weighted to reflect each county's population of infants and school-age children. Source: Budget Center analysis of data from the California Department of Education, 2016 Regional Market Rate Survey and US Census Bureau
Typical Single-Mother Family(Annual Income: $30,200)
Typical Single-Father Family(Annual Income: $44,107)
Typical Married-Couple Family(Annual Income: $94,103)
22.1%
68.8%
| 21
State and federal cuts have weakened key services and supports that help families achieve economic security.
Many of these programs continue to be funded below pre-recession levels.

| 22
The CalWORKs Grant Has Lost More Than One-Third of Its Purchasing Power Since 1998-99Maximum Monthly CalWORKs Grant for a Family of Three in a High-Cost County
* 2018-19 proposed.Note: The Governor's proposed budget does not provide a grant increase in 2018-19. Inflation adjustment is based on the California Necessities Index. CalWORKs was implemented in 1998.Source: Budget Center analysis of Department of Social Services data
Maximum MonthlyGrant if Adjusted forInflation Each Year
Actual MaximumMonthly Grant
300
600
900
$1,200 $1,136
$714
$61116-17
14-15
12-13
10-11
08-09
06-07
04-05
02-03
00-00
98-99
18-19*
| 23
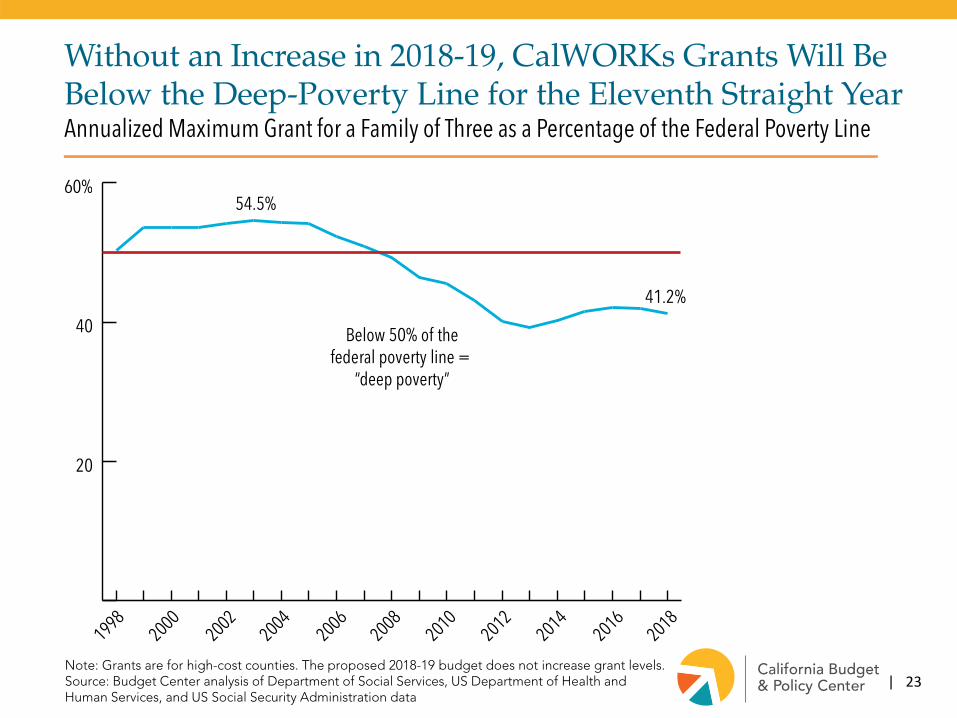
20
40
60%
Below 50% of thefederal poverty line =
“deep poverty”
2018
2016
2014
2012
2010
2008
2006
2004
2002
1998
2000
54.5%
41.2%
Note: Grants are for high-cost counties. The proposed 2018-19 budget does not increase grant levels.Source: Budget Center analysis of Department of Social Services, US Department of Health and Human Services, and US Social Security Administration data
Without an Increase in 2018-19, CalWORKs Grants Will Be Below the Deep-Poverty Line for the Eleventh Straight YearAnnualized Maximum Grant for a Family of Three as a Percentage of the Federal Poverty Line

| 24
Monthly Median Rentin High-Cost Counties
Maximum MonthlyCalWORKs Grant fora Family of Three inHigh-Cost Counties
500
700
900
1,100
1,300
1,500
$1,700
2018201720162015201420132012201120102009200820072006
$723
$1,658
$714
$1,180
The Median Rent in High-Cost Counties Has Far Outpaced Maximum CalWORKs Grants in Recent YearsMaximum Monthly CalWORKs Grant Compared to Median Monthly Rent for a Two-Bedroom
Note: Rent reflects gross rent, which includes utilities and fuels. For 2017 and 2018, rent is estimated based on the compound annual growth rate between 2011 and 2016. The Governor's proposed budget assumes no increase to CalWORKs grants in the 2018-19 fiscal year. Source: Department of Social Services; Budget Center analysis of US Census Bureau, American Community Survey data
| 25
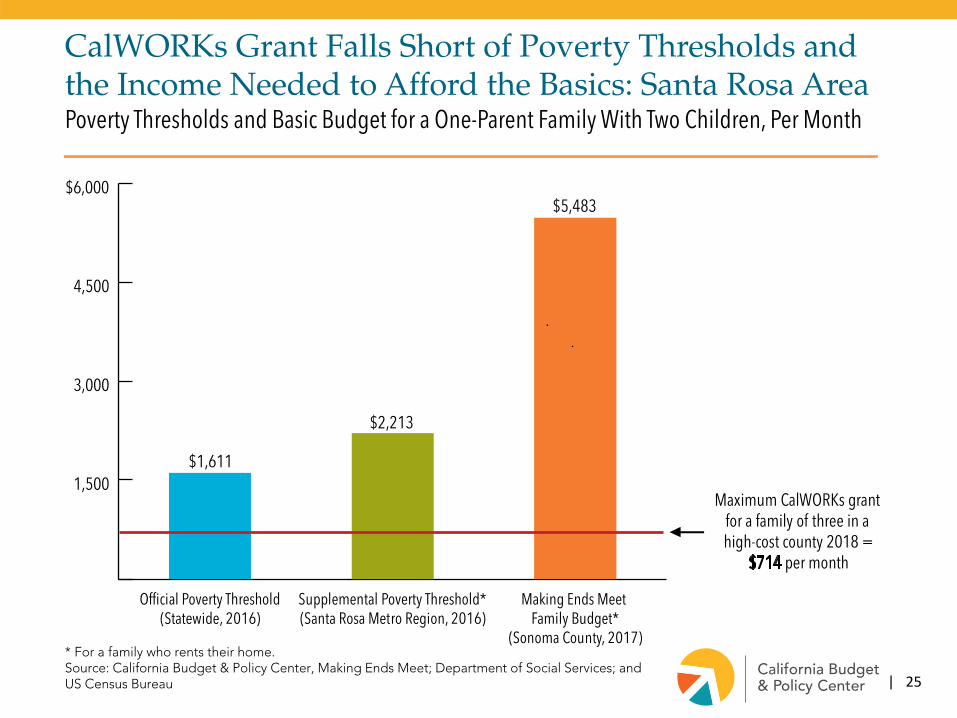
CalWORKs Grant Falls Short of Poverty Thresholds and the Income Needed to Afford the Basics: Santa Rosa AreaPoverty Thresholds and Basic Budget for a One-Parent Family With Two Children, Per Month
* For a family who rents their home.Source: California Budget & Policy Center, Making Ends Meet; Department of Social Services; and US Census Bureau
1,500
3,000
4,500
$6,000
Making Ends MeetFamily Budget*
(Sonoma County, 2017)
Supplemental Poverty Threshold*(Santa Rosa Metro Region, 2016)
Official Poverty Threshold(Statewide, 2016)
$5,483
$2,213
$1,611
Maximum CalWORKs grantfor a family of three in ahigh-cost county 2018 =
per month

| 26
Even With Recent Increases, California Will Have 64,000 Fewer Child Care and Preschool Slots Than in 2007-08Annual Number of Subsidized Child Care and Preschool Slots, Compared to 2007-08
*ProposedNote: Child care includes CalWORKs and non-CalWORKs programs and excludes Transitional Kindergarten. Slots include those funded with federal and/or state dollars. Source: Budget Center analysis of Department of Finance and Legislative Analyst’s Office data
2018-19*2017-182016-172015-162014-152013-142012-13
-110,100
-101,900
-88,900
-72,600-69,600 -66,700 -63,700

| 27
Federal Housing Assistance
• Housing assistance is crucial for California families, with 300,000 households using vouchers alone in 2014.
• The federal budget proposal for federal fiscal year 2019 would raise rents for almost 388,000 households and cut vouchers for about 27,000 households in California.

| 28
State leaders should continue to invest in California families.
| 29
Policy Options to Support Families
• Raise CalWORKs grant levels to above deep poverty
• Fully restore subsidized child care slots
• Increase state resources for tackling homelessness
• Further strengthen the California Earned Income Tax Credit (CalEITC)
Extend eligibility to immigrant families
Increase credit
Peg to rising minimum wage

| 30
The CalEITC, Together With Federal Credits, Significantly Boosts the Incomes of Working Families With ChildrenIncrease in Income From Tax Credits for Workers Qualifying for the Maximum CalEITC, 2017
Note: These families qualify for the refundable portion of the Child Tax Credit, referred to as the Additional Child Tax Credit.Source: Budget Center analysis
3
6
9
12
$15K
Three or More ChildrenTwo ChildrenOne ChildNo Children
83% increase92% increase
69% increase
CalEITC
Federal EITC
Earnings From Work
Federal Child Tax Credit

1107 9th Street, Suite 310
Sacramento, California 95814
916.444.0500
@CalBudgetCenter
@esi_hutchful
calbudgetcenter.org

| 32
Rents Are Highest in California’s Coastal Urban AreasFair Market Rent for a Two-Bedroom Apartment, 2017
Source: US Department of Housing and Urban Development
$2,500 or More
$2,000 to $2,499
$1,000 to $1,499
$1,500 to $1,999
$550 to $999

| 33
Eight in 10 Low-Income Households in California Have Unaffordable Housing CostsPercentage of Households With Housing Cost-Burden or Severe Housing Cost-Burden, 2015
Note: Low income defined as less than 200% of the official federal poverty line; middle income defined as 200% to 399% of the official federal poverty line; high income defined as 400% or more of the official federal poverty line. Definitions of housing cost-burden are from the US Department of Housing and Urban Development.Source: Budget Center analysis of US Census Bureau, American Community Survey data
0
10
20
30
40
50
60
70
80
90%
High-IncomeMiddle-IncomeLow-Income
Severely Cost-Burdened:Shelter Costs Exceed 50%of Household Income
Cost-Burdened:Shelter Costs Exceed 30%of Household Income
14.6%2.2%
55.5%
46.3%
15.3%
80.6%
| 34
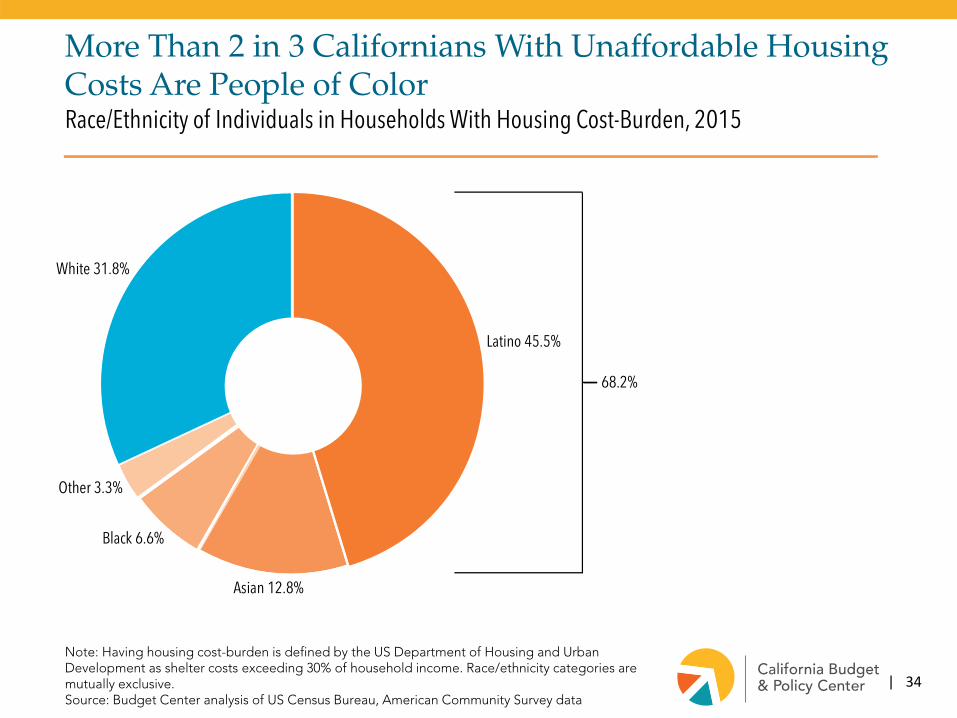
More Than 2 in 3 Californians With Unaffordable Housing Costs Are People of ColorRace/Ethnicity of Individuals in Households With Housing Cost-Burden, 2015
Note: Having housing cost-burden is defined by the US Department of Housing and Urban Development as shelter costs exceeding 30% of household income. Race/ethnicity categories are mutually exclusive.Source: Budget Center analysis of US Census Bureau, American Community Survey data
White 31.8%
Asian 12.8%
Other 3.3%
Black 6.6%
Latino 45.5%
68.2%