child pedestrian casualties with special reference to casualties on the journey to or from school in...
TRANSCRIPT

Accid. Anal. & Prev. Vol. 21, No. 3, pp. 291-301, 1989 0001-4575/89 $3.00+ .00 Printed in Great Britain. © 1989 Pergamon Press plc
SHORT NOTES AND RESEARCH COMMUNICATIONS
C H I L D P E D E S T R I A N C A S U A L T I E S W I T H S P E C I A L R E F E R E N C E T O C A S U A L T I E S O N T H E J O U R N E Y
T O O R F R O M S C H O O L I N M A N C H E S T E R A N D S A L F O R D , E N G L A N D
BARBARA PRESTON 52 Lower Fold, Marple Bridge, Stockport, SK6 5DU, England
(Received 20 July 1988; in revised form 26 January 1989)
Abstract--There are two separate facets of the casualty rates for child pedestrians in Great Britain that require explanation. (1) The casualty rate for child pedestrians aged 11-14 years is higher than the rate for those aged 5-10 years. In Manchester and Salford the casualty rate for the older age group is higher for children on the journey to or from school but at nonschool times the casualty rate is lower for those aged 11-14 years than for those aged 5-10 years. It is suggested that the high casualty rate for older children is connected with the school journey, which is longer to secondary than to primary schools. (2) The casualty rate for the older age group has increased in recent years. Comparing the casualty rates at school and nonschool times in Manchester and Salford in 1969 and 1987 suggests that this increase is due to an increase in accidents on the school journey.
I N T R O D U C T I O N
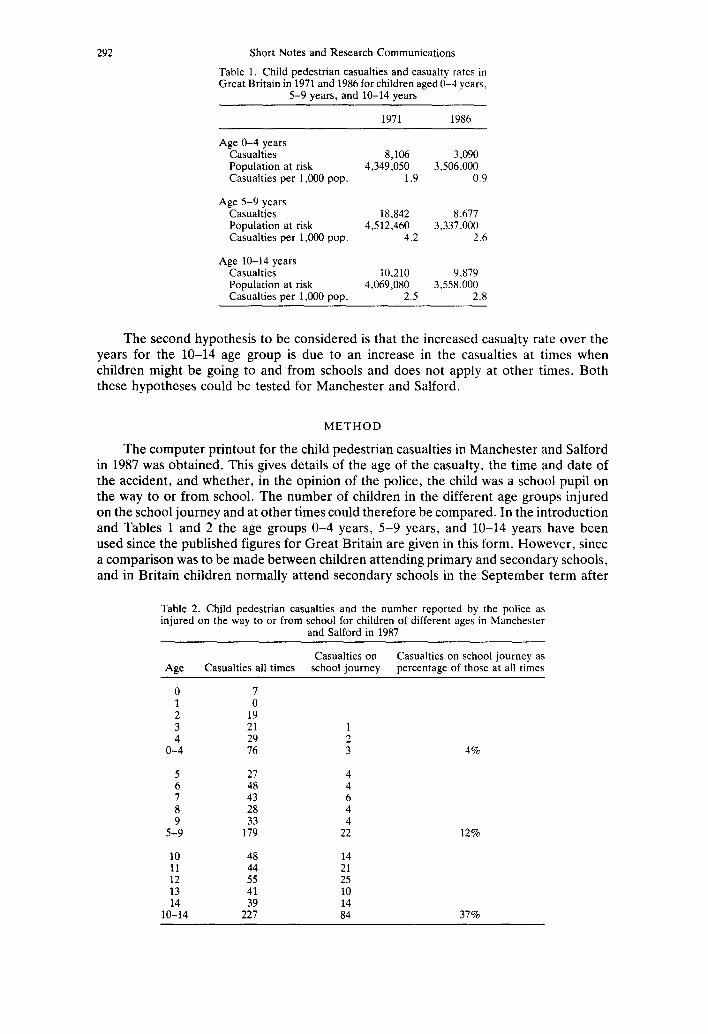
In Great Britain there has been a dramatic decrease in the number of child pedestrians under 10 years of age killed and injured on the roads, as shown in Table 1. The casualty rate for all child pedestrains decreased after the energy crisis in 1973 when petrol was in short supply and some special speed limits were imposed. The casualty rate for the 5-9 year olds continued to decrease after 1975--albeit more slowly and with minor fluctuations--whereas the casualty rate for the 10-14 year olds rose again until in 1986 it was higher than it had been in 1971 and higher than the rate for 5-9 year olds [Department of the Environment 1971; Department of Transport 1987; Office of Pop- ulation Censuses and Surveys (OPCS) 1971, 1987a]. There are many plausible reasons suggested for the decrease in accidents to younger children: demolition and rehousing of some of the most dangerous areas for young children; the fall of the birth rate, especially for the unskilled and semiskilled, who have the highest accident rates (Preston 1981); the suggestion that younger children are being increasingly ferried around in cars (West-Oram 1986); the road safety education (Department of Transport 1981). Some 3f these suggestions do not apply, or apply much less, to the 10-14 age group, but this does not explain why more older children are injured. One would expect that as children got older they would be better able to cope with the hazards of crossing the road (Sandels 1979). Children of secondary school age are more likely to be injured than primary ~chool children. It is suggested that children have to travel further to secondary schools :han to primary schools, which increases the risk of injury on the school journey.
The first hypothesis to be considered is that the difference in casualty rates for older compared with younger children applies to casualties on the school journey and not to ,:asualites at other times. Could the dangers of the school journey to secondary school also be the cause of the increased casualty rate in recent years for the 10-14 age group? 3etween 1971/72 and 1983/84 there was an overall trend towards larger schools (Central Statistical Office 1986). In 1971/2 only 12% of the public sector secondary schools in ~:he United Kingdom had over 1,000 pupils; in 1983/4 this had risen to 30%. The birth rate has fallen (OPCS 1985) and the population density has decreased--the population is more dispersed, so that larger schools mean that children must travel further to school. i~it is therefore suggested that this increased travel might have caused more casualties on the school journey.
~ p 21:3-c 201
292 Short Notes and Research Communications
Table 1. Child pedestrian casualties and casualty rates in Great Britain in 1971 and 1986 for children aged 0-4 years,
5-9 years, and 10-14 years
1971 1986
Age 0-4 years Casualties 8,106 3,090 Population at risk 4,349,050 3,506,000 Casualties per 1,000 pop, 1.9 0.9
Age 5-9 years Casualties 18,842 8,677 Population at risk 4,512,460 3,337.000 Casualties per 1,000 pop. 4.2 2.6
Age 10-14 years Casualties 10,210 9,879 Population at risk 4,069,080 3,558,000 Casualties per 1,000 pop. 2.5 2.8
The second hypothesis to be considered is that the increased casualty rate over the years for the 10-14 age group is due to an increase in the casualties at times when children might be going to and from schools and does not apply at other times. Both these hypotheses could be tested for Manchester and Salford.
M E T H O D
The computer printout for the child pedestrian casualties in Manchester and Salford in 1987 was obtained. This gives details of the age of the casualty, the time and date of the accident, and whether, in the opinion of the police, the child was a school pupil on the way to or from school. The number of children in the different age groups injured on the school journey and at other times could therefore be compared. In the introduction and Tables 1 and 2 the age groups 0-4 years, 5-9 years, and 10-14 years have been used since the published figures for Great Britain are given in this form. However, since a comparison was to be made between children attending primary and secondary schools, and in Britain children normally attend secondary schools in the September term after
Table 2. Child pedestrian casaalties and the number reported by the police as injured on the way to or from school for children of different ages in Manchester
and Salford in 1987
Casualties on Casualties on school journey as Age Casualties all times school journey percentage of those at all times
0 7 1 0 2 19 3 21 1 4 29 2
0-4 76 3
5 27 4 6 48 4 7 43 6 8 28 4 9 33 4
5-9 179 22
10 48 14 11 44 21 12 55 25 13 41 10 14 39 14
10-14 227 84
4%
12%
37%
Short Notes and Research Communications 293
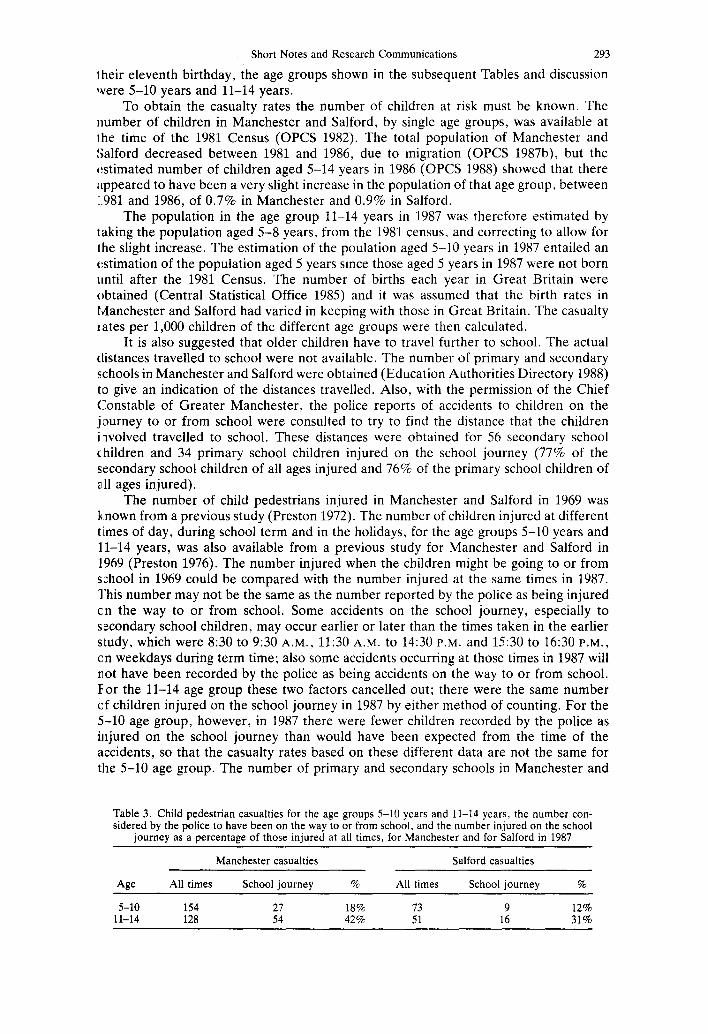
1heir eleventh birthday, the age groups shown in the subsequent Tables and discussion were 5-10 years and 11-14 years.
To obtain the casualty rates the number of children at risk must be known. The number of children in Manchester and Salford, by single age groups, was available at lhe time of the 1981 Census (OPCS 1982). The total population of Manchester and Salford decreased between 1981 and 1986, due to migration (OPCS 1987b), but the estimated number of children aged 5-14 years in 1986 (OPCS 1988) showed that there appeared to have been a very slight increase in the population of that age group, between :981 and 1986, of 0.7% in Manchester and 0.9% in Salford.
The population in the age group 11-14 years in 1987 was therefore estimated by laking the population aged 5-8 years, from the 1981 census, and correcting to allow for lhe slight increase. The estimation of the poulation aged 5-10 years in 1987 entailed an estimation of the population aged 5 years since those aged 5 years in 1987 were not born until after the 1981 Census. The number of births each year in Great Britain were obtained (Central Statistical Office 1985) and it was assumed that the birth rates in Manchester and Salford had varied in keeping with those in Great Britain. The casualty iates per 1,000 children of the different age groups were then calculated.
It is also suggested that older children have to travel further to school. The actual distances travelled to school were not available. The number of primary and secondary schools in Manchester and Salford were obtained (Education Authorities Directory 1988) to give an indication of the distances travelled. Also, with the permission of the Chief Constable of Greater Manchester, the police reports of accidents to children on the journey to or from school were consulted to try to find the distance that the children involved travelled to school. These distances were obtained for 56 secondary school children and 34 primary school children injured on the school journey (77% of the secondary school children of all ages injured and 76% of the primary school children of all ages injured).
The number of child pedestrians injured in Manchester and Salford in 1969 was !~ nown from a previous study (Preston 1972). The number of children injured at different times of day, during school term and in the holidays, for the age groups 5-10 years and 11-14 years, was also available from a previous study for Manchester and Salford in 1969 (Preston 1976). The number injured when the children might be going to or from school in 1969 could be compared with the number injured at the same times in 1987. "]'his number may not be the same as the number reported by the police as being injured cn the way to or from school. Some accidents on the school journey, especially to s~condary school children, may occur earlier or later than the times taken in the earlier study, which were 8:30 to 9:30 A.M., 11:30 A.M. to 14:30 P.M. and 15:30 to 16:30 P.M., cn weekdays during term time; also some accidents occurring at those times in 1987 will not have been recorded by the police as being accidents on the way to or from school. For the 11-14 age group these two factors cancelled out; there were the same number ef children injured on the school journey in 1987 by either method of counting. For the 5-10 age group, however, in 1987 there were fewer children recorded by the police as injured on the school journey than would have been expected from the time of the accidents, so that the casualty rates based on these different data are not the same for the 5-10 age group. The number of primary and secondary schools in Manchester and
Table 3. Child pedestrian casualties for the age groups 5-10 years and 11-14 years, the number con- sidered by the police to have been on the way to or from school, and the number injured on the school
journey as a percentage of those injured at all times, for Manchester and for Salford in 1987
Manchester casualties Salford casualties
Age Alltimes Schooljourney % Alltimes Schooljourney %
5-10 154 27 18% 73 9 12% 11-14 128 54 42% 51 16 31%

294 Short Notes and Research Communications
Table 4. Casualties, estimated population, and casualty rate per 1,000 children aged 5-10 years and 11-14 years for Manchester and Salford in 1987, for all casualties, for children reported by the police as injured on the journey to or from school, and for casualties not reported as occurring on
the school journey
School journey Nonschool journey Total
Age Population Casualties Rate Casualties Rate Casualties Rate
5-10 47,800 36 0.8 191 4.0 227 4.7 11-14 32,700 70 2.1 109 3.3 179 5.5
Salford in 1974 was obtained from the Education Departments of the two towns (City of Manchester Education Committee 1975, Salford Education Department 1988).
The number of children, in Manchester and Salford, for single age groups is pub- lished when a population census is taken. There was a census in 1966 and 1971 (General Register Office 1967; OPCS 1971). There was a considerable decrease in the number of children in both towns between these dates, largely due to rehousing. To estimate the population in 1969 it was assumed, in the absence of any evidence to the contrary, that the population decrease had occurred linearly: as the estimation was required for a year that was only two years from one census and three from the other it is not thought that the estimations would be very far off. Sufficient information was therefore available to test both hypotheses for Manchester and Salford.
R E S U L T S
The number of children of different ages injured in 1987 in Manchester and Salford and the number considered by the police to have been injured on the school journey are shown in Table 2.
The number injured in the age groups 5-10 years and 11-14 years and the number considered by the police to have been injured on the way to or from school are shown in Table 3 for Manchester and for Salford, separately. In Manchester there was a highly significant difference in the proportion of casualties on the school journey for the two age groups. For Salford the difference was significant for a two-tailed ×2 test at the 0.02 probability level.
The number of casualties, the estimated population, and the casualty rates per 1,000 children, for casualties thought by the police to be incurred on the journey to or from school and for those at other times, for children aged 5-10 years for those aged 11-14 years in Manchester and Salford in 1987 are shown in Table 4. The casualty rate for the school journey is greater for the 11-14 year age group than for the 5-10 year age group, as is the total casualty rate. However, the casualty rate for accidents not considered by the police to be on the school journey is lower for the 11-14 year age group than for the 5-10 year age group.
It is suggested that the school journey is more hazardous for older children because they have to travel further to secondary schools than to primary schools. The miles
Table 5. Distance from home to school for children injured on the way to or from primary and secondary schools in Manchester and
Salford in 1987
Distance Pupils at secondary schools Pupils at primary schools
<½ mile 7 12
1- 17 2- 3 3- 4 4- 6 5- 3 >6 miles 4
23 10
1

Short Notes and Research Communications
Table 6. Child pedestrian casualties and the number occurring at times when the children might be on the way to or from school, for children of different ages in
Manchester and Salford in 1969
295
Casualties Casualties to Age all times or from school
Casualties at times when children might have been going to or from school
as a % of those at all times
0 4 1 13 2 34 3 87 4 109
0-4 247
5 6 7 8 9
10 5-10
101 111 101 93 72 55
533
11 53 12 56 13 53 14 38
11-14 200
129 24%
60 30%
~xavelled by all pupils are not known. However, the distance from home to school for ~:he children involved in accidents was obtained for primary and secondary school children in Manchester and Salford, as shown in Table 5. None of the primary school pupils who were injured travelled more than two miles to school and only one travelled between one and two miles; the majority travelled less than half a mile to school. For secondary ~;chool pupils the median distance travelled was between one and two miles and nearly a quarter of the injured children travelled over four miles to school. This does not necessarily correspond with the distance travelled by the children who did not have accidents, but it certainly indicates that the distance travelled was longer on the journey lo or from secondary school. Moreover, there are 231 primary schools in Manchester and Salford but only 57 secondary schools. The majority of children attend their nearest ,.chool, though they are not obliged to do so and some prestigious secondary schools, ,uch as Manchester Grammar School, will recruit from the entire area.
There seems little doubt that children travel further to secondary school than to primary school and that the extra length of the school journey will account for some of lhe increase in casualties associated with the journey to secondary school.
Can the increase in the accident rate for the older age group over time also be explained by an increase in the number injured on the way to or from school?
The child pedestrian casualties in Manchester and Salford in 1969 and the number of casualties at times when they might have been going to or from school for the age ~,,roups 5-10 years and 11-14 years are shown in Table 6. In 1969, for the 5-10 year age group, 24% of the casualties occurred at times when the children might have been going
Table 7. A comparison of the number of chil- dren aged 11-14 injured in Manchester and Salford in 1969 and 1987 at all times, at times when the children might have been going to
or from school, and at other times
1969 1987
Total casualties 200 179 School times 60 70 Other times 140 109 School times as a 30% 39%
% of all casualties

296 Short Notes and Research Communications
Table 8. Estimated population and casualty rates per 1,000 children aged 5-10 years and 11-14 years in Manchester and Salford in 1969 and 1987 for times when the children might have been going to or from school,
other times, and all times
1969 1987
Casualty rates Casualty rates
School Not school School Not school Age Population times times Total Population times times Total
5-10 69,200 1.9 5.8 7.7 47,800 1.0 3.7 4.7 11-14 41,600 1.4 3.4* 4.8 32,700 2.1 3.3* 5.5
*The apparent decrease in 1987 is spurious. The figures were rounded to one decimal place as the accuracy is not sufficient to give the figures to two decimal places; before rounding off the figures were 3.36 in 1969 and 3.33 in 1987 and this apparent difference is meaningless.
to or from school; 21% of the casualties occurred at those times in 1987. This difference is not statistically significant. In 1969 for the age group 11-14 years 30% of the casualties occurred at times when the children might have been going to or from school; 39% of the casualties occurred at those times in 1987, as shown in Table 7. For a one-tailed ×2 tes t - - the direction of the expected change having been predicted--this was significant at the 0.05 probability level.
The casualty rates, in 1969 and 1987, for school and nonschool times, for the age groups 5-10 and 11-14 years are given in Table 8. The increase in the casualty rate for the 11-14 year olds in Manchester and Salford between 1969 and 1987 appears to be at times when the children might be going to or from school; there was no overall increase at nonschool times.
It is suggested that the increased dangers of the journey to or from secondary school might be due to the journey being longer in 1987 than in 1969. The number of secondary schools in Manchester and Salford decreased from 99 in 1974 to 57 in 1987.
It was also noticed that there was an increase between 1969 and 1987 in the number of children of this age injured after 8:30 P.M. in the evening. Had this been predicted it would have been statistically significant for a two-tailed ×2 test at the 0.05 probability level. However, it was not predicted and the reason is not known.
CONCLUSION
1. The casualty rate per 1,000 child pedestrians in Manchester and Salford in 1987 was higher for those aged 11-14 years than for the 5-10 year age group. When the casualty rates on the journey to or from school and at other times were considered separately, the casualty rate on the school journey was higher for the 11-14 year olds than for the younger age group but the casualty rate at other times was lower for those aged 11-14 years than for those aged 5-10 years. It is suggested that children have to travel further to secondary schools than to primary schools and that this may explain much of the higher casualty rate for the 11-14 year age group.
2. The casualty rate per 1,000 child pedestrains in Manchester and Salford for those aged 5-10 years was lower in 1987 than in 1969, but the casualty rate for the 11-14 year age group had increased over this period. For the 5-10 year age group the casualty rate at times when the children might have been going to or from school had decreased and so had the casualty rate at nonschool times. For the 11-14 year age group the casualty rate at times when the children might have been going to or from school had increased from 1969 to 1987, whereas the casualty rate at nonschool times had not changed. Again it is suggested that the increased casualty rate at school times may have been due to an increase in the length of the journey to secondary schools.
REFERENCES
Central Statistical Office. Annual abstract of statistics 1985. London: H.M.S.O.; 1985. Central Statistical Office. Social trends 16. London: H.M.S.O.: 1986. City of Manchester Education Committee. Statistical information 1974/75. Manchester: CMEC; 1975.

Short Notes and Research Communications 297
Department of the Environment, Scottish Development Department, Welsh Office. Road accidents in Great Britain 1971. London: H.M.S.O.; 1973.
Department of Transport. Road accidents in Great Britain 1980. London: H.M.S.O.; 1981. Department of Transport. Road accidents in Great Britain 1986. London: H.M.S.O.; 1987. Education Authorities Directory. Redhill, Surrey: The School Government Publishing Co. Ltd.; 1988. General Register Office. Sample census 1966. London: H.M.S.O.; 1967. Office of Population Censuses and Surveys. Census 1971. London: H.M.S.O.; 1971. Office of Population Censuses and Surveys. Census 1981. London: H.M.S.O.; 1982. Office of Population Censuses and Surveys. Birth statistics. London: H.M.S.O.; 1985. Office of Population Censuses and Surveys. Population projections. London: H.M.S.O.; 1987a. Office of Population Censuses and Surveys. Monitor PP1/871. London: H.M.S.O.; 1987b. Office of Population Censuses and Surveys. Key population and vital statistics, England and Wales local
authority areas 1986. London: H.M.S.O.; 1988. Preston, B. Statistical analysis of child pedestrian accidents in Manchester and Salford. Accid. Anal. Prev.
4:323-332; 1972. Preston, B. Child pedestrian accidents in Manchester and Salford. Manchester: Manchester Polytechnic;
1976:9-14. Preston, B. Child pedestrian deaths. Walk. Vol. 3, No. 7. London: Pedestrians Association; 1981:9-10. Salford Education Department. Private communication. Salford; 1988, Sandels, S. Unprotected road users. A behavioural study. The Skandia Report 111. Stockholm: Ramsays;
1979. West-Oram, F. G. The problem. Conference on providing for the pedestrian. Cheshire: Winsford; 1986.
R O A D T R A F F I C A C C I D E N T F A T A L I T I E S IN P O R T M O R E S B Y : A T E N - Y E A R S U R V E Y
SANKAR N. SINHA AND S. K. SENGUPTA Department of Clinical Sciences and Pathology, Faculty of Medicine,
University of Papua New Guinea, P.O. Box 5623, Boroko, Papua New Guinea
(Received 21 May 1987; in revised form 1 February 1989)
Abstract--A retrospective analysis for a 10-year period (1976-1985) of Road Traffic Accident (RTA) fatalities was carried out in Port Moresby, the capital of Papua New Guinea. The majority of the victims were males and under the age of 45. Passengers formed the largest number, followed by pedestrians and drivers. Most fatal accidents occurred during the weekend. Analysis of injuries reveal head injury to be the dominant and possible cause of death in all three categories of victims. Multiple injuries involving many organs were more common in pedestrians and passengers than drivers. Factors contributing to the high rate of RTAs are discussed and measures to minimise the rate of such accidents have been suggested.
I N T R O D U C T I O N
Papua New Guinea (PNG) is situated to the north of Australia and forms the eastern half of the island of New Guinea. Port Moresby, the capital of PNG, forms the National Capital District (NCD) and has a population of about 125,000 with a annual population growth rate of 2.9% [National Statistical Office (NSO) 1988a]. It is perhaps unique among the world's capitals in that it is not linked by road to any other major town. Yet, 33% of the country's road traffic accidents (RTAs) occur in Port Moresby (Lourie 1982). An analysis of road accidents in Port Moresby in 1977 and 1978 showed that a vehicle had a one in six chance each year of being involved in an accident, which was more than double that in Sydney (Scrimgeour 1983). Between 1976 to 1980 RTAs accounted for 56% of all traumatic fatalities at the Port Moresby General Hospital (PMGH), the only referral hospital for the city of Port Moresby and its neighbouring areas (Sinha, Sengupta, and Purohit 1981).
The subject of road accidents and their prevention in this country has been high- lighted in several publications over the past decade (Bouraga 1980; Shepard 1980; Wyatt 1980; Sinha et al. 1981; Lourie 1982; Lourie and Sinha 1983). In proportion to the number of registered vehicles PNG has a very high road accident fatality rate; 67 fatalities per 10,000 vehicles were recorded in 1978 (Bouraga 1980). To minimise the rate of road accidents intensive efforts have been made during the past five years to increase public