child malnutrition in shining india: a x-state empirical ... nut xstate 1998 text.doc /india nut...
TRANSCRIPT

India nut Xstate 1998 text.doc /India nut Xstate 1998/ First draft: 2006-07-15; current: 2006-09-07
Child Malnutrition in Shining India:
A X-state Empirical Analysis
Peter Svedberg*
The core question addressed in this paper is what explains the large inter-state
differences in child malnutrition as manifested in stunting in India⎯ranging from 22 to
56 per cent. The method used is multiple regression analysis with controls for
multicolinearity, reverse causation and robustness. A perhaps surprising finding is that
inter-state differences in child stunting are not directly correlated to differences in
income poverty. The variables with the highest explanatory power for stunting are child
health-care provision and the fertility rate. Child health-care provision, in turn, is
explained mainly by the relative status of women in society and household per-capita
income. The large inter-state variation in fertility is strongly linked to female literacy and
more weakly to government health expenditures and household per-capita income.
Key words: Child malnutrition, stunting, poverty, health care, female status, literacy,
fertility, India.
_____________________________________
* Peter Svedberg is professor of development economics at the Institute for International
Economic Studies, Stockholm University. E-mail: [email protected].
1. BACKGROUND AND INTRODUCTION
The first Millennium Development Goal (MDG) is to reduce by half the prevalence of
poverty and child malnutrition before the year 2015. The mergence of poverty and
malnutrition into one and the same goal must rest on a conviction that they are intimately
connected. Ample empirical support for this presumption has been offered in the
empirical literature, based mainly on multiple cross-country (panel) regressions. In these
investigations, per-capita income differences explain 50-60 per cent of the variation in
child stunting (and underweight).1
Three main structural linkages from income to child stunting have been identified.
The first is that with higher incomes, households can (on average) exert stronger effective
demand for essential private consumption goods, including more and nutritionally richer
food and health care [Svedberg 2000]. The second is that with higher income, demand for
education increases, which in turn affects peoples’ preferences and behaviour, including
desired family size and fertility [Smith et al. 2003]. The third is that higher household
per-capita incomes tend to go hand in hand with higher government revenues and
expenditures. To the extent that these expenditures finance public consumption and
investment in health- and nutrition-related services, child nutritional status should be
positively affected [Sen 1998].
In this paper, I will investigate the determinants of child malnutrition on the basis
of data from states within a country, incorporating income and poverty and most other
explanatory variables included in earlier studies. To the best of my knowledge, this is the
first time a study aimed at disclosing the reasons for child malnutrition is based on data at
1 See for instance Svedberg [2000; 2004], Smith and Haddad [2002 and Haddad et al. [2003].
2

this level of aggregation. The hope is that the ensuing results will add to our
understanding of the complex nexus of determinants of child malnutrition.
For a number of reasons, India is the country to be studied. First, India is home to
about one-third of all pre-school children in the world who are malnourished as measured
by being stunted and/or underweight [WHO 2006]. The most recent Indian survey (from
1998/99) shows 57 percent of the children aged 0-3 year to be either severely or
moderately stunted and/or underweight [Nandy et al. 2005]. Only a few, much smaller,
developing countries have a higher incidence of child malnutrition [Svedberg 2006]. The
prevalence of child malnutrition in India, as measured by the proportion of children aged
0-3 years who are stunted, remained unaltered over the “shining” 1990s [Svedberg 2006].
This means that new policy initiatives are needed for the MDG to be attained, not only in
India, but also at the global level considering the weight populous India carries.
Second, India is probably the only large country with widespread child
malnutrition for which sufficiently reliable and disaggregated data are available. The
superior statistical data gathering in India goes a long way back in history and further
improvements were undertaken during the British Raj era [references]. Also in the hay-
days of five-year plans and heavy state interventions in post-colonial India, strong
emphasis was placed on data collection. India is probably alone among developing
nations to have conducted decadal nation-wide population censuses for more than a
century (since 1871). The National Sample Surveys (NSS), monitoring household
consumption and a vast number of other variables, now in the 60th round, are also unique
among developing countries.
3

Third, the inter-state variation in child malnutrition in India, as well as in most of
the variables to be used as regressors, is large. This variation is essential for the
possibility to derive strong and robust results. We can hence exploit the fact that the
states have considerable political and policy autonomy. A further advantage with the
Indian state data is that variables are estimated with uniform definitions and methods,
which is seldom the case in cross-country data sets.
There are some limitations of the study that should be mentioned upfront. One is
that stunting will be used as the only measure of child malnutrition. The main reason is
that stunting is the most sensitive marker of long-term, persistent nutrition and health-
care deprivation among children, the concern here. A further reason is to save space.
However, there is high overlap between stunting and underweight in Indian children. In
the 1998/99 survey, 75 per cent of the underweight children were also stunted and 78 per
cent of the stunted children were underweight as well [Nandy et al. 2005]. To constrain
the analysis to stunting will therefore hopefully not lead to much loss of information. A
second limitation is that the study will be confined to 0-3 year olds; a restriction dictated
by the fact that this was the age group covered in the 1998/99 survey. A third limitation is
that the analysis will focus on rural and urban children in combination and females and
males jointly. The data would in most instances allow separate analysis for rural and
urban areas and by gender, but this will not be done here ⎯ mainly in order to
economise on space.2
2 See Svedberg [2001], Gaiha and Kulkarni [2005] and das Gupta et al. [2005] for recent attempts to explain gender disparities in child malnutrition in India.
4

2. THEORETICAL FRAMEWORK
The subsequent empirical analysis will take as its theoretical foundations standard
economic consumption theory and various theories linking child nutritional status to
(female) education and to the health environment and health care provided to children.
The empirical results reported in earlier cross-country investigations of determinants of
child malnutrition are a further source of inspiration.
2.1. Income poverty
Consumption theory identifies income and the relative price of food as the chief
determinants of households’ effective demand for food. For the average Indian
household, food comprises about half of total consumption expenditures and nearly three-
fourths in the lowest income quartile [Sen and Himanshu 2004]. Per-capita real income is
hence one of the variables that should affect households’ ability to afford a quantitatively
sufficient and qualitatively adequate diet. At the state level, however, the share of
households that can afford a nutritionally appropriate diet is also influenced by the
distribution of incomes. Further, if the relative price of food differs markedly across
states, this should also have a differential effect on the affordability of food and, hence,
the nutritional status of children.
The consideration of food-price differentials is complicated by the fact that some
households are net producers of food and others are net consumers. When producer and
consumer food prices move in tandem, higher food prices will be beneficial to producers
and detrimental to consumers. Urban households are almost by definition net consumers
of food and so are most of the poorest households (many landless) in rural areas
5

[Ravallion 2000; Gaiha and Kulkarni 2005]. Previous studies have found that “mean
[food] consumption is strongly and negatively correlated with the relative price of food
(the simple correlation coefficient with the relative price of food over the 24 survey
rounds is 0.82)” in India [Datt and Ravallion 1998:77]. We will hence proceed on the
assumption that the majority of the poor households are net consumers of food. This
means that we expect a positive correlation between child stunting and the relative price
of food.3
Household income (and distribution) also affects the demand for (child) health
care. India is special in the sense that about 75 per cent of all health expenditures are
private, out of the pocket, a higher proportion than in almost all other 192 countries for
which the WHO provides estimates (AT 2). The share of total government expenditures
allocated to the health sector (3.9 per cent) is lower in India than in all but five other
countries. We should thus expect a positive correlation between household per-capita
income and demand for child health care across states.
2.2. Female education and status
There are at least two theoretical reasons for expecting female literacy to enhance child
nutritional status. One is that literate women are in a better position to acquire and apply
knowledge about appropriate child health-care and nutrition practices [Webb and Block
2004]. The other is that educated women (i.e. at least being literate) marry later and
desire fewer children [Barro 1997], opting for child “quality” rather than “quantity”, a
3 Ideally, one should also take the effect on the demand for food of taxes and subsidies. In a country where
the government intervenes heavily in producer and consumer food markets this may be an important factor
to consider. However, the lack of data hinder the inclusion of a variable that captures this in the regressions.
6

notion going back to Becker [1981]. Reduced fertility may also improve the nutritional
status of children since parents (for given income) can afford to spend more resources on
each child, including time for individual care. In the following we will try to separate the
knowledge effect of female education from the demographic effect by entering female
literacy and fertility rate as two alternate explanatory variables.
Female status, although difficult to define and measure (see below), within the
household as well as in society, is another variable that has been hypothesised to affect
child nutritional wellbeing [Smith et al. 2003]. The main hypothesis is that females
(mothers) have different preferences than males (fathers), i.e. that mothers are more
inclined to allocate scarce household resources in favour of children than their husbands.
Consequently, one should expect that the stronger the bargaining power (status) of
females is, relatively more resources are devoted to child welfare ⎯ and the lower the
prevalence of child malnutrition.
2.3. Health environment and public child health care
That poor health and illness in children affect their nutritional status negatively ⎯ as
manifested in growth retardation ⎯ has been understood since long [Scrimshaw et al.
1959]. There are three main links from illness to loss of weight and stunted growth in
children. One is that the child’s food intake is reduced due to loss of appetite (most
diseases). A second is that disease reduces the amount of nutrients effectively absorbed
by the body (e.g. diarrhoea and intestinal parasites). A third is that many diseases
increase the child’s energy expenditures in the form of heat generation (all fevers).4
4 See Svedberg [2000:200-04] for a more elaborate summary.
7

The prevalence of ill health among children is mainly dictated by the general
health environment in which they live and the quantity and quality of the health care they
receive. The health environment is determined at both the micro and the macro level. The
micro-environment is mainly related to household resources (income) in the form of
housing, water supply and sanitation, but also to public provision of infrastructural
services at the communal level.
The macro environment is partly determined by the prevalence of disease vectors
(such as malaria) and partly by public preventive health care provision [das Gupta 2005].
Public child health care is a function of government total health expenditures, its spatial
distribution and between preventive and curative activities ⎯ and the extent to which
health care is directly provided to children rather than other segments of the population.
The one-quarter of total health care that is financed by (mainly) state governments one
would presume to be related to the per-capita State Domestic Product (SDP) and tax
revenues. To the extent that the public health-care expenditures are directed towards
children, their health and nutritional status should improve, leaving fewer children
stunted.
3. VARIABLE DEFINITIONS AND DATA
3.1. Malnutrition and stunting
In this paper, child malnutrition will be proxied by stunting on the notion that stunting is
the best available ⎯ although not perfect ⎯ marker of prolonged deprivation of
nutrients and health care. The data on child stunting are from the second Indian National
Family Health Survey (NFHS-II) undertaken in 1998/99, as processed and reported by
8

the WHO [2006].5 The survey is national and separate data are reported from the 15
largest Indian states with about 96% of the population. The age group covered is 0-3 year
olds and the estimates are based on the internationally applied height-for-age
WHO/NCHS norms. Stunting is defined as a height for age below 2 standard deviations
from the median of the heights of the norm children.
3.2. Income poverty
The official poverty estimates from the Indian states capture differences in per-capita
household income, income distribution and relative price level. The unusual property
with these estimates is that they are derived using state-specific poverty lines that take
differences in the price level into account. Relative prices, in turn, are mainly reflecting
differences in food prices, as food has a weight of between 60 and 70% in the states’
consumer price indexes [reference]. The poverty estimates are based on the 1999/00 NSS
(large round) consumption expenditure survey. Income poverty, defined as the percentage
of the population whose per-capita income falls below the state-specific poverty line, will
hence constitute the benchmark income variable in the estimates of the impact on child
nutritional status.
There is also the question of gross and net incomes, considering taxes and
subsidies. Poor households in India pay practically no income taxes and few other taxes
[Reference in Asian Economics 2005]. However, food price consumption subsidies for
the poor have a long tradition in India [das Gupta et al. 2005]. The federal Indian
attempted to improve child welfare through doubling the size and funding of the
Integrated Child Development Service (ICDS) program during the 1990s. At the end of
TP
5 A new national survey is underway (2005/06), but the results will not be due until 2007 at the earliest.
9

the decade, it covered almost two-thirds of the about 600 000 Indian villages. The inter-
state coverage of this program varies considerably, however, and this could be a
contributing factor behind the differences in child stunting.
3.3. Female education and status
Female literacy is one of the many variables for which data are collected in the decadal
population censuses. The estimates from the latest census (2001) have been criticized for
being derived with methods that over-estimate female literacy [references]. However,
here we are primarily interested in inter-state differences and to my knowledge, the same
estimation method was used all over India, hopefully leaving the differences across states
reasonably unbiased.
In previous attempts to examine whether “female status” in society has an impact
on the nutritional and health conditions of young children, several proxy variables have
been suggested. Examples include male/female (M/F) population ratio, male/female
literacy rates, male/female life expectancy and various composite indexes (such as the
Gender Disparity Index from the GOI [2002]). Since each of these measure are indicators
of different dimensions of female status or empowerment, while none is comprehensive,
it is basically an empirical matter to find out which indicator has the strongest bearing to
child malnutrition (if any at all). The preliminary consultation of the data suggested that
the M/F population ratio is the variable to use as the benchmark.6 Subsequently,
robustness tests using other proxy variables for female status will be undertaken.
6 The M/F ratio in a population is mainly determined by differences in sex-specific death rates for different
age cohorts and the sex ratio at births. A higher than normal M/F ratio in the population at large reflects
10

3.4. Health environment and public child health-care provision
The micro-level health environment faced by children in different states should be
adequately captured by the poverty estimates. The macro-level environment will be
proxied by the relative incidence of malaria, the only disease for which the spatial
distribution in India is mapped in some detail. Malaria is, however, the worst killer
disease among children in South Asia (and tropical Africa) [WHO 2005]. Moreover,
malaria is correlated to other tropical diseases and should hence constitute the best
available ⎯ although not perfect ⎯ proxy for the macro-level health environment faced
by children.
Direct measures of public health care provided to children in the Indian states are
hard to come by. The data on public expenditures on health in the individual states do not
disentangle health care for children and the population in general, or what ill-health
conditions are prioritised [GOI 2002]. As a benchmark measure of child health-care
provision, we will use the share of births that takes place in medical institutions. The
underlying presumption is that there is a considerable overlap between this variable and
health care provided to young children in general. Subsequently, we will use alternate
proxy variables for child health-care provision in the robustness tests.
higher than normal deaths of females in the wake of discriminatory treatment in health care and nutrition. A
higher than normal M/F ratio at birth reflects mainly sex-selective abortions, but also sex-selective
infanticide. Sudha and Rajan [1999] estimated that about 10 per cent of all female foetuses were aborted in
India in the early 1990s (with large differences across states).
11

The average and the min and max values for the variables to be inserted in the
first round of regressions are presented in Table 1. The table reveals large inter-state
variations in all the variables. Stunting ranges from 22 to 56 per cent and poverty is
almost eight times more prevalent in Orissa than in Punjab. The estimated female literacy
rate ranges from 35 per cent in Bihar to 93 per cent in Kerala. The fertility rate also varies
considerably, from below replacement rate in Kerala (1.8) to well above 4 in Bihar and
Uttar Pradesh. The M/F population ratio is 1.16 in Haryana while 0.95 in Kerala and the
health-care proxy variable (the share of births delivered in medical institutions) ranges
from 15 per cent in Bihar to 93 per cent in Kerala. All variable estimates are from a year
in the 1999-2001 period.
[Table 1 about here]
4. REGRESSION RESULTS
In this section, we report the results from a sequence of regressions aimed at identifying
the main proximate determinants of the large inter-state differences in child stunting in
India, as estimated in the national 1998/99 survey. In the first round, we will present
bivariate regressions between child stunting and the main explanatory variables.
Subsequently, a series of multiple regressions will be carried out, with due regard to the
fact that some of the explanatory variables are internally inter-related ⎯ so as to avoid
spurious results because of multicolinearity. In the next round of regressions (section 5),
we will try to identify the underlying factors that determine the variables with the largest
direct impact on child stunting. Various sensitivity and robustness tests are conducted in
section 6.
12

4.1. First round of bivariate regressions
The bivariate correlation across the 15 largest Indian states between the prevalence of
child stunting and each of the proximate explanatory variables identified in the theory
section are reported in Table 2. The association between the incidence of stunting and
income poverty turns out statistically insignificant. This means that if income poverty is
an important determinant of child nutritional status in India, the impact must be indirect.
The pathways to be explored later (in section 5) are from household income poverty to
female literacy (and concomitant fertility change) and (privately financed) child health-
care provision.
[Table 2 about here]
Child stunting is negatively and strongly correlated to female literacy in a
bivariate regression and even more so to the fertility rate. These findings provide a
preliminary indication that the main impact of female literacy on child stunting goes
through reduced fertility, rather than through better knowledge of child health-care
practices. Child stunting is also significantly associated with female status (as proxied by
the M/F population ratio) with the expected sign (Table 2).
The provision of child health care, as proxied by the share of births in medical
institutions, turns out to have the strongest direct link to child stunting. In fact, this
variable alone “explains” 92 per cent of the inter-state variance in child stunting. The
strength of this correlation is further demonstrated in Figure 1, which shows that not a
single Indian state can be identified as being an outlier. If this result survives the
inclusion of other explanatory variables in the regressions and the various robustness tests
13

to be carried out, it will be an important marker of what policy initiatives that are
required for alleviating child malnutrition in India.
[Figure 1 about here]
4.2. Interdependence between explanatory variables
There is interdependence between some of the explanatory variables used in the bivariate
regressions, but household income poverty is not significantly associated with any of the
other explanatory variables (Appendix Table 1).7 The fertility rate is highly correlated to
female literacy in accordance with expectations. Somewhat surprisingly, the female
literacy rate is not associated with the proxy used for “women status” in society, the M/F
population ratio. The child health-care-provision variable is significantly associated with
all the three other explanatory variables. To include health care and these other variables
in one and the same multiple regression could hence lead to spurious results.
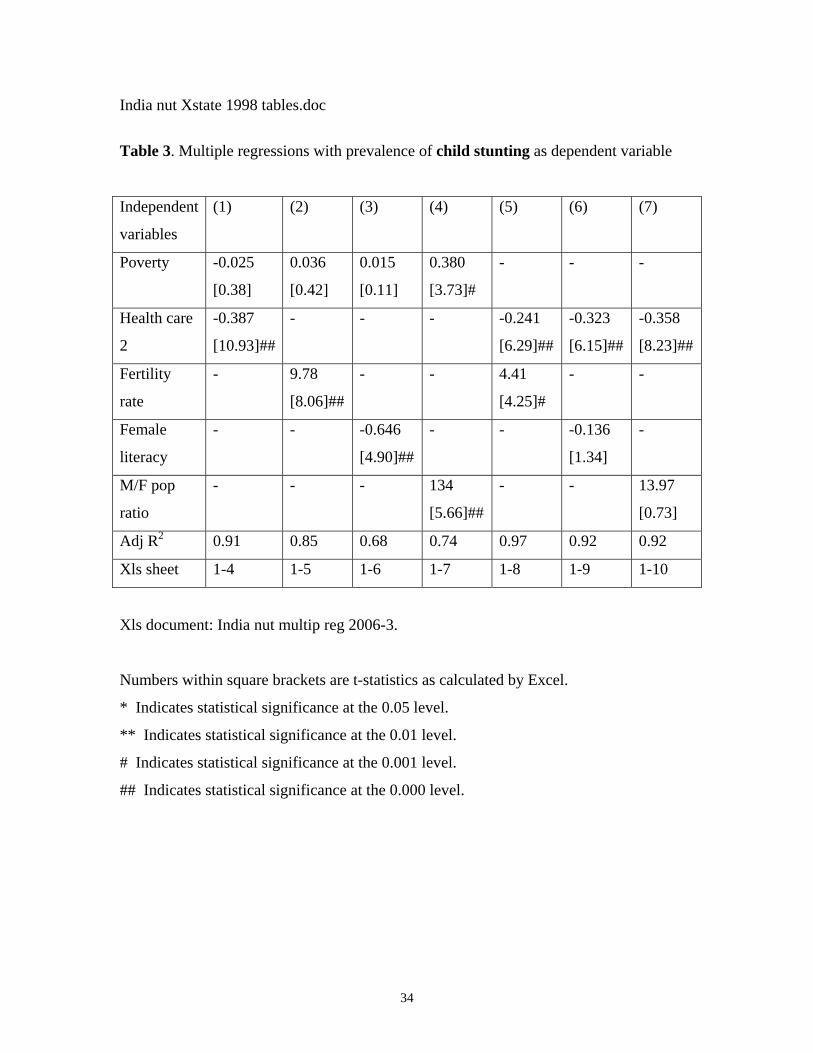
4.3. Multiple regressions with child stunting as dependent variable
In order to check whether the insignificant bivariate correlation between the prevalence
of stunting and poverty across the Indian states is confounded by the other explanatory
variables, poverty and each of these were included in the next round of regressions (Table
3, column 1-4). In three out of four regression, the poverty variable remained
insignificant; only in combination with the M/F population variable did poverty turn out
7 The simple correlation between female status (F/M population ratio) and household per-capita income is
insignificant at the 0.05 level. This may seem puzzling, but follows from the observation that the female
disadvantage tends to be the highest in the poorest and the richest Indian states. A bivariate polynominal
regression aimed at capturing this non-linearity turns out highly significant.
14

significant. It hence seems that poverty is not a significant and robust determinant of
child stunting in India, at least not through its direct impact. In the subsequent regressions
(5-7), poverty was hence dropped.
[Table 3 about here]
The child health-care-provision variable is the most closely related to child
stunting also in the multivariable regressions. In combination with female literacy and the
M/F ratio, the latter two variables lose significance, while the health-care variable
remains significant at the 0.000 level. The health-care variable also comes out highly
significant when entered in combination with the fertility rate; actually, the two variables
jointly “explain” 97 per cent (R2-adjusted) of the variation in child stunting across the
Indian states. It should be recalled, though, that the health-care provision and fertility
variables are significantly associated. This means that the result in column (5) must be
interpreted cautiously. Nonetheless, the earlier bivariate correlation between stunting and
the health-care variable alone was almost as strong (also see Figure 1).
5. EXPLAINING HEALTH CARE AND FERTILITY
All in all, on the basis of what has been found so far, it is difficult not to conclude that the
variation in child health-care provision is the main proximate determinant of differences
in child stunting across the Indian states ⎯ with differences in fertility in second place.
In this section we shall therefore make an attempt to explain what underlies the inter-state
variations in these two variables.
5.1. Explaining child health-care provision
15

As noted, on average, about three-fourths of all health expenditures in India are out of the
households’ pockets and only one-fourth is financed by governments, mainly at the state
level. One would hence expect private health expenditures (demand) to be related to
household per-capita income (and hence the prevalence of poverty). Government health
expenditures have to be financed by government revenues that, in turn, are expected to be
related to per-capita State Domestic Product (SDP).
Results from bivariate regressions with child health-care provision as the
dependent variable are reported in Table 4. All four regressions turn out significant with
the expected signs. The bivariate regression is the strongest for government health
expenditures, measured in rupees per capita. Government health expenditures, in turn, are
closely correlated to per-capita SDP (and hence government revenues) as expected.
[Table 4 about here]
State governments’ allocation of funds for health care and the distribution of the
health expenditures between various end uses are not carried out in a political and social
vacuum. It does not seem too farfetched to assume that the priority given to child health
care is a function of the relative clout of women in society. That is, in states where a
higher proportion of women are literate and less subjugated, child health-care provision is
more likely to be prioritised.
The results from multivariable regressions aimed at testing this proposition are
reported in Table 5. Controlling for differences in household per-capita income and in
government health expenditures, both female literacy and M/F ratio turn out highly
significant, in separate regressions as well as in the ones where they are entered jointly.
(It should be recalled that female literacy and the M/F ratio are internally unrelated; cf
16

AT 1). Household per-capita income and women status together explain more than 90
per cent of the inter-state variation in child health-care provision. Household income
presumably captures the affordability of child health care, while mothers’ “status”
reflects the priority given to child health.
[Table 5 about here]
5.2. Explaining fertility
The fertility rate varies more (in relative terms) across the Indian states than most of the
other explanatory variables for child stunting, from 1.8 in Kerala to 4.9 in Uttar Pradesh
(Table 1). The bivariate correlation between child stunting and fertility reported earlier
was very strong. In bivariate regressions with the fertility rate as dependent variable, the
correlation with female literacy carries the most weight, while the bivariate correlation
with poverty is insignificant (Table 6).
[Table 6 about here]
The results from a string of multivariable regressions with the fertility rate as the
dependent variable are reported in Table 7. Again, female literacy emerges as the most
highly significant and robust explanatory variable for fertility. /Add cultural and religious
characteristics/
[Table 7 about here]
6. SENSITIVITY AND ROBUSTNESS TESTS
The results derived here may be sensitive to the choice of measurements and proxy
variables. They may also be biased by the omission of variables that have been found to
17

have a bearing on child malnutrition in previous investigations. It is also feasible that
some correlations are affected by reverse causality. In this section, we shall take a closer
look at these potential sources of bias.
6.1. Alternative measures of explanatory variables
Income poverty. The official poverty estimates from India used in our regressions have
been criticised by a number of scholars. The critique has been focused on the fact that
changes in survey design between rounds have compromised comparability over time.
Since we have relied on one survey only (from 1999/00) inter-temporal comparability is
not an issue here. However, the alternative state-specific poverty estimates derived by
various scholars also differ somewhat from the official estimates. We therefore reran all
regressions with three sets of alternative poverty estimates,8 but nothing of substance
changed. (These results are not reported here due to the space constraint, but are available
from the author on request.)
The lingering scepticism concerning both the official and the alternative poverty
estimates in India [Popli et al. 2005] motivates additional regressions of child stunting on
the three building blocks underlying the poverty estimates: per-capita income, income
distribution and relative price level. Again, nothing of substance changed. The only
notable result is that income distribution (measured alternately with the 20%-richest to
the 40%-poorest per-capita income ratio and Gini) turned out as a significant, but not
very robust, regressor for stunting. Per-capita income and (food) price level differences
turned out insignificant.
8 From Sen and Himanshu [2004], Deaton and Dréze [2002] and Popli et al. [2005], respectively.
18

Child health-care provision. The two alternative proxy variables for child
health-care provision are the share of births attended by professionals and the share
children aged 12-23 months who are fully vaccinated.9 The share of births attended by
health professionals is highly correlated to the share of births in medical institutions and
changes nothing. The share of children vaccinated is also strongly, although less so,
correlated to births in medical institutions (Table 8). This is a vindication that both these
proxy variables reflect reasonably well what they intend to measure here: the provision of
child health care in general. /I have yet to rerun core regressions with vaccination as the
health-care proxy./
[Table 8 about here]
Female status. A limitation with the M/F population ratio as an indicator of
female status is that it is influenced by migration, although this does not seem to be a
major problem for internal migration. On the basis of the 1991 population census, Lucas
[xxxx] found that only a minuscule share of registered migration are over state borders
and that migration is rather evenly distributed among males and females. External
migration is more of a problem. Kerala has the lowest M/F population ratio (0.95) in
India (averaging 1.07), much a consequence of the fact that males in Kerala migrate to
Middle Eastern and other foreign countries in proportionally much larger numbers than in
other Indian states.
As one of two alternative proxy measures of female status, we use the M/F ratio at
births. While the M/F ratio in the entire population reflects several decades of
9 Children are fully vaccinated if they have received BCG, measles and three doses of DPT and polio
vaccine [GOI 2002: tab 5.36].
19

“accumulated discrimination” of women, the M/F ratio at birth is probably a more
adequate indicator of contemporary gender bias. That is, in states where females are the
most subjugated, a larger share of female foetus are aborted or victims of infanticide
[Sudha and Rajan 1999; GOI 2002]. The other alternative variable is the M/F literacy
ratio among 7-14 year olds, which should be a sharper indicator of the present status of
women than the commonly applied M/F literacy ratio of the entire 7+ generation.
The inclusion of the M/F birth ratio as an alternative measure of the relative
position of females in the regressions did…../yet to be carried out/. The use of M/F
literacy in the 7-14 age cohort……/I have not been able to access the data from the 2001
census, only the 1991 [UNDP 2002: table 4.7].10
6.2. Omitted variables
There are at least two relevant variables for which data are available and could have been
included in the regressions but were not. One is the federal government provision of
support to children in the different states through the Indian Child Distribution System
(ICDS). That no results for the impact of the ICDS program on child malnutrition are
reported is because there is an unresolved problem with reverse causality. A recent
evaluation of this program concluded that it “has had very little apparent impact on
aggregate child nutrition levels” (das Gupta et al. [2005]; also see Kochar [2005]). The
main reason is that the “states with the highest prevalence of child malnutrition have the
10 In populations with no strong sex-preferences of children, the M/F ratio at birth is around 1.05. In India
as a whole it was 0.94 in 1991 (the latest year for which I have data), signifying that up to 10 per cent of
female foetus and neonatal infants are aborted or fall victims of infanticide [GOI 2002: tab 5.24]. The M/F
birth ratio varies across states, from 0.85 in Punjab to 0.97 in Andhra Pradesh.
20

lowest coverage of the program and receive the least funding for it”. To include the state-
wise allocations from the ICDS in our regressions would hence produce a negative
correlation with causality running from low levels of child stunting to large receipts of
ICDS funds, rather than the other way around.
The other variable that could have been included, but was not, is the nutritional
status of adult females (mothers), as indicated by the prevalence of underweight
(BMI<18.5). Maternal malnutrition may have inter-generational effect on child
nutritional status through various channels. That no results for the women BMI status and
child stunting are reported is because the preliminary findings turned out inconclusive.
/Perhaps more in next version/
Some other variables have been omitted because no appropriate data could be
found at the level of states in India. In a few cross-country regressions of child stunting,
as well as within-country investigations, with households as the unit of observation, the
provision of various local-community public services, such as safe water supply and
adequate sanitation, have been found to impact child nutritional status. 11 The prevalence
of low birth weight is yet another factor related to stunting (Osmani [1997] and Osmani
and Sen [2003]) for which I have yet to find useful data at the state level in India.
11 There are estimates from the individual states on the share of households with access to “safe drinking
water” [GOI 2002: tab 3.6-7], but there is something odd with the definition of “safe”. Kerala is found to
have the lowest share of households with safe water (19 per cent) compared to about 60 per cent in Bihar
and Uttar Pradesh. All health indicators tell a different story. On closer inspection, it turns out that the
traditional pucca wells that predominate in Kerala are classified as “unsafe”. Whether these wells provide
safe water or not depends on how they are maintained (as with most sources of water supply).
21

Another possible reason for inter-state variation in the prevalence of child
stunting in India, not considered here, is differences in the micro-nutrient content of (the
predominantly vegetarian) local staple diets. In at least one cross-country investigation it
was found that the share of calories emanating from micronutrient-rich animal sources is
correlated to lower incidence of child stunting net of other influences [Svedberg 2004].
There is also mounting empirical evidence showing that even moderate malnutrition in
lactating mothers lowers the micronutrient content in their breast milk, affecting infant
and young child growth adversely [Allen 2005]. In the absence of detailed data on the
micro-nutrient content in local diets, the “micro-nutrient” hypothesis could not be tested
on state data in India.
The inter-state differences in cultural traits, dominance of different religions and
caste hierarchies ⎯ and also in the share of scheduled and tribal populations ⎯ have
also been neglected in the regression exercises. It may well be that these variables have
bearings on women status, female literacy, and fertility and ⎯ in the end ⎯ on child
health and stunting. /look for data/
The exclusion of the above mentioned (and possibly other relevant) variables in
our inter-state regressions may have induced omitted variable bias.12 However, with the
variables included, about 90 per cent of the variation in child stunting has been explained
by differences in the provision of child health care. This result seems robust to alternate
measures of health care provision and there is little reason for expecting reverse causality
12 Investigations based on household as the unit of observation, have found additional factors that have a
baring on child nutritional status (e.g. Borooah [2002; 2005], Haddad et al [2003]; Gaiha and Kulkarni
[2005], das Gupta et al. [2005]).
22

(see below). Moreover, above 90 per cent of the variation in the health-care variable was
explained by variations in household per-capita income and the relative status of women.
With such high explanatory power, the most important explanatory variables have likely
been identified. Including additional variables would probably not add much value and
invite problems with multicolinearity. With only 15 observations (states) we also face the
constraint imposed by limited degrees of freedom.
6.3. Outliers
In many of the regressions, the same states appear as outliers. Kerala is the case in point
on the “positive” side of the regression lines, but also Tamil Nadu in some cases.
Haryana and Punjab are often found on the “negative” side; their relative economic
prosperity is not matched by high accomplishments with regard to female literacy and
“status”, or in terms of child health-care provision and child stunting. However, in the
regressions with the strongest results ⎯ with statistical significance at the 0.000 level
and an adjusted R2 around 0.90 ⎯ there are obviously no “disturbing” outliers.
6.4. Reverse causality?
The main finding here ⎯ that health-care provision to children is the major determinant
of child nutritional status ⎯ could be challenged on the notion that the strong correlation
reflects (fully or partly) the reverse order of causation. That is, health-care provision is
systematically directed to the states with the lowest prevalence of child malnutrition. Had
it been that most health-care provision were financed by a cynical federal government
with no concern whatsoever for child welfare, one might expect government money to
23

trail other political objectives than child needs, but this is not the case. Three-quarters of
all health-care expenditures in India are privately financed and most of the rest by local
state government agencies.
Higher incomes normally mean higher demand for female education. However,
female education (as well as for men) is also a determinant of income growth. Numerous
cross-country studies aimed at identifying the driving forces behind economic growth
find human capital, i.e. education and knowledge, to be one of the strongest explanatory
variables (see Temple [1999] for a literature review). There may be causal effects in both
directions, but this does not pose a major problem in the present context. If there is a
feed-back effect ⎯ from female literacy to higher income ⎯ so much the better when
child malnutrition is the concern.
There is little theoretical reason to expect that the causation runs from fertility to
literacy. At the level of individuals, literacy is almost universally accomplished during
school-age years, while child birth takes place later in life. That women status, as
measured by the M/F population ratio, should be determined by child health-care
provision or the share of stunted children, also seems unlikely.
7. RECONCILING RESULTS WITH CROSS-COUNTRY FINDINGS
The perhaps most striking difference between the results derived here on the basis of data
for Indian states and those derived on cross-country data is the less prominent role of per-
capita income as a proximate variable in explaining child stunting. Although a thorough
analysis of why this is the case has to await future study, one can list a few plausible
hypotheses. The first is that over large cross-sections of countries, the variation in per-
24

capita income is much larger than the equivalent difference within India. In cross-country
data panels, income per capita often differs by a factor of 10; across Indian states, the
ratio is 2.2.
Second, in previous attempts to identify the main determinants for child
malnutrition on the basis of cross-country data, the income variable used is per-capita
GDP (or GNI).13 The main reason why this rather blunt measure of “poverty” has been
used is the lack of comparable estimates of poverty at a given point in time for large sets
of countries. From a methodological point of view, the use of state-specific poverty
estimates in India that are derived in a coherent and uniform way seems a major
advantage. That the state-specific poverty lines reflect food price differences is a further
advantage.
A third reason could be that household consumption expenditures (the income
variable underlying the poverty estimates used here) only account for less than 45 per
cent of all incomes included in the Indian national accounts. 14 There is, however, large
variation within India, from 34 per cent in Maharashtra to 91 per cent in Bihar.
However, the weak direct link from poverty to child stunting revealed by our
findings does not imply that income levels (or distribution) are unimportant for child
nutritional status in India. Household per-capita income ⎯ jointly with the relative status
of women ⎯ was found to explain above 90 per cent of the inter-state variation in child
health-care provision.
13 Among recent studies are Svedberg [2000, 2004], Smith and Haddad [2002], Smith et al. [2003] and
Haddad et al. [2003].)
14 Roughly 65 per cent of the Indian GDP comprise private and government consumption [RBI 2003] and
yet another 65 per cent of total consumption is private and covered in the household surveys [Sen 2001].
25

The variable that turned out as the strongest determinant of child nutritional status
in this investigation ⎯ health care provision for children ⎯ has not been captured in
any previous study that I know of. The most commonly used health-proxy variables are
the number of people per physician or nurse and the distance to the nearest health clinic.
Neither of these indicators measure the actual provision of health care for children
specifically; they only reflect health-resource availability and accessibility in general.
Moreover, these proxy variables have been completely dominated by per-capita income
in the cross-country investigations.
Several of the other results derived in this study merely corroborate findings in
earlier investigations based on data at different levels of aggregation. The prominent role
of female literacy and fertility for explaining stunting is one example [Osmani 1997]. On
the basis of household-level data Horton [1988] and Gaiha and Kulkarni [2005] found
that children with third and higher birth orders are more frequently stunted than their
older siblings.15 Smith et al. [2003] also found that in countries/societies where women
have miniscule or no education, little voice in decision making, and are subjugated in
most ways of life, children fare especially bad. However, in this study we have made a
more concerted effort than in most earlier studies to control inter-dependence between
explanatory variable ⎯ so as to avoid spurious results due to multicolinearity. This
should render the results some credibility.
15 See Borooah [2002] for a recent summary of this literature.
26

8. SUMMARY AND POLICY CONCLUSIONS
The major findings in this paper are two-fold. The first is that the variance in prevalence
of child stunting across the Indian states is strongly correlated to the health care provided
to children. The second is that child health-care provision is mainly determined by
household per-capita income and the relative status of women. Both results are robust to
the use of alternative measures of health-care provision and female status and are
unlikely to reflect reverse causality.
The health-care variable is not only highly significant; the correlation coefficient
suggests that a higher coverage of child health care has a substantial quantitative effect on
the incidence of child stunting (also see Figure 1) A simple simulation exercise suggests
that if the child health-care provision in the seven states where it is presently below the
median, was brought up to this level (37.5 per cent), the prevalence of child stunting in
all-India would be reduced by about 9 per cent (or by 3.9 percentage points). This would
not bring an end to child malnutrition, but considering that the prevalence of child
stunting in India remained unaltered over the 1990s [Svedberg 2006], a decline of
magnitude is not negligible.
From a broader policy perspective, the findings in this paper indicate that there
are no simple remedies for alleviating child malnutrition in India over the short term. The
many intertwined links through which child stunting apparently is affected, means that no
single policy measure can be expected to be the panacea. That high economic growth is
not sufficient (although pro-poor growth is most likely necessary) for reducing child
malnutrition is suggested by the insignificant correlation between child stunting and
levels of per-capita income across the states. The overall high growth of per-capita NDP
27

over the 1990s in India was paired with deteriorating income inequality in all dimensions,
the inter-state, the rural-urban, the within rural, the within urban, and across households16
⎯ most probably the main reason why child stunting did not decline.
The findings reported here suggest that a complex combination of policy
interventions is required, focused on income growth that involves the poor population
segments, female education, fertility reduction and ⎯ as a more short-term policy ⎯
extended provision of high-quality health-care for young children. That the federal Indian
government has limited juridical and financial power over health-care provision in the
states is an obstacle for concerted action at this level, but an overhaul of the inefficient
federally financed ICDS program [das Gupta et al. 2005] would be a welcome initiative.
The entrenched cultural traits that lie behind the subjugation of females in large parts of
rural and urban India can be expected to change only in the long term.
16 See for instance: Sen and Himanshu [2004], Deaton and Dréze [2002] and Datt and Ravallion [2005],
and Svedberg [2006] for more details on the inter-linkage between economic growth and persistent child
stunting in India during the 1990s.
28

References (incomplete)
Allen, L (2005): ‘Multiple Micronutrients in Pregnancy and Lactation: An Overview’,
American Journal of Clinical Nutrition, 81 (supplement).
Becker, G (1981): A Treatise on the Family, Cambridge: Harvard University Press.
Borooah, VK (2002): ‘The Role of Maternal Literacy in Reducing the Risk of Child
Malnutrition in India’, Mimeo, University of Ulster.
⎯ ⎯ (2005): “The Height-for-Age of Indian Children”, Economics and Human Biology
3.
Das Gupta, M (2005), ‘Public Health in India: An Overview”, World Bank Policy
Research Working Paper 3787 (December).
Das Gupta, M, M Lokshin, M Gragnolati and O Ivnaschenko (2005): ‘Improving Child
Nutrition Outcomes in India: Can the Integrated Child Development Service
Program be More Effective?’, World Bank Policy Research Working Paper 3647
(June).
Datt, G and M Ravallion (1998): ‘Farm Productivity and Rural Poverty in India’, Journal
of Development Studies, 34.
⎯⎯ (2005): ‘Is India’s Economic Growth Leaving the Poor Behind?’, Journal of
Economic Perspectives (forthcoming).
Deaton, A and J Dréze (2002): ‘Poverty and Inequality in India: A Re-Examination’,
Economic and Political Weekly, 37 (Sep 7).
Gaiha R, and V Kulkarni (2005): ‘Anthropometric Failure and Persistence of Poverty in
Rural India’, International Review of Applied Economics,19(2).
Government of India (2002), Human Development Report 2001. Planning Comission:
New Delhi.
Haddad, L, H Alderman, S Appleton, L Song and Y Yohannes (2003): ‘Reducing Child
Undernutrition: How far does Income Growth Take Us?’, World Bank Economic
Review, 17(1).
Horton, S (1988): ‘Birth Order and Child Nutritional Status: Evidence on the Intra-
household Allocation of Resources in the Philippines’, Economic Development
and Cultural Change, 36.
29

Kochar, A. (2005): ‘Can Targeted Food Programs Improve Nutrition? An Empirical
Analysis of India’s Public Distribution Service’, Economic Development and
Cultural Change, 54(1).
Lucas (xxxx)
Nandy, S, M Kelly, D Gordon, SV Subramanian, GD Smith (2005): ‘Poverty, Child
Undernutrition and Morbidity: New Evidence from India’, Bulletin of the World
Health Organisation, 83.
Osmani, SR (1997): ‘Poverty and Nutrition in South Asia’, in Nutrition and Poverty,
ACC/SCN, Geneva.
Osmani, SR and AK Sen (2003): ‘The Hidden Penalties of Gender Inequality: Fetal
Origins of Ill-Health’, Economics and Human Biology 1.
Popli, G, A Parikh and R Palmer-Jones (2005), ‘Are the 2000 Poverty Estimates for India
a Myth, Artefact or Real?’, Economic and Political Weekly, 40 (Oct 22).
Registrar General India (2005): Health and Population Indicators’, www.censusindia.net.
Reserve Bank of India (2003): Macroeconomic Monetary Developments in 2002-03,
Mumbai.
Scrimshaw, NS et al. (1959): ‘Interaction of Nutrition and Infection ’, American Journal
of Medical Science 237.
Sen, AK (1998): ‘Mortality as an Indicator of Economic Success and Failure’, Economic
Journal 108.
Sen, Abhijit (2001): ‘Estimates of Consumer Expenditure and its Distribution: Statistical
Priorities after the NSS 55th Round’, Economic and Political Weekly 35
(December 16).
Sen, Abhijit and Himanshu (2004a,b): ‘Poverty and Inequality in India⎯I and II’,
Economic and Political Weekly 39 (Sep 18 and 25).
Smith, LC and L Haddad (2002): ‘How Potent is Economic Growth in Reducing
Undernutrition? What are the Pathways of Impact? New Cross-country Evidence’,
Economic Development and Cultural Change, 51(1).
30

Smith, LC et al. (2003): The Importance of Women’s Status for Child Nutrition in
Developing Countries, International Food Policy Research Institute, Research
Report 131, Washington DC.
Svedberg, P (2000): Poverty and Undernutrition: Theory, Measurement, and Policy,
Oxford University Press, Oxford.
⎯⎯ (2001): ‘Hunger in India: Facts and Challenges’, Little Magazine 2(6).
⎯⎯ (2002): ‘Undernutrition Overestimated’, Economic Development and Cultural
Change, 51(1).
⎯⎯ (2004): ‘Malnutrition and Hunger: An Alternative Perspective’, in: Lomborg B
(ed). Global Crises, Global Solutions. Cambridge: Cambridge University Press.
⎯ ⎯ (2006): ‘Declining Child Malnutrition: A Re-Assessment’, International Journal of
Epidemiology 35.
Temple, J (1999): ‘The New Growth Evidence’, Journal of Economic Literature, 17.
Webb, P and S Block (2004): ‘Nutritional Information and Formal Schooling as Inputs to
Child Nutrition’, Economic Development and Cultural Change, 53.
World Bank (2003): World Development Indicators, 2003, World Bank, Washington DC.
World Health Organisation (2006): Global Database on Child Growth and Malnutrition,
WHO, Geneva.
World Health Organisation (various): World Health Report, WHO: Geneva.
31

India nut Xstate 1998 tables.doc Table 1. Descriptive data for variables in first round of regressions
Variable Average value Minimum value (state) Maximum value (state)
Stunting (%) 44.9 21.9 (Kerala) 55.5 (Uttar Pradesh)
Poverty (%) 26.1 6.2 (Punjab) 47.2 (Orissa)
Female literacy (%) 54.3 35.0 (Bihar) 87.9 (Kerala)
Fertility rate (N) 3.4 1.8 (Kerala) 4.9 (Uttar Pradesh)
M/F pop (ratio) 1.07 0.95 (Kerala) 1.16 (Haryana)
Health care (2) (%) 33.6 14.7 (Bihar) 93.0 (Kerala)
Sources: WHO [2006] (stunting); GOI [2002] (other variables).
32

India nut Xstate 1998 tables.doc
Table 2. Bivariate regressions with child stunting as dependent variable
Indep var Poverty Fertility rate Female
literacy
M/F popula-
tion ratio
Health care2
(1) (2) (3) (4) (5)
B 0.322 10.00 -0.654 125.6 -0.381
[t] [1.73] [9.37]## [5.90]## [3.77]** [12.65]##
Adj R2 0.12 0.86 0.71 0.49 0.92
Xls sheet 1-4 1-20 1-41 1-5 1-7
Xls document: India nut multiple reg 2006-2.
Numbers within square brackets are t-statistics as calculated by Excel.
* Indicates statistical significance at the 0.05 level.
** Indicates statistical significance at the 0.01 level.
# Indicates statistical significance at the 0.001 level.
## Indicates statistical significance at the 0.000 level.
33
India nut Xstate 1998 tables.doc
Table 3. Multiple regressions with prevalence of child stunting as dependent variable
Independent
variables
(1) (2) (3) (4) (5) (6) (7)
Poverty
-0.025
[0.38]
0.036
[0.42]
0.015
[0.11]
0.380
[3.73]#
- - -
Health care
2
-0.387
[10.93]##
- - - -0.241
[6.29]##
-0.323
[6.15]##
-0.358
[8.23]##
Fertility
rate
- 9.78
[8.06]##
- - 4.41
[4.25]#
- -
Female
literacy
- - -0.646
[4.90]##
- - -0.136
[1.34]
-
M/F pop
ratio
- - - 134
[5.66]##
- - 13.97
[0.73]
Adj R2 0.91 0.85 0.68 0.74 0.97 0.92 0.92
Xls sheet 1-4 1-5 1-6 1-7 1-8 1-9 1-10
Xls document: India nut multip reg 2006-3.
Numbers within square brackets are t-statistics as calculated by Excel.
* Indicates statistical significance at the 0.05 level.
** Indicates statistical significance at the 0.01 level.
# Indicates statistical significance at the 0.001 level.
## Indicates statistical significance at the 0.000 level.
34

India nut Xstate 1998 tables.doc
Table 4. Bivariate regressions with Health care 2 and Government health
expenditures per capita as dependent variables
Dependent
variable
Health care 2 (share of births in medical institutions) Gov health
expend/c
Independent
variable
Poverty Household
expend/c
NSDP/C
(rupees)
Gov health
exp
(rupee/c)
NSDP/C
(rupees)
(1) (3) (2) (4) (5)
B -0.90 0.010 0.002 0.249 0.007
[t] [1.95]* [3.07]** [2.76]* [3.45]** [3.51]**
Adj R2 0.17 0.38 0.32 0.44 0.45
Xls sheet 1-42 1-13 1-12 2-18 2-35
Xls document: India nut multip reg 2006-3 (except column 1, in reg 2006-2).
Numbers within square brackets are t-statistics as calculated by Excel.
* Indicates statistical significance at the 0.05 level.
** Indicates statistical significance at the 0.01 level.
# Indicates statistical significance at the 0.001 level.
## Indicates statistical significance at the 0.000 level.
35

India nut Xstate 1998 tables.doc
Table 5. Multiple regressions results with Health 2 as dependent variable
Independent
variables
(1) (2) (3) (4) (5) (6)
Household ex-
penditures/c
0.001
[0.26]
- 0.010
[7.90]##
- 0.009
[3.79]##
-
Gov health ex-
penditures/c
- 0.133
[2.41]*
- 0.184
[3.22]**
- 0.115
[2.76]*
Female
literacy
1.154
[3.24]**
1.250
[4.23]#
- - 0.091
[0.26]
0.959
[4.00]**
M/F popula-
tion ratio
- - -310
[8.64]##
-236
[3.40]**
-300
[5.63]##
-160
[3.20]**
Adj R2 0.64 0.76 0.91 0.69 0.90 0.86
Xls sheet 2-15 2-20 2-16 2-21 2-24 2-23
Xls document: India nut multip reg 2006-3.
Numbers within square brackets are t-statistics as calculated by Excel.
* Indicates statistical significance at the 0.05 level.
** Indicates statistical significance at the 0.01 level.
# Indicates statistical significance at the 0.001 level.
## Indicates statistical significance at the 0.000 level.
36

India nut Xstate 1998 tables.doc
Table 6. Bivariate regressions with Fertility rate as dependent variable
Independent
variable
Poverty Household
expend/c
Female
literary
M/F popula-
tion ratio
Gov health
expend/c
(1) (2) (3) (4) (5)
B 0.029 -0.0003 -0.060 9.73 -0.009
[t] [1.67] [2.64]* [5.70]## [2.70]* [3.62]**
Adj R2 0.11 0.30 0.69 0.31 0.46
Xls sheet 1-21 1-36 1-24 1-23 1-26
Xls document: India nut multiple reg 2006-2 (and 2006-3 for column 5).
Numbers within square brackets are t-statistics as calculated by Excel.
* Indicates statistical significance at the 0.05 level.
** Indicates statistical significance at the 0.01 level.
# Indicates statistical significance at the 0.001 level.
## Indicates statistical significance at the 0.000 level.
37

India nut Xstate 1998 tables.doc
Table 7. Multiple regressions results with Fertility rate as dependent variable
Independent
variables
(1) (2) (3) (4) (5) (6)
Household
expend/c
-0.000
[0.40]
- -0.000
[3.75]**
- -0.000
[0.64]
-
Gov health
expend/c
- -0.005
[2.71]*
- -0.008
[3.14]**
- -0.005
[2.65]*
Female
literacy
-0.065
[3.94]**
-0.047
[4.64]#
- - -0.040
[1.79]
-0.041
[3.96]**
M/F popula-
tion ratio
- - 9.68
[3.80]**
6.60
[2.24]*
5.42
[1.62]
3.39
[1.59]
Adj R2 0.67 0.79 0.66 0.59 0.71 0.82
Xls sheet 3-29 3-30 3-31 3-32 3-33 3-34
Xls document: India nut multip reg 2006-3.
Numbers within square brackets are t-statistics as calculated by Excel.
* Indicates statistical significance at the 0.05 level.
** Indicates statistical significance at the 0.01 level.
# Indicates statistical significance at the 0.001 level.
## Indicates statistical significance at the 0.000 level.
38

India nut Xstate 1998 tables.doc
Table 8. Correlation between Health 2 and alternative variables reflecting child health-
care provision
Health 1a Vaccination
coverageb
Maternal death
rate??
??
B 0.90 0.765 -5.71
[t] [12.78]## [4.76]## [3.01]**
Adj R2 0.92 0.61 0.37
Xls sheet 1-8 1-17 1-11
Xls document: India nut multiple reg 2006-2
Numbers within square brackets are t-statistics as calculated by Excel.
* Indicates statistical significance at the 0.05 level.
** Indicates statistical significance at the 0.01 level.
# Indicates statistical significance at the 0.001 level.
## Indicates statistical significance at the 0.000 level.
a) Per cent of child births attended by health professionals.
b) Per cent of children aged 12-23 months fully vaccinated.
39

India nut Xstate 1998 tables.doc
Appendix Table 1. Matrix of partial correlation coefficients (r) between explanatory
variables in first round of regressions
Poverty Health 2 Fem literacy Fertility rate M/F ratio
Poverty
Sheet
- - - -
Health 2
Sheet
-0.48
1-42
- - - -
Fem literacy
Sheet
-0.49
1-39
0.83
1-43
- - -
Fertility rate
Sheet
0.42
1-21
-0.86
1-19
-0.84
1-24
- -
M/F ratio
Sheet
0.10
1-15
0.71
1-16
-0.48
1-40
0.60
1-23
-
Xls document: India nut multiple reg 2006-2.
Number in bold means that the correlation is insignificant at the 0.05 level.
40

India nut Xstate 1998 tables.doc
Appendix Table 2. Selected health indicators from India in international comparison
2003
Indicator India China Finland India in international
comparison (N=192)
Total H-Exp/GDP 4.8* 5.6# 7.4# Below average for LMCa
Government share 24.8 36.2* 76.5 Only 5-6 countries lower
Private share 75.2 63.8# 23.5 Only 5-6 countries higher
Gov H-exp/all exp 3.9* 9.7* 11.2# Only 5-6 countries lower
Tot Health
Exp/capita
($)
($PPP)
27
82#
61#
278#
2307#
2108#
Higher than most, but not
all, SSA countries
Gov Health
Exp/capita
($)
($PPP)
7
20#
22#
101#
1766#
1613#
At par with most of SSA,
lower than Haiti & Yemen
Priv Health
Exp/capita
($)
($PPP)
20
62#
39#
177#
541#
495#
Higher than in SSA and
Bangladesh & Pakistan
Physicians/1000 0.60 1.06 3.16
Nurses/1000 0.80 1.05 14.43
Higher than in SSA and
Bangladesh & Pakistan
Midwives/1000 0.47 0.03 0.76 Average for LMC
Source: WHO World Health Report 2006: AT 2-4.
* Indicate a decline over the 1999-2003 period.
# Indicate an increase over the 1999-2003 period.
a) LMC = Low and middle income countries.
41

Figure 1. Correlation between prevalence of child stunting and child health-care provision across Indian States in 1999/00
y = -0,3808x + 58,025R2 = 0,9249
0
10
20
30
40
50
60
0 20 40 60 80 100
Share of child births in medical institutions (%)
Shar
e of
chi
ldre
n w
ho a
re s
tunt
ed (%
)
UP
KE
BI MP RAHA
AS
OR
PU
WBGU
MAAP
KATN
42

43