child labour and its determinants in kenya
TRANSCRIPT


Child Labour and Its Determinants in Kenya
Beatrice W. MainaSocial Sector Division
Kenya Institute for Public Policy Research and Analysis
KIPPRA Discussion Paper No. 1572013

ii
Child labour and its determinants in Kenya
KIPPRA in Brief
The Kenya Institute for Public Policy Research and Analysis (KIPPRA) is an autonomous institute whose primary mission is to conduct public policy research leading to policy advice. KIPPRA’s mission is to produce consistently high-quality analysis of key issues of public policy and to contribute to the achievement of national long-term development objectives by positively influencing the decision-making process. These goals are met through effective dissemination of recommendations resulting from analysis and by training policy analysts in the public sector. KIPPRA therefore produces a body of well-researched and documented information on public policy, and in the process assists in formulating long-term strategic perspectives. KIPPRA serves as a centralized source from which the Government and the private sector may obtain information and advice on public policy issues.
Published 2013© Kenya Institute for Public Policy Research and AnalysisBishops Garden Towers, Bishops RoadPO Box 56445-00200 Nairobi, Kenyatel: +254 20 2719933/4; fax: +254 20 2719951email: [email protected]: http://www.kippra.org
ISBN 9966 058 25 6
The Discussion Paper Series disseminates results and reflections from ongoing research activities of the Institute’s programmes. The papers are internally refereed and are disseminated to inform and invoke debate on policy issues. Opinions expressed in the papers are entirely those of the authors and do not necessarily reflect the views of the Institute.
This paper is produced under the KIPPRA Young Professionals (YPs) programme. The programme targets young scholars from the public and private sector, who undertake an intensive one-year course on public policy research and analysis, and during which they write a research paper on a selected public policy issue, with supervision from senior researchers at the Institute.
KIPPRA acknowledges generous support from the Government of Kenya, the African Capacity Building Foundation (ACBF), and the Think Tank Initiative of IDRC.
iii
Abstract
Child labour is a major policy concern in Kenya because it has implications that persist over a child’s life cycle and across generations. This study examines the levels of child labour participation across sectors and regions and identifies some of the main determinants of children’s participation in economic activities. It uses data from the 2005/06 Kenya Integrated Household Budget Survey (KIHBS) conducted by Kenya National Bureau of Statistics (KNBS) and used a national representative sample. Child labour was defined and analysed in respect of a child’s age, number of hours worked per week, and school attendance. Child activities were categorized into four main areas, namely schooling only, working and schooling, working only, and neither schooling nor working. The characteristics examined in the study were divided into three main categories, namely child characteristics, household characteristics and community characteristics.
The analysis was based on 23,210 children aged 5 to 17 years. The results show that 7.2 per cent of all children are engaged in child labour, with 39 per cent of them combining labour and schooling. Children in rural areas and in Rift Valley and Eastern provinces are more prone to child labour, with the agricultural sector being the highest employer.
This study shows that child labour is influenced by child, household and community characteristics, with the extent varying regionally and by sector. It shows that this is an issue requiring concerted efforts from all sectors. Therefore, policies aiming at eliminating child labour should target all sectors and stakeholders. Priority should be given to adoption of policies that aim at eliminating child labour in all sectors of the economy, as well as household-based child labour. Policies aimed at enhancing access to education should further ensure retention of children in schools, and a smooth transition from primary to secondary schools. If children are not in school, they are subjected to harsh economic conditions and hence forced to engage in child labour.

v
Table of Contents
Abstract .................................................................................................................iiiAbbreviations and Acronyms .................................................................................v
1. Introduction ..................................................................................................... 1 1.1 Background ................................................................................................. 1 1.2 Problem Statement .....................................................................................2 1.3 Objectives of the Study ...............................................................................3 1.4 Justification ................................................................................................3 2. Literature Review .............................................................................................6 2.1 Theoretical Literature .................................................................................6 2.2 Empirical Literature ...................................................................................7
3. Methodology ....................................................................................................9 3.1 Conceptual Framework ..............................................................................9 3.2 Theoretical Framework ..............................................................................9 3.3 Empirical Model ........................................................................................11 3.4 Data and Measurement of Variables ....................................................... 13
4. Results and Discussion ................................................................................. 16 4.1 Descriptive Statistics ............................................................................... 16 4.2 Multinomial Logit Results ....................................................................... 17
5. Conclusion, Policy Recommendations ..........................................................22 5.1 Conclusion ................................................................................................22 5.2 Policy Recommendations .........................................................................22 5.3 Areas of Further Research........................................................................23 References ......................................................................................................24 Annex..............................................................................................................28


1
1. Introduction
1.1 Background
Child labour1 is a widespread phenomenon the world over, and has consequences on socio-economic development of a country. There is a distinction between child work and child labour, with the latter used to denote a more harmful part of child work. Child work includes light household chores and work that may have some actual learning value. It is not harmful as children are thought to work within a stable and nurturing environment with their parents or under the protection of a guardian. It is not the work, but the nature of work that determines whether it is detrimental or not. Child work takes place in a continuum; on one end it is beneficial to the child, while on the other it is child labour, which is detrimental.
World trend indicates that child labour has declined over time, though at a very slow pace. About 215 million of the world’s children aged 5-17 years work for pay or family gain, nearly half of them full time (Diallo et al., 2010). This is a decline from 250 million children between 2004 and 2008. For the children aged 5-14 years, the incidence rate declined from 17.6 per cent to 16.2 per cent and 14.5 per cent in 2000, 2004 and 2008, respectively (Hagemann et al., 2006). However, in Africa, especially Sub-Saharan Africa, this is not the case; child labour has continued to increase over time (Diallo et al., 2010). In 2004, the incidence rate was 26.4 per cent, increasing to 28.4 per cent in 2008 (Diallo et al., 2010; Hagemann et al., 2006). This has been attributed to high poverty levels and low economic growth.
Canagarajah and Nielsen (1999) agree with the poverty attribute and observe that regional variations are mainly characterized by levels of economic growth. Countries with high levels of economic growth have low incidence of child labour and, as the poorest continent, Africa has the highest incidence of child labour, which is further differentiated within the continent. In addition, African countries are dominated by household production, and small land holdings which are more rural. There is also a combination of cultural factors and norms that pull children towards the labour force (Bradley, 1993).
Bhalotra (2003) shows an uneven progress towards the goal of eliminating the worst forms of child labour by 2016. Although overall global pattern of child labour shows a decline, the 2016 target will be missed if the current slow trend
1 Definition of child labour is guided by the ILO Convention on the Minimum age of work (C 138) of 1973 and the Convention on the worst forms of child labour (C. 182) of 1999. It is work which, by its nature or circumstances under which it is carried out, harms and abuses, and exploits the child and deprives the child of an education. A child is considered to be everyone under the age of 18, entitled to the rights proclaimed in the UN Convention on the Rights of the Child, including the right to be protected from economic exploitation (ILO, 1973; 1999).
2
Child labour and its determinants in Kenya
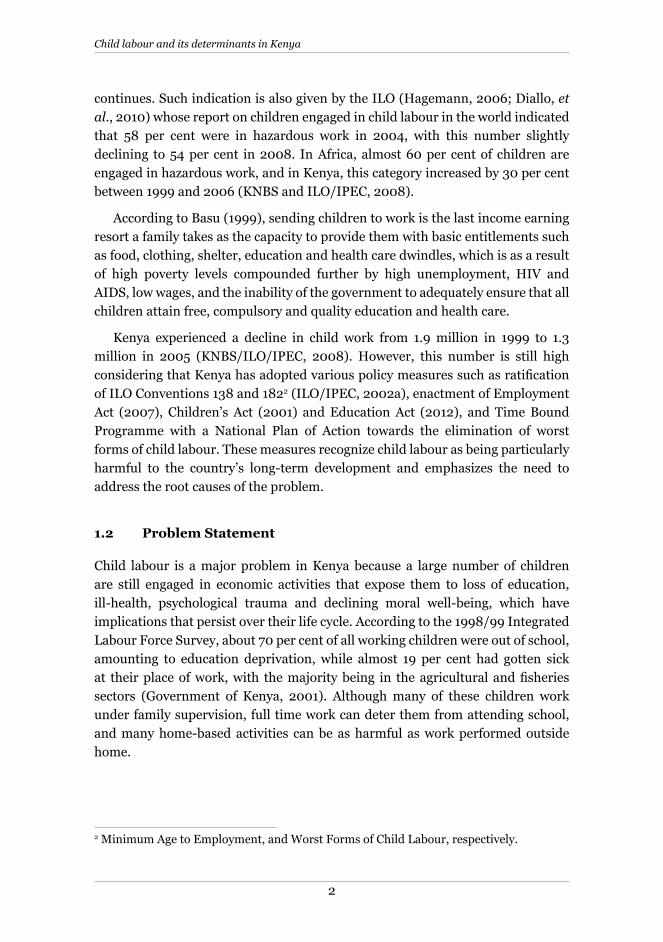
continues. Such indication is also given by the ILO (Hagemann, 2006; Diallo, et al., 2010) whose report on children engaged in child labour in the world indicated that 58 per cent were in hazardous work in 2004, with this number slightly declining to 54 per cent in 2008. In Africa, almost 60 per cent of children are engaged in hazardous work, and in Kenya, this category increased by 30 per cent between 1999 and 2006 (KNBS and ILO/IPEC, 2008).
According to Basu (1999), sending children to work is the last income earning resort a family takes as the capacity to provide them with basic entitlements such as food, clothing, shelter, education and health care dwindles, which is as a result of high poverty levels compounded further by high unemployment, HIV and AIDS, low wages, and the inability of the government to adequately ensure that all children attain free, compulsory and quality education and health care.
Kenya experienced a decline in child work from 1.9 million in 1999 to 1.3 million in 2005 (KNBS/ILO/IPEC, 2008). However, this number is still high considering that Kenya has adopted various policy measures such as ratification of ILO Conventions 138 and 1822 (ILO/IPEC, 2002a), enactment of Employment Act (2007), Children’s Act (2001) and Education Act (2012), and Time Bound Programme with a National Plan of Action towards the elimination of worst forms of child labour. These measures recognize child labour as being particularly harmful to the country’s long-term development and emphasizes the need to address the root causes of the problem.
1.2 Problem Statement
Child labour is a major problem in Kenya because a large number of children are still engaged in economic activities that expose them to loss of education, ill-health, psychological trauma and declining moral well-being, which have implications that persist over their life cycle. According to the 1998/99 Integrated Labour Force Survey, about 70 per cent of all working children were out of school, amounting to education deprivation, while almost 19 per cent had gotten sick at their place of work, with the majority being in the agricultural and fisheries sectors (Government of Kenya, 2001). Although many of these children work under family supervision, full time work can deter them from attending school, and many home-based activities can be as harmful as work performed outside home.
2 Minimum Age to Employment, and Worst Forms of Child Labour, respectively.

3
Introduction
Children also engage in, among other activities, prostitution, drug trafficking and armed conflict – as child soldiers – making them suffer from psychological trauma and degrade their morals. Sometimes they are exposed to injuries through physical assault and sexual exploitation, resulting in such tribulations as HIV and AIDS, unwanted pregnancies and death, and are also in constant conflict with the law when they engage in illegal activities. ILO estimates that about 30,000 girls under the age of 18 years in Kenya engage in prostitution. Children working on the streets encounter harsh conditions as they face all types of abuses and neglect (ECPAT-UK, 2005).
From the above socio-economic situations associated with high levels of child labour, Kenya’s ability to achieve the targets for the Millennium Development Goals (MDGs) is doubtful. While child labour continues to be of concern, the extent of the phenomenon in general and across regions and sectors has not been analyzed. Unless the severity and determinants of child labour are well understood to provide the necessary interventions, the problem will persist.
This study seeks to analyze the levels and determinants of child labour in Kenya and identify the regions and sectors that are mostly affected. This will be done by answering the following research questions;
(i) What are the levels of child labour participation in Kenya?
(ii) What is the extent of sectoral and regional variations in child labour?
(iii) What are the key determinants of child labour participation in Kenya?
1.3 Objectives of the Study
The main objective of the study is to analyze child labour participation and the key determinants in Kenya. Specifically, the study seeks to:
(i) Analyze the levels of child labour participation across various sectors and regions
(ii) Identify the main determinants of children’s participation in economic activities
(iii) Draw policy recommendations
1.4 Justification
In Kenya, child labour is a violation of children’s rights and contravenes the country’s as well as international standards of child protection. While engaging in work, children are exposed to hazardous and dangerous environment. Elimination

4
Child labour and its determinants in Kenya
of hazardous child labour would reduce health costs, which includes reductions in direct expenses for medical treatment and increased productivity of future adult.
For children, the most compelling potential alternative to full-time work is education; it helps a child to develop cognitively, emotionally and socially. According to Bequele and Myers (1995), work absorbs the child’s time, leaving the child too exhausted to attend school or to effectively study. The social environment at work makes children undermine the value of education, while those who are mistreated at the workplace may be too traumatized to concentrate on school work or are rejected by teachers as disruptive.
Children engage in full-time work either because they have no access to schools within a convenient distance, or the schools are of such low quality that parents do not see the advantage of enrolling them. Therefore, the shortcoming of the education system is a significant factor in discouraging children from attending school and thus engaging in child work (Manda et al., 2003). However, it is not obviously the case that there are two alternatives, work and school, as there is a number of children who are in neither category. In Kenya, over one million children are in this group (KNBS and ILO/IPEC, 2008). These children are believed to be engaged in household chores. It is therefore necessary to inform policies that integrate the fight against child labour in all sectors of the economy.
The most recent policy reforms the government has undertaken have borne some fruits. They include the Economic Recovery Strategy for Wealth and Employment Creation (ERC) and thereafter the formulation of Vision 2030, and also the Education Policy. Poverty has been identified as a major cause of child labour. With the standard of living growing by 3 per cent, 4.9 per cent and 5.8 per cent in 2003, 2004 and 2008, respectively (Government of Kenya, 2007), this growth is thought to have had a positive effect on child labour. In addition, with the implementation of Free Primary Education (FPE), Net Primary Enrolment (NPE) rose from 87 per cent in 2006 to 92 per cent in 2007. This also had a positive effect on the child labour situation. In addition, the Employment Act, the Children’s Act, the Millennium Development Goals (MDGs), and the new constitution also tackle the problem of child labour.
In spite of the above policies, a large number of children are still engaged in child labour, an indication that the policies have not adequately addressed the problem. In Kenya, there is no specific policy on child labour; the draft policy has been awaiting Cabinet approval for some time. Child protection is briefly covered by the Employment Act (2007) and the Children’s Act (2001), with the former putting the minimum age of employment at 13; those aged between 13 and 16 years are employed to perform light work. The Act only provides for penalties in respect of those who engage children in the worst forms of child labour. The

5
Introduction
two pieces of legislation contradict on the minimum age of entry to employment; while the Employment Act indicates that children aged 13 to 16 years can be employed to perform light work, the Children’s Act pegs the minimum age at 16 years. This contradiction has policy implications, as people engaging children in child labour cannot be legally held accountable unless it involves “worst forms of child labour”. In addition, the Children’s Act deals with the rights of the child and does not outline penalties to be given to those who contravene them.
Kenya has also ratified various international conventions that address aspects of child labour. They include the UN Convention on the Rights of Child, the ILO Minimum Age Convention (138) of 1973, the UN Convention on the Rights of the Child (CRC) of 1989, the African Charter on the Rights and Welfare of Child of 1990, the ILO Declaration on Fundamental Principles and Rights at Work of 1998, and the ILO Worst Forms of Child Labour Convention (182) of 1999. In 1992, the Government of Kenya signed a Memorandum of Understanding (MoU) with the International Labour Organization (ILO) aimed at ensuring that the country benefited from international experience and assistance in addressing child labour. The Ministry of Labour also immediately assumed formal over-arching responsibility for child labour, at least in an employment context, and set up a Child Labour Division with a permanent staff establishment to monitor and facilitate work in this field. Progress is neither fast nor comprehensive enough to reach the goals that have been set. Therefore, this calls for the need to understand why children go to work with a view to renewing efforts of campaign against child labour.

6
Child labour and its determinants in Kenya
2. Literature Review
2.1 Theoretical Literature
Various theories explain household decision-making with regard to employment of children. Neoclassical models of household decision-making derived from Becker (1964) are commonly used in the analysis of child labour. The theories include those in which children have no bargaining power, and those in which children have some intrinsic value in the family.
Becker and Lewis (1973) indicate that children are viewed strictly in terms of their value as assets. They argue that in the quality-quantity trade-off, the number of children and investment in the human capital of children are substitutes, and parents who choose a large number of children are less likely to invest in quality schooling. Parents may choose to have a large number of children in order to diversify risk, formally educating some and putting the others to work. However, Levison (1991) indicates that with a large number of children available to engage in household work, the opportunity cost of education for any one child may be quite low.
According to Baland and Robinson (2000), parents weigh the present discounted value of the future income of an educated child against the foregone income while the child is in school. Child labour is only chosen if the return to education is not high enough to compensate families for the lost income of their children. It is therefore viewed as a device for transferring income from the future into the present. A child who works today at the expense of acquiring an education will contribute to family income today at the expense of future productivity. In addition, when household’s survival is threatened by a period of unemployment and drought, parents even out the consumption profile of the family by borrowing against the household’s future wealth. This increases current consumption while lowering future consumption. Thus, the only option parents have for increasing current household consumption at the expense of the future is to put the child to work.
Other theories assume that parents are altruistic and focus on the interaction between market characteristics and child labour. Basu and Van (1998) show the possibility of multiple equilibriums; in a general equilibrium framework, a good equilibrium with high wage means no child labour, and a bad equilibrium with low wage means child labour. It assumes the “luxury” axiom that, below a certain wage level, households do not let their children work. It also assumes that a mass of children can significantly affect adult wage rates (substitution axiom).

7
Literature Review
Basu (1999) examines the case in which rigidities in the market for adult labour drive child labour. He considers a market in which the adult wage is downward rigid, giving rise to adult unemployment. Low household income or wealth and the possibility of substituting children for adults in production can lead to equilibriums in which children work (Basu and Van, 1998). Further, they analyze the case in which parents withdraw their children from the labour market once the adult wage reaches a critical level.
Ranjan (2001) links the phenomenon of working children to imperfect capital markets; children may end up going to work in part because their families are unable to borrow against future earnings to finance schooling. In particular, he considers very poor families that would choose to educate their children if they had access to a capital market, but fail to do so due to capital-market failure. Such families produce poor, uneducated children who repeat the cycle for the next generation. Therefore, efforts to educate one generation of such children would pull the family and subsequent generations away from the income level at which they depend on the labour of their children for survival.
2.2 Empirical Literature
In their campaign to raise awareness on grim realities of child labour in 2005, UNICEF (UK) indicated that children are pushed to work by two broad factors, namely the supply factors and demand factors. The supply factors mainly include return to schooling, cultural traditions, poverty, level of education and gender of household head, and credit market failure. The main demand factor is “why employers want children”, with reasons being that children are cheap and obedient, and that they give special attention to detail.
Canagarajah and Harold (1997) argue that in the African context, poor quality of child schooling and their lack of apparent relevance to the child’s employment skills encourage parents to take their children out of schools and put them into employment. In their study on the determinants of child labour in rural households in Ghana and Pakistan, Bhalotra and Heady (1998) found that factors such as age, mother’s education, region, ethnicity, religion, availability of public transport and electricity influence the children labour.
Chaubey et al. (2007) investigated the determinants of child labour and school enrolment using data from 175 countries. It was argued that poverty, inequality, access to education, culture, parents’ education, vulnerability and economic crises often increased the supply of and demand for children’s labour. At the same time, trade liberalization has created new markets for unskilled cheap labour, often including that of children.
8
Child labour and its determinants in Kenya
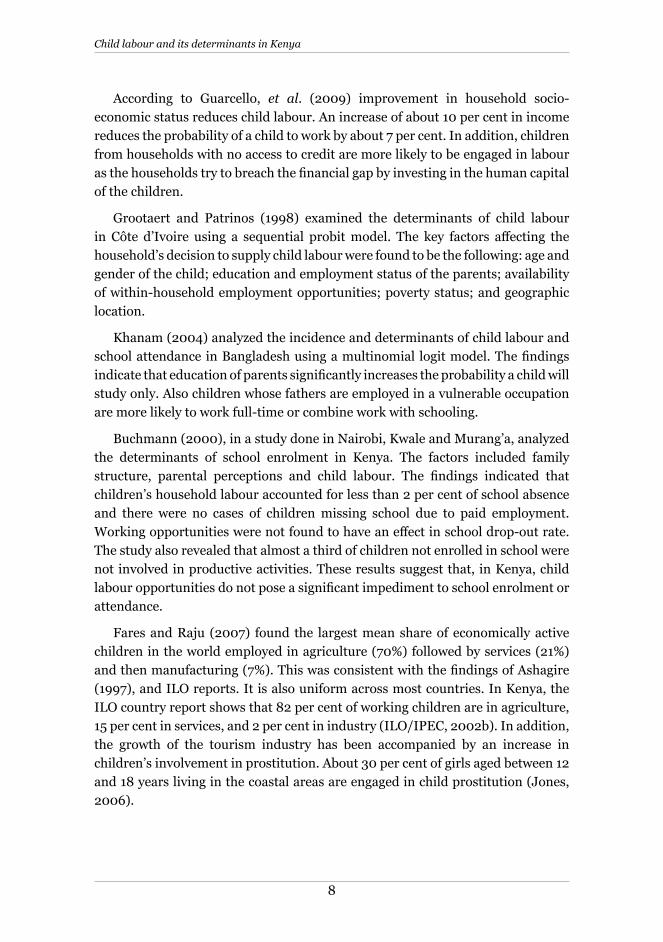
According to Guarcello, et al. (2009) improvement in household socio-economic status reduces child labour. An increase of about 10 per cent in income reduces the probability of a child to work by about 7 per cent. In addition, children from households with no access to credit are more likely to be engaged in labour as the households try to breach the financial gap by investing in the human capital of the children.
Grootaert and Patrinos (1998) examined the determinants of child labour in Côte d’Ivoire using a sequential probit model. The key factors affecting the household’s decision to supply child labour were found to be the following: age and gender of the child; education and employment status of the parents; availability of within-household employment opportunities; poverty status; and geographic location.
Khanam (2004) analyzed the incidence and determinants of child labour and school attendance in Bangladesh using a multinomial logit model. The findings indicate that education of parents significantly increases the probability a child will study only. Also children whose fathers are employed in a vulnerable occupation are more likely to work full-time or combine work with schooling.
Buchmann (2000), in a study done in Nairobi, Kwale and Murang’a, analyzed the determinants of school enrolment in Kenya. The factors included family structure, parental perceptions and child labour. The findings indicated that children’s household labour accounted for less than 2 per cent of school absence and there were no cases of children missing school due to paid employment. Working opportunities were not found to have an effect in school drop-out rate. The study also revealed that almost a third of children not enrolled in school were not involved in productive activities. These results suggest that, in Kenya, child labour opportunities do not pose a significant impediment to school enrolment or attendance.
Fares and Raju (2007) found the largest mean share of economically active children in the world employed in agriculture (70%) followed by services (21%) and then manufacturing (7%). This was consistent with the findings of Ashagire (1997), and ILO reports. It is also uniform across most countries. In Kenya, the ILO country report shows that 82 per cent of working children are in agriculture, 15 per cent in services, and 2 per cent in industry (ILO/IPEC, 2002b). In addition, the growth of the tourism industry has been accompanied by an increase in children’s involvement in prostitution. About 30 per cent of girls aged between 12 and 18 years living in the coastal areas are engaged in child prostitution (Jones, 2006).

9
3. Methodology
In this study, child labour is defined as participation of children within the range of 5-17 years of age in the labour market to earn a living either to support themselves or to supplement household income, in respect of their age, schooling status and hours of work. The study focused on supply factors at the household level; that is, those characteristics of the child, the household and the head of the household that can exercise an influence over the household’s decision to allocate children’s time away from school and towards work. Street children are not included in the study. Children engaged in household chores are captured under the “neither working nor schooling category”.
With regard to the social systems and culture in Kenya, engaging a child in work is a way of training them to be responsible. This is only beneficial to a child up to a certain limit, after which it becomes detrimental in various aspects. All children working and not in school are regarded to be in child labour; children who are in school and working beyond a certain number of hours relative to their age are regarded to be in child labour; children aged between 5 and 11 years working at least 1 hour of economic work or over 28 hours of domestic work, those aged between 12 and 14 years working at least 14 hours of economic work or 28 hours of domestic work per week, and those aged 15 to 17 years working at least 43 hours of economic work per week are regarded to be in child labour .
3.1 Conceptual Framework
In the framework below, child, household and community characteristics all play a role in determining the activities a child engages in. The activities are divided into four mutually exclusive categories as illustrated. From these categories, the children engaged in child labour are derived.
3.2 Theoretical Framework
There are two main household decision-making models that allocate children’s time between labour and non-labour activities such as schooling and leisure, namely the traditional model and collective model. The traditional model of the household (unitary model) characterizes the household as a single unit of decision-making (Becker, 1981). This is only valid when one person in the household happens to be the only decision maker, or all people in the household have the same utility function. There are other recent collective models involving making decisions from a bargaining process among members. The models require information on the bargaining structure among household members.

10
Child labour and its determinants in Kenya
In this study, the unitary model is used because it is noted that decisions regarding children activities are made by an adult in the household and not the child. A general utility maximizing framework is also adopted to model the choices of child labour and other activities. The assumption is that children are not making their own choices independently, but are under the control of their parents. Therefore, a decision regarding whether a child will work or study can be explained by a model of parental decisions. A child can go to school full time, work full time, combine work and school or do neither. Parents maximize utility based on the human capital of children, leisure of household members and consumption of composite goods, subject to income and time constraints of the household members (Becker and Lewis, 1973).
U = U (S, L, C, Z) (1)
Where S and L are schooling and leisure of the child, respectively, C is the consumption of a composite good and Z represents the observables and
Child Characteristics Age, Sex, Relation to
household head
Community Characteristics
Cost of schooling, Region of residence, Place of
residence
Work only Work and study Study only
Household Characteristics
Age of HH Head, Sex of HH head, Monthly HH expenditure, Source of water
Neither work nor study
Number of hours worked is greater than recommended minimum in respect to child’s age
CHILD LABOUR
Number of hours worked is less than or equal to recommended minimum in respect to child’s age
Child Activities
Figure 3.1: Conceptual framework
Source: Authors own illustration

11
unobservable individual, household and community characteristics. Z allows for heterogeneity across households.
Given T as the total available time of the child spent on schooling (S), work (W) and leisure (L), the time constraint is:
T = S + W + L (2)
The household budget constraint is given by:
C + PsS=V + Y (3)
C is the price of consumption; Ps the price of schooling; V the non-labour income; and Y income from all other sources than child labour. Combining (2) and (3) gives the full income constraint of the household:
C + PsS = V + PwT + Y (4)
The maximization of utility function will yield a set of reduced form demand functions for work, school and leisure as shown:
J = f (Ps, Z, V); J= S, W, L (5)
3.3 Empirical Model
Because the children’s choices are characterized as discrete decisions, a statistical procedure is required that takes into account the different discrete states that an individual can occupy. This study describes an econometric model to account for variations in the allocation of children’s time in different areas. It uses a multinomial logit to estimate simultaneously the determinants of study (children who attend school but do not participate in the labour force), combining work and study (children who attend school and at the same time participate in the labour force), doing neither (children who neither participate in the labour force nor attend school) and work only (children who participate in the labour force only). The choices are mutually exclusive, and a child can only be engaged in one activity. The level of utility associated with each option is assumed to depend on the characteristics of the child, household and community.
Multinomial logit models are valid under the Independence of Irrelevant Alternatives (IIA) assumption, which states that characteristics of one particular choice alternative do not impact the relative probabilities of choosing other alternatives. In this study, the IIA test was done using the Hausman test, and the results revealed that the test holds.
Quantitatively, the decision to send a child to work is described by the following model:
Methodology
12
Child labour and its determinants in Kenya
Wi* = Xiβ1 + Є1i (6)
Wi* is the net benefit attained by the family by sending child i to work, Xi is a vector of the child, family and community characteristics that determine Wi*, and Є1i is a random error, with zero mean and unit variance. However, Wi* is not observed. What is observed is the following binary variable:
Wi* ={1, if the child works (Wi* > 0)
0, otherwise
In addition, the decision to send a child to school is described by the following model:
Si* = Xiβ2 + Є2i (7)
Si* is the net benefit to the family from sending the child to school, Xi is a vector of the child, family and community characteristics that determine Si* and Є2i is a random error, with zero mean and unit variance. Si* is not observed. What is observed is the following binary variable:
Si* = {1, if the child works (Si* > 0)
0, otherwise
In the multinomial logit estimation procedure, the two equation system are converted into an observable form (Y) involving the four states as follows:
(i) Yt=0:Wt*≤ 0, St*≤ 0 (child neither works nor attends school)
(ii) Yt=1:Wt*> 0, St*≤ 0 (child works, does not attend school)
(iii) Yt=2:Wt*≤ 0, St*> 0 (child does not work, attends school)
(iv) Yt=3:Wt*> 0, St*> 0 (child works and attends school)
The child’s utility function will be defined as:
Pij = X’βi + Єij (8)
where i =1... N j =, 1,2,3,4
where X is a vector containing explanatory variables for child i, which include individual, household and community characteristics. The error term is assumed to be normally distributed with mean zero and unity variance. Pi*j is a latent variable representing the ith individual utility gain from choosing the jth work and school status where:
j=1 If the child attends school only
j=2 If the child works only
13
j=3 If the child works and attends school
j=4 If the child neither works nor attends school
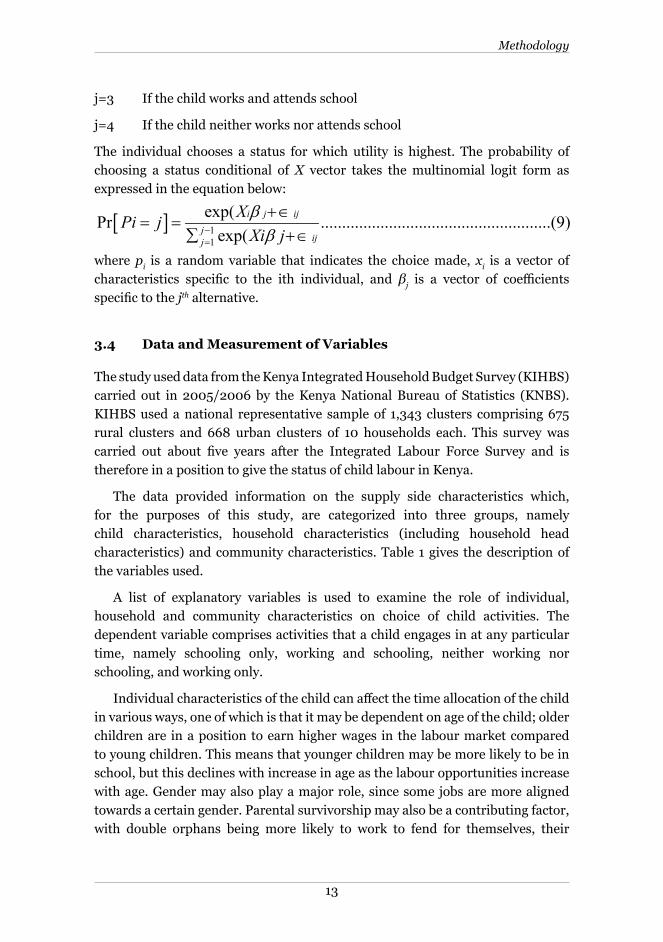
The individual chooses a status for which utility is highest. The probability of choosing a status conditional of X vector takes the multinomial logit form as expressed in the equation below:
where pi is a random variable that indicates the choice made, xi is a vector of characteristics specific to the ith individual, and βj is a vector of coefficients specific to the jth alternative.
3.4 Data and Measurement of Variables
The study used data from the Kenya Integrated Household Budget Survey (KIHBS) carried out in 2005/2006 by the Kenya National Bureau of Statistics (KNBS). KIHBS used a national representative sample of 1,343 clusters comprising 675 rural clusters and 668 urban clusters of 10 households each. This survey was carried out about five years after the Integrated Labour Force Survey and is therefore in a position to give the status of child labour in Kenya.
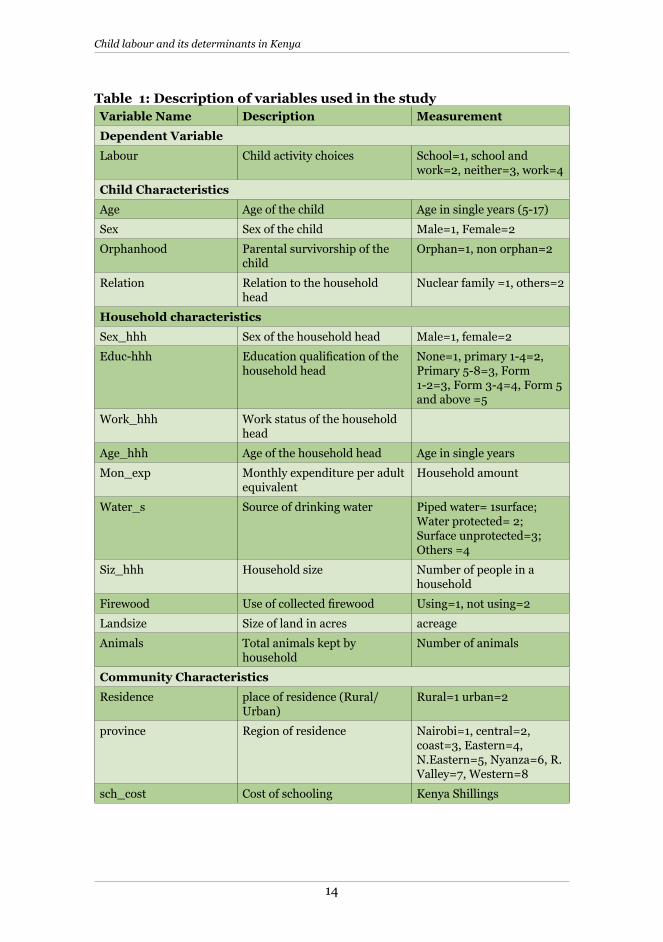
The data provided information on the supply side characteristics which, for the purposes of this study, are categorized into three groups, namely child characteristics, household characteristics (including household head characteristics) and community characteristics. Table 1 gives the description of the variables used.
A list of explanatory variables is used to examine the role of individual, household and community characteristics on choice of child activities. The dependent variable comprises activities that a child engages in at any particular time, namely schooling only, working and schooling, neither working nor schooling, and working only.
Individual characteristics of the child can affect the time allocation of the child in various ways, one of which is that it may be dependent on age of the child; older children are in a position to earn higher wages in the labour market compared to young children. This means that younger children may be more likely to be in school, but this declines with increase in age as the labour opportunities increase with age. Gender may also play a major role, since some jobs are more aligned towards a certain gender. Parental survivorship may also be a contributing factor, with double orphans being more likely to work to fend for themselves, their
Methodology
[ ] 11
exp(Pr ......................................................(9)exp(
i j ij
jijj
XPi jXi jββ−
=
+∈= =
∑ +∈
14
Child labour and its determinants in Kenya
Variable Name Description Measurement
Dependent Variable
Labour Child activity choices School=1, school and work=2, neither=3, work=4
Child Characteristics
Age Age of the child Age in single years (5-17)
Sex Sex of the child Male=1, Female=2
Orphanhood Parental survivorship of the child
Orphan=1, non orphan=2
Relation Relation to the household head
Nuclear family =1, others=2
Household characteristics
Sex_hhh Sex of the household head Male=1, female=2
Educ-hhh Education qualification of the household head
None=1, primary 1-4=2, Primary 5-8=3, Form 1-2=3, Form 3-4=4, Form 5 and above =5
Work_hhh Work status of the household head
Age_hhh Age of the household head Age in single years
Mon_exp Monthly expenditure per adult equivalent
Household amount
Water_s Source of drinking water Piped water= 1surface; Water protected= 2; Surface unprotected=3; Others =4
Siz_hhh Household size Number of people in a household
Firewood Use of collected firewood Using=1, not using=2
Landsize Size of land in acres acreage
Animals Total animals kept by household
Number of animals
Community Characteristics
Residence place of residence (Rural/Urban)
Rural=1 urban=2
province Region of residence Nairobi=1, central=2, coast=3, Eastern=4, N.Eastern=5, Nyanza=6, R. Valley=7, Western=8
sch_cost Cost of schooling Kenya Shillings
Table 1: Description of variables used in the study
15
siblings or their aged guardians. The other factor is relation to the household head, whereby household heads tend to favour their own biological children and will always choose what is best for them. Therefore, in a household where other children are living, it is more likely that they will be disadvantaged in favour of the households’ own children, and especially where the household is resource constrained.
Household characteristics that include characteristics of the household head also have a great influence on how choices of child activities are done. Age and sex of the household head will influence decision-making regarding the choice of child activity. Sex of the household head is partly viewed as a cultural norm, whereby those households headed by female are seen to be weak. Children in these households are said to be disadvantaged and will be forced to assist in fending for the family. However, this is altered by education level of the head and subsequently, the nature of work of the household head.
The number of household members also has an impact on the decision-making process. The more the number of household members, the more likely some of the children will be engaged in work.
The other determinant covered in the study is household welfare determined in terms of household expenditure. Household expenditure was used during data collection as a proxy for household income. Other factors considered included sources of drinking water, use of firewood for cooking, total animals kept, and land size. These factors mainly include the main activities that children usually engage in.
The community characteristics in the study include region and place of residence, and the school cost. These characteristics may affect time allocation decisions through the returns to schooling through the wage available to children in market work.
Access to and quality of schooling is important. The return to schooling also depends on the opportunities open to educated labour; for example, education may be of less value in the agricultural sector than in finance or services sector. The labour market demands may also differ by regions. The variables considered in the study include place of residence (Rural/urban), region of residence (Provinces), and the cost of schooling (Access to schooling).
Methodology

16
Child labour and its determinants in Kenya
4. Results and Discussion
4.1 Descriptive Statistics
The analysis is based on 23,210 sample children aged 5 to 17 years. The various characteristics of the children are tabulated in Annex 2 and 3. Out of the total, 50 per cent are female. Almost 75 per cent live in rural areas and about 30 per cent live in female-headed households. Of the 90 per cent who have ever attended school, 95 per cent are still in school, an increase in proportion compared with 1999 where only 68 per cent of children were in school. In response to why a child is not in school or has never attended school, about 29 per cent indicated the main reason as lack of money, which may be an indication of the effect of poverty on education and consequently on child labour. In addition, about 19 per cent of the children did not go to school because their parents did not let them, and another 13 per cent had to work. Out of those whose parents refused them to attend school, 30 per cent cited working as the second main reason. This is an indication that children may not be making a decision alone on what activity to engage in.
Children were divided into four categories: 82 per cent were in school only, a possible result of the free primary education and a near realization of the MDG on Education for All; about 3 per cent were in school and at the same time engaged in economic activities beyond the recommended minimum hours; 11 per cent were neither in school nor engaged in any economic activity; and 4 per cent were engaged in economic activities only.
Several studies have found that a considerable number of children are neither engaged in any economic activity nor in school. The group partially forms an important category called invisible child labour (Bradley, 1993). Their involvement is only in household chores. However, most studies, including the current study, have not researched further on this particular group of children. These child workers are virtually invisible to outsiders, as they work in the privacy of people’s homes and are mostly girls. Children working inside people’s houses now receive more attention than before, although there is still no accurate figure of child domestic workers worldwide (Himayatullah, 2005). Of interest to this study are the children working only without attending school and those in school and engaging in labour. This combined group defines children engaged in child labour.
As indicated earlier, a child can only work up to a certain maximum number of hours per week relative to their age. Any child working and not attending school is considered to be in child labour regardless of the number of hours worked per week or the age. The study revealed that about 7.2 per cent of children between 5 and 17 years are currently engaged in child labour. Of these, 54 per cent are male.
17
With regard to age, 34 per cent of child labourers are aged between 5 and 11 years and 38 per cent are aged between 15 and 17 years. According to KNBS (2008), the number of children engaged in child labour was estimated at 6 per cent. This is a decline compared to the 12 per cent reported by the 1999 Labour Force Survey.
There are regional and sectoral variations in child labour in Kenya, with 86 per cent of child labourers being in rural areas. Annex 3 shows the sectoral distribution; agriculture is the dominant source of employment at 81 per cent followed by services sector at 13 per cent. Law and Order, and financial institutions employ the least percentage of children at 0.07 per cent each. The agricultural sector also has a poor record of safety; 1 in 8 child workers suffer illness or injury (Ashagire, 1997), as they are exposed to dangerous tools and machinery, and harmful chemicals, among other things. Regionally, Rift Valley Province has the highest percentage of child labour at 35 per cent followed by Eastern Province at 24 per cent. The least percentage of child labour is in Nairobi Province at 0.7 per cent followed by North Eastern Province at 2.4 per cent. Sector wise, the agricultural sector employs the highest percentage of children at 81 per cent followed by services sector at 13 per cent. Law and Order, and financial institutions employ the least percentage of children at 0.07 per cent each.
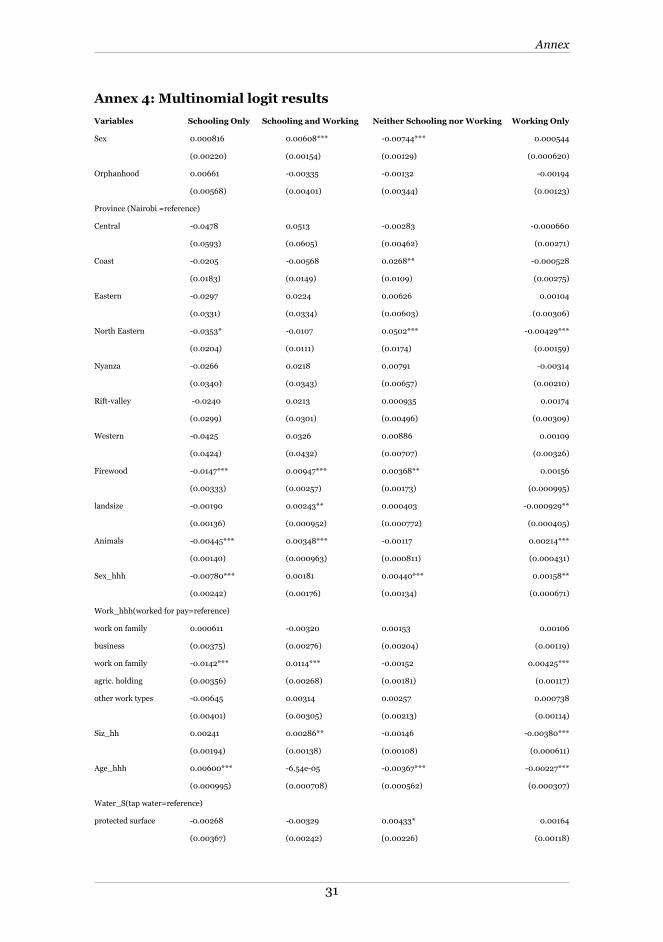
4.2 Multinomial Logit Results
This section discusses the multinomial logit results based on the analysis of the four alternatives–school only, school and work, neither school nor work, and work only. School only is used as the reference category. The results are tabulated in Annex 4.
4.2.1 Child’s characteristics
Various characteristics of the child were analysed with regard to child labour. Age, sex, relation to household head, and orphan-hood status were used in the study. Only orphan-hood status was found not to be statistically significant in determining the choice of a child’s activity. This may be attributed to the support such children are given by informal safety net mechanisms such as immediate family, extended family, relatives, and the community. There are also formal safety net programmes by the government and civil society, such as the Cash Transfer for Orphans and Vulnerable Children aged 0-17 years, which was started in 2004 and targeting poor households. Various studies show that children who have lost one or both parents are less likely to be in school and are more likely to be working. One such study was done by Monasch and Snoad (2003) using data from 40 sub-Saharan countries and revealed that orphans were more involved in
Results and discussion

18
Child labour and its determinants in Kenya
child labour than other children. In Tanzania, orphans were more likely to work while attending school than non-orphans (Suliman 2003). Assessments carried out by ILO found that orphaned children are more likely than non-orphans to be working in commercial agriculture, domestic service, commercial sex, and as street vendors.
Age of the child was not found to be statistically significant in choosing schooling only and schooling and working. However, age was highly significant in determining whether a child would neither go to school nor work, or will be working only. Various studies in support of this argue that the younger the child, the less likely that they will be engaged in labour activities where as much older children will more likely engage in activities for economic gain. This may be explained by the fact that as children grow older, they acquire more experience and more human capital, which creates a prospect of higher wages inducing them to leave school. This can also be the case that older children may have completed their studies at primary school level and failed to continue to secondary level. Also, in some parts of the country, children as old as five years will not have started going to school. This happens in rural areas and in areas with poor accessibility to schools. Most of these children will stay at home doing nothing and, as they become of age, they will join the rest in schools. Khanam (2004) also found similar results in Bangladesh, where young children were more likely to be found neither working nor studying. This supports the results that an increase in age of the child reduces their likelihood of neither being in school nor working.
Sex in the context of child labour was used to determine the extent of inequality between boys and girls in terms of education and economic exploitation. In the traditional settings, girls are more aligned towards household chores, while boys are more aligned towards more demanding activities such as working in the farms. However, with the harsh economic times and the fight for gender equity, girls are also getting involved in roles that were earlier presumed to be men’s. Sex of the child was found to be a statistically significant factor in determining whether a child will be in school and working, or will neither be in school nor working. Being male increases the probability of combining both school and work while reducing the probability of being neither in school nor working. This finding agrees with those of Grootaert (1999) and Cigno and Rosati (2000) in which they found that boys are more likely to combine both study and work than girls. In Zambia, Jensen and Nielsen (1996) explained that this outcome could be attributed to the fact that girls drop out of school at a higher rate than boys, since they are overburdened with housework, in addition to early marriages and pregnancy.
Relation to household head is highly significant in the choice of child activity. Related to not being a biological child to the household head and being a

19
daughter/son to the household head increases the probability of being in school only, while reducing the probability of working only or the probability of neither being in school nor working. While children living in the same household should be treated the same regardless of the biological relationships, most households will first cater for the interest of their children. This may also be attributed to the poverty levels prevailing in the country, such that given a choice, one would choose to take their children to school if they cannot afford to take all children within that household to school. Most of the children not living with their parents live with their grandparents, who are often aged. The children tend to take care of most of the chores in and out of the home, and are at times forced to engage in economic activities to fend for themselves and their grandparents. The common practice in households is the employment of children to take care of children who are their age-mates, since they provide cheap labour. These children are supposed to be in school, but the circumstances may not allow them. They have to fend for themselves and their dependants.
4.2.2 Household characteristics
Different households have different characteristics that influence how decisions are made within them. Such characteristics also influence how a decision regarding child activities is made. Household size, household monthly expenditure, source of drinking water, number of animals kept, and use of collected firewood are variables that were used to describe a household. In addition, characteristics of the household head, which are believed to have an influence in decision-making, were analysed as children do not make own decisions without the involvement of an adult. More often, it is assumed that the head of a household takes up this decision-making role. The characteristics used in the study include age, sex, education and work status of the household head.
According to KNBS/ILO/IPEC (2008), household expenditure was used as a proxy for household income since “it’s difficult to collect income data in Kenya”. It is used with the assumption that as the income of the household improves, household expenditure goes up and the welfare of the household improves. The results reveal that monthly expenditure is a significant determinant of child activities, which is strong proof that poverty levels influence the decisions of child activities. Results also showed that an increase in monthly expenditure increases the probability of a child being in school only, or combining school and work while reducing the probability of being in neither school nor work, or working only.
The above findings are supported by those of Dammert (2005) where she found that child labour declines with household income. All these findings therefore confirm the theoretical prediction that households with higher levels of income
Results and discussion

20
Child labour and its determinants in Kenya
increase the chance of the child being in school rather than working. Canagarajah and Nielson (1999) also agree with this attribute that poverty appears to be the major reason for child labour; poverty status of a household compels parents to make their children work (Liu, 1998). The parents need income, mostly for food, which is the main expenditure item in poor households.
In most communities, children are given certain duties meant to build them up. Such duties include collecting firewood, fetching water and tending to livestock. However, if the duty makes a child miss school or is detrimental to the child’s well-being, it becomes of concern. The results of the study reveal that use of firewood as a source of cooking fuel has a significant effect on a child’s activity. While it does not have an effect on the choice of working only, it reduces the probability of the child schooling only, and increases the probability of schooling and working, and neither schooling and working. This means that children are forced to miss school in search of firewood, or they combine schooling and working. This same scenario applies to livestock ownership, with the only difference being that the more livestock a household owns, the higher the probability that a child will be working only. This happens mostly in nomadic/pastoralist comminuties, where children are pulled out of school to fend for the animals or drive them to greener pastures. With regard to water sources, use of unprotected surface water sources greatly influences the activity a child engages in. While it reduces the probability of a child being in school only, it increases the probability of a child working only or neither schooling nor working.
An increase in the size of household reduces the probability of a child working only, while it increases the probability of a child working and schooling at the same time. Khan (2003) agrees with this findings in a study carried out in Pakistan, where children from large families were more likely to combine work and school.
An increase in the age of household head increases the probability of a child being in school only, while it reduces the probability of a child working only or neither being in school nor working. Sex of household head also has an influence on decision-making. The results indicate that being in a male-headed household reduces the probability of being in school only, while increasing the probability of either working only, or neither schooling nor working compared to being in a female-headed household.
Nature of work of household head also influences the status of the child. When a household head is working in own or family agriculture, it reduces the probability of a child being in school, while increasing the probability of a child either schooling and working or working only. This can be taken to assume that the household’s source of livelihood is mainly agriculture. A higher percentage of children live in rural areas and most rural household engage in agricultural activities. In cultural

21
settings, children will accompany their elders within the household to work in agricultural holdings, especially during planting and harvesting seasons. The agricultural sector employs the highest percentage of children.
Education level of household head has an influence on the child’s choice of activity. The education levels of household heads (who mostly are the parents) affect the decision of whether a child will participate in the labour force (ILO, 1992; Grootaert and Kanbur, 1995). Regardless of the educational level attained by the household head, having a head who has been to school reduces the likelihood of a child working only. However, having a household head with up to Primary 4 has no significance in determining whether a child will be in school only, school and work or do neither. A head with an educational level of Primary 5 and above increases the probability of a child schooling only while reducing the probability of neither working nor schooling and working only. Only heads with educational level of Form 5 and above have a significant effect in reducing the probability of a child combining both school and work. It is assumed that parents having higher education create a high demand in directing their children to school, since those who have higher education place great importance on the education of their children and hence direct them to school instead of working (Khanam, 2004). This explains the effect of education on household decision-making and the value attached to education by household heads who have ever gone to school. It also reflects a direct education effect on child labour.
4.2.3 Community characteristics
The characteristics of the communities children live in are also likely to influence decisions that are made at household level. Variables used include region of residence, place of residence, and cost of schooling.
The results indicate that living in rural areas increases the probability of a child working and schooling only. On regional disparities, living in North Eastern Province increases the probability of a child neither schooling nor working, while reducing the probability of working only and schooling only. A child living in Coast Province has increased probability of neither schooling nor working. This indicates that child labour could have different determinants in different regions. The nature of work a child living in the rural areas will engage in could be different from that of a child living in urban areas (Ray, 2000).
The results revealed that increase in school costs increases the probability of a child being in school only while reducing the probability of neither schooling nor working, or working only. However, school costs of over Ksh 10,000 reduce the probability of schooling only and that of being in school and working and increase the probability of the other two options.
Results and discussion

22
Child labour and its determinants in Kenya
5. Conclusion and Recommendations
5.1 Conclusion
The aim of this study was to analyze child labour and its key determinants in Kenya. A multinomial logit model was used to estimate the effects of child, household and community characteristics on the four choices: schooling, schooling and working, neither schooling nor working, and working only.
This paper provides evidence on the main determinants of child labour in Kenya. The results suggest that a child’s household head, household and community characteristics are all important determinants of child labour. Sex, school cost, household monthly expenditure, place of residence, sources of water, family size, and work of the household head are among factors that influence a decision to have a child engaged in labour and attending school at the same time. In addition, while number of animals, sex and work of the household head, water source, and age of the child increase the probability of a child working only, large size of household land, age and education of household head, household size and monthly expenditure, and being a child to the household head reduces the probability of working only.
Child labour does not extend to poor families only. Children from richer families are also involved in child labour. However, the type of work that the children perform differs; children from poor households are more likely to work for pay, while children from richer households are more likely to work in family enterprises.
The analysis has several policy implications. There is evidence that welfare measure of the households has great impact on child labour. Therefore, an important policy implication is that the government should put more effort in poverty alleviation if it is going to succeed in fighting child labour. Since the government has already reduced the direct costs of schooling by introducing free primary and secondary education, another possible solution is to improve the income possibilities of the heads of households.
5.2 Policy Recommendations
The findings of the study provide important directions for policy makers. Programmes that aim at retaining older children in school should be adopted, as well those that would enable them transit from primary to secondary school without having to drop out. This can be done by extending the FPE to cover Free Secondary Education, unlike the current subsidised format for the latter. The cost of education, especially in secondary schools, should be minimized to a maximum
23
of Ksh 10,000 per school year. This will make education affordable, enabling most children access education and indirectly pull them out of child labour. Introduction of more public day secondary schools will be an added advantage in line with this aspiration.
In addition to the above, access to quality and affordable education to all will break the intergenerational cycle of child labour replicated by the inter-generational poverty trap. Enhancing the education levels of parents who are usually the heads of households and, therefore, decision-makers may play a role in resolving this problem. The government should thus increase the education level of adults capable of affecting the decision making mechanism, especially in rural regions.
Identifying children of the most poor and vulnerable families in the community and assisting them using safety nets will pull the children out of child labour.
5.3 Areas of Further Research
The results of the study indicate that a large number of children are neither working nor schooling. This phenomenon warrants greater attention. This study recommends further research to find out the main causes and come up with possible intervention measures. Specific attention should be given to North Eastern and Coast provinces, where children are more likely to be neither schooling nor working compared to other provinces. These results will help in mitigating regional disparities in the choice of child activities, and will help in informing policy.
Conclusion and recommendations
24
Child labour and its determinants in Kenya
References
Ashagire, K. (1997), Statistics on Working Children and Hazardous Child Labour in Brief, Geneva: International Labour Organization.
Baland, J. M. and J. A. Robinson (2000), “Is Child Labour Inefficient?” Journal of Political Economy, Vol. 108, No. 4.
Basu, K. (1999), “Child Labour: Cause, Consequences and Cure, with Remarks on International Labour Standards”, Journal of Economic Literature, Vol. 37, Issue 2, pp. 1083-1119.
Basu, K. and P.H. Van (1998), “The Economics of Child Labour”, American Review, Vol. 88, No. 3.
Becker, G.S. (1981, Enlarged Edition, 1991), A Treatise on the Family, Cambridge: Harvard University Press.
Becker, G. (1964), Human Capital, Chicago: University of Chicago Press.
Becker, G.S. and H.G. Lewis (1973), “Interaction between the Quantity and Quality of Children”, Journal of Political Economy, No. 81, Vol. 2.
Bequele, A. and W.E. Myers (1995), First Things First: Eliminating Work Detrimental to Children, Geneva: UNICEF/ILO.
Bhalotra, S. (2003), Child Labour in Africa, OECD Social, Employment and Migration Working Papers, No. 4. Paris: OECD Publishing.
Bhalotra, S. and C. Heady (1998), Child Labour in Rural Pakistan and Ghana, mimeo, University of Bristol and University of Bath and Bristol.
Bradley, C. (1993), “Women’s Power, Children Labour”, Cross Cultural Research, 27 No.1-2.
Buchmann, C. (2000), “Family Structure, Parental Perceptions, and Child Labour in Kenya: What Factors Determine Who is Enrolled in School?” Social Forces, Vol. 78, No. 4.
Canagarajah, S. and C. Harold (1997), Child Labour and Schooling in Ghana: A World Bank Policy Research Working Paper 1844. Washington DC: World Bank.
Canagarajah, S. and H. Nielson (1999), Child Labour and Schooling in Africa: A Comparative Study Human Development Network, Social Protection, Washington DC: World Bank.

25
References
Chaubey, J., Perisic, M., Perrault, N., Laryea-Adjei, G. and Khan, N. (2007), Child Labour, Education and Policy Options, New York: United Nations Children’s Fund.
Cigno, A. and Rosati F.C. (2000), “Why Do Indian Children Work, and Is It Bad for Them?” IZA Discussion Paper 115.
Dammert, A. (2005), Does Child Labour Decline with Household Income? A Non-Parametric Approach, Department of Economics, Syracuse University.
Diallo , Y., F. Hagemann, A. Etienne, Y. Gurbuzer, F. Mehran (2010), Global Child Labour Developments: Measuring Trends from 2004 to 2008, Geneva: International Labour Organization.
ECPAT-UK (2005), Child Sex Tourism in Kenya, London: Grosvenor Gardens House.
Fares, J. and Raju D. (2007), “Child Labour across the Developing World: Patterns and Correlations,” World Bank Policy Research Working Paper 4119. Washington DC: World Bank.
Government of Kenya (2001), Children’s Act, Cap 141 Laws of Kenya. Nairobi: Government Printer.
Government of Kenya (2007), Employment Act, Cap 226, Laws of Kenya. Nairobi: Government Printer.
Government of Kenya (2001), The 1998/99 Child Labour Report, Nairobi, Available at www.undp.org/mdg/basics.shtml.
Grootaert, C. and Kanbur, R. (1995), “Child Labour: A Review,” World Bank Policy Research Working Paper No. 1454, May.
Grootaert, C. (1999), “Social Capital, Household Welfare and Poverty in Indonesia,” Local Level Institutions Working Paper No. 6, Washington DC: The World Bank.
Grootaert, C. and Patrinos H. A. (1998), “The Policy Analysis of Child Labour: A Comparative Study. Mimeo,” Washington DC: World Bank.
Guarcello, L., F. Mealli and F.R. Rosati (2009), “Household Vulnerability and Child Labour: The Effect of Shocks, Credit Rationing, and Insurance,” Journal of Population Economics, Vol. 23.
Hagemann, F., Y. Diallo, A. Etienne, F. Mehran (2006), Global Child Labour Trends: 2000 to 2004, Geneva: International Labour Organization.
26
Child labour and its determinants in Kenya
Himayatullah, K. (2005), Child Labour Today: Issues, Causes and Consequences, Paper Presented in the 8th Sustainable Development Conference Organized by the Sustainable Development Policy Institute (SDPI), Islamabad, Pak., Dec. 7-9.
ILO (1973), Convention Concerning Minimum Age for Admission to Employment, Convention No. 138, 58th International Labour Conference, Geneva.
ILO (1999) “Convention Concerning the Prohibition and Immediate Action for Elimination of the Worst Forms of Child Labour, Convention No. 182, 87th International Labour Convention, Geneva.
ILO/IPEC (2002a), Every Child Counts: New Global Estimates on Child Labour. Geneva: International Labour Organization.
ILO/IPEC (2002b), Kenya Child Labour Data Country Brief. Geneva: International Labour Organization.
ILO (1992), World Congress on the Elimination of Child Labour, Report of the Director-General Governing Body, 253rd Session, Geneva.
Jensen, P. and H.S. Nielsen (1996), “Child Labour or School Attendance? Evidence from Zambia”, Working Paper, Centre for Labour Market and Social Research, Aarhus, Denmark.
Jones S. C. (2006), The Extent and Effect of Sex Tourism and Sexual Exploitation of Children on the Kenyan Coast, UNICEF and the Government of Kenya.
KNBS/ILO/IPEC (2008), Kenya Integrated Household Budget Survey: Child Labour Analytical Report, Nairobi: Kenya National Bureau of Statistics.
Khan R.E.A. (2003), “Children in Different Activities: Child Schooling and Child Labour,” Pakistan Development Review 42:2, pp 137-160.
Khanam, R. (2004), “Child Labour in Bangladesh: Determinants and Effects”, Discipline of Economics, University of Sidney, Australia
Levison, D. (1991), Children’s Labour Force Activity and Schooling in Brazil, University of Michigan, Ph.D Dissertation.
Liu, A.Y. (1998), School Children’s Participation Behaviour in Vietnam: An Empirical Analysis, The 12th Annual Conference of the European Society for Population Economics, Amsterdam, Netherlands.
Manda, D., P. Kimalu, N. Nafula, D. Kimani, R. Nyaga, J. Mutua, G. Mwabu and S. Kimenyi (2003), “Costs and Benefits of Eliminating Child Labour in Kenya”, KIPPRA Discussion Paper No. 10, Nairobi.

27
Monasch, R. and Snoad N. (2003), The Situation of Orphans in a Region Affected by HIV/AIDS, Paper Presented at the Scientific Meeting on Empirical Evidence for the Demographic and Socio-Economic Impact of AIDS, Hosted by the Health Economics and HIV/AIDS Research Division (HEARD), Durban, March 26-28.
Ranjan, P. (2001), “Credit Constraints and the Phenomenon of Child Labour”, Journal of Development Economics, Vol. 64.
Ray, R. (2000), “Analysis of Child Labor in Peru and Pakistan: A Comparative Study”, Journal of Population Economics, Vol. 13.
Suliman E.D. (2003), “HIV/AIDS Effects on AIDS Orphans in Tanzania,” Working Paper, Baltimore, Maryland: Johns Hopkins University.
References
28
Child labour and its determinants in Kenya
b04
b05a
orp
hans
1 hh
h_re
l fw
d_co
l lan
dsiz
e to
t_an
i hhs
iz_
2 w
ater
_s
mon
_ex
p hh
h_se
x hh
h_w
hhh
_ag
e hh
h_ed
uc p
rovi
nce
ruru
rban
sch
_co
st
b04
1.00
00
b05a
0.
0074
1.0
000
orph
ans1
-0.0
009
0.07
49 1
.000
0
hhh_
rel
0.01
18 -0
.042
2 -0
.341
0 1.
0000
fwd_
col
0.00
81 0
.024
2 -0
.009
1 -0
.012
2 1.
0000
land
size
-0
.007
5 0.
0199
-0.0
103
-0.0
021
0.15
68 1
.000
0
tot_
ani
0.01
37 0
.042
3 -0
.001
4 -0
.031
7 0.
3334
0.1
739
1.00
00
hhsi
z_2
-0.
0113
0.0
511
-0.0
214
0.02
39 0
.101
0 0.
0437
0.1
843
1.00
00
wat
er_
s 0
.009
6 -0
.007
7 0.
0050
-0.0
062
0.21
78 0
.026
0 0.
1704
0.0
890
1.00
00
mon
_ex
p -0
.016
1 -0
.000
8 -0
.000
8 0.
0152
-0.3
716
-0.0
564
-0.1
573
-0.2
189
-0.2
483
1.00
00
hhh_
sex
0.0
068
-0.0
594
-0.0
969
0.19
61 -0
.030
8 0.
0117
0.0
674
0.19
98 -0
.017
6 0.
0422
1.0
000
hhh_
w
0.01
91 0
.029
9 0.
0324
-0.1
241
0.20
66 -0
.023
1 0.
1548
0.0
386
0.15
02 -0
.286
6 -0
.197
0 1.
0000
hhh_
age
0.0
276
0.18
98 0
.077
6 -0
.324
1 0.
1332
0.0
224
0.16
25 0
.155
5 0.
0609
-0.1
745
0.06
10 0
.243
0 1.
0000
hhh_
educ
-0.0
174
-0.0
221
-0.0
313
0.13
64 -0
.253
3 0.
0543
-0.1
048
-0.0
841
-0.2
130
0.46
08 0
.192
6 -0
.393
8 -0
.319
9 1.
0000
prov
ince
0.
0116
-0.0
116
0.01
19 -0
.007
5 0.
1324
0.0
446
0.13
91 0
.063
5 0.
0617
-0.1
135
-0.0
170
0.01
72 -0
.034
9 0.
0160
1.0
000
ruru
rban
0.0
161
0.00
58 -0
.017
4 0.
0001
0.5
178
0.17
85 0
.458
1 0.
1153
0.2
933
-0.4
256
0.00
57 0
.252
0 0.
1420
-0.2
733
0.08
56 1
.000
0
sch_
cost
-0.0
237
0.05
18 -0
.031
3 0.
0533
-0.1
511
-0.1
095
-0.1
112
-0.0
399
-0.0
751
0.23
87 0
.061
3 -0
.079
6 -0
.065
8 0.
1145
-0.0
548
-0.1
691
1.00
00
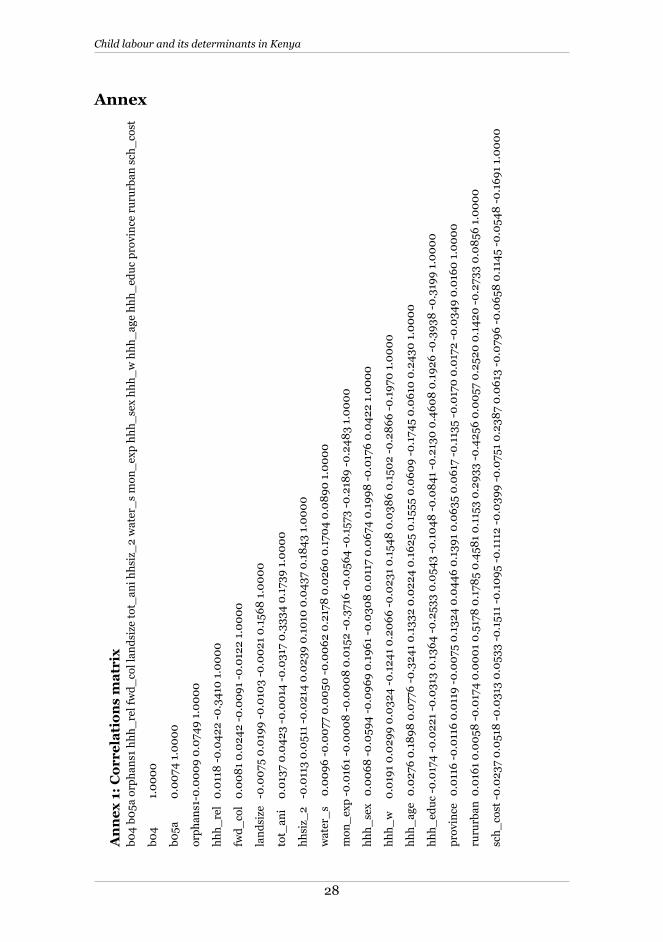
An
nex
1: C
orre
lati
ons
mat
rix
Annex

29
Variable Frequency Percentage
child labour
yes 1,661 7.2
no 21,549 92.8
child activities
school only 19,095 654
school and work 2,454 1,007
neither school nor work 82.3 2.8
work only 10.6 4.3
sex
male 11,613 11,597
female 50.0 50.0
orphan hood
orphan 695 22,515
not orphan 3.0 97.0
relation to household head
spouse/child 18,590 4,620
others 80.1 20.0
region of residence
Nairobi 539 1,905
Central 2,364 4,387
Coast 1,344 3,575
Eastern 6,066 3,030
North Eastern 2.3 8.2
Nyanza 10.2 18.9
Rift-valley 5.8 15.4
Western 26.1 13.1
place of residence
rural 17,394 5,816
urban 74.9 25.1
sex of household head
male 16,251 6,959
female 70.0 30.0
education of household head
no education 6,864 29.6
primary 1-4 2,580 11.0
primary 5-8 7,436 32.0
form 1-2 1,381 6.0
form 3-4 40.42 17.4
form 5 and above 907 4.0
Total 23,210 100
Annex 2: Descriptive statistics
Annex

30
Child labour and its determinants in Kenya
Agriculture Mining and Quarrying Manufacturing Construction Wholesale Services Transport and Communication Financial Institutions Law and Order
Annex 3: Child labour by sector
31
Annex
Variables Schooling Only Schooling and Working Neither Schooling nor Working Working Only
Sex 0.000816 0.00608*** -0.00744*** 0.000544
(0.00220) (0.00154) (0.00129) (0.000620)
Orphanhood 0.00661 -0.00335 -0.00132 -0.00194
(0.00568) (0.00401) (0.00344) (0.00123)
Province (Nairobi =reference)
Central -0.0478 0.0513 -0.00283 -0.000660
(0.0593) (0.0605) (0.00462) (0.00271)
Coast -0.0205 -0.00568 0.0268** -0.000528
(0.0183) (0.0149) (0.0109) (0.00275)
Eastern -0.0297 0.0224 0.00626 0.00104
(0.0331) (0.0334) (0.00603) (0.00306)
North Eastern -0.0353* -0.0107 0.0502*** -0.00429***
(0.0204) (0.0111) (0.0174) (0.00159)
Nyanza -0.0266 0.0218 0.00791 -0.00314
(0.0340) (0.0343) (0.00657) (0.00210)
Rift-valley -0.0240 0.0213 0.000935 0.00174
(0.0299) (0.0301) (0.00496) (0.00309)
Western -0.0425 0.0326 0.00886 0.00109
(0.0424) (0.0432) (0.00707) (0.00326)
Firewood -0.0147*** 0.00947*** 0.00368** 0.00156
(0.00333) (0.00257) (0.00173) (0.000995)
landsize -0.00190 0.00243** 0.000403 -0.000929**
(0.00136) (0.000952) (0.000772) (0.000405)
Animals -0.00445*** 0.00348*** -0.00117 0.00214***
(0.00140) (0.000963) (0.000811) (0.000431)
Sex_hhh -0.00780*** 0.00181 0.00440*** 0.00158**
(0.00242) (0.00176) (0.00134) (0.000671)
Work_hhh(worked for pay=reference)
work on family 0.000611 -0.00320 0.00153 0.00106
business (0.00375) (0.00276) (0.00204) (0.00119)
work on family -0.0142*** 0.0114*** -0.00152 0.00425***
agric. holding (0.00356) (0.00268) (0.00181) (0.00117)
other work types -0.00645 0.00314 0.00257 0.000738
(0.00401) (0.00305) (0.00213) (0.00114)
Siz_hh 0.00241 0.00286** -0.00146 -0.00380***
(0.00194) (0.00138) (0.00108) (0.000611)
Age_hhh 0.00600*** -6.54e-05 -0.00367*** -0.00227***
(0.000995) (0.000708) (0.000562) (0.000307)
Water_S(tap water=reference)
protected surface -0.00268 -0.00329 0.00433* 0.00164
(0.00367) (0.00242) (0.00226) (0.00118)
Annex 4: Multinomial logit results

32
Child labour and its determinants in Kenya
unprotected surface -0.0143*** 0.00436* 0.00646*** 0.00345***
(0.00352) (0.00247) (0.00203) (0.00110)
other sources -0.00977** -0.000114 0.00625** 0.00364**
(0.00456) (0.00311) (0.00265) (0.00156)
Age 0.000352 0.000186 -0.00209*** 0.00155***
(0.000316) (0.000215) (0.000188) (0.000131)
Sch_cost (zero =Reference)
Kshs. 1-100 0.0201*** 0.00223 -0.0185*** -0.00389***
(0.00434) (0.00383) (0.00149) (0.00140)
Kshs. 101-500 0.0259*** 0.00393 -0.0231*** -0.00673***
(0.00380) (0.00302) (0.00198) (0.00116)
Kshs. 501-2000 0.0229*** 0.00125 -0.0181*** -0.00605***
(0.00375) (0.00283) (0.00211) (0.00125)
Kshs. 2001 to 10000 0.0117** -0.00571* -0.00479 -0.00118
(0.00492) (0.00304) (0.00324) (0.00211)
Over Kshs. 10000 -0.392*** -0.0146*** 0.310*** 0.0971***
(0.0229) (0.00231) (0.0238) (0.0136)
mon_exp 0.0161*** 0.00403*** -0.0145*** -0.00562***
(0.00170) (0.00105) (0.00114) (0.000611)
Educ_hhh(none=reference)
Primary 1-4 0.00362 -0.00132 0.000589 -0.00289***
(0.00366) (0.00247) (0.00234) (0.000845)
Primary 5-8 0.00978*** -0.000302 -0.00288* -0.00660***
(0.00300) (0.00217) (0.00171) (0.000864)
Form 1-2 0.0188*** -1.32e-05 -0.0123*** -0.00648***
(0.00384) (0.00343) (0.00155) (0.000709)
Form 3-4 0.0279*** -0.00156 -0.0177*** -0.00858***
(0.00319) (0.00266) (0.00150) (0.000852)
Form 5 and above 0.0393*** -0.0155*** -0.0173*** -0.00643***
(0.00328) (0.00296) (0.00126) (0.000709)
Relation 0.0357*** -0.00220 -0.0180*** -0.0155***
(0.00438) (0.00233) (0.00276) (0.00199)
Residence -0.00439 0.00674*** -0.00161 -0.000732
(0.00349) (0.00249) (0.00197) (0.00108)
Observations 23,210 23,210 23,210 23,210