child health leadership and networks in tanzania …
TRANSCRIPT
AFR
ICA
RE
CHILD HEALTH LEADERSHIP AND
NETWORKS IN TANZANIA FROM
2000 TO THE PRESENT: COUNTRY
PERSPECTIVES
CASE STUDY REPORT ANNEXES
MARCH 2020
USAID.GOV TANZANIA CASE STUDY REPORT ANNEXES | 2
Contract Number:
AID-OAA-M-16-00006
This document was made possible by the support of the American People through the United States Agency for International Development
(USAID) under the terms of the Coordinating Implementation Research to Communicate Learning and Evidence (CIRCLE) contract AID-OAA-
M-16-00006. CIRCLE is implemented by Social Solutions International, Inc. Views expressed are not necessarily of USAID or other affiliated
institutions.

USAID.GOV TANZANIA CASE STUDY REPORT ANNEXES | 3
CONTENTS
Contents .............................................................................................................................................................................. 3
Annex A: Desk Review ................................................................................................................................................... 4
Annex B: Detailed Methodology .................................................................................................................................. 52
Annex C: Instruments ................................................................................................................................................... 67
Annex D: ONA – Complete Results .......................................................................................................................... 77
For more information ..................................................................................................................................................... 92
USAID.GOV TANZANIA CASE STUDY REPORT ANNEXES | 4
ANNEX A: DESK REVIEW
Country Perspectives on Child Health Leadership and Networks in Tanzania from 2000 to Present
TANZANIA CASE STUDY DESK REVIEW
JUNE 2018

USAID.GOV TANZANIA CASE STUDY REPORT ANNEXES | 5
CONTENTS (DESK REVIEW REPORT)
Introduction ....................................................................................................................................................................... 7
Child Health Outcomes ................................................................................................................................................... 8
Policies, Programs and Strategies................................................................................................................................. 20
Governance and Partnerships ....................................................................................................................................... 25
Delivery Platforms ........................................................................................................................................................... 31
Conclusions ....................................................................................................................................................................... 35
Desk Review Appendices............................................................................................................................................... 36
USAID.GOV TANZANIA CASE STUDY REPORT ANNEXES | 6
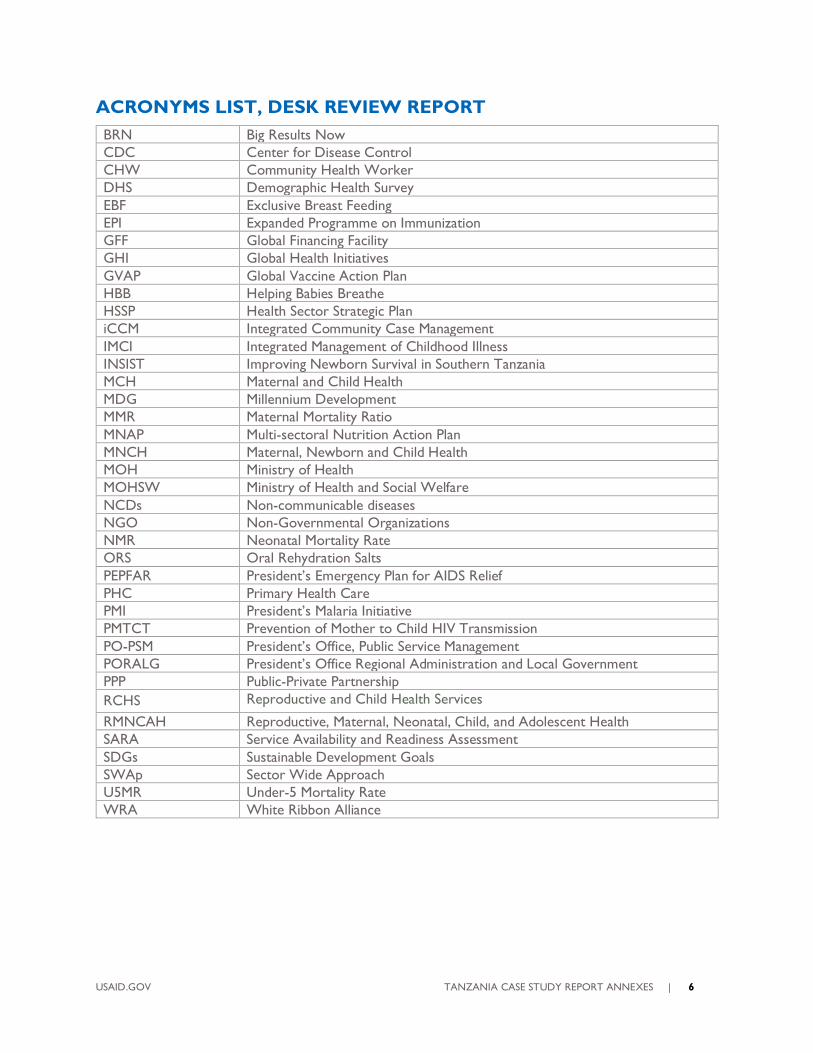
ACRONYMS LIST, DESK REVIEW REPORT
BRN Big Results Now
CDC Center for Disease Control
CHW Community Health Worker
DHS Demographic Health Survey
EBF Exclusive Breast Feeding
EPI Expanded Programme on Immunization
GFF Global Financing Facility
GHI Global Health Initiatives
GVAP Global Vaccine Action Plan
HBB Helping Babies Breathe
HSSP Health Sector Strategic Plan
iCCM Integrated Community Case Management
IMCI Integrated Management of Childhood Illness
INSIST Improving Newborn Survival in Southern Tanzania
MCH Maternal and Child Health
MDG Millennium Development
MMR Maternal Mortality Ratio
MNAP Multi-sectoral Nutrition Action Plan
MNCH Maternal, Newborn and Child Health
MOH Ministry of Health
MOHSW Ministry of Health and Social Welfare
NCDs Non-communicable diseases
NGO Non-Governmental Organizations
NMR Neonatal Mortality Rate
ORS Oral Rehydration Salts
PEPFAR President’s Emergency Plan for AIDS Relief
PHC Primary Health Care
PMI President’s Malaria Initiative
PMTCT Prevention of Mother to Child HIV Transmission
PO-PSM President’s Office, Public Service Management
PORALG President’s Office Regional Administration and Local Government
PPP Public-Private Partnership
RCHS Reproductive and Child Health Services
RMNCAH Reproductive, Maternal, Neonatal, Child, and Adolescent Health
SARA Service Availability and Readiness Assessment
SDGs Sustainable Development Goals
SWAp Sector Wide Approach
U5MR Under-5 Mortality Rate
WRA White Ribbon Alliance
USAID.GOV TANZANIA CASE STUDY REPORT ANNEXES | 7
INTRODUCTION
Tanzania has experienced several decades of political stability with recent high-level attention to
reproductive, maternal, neonatal, child, and adolescent health (RMNCAH) as signified by President
Jakaya Kikwete co-chairing the UN Commission on Information and Accountability for the UN
Secretary-General’s Global Strategy for Women’s and Children’s Health in 2011. Countdown Case
Studies concluded that Tanzania’s progress on RMNCAH was mixed, with substantial advances in child
survival but slower progress in maternal and newborn survival, and family planning [1]. The country
achieved the fifth fastest reduction in under-5 mortality rate (U5MR) for the Countdown to 2015
countries, attaining the MDG 4 target with a U5MR of 54 deaths per 1000 live births in 2013. However,
the targets for maternal and neonatal mortality were not met. In 2015, reduction in neonatal mortality
accounted for 40% of deaths in children younger than 5 years, and the maternal mortality ratio (MMR)
was 410 deaths per 100,000 live births. A study that analyzed reasons for progress in RMNCAH from
1990-2004 found that U5MR progress was related to increased health resources combined with a
decentralized health system [2]. The conclusions from this and from the Countdown Case Study
underscore that continued focus is needed on addressing unmet need for family planning, gaps in
coverage and quality of care at birth (especially in rural areas) [1]. As the country looks towards 2030,
there is an urgent need to continue and maintain the progress on child health and address the gaps in
maternal and neonatal survival.
Table 1. Key Demographic Indicators, Tanzania, 2015
Total population 53,880,000
Total under-5 population 9,419,000
Population growth rate1 3.12%
Crude birth rate 39.8
Total fertility rate 5.24
Age-specific fertility rate (15-19 years) 122.7 (SSA average: 110.4; LIC: 106.3) Source: United Nations, Department of Economic and Social Affairs, Population Division (2017)
EPIDEMIOLOGICAL AND DEMOGRAPHIC PROFILE OF THE COUNTRY
The United Republic of Tanzania is the largest country in the eastern Africa region spanning 945,000 km
including mainland and the Zanzibar islands. In 2016, Tanzania’s population was 50,733,262 and
expected to reach over 56 million by the year 2020. The population is mostly young: 43.9% below the
age of 15 years; 3.9% aged 65 years and over. Regions with a high proportion of the young population
are also areas with high fertility rates that are above the national average of 5.4 children per women.
ECONOMIC AND DEVELOPMENT CONTEXT
Sound macroeconomic policies, market-oriented reforms and debt relief have ensured a positive
environment for the country’s steady economic growth. Tanzania’s economy depends heavily on the
service sector, particularly tourism, which accounts for nearly half of GDP. Agriculture accounts for
nearly one-quarter of GDP, employing two-thirds of the work force.
At 7% in 2016, Tanzania’s economy expanded quickly, putting it close to the top of the fastest growing
economies in sub-Saharan Africa. Since coming to office in 2015, President Magufuli has reoriented
1 Average annual rate of population change (%)
USAID.GOV TANZANIA CASE STUDY REPORT ANNEXES | 8
public expenditure toward development spending, reducing recurrent expenditure significantly, and
intensifying efforts to mobilize domestic revenue.2 Government spending overall was cut back, and a cap
put in place on the salaries of executive officers. Measures were introduced to control tax
exemptions. At 5.2%, the inflation rate has remained low and close to the government’s medium-term
target of 5%.
The poverty rate fell from 60% in 2007 to 47% in 2016. Approximately 12 million Tanzanians still live in
extreme poverty (based on the US$1.90 per day global poverty line) surviving on earnings of less than
US$0.60 per day (World Bank, 2018). The majority (over 80%) of the poor and the extreme poor live in
the rural areas [3]. More than half of the rural poor depend on subsistence agriculture for their
livelihoods.
POLITICAL CONTEXT
Tanzania gained its independence in 1961 (Tanganyika since 1961 and Zanzibar since 1963), and in 1964
the two countries merged to form the United Republic of Tanzania. Julius Nyerere became president of
the new republic, and his post-independence Arusha Declaration in 1967 laid the foundations for
Tanzania’s national development based on egalitarianism, socialism and self-reliance. Tanzania continued
to be a one-party state until political reforms which brought in multi-party political elections in 1995 [4].
The country is organized into 30 administrative regions; the president is elected directly, together with
the national assembly. The last election was held in 2015. In October 2015, John Pombe Magufuli, was
elected the fifth president of the United Republic of Tanzania, ushering in a period of political change.
CHILD HEALTH OUTCOMES
Reductions in maternal, newborn, and child mortality accelerated during the Millennium Development
Goals (MDG) era, especially since 2000, most notably for U5MR [1]. Two main studies analyze trends
and outcomes of child survival in Tanzania from the period of 1999 - 2004 [2] and 2000 - 2012 [1].
NEONATAL MORTALITY
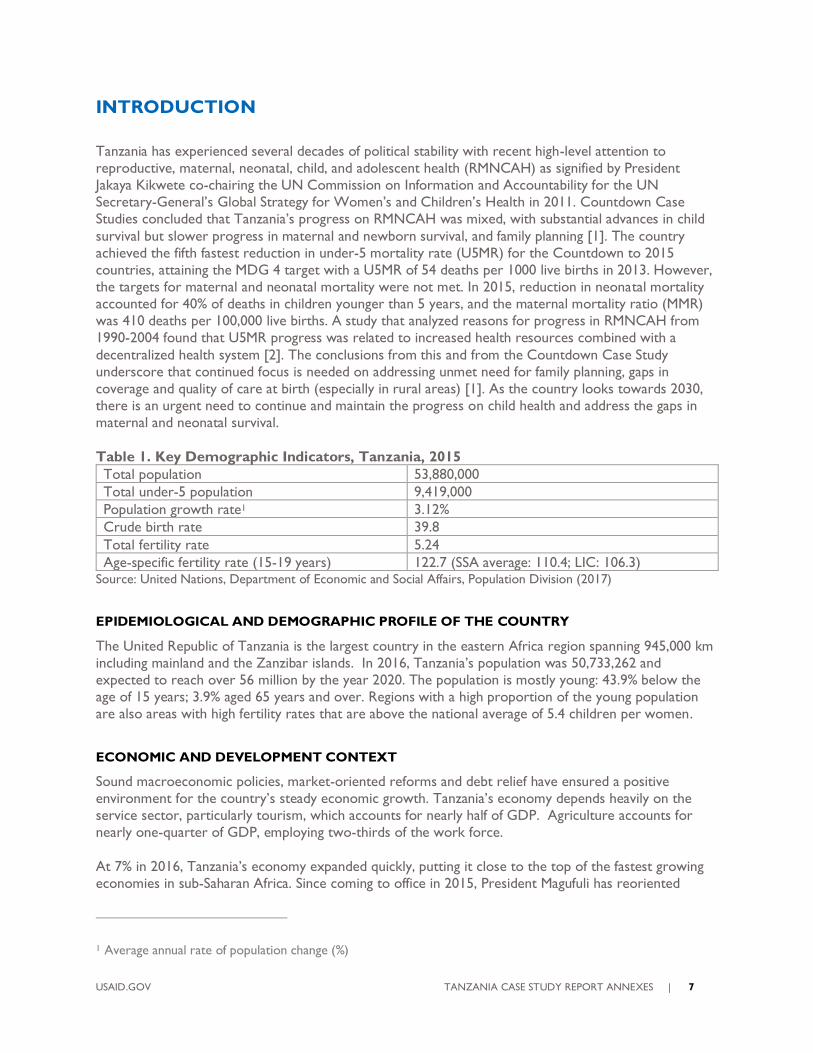
Between 2000 and 2012, neonatal mortality decreased at a substantially slower rate than under-5
mortality, at half the annual rate of reduction (ARR=4.3) and reached 21 deaths per 1000 live births by
2012 [1]. By 2016, neonatal mortality was 21.7 deaths per 1000 live births (Figure 1). The Sustainable
Development Goal (SDG) target is to reach 12 deaths per 1000 live births by 2030 (25,500 deaths).
2 http://www.worldbank.org/en/country/tanzania/overview#1
USAID.GOV TANZANIA CASE STUDY REPORT ANNEXES | 9
Figure 1. Trends in Neonatal Mortality Rate and Neonatal Deaths, Tanzania, 1990 – 2016
Source: UN Inter-agency Group for Child Mortality Estimation, 2017 (http://data.unicef.org)
STILLBIRTHS
There is poor progress in stillbirths with around 47,550 stillbirths per year, of which 47% are
intrapartum (a sensitive indicator of poor quality care at birth).
INFANT MORTALITY
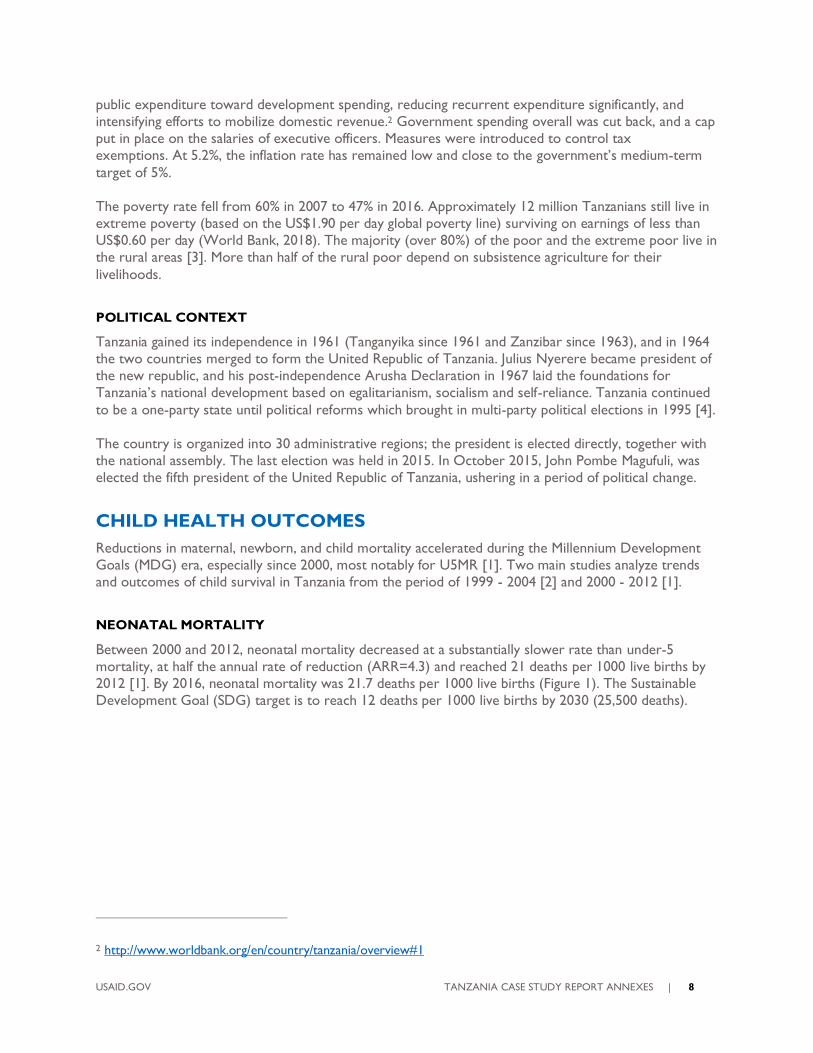
Figure 2 shows the trends in deaths among infants under 1 year. The infant mortality rate in 2016 was
40.3 deaths per 1000 live births (84,339 deaths).
Figure 2. Trends in Infant Mortality Rate and Infant deaths, Tanzania, 1990 - 2016
Source: UN Inter-agency Group for Child Mortality Estimation, 2017 (http://data.unicef.org)
UNDER-5 MORTALITY
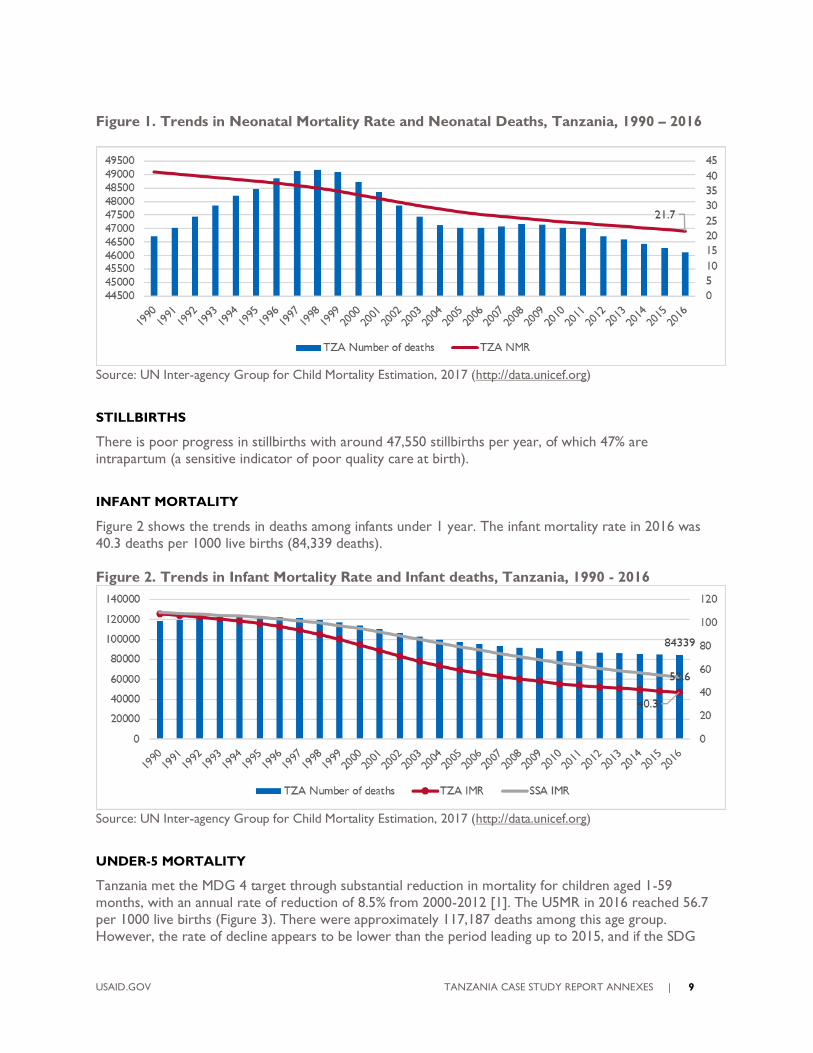
Tanzania met the MDG 4 target through substantial reduction in mortality for children aged 1-59
months, with an annual rate of reduction of 8.5% from 2000-2012 [1]. The U5MR in 2016 reached 56.7
per 1000 live births (Figure 3). There were approximately 117,187 deaths among this age group.
However, the rate of decline appears to be lower than the period leading up to 2015, and if the SDG
USAID.GOV TANZANIA CASE STUDY REPORT ANNEXES | 10
target of 14 per 1000 live births (37,400 deaths) is to be met, then efforts must be maintained to
continue the decline in under-5 mortality.
Figure 3. Trends in U5MR and U5 Deaths, Tanzania, 1990 – 2016
Source: UN Inter-agency Group for Child Mortality Estimation, 2017 (http://data.unicef.org)
DISPARITIES
Under-5 mortality is highest among infants, boys, children of uneducated mothers, children of youngest
and oldest mothers, and children from relatively poor households [5]. A study in rural Tanzania showed
that the children living in the poorest households had a risk of dying that was 1.28 times greater than
children in richest households. In the period 2001-2011, disparities by maternal education
attainment narrowed over time while those between the poorest and richest worsened in
rural areas of Tanzania. Improved child survival therefore does not necessarily indicate improved
equity. The authors conclude that there is a need for policies and programs that both reduce child
mortality and address socioeconomic disparities.
FORWARD-LOOKING PROJECTIONS
The Countdown Case Study of Tanzania concluded that projections to 2030 indicate that if present
trends continue, Tanzania could achieve child and possibly also neonatal targets in A Promised Renewed
and Every Newborn Action Plan [1].
MATERNAL MORTALITY
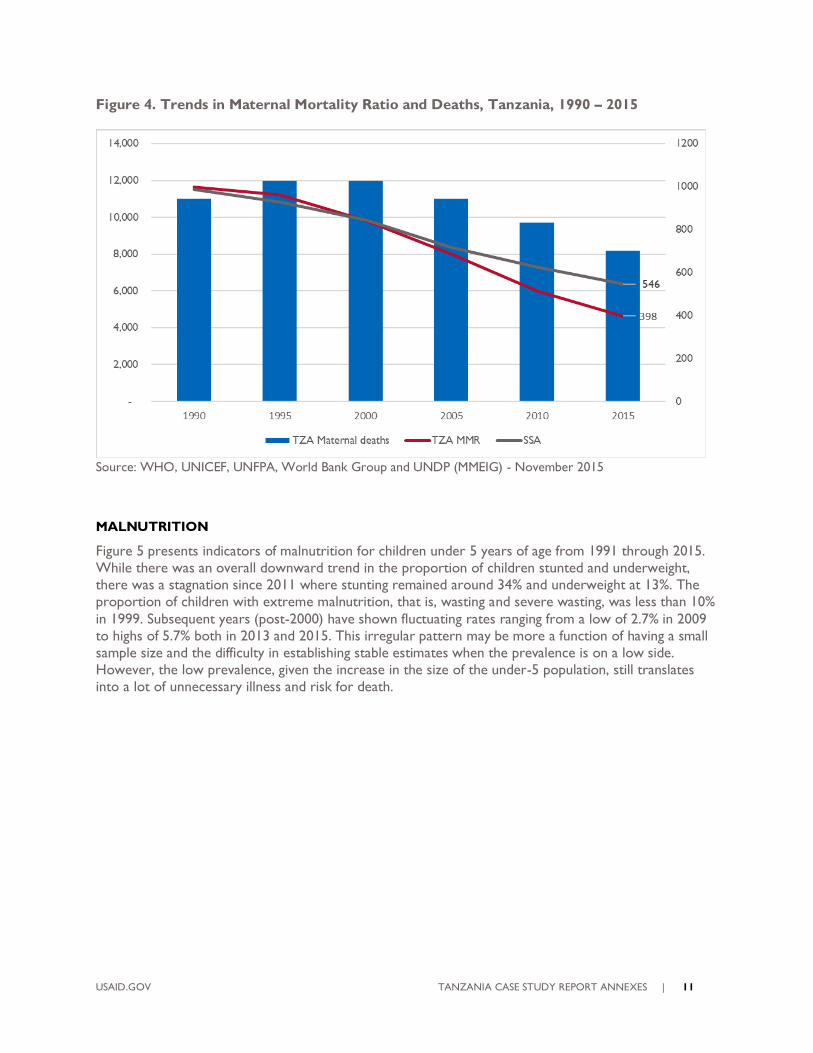
Tanzania has had less success in meeting maternal mortality targets, and not sufficient progress was
made to meet MDG 5. In period 1990-2013, the annual rate of reduction was 3.4%; and 4.7% by 2012
(still below the 5.5% required to reach MDG 5). In 2015, MMR was 398 deaths per 100,000 live births
(Figure 4). According to the Countdown case study, Tanzania is also not likely to reach the 2030 target
of 140 maternal deaths per 100,000 live births [1].
USAID.GOV TANZANIA CASE STUDY REPORT ANNEXES | 11
Figure 4. Trends in Maternal Mortality Ratio and Deaths, Tanzania, 1990 – 2015
Source: WHO, UNICEF, UNFPA, World Bank Group and UNDP (MMEIG) - November 2015
MALNUTRITION
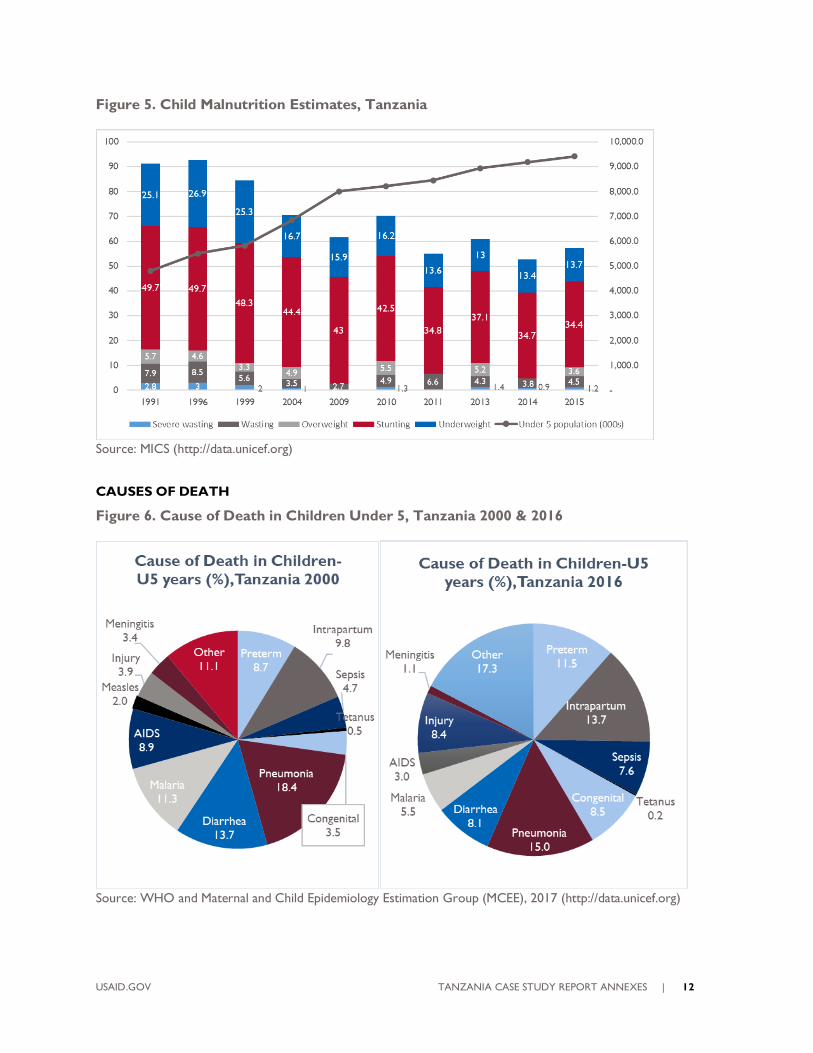
Figure 5 presents indicators of malnutrition for children under 5 years of age from 1991 through 2015.
While there was an overall downward trend in the proportion of children stunted and underweight,
there was a stagnation since 2011 where stunting remained around 34% and underweight at 13%. The
proportion of children with extreme malnutrition, that is, wasting and severe wasting, was less than 10%
in 1999. Subsequent years (post-2000) have shown fluctuating rates ranging from a low of 2.7% in 2009
to highs of 5.7% both in 2013 and 2015. This irregular pattern may be more a function of having a small
sample size and the difficulty in establishing stable estimates when the prevalence is on a low side.
However, the low prevalence, given the increase in the size of the under-5 population, still translates
into a lot of unnecessary illness and risk for death.
USAID.GOV TANZANIA CASE STUDY REPORT ANNEXES | 12
Figure 5. Child Malnutrition Estimates, Tanzania
Source: MICS (http://data.unicef.org)
CAUSES OF DEATH
Figure 6. Cause of Death in Children Under 5, Tanzania 2000 & 2016
Source: WHO and Maternal and Child Epidemiology Estimation Group (MCEE), 2017 (http://data.unicef.org)

USAID.GOV TANZANIA CASE STUDY REPORT ANNEXES | 13
Among all children under 5, infectious diseases declined from 58.2% in 2000 to 32.9% in 2016 (Figure 6).
There was a reduction in all individual infectious diseases while injuries doubled from 3.9% to 8.4%
during this time period. Conditions causing neonatal mortality such as preterm births, intrapartum
complications, congenital abnormalities, sepsis, and other conditions have increased as causes of deaths
between 2000 and 2016. Pneumonia continues to be the leading cause of death for this age group (15%).
In children 1-59 months (Figure 7), the main causes of death from childhood infections in 2000
accounted for over 72.8% of deaths but sharply declined to 49.1% by 2016. Among infections,
pneumonia continues to be the most persistent, accounting for close to 20.2% of deaths in 2016
(declining from 22.3% in 2000). Causes of death from injuries tripled (3.9% of deaths in 2000 to over
13% in 2016). As infectious diseases declined, the “other” death category reached a high of 37.5%
suggesting that deaths from non-communicable diseases are becoming an important factor in causing
death during the post-neonatal period.
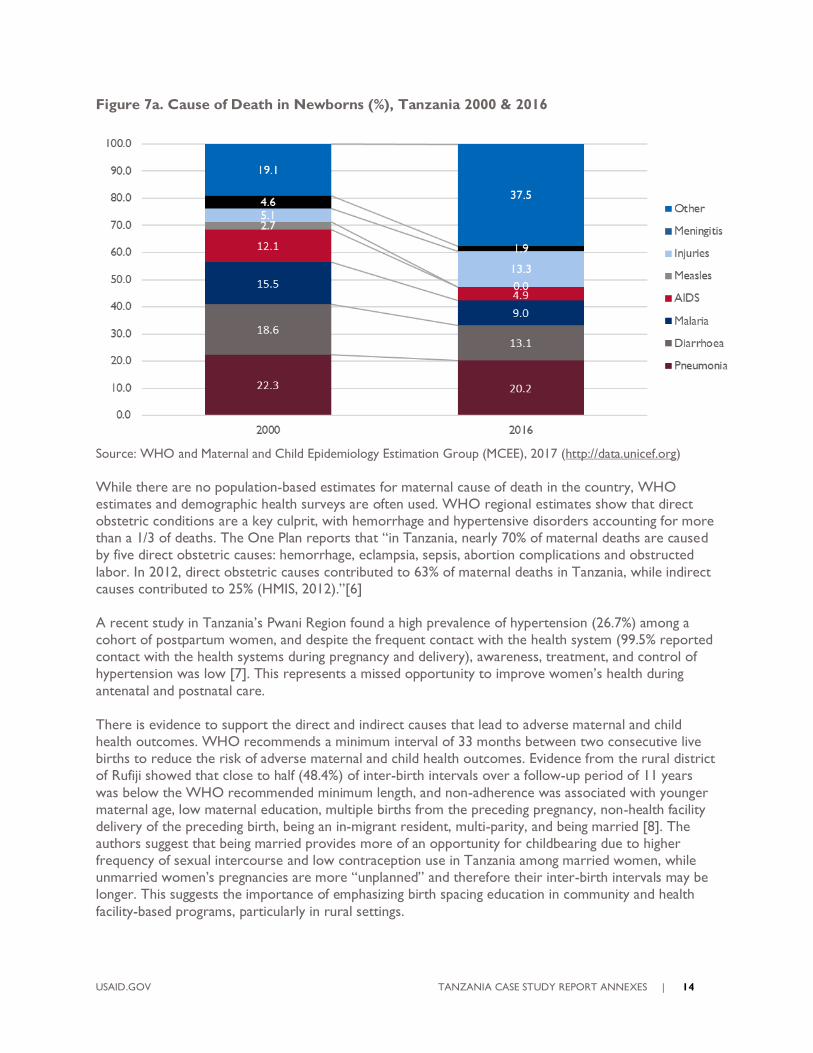
In neonates (Figure 7a), causes of mortality included intrapartum-related events (birth asphyxia: 31%);
preterm complications (24%); and sepsis (19%). These three conditions account for three quarters of
newborn deaths without much change between 2000 and 2016. Sepsis accounted for approximately 19%
of newborn deaths, which is an increase from 17% in 2000. More than 80% of neonatal deaths occur in
low birthweight, mainly preterm babies.
Figure 7. Cause of Death in Children 1-59 Months (%), Tanzania 2000 & 2016
Source: WHO and Maternal and Child Epidemiology Estimation Group (MCEE), 2017 (http://data.unicef.org)
USAID.GOV TANZANIA CASE STUDY REPORT ANNEXES | 14
Figure 7a. Cause of Death in Newborns (%), Tanzania 2000 & 2016
Source: WHO and Maternal and Child Epidemiology Estimation Group (MCEE), 2017 (http://data.unicef.org)
While there are no population-based estimates for maternal cause of death in the country, WHO
estimates and demographic health surveys are often used. WHO regional estimates show that direct
obstetric conditions are a key culprit, with hemorrhage and hypertensive disorders accounting for more
than a 1/3 of deaths. The One Plan reports that “in Tanzania, nearly 70% of maternal deaths are caused
by five direct obstetric causes: hemorrhage, eclampsia, sepsis, abortion complications and obstructed
labor. In 2012, direct obstetric causes contributed to 63% of maternal deaths in Tanzania, while indirect
causes contributed to 25% (HMIS, 2012).”[6]
A recent study in Tanzania’s Pwani Region found a high prevalence of hypertension (26.7%) among a
cohort of postpartum women, and despite the frequent contact with the health system (99.5% reported
contact with the health systems during pregnancy and delivery), awareness, treatment, and control of
hypertension was low [7]. This represents a missed opportunity to improve women’s health during
antenatal and postnatal care.
There is evidence to support the direct and indirect causes that lead to adverse maternal and child
health outcomes. WHO recommends a minimum interval of 33 months between two consecutive live
births to reduce the risk of adverse maternal and child health outcomes. Evidence from the rural district
of Rufiji showed that close to half (48.4%) of inter-birth intervals over a follow-up period of 11 years
was below the WHO recommended minimum length, and non-adherence was associated with younger
maternal age, low maternal education, multiple births from the preceding pregnancy, non-health facility
delivery of the preceding birth, being an in-migrant resident, multi-parity, and being married [8]. The
authors suggest that being married provides more of an opportunity for childbearing due to higher
frequency of sexual intercourse and low contraception use in Tanzania among married women, while
unmarried women’s pregnancies are more “unplanned” and therefore their inter-birth intervals may be
longer. This suggests the importance of emphasizing birth spacing education in community and health
facility-based programs, particularly in rural settings.
USAID.GOV TANZANIA CASE STUDY REPORT ANNEXES | 15
Mother’s age is an important risk factor for child survival, particularly among neonates. Approximately
44% of women in rural parts of Tanzania have given birth before the age of 18 [9]. A study describing
the factors associated with neonatal survival in parts of Kilombero and Ulanga districts (rural areas in
Tanzania) found the neonatal mortality rate to be 32 per 1000 live births, with increased risk of
mortality among neonates born to younger mothers aged 13-19 years compared to those 20 years and
older, if they were in second birth order, and if their mothers had no partner co-resident in the
household [10]. They also found that short-birth interval was associated with increased risk of neonatal
mortality, and that male born neonates were at increased risk of mortality. The authors recommend
delaying the age of first birth as a valuable strategy to promote and improve neonatal health and survival.
Prioritizing girls’ formal education and economic empowerment strategies may be worthwhile measures
toward reducing adolescent pregnancy and ultimately improving neonatal survival.
COVERAGE OF KEY INTERVENTIONS
This section reviews the coverage and trends in some of the key interventions along the RMNCAH
continuum of care. We start first with key coverage interventions on reproductive and maternal health,
delivery, newborn care, immunization, and Vitamin A supplementation. This is followed by care-seeking
indicators for infections including pneumonia, diarrhea, and malaria. Finally, we discuss nutrition
coverage including indicators on complementary feeding (minimum acceptable diet, minimum diet
diversity, and minimum diet frequency). Data were compiled from available Demographic Health Surveys
(DHS) (including the latest 2016 survey) and indicators reported in the Tanzania Countdown Case
Study.
INTERVENTIONS ALONG THE CONTINUUM OF CARE
REPRODUCTIVE AND MATERNAL HEALTH
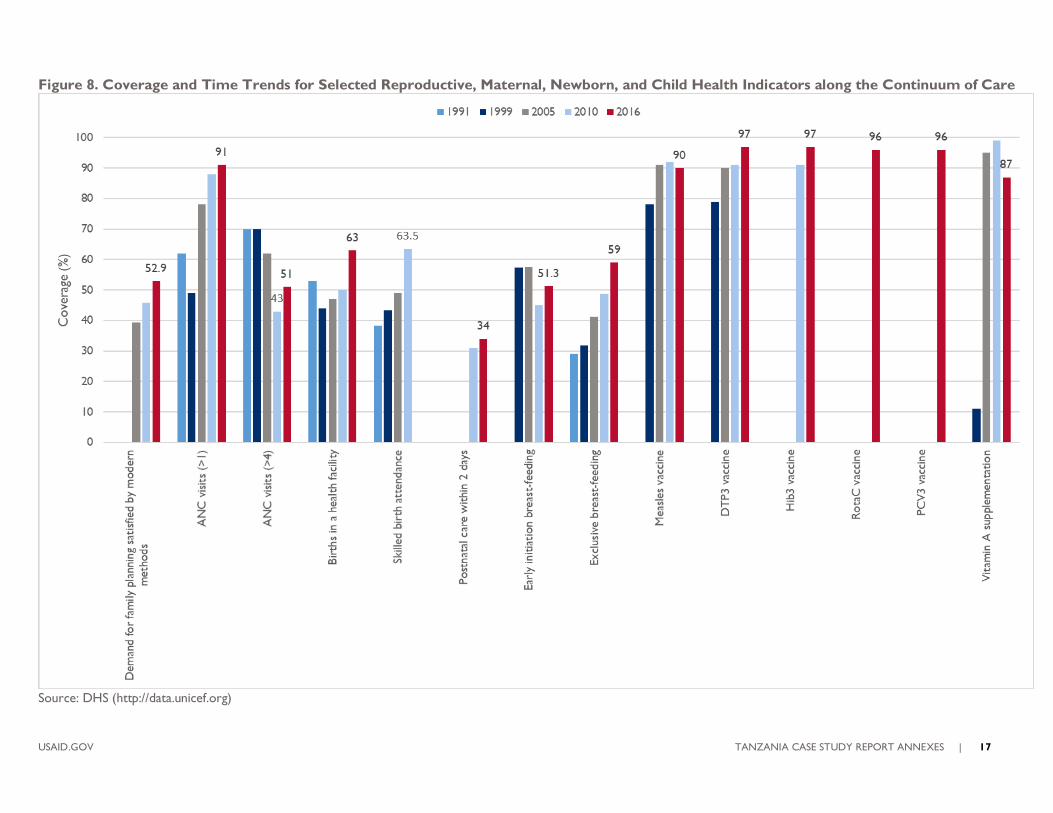
Coverage remains low for the proportion of demand for family planning satisfied by modern
contraceptives methods although it has increased slightly from 2010 (46% in 2010 and 52.9% in 2016).
As reported in the Countdown case study, there are large disparities in by socioeconomic status [1].
DELIVERY
For care around delivery and birth, while over 90% of women attend at least one antenatal care visit,
only half of pregnant women attend the recommended four or more antenatal care visits. Coverage
decreased substantially in 2010 (43%) but it increased to 51% in 2016. The differences between the
almost universal access to at least one antenatal care coverage and more visits suggests quality of care
constraints and a missed opportunity for care continuity.
In 2016, 63% of women gave birth in a health facility (up from 50% in 2010), and 63.5% of women gave
birth with the assistance of a skilled provider. However, there are large inequities by socioeconomic
status [1]. In the same year, 34% of women received postnatal care within two days of care, which is
very low and nearly the same as in 2010 (31%).
NEWBORN CARE
In 2016, the prevalence of early initiation of breastfeeding, defined as children born in the last two years
that were put to the breast within one hour of birth, was 51.3%, which was up from its low of 41% in
2010 but not up to 2005 levels of 57%. Exclusive breastfeeding has steadily increased in coverage,
reaching 59% in 2016.
USAID.GOV TANZANIA CASE STUDY REPORT ANNEXES | 16
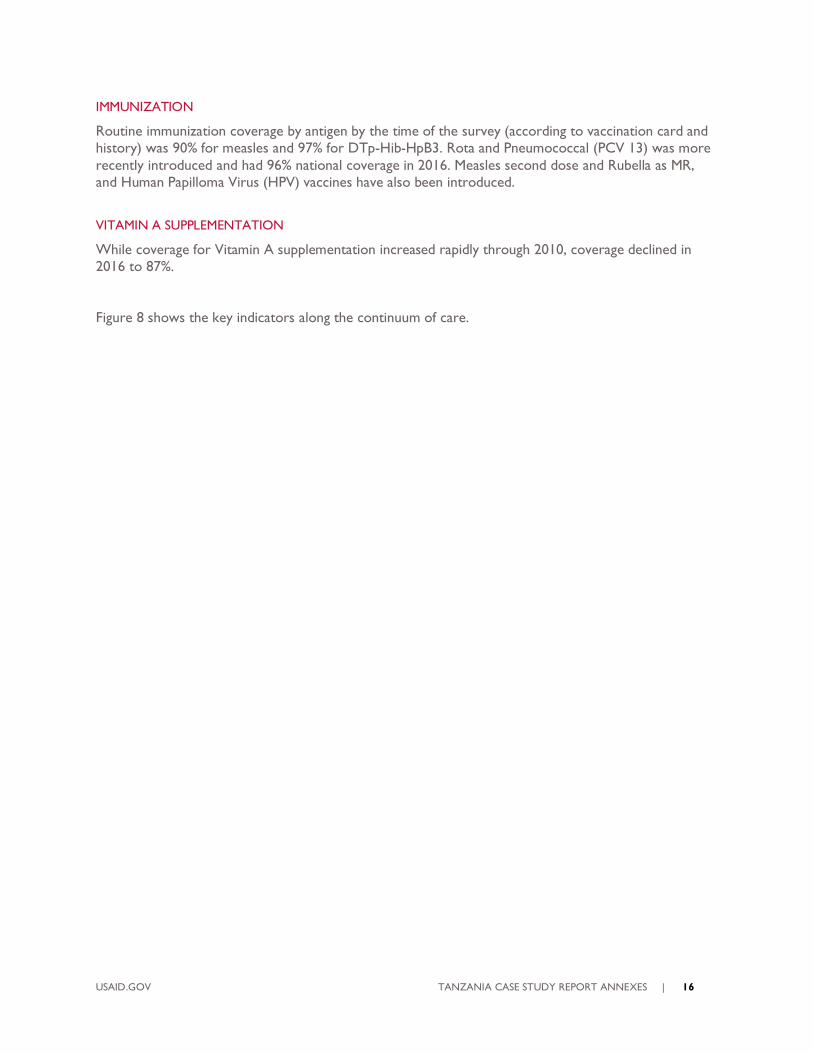
IMMUNIZATION
Routine immunization coverage by antigen by the time of the survey (according to vaccination card and
history) was 90% for measles and 97% for DTp-Hib-HpB3. Rota and Pneumococcal (PCV 13) was more
recently introduced and had 96% national coverage in 2016. Measles second dose and Rubella as MR,
and Human Papilloma Virus (HPV) vaccines have also been introduced.
VITAMIN A SUPPLEMENTATION
While coverage for Vitamin A supplementation increased rapidly through 2010, coverage declined in
2016 to 87%.
Figure 8 shows the key indicators along the continuum of care.
USAID.GOV TANZANIA CASE STUDY REPORT ANNEXES | 17
Figure 8. Coverage and Time Trends for Selected Reproductive, Maternal, Newborn, and Child Health Indicators along the Continuum of Care
Source: DHS (http://data.unicef.org)
USAID.GOV TANZANIA CASE STUDY REPORT ANNEXES | 18
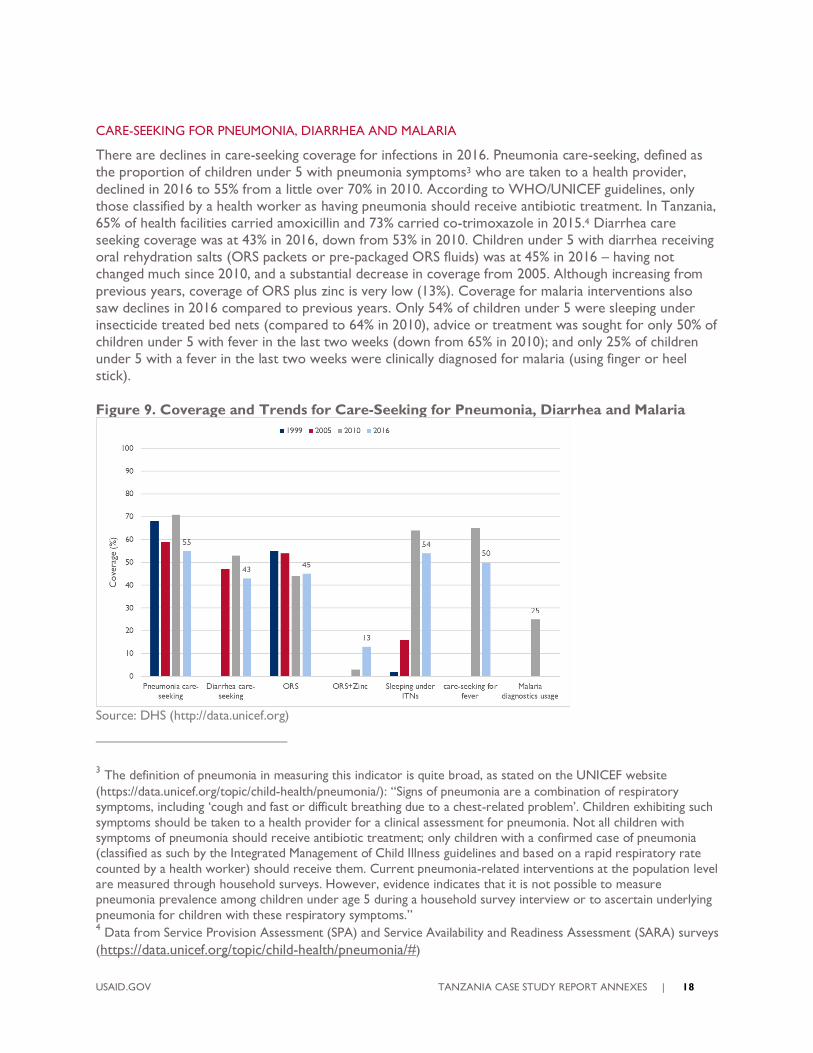
CARE-SEEKING FOR PNEUMONIA, DIARRHEA AND MALARIA
There are declines in care-seeking coverage for infections in 2016. Pneumonia care-seeking, defined as
the proportion of children under 5 with pneumonia symptoms3 who are taken to a health provider,
declined in 2016 to 55% from a little over 70% in 2010. According to WHO/UNICEF guidelines, only
those classified by a health worker as having pneumonia should receive antibiotic treatment. In Tanzania,
65% of health facilities carried amoxicillin and 73% carried co-trimoxazole in 2015.4 Diarrhea care
seeking coverage was at 43% in 2016, down from 53% in 2010. Children under 5 with diarrhea receiving
oral rehydration salts (ORS packets or pre-packaged ORS fluids) was at 45% in 2016 – having not
changed much since 2010, and a substantial decrease in coverage from 2005. Although increasing from
previous years, coverage of ORS plus zinc is very low (13%). Coverage for malaria interventions also
saw declines in 2016 compared to previous years. Only 54% of children under 5 were sleeping under
insecticide treated bed nets (compared to 64% in 2010), advice or treatment was sought for only 50% of
children under 5 with fever in the last two weeks (down from 65% in 2010); and only 25% of children
under 5 with a fever in the last two weeks were clinically diagnosed for malaria (using finger or heel
stick).
Figure 9. Coverage and Trends for Care-Seeking for Pneumonia, Diarrhea and Malaria
Source: DHS (http://data.unicef.org)
3 The definition of pneumonia in measuring this indicator is quite broad, as stated on the UNICEF website
(https://data.unicef.org/topic/child-health/pneumonia/): “Signs of pneumonia are a combination of respiratory symptoms, including ‘cough and fast or difficult breathing due to a chest-related problem’. Children exhibiting such
symptoms should be taken to a health provider for a clinical assessment for pneumonia. Not all children with symptoms of pneumonia should receive antibiotic treatment; only children with a confirmed case of pneumonia (classified as such by the Integrated Management of Child Illness guidelines and based on a rapid respiratory rate
counted by a health worker) should receive them. Current pneumonia-related interventions at the population level are measured through household surveys. However, evidence indicates that it is not possible to measure pneumonia prevalence among children under age 5 during a household survey interview or to ascertain underlying
pneumonia for children with these respiratory symptoms.” 4 Data from Service Provision Assessment (SPA) and Service Availability and Readiness Assessment (SARA) surveys
(https://data.unicef.org/topic/child-health/pneumonia/#)
USAID.GOV TANZANIA CASE STUDY REPORT ANNEXES | 19
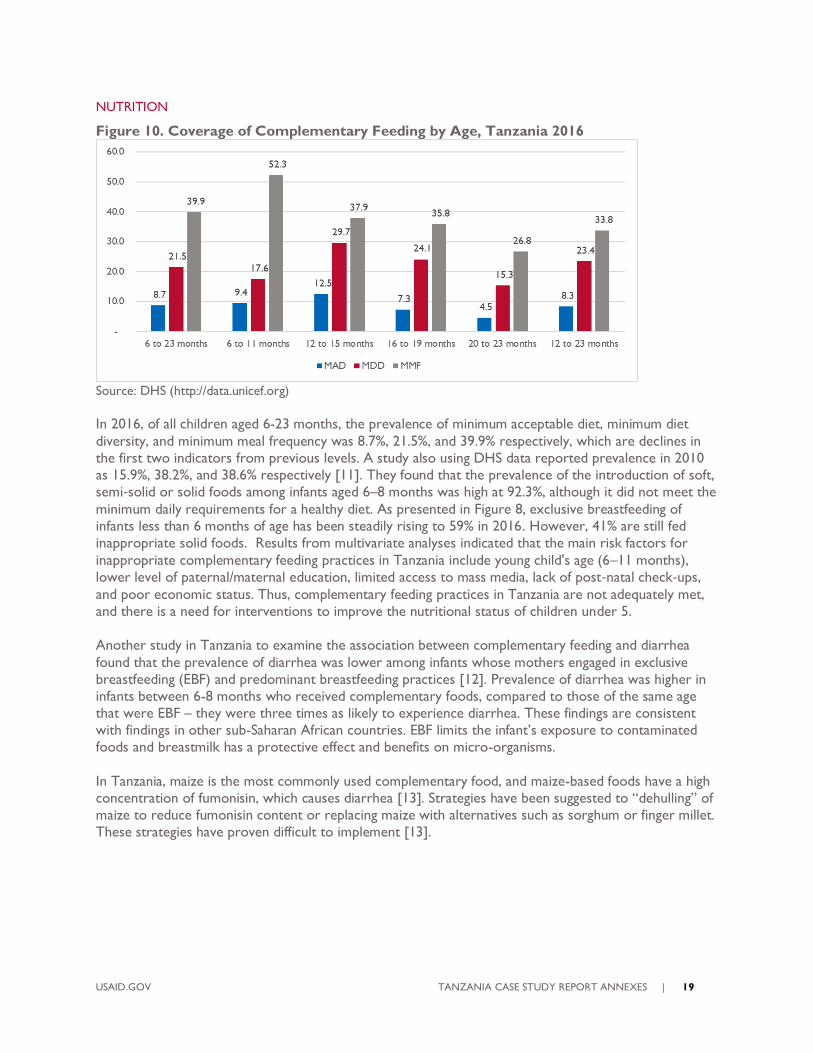
NUTRITION
Figure 10. Coverage of Complementary Feeding by Age, Tanzania 2016
Source: DHS (http://data.unicef.org)
In 2016, of all children aged 6-23 months, the prevalence of minimum acceptable diet, minimum diet
diversity, and minimum meal frequency was 8.7%, 21.5%, and 39.9% respectively, which are declines in
the first two indicators from previous levels. A study also using DHS data reported prevalence in 2010
as 15.9%, 38.2%, and 38.6% respectively [11]. They found that the prevalence of the introduction of soft,
semi‐solid or solid foods among infants aged 6–8 months was high at 92.3%, although it did not meet the
minimum daily requirements for a healthy diet. As presented in Figure 8, exclusive breastfeeding of
infants less than 6 months of age has been steadily rising to 59% in 2016. However, 41% are still fed
inappropriate solid foods. Results from multivariate analyses indicated that the main risk factors for
inappropriate complementary feeding practices in Tanzania include young child's age (6–11 months),
lower level of paternal/maternal education, limited access to mass media, lack of post‐natal check‐ups,
and poor economic status. Thus, complementary feeding practices in Tanzania are not adequately met,
and there is a need for interventions to improve the nutritional status of children under 5.
Another study in Tanzania to examine the association between complementary feeding and diarrhea
found that the prevalence of diarrhea was lower among infants whose mothers engaged in exclusive
breastfeeding (EBF) and predominant breastfeeding practices [12]. Prevalence of diarrhea was higher in
infants between 6-8 months who received complementary foods, compared to those of the same age
that were EBF – they were three times as likely to experience diarrhea. These findings are consistent
with findings in other sub-Saharan African countries. EBF limits the infant’s exposure to contaminated
foods and breastmilk has a protective effect and benefits on micro-organisms.
In Tanzania, maize is the most commonly used complementary food, and maize-based foods have a high
concentration of fumonisin, which causes diarrhea [13]. Strategies have been suggested to “dehulling” of
maize to reduce fumonisin content or replacing maize with alternatives such as sorghum or finger millet.
These strategies have proven difficult to implement [13].
USAID.GOV TANZANIA CASE STUDY REPORT ANNEXES | 20
POLICIES, PROGRAMS AND STRATEGIES
Tanzania began its intense focus on health sector reform policies in the mid-1990s following the severe
economic crisis in the 1980s. The key components of those reforms included the decentralization of
decision-making power and authority; introduction of user fees in public health care provision; and
public-private partnerships in service delivery [14]. These reforms and in particular the decentralization
of health systems have been linked to Tanzania’s dramatic declines in child mortality leading up to 2015
[15]. In this section, we review the macro-level, health-sector level, and RMNCAH policies and
strategies and their evolution, aims, and impact.
MACRO-LEVEL ECONOMIC AND DEVELOPMENT POLICIES
In 2013, the government of Tanzania launched the multi-sector development strategy to guide its quest
to reach middle-income country status during the next decade. Modeled on the Malaysian development
plan called “The Big Fast Results Initiative,” the Tanzania program initially focused on six priority areas:
energy and natural gas; agriculture; water; education; transportation; and mobilization of resources. In
October 2014, health was added as a seventh area of emphasis.
Tanzania uses a Sector Wide Approach (SWAp) as an important element in government structure of
the health sector [14]. SWAp provides the framework for collaboration among stakeholders including
among ministries, civil society, private sector, and bilateral/multilateral development partners.
HEALTH-SECTOR POLICIES AND STRATEGIES
Many health reforms planned during the 1990s were implemented in the 2000s [2]. This aligned with
macro-level decentralization policies and included the sector-wide approach basket funding; and a
proliferation of new guidelines, informatics for district planning and management, and new policies
focused on child survival. The National Health Policy of 1990 and 2007 clearly outline the country’s
commitment in addressing maternal, newborn and child health. Also, being the signatory of MDGs,
Tanzania focused at a national level to ensure maternal and child health services were strengthened to
meet MDGs 4 and 5 targets by 2015.
This priority is reflected in several policy documents produced by the Government of Tanzania. The
country’s Vision 2025 states that “access to quality reproductive health services for all individuals and
reduction in infant and maternal mortality” are among the most important health service goals. The
National Strategy for Growth and Poverty Reduction makes maternal, newborn, and child health as one
of its major objectives. The Primary Health Service Development Programme (PHSDP/MMAM 2007 –
2017) “addresses the crucial issue of equity by calling for an increase in the coverage and quality of
primary health care services for communities living in rural and remote areas.” Maternal and child health
are also prominently noted in the National RCH Policy guideline 2015; the National Guideline on
Essential Reproductive and Child Health Interventions in Tanzania 2003; Reproductive and Child Health
Strategy (2005-2010); National Population Policy 1992, 2007; and the Health Sector Strategic Plan 2016-
2020 (HSSP IV).
USAID.GOV TANZANIA CASE STUDY REPORT ANNEXES | 21
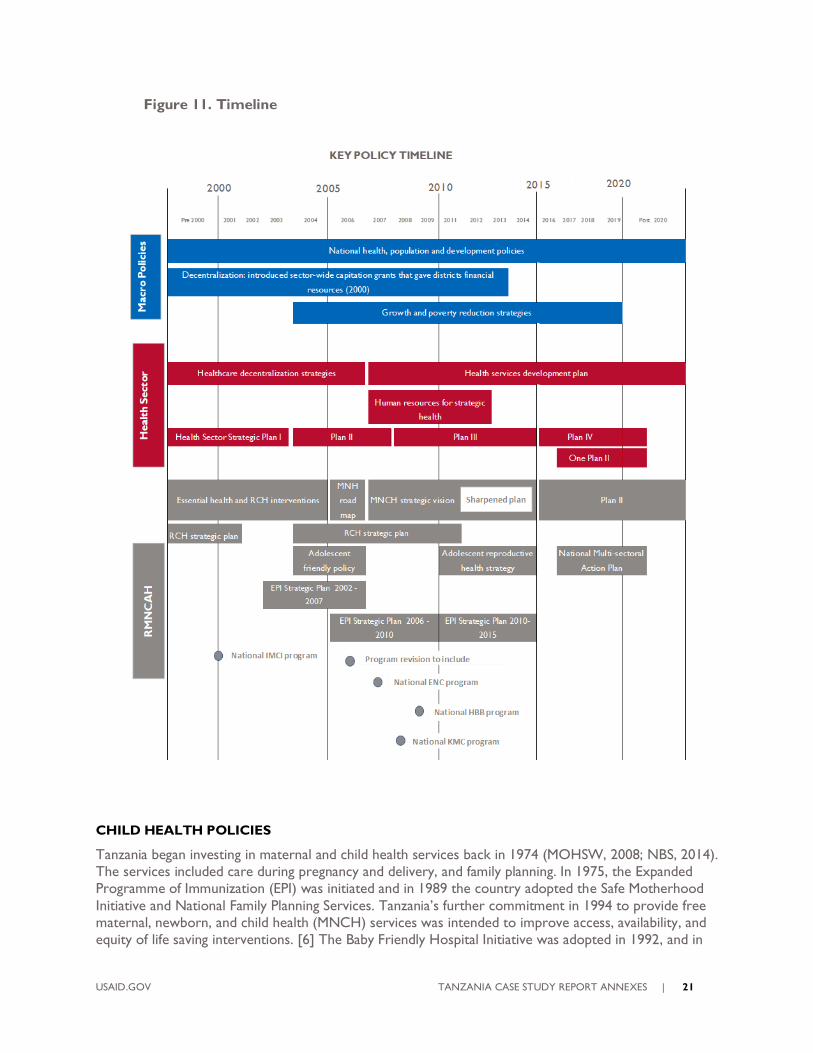
Figure 11. Timeline
CHILD HEALTH POLICIES
Tanzania began investing in maternal and child health services back in 1974 (MOHSW, 2008; NBS, 2014).
The services included care during pregnancy and delivery, and family planning. In 1975, the Expanded
Programme of Immunization (EPI) was initiated and in 1989 the country adopted the Safe Motherhood
Initiative and National Family Planning Services. Tanzania’s further commitment in 1994 to provide free
maternal, newborn, and child health (MNCH) services was intended to improve access, availability, and
equity of life saving interventions. [6] The Baby Friendly Hospital Initiative was adopted in 1992, and in
USAID.GOV TANZANIA CASE STUDY REPORT ANNEXES | 22
1996 the country adopted the Integrated Management of Childhood Illness (IMCI) for care of common
childhood illnesses. The National Adolescent Reproductive Health services were mainstreamed in the
health sector following the International Conference on Population and Development 1994 after
understanding the country situation and putting in place strategic documents to guide implementers
(Adolescent Health and Development Strategy 2004-2008, ARH strategy 2011-2015). In 2008, the
country introduced National Reproductive Health Cancers-Cervical Cancer Prevention and Control,
and Health Sector Prevention and Response to Gender-Based Violence.
In line with the poverty-reduction strategy, and supported by national decisions and commitments, in
2005 several child survival interventions were scaled up and strengthened by the Ministry of Health and
Social Welfare, and the implementation of IMCI, and the Expanded Program on Immunization, Vitamin A
supplementation, and insecticide-treated nets expanded [2]. The period of the 2000s therefore
witnessed progress in child health, more so than maternal and newborn health, particularly those
delivered through primary care [1]. This period also saw the adoption of the National Program on
Prevention of Mother-to-Child Transmission – PMTCT (2003) and between 2005 and the period leading
up to 2015, along with continued focus on immunization and malaria.
While policies on childhood nutrition have existed in Tanzania since the 1960s [12], the challenge has
been to translate the government commitment to evidence-based interventions that are costed,
implemented, and monitored. The National Strategy on Infant and Young Child Feeding and Nutrition
was developed in 2005,5 and in 2016, the National Multi-sectoral Nutrition Action Plan 2016-2021
(MNAP) was launched in an effort to improve breastfeeding practices and the introduction of
complementary foods [16].
RMNCH Strategic Plan – One Plan I
The first National Road Map Strategic Plan to Accelerate Reduction of Maternal, Newborn and Child
Deaths in Tanzania, 2008-2015 (One Plan) was developed in 2008 to provide guidance on the
implementation of MNCH programs across different levels of service delivery and to ensure
coordination of interventions and quality service delivery across the RMNCH continuum of care.
Progress was measured in mid-term review reports. The One Plan had three key target indicators and
14 operational targets which had to be achieved by 2015:
Reducing maternal mortality to 193 per 100,000 births
Reducing neonatal mortality to 19 per 1000 live births
Reducing under-five mortality rates to 54 per 1000 live births.
Leading up to the MDG reporting, the One Plan was thoroughly reviewed in 2013 to accelerate the
progress of the country, particularly toward meeting MDGs 4 and 5. The result was the Sharpened One
Plan, which was launched in April 2014 and focused on two of the country’s poorest and rural zones —
Lake and Western. Interventions with the highest potential impact were scaled up in these zones,
including “family planning, care at birth, postpartum care, and postnatal care; mechanisms to avert
stockouts of commodities essential to RMNCAH; and increased accountability and transparency at
every level of the health system responsible for RMNCAH” [17].
Big Results Now (BRN) was also introduced in 2014 as an initiative across multiple development sectors
and supported by the World Bank. Rolled out in three phases, BRN had four areas of focus: human
5 There are also other strategies that were adopted in relation to adolescent and maternal health: The Adolescent Health and Development Strategy 2004 – 2008, ARH Strategy 2011-2015; National Reproductive Health Cancers (2008); Cervical Cancer Prevention and Control and Health Sector Prevention and Response to Gender-based
Violence.
USAID.GOV TANZANIA CASE STUDY REPORT ANNEXES | 23
resources for health distribution, health commodities, performance management, and RMNCH. For its
RMNCH component, BRN was to complement the Sharpened One Plan, and worked to reduce by 20%
the maternal and neonatal mortality in five regions also within the Lake and Western zones by 2018.
BRN’s objective was to increase demand (through raising community awareness) for Basic Emergency
Obstetric and Newborn Care and Comprehensive Emergency Obstetric and Newborn Care; upgrade
facilities to offer these services; use mobile phone messaging to support use of the services at the
upgraded facilities; and increase voluntary blood donations to keep pace with the demand associated
with expansion of emergency care. The inclusion of MNCH in Tanzania’s high-profile BRN initiative
reflected the recognition that improved MNCH was essential to Tanzania’s economic growth [18].
RMNCH STRATEGIC PLAN – ONE PLAN II (POST-2015 ERA)
The One Plan II was rolled out in 2016 and had five strategic objectives and multiple operational targets
covering the areas of MNCH, Adolescent Health, Family Planning; PMTCT; Immunization and Vaccine
Development; Reproductive Health Cancer; Reproductive Health Gender; and cross-cutting programs.
The plan aims to by 2020 to:
Reduce maternal mortality from 432 to 292 per 100,000 live births;
Reduce neonatal mortality from 21 to 16 per 1000 live births; and
Reduce U5MR from 54 to 40 per 1000 live births.
The plan sets out targets for each of the program areas along the RMNCH continuum of care (included
in the Appendix are current coverage rates and targets for 2020 for newborn care and child health).
COSTS OF THE ONE PLAN II
The financial resources needed for RMNCAH programming under One Plan II and HSSP IV are
projected to increase by nearly one-third, from US$108 million (2015/16) to US$143 million (2019/20).
RMNCAH represent a significant proportion of the total HSSP IV resource requirements. By FY2019/20,
RMNCAH could represent 12% of health services costs (compared to 11% in 2015) and be the third
highest cost program within HSSP IV following HIV and non-communicable diseases (NCDs) [19].
IMPLEMENTATION BOTTLENECKS
A Health Policy Project brief points out that despite the One Plan II detailed roadmap for RMNCAH
goals, implementation and costs, achieving the goals may be challenging due to the fiscal space, human
resources, and other challenges [19]. An assessment of effective coverage of health interventions for
mothers and newborns found major bottlenecks in access, availability, and effective coverage in rural
areas of Tanzania [20]
The brief continues that while there is government commitment to scale up of RMNCAH services,
allocation of funds will require “concerted and coordinated efforts by the government and partners.”
There are opportunities for expanding RMNCAH services through the Global Financing Facility (GFF),
launched in 2014 to support Every Woman Every Child. This US$4 billion initiative aims to end
preventable deaths of women and children globally by 2030, and Tanzania is one of the four initial
countries to receive GFF support. Tanzania may be eligible to receive grant funds of up to US$40 million
from the GFF trust fund and up to US$20 million from the Achieving Nutrition at Scale Multi-Donor
Trust Fund across a five-year period. These funds will be aligned with US$36 million in existing support
from USAID for Eliminating Preventable Child and Maternal Deaths.
USAID.GOV TANZANIA CASE STUDY REPORT ANNEXES | 24
ESSENTIAL NEWBORN CARE
Despite high level government commitments, Tanzania faces challenges in reaching newborns [21]. The
target of having 75% of health facilities with delivery services offering Essential Newborn Care was not
realized by 2015 (MOHSW, 2014; WHO, 2014). The prevalence of breastfeeding within one hour of
birth declined from 59% in 2004/05 to 49% in 2010. In Tanzania, a higher prevalence of breast feeding
within one hour was noted in urban areas, among educated and wealthier women, among women
delivering at health facilities, and among women delivering with a skilled birth attendant [22]. To ensure
accountability, a RMNCH Score Card was introduced where regional commissioners were required to
submit quarterly reports showing the percentage of women using contraceptives, the percentage of
pregnant women attending antenatal clinics, and the percentage of women who deliver their babies in
the presence of a skilled attendant. Despite this effort, newborn targets were not met by 2015.
The main barriers in service delivery along the continuum of care that impact newborn care include a
severe shortage of trained health workers and lack of critical infrastructure, equipment and supplies
[23]. Most of the estimated annual newborn deaths occur at home, without any formal contact with the
health system [21]. Despite the high coverage of antenatal care, only 49% of women give birth with the
help of a skilled attendant.
In 2009, Improving Newborn Survival in Southern Tanzania (INSIST) trial (mainly funded by Save the
Children’s Saving Newborn Lives program and implemented by several partners) was launched with the
aim to develop, implement, and evaluate two interventions to improve neonatal survival: 1) home-based
counseling interventions; and 2) quality improvement intervention at primary health care facilities. An
assessment of the costs of INSIST found that home-based counseling intervention involved substantial
design and set-up costs, largely for training of community health workers (CHWs) and follow-up. The
cost of the home-based counseling intervention was US$19.5 per mother-newborn pair. Moving from
two CHWs per village to one CHW decreased costs by 35%, thus increasing the sustainability of the
program; the financial cost in a 100,000 population at 95% coverage was US$6.9 per mother [21].
Also in 2009, the Tanzanian Ministry of Health (MOH) launched a national Helping Babies Breathe (HBB)
training program. The program was scaled through the funding support of the Children’s Investment
Fund Foundation and implementation partner Jhpiego, reaching 16 regions throughout Tanzania in a
phased region-by-region rollout among a targeted 14,000 facility-based providers. The MOH was to
integrate HBB expansion with Essential Newborn Care to achieve economies of scale and demonstrate
global standards of newborn care [24].
The White Ribbon Alliance (WRA) was established in Tanzania in 2004 to advocate for policies and
programs across government and the community (https://www.whiteribbonalliance.org/tanzania/).
According to their website, WRA secured a 52.6% increase in country maternal health budget in 2017.
WRA also led a sustained campaign in Ruka region, and through facility assessments, engagement of civil
society, and campaigning at local and national levels, they succeeded in ensuring members of parliament
include maternal and newborn priorities into the government’s Big Results Now strategy [25].
IMCI/ICCM
IMCI was developed by WHO and UNICEF in the 1990s and introduced in over 100 countries [26].
Initial evaluations demonstrated improvements in provision of child care. However, later on studies
began to find mixed results, leading to concerns that health workers often do not adhere to IMCI
guidelines [27].
USAID.GOV TANZANIA CASE STUDY REPORT ANNEXES | 25
An assessment in Mwanza region of Tanzania found that only 51% of health workers were trained on
IMCI (below the recommended 60% by WHO) [28]. Health workers reported that the frequent changes
and updates to the management of childhood illnesses made adhering to IMCI challenging. For example,
in this study, health workers pointed out the conflicting information between new malaria case
management guidelines and IMCI. This requires regular review of the IMCI at the national level. Another
challenge identified was the shortage in supplies and essential drugs for the treatment of pneumonia,
diarrhea and malaria, in addition to the shortage of health care workers (as IMCI-trained staff often leave
or are transferred).
IMMUNIZATION
As noted earlier, the EPI was launched in 1975. However, implementation was slow due to lack of
financing and infrastructure. The economic reforms instituted in the 1990s, accompanied by
decentralization, health sector reforms, and increasing donor involvement led to expansion of the
program [29]. At the time, funding modalities for vertical programs were aligned with SWAPs. Health
sector reform included reorganization of the health system and of supply chain systems to integrate
many vertical programs, including EPI.
The WHO’s Global Vaccine Action Plan (GVAP) was endorsed by 194 member states of the World
health Assembly in 2012 and calls for targets to be met by 2020 through more equitable access to
vaccines [30]. The 2017 report details the status of countries, including Tanzania, in implementing the
GVAP targets [31]. Among all the targets reported on, of note was that Tanzania was one of two low-
income countries (along with Bangladesh) to reach DTP3 national coverage of >90%, and also was one
of the few countries to reduce disparities with DTP3 coverage between poorest and richest ranging
from 81-95%.
NUTRITION
Tanzania has had policies on childhood nutrition since the 1960s [12]. The challenge has been to
translate the government commitment to evidence-based interventions that are costed, implemented,
and monitored. The 2016-2021 MNAP sets seven key areas that are to be scaled up: 1) maternal, infant,
young child and adolescent nutrition; 2) prevention and control of micronutrient deficiencies; 3)
integrated management of acute malnutrition; 4) prevention and management of diet related non-
communicable diseases; 5) integration of multi-sectoral nutrition sensitive interventions; 6) improving
multi-sectoral nutrition governance; and 7) establishing multi-sectoral nutrition information systems
[16].
GOVERNANCE AND PARTNERSHIPS
In comparison to other low- and middle-income countries, Tanzania is well known for its large number
of stakeholders and foreign aid partners [32]. There are a large number of bilateral, multilateral,
international, and local NGOs groups working in Tanzania on RMNCH (see Appendix B for list of
stakeholders). Here we elaborate on some of the key players and initiatives.
USAID.GOV TANZANIA CASE STUDY REPORT ANNEXES | 26
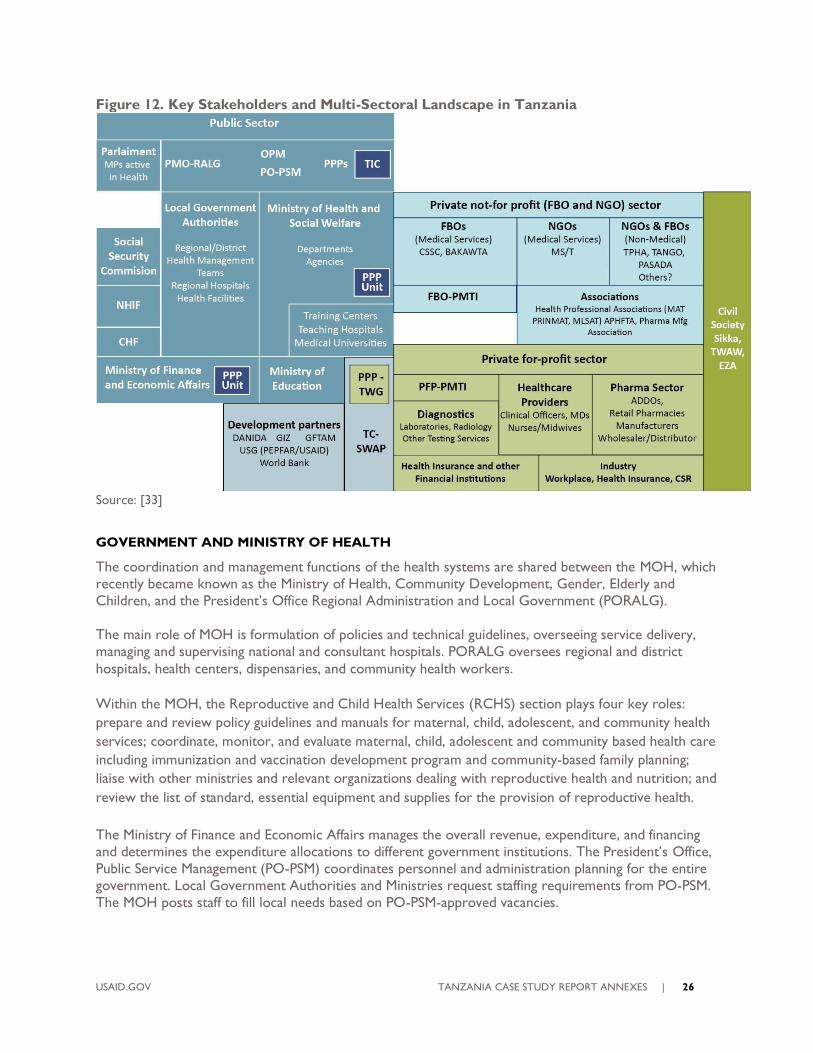
Figure 12. Key Stakeholders and Multi-Sectoral Landscape in Tanzania
Source: [33]
GOVERNMENT AND MINISTRY OF HEALTH
The coordination and management functions of the health systems are shared between the MOH, which
recently became known as the Ministry of Health, Community Development, Gender, Elderly and
Children, and the President’s Office Regional Administration and Local Government (PORALG).
The main role of MOH is formulation of policies and technical guidelines, overseeing service delivery,
managing and supervising national and consultant hospitals. PORALG oversees regional and district
hospitals, health centers, dispensaries, and community health workers.
Within the MOH, the Reproductive and Child Health Services (RCHS) section plays four key roles:
prepare and review policy guidelines and manuals for maternal, child, adolescent, and community health
services; coordinate, monitor, and evaluate maternal, child, adolescent and community based health care
including immunization and vaccination development program and community-based family planning;
liaise with other ministries and relevant organizations dealing with reproductive health and nutrition; and
review the list of standard, essential equipment and supplies for the provision of reproductive health.
The Ministry of Finance and Economic Affairs manages the overall revenue, expenditure, and financing
and determines the expenditure allocations to different government institutions. The President’s Office,
Public Service Management (PO-PSM) coordinates personnel and administration planning for the entire
government. Local Government Authorities and Ministries request staffing requirements from PO-PSM.
The MOH posts staff to fill local needs based on PO-PSM-approved vacancies.
USAID.GOV TANZANIA CASE STUDY REPORT ANNEXES | 27
Communities are involved through councils and are engaged in coordination of activities of CHWs, and
inclusion and participation in health boards and health facility governing committees. The government
monitors compliance to service agreements with NGOs through a public-private partnership
framework.
UNITED STATES GOVERNMENT
The US government has maintained bilateral relations with Tanzania since its independence in 1961. US-
funded development assistance programs began shortly thereafter [18]. The US-Tanzania relationship on
health and development has experienced political highs and lows over the last six decades, with a
challenging period being the phaseout of the USAID Mission in the mid-1980s in response to Tanzania’s
failure to make regular loan payments. Since the re-opening of the Mission in 1987, the bilateral
relationship on development has been strong. The US-Tanzania Country Development Cooperation
Strategy for 2015-2019 identifies women and youth empowerment, sustainable, inclusive broad-based
economic growth, and improved democratic governance as overarching goals.
In 2014, US overall spending on health activities reached more than $450 million.6 The principal US
government agencies carrying out work on health are USAID and CDC. CDC contributes to MNCH
through its PEPFAR-funded activities. The Peace Corps and Department of Defense Walter Reed Army
Institute of Research play important roles in the areas of training and research. The vast majority of US
health assistance, which totaled $368 million by 2015, is channeled through PEPFAR (62%).7 Several
programs areas contribute to MNCH. Direct funding for MNCH programs totaled $12 million in 2014,
and activities to strengthen immunization services received an additional $1.2 million. The President’s
Malaria Initiative (PMI), which supports much through its focus on indoor residual spraying and
preventing malaria infection provided$45 million in funding. Funding for voluntary family planning
activities, which contribute to maternal health through emphasis on health timing and spacing of
pregnancies, totaled $26 million.
Tanzania is one of 34 MNCH priority countries under USAID’s effort to address preventable maternal
and child health. The Maternal and Child Survival Program, launched in 2014 and administered by
Jhpiego, is currently scaling activities in Tanzania [18]. The United States also contributes to the Global
Fund and Gavi, the Vaccine Alliance (hereafter referred to as Gavi).
GLOBAL HEALTH INITIATIVES (GHIS)
There have been multiple GHIs since the early 2000s, the most prominent being the Global Fund to
Fight AIDS, Tuberculosis, and Malaria, Gavi, the Roll Back Malaria partnership, UNITAID, Stop TB
Partnership, and the Global Leprosy Programme [32]. Some GHIs have their own governance structures
operating through specifically created committees with a range of stakeholders including public and
private civil society organizations. Others operate through UN agencies, or through bilateral agencies
(e.g., all US-based GHIs such as PEPFAR are housed under the CDC) [32]. In Tanzania, while the GHIs
are perceived as “committed and aligned with the health sector’s strategic plan,” there are challenges in
coordinating and harmonizing implementation [32]. There is therefore duplication of activities at the
implementation level, particularly at the district and local levels. Their inability to use SWAp mechanisms
and instead use their own structures and mechanisms is a deterrent to effective coordination.
6 http://maternaltz.csis.org/tanzania/ 7 https://explorer.usaid.gov/cd/TZA?measure=Obligations&fiscal_year=2015&implementing_agency_id=1
USAID.GOV TANZANIA CASE STUDY REPORT ANNEXES | 28
PRIVATE SECTOR AND PUBLIC-PRIVATE PARTNERSHIPS
The private sector in Tanzania is composed of a diverse and large group of both for-profit and not-for-
profit organizations. A private sector assessment (Sustaining Health Outcomes through the Private
Sector) in 2013 concluded that the full scope of private health sector activity is excluded in assessments
and planning of the health system [33]. Over one-third of general health services could be accessed
through private sector facilities, faith-based organizations, and other not-for-profit facilities. However,
private sector stakeholders are not involved in the Comprehensive Council Health Plans at the district
level. While there is high-level commitment to PPPs at all levels and a supportive legal and regulatory
environment, the PPP units are under-resourced [33].
One of the prominent PPP models implemented in Tanzania is the accredited drug dispensing outlet
program launched in 2003 [48]. Implemented by the government and supported by multiple partners,
the program takes a comprehensive approach that combines owner and dispenser training, government
accreditation based on standards, business incentives, local regulatory enforcement, and demand
generation for quality products and services. By 2015, the program had been rolled out in all mainland
districts with 9,000 shops accredited and over 19,000 dispensers trained.
COMMUNITY PARTICIPATION
Community participation has been part of health sector reform since the 1990s [14]. More recently and
as part of the decentralization reform of the health sector, Council Health Service Boards and health
facility committees (hospital, health center, and dispensary committees) have been formed. Assessments
show that these committees have limited influence and are not engaged effectively in policy, budgeting,
and planning [14].
HEALTH SYSTEMS
While Tanzania has seen great improvements in its child health outcomes, continued progress is
contingent on a well-resourced, efficient health system that delivers services of quality. In this section,
we will summarize the key health systems inputs and delivery platforms and highlight key constraints and
plans to address them in the country.
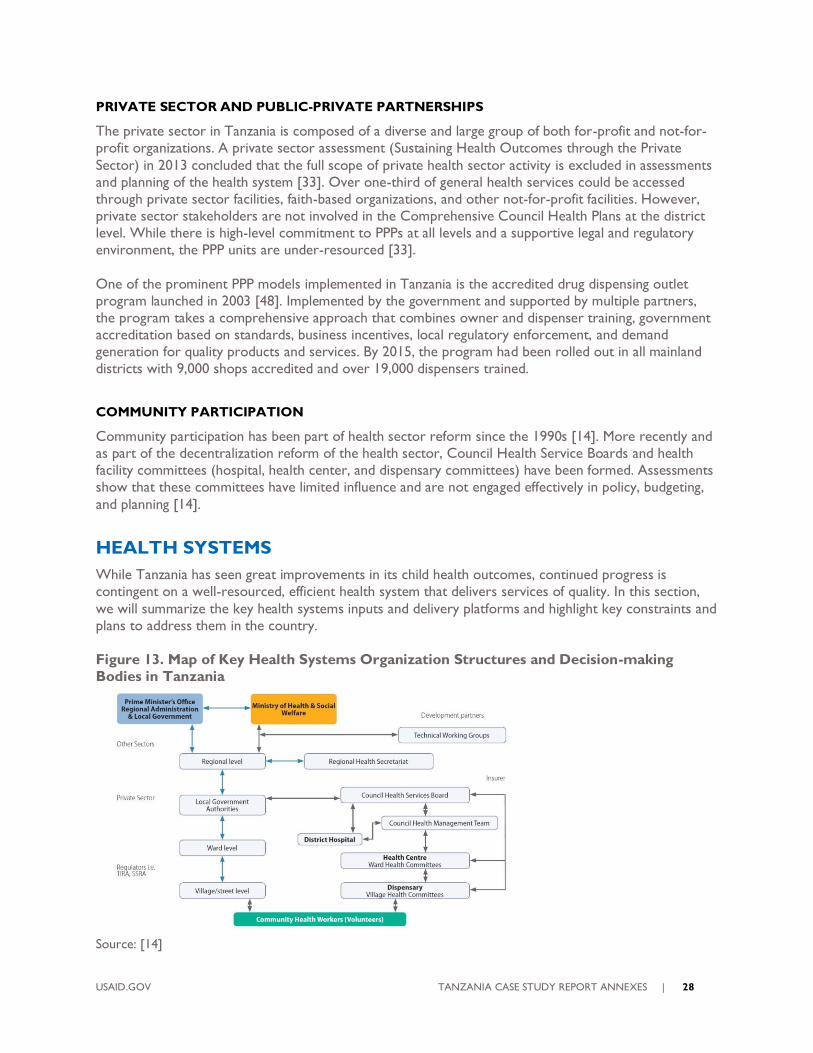
Figure 13. Map of Key Health Systems Organization Structures and Decision-making
Bodies in Tanzania
Source: [14]
USAID.GOV TANZANIA CASE STUDY REPORT ANNEXES | 29
ORGANIZATION OF THE HEALTH SYSTEM
The health system is largely decentralized. Priorities are set at the district level, which is responsible for
health service implementation and supervision of individual facilities on a monthly basis. The point of
entry for mothers and children is the community-level dispensary, which caters to between 6000-10,000
people and provides basic services including exams, receiving advice from a clinical officer or nurse,
procuring medicines and medical supplies, and immunization services. Some dispensaries are equipped
for labor and delivery; many offer PMTCT services and treatment options. Health centers, the next tier
up, are expected to serve about 50,000 people (approximately the population of one administrative
division). Health centers provide more comprehensive services than what is available at dispensaries,
including seeing a physician and providing in-patient services. Patients with more complicated cases are
referred to the district hospital (each district is supposed to have one district hospital). In places with no
government district hospital, faith-based or NGO-run hospitals are designated as the district-level
provider. Regional hospitals offer services similar to those at the district level but have specialists in
various fields with more services than those available at district-level hospitals and regional referral
hospitals. Long distances and transportation costs are obstacles to accessing care. The most complicated
cases are referred to a handful of specialized national referral hospitals in the capital city of Dar es
Salaam. Patients who live closer to a referral hospital or prefer for more distant health centers or the
district hospital can bypass community-level facilities altogether.
PRIVATE SECTOR
The private sector accounts for approximately 40% of health facilities in the country (not including drug
sellers or pharmacies), 35% of which are faith-based organizations [34]. According to the Primary Health
Services Development Plan 2007-2017, health facility ownership in mainland Tanzania is broken down as
follows: government 64.2%, “voluntary agencies” 17.7%, private institutions 15%, and parastatal 3%.
Faith-based organizations tend to be located in disadvantaged areas, and some are funded by the
government through grants, basket funds, and other forms of support (medicines, equipment, staff
secondment, and training). On the other hand, 90% of private for-profit health facilities are situated in
urban areas.
FINANCING
Although there are considerable efforts for the government to fund its own expenditures, gaps remain.
There is a dependency on international aid, particularly for development initiatives and public service
delivery. The country is one of the largest recipients of international aid in sub-Saharan Africa, receiving
its highest flows from the United States, the World Bank and the EU. From 2007 to 2011, approximately
one-third of government spending was financed by donor funds, although this share fell to about 20%
from 2012 to 2014 [35]. The country’s biggest donors are the United States, Canada, Denmark, Sweden,
Germany, Ireland, the United Kingdom, Finland, Japan, the African Development Bank, the World Bank,
and the European Commission. Tanzania spends 5.56% of its GDP on health and has been on an uphill
trajectory since 2000 despite the high increase and related drop-off in 2006-2009. This places Tanzania
within the average range of health expenditure compared to other sub-Saharan countries. The public
sector accounts for about 40% of total expenditure. While government health expenditure and external
funding have nearly tripled since 2003 [36], the share of total out-of-pocket spending has also been rising
and leveled off at 20% (World Bank).
USAID.GOV TANZANIA CASE STUDY REPORT ANNEXES | 30
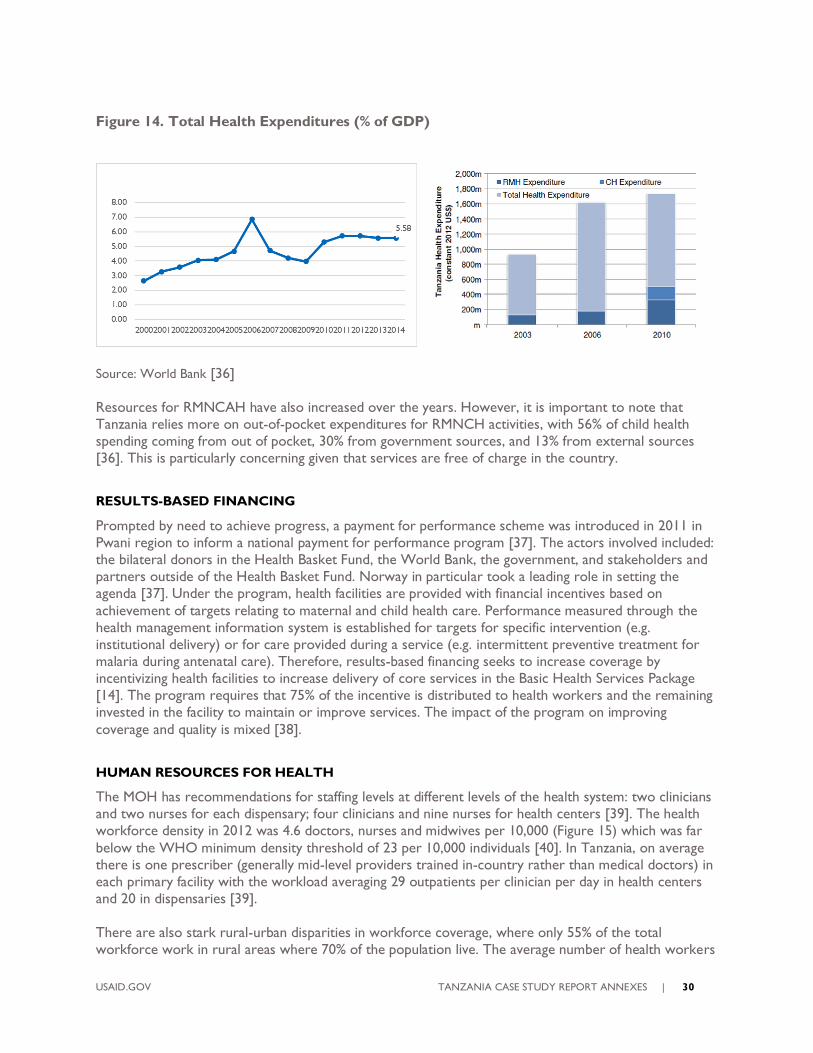
Figure 14. Total Health Expenditures (% of GDP)
Source: World Bank [36]
Resources for RMNCAH have also increased over the years. However, it is important to note that
Tanzania relies more on out-of-pocket expenditures for RMNCH activities, with 56% of child health
spending coming from out of pocket, 30% from government sources, and 13% from external sources
[36]. This is particularly concerning given that services are free of charge in the country.
RESULTS-BASED FINANCING
Prompted by need to achieve progress, a payment for performance scheme was introduced in 2011 in
Pwani region to inform a national payment for performance program [37]. The actors involved included:
the bilateral donors in the Health Basket Fund, the World Bank, the government, and stakeholders and
partners outside of the Health Basket Fund. Norway in particular took a leading role in setting the
agenda [37]. Under the program, health facilities are provided with financial incentives based on
achievement of targets relating to maternal and child health care. Performance measured through the
health management information system is established for targets for specific intervention (e.g.
institutional delivery) or for care provided during a service (e.g. intermittent preventive treatment for
malaria during antenatal care). Therefore, results-based financing seeks to increase coverage by
incentivizing health facilities to increase delivery of core services in the Basic Health Services Package
[14]. The program requires that 75% of the incentive is distributed to health workers and the remaining
invested in the facility to maintain or improve services. The impact of the program on improving
coverage and quality is mixed [38].
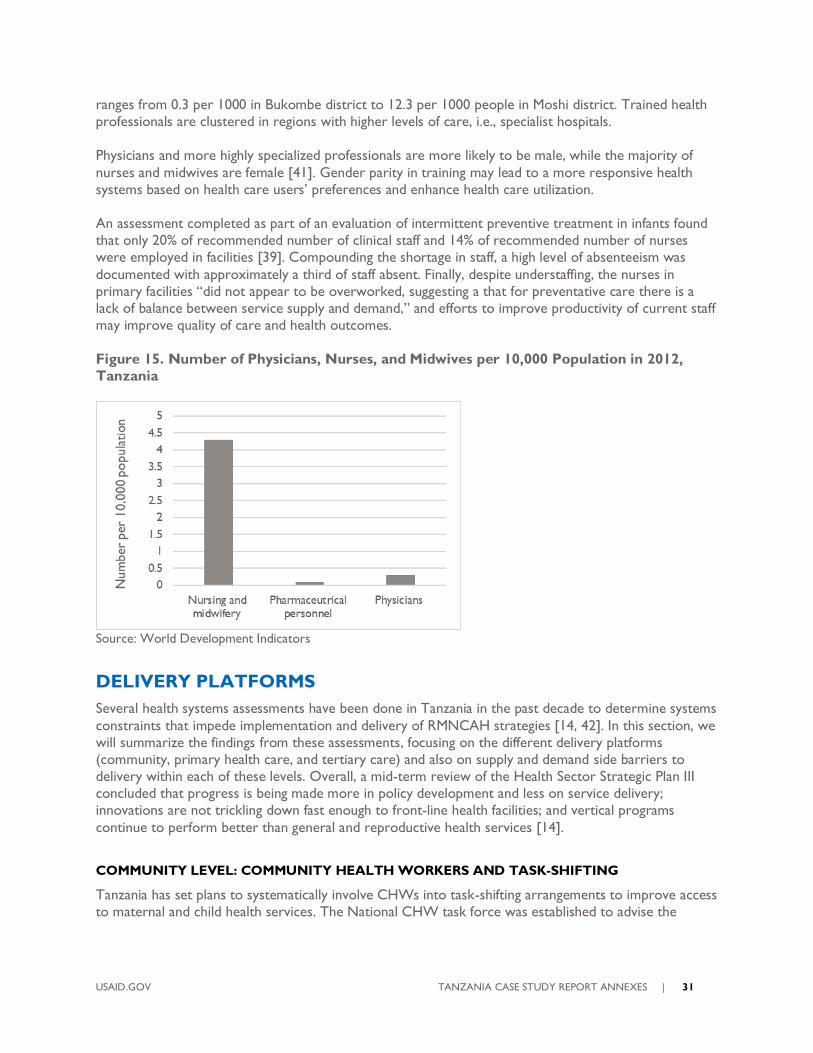
HUMAN RESOURCES FOR HEALTH
The MOH has recommendations for staffing levels at different levels of the health system: two clinicians
and two nurses for each dispensary; four clinicians and nine nurses for health centers [39]. The health
workforce density in 2012 was 4.6 doctors, nurses and midwives per 10,000 (Figure 15) which was far
below the WHO minimum density threshold of 23 per 10,000 individuals [40]. In Tanzania, on average
there is one prescriber (generally mid-level providers trained in-country rather than medical doctors) in
each primary facility with the workload averaging 29 outpatients per clinician per day in health centers
and 20 in dispensaries [39].
There are also stark rural-urban disparities in workforce coverage, where only 55% of the total
workforce work in rural areas where 70% of the population live. The average number of health workers
USAID.GOV TANZANIA CASE STUDY REPORT ANNEXES | 31
ranges from 0.3 per 1000 in Bukombe district to 12.3 per 1000 people in Moshi district. Trained health
professionals are clustered in regions with higher levels of care, i.e., specialist hospitals.
Physicians and more highly specialized professionals are more likely to be male, while the majority of
nurses and midwives are female [41]. Gender parity in training may lead to a more responsive health
systems based on health care users’ preferences and enhance health care utilization.
An assessment completed as part of an evaluation of intermittent preventive treatment in infants found
that only 20% of recommended number of clinical staff and 14% of recommended number of nurses
were employed in facilities [39]. Compounding the shortage in staff, a high level of absenteeism was
documented with approximately a third of staff absent. Finally, despite understaffing, the nurses in
primary facilities “did not appear to be overworked, suggesting a that for preventative care there is a
lack of balance between service supply and demand,” and efforts to improve productivity of current staff
may improve quality of care and health outcomes.
Figure 15. Number of Physicians, Nurses, and Midwives per 10,000 Population in 2012,
Tanzania
Source: World Development Indicators
DELIVERY PLATFORMS
Several health systems assessments have been done in Tanzania in the past decade to determine systems
constraints that impede implementation and delivery of RMNCAH strategies [14, 42]. In this section, we
will summarize the findings from these assessments, focusing on the different delivery platforms
(community, primary health care, and tertiary care) and also on supply and demand side barriers to
delivery within each of these levels. Overall, a mid-term review of the Health Sector Strategic Plan III
concluded that progress is being made more in policy development and less on service delivery;
innovations are not trickling down fast enough to front-line health facilities; and vertical programs
continue to perform better than general and reproductive health services [14].
COMMUNITY LEVEL: COMMUNITY HEALTH WORKERS AND TASK-SHIFTING
Tanzania has set plans to systematically involve CHWs into task-shifting arrangements to improve access
to maternal and child health services. The National CHW task force was established to advise the
USAID.GOV TANZANIA CASE STUDY REPORT ANNEXES | 32
Ministry of Health, Community Development, Gender, Elderly and Children on the policies, strategies,
and guidelines [43.]8
The CHW model was introduced in Tanzania following the 1978 Alma Ata Declaration. For many
decades, the Primary Health Care (PHC) and CHW programs were left uncoordinated, as was the case
in many countries. Approximately 41,000 CHWs are currently employed across Tanzania by a network
of development partners and NGOs [44]. About one in four of them have the minimum level of
education level required to be a government employee, and therefore employed on a voluntary basis.
CHWs are not evenly distributed across all regions: Rukwa had the highest number of CHWs per capita
(61 per 10,000 population) and Katavi had less than one CHW per 10,000 with a median of seven
CHWs per 10,000.
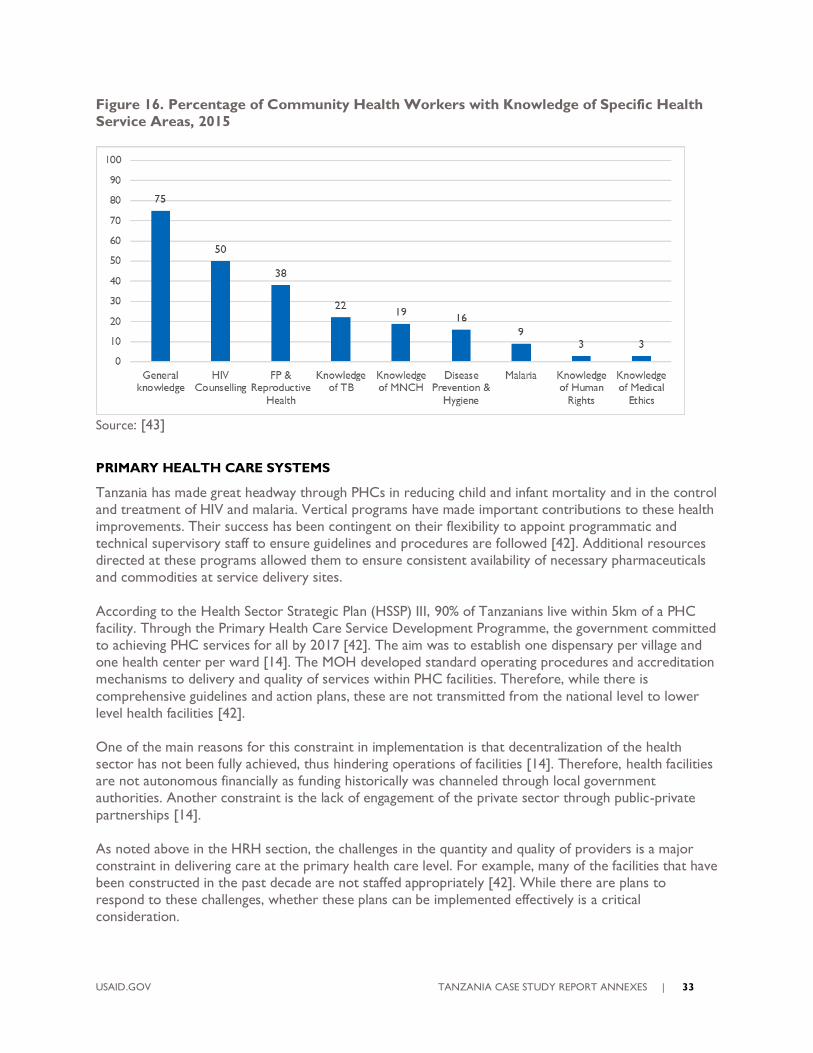
One of the main goals of the CHW Task Force is to institutionalize and integrate CHWs into the health
system and standard practice throughout the country. “A critical question for the Tanzanian health
sector has been whether one CHW would be able to address all the needs of an integrated maternal
neonatal child health (MNCH), HIV/AIDS, and nutrition program.” (https://chw-
lap.muhas.ac.tz/index.php/history-of-chws-tanzania). As Figure 16 shows, knowledge of MNCH stands at
only 19%,
8 In July 2013, members of Johns Hopkins University’s Bloomberg School of Public Health (JHU/JHSPH) and
Muhimbili University of Health and Allied Sciences (MUHAS) engaged in discussions with members of the CHW Task Force to brief them on the JHU-MUHAS mandate given from the USAID Tanzania mission to support the scale-up of Tanzania’s integrated CHW program. This launched the Community Health Worker-Learning Agenda
Project (CHW-LAP). https://chw-lap.muhas.ac.tz/index.php/chw-lap-overview
USAID.GOV TANZANIA CASE STUDY REPORT ANNEXES | 33
Figure 16. Percentage of Community Health Workers with Knowledge of Specific Health
Service Areas, 2015
Source: [43]
PRIMARY HEALTH CARE SYSTEMS
Tanzania has made great headway through PHCs in reducing child and infant mortality and in the control
and treatment of HIV and malaria. Vertical programs have made important contributions to these health
improvements. Their success has been contingent on their flexibility to appoint programmatic and
technical supervisory staff to ensure guidelines and procedures are followed [42]. Additional resources
directed at these programs allowed them to ensure consistent availability of necessary pharmaceuticals
and commodities at service delivery sites.
According to the Health Sector Strategic Plan (HSSP) III, 90% of Tanzanians live within 5km of a PHC
facility. Through the Primary Health Care Service Development Programme, the government committed
to achieving PHC services for all by 2017 [42]. The aim was to establish one dispensary per village and
one health center per ward [14]. The MOH developed standard operating procedures and accreditation
mechanisms to delivery and quality of services within PHC facilities. Therefore, while there is
comprehensive guidelines and action plans, these are not transmitted from the national level to lower
level health facilities [42].
One of the main reasons for this constraint in implementation is that decentralization of the health
sector has not been fully achieved, thus hindering operations of facilities [14]. Therefore, health facilities
are not autonomous financially as funding historically was channeled through local government
authorities. Another constraint is the lack of engagement of the private sector through public-private
partnerships [14].
As noted above in the HRH section, the challenges in the quantity and quality of providers is a major
constraint in delivering care at the primary health care level. For example, many of the facilities that have
been constructed in the past decade are not staffed appropriately [42]. While there are plans to
respond to these challenges, whether these plans can be implemented effectively is a critical
consideration.
USAID.GOV TANZANIA CASE STUDY REPORT ANNEXES | 34
PROVISION OF BASIC SERVICES. The 2012 Service Availability and Readiness Assessment (SARA)
showed that great variability in service availability in different health facilities [14]. Child health
immunization coverage was high, with three quarters of health facilities offering immunization services.
However, coverage for malnutrition is low, with Tanzania being one of the 10 worst affected countries
in the world.
INTEGRATION. While vertical programs have contributed to the performance of the health system
in Tanzania, they have posed challenges to integration of RMNCAH services as they compete for staff
particularly at the supervisory level [42]. Strict donor funding and reporting streams make it challenging
for coordination at the central level between programs, and sometimes even within programs (e.g.
prevention versus treatment of HIV [42].
TERTIARY CARE
While many RMNCAH services can be delivered at the community and primary health levels, a well-
functioning hospital and referral system needs to be in place for interventions that require management
and treatment of high-risk cases.
In addition to the constraints faced by the primary health care system, the referral system in Tanzania
faces specific challenges. Many of the health facilities do not have the capacity for an early identification
and warning system. Many facilities also do not have the resources to transport patients to referral
facilities. Providers do not have the capacity or motivation to appropriately complete the paperwork
required to transfer patients [42]. Patients without referrals therefore self-refer and are charged for
services, finding themselves paying for higher-level services. According to one assessment, basic medical
life-saving equipment is not consistently available in hospitals [42].
FACILITY DELIVERY. The quality of care at health facilities is another major constraint in Tanzania.
One study conducted in Tanzania found that women were significantly more likely to deliver in a health
facility if they received antenatal care in a government health center or a faith-based mission facility than
were women who received antenatal care in a dispensary [45]. This was the case even in areas with high
levels of facility delivery overall [46]. Women who live further from higher-level health facilities (i.e.
hospitals) who had access to lower-level facilities (dispensaries) were more likely to deliver at home.
Finally, there are large disparities among women in relation to their income, education, and parity, which
will require interventions such as cash transfers and vouchers to improve access. In addition to quality,
women could be unaware of the types of services available through the continuum of care and where to
receive those services. One study found that mothers in Tanzania were aware of maternal health
services during pregnancy and delivery, but not aware of postpartum complications and follow up
services [47].
USAID.GOV TANZANIA CASE STUDY REPORT ANNEXES | 35
CONCLUSIONS
Tanzania has made major improvements in child health outcomes leading up to 2015. Indicators
from 2016, however, indicate a possible stagnation in the rate of progress. In addition, the key
interventions along the RMNCAH continuum of care, particularly in relation to childhood
illnesses, newborn care, and nutrition (e.g. exclusive breastfeeding) must be scaled up and
effectively implemented.
The causes of deaths in children, particularly those that have survived the first month of life, are
shifting from predominantly infectious diseases to “other” causes that are largely non-
communicable diseases and injuries. This shift and its implications will need to be considered in
designing child health strategies, resources, and health systems capacity moving forward.
Interventions for reproductive health and maternal health continue to be low, indicating
challenges in the quality and continuity of care in health facilities. Women’s unwillingness to
deliver in lower-level facilities and their lack of access to hospitals makes access to a skilled birth
attendant at birth challenging.
Staff shortages continue to be one of the major challenges in Tanzania. Reports show that
despite the shortages, existing resources and capacity could be made more efficient through staff
incentive and training programs.
Throughout the health sector, Tanzania’s government is committed at the highest level to
evidence-based and reform strategies. This is exhibited in the comprehensive set of policies,
guidelines, and implementation plans. Challenges appear to be related to the implementation and
reach of policies to local government and front-line facilities. Implementation and delivery has to
be improved to ensure effective coverage of RMNCAH strategies.
Tanzania has a large number of partners and stakeholders working on health and RMNCAH
specifically. While partners have helped in Tanzanian’s impressive progress in the past few
decades, the challenges of coordination at district and local levels of the multitude of strategies
and interventions leads to loss in efficiencies and effectiveness. This becomes critical in ensuring
for example integration of services are possible, and that programs work to strengthen health
systems in a complementary way and do not compete for resources and staff.
One of the key areas for improvement is the effective engagement of community health workers
into the health system through formal training and hiring practices. The private sector also
seems to be untapped and could be better engaged and supported to enter into the health
sector.
USAID.GOV TANZANIA CASE STUDY REPORT ANNEXES | 36
DESK REVIEW APPENDICES
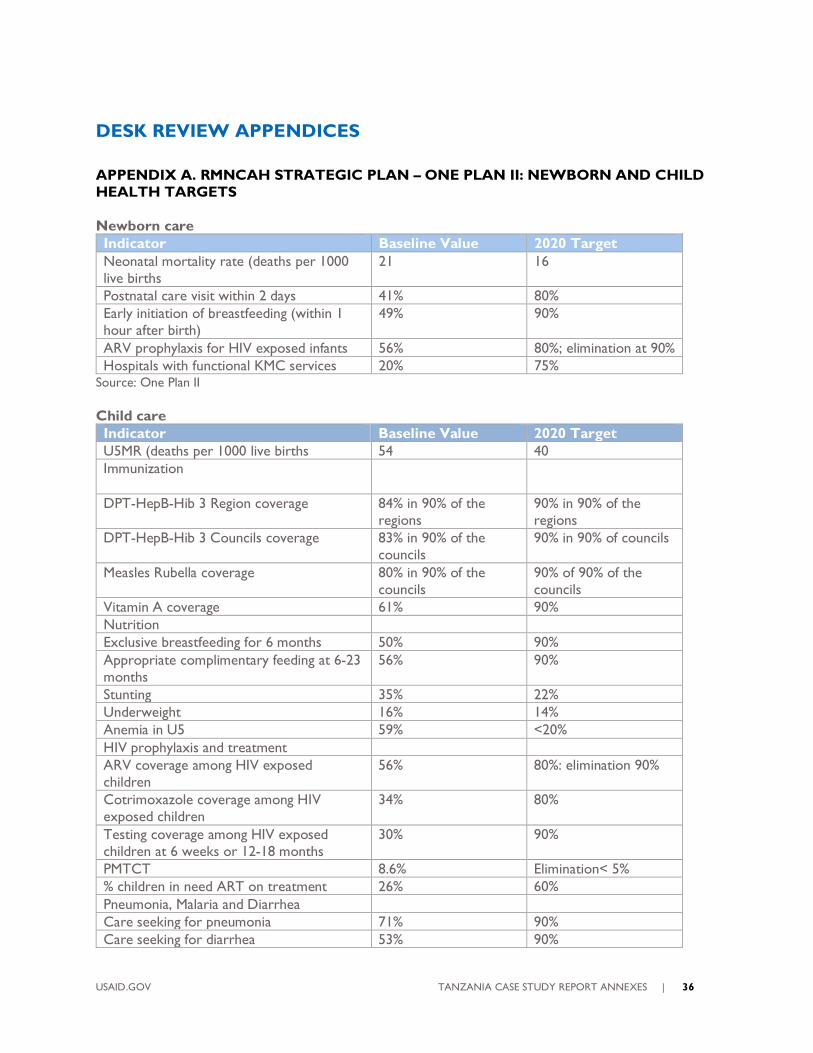
APPENDIX A. RMNCAH STRATEGIC PLAN – ONE PLAN II: NEWBORN AND CHILD
HEALTH TARGETS
Newborn care
Indicator Baseline Value 2020 Target
Neonatal mortality rate (deaths per 1000
live births
21 16
Postnatal care visit within 2 days 41% 80%
Early initiation of breastfeeding (within 1
hour after birth)
49% 90%
ARV prophylaxis for HIV exposed infants 56% 80%; elimination at 90%
Hospitals with functional KMC services 20% 75% Source: One Plan II
Child care
Indicator Baseline Value 2020 Target
U5MR (deaths per 1000 live births 54 40
Immunization
DPT-HepB-Hib 3 Region coverage 84% in 90% of the
regions
90% in 90% of the
regions
DPT-HepB-Hib 3 Councils coverage 83% in 90% of the
councils
90% in 90% of councils
Measles Rubella coverage 80% in 90% of the
councils
90% of 90% of the
councils
Vitamin A coverage 61% 90%
Nutrition
Exclusive breastfeeding for 6 months 50% 90%
Appropriate complimentary feeding at 6-23
months
56% 90%
Stunting 35% 22%
Underweight 16% 14%
Anemia in U5 59% <20%
HIV prophylaxis and treatment
ARV coverage among HIV exposed
children
56% 80%: elimination 90%
Cotrimoxazole coverage among HIV
exposed children
34% 80%
Testing coverage among HIV exposed
children at 6 weeks or 12-18 months
30% 90%
PMTCT 8.6% Elimination< 5%
% children in need ART on treatment 26% 60%
Pneumonia, Malaria and Diarrhea
Care seeking for pneumonia 71% 90%
Care seeking for diarrhea 53% 90%
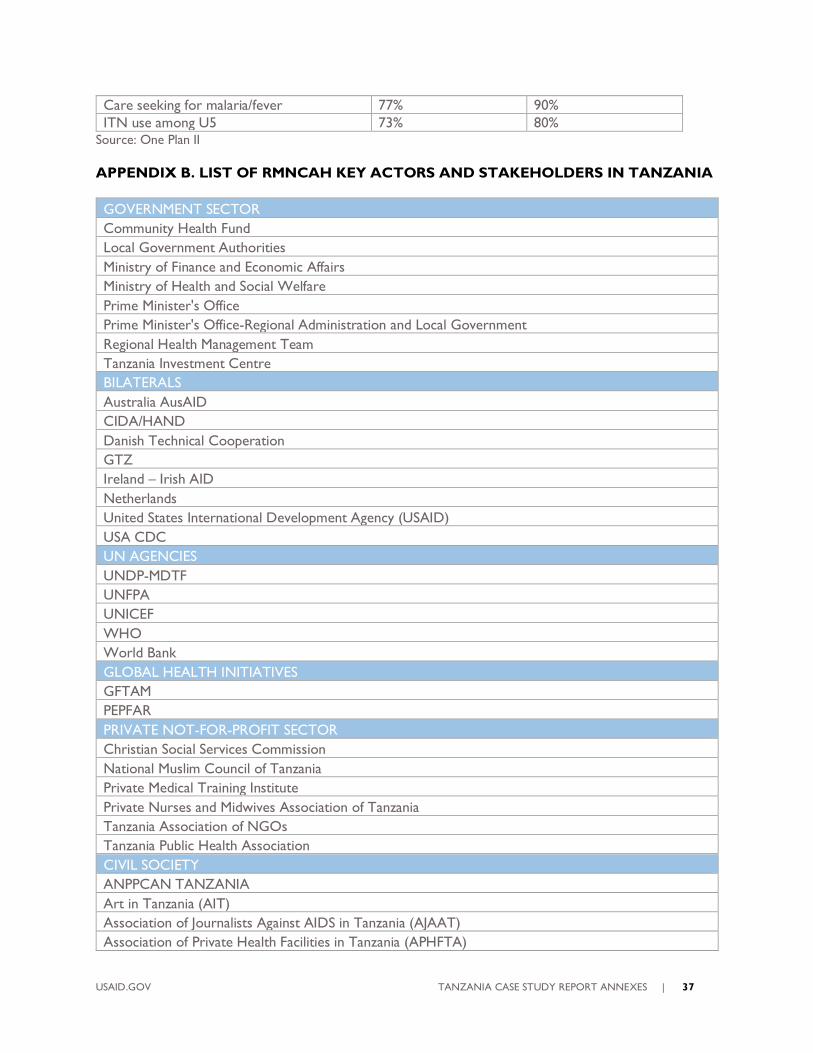
USAID.GOV TANZANIA CASE STUDY REPORT ANNEXES | 37
Care seeking for malaria/fever 77% 90%
ITN use among U5 73% 80% Source: One Plan II
APPENDIX B. LIST OF RMNCAH KEY ACTORS AND STAKEHOLDERS IN TANZANIA
GOVERNMENT SECTOR
Community Health Fund
Local Government Authorities
Ministry of Finance and Economic Affairs
Ministry of Health and Social Welfare
Prime Minister's Office
Prime Minister's Office-Regional Administration and Local Government
Regional Health Management Team
Tanzania Investment Centre
BILATERALS
Australia AusAID
CIDA/HAND
Danish Technical Cooperation
GTZ
Ireland – Irish AID
Netherlands
United States International Development Agency (USAID)
USA CDC
UN AGENCIES
UNDP-MDTF
UNFPA
UNICEF
WHO
World Bank
GLOBAL HEALTH INITIATIVES
GFTAM
PEPFAR
PRIVATE NOT-FOR-PROFIT SECTOR
Christian Social Services Commission
National Muslim Council of Tanzania
Private Medical Training Institute
Private Nurses and Midwives Association of Tanzania
Tanzania Association of NGOs
Tanzania Public Health Association
CIVIL SOCIETY
ANPPCAN TANZANIA
Art in Tanzania (AIT)
Association of Journalists Against AIDS in Tanzania (AJAAT)
Association of Private Health Facilities in Tanzania (APHFTA)
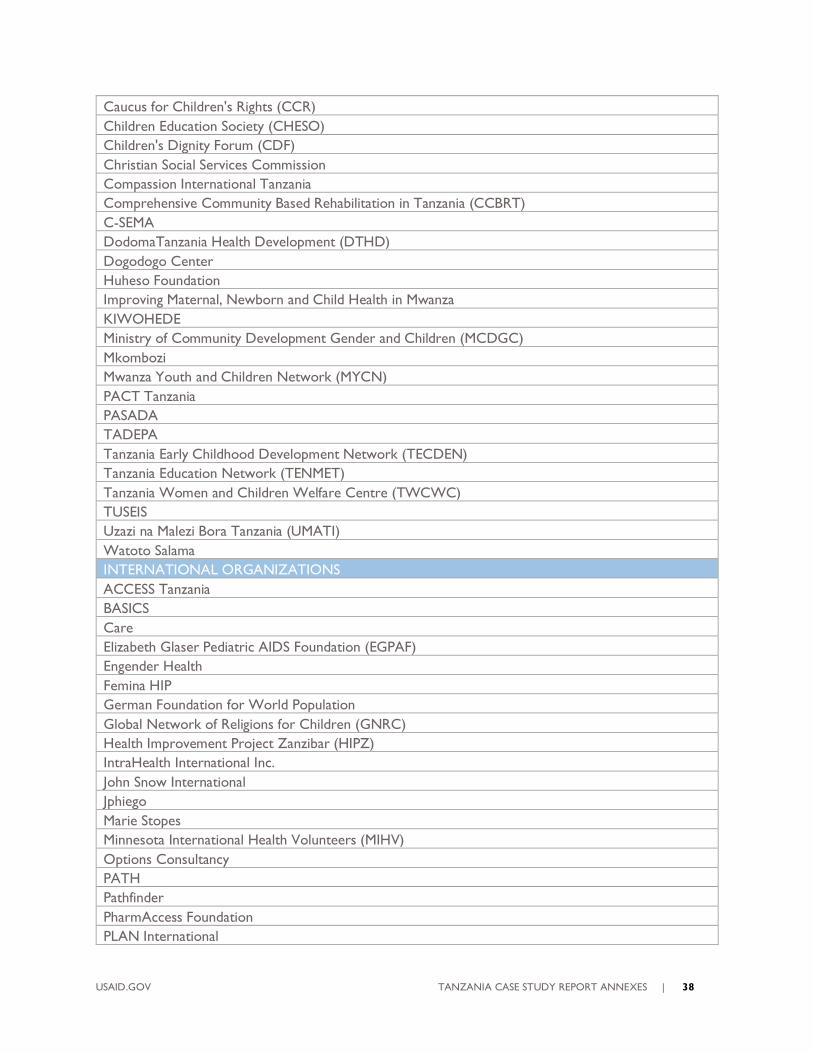
USAID.GOV TANZANIA CASE STUDY REPORT ANNEXES | 38
Caucus for Children's Rights (CCR)
Children Education Society (CHESO)
Children's Dignity Forum (CDF)
Christian Social Services Commission
Compassion International Tanzania
Comprehensive Community Based Rehabilitation in Tanzania (CCBRT)
C-SEMA
DodomaTanzania Health Development (DTHD)
Dogodogo Center
Huheso Foundation
Improving Maternal, Newborn and Child Health in Mwanza
KIWOHEDE
Ministry of Community Development Gender and Children (MCDGC)
Mkombozi
Mwanza Youth and Children Network (MYCN)
PACT Tanzania
PASADA
TADEPA
Tanzania Early Childhood Development Network (TECDEN)
Tanzania Education Network (TENMET)
Tanzania Women and Children Welfare Centre (TWCWC)
TUSEIS
Uzazi na Malezi Bora Tanzania (UMATI)
Watoto Salama
INTERNATIONAL ORGANIZATIONS
ACCESS Tanzania
BASICS
Care
Elizabeth Glaser Pediatric AIDS Foundation (EGPAF)
Engender Health
Femina HIP
German Foundation for World Population
Global Network of Religions for Children (GNRC)
Health Improvement Project Zanzibar (HIPZ)
IntraHealth International Inc.
John Snow International
Jphiego
Marie Stopes
Minnesota International Health Volunteers (MIHV)
Options Consultancy
PATH
Pathfinder
PharmAccess Foundation
PLAN International
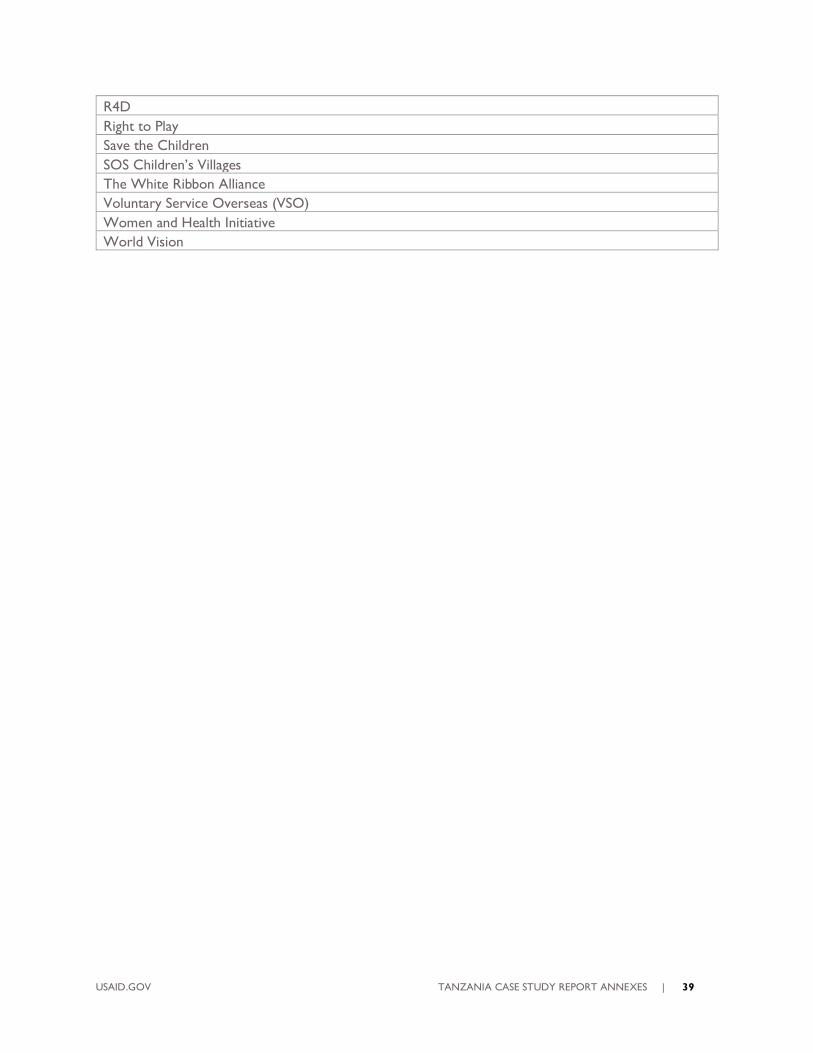
USAID.GOV TANZANIA CASE STUDY REPORT ANNEXES | 39
R4D
Right to Play
Save the Children
SOS Children’s Villages
The White Ribbon Alliance
Voluntary Service Overseas (VSO)
Women and Health Initiative
World Vision
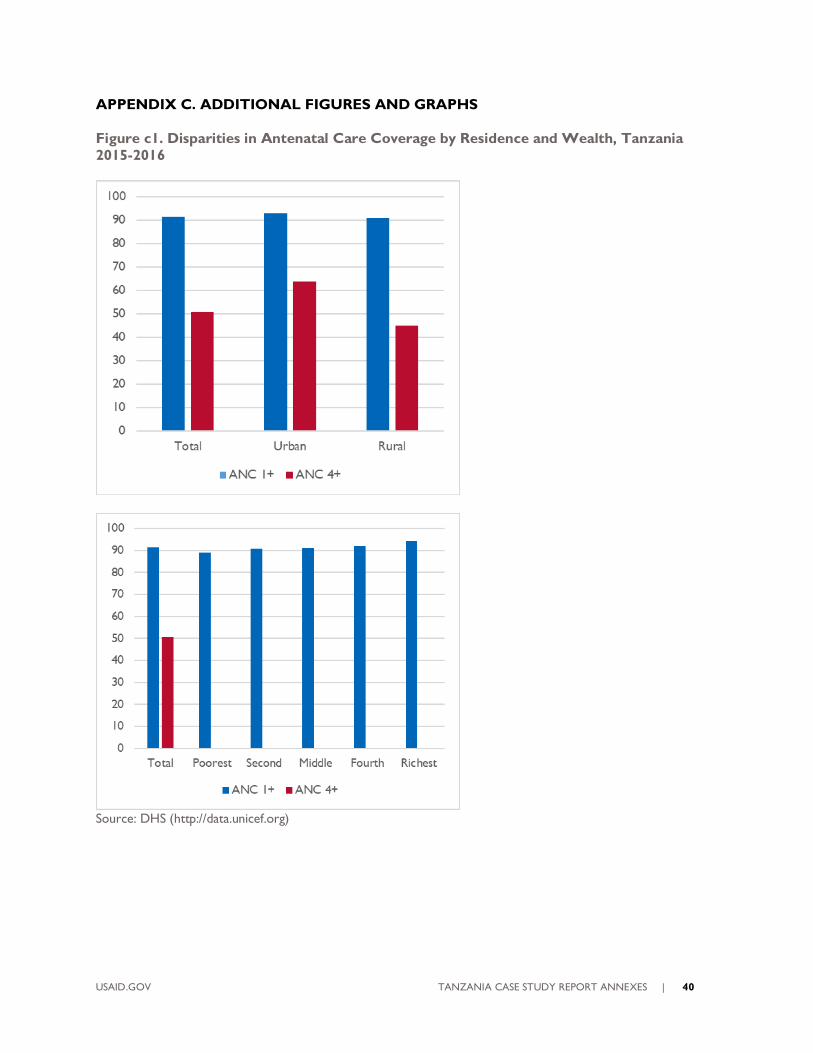
USAID.GOV TANZANIA CASE STUDY REPORT ANNEXES | 40
APPENDIX C. ADDITIONAL FIGURES AND GRAPHS
Figure c1. Disparities in Antenatal Care Coverage by Residence and Wealth, Tanzania
2015-2016
Source: DHS (http://data.unicef.org)
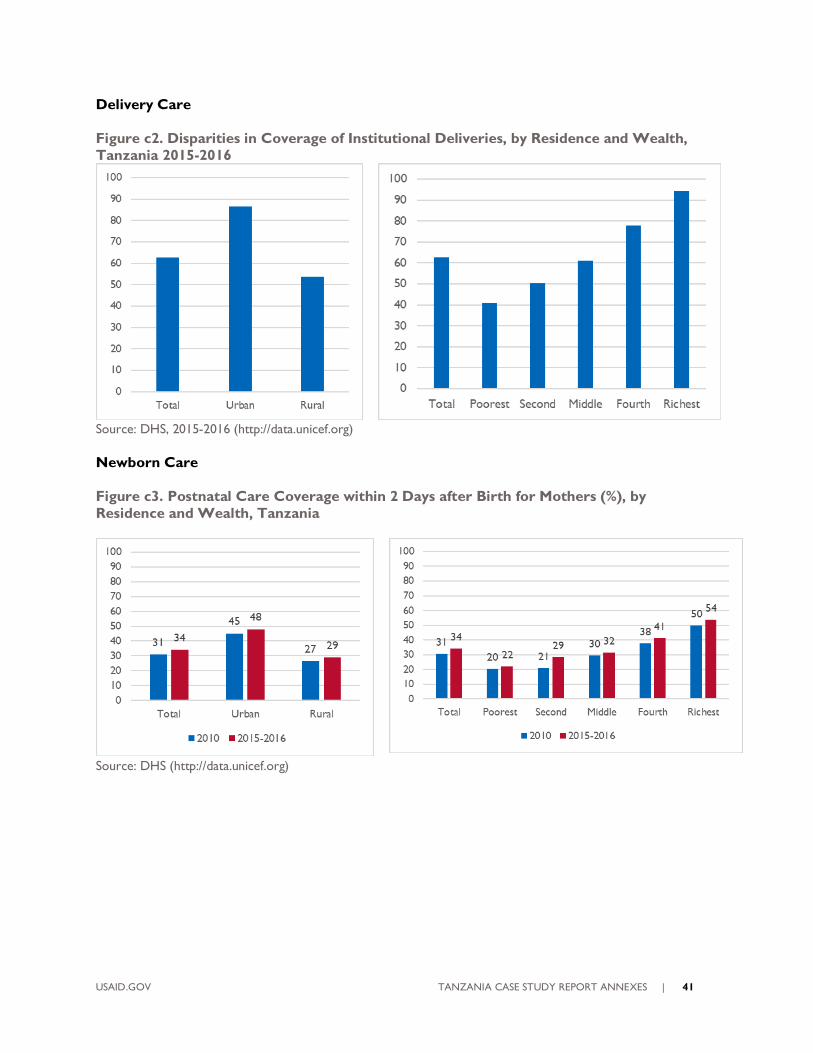
USAID.GOV TANZANIA CASE STUDY REPORT ANNEXES | 41
Delivery Care
Figure c2. Disparities in Coverage of Institutional Deliveries, by Residence and Wealth,
Tanzania 2015-2016
Source: DHS, 2015-2016 (http://data.unicef.org)
Newborn Care
Figure c3. Postnatal Care Coverage within 2 Days after Birth for Mothers (%), by
Residence and Wealth, Tanzania
Source: DHS (http://data.unicef.org)
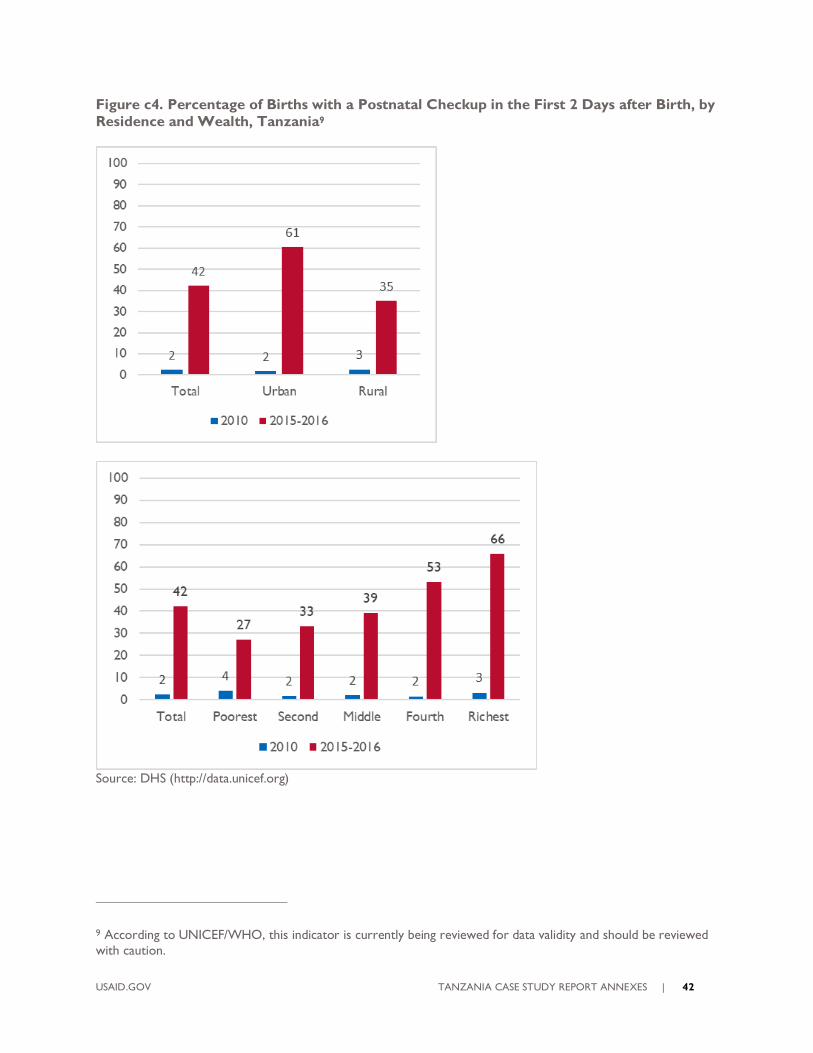
USAID.GOV TANZANIA CASE STUDY REPORT ANNEXES | 42
Figure c4. Percentage of Births with a Postnatal Checkup in the First 2 Days after Birth, by
Residence and Wealth, Tanzania9
Source: DHS (http://data.unicef.org)
9 According to UNICEF/WHO, this indicator is currently being reviewed for data validity and should be reviewed
with caution.
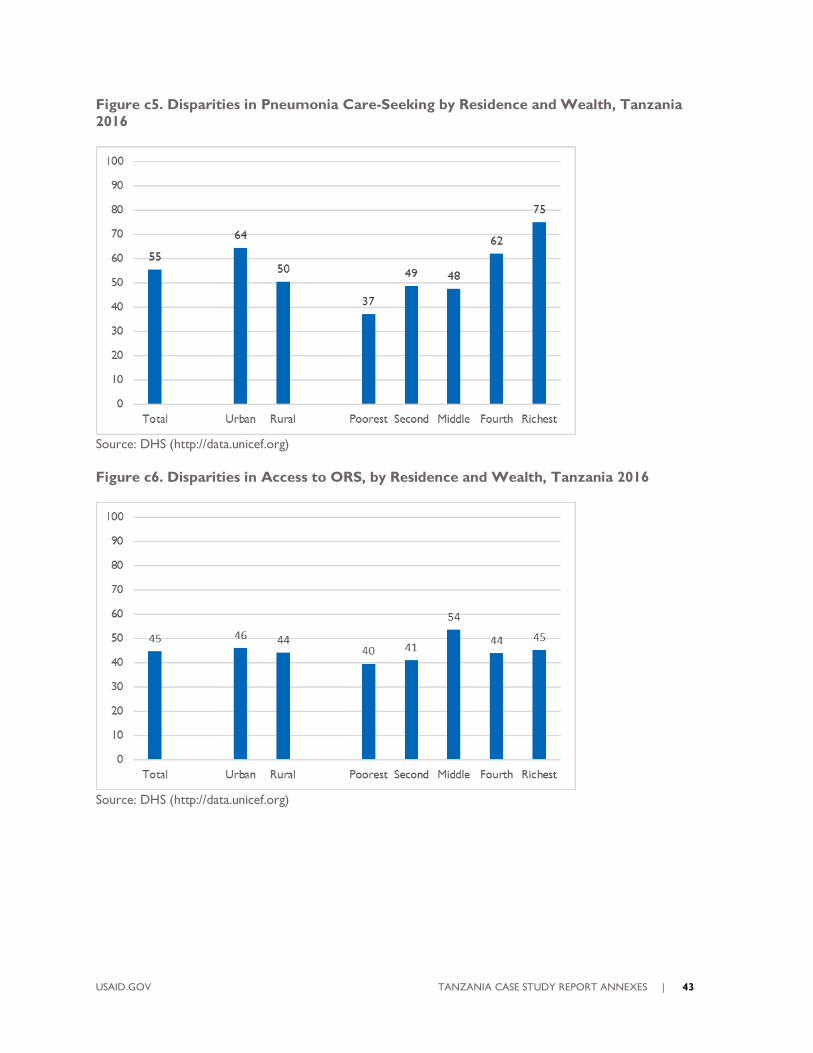
USAID.GOV TANZANIA CASE STUDY REPORT ANNEXES | 43
Figure c5. Disparities in Pneumonia Care-Seeking by Residence and Wealth, Tanzania
2016
Source: DHS (http://data.unicef.org)
Figure c6. Disparities in Access to ORS, by Residence and Wealth, Tanzania 2016
Source: DHS (http://data.unicef.org)
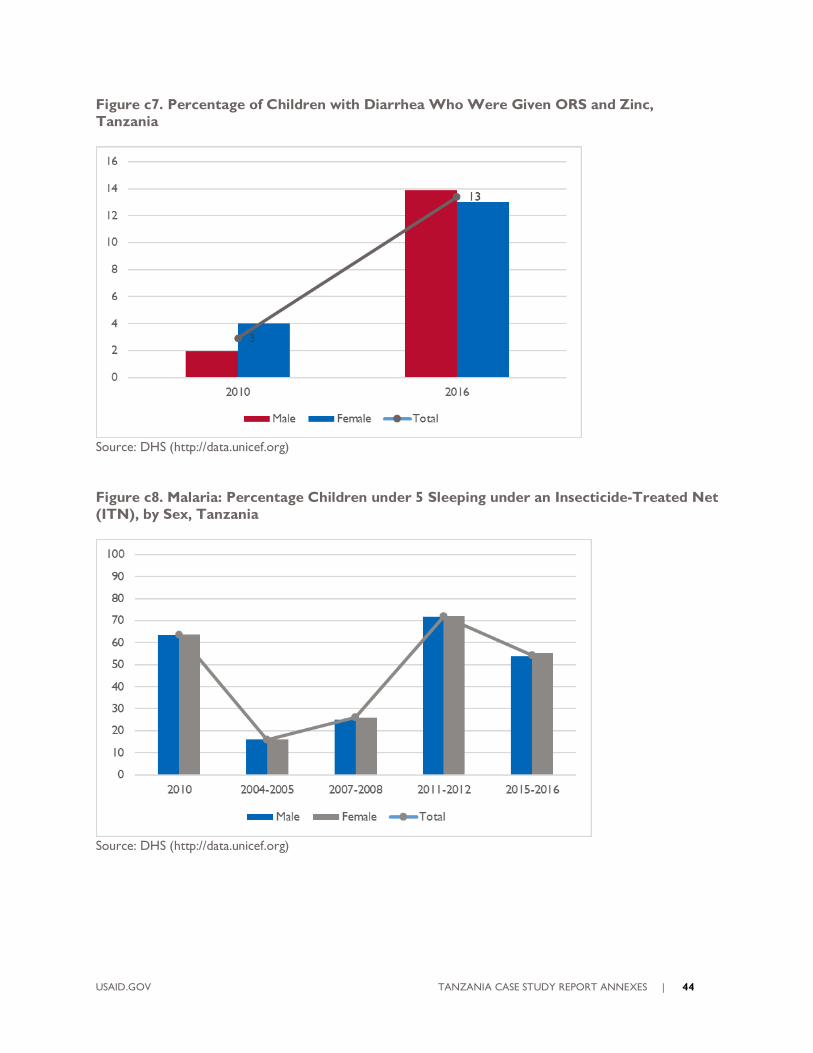
USAID.GOV TANZANIA CASE STUDY REPORT ANNEXES | 44
Figure c7. Percentage of Children with Diarrhea Who Were Given ORS and Zinc,
Tanzania
Source: DHS (http://data.unicef.org)
Figure c8. Malaria: Percentage Children under 5 Sleeping under an Insecticide-Treated Net
(ITN), by Sex, Tanzania
Source: DHS (http://data.unicef.org)
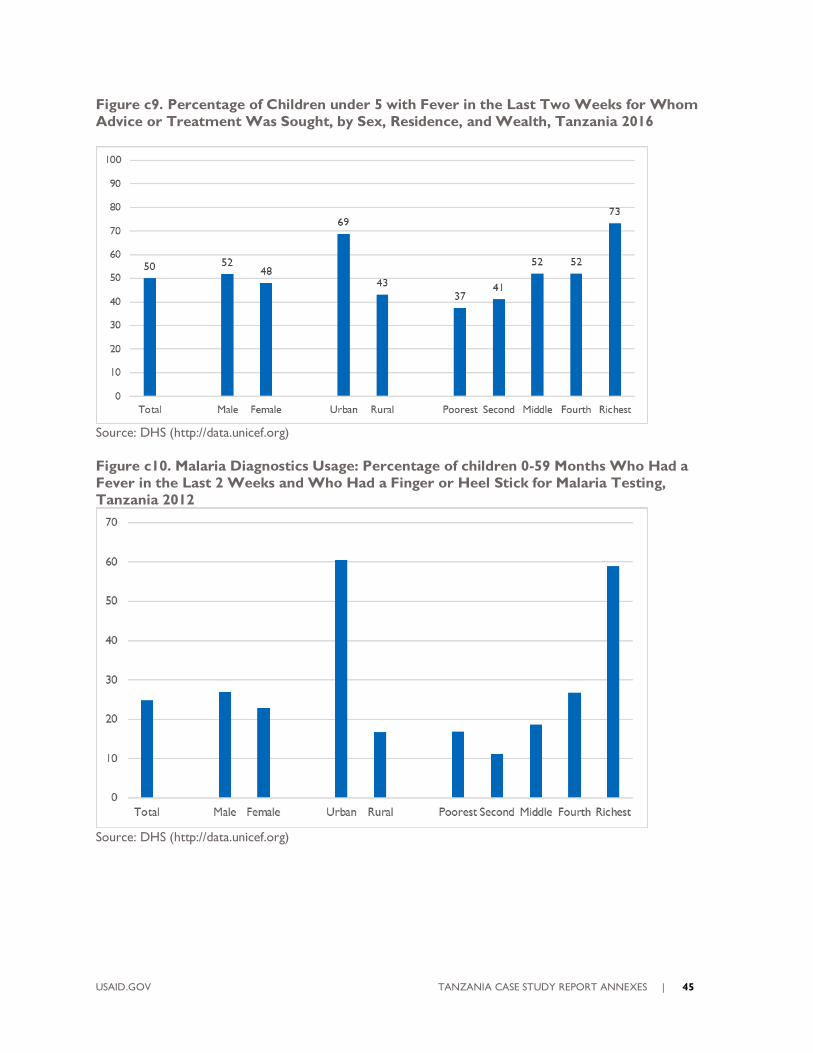
USAID.GOV TANZANIA CASE STUDY REPORT ANNEXES | 45
Figure c9. Percentage of Children under 5 with Fever in the Last Two Weeks for Whom
Advice or Treatment Was Sought, by Sex, Residence, and Wealth, Tanzania 2016
Source: DHS (http://data.unicef.org)
Figure c10. Malaria Diagnostics Usage: Percentage of children 0-59 Months Who Had a
Fever in the Last 2 Weeks and Who Had a Finger or Heel Stick for Malaria Testing,
Tanzania 2012
Source: DHS (http://data.unicef.org)
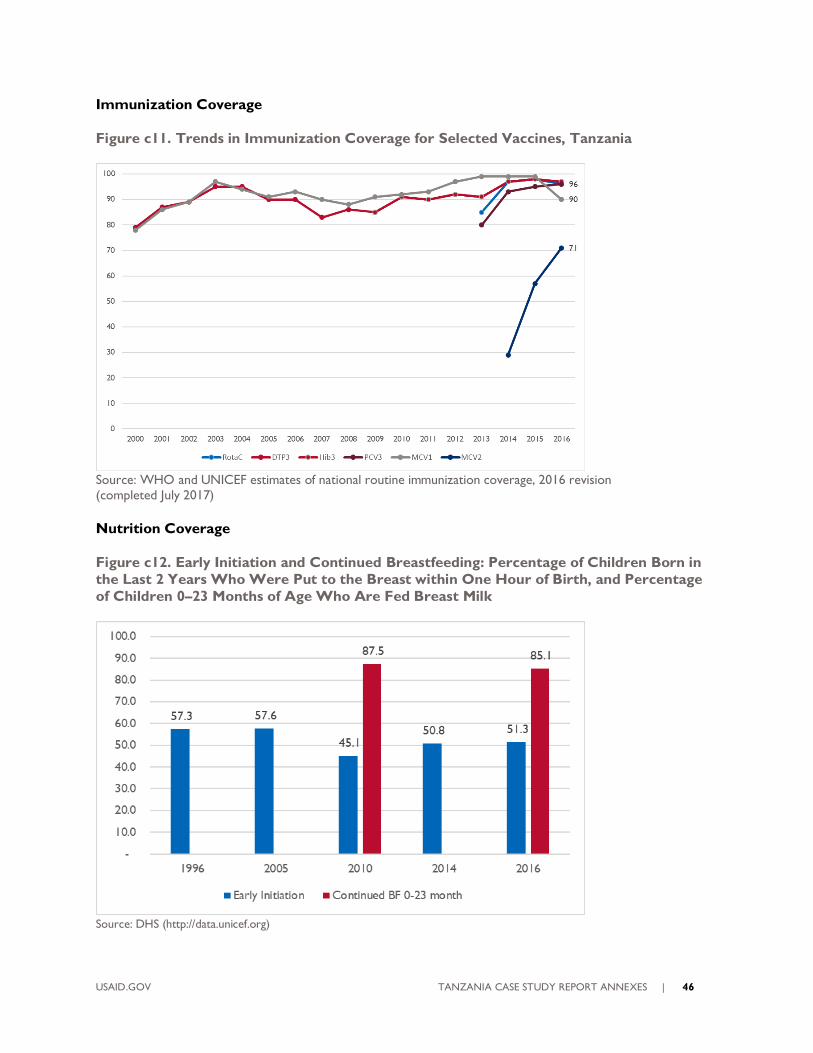
USAID.GOV TANZANIA CASE STUDY REPORT ANNEXES | 46
Immunization Coverage
Figure c11. Trends in Immunization Coverage for Selected Vaccines, Tanzania
Source: WHO and UNICEF estimates of national routine immunization coverage, 2016 revision (completed July 2017)
Nutrition Coverage
Figure c12. Early Initiation and Continued Breastfeeding: Percentage of Children Born in
the Last 2 Years Who Were Put to the Breast within One Hour of Birth, and Percentage
of Children 0–23 Months of Age Who Are Fed Breast Milk
Source: DHS (http://data.unicef.org)
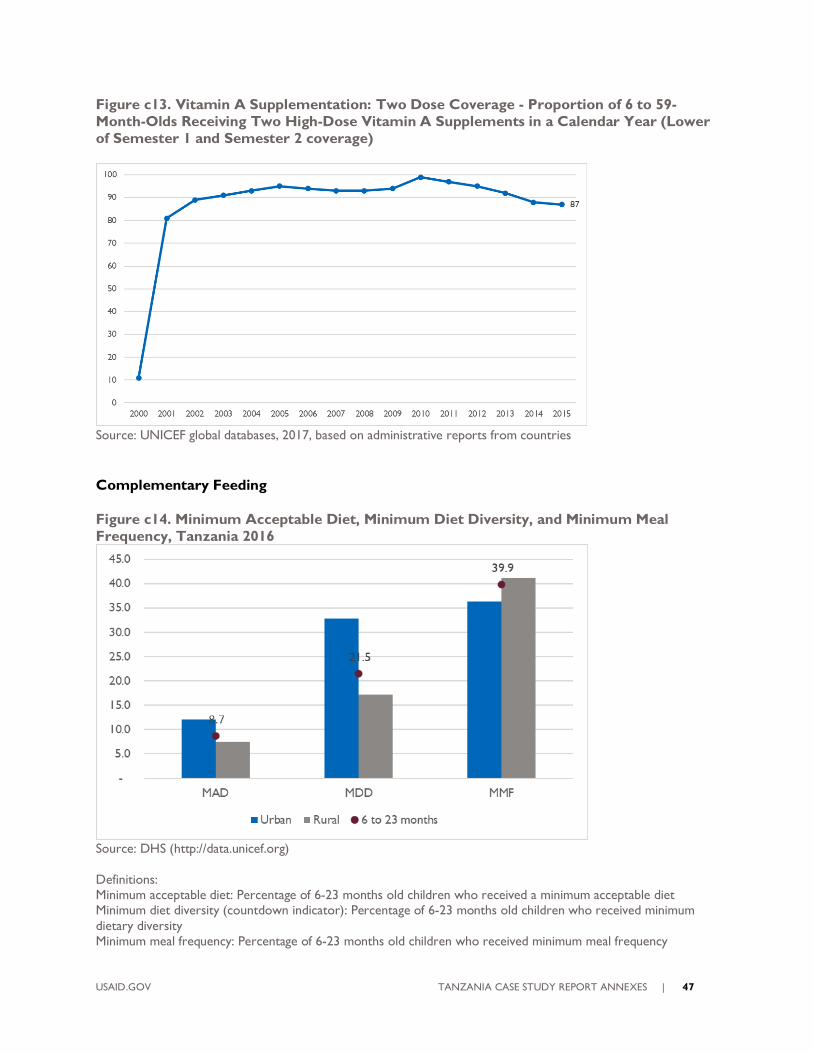
USAID.GOV TANZANIA CASE STUDY REPORT ANNEXES | 47
Figure c13. Vitamin A Supplementation: Two Dose Coverage - Proportion of 6 to 59-
Month-Olds Receiving Two High-Dose Vitamin A Supplements in a Calendar Year (Lower
of Semester 1 and Semester 2 coverage)
Source: UNICEF global databases, 2017, based on administrative reports from countries
Complementary Feeding
Figure c14. Minimum Acceptable Diet, Minimum Diet Diversity, and Minimum Meal
Frequency, Tanzania 2016
Source: DHS (http://data.unicef.org)
Definitions: Minimum acceptable diet: Percentage of 6-23 months old children who received a minimum acceptable diet Minimum diet diversity (countdown indicator): Percentage of 6-23 months old children who received minimum
dietary diversity Minimum meal frequency: Percentage of 6-23 months old children who received minimum meal frequency
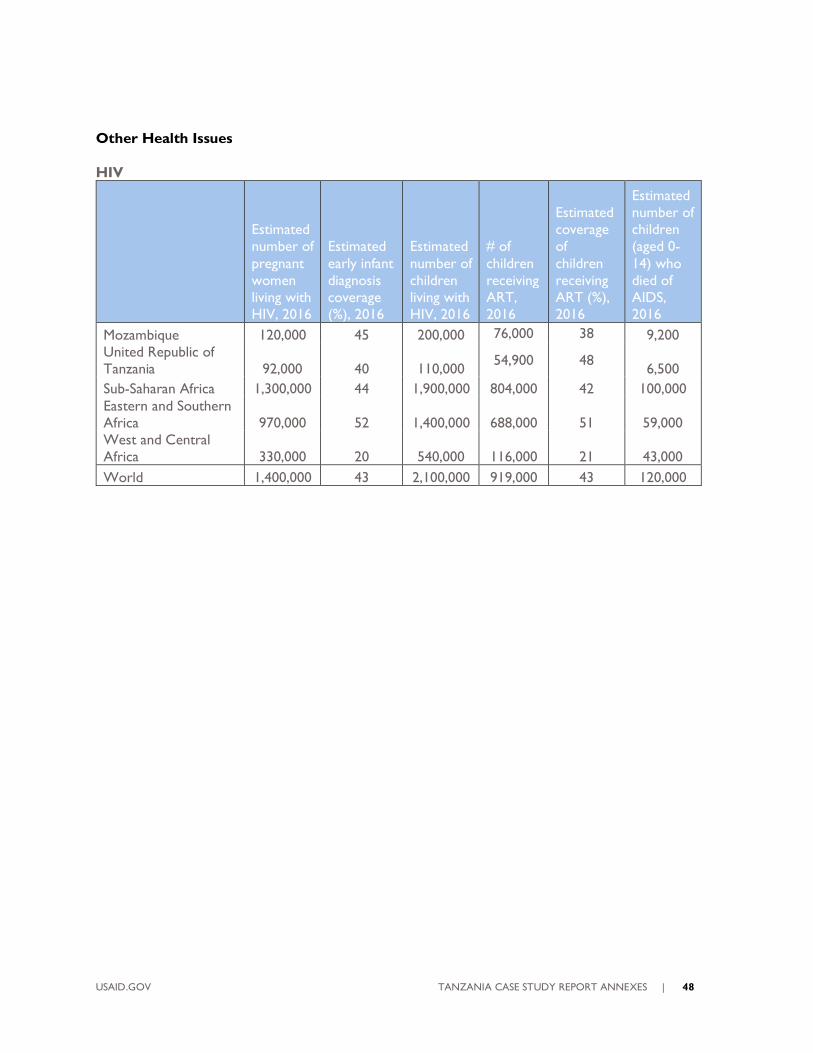
USAID.GOV TANZANIA CASE STUDY REPORT ANNEXES | 48
Other Health Issues
HIV
Estimated
number of
pregnant
women
living with
HIV, 2016
Estimated
early infant
diagnosis
coverage
(%), 2016
Estimated
number of
children
living with
HIV, 2016
# of
children
receiving
ART,
2016
Estimated
coverage
of
children
receiving
ART (%),
2016
Estimated
number of
children
(aged 0-
14) who
died of
AIDS,
2016
Mozambique 120,000 45 200,000 76,000 38 9,200
United Republic of
Tanzania 92,000 40 110,000 54,900 48
6,500
Sub-Saharan Africa 1,300,000 44 1,900,000 804,000 42 100,000
Eastern and Southern
Africa 970,000 52 1,400,000 688,000 51 59,000
West and Central
Africa 330,000 20 540,000 116,000 21 43,000
World 1,400,000 43 2,100,000 919,000 43 120,000

USAID.GOV TANZANIA CASE STUDY REPORT ANNEXES | 49
REFERENCES
1. Afnan-Holmes, H., et al., Tanzania's Countdown to 2015: an analysis of two decades of progress and gaps
for reproductive, maternal, newborn, and child health, to inform priorities for post-2015. The Lancet Global
Health, 2015. 3(7): p. e396-e409.
2. Masanja, H., et al., Child survival gains in Tanzania: analysis of data from demographic and health surveys.
Lancet, 2008. 371(9620): p. 1276-1283.
3. World Bank Group. Tanzania Mainland Poverty Assessment. 2015.
4. Lugg, R., Morley, L., Leach F. Country Profiles for Ghana and Tanzania: Economic, social and political
context for widening participation in higher education, 2008. ERSC/Dfid Poverty Reduction Programme
5. Malick Kanté, A., et al., Trends in socioeconomic disparities in a rapid under-five mortality transition: a
longitudinal study in the United Republic of Tanzania. Tendencias en las desigualdades socioeconómicas
en una rápida transición de las tasas de mortalidad en menores de cinco años: un estudio
longitudinal en la República Unida de Tanzania., 2016. 94(4): p. 258-266A.
6. United Republic of Tanzania, Ministry of Health, Community Development, Gender and Elderly
Children. The National Road Map Strategic Plan to Improve Reproductive, Maternal, Newborn, Child and
Adolescent Health (2016-2020). One Plan II, 2016. <ONE PLAN CEEMI-1.pdf>.
7. Larson, E., et al., Missed Opportunities to Improve the Health of Postpartum Women: High Rates of
Untreated Hypertension in Rural Tanzania. 2017, Springer Science & Business Media B.V. p. 407-413.
8. Exavery, A., et al., Levels and correlates of non-adherence to WHO recommended inter-birth intervals in
Rufiji, Tanzania. BMC Pregnancy & Childbirth, 2012. 12(1): p. 1-8.
9. Exavery, A., et al., Multilevel Analysis of Childbearing in Childhood in Tanzania's Rufiji District. Maternal &
Child Health Journal, 2016. 20(2): p. 447-455.
10. Selemani, M., et al., The effect of mother's age and other related factors on neonatal survival associated
with first and second birth in rural, Tanzania: evidence from Ifakara health and demographic surveillance
system in rural Tanzania. BMC Pregnancy & Childbirth, 2014. 14(1): p. 1-9.
11. Victor, R., et al., Factors associated with inappropriate complementary feeding practices among children
aged 6-23 months in Tanzania. Maternal & Child Nutrition, 2014. 10(4): p. 545-561.
12. Ogbo, F.A., et al., The association between infant and young child feeding practices and diarrhoea in
Tanzanian children. Tropical Medicine & Health, 2018. 46(1): p. 1-9.
13. Kimanya, M.E., et al., Strategies to reduce exposure of fumonisins from complementary foods in rural
Tanzania. Maternal & child nutrition, 2012. 8(4): p. 503-511.
14. Maluka, S, Chitama, D. Primary Care Systems Profiles & Performance (Primasys): Tanzania Case Study.
Alliance for Health Policy and Systems Research.
15. Croke, K., The Political Economy of Child Mortality Decline in Tanzania and Uganda, 1995-2007. Studies
in Comparative International Development, 2012. 47(4): p. 441-463.
16. Mchome, Z., Bailey, A., Darak, S., Kessy, F., Haisma, H. He usually has what we call normal fevers’:
Cultural perspectives on healthy child growth in rural Southeastern Tanzania: An ethnographic enquiry. PLoS
ONE 14(9): e0222231. https://doi.org/10.1371/journal.pone.0222231.
17. McGill, D., Perales, N., Dutta, A. Prognosis for Maternal, Newborn, and Child Health in Tanzania: Plans
for Interventions in the Short, Medium, and Long Term, 2015. Healthy Policy Projects, Futures Group.
18. Bliss, K. E., Streifel, C. Targeting Big Results in Maternal, Neonatal, and Child Health: A Trip Report of
Report of the CSIS Delegation to the United Republic of Tanzania, February 2015. Center for Strategic
and International Studies, 2015.
19. United Republic of Tanzania. National Five Development Plan 2016/17-2020/21: Nurturing
Industrialization for Economic Transformation and Human Development. 2016. Ministry of Finance and
Planning.
20. Baker, U., et al., Identifying implementation bottlenecks for maternal and newborn health interventions in
rural districts of the United Republic of Tanzania. Identificación de obstáculos en la ejecución de
USAID.GOV TANZANIA CASE STUDY REPORT ANNEXES | 50
intervenciones de salud maternal y neonatal en distritos rurales de la República Unida de Tanzania.,
2015. 93(6): p. 380-389.
21. Manzi, F., et al., Improving Newborn Survival in Southern Tanzania (INSIST) trial; community-based
maternal and newborn care economic analysis. Health Policy Plan, 2017. 32(suppl_1): p. i33-i41.
22. United Republic of Tanzania, Ministry of Health, Community Development, Gender and Elderly
Children. The National Road Map Strategic Plan to Improve Reproductive, Maternal, Newborn,
Child and Adolescent Health (2016-2020). One Plan II, 2016.
23. Manji, K. Situation analysis of newborn health in Tanzania: Current situation, existing plans and strategic
next steps for newborn health. Dar es Salaam: Ministry of Health and Social Welfare, Save the
Children; 2009
24. Chaudhury, S., et al., Cost analysis of large-scale implementation of the 'Helping Babies Breathe' newborn
resuscitation-training program in Tanzania. BMC Health Serv Res, 2016. 16(1): p. 681.
25. <WRA_Tanzania-Case-Study.pdf>.
26. Krüger, C., M. Heinzel-Gutenbrunner, and M. Ali, Adherence to the integrated management of childhood
illness guidelines in Namibia, Kenya, Tanzania and Uganda: evidence from the national service provision
assessment surveys. BMC Health Services Research, 2017. 17: p. 1-12.
27. Victora, C.G., et al., Are health interventions implemented where they are most needed? District uptake of
the Integrated Management of Childhood Illness strategy in Brazil, Peru and the United Republic of
Tanzania. Se implementan las intervenciones sanitarias donde más se necesitan? Implantacion distrital
de la estrategia de Atención Integrada a las Enfermedades Prevalentes de la Infancia en el Brasil, el
Perú y la República Unida de Tanzanía, 2006. 84(10): p. 792-801.
28. Kiplagat, A., et al., Factors influencing the implementation of integrated management of childhood illness
(IMCI) by healthcare workers at public health centers & dispensaries in Mwanza, Tanzania. BMC Public
Health, 2014. 14(1): p. 277-286.
29. Semali, I.A., Trends in immunization completion and disparities in the context of health reforms: the case
study of Tanzania. BMC Health Serv Res, 2010. 10: p. 299.
30. Mihigo, R., Badir. N., O’Malley, H., Chaudhri, I. Fulfilling A Promise: Ensuring Immunization For All in
Africa. Ministerial Conference on Immunization in Africa. WHO, 2016. Global Vaccine Action Plan:
Regional Vaccine Action Plans 2016 Progress Report.
31. Global Vaccine Action Plan Secretariat Annual Report, 2017. World Health Organization.
32. Mwisongo, A., A.N. Soumare, and J. Nabyonga-Orem, An analytical perspective of Global health
initiatives in Tanzania and Zambia. BMC Health Serv Res, 2016. 16 Suppl 4: p. 223.
33. White, James, Barbara O‘Hanlon, Grace Chee, Emmanuel Malangalila, Adeline Kimambo, Jorge
Coarasa, Sean Callahan, Ilana Ron Levey, and Kim McKeon. January 2013. Tanzania Private Sector
Assessment. Bethesda, MD: Strengthening Health Outcomes through the Private Sector Project, Abt
Associates Inc.
34. United Republic of Tanzania, Ministry of Health and Social Welfare. Primary Health Services
Development Programme-MMAM, 2007-2017. 2007.
35. Anyimadu, A. Politics and Development in Tanzania: Shifting the Status Quo. Chatham House The Royal
Institute of International Affairs, Africa Programme, 2016.
36. Mann, C., et al., Countdown to 2015 country case studies: what can analysis of national health financing
contribute to understanding MDG 4 and 5 progress? BMC Public Health, 2016. 16(1): p. 67-81.
37. Chimhutu, V., et al., Introducing payment for performance in the health sector of Tanzania- the policy
process. Globalization & Health, 2015. 11(1): p. 1-10.
38. Binyaruka, P., et al., Effect of Paying for Performance on Utilisation, Quality, and User Costs of Health
Services in Tanzania: A Controlled Before and After Study. PLoS ONE, 2015. 10(8): p. 1-16.
39. Manzi, F., et al., Human resources for health care delivery in Tanzania: a multifaceted problem. Human
Resources for Health, 2012. 10(1): p. 1-10.
40. World Health Organization, Health Workforce Resource Requirements for Universal Health Coverage and
Sustainable Development Goals. 2016.
USAID.GOV TANZANIA CASE STUDY REPORT ANNEXES | 51
41. Exavery, A., et al., Gender-based distributional skewness of the United Republic of Tanzania's health
workforce cadres: a cross-sectional health facility survey. Human Resources for Health, 2013. 11(1): p. 1-
9.
42. Tanzania Health System Assessment. USAID, 2010.
43. Mapping Tanzania’s Community Health Worker Programs. Community Health Worker Learning Agenda
Project, 2015.
44. Naburi, H., et al., The potential of task-shifting in scaling up services for prevention of mother-to-child
transmission of HIV: a time and motion study in Dar es Salaam, Tanzania. Human Resources for Health,
2017. 15: p. 1-11.
45. Rockers, P.C., et al., Source of antenatal care influences facility delivery in rural Tanzania: a population-
based study. Matern Child Health J, 2009. 13(6): p. 879-85.
46. Kruk, M.E., et al., Who is left behind on the road to universal facility delivery? A cross‐sectional multilevel
analysis in rural Tanzania. Tropical Medicine & International Health, 2015. 20(8): p. 1057-1066.
47. Mahiti, G.R., et al., Women's perceptions of antenatal, delivery, and postpartum services in rural Tanzania.
Glob Health Action, 2015. 8: p. 28567.
48. Embrey, M., et al., Understanding the Role of Accredited Drug Dispensing Outlets in Tanzania’s Health
System. PLoS ONE, 2016. 11(11): p. 1-16.
USAID.GOV TANZANIA CASE STUDY REPORT ANNEXES | 52
ANNEX B: DETAILED METHODOLOGY
Child Health Leadership and Networks in
Tanzania from 2000 to the Present:
Country Perspectives
Final Study Description
USAID CIRCLE Project
October 28, 2018
USAID.GOV TANZANIA CASE STUDY REPORT ANNEXES | 53
TABLE OF CONTENTS, DETAILED METHODOLOGY
Background and Rationale ............................................................................................................................................. 54
Research Questions ........................................................................................................................................................ 55
Study Design ..................................................................................................................................................................... 57
Study Methodology.......................................................................................................................................................... 59
Analysis ............................................................................................................................................................................... 65
Reporting ........................................................................................................................................................................... 67
USAID.GOV TANZANIA CASE STUDY REPORT ANNEXES | 54
BACKGROUND AND RATIONALE
WHY CHILD HEALTH?
Childhood mortality rates have decreased significantly over the past 15 years in Tanzania as reported in
the 2015 Tanzania Demographic and Health Survey (TDHS). The neonatal mortality rate declined from
40 deaths per 1,000 live births in 1999 to 25 deaths in 2015. Over the same period, the infant and
under-5 mortality rates have declined from 99 deaths to 43 deaths per 1000 live births and from 147 to
67 deaths per 1,000 live births, respectively. Tanzania achieved the fifth fastest reduction in under-5
mortality rate among Countdown to 2015 countries, attaining the MDG 4 target with an under-5
mortality rate of 54 deaths per 1000 live births in 2013. However, the targets for maternal and neonatal
mortality were not met and neonatal mortality now accounts for nearly 40% of under-5 mortality.
Trends in coverage of the life-saving services that might have contributed to progress varied in this time
period. Preventive child health services coverage was high (≥85%) and equitable, but coverage of child
curative services was lower and more inequitable (71%). Importantly, facility delivery reached a high of
52% coverage with wide inequities, and family planning coverage was even lower. (46%). Child mortality
reductions were associated with large increases in coverage of insecticide-treated nets and vaccination
and to general economic growth. The conclusions from the Countdown Case and other studies
underscore that focus must continue on addressing unmet need for family planning and gaps in coverage
and quality of care at birth, especially in rural areas.
As the country looks towards 2030 and a goal of 25 for under-5 mortality and 12 for neonatal mortality,
there is an urgent need to maintain focus on child health and to address the gaps in maternal and
neonatal health. With a total fertility rate of 5.2 (TDHS) and the need for new strategies to reach
underserved populations, it may be useful to identify and determine how to enhance health sector
leadership and stakeholder networks to support the implementation of child health strategies and
accelerate progress.
WHY THIS STUDY?
In 2015, USAID commissioned a mapping of global child health leadership to better understand the
evolution of child health since 2000, the current network of global stakeholders and leaders, and the
potential implications for USAID’s future investments in child health. This landscaping exercise explored
how the global child health community might strengthen leadership and reposition child health to
improve outcomes. To reach the Sustainable Development Goals (SDGs) for 2030, it was strongly
recommended that countries be at the center of reframing the future child health agenda and that in-
depth country reflections on child health progress, leadership, and the effectiveness of stakeholder
networks be more systematically documented.
USAID proposes to conduct a country-focused analysis to begin to complement the global mapping
report findings with the perspectives of some country level stakeholders. This follow-on activity will
document context and facilitate a deeper understanding of child health leadership, networks, and
political commitment for child health at the national level in three USAID priority countries:
Mozambique, Tanzania, and Uganda. Findings are intended to contribute to investment, policy, and
programmatic decisions and to enhance collaboration of stakeholders in these countries.
USAID.GOV TANZANIA CASE STUDY REPORT ANNEXES | 55
RESEARCH QUESTIONS
For the purposes of this study, child health is defined as the health of children from birth to 5 years.
Quantitative measures and trends will be drawn from existing published sources. The under-five
mortality rate (U5MR), the infant mortality rate, the neonatal mortality rate (NMR), and rates of wasting
and stunting will be used to describe overall, impact level change in child health at country level over the
past decade or more. Changes in impact are likely the result of improvements in multiple sectors
including health, the economy, education and others. Intermediate outcome and output indicators will
be used to describe the effects of health programs. Health program component indicators may relate to
leadership, stakeholder collaboration, national policy and guidelines, service delivery interventions and
approaches, human resources, information use, financing (including donors), and supply logistics.
Change in child health activities and results will be mapped over approximately 15 years starting about
the year 2000. This starting point was selected based on shifts in the support of child health at the
global level and availability of existing country data on child health resources, strategy, and outcomes
such as the timing of health sector five-year plans. The focus will be on the national level for each
country and data gathering will be limited to this level. Each country will be considered a separate case
study, and all country case studies will be reviewed together to identify similarities and differences in
factors that shaped progress in child health.
The aim of the study is to understand the effectiveness of leadership and stakeholder
networks in improving child health over the past 15 years in the selected countries. This
study will also suggest how these and other drivers of change might be harnessed to advance child
health going forward, especially for USAID. More specifically, the study will answer the following
questions:
• What strategies were employed to improve child health over time? (Strategies are defined as policies,
plans of action, implementation and their results)
• What were the key facilitators and barriers to progress in child health since approximately the year
2000?
• Who were important leaders and organizations in child health in each country and what roles did they
play to influence progress and results?
a. Applying organizational network analysis theory, what were the structure, relationship
characteristics, and dynamics of country child health organizations and networks?
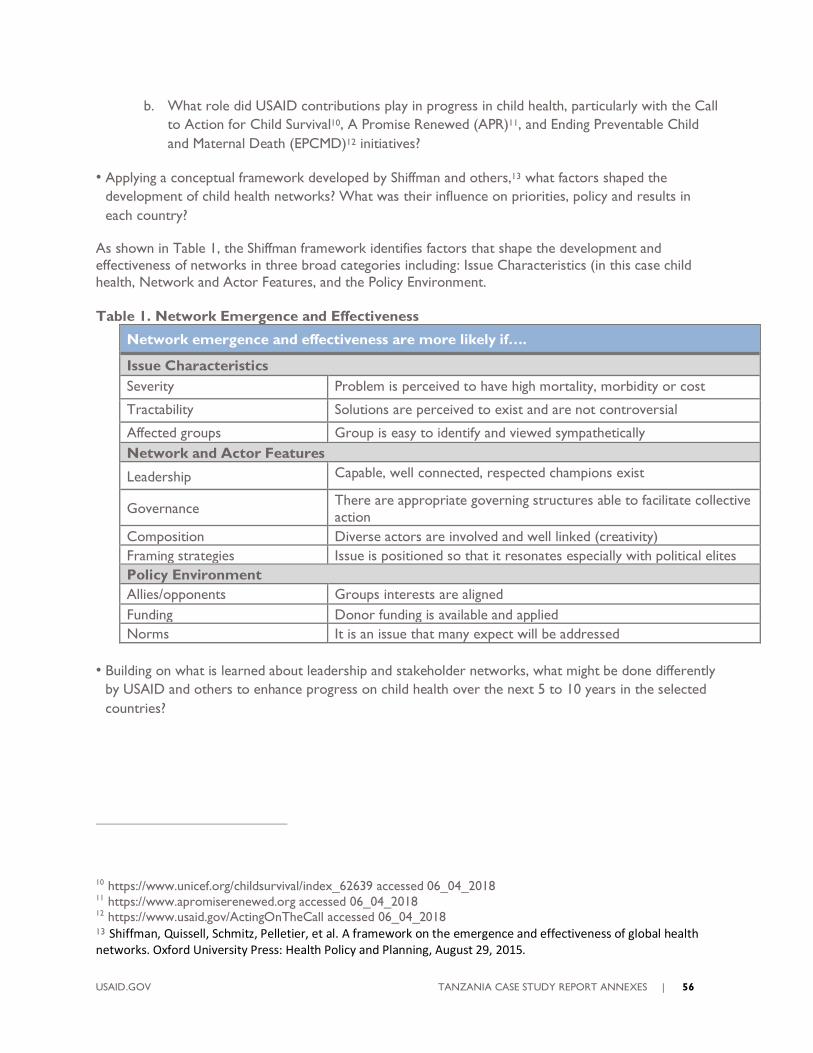
USAID.GOV TANZANIA CASE STUDY REPORT ANNEXES | 56
b. What role did USAID contributions play in progress in child health, particularly with the Call
to Action for Child Survival10, A Promise Renewed (APR)11, and Ending Preventable Child
and Maternal Death (EPCMD)12 initiatives?
• Applying a conceptual framework developed by Shiffman and others,13 what factors shaped the
development of child health networks? What was their influence on priorities, policy and results in
each country?
As shown in Table 1, the Shiffman framework identifies factors that shape the development and
effectiveness of networks in three broad categories including: Issue Characteristics (in this case child
health, Network and Actor Features, and the Policy Environment.
Table 1. Network Emergence and Effectiveness
Network emergence and effectiveness are more likely if….
Issue Characteristics
Severity Problem is perceived to have high mortality, morbidity or cost
Tractability Solutions are perceived to exist and are not controversial
Affected groups Group is easy to identify and viewed sympathetically
Network and Actor Features
Leadership Capable, well connected, respected champions exist
Governance There are appropriate governing structures able to facilitate collective
action
Composition Diverse actors are involved and well linked (creativity)
Framing strategies Issue is positioned so that it resonates especially with political elites
Policy Environment
Allies/opponents Groups interests are aligned
Funding Donor funding is available and applied
Norms It is an issue that many expect will be addressed
• Building on what is learned about leadership and stakeholder networks, what might be done differently
by USAID and others to enhance progress on child health over the next 5 to 10 years in the selected
countries?
10 https://www.unicef.org/childsurvival/index_62639 accessed 06_04_2018 11 https://www.apromiserenewed.org accessed 06_04_2018 12 https://www.usaid.gov/ActingOnTheCall accessed 06_04_2018 13 Shiffman, Quissell, Schmitz, Pelletier, et al. A framework on the emergence and effectiveness of global health networks. Oxford University Press: Health Policy and Planning, August 29, 2015.

USAID.GOV TANZANIA CASE STUDY REPORT ANNEXES | 57
STUDY DESIGN
SUMMARY OF STUDY METHODS
Methods to be utilized in the country analysis include a desk review and secondary data analysis, in-
depth interviews with child health stakeholders at national level, an organizational network analysis
(ONA), and facilitated findings reviews. Table 2 illustrates the relationship among methods, research
questions, and the type of data collected.
Table 2. Study Methods and Research Questions
Method
Research Questions
A B C D E F G
Strategies Enablers
&
Barriers
Call to
Action,
APR,
EPCMD
Past Leaders,
Organizations
, Partnerships
Recent
Leaders,
Organizatio
n networks
Network
Factors
(Shiffman et
al.)
Way
Forward
Desk Review*
In-depth
interviews
Organizational
network analysis
Group reviews
*Data for desk review will not be collected from participants in study countries or globally, but will be collected
from published and gray literature reports, documents, and websites.
CHILD HEALTH TRACER INTERVENTIONS
The study will document the evolution of child health programs and results in terms of strategy,
leadership, and stakeholder network effectiveness. Key child health interventions will be “traced” in
greater detail over time in each country to document if and how these factors affected changes in child
health program performance. These topics (also referred to as “tracer interventions”) include:
Integrated Management of Child Illness (IMCI) - integrated Community Case
Management (iCCM)
Child Immunization
Complementary feeding of young children
Newborn Health (Kangaroo Mother Care [KMC], management of Possible Serious
Bacterial Infection [PSBI], milestones from Every Newborn Action Plans)14
14The indicators available for tracking newborn health are not particularly robust hence more recently developed
indicators for KMC and PSBI case management will be sought. If these are not available, country-reported ENAP
indicators will be used.
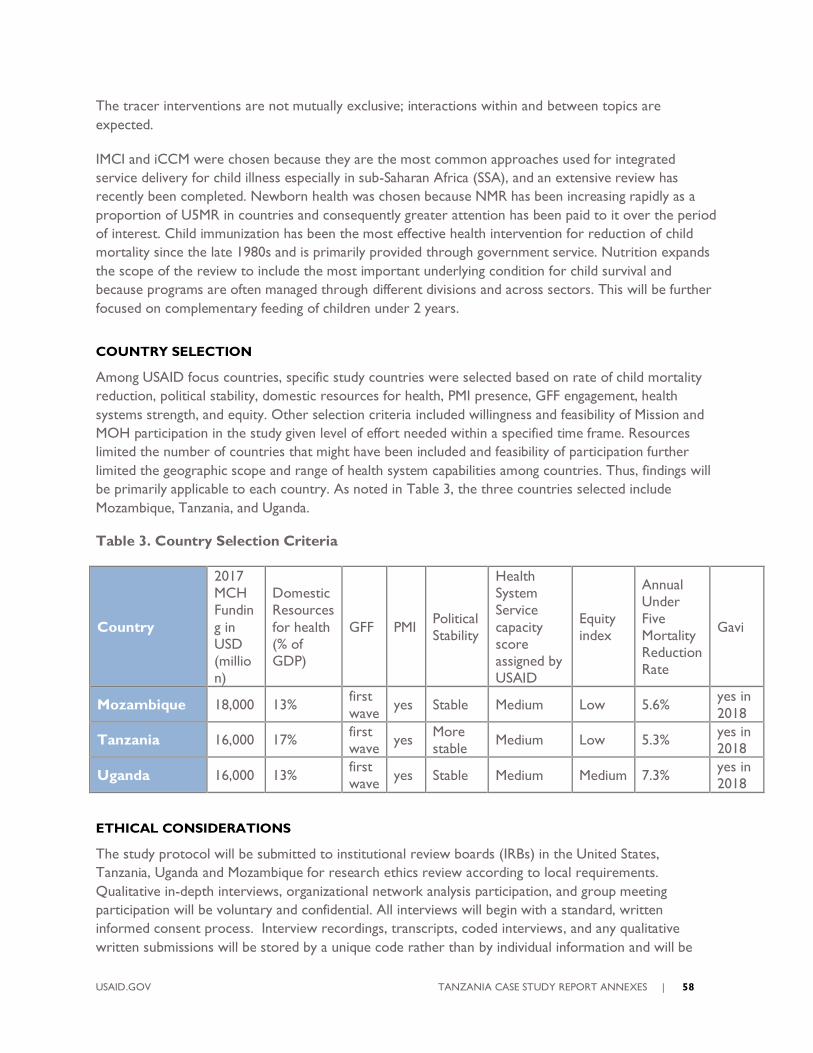
USAID.GOV TANZANIA CASE STUDY REPORT ANNEXES | 58
The tracer interventions are not mutually exclusive; interactions within and between topics are
expected.
IMCI and iCCM were chosen because they are the most common approaches used for integrated
service delivery for child illness especially in sub-Saharan Africa (SSA), and an extensive review has
recently been completed. Newborn health was chosen because NMR has been increasing rapidly as a
proportion of U5MR in countries and consequently greater attention has been paid to it over the period
of interest. Child immunization has been the most effective health intervention for reduction of child
mortality since the late 1980s and is primarily provided through government service. Nutrition expands
the scope of the review to include the most important underlying condition for child survival and
because programs are often managed through different divisions and across sectors. This will be further
focused on complementary feeding of children under 2 years.
COUNTRY SELECTION
Among USAID focus countries, specific study countries were selected based on rate of child mortality
reduction, political stability, domestic resources for health, PMI presence, GFF engagement, health
systems strength, and equity. Other selection criteria included willingness and feasibility of Mission and
MOH participation in the study given level of effort needed within a specified time frame. Resources
limited the number of countries that might have been included and feasibility of participation further
limited the geographic scope and range of health system capabilities among countries. Thus, findings will
be primarily applicable to each country. As noted in Table 3, the three countries selected include
Mozambique, Tanzania, and Uganda.
Table 3. Country Selection Criteria
Country
2017
MCH
Fundin
g in
USD
(millio
n)
Domestic
Resources
for health
(% of
GDP)
GFF PMI Political
Stability
Health
System
Service
capacity
score
assigned by
USAID
Equity
index
Annual
Under
Five
Mortality
Reduction
Rate
Gavi
Mozambique 18,000 13% first
wave yes Stable Medium Low 5.6%
yes in
2018
Tanzania 16,000 17% first
wave yes
More
stable Medium Low 5.3%
yes in
2018
Uganda 16,000 13% first
wave yes Stable Medium Medium 7.3%
yes in
2018
ETHICAL CONSIDERATIONS
The study protocol will be submitted to institutional review boards (IRBs) in the United States,
Tanzania, Uganda and Mozambique for research ethics review according to local requirements.
Qualitative in-depth interviews, organizational network analysis participation, and group meeting
participation will be voluntary and confidential. All interviews will begin with a standard, written
informed consent process. Interview recordings, transcripts, coded interviews, and any qualitative
written submissions will be stored by a unique code rather than by individual information and will be
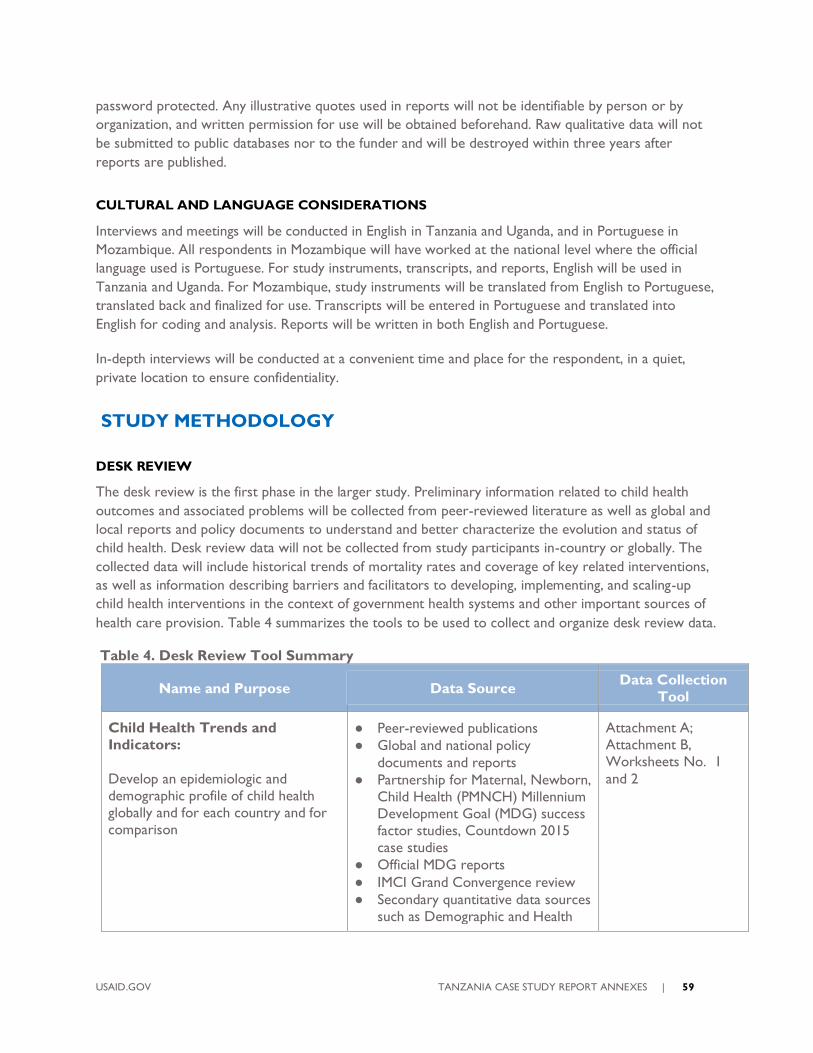
USAID.GOV TANZANIA CASE STUDY REPORT ANNEXES | 59
password protected. Any illustrative quotes used in reports will not be identifiable by person or by
organization, and written permission for use will be obtained beforehand. Raw qualitative data will not
be submitted to public databases nor to the funder and will be destroyed within three years after
reports are published.
CULTURAL AND LANGUAGE CONSIDERATIONS
Interviews and meetings will be conducted in English in Tanzania and Uganda, and in Portuguese in
Mozambique. All respondents in Mozambique will have worked at the national level where the official
language used is Portuguese. For study instruments, transcripts, and reports, English will be used in
Tanzania and Uganda. For Mozambique, study instruments will be translated from English to Portuguese,
translated back and finalized for use. Transcripts will be entered in Portuguese and translated into
English for coding and analysis. Reports will be written in both English and Portuguese.
In-depth interviews will be conducted at a convenient time and place for the respondent, in a quiet,
private location to ensure confidentiality.
STUDY METHODOLOGY
DESK REVIEW
The desk review is the first phase in the larger study. Preliminary information related to child health
outcomes and associated problems will be collected from peer-reviewed literature as well as global and
local reports and policy documents to understand and better characterize the evolution and status of
child health. Desk review data will not be collected from study participants in-country or globally. The
collected data will include historical trends of mortality rates and coverage of key related interventions,
as well as information describing barriers and facilitators to developing, implementing, and scaling-up
child health interventions in the context of government health systems and other important sources of
health care provision. Table 4 summarizes the tools to be used to collect and organize desk review data.
Table 4. Desk Review Tool Summary
Name and Purpose Data Source Data Collection
Tool
Child Health Trends and
Indicators:
Develop an epidemiologic and
demographic profile of child health
globally and for each country and for
comparison
Peer-reviewed publications
Global and national policy
documents and reports
Partnership for Maternal, Newborn,
Child Health (PMNCH) Millennium
Development Goal (MDG) success
factor studies, Countdown 2015
case studies
Official MDG reports
IMCI Grand Convergence review
Secondary quantitative data sources
such as Demographic and Health
Attachment A;
Attachment B,
Worksheets No. 1
and 2
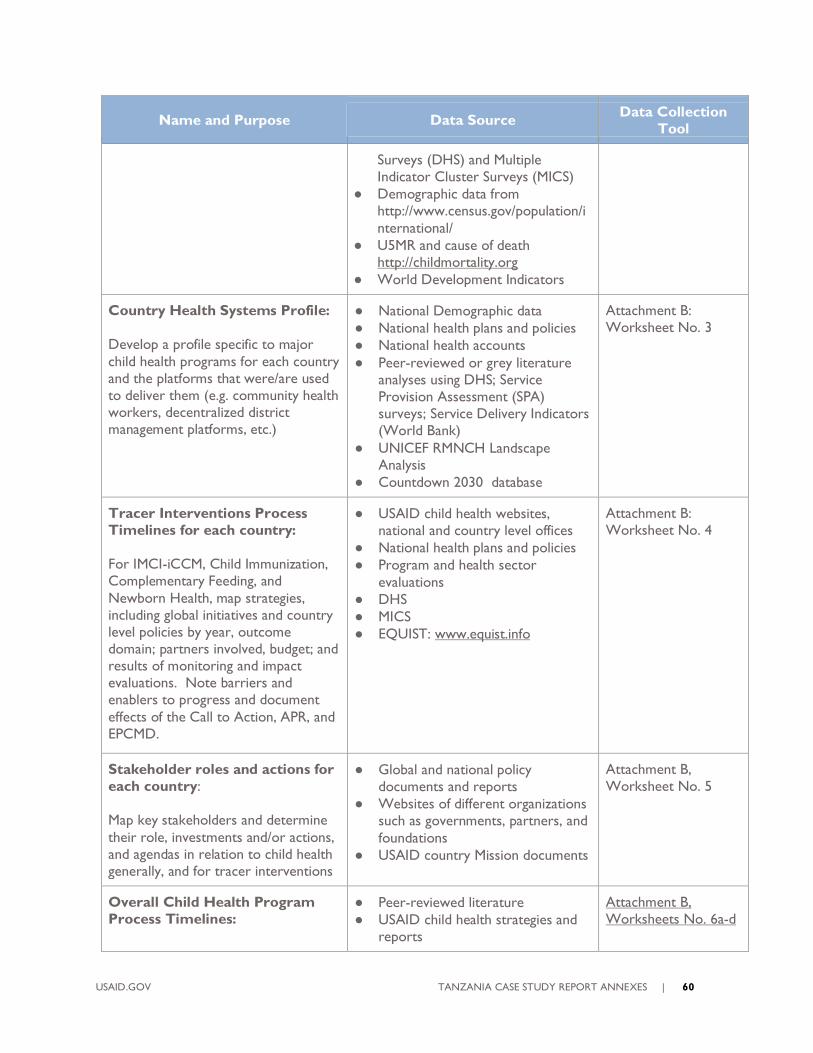
USAID.GOV TANZANIA CASE STUDY REPORT ANNEXES | 60
Name and Purpose Data Source Data Collection
Tool
Surveys (DHS) and Multiple
Indicator Cluster Surveys (MICS)
Demographic data from
http://www.census.gov/population/i
nternational/
U5MR and cause of death
http://childmortality.org
World Development Indicators
Country Health Systems Profile:
Develop a profile specific to major
child health programs for each country
and the platforms that were/are used
to deliver them (e.g. community health
workers, decentralized district
management platforms, etc.)
National Demographic data
National health plans and policies
National health accounts
Peer-reviewed or grey literature
analyses using DHS; Service
Provision Assessment (SPA)
surveys; Service Delivery Indicators
(World Bank)
UNICEF RMNCH Landscape
Analysis
Countdown 2030 database
Attachment B:
Worksheet No. 3
Tracer Interventions Process
Timelines for each country:
For IMCI-iCCM, Child Immunization,
Complementary Feeding, and
Newborn Health, map strategies,
including global initiatives and country
level policies by year, outcome
domain; partners involved, budget; and
results of monitoring and impact
evaluations. Note barriers and
enablers to progress and document
effects of the Call to Action, APR, and
EPCMD.
USAID child health websites,
national and country level offices
National health plans and policies
Program and health sector
evaluations
DHS
MICS
EQUIST: www.equist.info
Attachment B:
Worksheet No. 4
Stakeholder roles and actions for
each country:
Map key stakeholders and determine
their role, investments and/or actions,
and agendas in relation to child health
generally, and for tracer interventions
Global and national policy
documents and reports
Websites of different organizations
such as governments, partners, and
foundations
USAID country Mission documents
Attachment B,
Worksheet No. 5
Overall Child Health Program
Process Timelines:
Peer-reviewed literature
USAID child health strategies and
reports
Attachment B,
Worksheets No. 6a-d
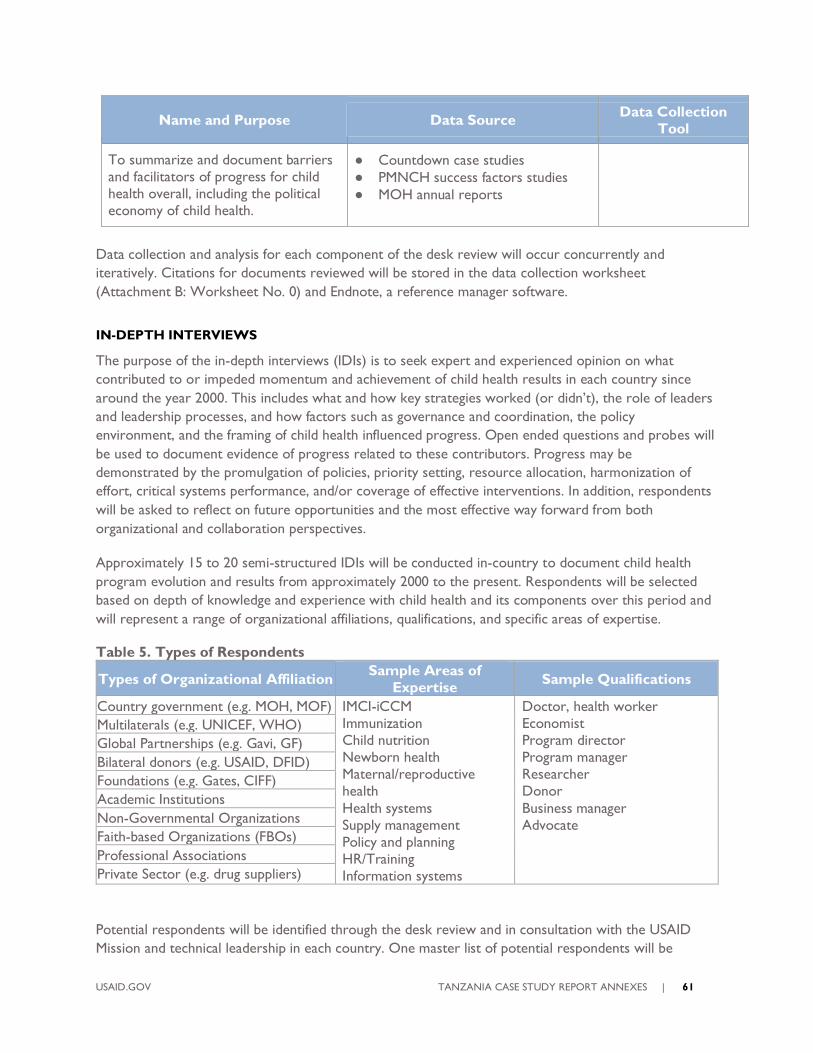
USAID.GOV TANZANIA CASE STUDY REPORT ANNEXES | 61
Name and Purpose Data Source Data Collection
Tool
To summarize and document barriers
and facilitators of progress for child
health overall, including the political
economy of child health.
Countdown case studies
PMNCH success factors studies
MOH annual reports
Data collection and analysis for each component of the desk review will occur concurrently and
iteratively. Citations for documents reviewed will be stored in the data collection worksheet
(Attachment B: Worksheet No. 0) and Endnote, a reference manager software.
IN-DEPTH INTERVIEWS
The purpose of the in-depth interviews (IDIs) is to seek expert and experienced opinion on what
contributed to or impeded momentum and achievement of child health results in each country since
around the year 2000. This includes what and how key strategies worked (or didn’t), the role of leaders
and leadership processes, and how factors such as governance and coordination, the policy
environment, and the framing of child health influenced progress. Open ended questions and probes will
be used to document evidence of progress related to these contributors. Progress may be
demonstrated by the promulgation of policies, priority setting, resource allocation, harmonization of
effort, critical systems performance, and/or coverage of effective interventions. In addition, respondents
will be asked to reflect on future opportunities and the most effective way forward from both
organizational and collaboration perspectives.
Approximately 15 to 20 semi-structured IDIs will be conducted in-country to document child health
program evolution and results from approximately 2000 to the present. Respondents will be selected
based on depth of knowledge and experience with child health and its components over this period and
will represent a range of organizational affiliations, qualifications, and specific areas of expertise.
Table 5. Types of Respondents
Types of Organizational Affiliation Sample Areas of
Expertise Sample Qualifications
Country government (e.g. MOH, MOF) IMCI-iCCM
Immunization
Child nutrition
Newborn health
Maternal/reproductive
health
Health systems
Supply management
Policy and planning
HR/Training
Information systems
Doctor, health worker
Economist
Program director
Program manager
Researcher
Donor
Business manager
Advocate
Multilaterals (e.g. UNICEF, WHO)
Global Partnerships (e.g. Gavi, GF)
Bilateral donors (e.g. USAID, DFID)
Foundations (e.g. Gates, CIFF)
Academic Institutions
Non-Governmental Organizations
Faith-based Organizations (FBOs)
Professional Associations
Private Sector (e.g. drug suppliers)
Potential respondents will be identified through the desk review and in consultation with the USAID
Mission and technical leadership in each country. One master list of potential respondents will be
USAID.GOV TANZANIA CASE STUDY REPORT ANNEXES | 62
created for the IDIs and for the ONA (described below). The initial list for the IDIs and ONA
interviews will be reviewed and prioritized into first-tier respondents (highly knowledgeable/experienced
in child health along the time frame of interest) and second-tier respondents (to balance input, fill gaps -
as time allows). In addition, any individuals or important actors suggested by respondents during
interviews will be noted and continuously reviewed. Additional interviews may be done with those
identified, if further detail or clarification is needed, if they fill significant gaps in time-frame, content or
representativeness, or if they contribute to triangulation of key information. Ultimately the master list
will be finalized to list only those scheduled for interviews for the IDIs and for the ONA. Code numbers
will be assigned to each name for use in identifying respondents on the data collection instruments,
recordings, and transcripts.
The interview instrument (See Annex C) is designed based on the study questions and experience with
the global child health leadership study, and will be refined by desk review findings, USAID Mission, and
local researcher review.
ORGANIZATIONAL NETWORK ANALYSIS (ONA)
In recent years, there has been an effort to examine how social and organizational networks impact
health systems and health outcomes.15 Organizational Network Analysis is a methodology developed to
study how individuals, communities, organizations, and other entities connect and interact with one
another.16 It uses quantitative methods and associated visualization software to examine the relationship
between agents (people and organizations) to describe the pattern of relationships in the whole network
and positions of organizations in the network to understand system processes and aspects of
performance. Through this process, ONA uncovers the patterns of complex interactions that occur
within and between different types of institutions, organizations and government departments.
The ONA for this study will document the recent relationships and positions of organizations working
on child health. It will help assess the extent to which certain organizations have leveraged their
positions and forged successful partnerships and networks to influence policies, plans, and programs in
child health. Additional areas of analysis include establishing the key organizations that are: a) influential,
b) sought for the latest evidence, and c) recognized leaders that can bring the child health community
together to discuss controversial topics and build common goals and directions for the future.
The ONA methodology will contribute to the understanding of the top “network and actor features.”
This includes identification of key leadership organizations based on confirmed relationships in the child
health network, the overall density of relationships, the extent to which there are isolated sub-groups
or clusters of organizations, and how they are linked into the overall network through “bridging” ties or
organizations that provide important pathways for communication and coordination.
15 For a review of these efforts, see Varda, D., Shoup, J.A., and Miller, S. 2012. A systematic review of collaboration and network research in the Public Affairs literature: Implications for public health practice and research. American
Journal of Public Health, 102: 564—571; Friedman, S.R. and Aral, S. 2001. Social networks, risk-potential networks, health, and disease. Journal of Urban Health: Bulletin of the New York Academy of Medicine, 78:411-418. 16 Valente, T.W., Coronges, KA, Stevens, GD, and Cousineau, MR. 2008. Collaboration and competition in a
children’s health initiative coalition: A network analysis. Evaluation and Program Planning, 31:392-402.
USAID.GOV TANZANIA CASE STUDY REPORT ANNEXES | 63
The ONA will determine how organizations are interacting and communicating around key themes of
interest, the intensity of the interaction and the relationship quality. This will contribute to identifying
opportunities and modalities for more effective stakeholder engagement and thus better child health
results in the future.
In order to construct an accurate picture of organizational relationships, we have selected a recall
period of 2015, or post MDGs until the present. (The desk review and qualitative survey will explore
the longer historical trajectory of child health progress beginning around 2000.)
The basic starting point of a network definition is that it is viewed as a group of three or more
organizations connected in ways that facilitate the achievement of a common goal.17 Organizations and
respondents will be identified through the desk review process, consultation with key informants in
selected countries, and with USAID Missions. The list is likely to include: national government (e.g.,
MOH, Ministry of Social Welfare); donors or development partners (e.g. USAID, UNICEF, WHO);
financing partners (e.g. World Bank, GFF); implementing partners; private sector networks or private
health providers; NGOs; FBOs; professional associations; and research institutions.
The master list of potential organizations and respondents as described above will also include
respondents for the ONA. To get a more accurate picture of relationships, it may be necessary to seek
out essential individuals who were engaged with a particular organization during the time period of
interest but have either retired or have joined another organization.
The ONA questionnaire contains characteristics of the respondent and the organization, followed by a
table that lists all the organizations in the study and notes whether a relationship exists (see Annex E). If
a relationship exists, a series of questions are asked about the type of working relationship related to
child health since 2015. These relationships are grouped into the categories of a) strategies, policies,
plans, or legislation; b) capacity development; c) program implementation; and d) accountability
mechanisms. These questions may be adapted to reflect individual country context.
Further questions in the survey explore the intensity of the relationship between the respondent
organization and every other organization with which they have a relationship. This is organized by
increasing levels of intensity: 1) communication - interactions as necessary to inform one another and/or
access resources; 2) coordination - interactions to exchange ideas, build consensus, and ensure that
overlap is minimized; 3) collaboration - having an ongoing, reciprocal working relationship.
The last area assesses the quality of the relationship between organizations as trust is a central
component of a functional network. Relationship quality is measured by a 5-point Likert scale: poor,
fair, good, very good, or excellent. Respondents are also asked to identify the five top organizations that
have been: a) most influential in child health since 2015, b) who they would turn to for the latest
research and evidence, and c) which are best suited to convening the child health community to discuss
important and/or controversial issues in developing child health strategies, policies and programs.
17 Provan, Keith, Fish, Amy and Sydow, Joerg, Interorganizational Networks at the Network Level: A review of the
Empirical Literature on Whole Networks, Journal of Management 2007 33:479-516.
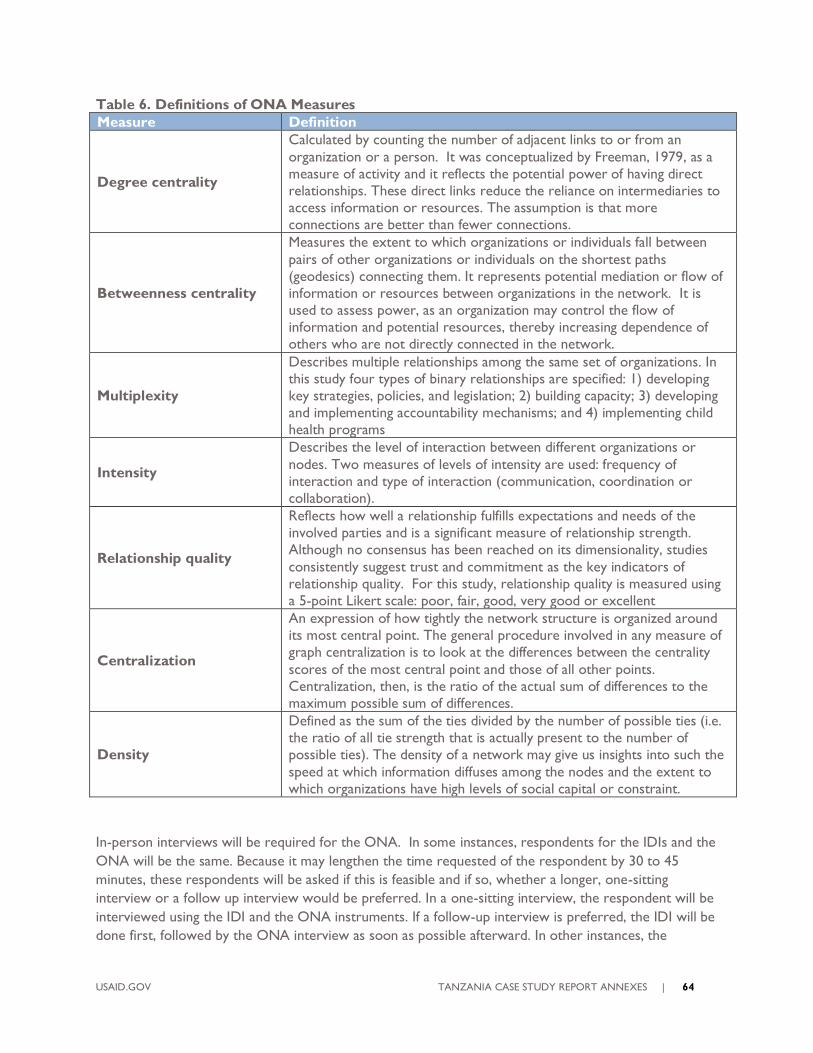
USAID.GOV TANZANIA CASE STUDY REPORT ANNEXES | 64
Table 6. Definitions of ONA Measures
Measure Definition
Degree centrality
Calculated by counting the number of adjacent links to or from an
organization or a person. It was conceptualized by Freeman, 1979, as a
measure of activity and it reflects the potential power of having direct
relationships. These direct links reduce the reliance on intermediaries to
access information or resources. The assumption is that more
connections are better than fewer connections.
Betweenness centrality
Measures the extent to which organizations or individuals fall between
pairs of other organizations or individuals on the shortest paths
(geodesics) connecting them. It represents potential mediation or flow of
information or resources between organizations in the network. It is
used to assess power, as an organization may control the flow of
information and potential resources, thereby increasing dependence of
others who are not directly connected in the network.
Multiplexity
Describes multiple relationships among the same set of organizations. In
this study four types of binary relationships are specified: 1) developing
key strategies, policies, and legislation; 2) building capacity; 3) developing
and implementing accountability mechanisms; and 4) implementing child
health programs
Intensity
Describes the level of interaction between different organizations or
nodes. Two measures of levels of intensity are used: frequency of
interaction and type of interaction (communication, coordination or
collaboration).
Relationship quality
Reflects how well a relationship fulfills expectations and needs of the
involved parties and is a significant measure of relationship strength.
Although no consensus has been reached on its dimensionality, studies
consistently suggest trust and commitment as the key indicators of
relationship quality. For this study, relationship quality is measured using
a 5-point Likert scale: poor, fair, good, very good or excellent
Centralization
An expression of how tightly the network structure is organized around
its most central point. The general procedure involved in any measure of
graph centralization is to look at the differences between the centrality
scores of the most central point and those of all other points.
Centralization, then, is the ratio of the actual sum of differences to the
maximum possible sum of differences.
Density
Defined as the sum of the ties divided by the number of possible ties (i.e.
the ratio of all tie strength that is actually present to the number of
possible ties). The density of a network may give us insights into such the
speed at which information diffuses among the nodes and the extent to
which organizations have high levels of social capital or constraint.
In-person interviews will be required for the ONA. In some instances, respondents for the IDIs and the
ONA will be the same. Because it may lengthen the time requested of the respondent by 30 to 45
minutes, these respondents will be asked if this is feasible and if so, whether a longer, one-sitting
interview or a follow up interview would be preferred. In a one-sitting interview, the respondent will be
interviewed using the IDI and the ONA instruments. If a follow-up interview is preferred, the IDI will be
done first, followed by the ONA interview as soon as possible afterward. In other instances, the
USAID.GOV TANZANIA CASE STUDY REPORT ANNEXES | 65
respondent may be a different person than for the in-depth interview, but from the same organization.
In this case, the person will be invited separately. Separate informed consent will also be obtained for
the ONA component.
GROUP REVIEW OF DATA AND FINDINGS
Study findings will be drawn from the three data collection methods of desk review, in-depth interviews,
and the ONA. To provide a check on early versions of key observations and findings within each
country, a small group of key informants will be invited to participate in a confidential, facilitated meeting
to review summary statements, to clarify their context, language, and accuracy, to identify any gaps in
information, and recommend any further data checking or analysis as needed. The group review will
take place after IDIs and ONA interviews are completed. At the simplest level, this process is intended
to document “did we hear what we thought we heard?” This group meeting will also be used to
characterize the future context for child health in country (5 to 10 years) and to identify opportunities
for consideration of future policy and program directions based on early findings.
Participation in these country-level group meetings will be voluntary and written informed consent will
be obtained beforehand. The meetings will not be recorded. Content notes of meetings will be kept
without attribution to individual participants, and information will be summarized and synthesized and
fed into the overall final report. There will not be separate reports, and notes will be destroyed within
three years after the final report is published.
After the first draft country case study findings and conclusions have been completed, a meeting of local
and international researchers from all three countries and possibly other child health thought leaders in
sub-Saharan Africa will be held to compare and contrast findings and conclusions. The main purpose of
this meeting will be to help country teams consider findings from a broader perspective and to identify
any useful learning that may be shared among countries as they apply study results. For this meeting,
report summaries only will be shared. Raw qualitative data, personally or organizationally identifiable
data, and country group meeting notes from countries will not be shared. Participants in the meeting will
not be individually quoted.
ANALYSIS
Desk review information will be presented in spreadsheets and timelines and separate reports prepared
for each country. Quantitative information will be assembled in standard graphs and formats for each
country for use during the facilitated reviews and overall analysis. Qualitative information, largely from
other studies, will be extracted by questionnaire themes and factors and combined with IDI coded
information during the analysis phase.
In-depth interviews will be recorded with permission, transcribed, coded, and excerpted in Dedoose, a
web-based qualitative data analysis platform.18 Interviews from Mozambique will be in Portuguese,
18Dedoose Version 8.0.35, web application for managing, analyzing, and presenting qualitative and mixed method
research data (2018). Los Angeles, CA: SocioCultural Research Consultants, LLC. www.dedoose.com.
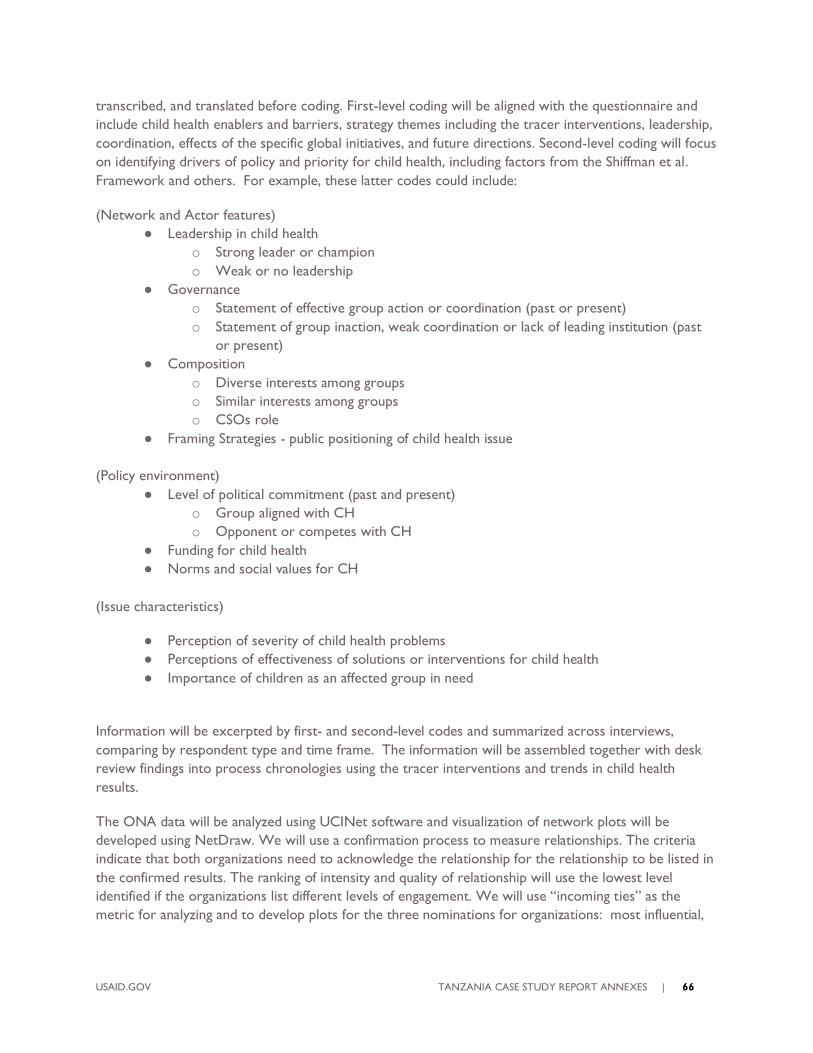
USAID.GOV TANZANIA CASE STUDY REPORT ANNEXES | 66
transcribed, and translated before coding. First-level coding will be aligned with the questionnaire and
include child health enablers and barriers, strategy themes including the tracer interventions, leadership,
coordination, effects of the specific global initiatives, and future directions. Second-level coding will focus
on identifying drivers of policy and priority for child health, including factors from the Shiffman et al.
Framework and others. For example, these latter codes could include:
(Network and Actor features)
Leadership in child health
o Strong leader or champion
o Weak or no leadership
Governance
o Statement of effective group action or coordination (past or present)
o Statement of group inaction, weak coordination or lack of leading institution (past
or present)
Composition
o Diverse interests among groups
o Similar interests among groups
o CSOs role
Framing Strategies - public positioning of child health issue
(Policy environment)
Level of political commitment (past and present)
o Group aligned with CH
o Opponent or competes with CH
Funding for child health
Norms and social values for CH
(Issue characteristics)
Perception of severity of child health problems
Perceptions of effectiveness of solutions or interventions for child health
Importance of children as an affected group in need
Information will be excerpted by first- and second-level codes and summarized across interviews,
comparing by respondent type and time frame. The information will be assembled together with desk
review findings into process chronologies using the tracer interventions and trends in child health
results.
The ONA data will be analyzed using UCINet software and visualization of network plots will be
developed using NetDraw. We will use a confirmation process to measure relationships. The criteria
indicate that both organizations need to acknowledge the relationship for the relationship to be listed in
the confirmed results. The ranking of intensity and quality of relationship will use the lowest level
identified if the organizations list different levels of engagement. We will use “incoming ties” as the
metric for analyzing and to develop plots for the three nominations for organizations: most influential,
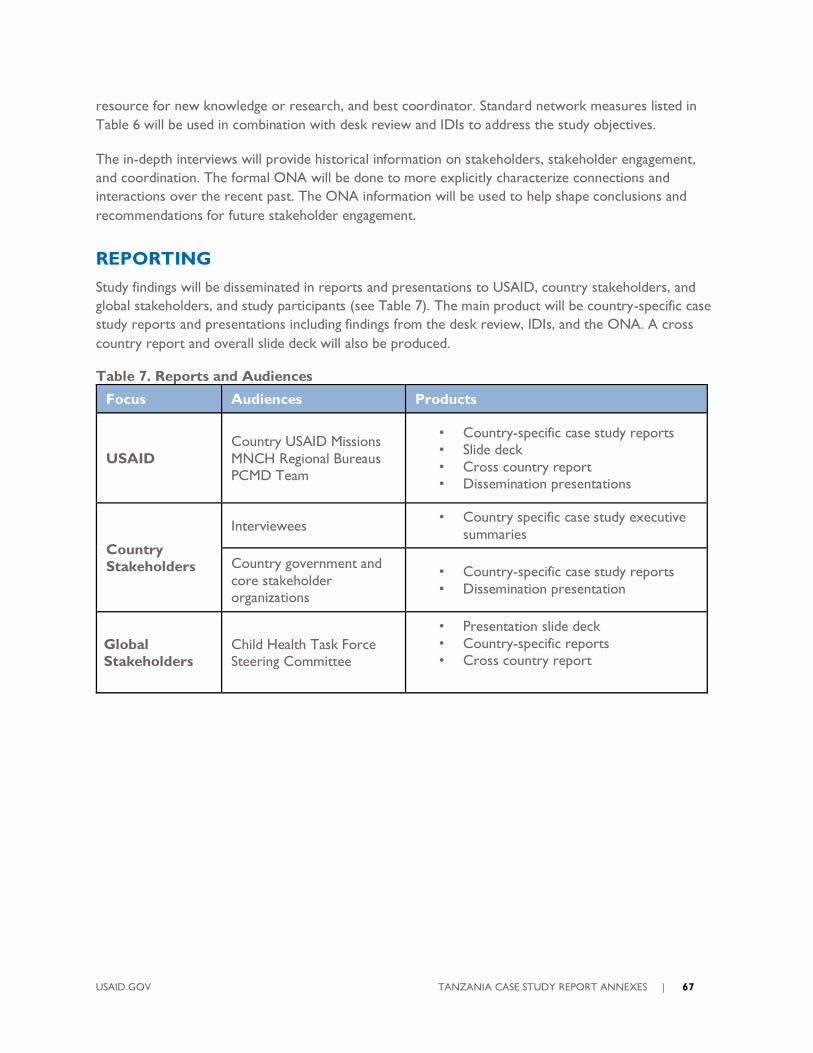
USAID.GOV TANZANIA CASE STUDY REPORT ANNEXES | 67
resource for new knowledge or research, and best coordinator. Standard network measures listed in
Table 6 will be used in combination with desk review and IDIs to address the study objectives.
The in-depth interviews will provide historical information on stakeholders, stakeholder engagement,
and coordination. The formal ONA will be done to more explicitly characterize connections and
interactions over the recent past. The ONA information will be used to help shape conclusions and
recommendations for future stakeholder engagement.
REPORTING
Study findings will be disseminated in reports and presentations to USAID, country stakeholders, and
global stakeholders, and study participants (see Table 7). The main product will be country-specific case
study reports and presentations including findings from the desk review, IDIs, and the ONA. A cross
country report and overall slide deck will also be produced.
Table 7. Reports and Audiences
Focus Audiences Products
USAID
Country USAID Missions
MNCH Regional Bureaus
PCMD Team
• Country-specific case study reports
• Slide deck
• Cross country report
• Dissemination presentations
Country
Stakeholders
Interviewees • Country specific case study executive
summaries
Country government and
core stakeholder
organizations
• Country-specific case study reports
• Dissemination presentation
Global
Stakeholders
Child Health Task Force
Steering Committee
• Presentation slide deck
• Country-specific reports
• Cross country report
USAID.GOV TANZANIA CASE STUDY REPORT ANNEXES | 68
ANNEX C: INSTRUMENTS
Child Health Country Perspectives Study
In-depth Interview Guide Draft
Note: Adjust time period to reflect start year chosen for this country
Date:
Code Number of Respondent:
Main areas of expertise:
Interviewer:
BACKGROUND AND CONSENT
Thank you very much for setting aside time to talk with me today.
The USAID-funded CIRCLE Project is exploring progress on child health in this country by exploring the
effects of leadership, governance, and networks on programs and outcomes over the past 10-15 years.
You are being interviewed because you and your organization are important stakeholders in the child
health community. This is a confidential interview that will take about an hour. First, I would like to
review the consent form with you.
[Allow time for the respondent to read the informed consent form. Review the contents from all
sections of the informed consent form with the respondent. (See attached form). Ask if he/she
understands and agrees to continue. Ask him/her to sign the form, put it in the secure bag and provide
one copy to the respondent.]
To make sure I capture all your feedback, is it all right with you if I record this interview?
Before I begin, do you have any questions?
INTRODUCTION
We would like to understand your perspective of the major strategies and events that helped or
constrained achieving improved child health in [country]. For the purposes of this study, we would like
to focus on approximately the past 15 years (since ~2000) and on all children under five years, including
newborns.
1. In the past 15 years, how have you engaged in child health? (Probe: any areas of
specialization?)
a. Which organizations have you worked for during this time?
USAID.GOV TANZANIA CASE STUDY REPORT ANNEXES | 69
2. What do you think were the most important successes for child health here?
a. What were the biggest disappointments? (Probe: What were missed opportunities, if any?)
3. Were there any contextual changes that contributed to the success or failure of child
health outcomes here? If so, what were they? (Probe: economic, political, development policy
changes?)
EVENTS AND STRATEGIES
Instruction to interviewer: Ask questions 3 and 4 for child health generally, then tailoring the topics to this
respondent, ask 3 and 4 for specific examples (IMCI-iCCM, immunization, newborn health or nutrition-
complementary feeding). Ensure that present day is included.
4. Reflecting over the time period from 2000 to now, what were the major strategies and
events that advanced the child health agenda and helped achieve results?
5. What were the major barriers or bottlenecks that critically challenged progress?
6. Were there external global or regional initiatives or situations that enabled progress in
child health? If so, what were they? (Probe: EWEC, IMCI, PEI, PMI, HIV/Pepfar, SSA regional or AU
initiatives.)
7. Were there external situations that created barriers or bottlenecks that challenged
progress in child health? If so, what were they?
If the Call to Action, APR, and/or EPCMD were active in this country, ask the following question.
8. What did the Call to Action, APR, and/or EPCMD do in this country?
a. How did [each] influence progress? (Probe: enabling and inhibiting)
b. How would progress have been different if [each] had not been implemented
here?
LEADERS AND STAKEHOLDERS
9. Who were important leaders (people in this country) that advanced the child health
agenda? (Probe: nationals and where they sat)
a. What did [leader] do that was important?
10. Were there any leaders outside the country that had an important effect here? If so,
who were they and what did they do? (Probe SSA and neighboring countries)
11. Who were leading organizations in earlier years in child health?
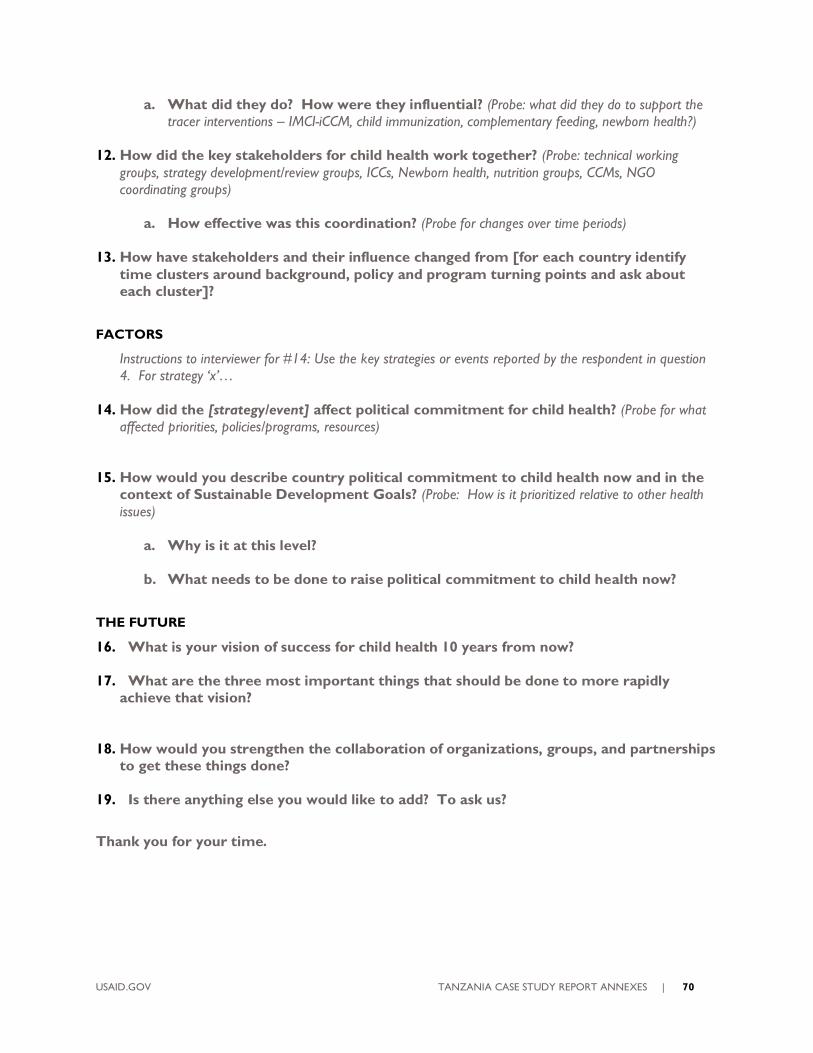
USAID.GOV TANZANIA CASE STUDY REPORT ANNEXES | 70
a. What did they do? How were they influential? (Probe: what did they do to support the
tracer interventions – IMCI-iCCM, child immunization, complementary feeding, newborn health?)
12. How did the key stakeholders for child health work together? (Probe: technical working
groups, strategy development/review groups, ICCs, Newborn health, nutrition groups, CCMs, NGO
coordinating groups)
a. How effective was this coordination? (Probe for changes over time periods)
13. How have stakeholders and their influence changed from [for each country identify
time clusters around background, policy and program turning points and ask about
each cluster]?
FACTORS
Instructions to interviewer for #14: Use the key strategies or events reported by the respondent in question
4. For strategy ‘x’…
14. How did the [strategy/event] affect political commitment for child health? (Probe for what
affected priorities, policies/programs, resources)
15. How would you describe country political commitment to child health now and in the
context of Sustainable Development Goals? (Probe: How is it prioritized relative to other health
issues)
a. Why is it at this level?
b. What needs to be done to raise political commitment to child health now?
THE FUTURE
16. What is your vision of success for child health 10 years from now?
17. What are the three most important things that should be done to more rapidly
achieve that vision?
18. How would you strengthen the collaboration of organizations, groups, and partnerships
to get these things done?
19. Is there anything else you would like to add? To ask us?
Thank you for your time.
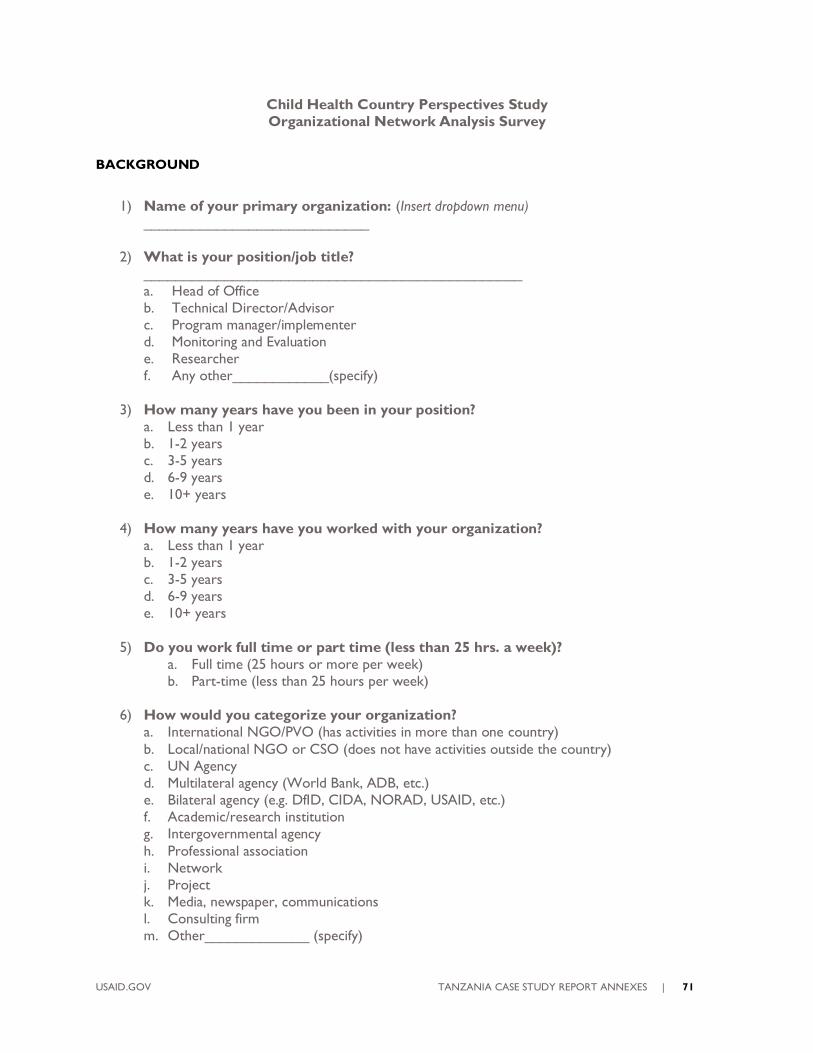
USAID.GOV TANZANIA CASE STUDY REPORT ANNEXES | 71
Child Health Country Perspectives Study
Organizational Network Analysis Survey
BACKGROUND
1) Name of your primary organization: (Insert dropdown menu)
____________________________
2) What is your position/job title?
_______________________________________________
a. Head of Office
b. Technical Director/Advisor
c. Program manager/implementer
d. Monitoring and Evaluation
e. Researcher
f. Any other____________(specify)
3) How many years have you been in your position?
a. Less than 1 year
b. 1-2 years
c. 3-5 years
d. 6-9 years
e. 10+ years
4) How many years have you worked with your organization?
a. Less than 1 year
b. 1-2 years
c. 3-5 years
d. 6-9 years
e. 10+ years
5) Do you work full time or part time (less than 25 hrs. a week)?
a. Full time (25 hours or more per week)
b. Part-time (less than 25 hours per week)
6) How would you categorize your organization?
a. International NGO/PVO (has activities in more than one country)
b. Local/national NGO or CSO (does not have activities outside the country)
c. UN Agency
d. Multilateral agency (World Bank, ADB, etc.)
e. Bilateral agency (e.g. DfID, CIDA, NORAD, USAID, etc.)
f. Academic/research institution
g. Intergovernmental agency
h. Professional association
i. Network
j. Project
k. Media, newspaper, communications
l. Consulting firm
m. Other_____________ (specify)
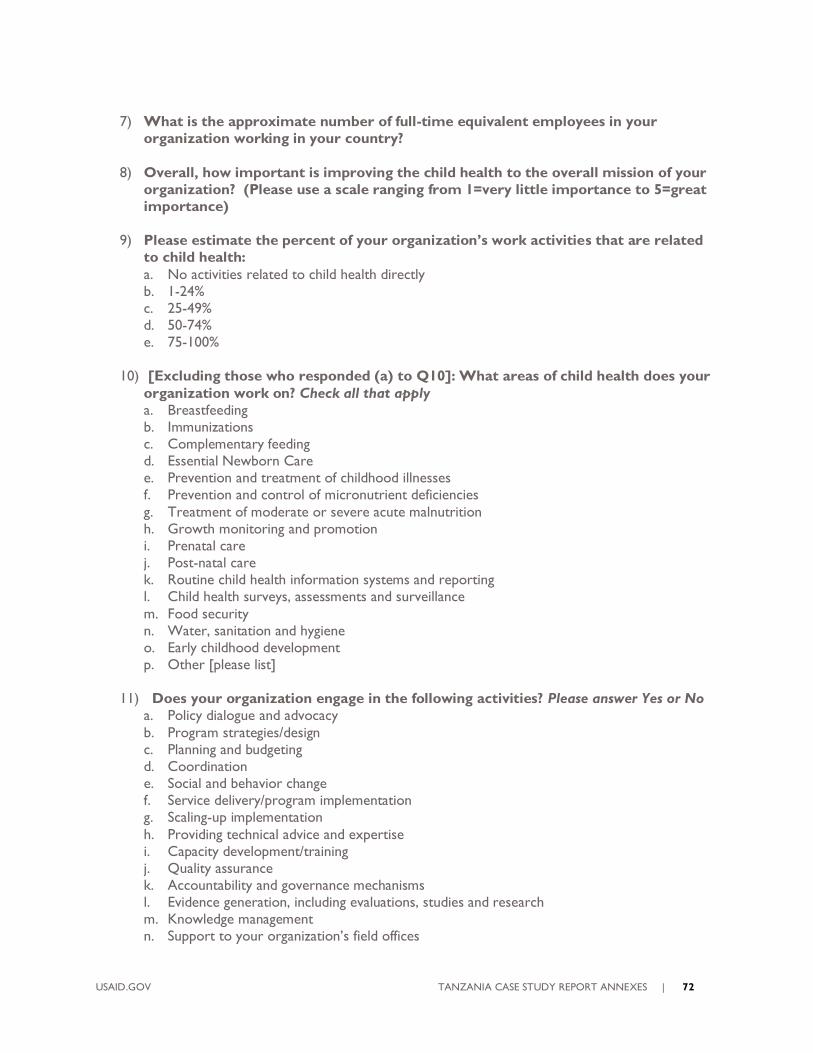
USAID.GOV TANZANIA CASE STUDY REPORT ANNEXES | 72
7) What is the approximate number of full-time equivalent employees in your
organization working in your country?
8) Overall, how important is improving the child health to the overall mission of your
organization? (Please use a scale ranging from 1=very little importance to 5=great
importance)
9) Please estimate the percent of your organization’s work activities that are related
to child health:
a. No activities related to child health directly
b. 1-24%
c. 25-49%
d. 50-74%
e. 75-100%
10) [Excluding those who responded (a) to Q10]: What areas of child health does your
organization work on? Check all that apply
a. Breastfeeding
b. Immunizations
c. Complementary feeding
d. Essential Newborn Care
e. Prevention and treatment of childhood illnesses
f. Prevention and control of micronutrient deficiencies
g. Treatment of moderate or severe acute malnutrition
h. Growth monitoring and promotion
i. Prenatal care
j. Post-natal care
k. Routine child health information systems and reporting
l. Child health surveys, assessments and surveillance
m. Food security
n. Water, sanitation and hygiene
o. Early childhood development
p. Other [please list]
11) Does your organization engage in the following activities? Please answer Yes or No
a. Policy dialogue and advocacy
b. Program strategies/design
c. Planning and budgeting
d. Coordination
e. Social and behavior change
f. Service delivery/program implementation
g. Scaling-up implementation
h. Providing technical advice and expertise
i. Capacity development/training
j. Quality assurance
k. Accountability and governance mechanisms
l. Evidence generation, including evaluations, studies and research
m. Knowledge management
n. Support to your organization’s field offices
USAID.GOV TANZANIA CASE STUDY REPORT ANNEXES | 73
o. Other activity (child health related) please specify
12) Are there other organizations that you also currently work for or represent?
a. Yes
b. No
13a. If yes, what are they? (List up to 2 responses)
1) _______________________
2) _______________________
USAID.GOV TANZANIA CASE STUDY REPORT ANNEXES | 74
ORGANIZATIONAL NETWORK ANALYSIS
In this section, we would like to know about the relationships you have had in the recent past with
organizations. The organizations are presented along with a series of questions about different aspects
of your how you are connected.
First, we would like to know whether your organization has a relationship with another named
organization or agency in Column 2. If there is no relationship or if it’s your own organization,
then you can skip to the next row and do not answer any further questions in columns 3-9 for
that organization. At the end, please enter up to five additional organizations with whom you interact
and the types of linkages you have with them, if it’s applicable.
Columns 3 relates to frequency of contact for any reason since 2015, the end of the MDG era with
the named organization.
Columns 4-7 relate to the types of activities that you may have worked on with each organization
since 2015, the end of the MDG period.
Column 8 refers to the highest level of intensity of interaction with an organization.
The options are: 1=Communication (interaction as necessary to inform others or to check on specific
issues), 2=Coordination (moderate-intensity interaction to share new ideas, ensure that
duplication/overlap is minimized, etc.), 3=Collaboration (a close, on-going, reciprocal, working
relationship); Only one option can be selected that reflects the highest level of connectivity.
Column 9 asks you to identify the overall quality of the relationship with a particular organization. (The
choices are: 1= Poor; 2=Fair; 3= Good; 4=Very Good or Excellent)
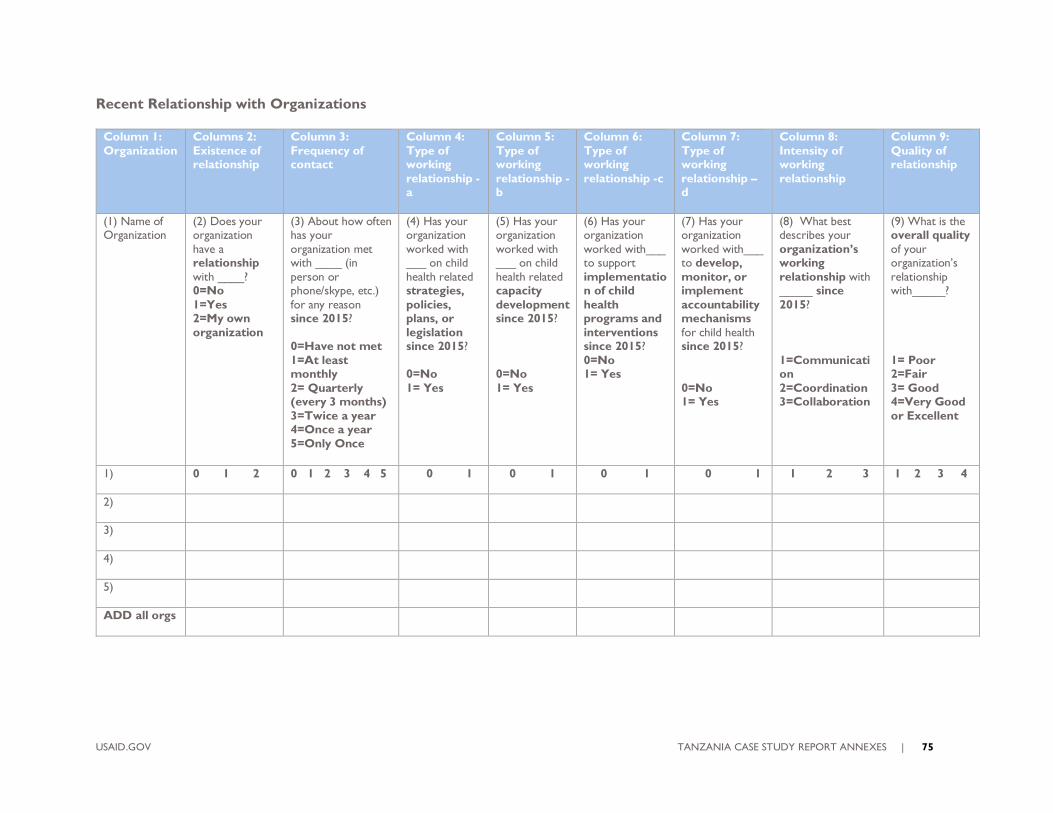
USAID.GOV TANZANIA CASE STUDY REPORT ANNEXES | 75
Recent Relationship with Organizations
Column 1:
Organization
Columns 2:
Existence of relationship
Column 3:
Frequency of contact
Column 4:
Type of working
relationship -a
Column 5:
Type of working
relationship -b
Column 6:
Type of working
relationship -c
Column 7:
Type of working
relationship – d
Column 8:
Intensity of working
relationship
Column 9:
Quality of relationship
(1) Name of Organization
(2) Does your organization
have a relationship
with ____? 0=No
1=Yes 2=My own
organization
(3) About how often has your
organization met with ____ (in
person or phone/skype, etc.)
for any reason since 2015?
0=Have not met
1=At least monthly
2= Quarterly (every 3 months)
3=Twice a year 4=Once a year
5=Only Once
(4) Has your organization
worked with ___ on child
health related strategies,
policies, plans, or
legislation since 2015?
0=No
1= Yes
(5) Has your organization
worked with ___ on child
health related capacity
development since 2015?
0=No
1= Yes
(6) Has your organization
worked with___ to support
implementation of child
health programs and
interventions since 2015?
0=No 1= Yes
(7) Has your organization
worked with___ to develop,
monitor, or implement
accountability mechanisms
for child health since 2015?
0=No 1= Yes
(8) What best describes your
organization’s working
relationship with _____ since
2015?
1=Communication
2=Coordination 3=Collaboration
(9) What is the overall quality
of your organization’s
relationship with_____?
1= Poor 2=Fair
3= Good 4=Very Good
or Excellent
1) 0 1 2 0 1 2 3 4 5 0 1 0 1 0 1 0 1 1 2 3 1 2 3 4
2)
3)
4)
5)
ADD all orgs
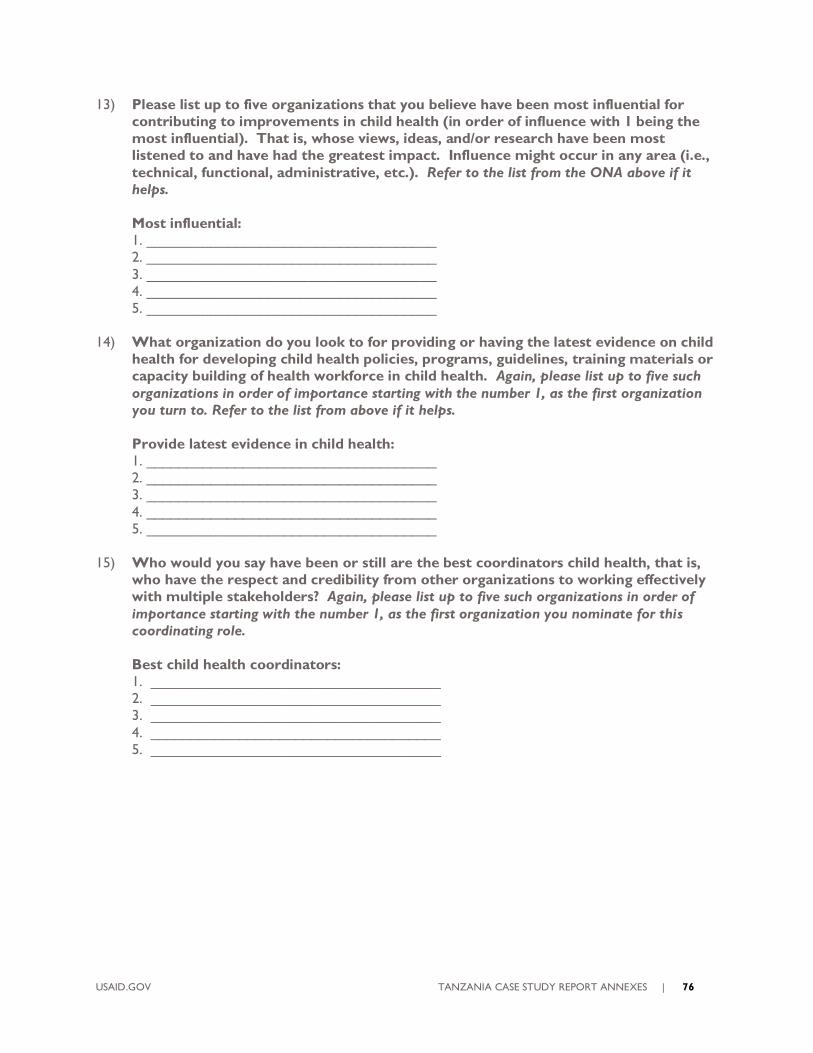
USAID.GOV TANZANIA CASE STUDY REPORT ANNEXES | 76
13) Please list up to five organizations that you believe have been most influential for
contributing to improvements in child health (in order of influence with 1 being the
most influential). That is, whose views, ideas, and/or research have been most
listened to and have had the greatest impact. Influence might occur in any area (i.e.,
technical, functional, administrative, etc.). Refer to the list from the ONA above if it
helps.
Most influential:
1. ____________________________________
2. ____________________________________
3. ____________________________________
4. ____________________________________
5. ____________________________________
14) What organization do you look to for providing or having the latest evidence on child
health for developing child health policies, programs, guidelines, training materials or
capacity building of health workforce in child health. Again, please list up to five such
organizations in order of importance starting with the number 1, as the first organization
you turn to. Refer to the list from above if it helps.
Provide latest evidence in child health:
1. ____________________________________
2. ____________________________________
3. ____________________________________
4. ____________________________________
5. ____________________________________
15) Who would you say have been or still are the best coordinators child health, that is,
who have the respect and credibility from other organizations to working effectively
with multiple stakeholders? Again, please list up to five such organizations in order of
importance starting with the number 1, as the first organization you nominate for this
coordinating role.
Best child health coordinators:
1. ____________________________________
2. ____________________________________
3. ____________________________________
4. ____________________________________
5. ____________________________________
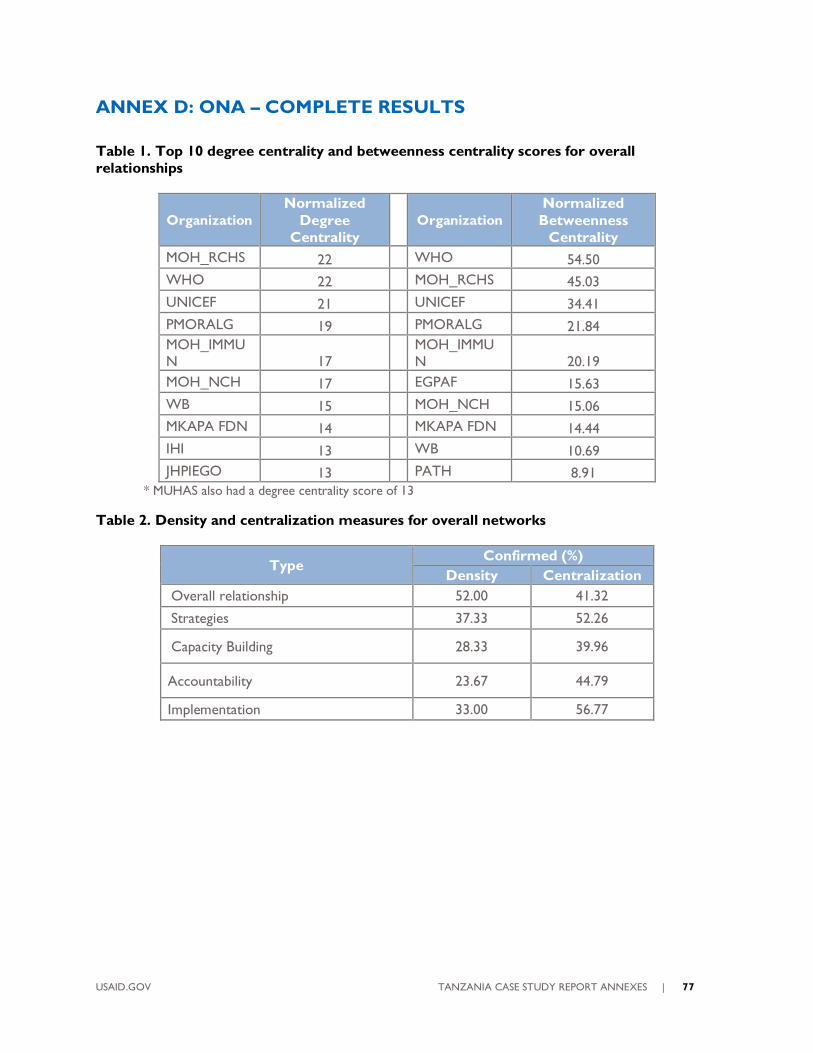
USAID.GOV TANZANIA CASE STUDY REPORT ANNEXES | 77
ANNEX D: ONA – COMPLETE RESULTS
Table 1. Top 10 degree centrality and betweenness centrality scores for overall
relationships
Organization
Normalized
Degree
Centrality
Organization
Normalized
Betweenness
Centrality
MOH_RCHS 22 WHO 54.50
WHO 22 MOH_RCHS 45.03
UNICEF 21 UNICEF 34.41
PMORALG 19 PMORALG 21.84
MOH_IMMU
N 17
MOH_IMMU
N 20.19
MOH_NCH 17 EGPAF 15.63
WB 15 MOH_NCH 15.06
MKAPA FDN 14 MKAPA FDN 14.44
IHI 13 WB 10.69
JHPIEGO 13 PATH 8.91
* MUHAS also had a degree centrality score of 13
Table 2. Density and centralization measures for overall networks
Type Confirmed (%)
Density Centralization
Overall relationship 52.00 41.32
Strategies 37.33 52.26
Capacity Building 28.33 39.96
Accountability 23.67 44.79
Implementation 33.00 56.77
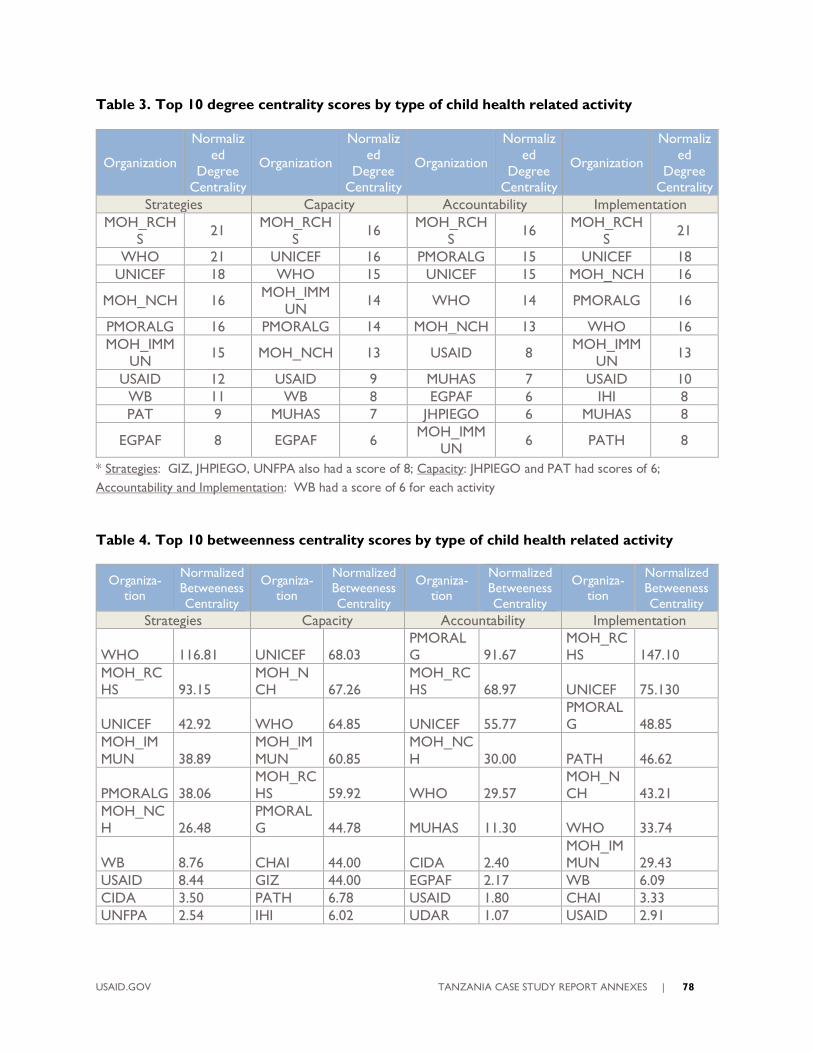
USAID.GOV TANZANIA CASE STUDY REPORT ANNEXES | 78
Table 3. Top 10 degree centrality scores by type of child health related activity
Organization
Normaliz
ed
Degree Centrality
Organization
Normaliz
ed
Degree Centrality
Organization
Normaliz
ed
Degree Centrality
Organization
Normaliz
ed
Degree Centrality
Strategies Capacity Accountability Implementation
MOH_RCH
S 21
MOH_RCH
S 16
MOH_RCH
S 16
MOH_RCH
S 21
WHO 21 UNICEF 16 PMORALG 15 UNICEF 18
UNICEF 18 WHO 15 UNICEF 15 MOH_NCH 16
MOH_NCH 16 MOH_IMM
UN 14 WHO 14 PMORALG 16
PMORALG 16 PMORALG 14 MOH_NCH 13 WHO 16
MOH_IMM
UN 15 MOH_NCH 13 USAID 8
MOH_IMM
UN 13
USAID 12 USAID 9 MUHAS 7 USAID 10
WB 11 WB 8 EGPAF 6 IHI 8
PAT 9 MUHAS 7 JHPIEGO 6 MUHAS 8
EGPAF 8 EGPAF 6 MOH_IMM
UN 6 PATH 8
* Strategies: GIZ, JHPIEGO, UNFPA also had a score of 8; Capacity: JHPIEGO and PAT had scores of 6;
Accountability and Implementation: WB had a score of 6 for each activity
Table 4. Top 10 betweenness centrality scores by type of child health related activity
Organiza-tion
Normalized Betweeness
Centrality
Organiza-tion
Normalized Betweeness
Centrality
Organiza-tion
Normalized Betweeness
Centrality
Organiza-tion
Normalized Betweeness
Centrality
Strategies Capacity Accountability Implementation
WHO 116.81 UNICEF 68.03
PMORAL
G 91.67
MOH_RC
HS 147.10
MOH_RC
HS 93.15
MOH_N
CH 67.26
MOH_RC
HS 68.97 UNICEF 75.130
UNICEF 42.92 WHO 64.85 UNICEF 55.77
PMORAL
G 48.85
MOH_IM
MUN 38.89
MOH_IM
MUN 60.85
MOH_NC
H 30.00 PATH 46.62
PMORALG 38.06
MOH_RC
HS 59.92 WHO 29.57
MOH_N
CH 43.21
MOH_NC
H 26.48
PMORAL
G 44.78 MUHAS 11.30 WHO 33.74
WB 8.76 CHAI 44.00 CIDA 2.40
MOH_IM
MUN 29.43
USAID 8.44 GIZ 44.00 EGPAF 2.17 WB 6.09
CIDA 3.50 PATH 6.78 USAID 1.80 CHAI 3.33
UNFPA 2.54 IHI 6.02 UDAR 1.07 USAID 2.91
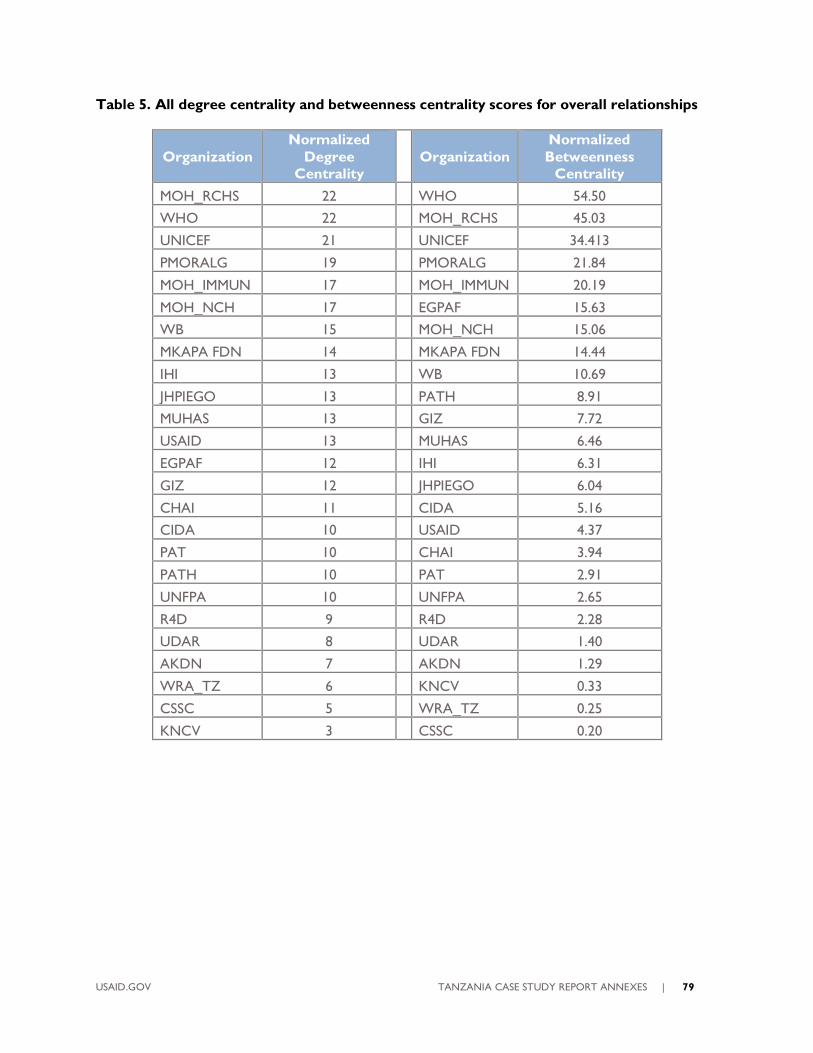
USAID.GOV TANZANIA CASE STUDY REPORT ANNEXES | 79
Table 5. All degree centrality and betweenness centrality scores for overall relationships
Organization
Normalized
Degree
Centrality
Organization
Normalized
Betweenness
Centrality
MOH_RCHS 22 WHO 54.50
WHO 22 MOH_RCHS 45.03
UNICEF 21 UNICEF 34.413
PMORALG 19 PMORALG 21.84
MOH_IMMUN 17 MOH_IMMUN 20.19
MOH_NCH 17 EGPAF 15.63
WB 15 MOH_NCH 15.06
MKAPA FDN 14 MKAPA FDN 14.44
IHI 13 WB 10.69
JHPIEGO 13 PATH 8.91
MUHAS 13 GIZ 7.72
USAID 13 MUHAS 6.46
EGPAF 12 IHI 6.31
GIZ 12 JHPIEGO 6.04
CHAI 11 CIDA 5.16
CIDA 10 USAID 4.37
PAT 10 CHAI 3.94
PATH 10 PAT 2.91
UNFPA 10 UNFPA 2.65
R4D 9 R4D 2.28
UDAR 8 UDAR 1.40
AKDN 7 AKDN 1.29
WRA_TZ 6 KNCV 0.33
CSSC 5 WRA_TZ 0.25
KNCV 3 CSSC 0.20
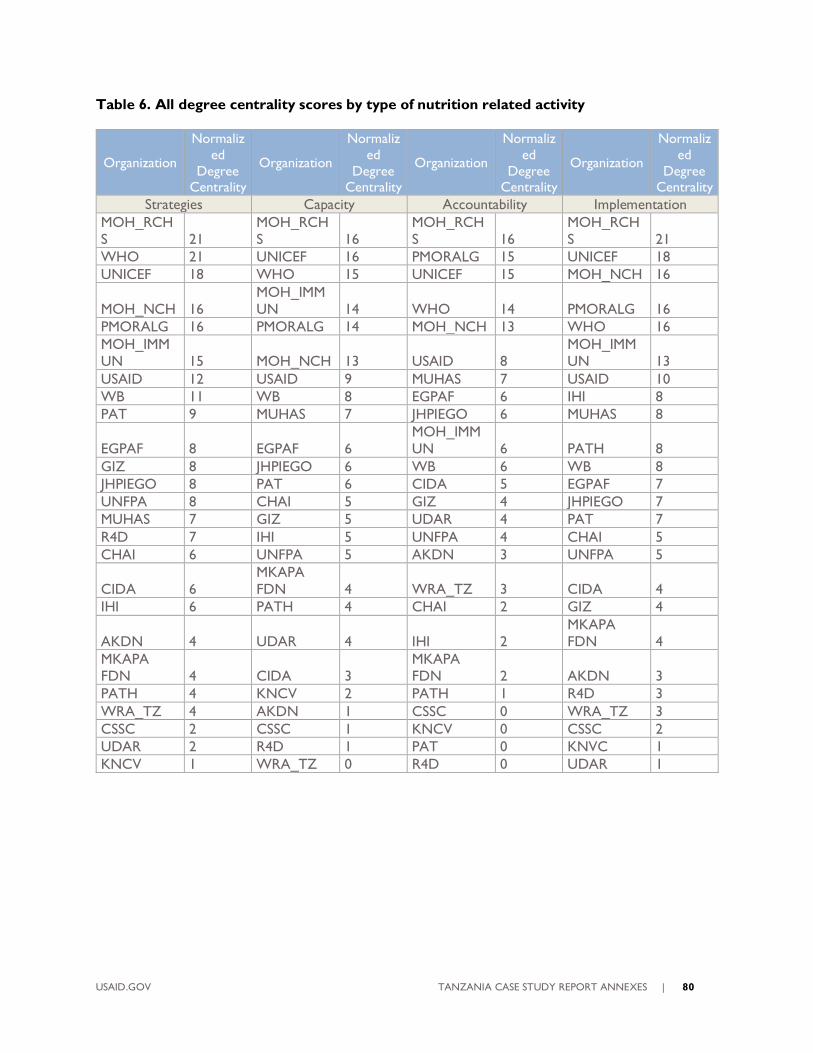
USAID.GOV TANZANIA CASE STUDY REPORT ANNEXES | 80
Table 6. All degree centrality scores by type of nutrition related activity
Organization
Normaliz
ed
Degree Centrality
Organization
Normaliz
ed
Degree Centrality
Organization
Normaliz
ed
Degree Centrality
Organization
Normaliz
ed
Degree Centrality
Strategies Capacity Accountability Implementation
MOH_RCH
S 21
MOH_RCH
S 16
MOH_RCH
S 16
MOH_RCH
S 21
WHO 21 UNICEF 16 PMORALG 15 UNICEF 18
UNICEF 18 WHO 15 UNICEF 15 MOH_NCH 16
MOH_NCH 16
MOH_IMM
UN 14 WHO 14 PMORALG 16
PMORALG 16 PMORALG 14 MOH_NCH 13 WHO 16
MOH_IMM
UN 15 MOH_NCH 13 USAID 8
MOH_IMM
UN 13
USAID 12 USAID 9 MUHAS 7 USAID 10
WB 11 WB 8 EGPAF 6 IHI 8
PAT 9 MUHAS 7 JHPIEGO 6 MUHAS 8
EGPAF 8 EGPAF 6
MOH_IMM
UN 6 PATH 8
GIZ 8 JHPIEGO 6 WB 6 WB 8
JHPIEGO 8 PAT 6 CIDA 5 EGPAF 7
UNFPA 8 CHAI 5 GIZ 4 JHPIEGO 7
MUHAS 7 GIZ 5 UDAR 4 PAT 7
R4D 7 IHI 5 UNFPA 4 CHAI 5
CHAI 6 UNFPA 5 AKDN 3 UNFPA 5
CIDA 6
MKAPA
FDN 4 WRA_TZ 3 CIDA 4
IHI 6 PATH 4 CHAI 2 GIZ 4
AKDN 4 UDAR 4 IHI 2
MKAPA
FDN 4
MKAPA
FDN 4 CIDA 3
MKAPA
FDN 2 AKDN 3
PATH 4 KNCV 2 PATH 1 R4D 3
WRA_TZ 4 AKDN 1 CSSC 0 WRA_TZ 3
CSSC 2 CSSC 1 KNCV 0 CSSC 2
UDAR 2 R4D 1 PAT 0 KNVC 1
KNCV 1 WRA_TZ 0 R4D 0 UDAR 1
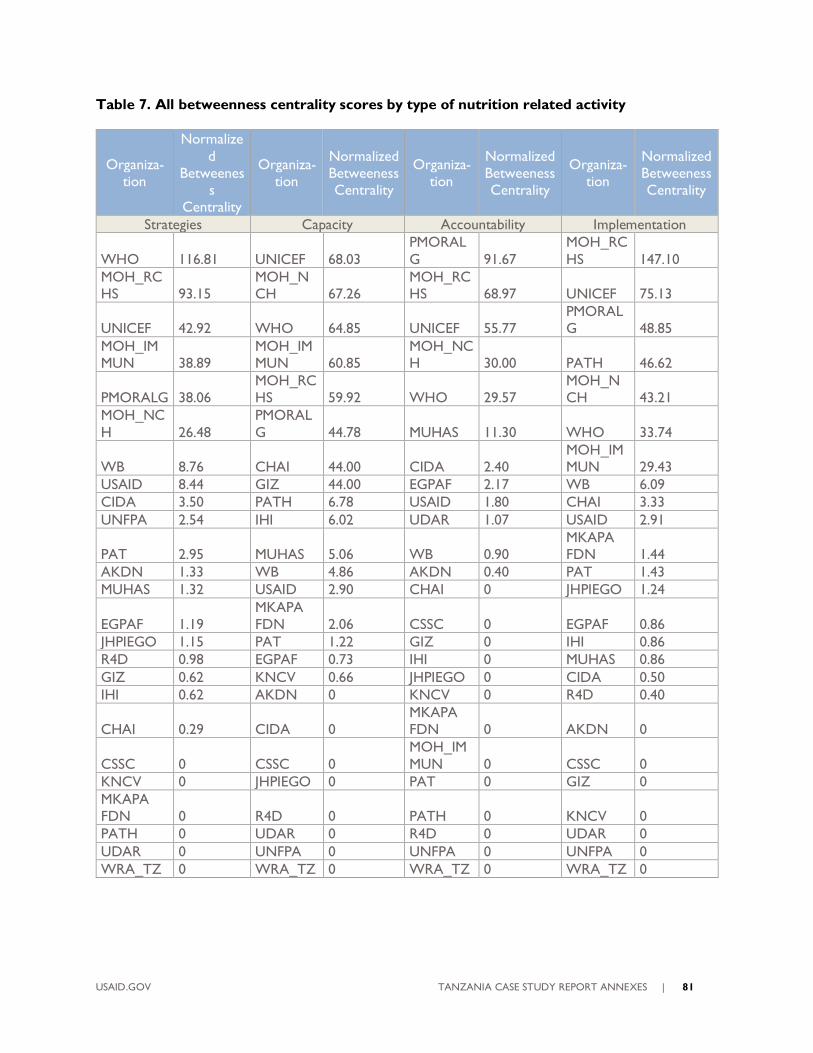
USAID.GOV TANZANIA CASE STUDY REPORT ANNEXES | 81
Table 7. All betweenness centrality scores by type of nutrition related activity
Organiza-
tion
Normalize
d
Betweenes
s
Centrality
Organiza-
tion
Normalized
Betweeness
Centrality
Organiza-
tion
Normalized
Betweeness
Centrality
Organiza-
tion
Normalized
Betweeness
Centrality
Strategies Capacity Accountability Implementation
WHO 116.81 UNICEF 68.03
PMORAL
G 91.67
MOH_RC
HS 147.10
MOH_RC
HS 93.15
MOH_N
CH 67.26
MOH_RC
HS 68.97 UNICEF 75.13
UNICEF 42.92 WHO 64.85 UNICEF 55.77
PMORAL
G 48.85
MOH_IM
MUN 38.89
MOH_IM
MUN 60.85
MOH_NC
H 30.00 PATH 46.62
PMORALG 38.06
MOH_RC
HS 59.92 WHO 29.57
MOH_N
CH 43.21
MOH_NC
H 26.48
PMORAL
G 44.78 MUHAS 11.30 WHO 33.74
WB 8.76 CHAI 44.00 CIDA 2.40
MOH_IM
MUN 29.43
USAID 8.44 GIZ 44.00 EGPAF 2.17 WB 6.09
CIDA 3.50 PATH 6.78 USAID 1.80 CHAI 3.33
UNFPA 2.54 IHI 6.02 UDAR 1.07 USAID 2.91
PAT 2.95 MUHAS 5.06 WB 0.90
MKAPA
FDN 1.44
AKDN 1.33 WB 4.86 AKDN 0.40 PAT 1.43
MUHAS 1.32 USAID 2.90 CHAI 0 JHPIEGO 1.24
EGPAF 1.19
MKAPA
FDN 2.06 CSSC 0 EGPAF 0.86
JHPIEGO 1.15 PAT 1.22 GIZ 0 IHI 0.86
R4D 0.98 EGPAF 0.73 IHI 0 MUHAS 0.86
GIZ 0.62 KNCV 0.66 JHPIEGO 0 CIDA 0.50
IHI 0.62 AKDN 0 KNCV 0 R4D 0.40
CHAI 0.29 CIDA 0
MKAPA
FDN 0 AKDN 0
CSSC 0 CSSC 0
MOH_IM
MUN 0 CSSC 0
KNCV 0 JHPIEGO 0 PAT 0 GIZ 0
MKAPA
FDN 0 R4D 0 PATH 0 KNCV 0
PATH 0 UDAR 0 R4D 0 UDAR 0
UDAR 0 UNFPA 0 UNFPA 0 UNFPA 0
WRA_TZ 0 WRA_TZ 0 WRA_TZ 0 WRA_TZ 0

USAID.GOV TANZANIA CASE STUDY REPORT ANNEXES | 82
Table A. Background characteristics
Yrs in the Position n (%)
1-2 years 9 (36.0)
3-5 years 6 (24.0)
10+ years 5 (20.0)
6-9 years 5 (20.0)
Yrs working with the organization n (%)
10+ years 11 (44.0)
6-9 years 6 (24.0)
1-2 years 4 (16.0)
3-5 years 4 (16.0)
Percent of work activities related to child health n (%)
1-24% 7 (28.0)
25-49% 7 (28.0)
75-100% 7 (28.0)
50-74% 4 (16.0)
Number of full-time equivalent employees
N 25
Median (IQR) 37.0 (53.0)
Min, Max 0, 700
Mode 1
Importance grading of improving child health
N 25
Median (IQR) 5.0 (0.0)
Min, Max 2, 5
Mode 5
Other organizations that you also currently work for or represent
No 18 (72.0)
Yes 7 (28.0)
Table B. Areas of child health
Areas of child health n (%)*
Child health surveys, assessments and surveillance 19 (76.0)
Post-natal care 19 (76.0)
Essential Newborn Care 18 (72.0)
Food security 18 (72.0)
Immunizations 18 (72.0)
Prenatal care 18 (72.0)
Prevention and treatment of childhood illnesses 18 (72.0)
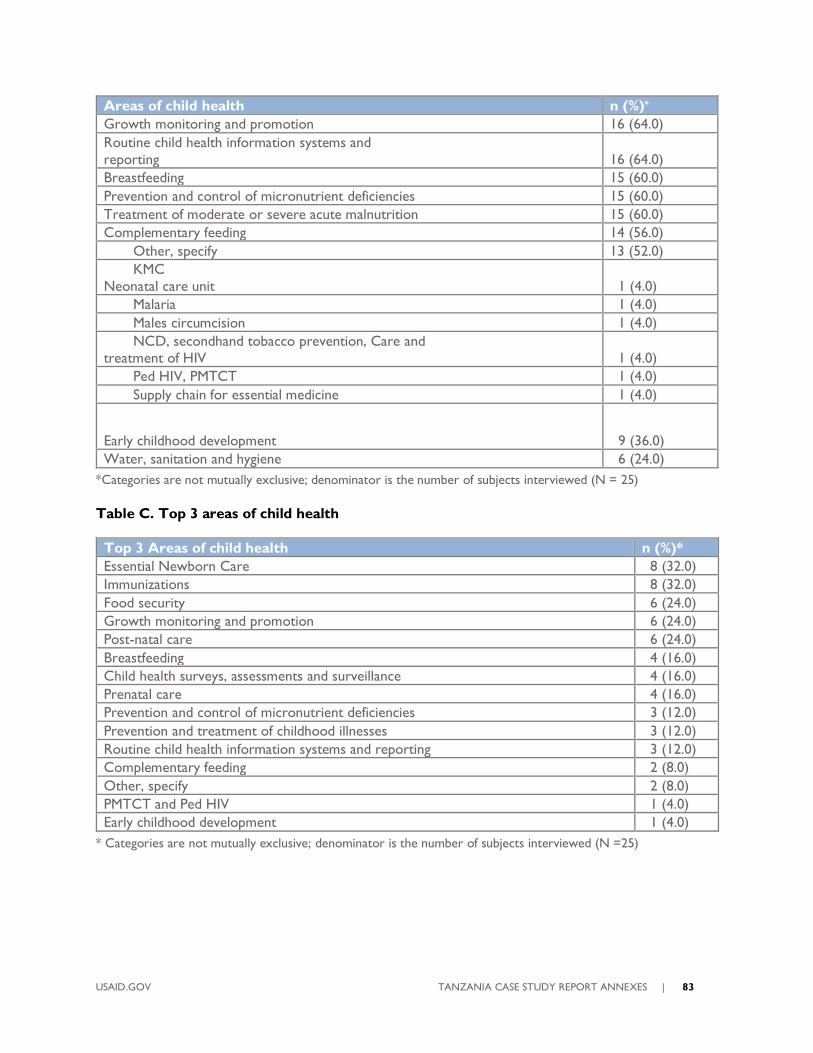
USAID.GOV TANZANIA CASE STUDY REPORT ANNEXES | 83
Areas of child health n (%)*
Growth monitoring and promotion 16 (64.0)
Routine child health information systems and
reporting 16 (64.0)
Breastfeeding 15 (60.0)
Prevention and control of micronutrient deficiencies 15 (60.0)
Treatment of moderate or severe acute malnutrition 15 (60.0)
Complementary feeding 14 (56.0)
Other, specify 13 (52.0)
KMC
Neonatal care unit 1 (4.0)
Malaria 1 (4.0)
Males circumcision 1 (4.0)
NCD, secondhand tobacco prevention, Care and
treatment of HIV 1 (4.0)
Ped HIV, PMTCT 1 (4.0)
Supply chain for essential medicine 1 (4.0)
Early childhood development 9 (36.0)
Water, sanitation and hygiene 6 (24.0)
*Categories are not mutually exclusive; denominator is the number of subjects interviewed (N = 25)
Table C. Top 3 areas of child health
Top 3 Areas of child health n (%)*
Essential Newborn Care 8 (32.0)
Immunizations 8 (32.0)
Food security 6 (24.0)
Growth monitoring and promotion 6 (24.0)
Post-natal care 6 (24.0)
Breastfeeding 4 (16.0)
Child health surveys, assessments and surveillance 4 (16.0)
Prenatal care 4 (16.0)
Prevention and control of micronutrient deficiencies 3 (12.0)
Prevention and treatment of childhood illnesses 3 (12.0)
Routine child health information systems and reporting 3 (12.0)
Complementary feeding 2 (8.0)
Other, specify 2 (8.0)
PMTCT and Ped HIV 1 (4.0)
Early childhood development 1 (4.0)
* Categories are not mutually exclusive; denominator is the number of subjects interviewed (N =25)
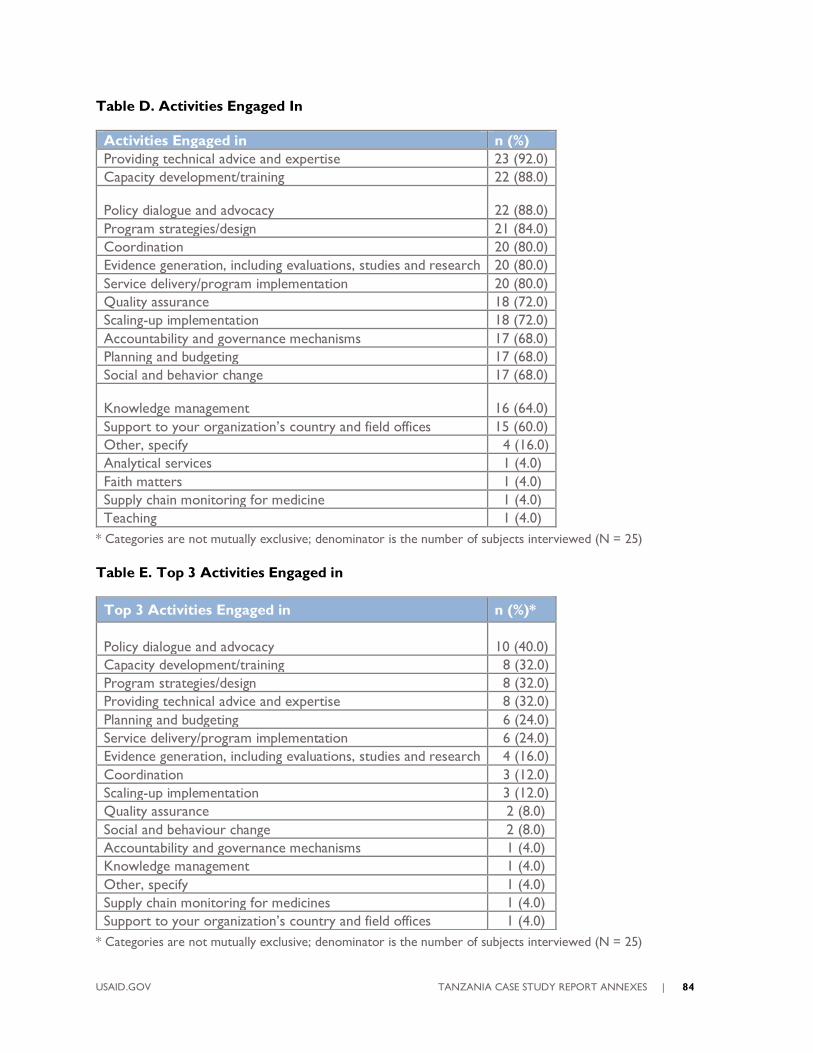
USAID.GOV TANZANIA CASE STUDY REPORT ANNEXES | 84
Table D. Activities Engaged In
Activities Engaged in n (%)
Providing technical advice and expertise 23 (92.0)
Capacity development/training 22 (88.0)
Policy dialogue and advocacy 22 (88.0)
Program strategies/design 21 (84.0)
Coordination 20 (80.0)
Evidence generation, including evaluations, studies and research 20 (80.0)
Service delivery/program implementation 20 (80.0)
Quality assurance 18 (72.0)
Scaling-up implementation 18 (72.0)
Accountability and governance mechanisms 17 (68.0)
Planning and budgeting 17 (68.0)
Social and behavior change 17 (68.0)
Knowledge management 16 (64.0)
Support to your organization’s country and field offices 15 (60.0)
Other, specify 4 (16.0)
Analytical services 1 (4.0)
Faith matters 1 (4.0)
Supply chain monitoring for medicine 1 (4.0)
Teaching 1 (4.0)
* Categories are not mutually exclusive; denominator is the number of subjects interviewed (N = 25)
Table E. Top 3 Activities Engaged in
* Categories are not mutually exclusive; denominator is the number of subjects interviewed (N = 25)
Top 3 Activities Engaged in n (%)*
Policy dialogue and advocacy 10 (40.0)
Capacity development/training 8 (32.0)
Program strategies/design 8 (32.0)
Providing technical advice and expertise 8 (32.0)
Planning and budgeting 6 (24.0)
Service delivery/program implementation 6 (24.0)
Evidence generation, including evaluations, studies and research 4 (16.0)
Coordination 3 (12.0)
Scaling-up implementation 3 (12.0)
Quality assurance 2 (8.0)
Social and behaviour change 2 (8.0)
Accountability and governance mechanisms 1 (4.0)
Knowledge management 1 (4.0)
Other, specify 1 (4.0)
Supply chain monitoring for medicines 1 (4.0)
Support to your organization’s country and field offices 1 (4.0)
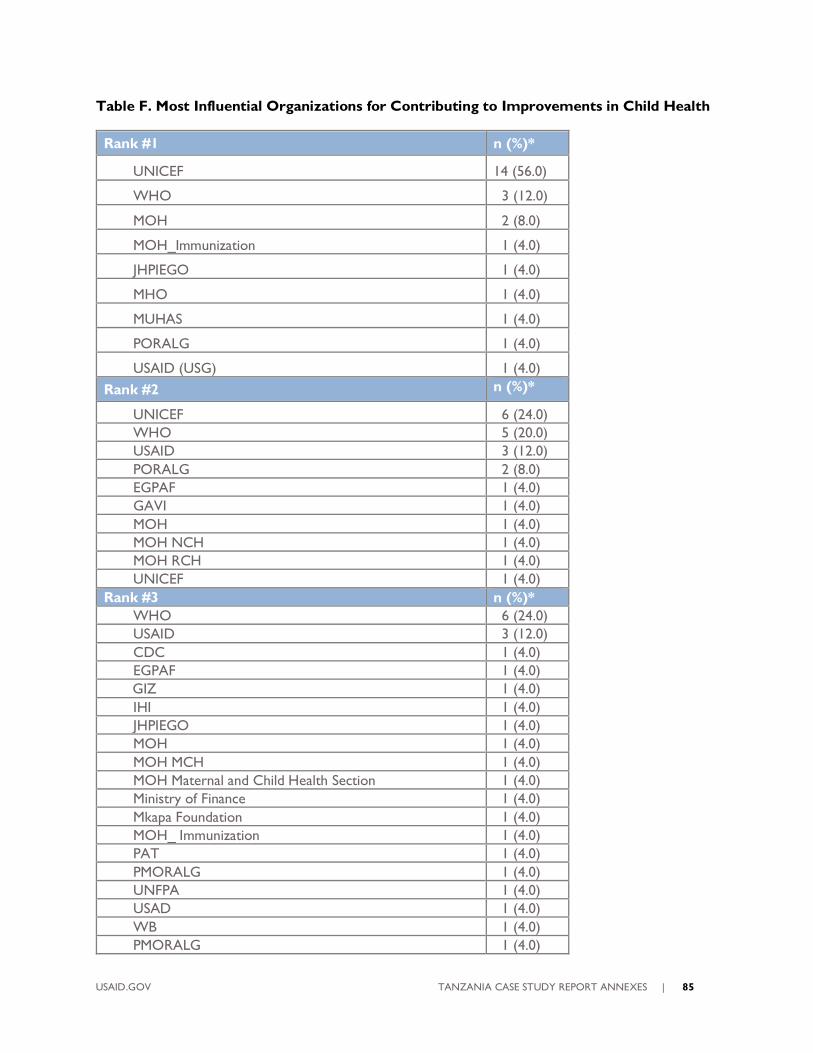
USAID.GOV TANZANIA CASE STUDY REPORT ANNEXES | 85
Table F. Most Influential Organizations for Contributing to Improvements in Child Health
Rank #1 n (%)*
UNICEF 14 (56.0)
WHO 3 (12.0)
MOH 2 (8.0)
MOH_Immunization 1 (4.0)
JHPIEGO 1 (4.0)
MHO 1 (4.0)
MUHAS 1 (4.0)
PORALG 1 (4.0)
USAID (USG) 1 (4.0)
Rank #2 n (%)*
UNICEF 6 (24.0)
WHO 5 (20.0)
USAID 3 (12.0)
PORALG 2 (8.0)
EGPAF 1 (4.0)
GAVI 1 (4.0)
MOH 1 (4.0)
MOH NCH 1 (4.0)
MOH RCH 1 (4.0)
UNICEF 1 (4.0)
Rank #3 n (%)*
WHO 6 (24.0)
USAID 3 (12.0)
CDC 1 (4.0)
EGPAF 1 (4.0)
GIZ 1 (4.0)
IHI 1 (4.0)
JHPIEGO 1 (4.0)
MOH 1 (4.0)
MOH MCH 1 (4.0)
MOH Maternal and Child Health Section 1 (4.0)
Ministry of Finance 1 (4.0)
Mkapa Foundation 1 (4.0)
MOH_ Immunization 1 (4.0)
PAT 1 (4.0)
PMORALG 1 (4.0)
UNFPA 1 (4.0)
USAD 1 (4.0)
WB 1 (4.0)
PMORALG 1 (4.0)
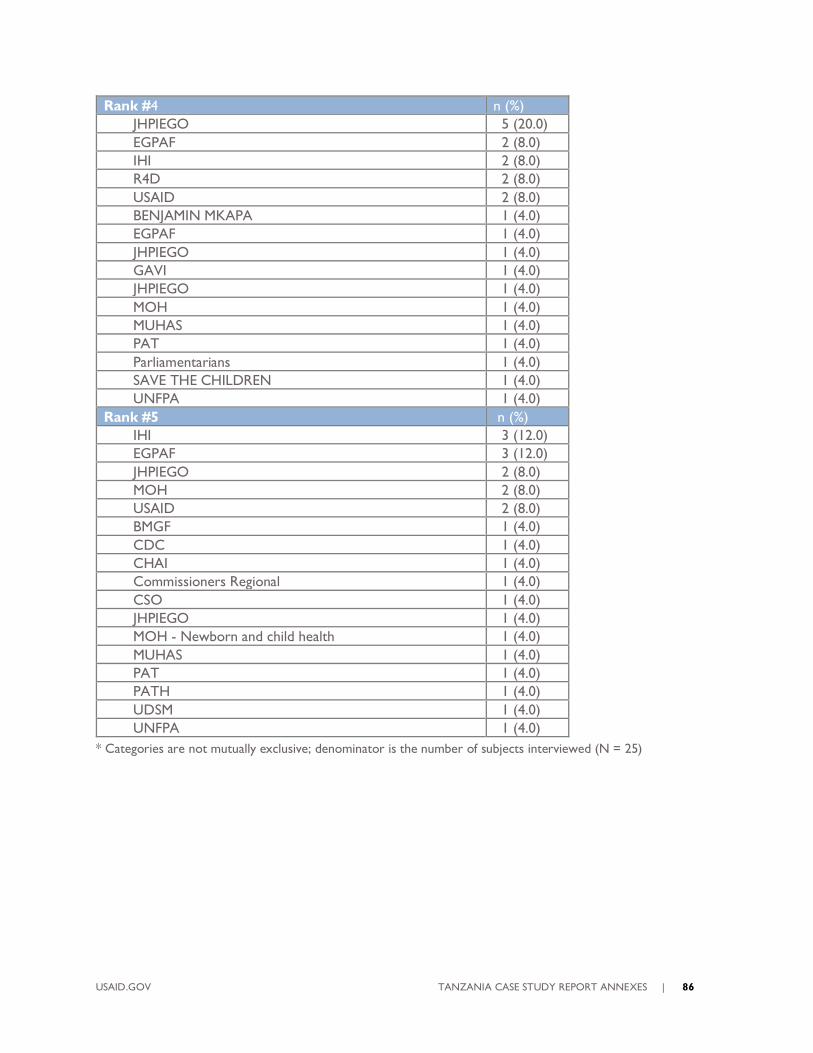
USAID.GOV TANZANIA CASE STUDY REPORT ANNEXES | 86
Rank #4 n (%)
JHPIEGO 5 (20.0)
EGPAF 2 (8.0)
IHI 2 (8.0)
R4D 2 (8.0)
USAID 2 (8.0)
BENJAMIN MKAPA 1 (4.0)
EGPAF 1 (4.0)
JHPIEGO 1 (4.0)
GAVI 1 (4.0)
JHPIEGO 1 (4.0)
MOH 1 (4.0)
MUHAS 1 (4.0)
PAT 1 (4.0)
Parliamentarians 1 (4.0)
SAVE THE CHILDREN 1 (4.0)
UNFPA 1 (4.0)
Rank #5 n (%)
IHI 3 (12.0)
EGPAF 3 (12.0)
JHPIEGO 2 (8.0)
MOH 2 (8.0)
USAID 2 (8.0)
BMGF 1 (4.0)
CDC 1 (4.0)
CHAI 1 (4.0)
Commissioners Regional 1 (4.0)
CSO 1 (4.0)
JHPIEGO 1 (4.0)
MOH - Newborn and child health 1 (4.0)
MUHAS 1 (4.0)
PAT 1 (4.0)
PATH 1 (4.0)
UDSM 1 (4.0)
UNFPA 1 (4.0)
* Categories are not mutually exclusive; denominator is the number of subjects interviewed (N = 25)
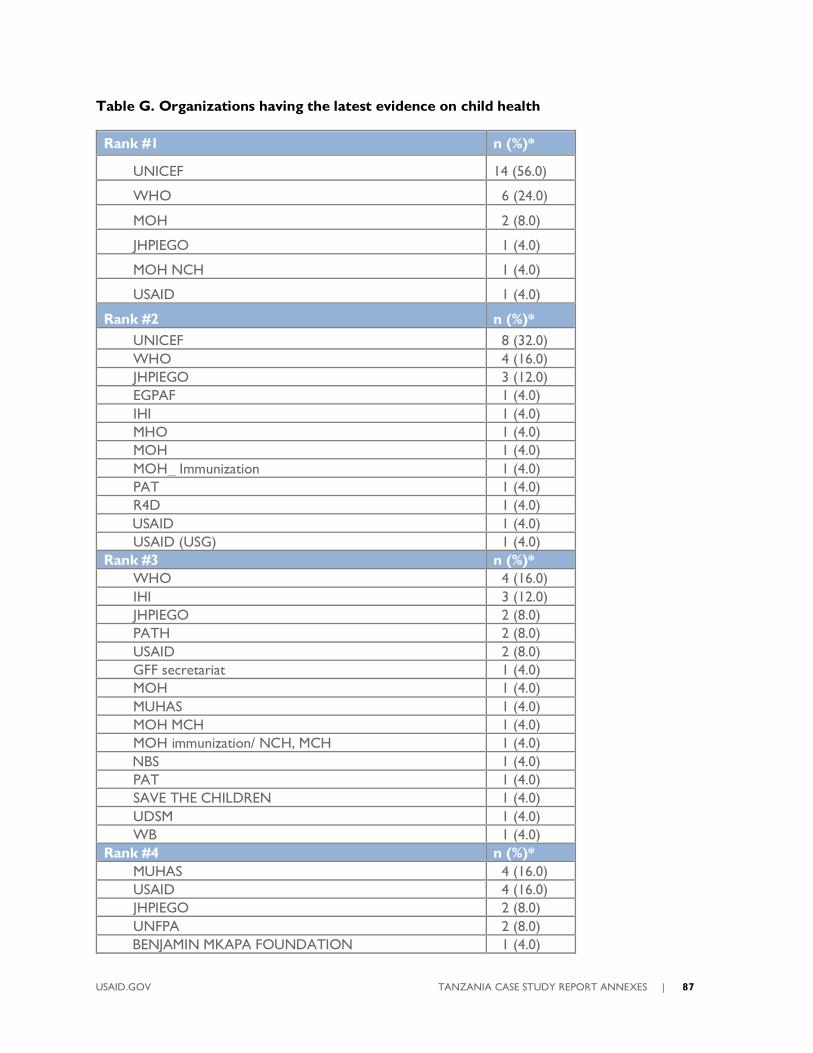
USAID.GOV TANZANIA CASE STUDY REPORT ANNEXES | 87
Table G. Organizations having the latest evidence on child health
Rank #1 n (%)*
UNICEF 14 (56.0)
WHO 6 (24.0)
MOH 2 (8.0)
JHPIEGO 1 (4.0)
MOH NCH 1 (4.0)
USAID 1 (4.0)
Rank #2 n (%)*
UNICEF 8 (32.0)
WHO 4 (16.0)
JHPIEGO 3 (12.0)
EGPAF 1 (4.0)
IHI 1 (4.0)
MHO 1 (4.0)
MOH 1 (4.0)
MOH_ Immunization 1 (4.0)
PAT 1 (4.0)
R4D 1 (4.0)
USAID 1 (4.0)
USAID (USG) 1 (4.0)
Rank #3 n (%)*
WHO 4 (16.0)
IHI 3 (12.0)
JHPIEGO 2 (8.0)
PATH 2 (8.0)
USAID 2 (8.0)
GFF secretariat 1 (4.0)
MOH 1 (4.0)
MUHAS 1 (4.0)
MOH MCH 1 (4.0)
MOH immunization/ NCH, MCH 1 (4.0)
NBS 1 (4.0)
PAT 1 (4.0)
SAVE THE CHILDREN 1 (4.0)
UDSM 1 (4.0)
WB 1 (4.0)
Rank #4 n (%)*
MUHAS 4 (16.0)
USAID 4 (16.0)
JHPIEGO 2 (8.0)
UNFPA 2 (8.0)
BENJAMIN MKAPA FOUNDATION 1 (4.0)

USAID.GOV TANZANIA CASE STUDY REPORT ANNEXES | 88
CSSC 1 (4.0)
EGPAF 1 (4.0)
EGPAF (EGPILE) 1 (4.0)
IHI 1 (4.0)
MHO 1 (4.0)
MOH 1 (4.0)
MOH MCH 1 (4.0)
R4D 1 (4.0)
Universities and training institution 1 (4.0)
WORLD BANK 1 (4.0)
Rank #5 n (%)*
JHPIEGO 3 (12.0)
GIZ 2 (8.0)
IHI 2 (8.0)
AGAKHAN 1 (4.0)
Development partners 1 (4.0)
EGPAF 1 (4.0)
MUHAS 1 (4.0)
R4D 1 (4.0)
USAID 1 (4.0)
* Categories are not mutually exclusive; denominator is the number of subjects interviewed (N = 25)
Table H. Best Child Health Coordinators
Rank #1 n (%)*
UNICEF 13 (52.0)
MOH 5 (20.0)
WHO 2 (8.0)
CHAI 1 (4.0)
JHPIEGO 1 (4.0)
RMNCH TWG 1 (4.0)
USAID 1 (4.0)
WHITE RIBON ALIANCE 1 (4.0)
Rank #2 n (%)*
WHO 6 (24.0)
UNICEF 5 (20.0)
MOH 3 (12.0)
USAID 3 (12.0)
EGPAF 1 (4.0)
SAVE THE CHILDREN 1 (4.0)
MOH NCH 1 (4.0)
MOH MCH 1 (4.0)
MUHAS 1 (4.0)
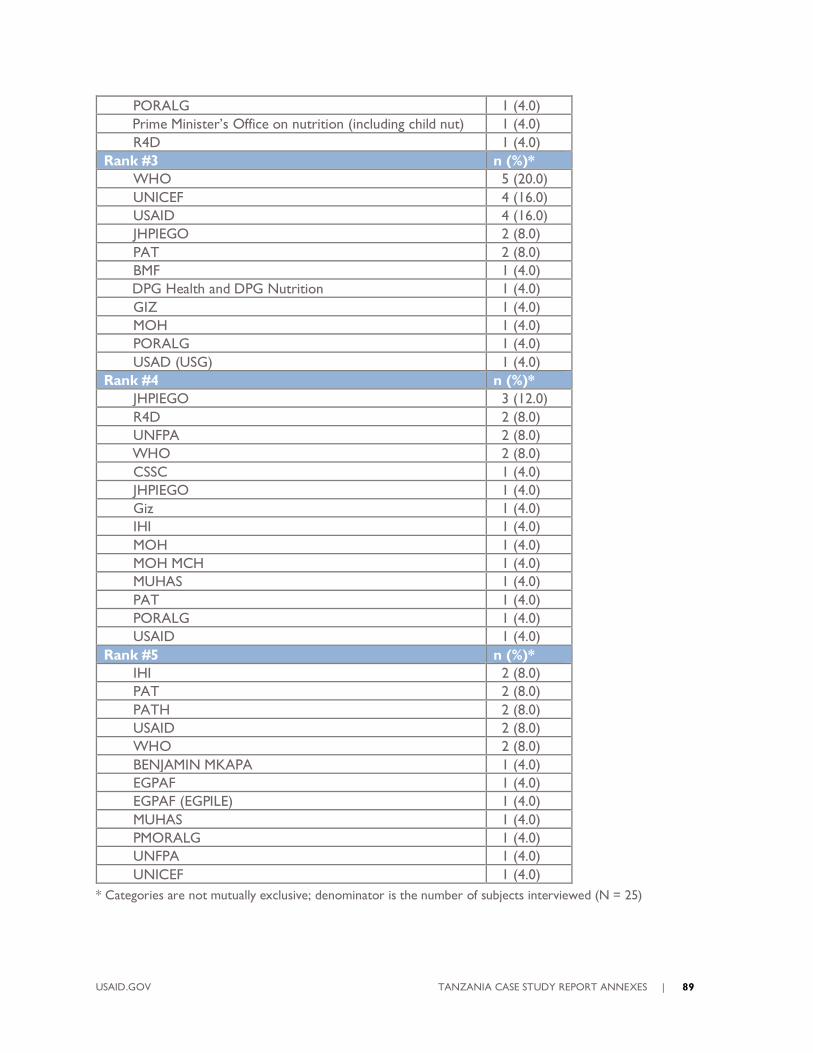
USAID.GOV TANZANIA CASE STUDY REPORT ANNEXES | 89
PORALG 1 (4.0)
Prime Minister’s Office on nutrition (including child nut) 1 (4.0)
R4D 1 (4.0)
Rank #3 n (%)*
WHO 5 (20.0)
UNICEF 4 (16.0)
USAID 4 (16.0)
JHPIEGO 2 (8.0)
PAT 2 (8.0)
BMF 1 (4.0)
DPG Health and DPG Nutrition 1 (4.0)
GIZ 1 (4.0)
MOH 1 (4.0)
PORALG 1 (4.0)
USAD (USG) 1 (4.0)
Rank #4 n (%)*
JHPIEGO 3 (12.0)
R4D 2 (8.0)
UNFPA 2 (8.0)
WHO 2 (8.0)
CSSC 1 (4.0)
JHPIEGO 1 (4.0)
Giz 1 (4.0)
IHI 1 (4.0)
MOH 1 (4.0)
MOH MCH 1 (4.0)
MUHAS 1 (4.0)
PAT 1 (4.0)
PORALG 1 (4.0)
USAID 1 (4.0)
Rank #5 n (%)*
IHI 2 (8.0)
PAT 2 (8.0)
PATH 2 (8.0)
USAID 2 (8.0)
WHO 2 (8.0)
BENJAMIN MKAPA 1 (4.0)
EGPAF 1 (4.0)
EGPAF (EGPILE) 1 (4.0)
MUHAS 1 (4.0)
PMORALG 1 (4.0)
UNFPA 1 (4.0)
UNICEF 1 (4.0)
* Categories are not mutually exclusive; denominator is the number of subjects interviewed (N = 25)
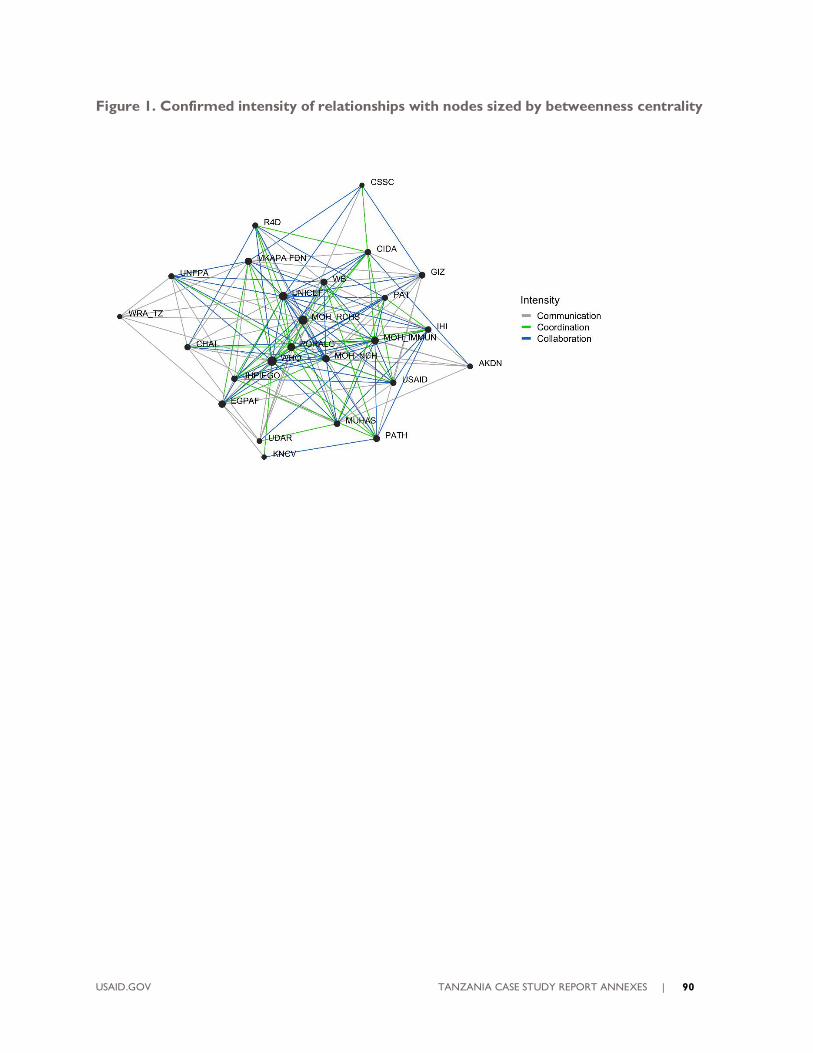
USAID.GOV TANZANIA CASE STUDY REPORT ANNEXES | 90
Figure 1. Confirmed intensity of relationships with nodes sized by betweenness centrality

USAID.GOV TANZANIA CASE STUDY REPORT ANNEXES | 91
USAID.GOV TANZANIA CASE STUDY REPORT ANNEXES | 92
FOR MORE INFORMATION
Coordinating Implementation Research to
Communicate Learning and Evidence Project (CIRCLE)
Social Solutions International, Inc.
www.socialsolutions.biz
This document was made possible by the support of the American People through the United States Agency for International Development
(USAID) under the terms of the Coordinating Implementation Research to Communicate Learning and Evidence (CIRCLE) contract AID-OAA-
M-16-00006. CIRCLE is implemented by Social Solutions International, Inc. Views expressed are not necessarily of USAID or other affiliated
institutions.