child cyclist accidents and cycling proficiency training
TRANSCRIPT

Accid. Anal & Prey. Vol. 12, pp. 31--40 Pergamon Press Ltd., 1980. Printed in Great Britain
CHILD CYCLIST ACCIDENTS AND CYCLING PROFICIENCY TRAINING
BARBARA PRESTON
Department of Social Science, Manchester Polytechnic, Aytoun St., Manchester MI 3GH, England
(Received 26 March 1979; in revised form 3 July 1979)
Abstract--An investigation of the effect of training children to ride pedal cycles was undertaken by asking school children to fill in questionnaires on their cycle training and accid.ents. Children who failed the cycling proficiency test had much higher accident rates than other children. Boys aged 10 and 11 years who had been trained and I;assed the cycling proficiency test had sliglRly lower accident rates than other boys, but this did not apply to girls. There were no other statistically significant differences in the accident rates, severity, or type of accidents, for boys or girls who had passed and those who never took the cycling proficiency test.
In Great Britain at the national level road safety has been the concern of the Royal Society for the Prevention of Accidents; supported largely by Government grants. They first introduced cycling proficiency schemes to train child cyclists. Since 1959 over two million children have been trained and there has been a decrease in the number of cyclists aged 10-14 killed or seriously injured, whereas there has been no such decrease for child cyclists under 10 years old. It was suggested [Department of the Environment, 1971] that this indicated that the training was worth while, since few children under 10 would be affected, but, gradually, increasing numbers of children over the age of 10 would be trained. Causal connections where changes occur over time are notoriously uncertain, since so many other factors may be changing, and, as shown in Fig. 1, there was also a large reduction in the number of cyclists over the age of 20 who were killed and seriously injured, thought to be due to a considerable reduction in the mileage cycled.
As the mileage cycled by children, during this period, is not known, the efficacy of the cycling proficiency training is "not proven". Moreover there has been a slight increase in the number of pedal cyclists aged 10-14 killed and seriously injured since 1974.
At the local level road safety education and propaganda are carried out by Road Safety Officers, (employed by the local authority) and also in some areas by the Police. The cycling proficiency schemes are run largely by Road Safety Officers, though the actual instruction is given by volunteers. In some areas the Police also run cycle proficiency training.
A great deal of time and money go into running cycle proficiency training, so it is important to know if it is effective, or whether the time and money could be better spent on other aspects of accident prevention.
Alastair Risk and Stanley Raymond [1976] investigated the effect of the cycling proficiency scheme on child cycling accidents. I0,240 children from 49 schools all over the country filled in questionnaires. The difference in the accident rates for trained and untrained children were small, and suggested that if the C.P.T. was reducing the accident rate this was only for children under 11 years of age. They concluded that the difference in accident rates between trained and untrained children could scarcely justify a conclusion in favour of the effectiveness of the instruction, though they were suggestive.
The Hereford and Worcester Road Safety Training Organiser also investigated this problem [Darlington, 1976]. Questionnaires were sent, through the schools, to a representative cross section of parents of children who had passed the C.P.T. and a control group of parents of similar children who had not taken the cycle training. They reported far more accidents, in the previous year, to children in the control group than to trained children, even though the trained children cycled more than the control group. However only 26% of the questionnaires were returned. This very large, though by no means unusual, non-response rate means that their figures may not be representative.

32
Killed ond I seriously injured I
B. PRESTON
5000
4000
3000
I - v o,
~ I0 1'o 15
I000
~ u n d e r I0
o 1954 6 8 60 2 4 6 8 7~0 2 4 6
yeor
Fig. 1. Pedal cyclists killed and seriously injured in Great Britain, 1954 to 1977.
With these conflicting reports a further investigation seemed called for, and a survey was carried out in an industrial town in the North of England, chosen primarily because the Road Safety Officer was especially interested in the cycling proficiency scheme. This area was also particularly suitable because some of the children were trained solely on the school playground and others completed their training on the roads. Thus the two types of training could be compared. Enrolment for the training is voluntary and depends therefore on the wishes of the children and/or their parents.
The Cycling Proficiency Training in this area is run one evening a week for 5 weeks, after school, in the Summer Term. First the children's cycles are inspected, and if faults are found the children are given a letter about this to take home to their parents. The children are taught the relevant parts of the Highway Code that apply to cyclists, and the other sessions are devoted to practical exercises on cycle control, stopping, starting and turning right and left. This is done first on the school playground, which is marked out as a road with stop signs and traffic signals. Later, if, but only if, the voluntary helpers are willing, which depends to a certain extent on whether the roads round the school carry much traffic, training is also carried out on the roads. After 5 sessions there is a test in the school playground and the children must get a minimum of 75% for each type of manoeuvre to pass. Those who pass may then take a further test on the roads, if they have been trained on the roads. Children who fail the playground test may have further training sessions and then retake the test.
M E T H O D
The information required was obtained largely from questionnaires, though a preliminary survey was undertaken when pupils aged 11 and 12 were interviewed individually. Question-

Child cyclist accidents and cycling proficiency training 33
naires were distributed to all secondary schools in the area, to be filled in by the IVth year in each school, that is boys and girls aged 14 and 15 years. The staff were most co-operative and questionnaires were filled in at 19 schools.
As the aim of the investigation was to try and find out whether taking the C.P.T. influenced the accident rate, and whether there was any difference for those trained on the playground and those also trained on the roads, the children were asked if they had ever taken the C.P.T., whether they had passed or failed, and whether they trained on the playground only or on the roads as well. They were also asked if they had had any cycling accidents, and if so to describe their injuries and the treatment they received, and to say what they were doing at the time, where the accident happened, who and what were involved, whose fault they thought it was, and why they thought the accident happened.
The problem in trying to ascertain whether the cycle training makes children less likely to have accidents is that there are so many other factors involved. The children were asked to state their sex, age, the age at which the accidents occurred, when they started to cycle, when they took the C.P.T. and whether or not the accidents were before or after taking the test.
The other factor that seemed most likely to influence the accident rate was how much the children cycled. It was found in the preliminary survey that children have great difficulty in answering questions on this, since the amount of time they spend cycling depends on the weather and time of year, and many have only the vaguest idea how many miles they have cycled, even recently. However, it was felt important to have some idea of the amount of cycling, even if it was not very exact, so the children were asked if they owned a bike or rode their friends bike, whether they cycled to school, where they cycled, how many evenings a week they cycled, for how long, and how many miles a week. Because of the difficulties in obtaining answers to these questions, even when applied to the present, no questions were asked as to how much the children had cycled before and after taking the C.P.T. It would have been interesting to know this, but it was felt that asking questions relating to the amount of cycling undertaken many years earlier would not only lead to unreliable answers, but might put the children off so that other questions were not answered seriously.
RESULTS
3,013 questionnaires were returned. 20% of the girls and 44% of the boys reported that they had been injured in a cycling accident at some time. Therefore the replies from boys and girls were analysed separately.
BOYS
1,458 questionnaires were returned. 10 could not be used as they were filled in frivolously, or hardly filled in; in addition a few others had to be omitted from some of the more detailed analyses as the ages at which the accidents occurred, or the C.P.T. was passed, were omitted. Also 6 boys said that they could not ride a bike and so these were not applicable to the survey, leaving 1,442 questionnaires to be analysed.
The replies to the questions on how much the boys cycled were not very reliable, as the boys themselves often did not know. However, it seemed possible to divide the answers into four categories, those who had given up cycling, those who cycle very little, those who cycle quite a lot, at least two evenings or 4 miles a week, and those who cycle a great deal, at least 6 hr or 10 miles a week.
Comparison o[ the accident rates of boys who had passed the test with other boys As the accident rate varies considerably with age this must be done by age groups. The
questionnaires were analysed to give the number of accidents and the number of boys "at risk" for each age group from 5 to 15, by amount of cycling and whether the boys had never taken, had passed, or had failed the C.P.T. showing whether the accidents occurred before or after training, and whether this was on the playground only or included a road test. Boys who had given up cycling could not be included in this analysis, as the age at which they had stopped cycling was not known. A correction for continuity was included, e.g. those aged 15 were all considered to be at risk for half a year.
However the accident rates for each age in each of the categories were--fortunately--based on too few accidents to be meaningful so the data had to be grouped.
AAP Vol. 12, No. I ~

34
..! I
IO%
B. PRESTON
-1 tralned
B not trained
\
, \ , \
O ' \
68f7 8&9 12~15 i4&15
Age in years
IO~11
Fig. 2. Accident rates for boys, grouped into two year age groups for boys who had passed, and boys who had not yet taken or never took the C.P.T.
Figure 2 gives a comparison of the accident rates at different ages for boys who had not yet taken or never took the C.P.T. and those who had passed the C.P.T. In order that the number of accidents in each group should be sufficient for fluctuations to be meaningful two year age groups from 6 to 15 years were taken, all who passed die C.P.T. were considered together, without differentiating between those tested on the road and the playground, and, apart from omitting those who had stopped cycling, different amounts of cycling were not considered separately.
Boys took the C.P.T. at any age from 7 to 14, but the majority took it when they were 10 or 11 years old. For those under 12 the accident rate was lower for those who had taken the C.P.T., the only age group for which the differences are statistically significant being the 10 and 11 year age group. (p = 0.05 level).
It might be expected that this would be the age at which training might be most effective, and this also agrees with Alastair Risk's findings[Risk and Raymond, 1976]. This analysis does not, however, take into consideration any differences in the amount of cycling, or any other inherent differences between the groups. Since taking the test is voluntary the children who were naturally more careful riders might be those who took the test, they might have newer and better maintained bicycles, and they might live and cycle in safer areas, though the latter should only apply to those who only cycle near home, that is younger children and those who do not cycle much, since older children who cycle long distances will not spend much of their cycling time near home.
Comparison of the accident rates for the groups of boys who passed, failed, and never took the test, both before and after taking the test
Were there any obvious differences between the group of boys who never took, and the boys who passed, or who failed, the C.P.T. apart from taking or not taking the test?
858 boys had not taken the C.P.T. (59.5%), 544 (38%) passed the test and 40 failed, 7% of those who took the test. The crude accident rates for accidents at all ages are given in Table 1.

Child cyclist accidents and cycling proficiency training
Table 1. Crude injury rates for boys who passed, failed, or never took the cycling proficiency test
Took C.P.T. and failed Out of 40 boys 28 reported accidents 70% Passed C.P.T. Out of 544 boys 237 reported accidents 44% Never took C.P.T. Out of 858 boys 371 reported accidents 43%
35
A much higher percentage of boys who failed the C.P.T. reported accidents, but there was no overall difference between those who had passed the test and those who never took the training.
These figures, however, refer to all accidents from the age of 5, and take no account of different amounts of cycling. It could be that differences in the accident rates at the younger ages, or in amount cycled, mask any effect due to the C.P.T.
Since most of those taking the C.P.T. were aged 10 and 11 the accident rates for younger boys, aged 6--10, was compared with the accident rate for older boys, aged 12-16, for those who never took the test, those who passed and those who failed, in order to see if there were any inherent differences between the three groups.
For the first two groups the amount of cycling was also included in the analysis; but the number who failed was too small to subdivide by amount of cycling. Again those who had given up cycling were omitted, as the number "at risk" for this group was not known.
The accident rates are shown in Table 2.
Table 2. Comparison of the injury rates per annum and amount of cycling for boys who passed, failed, or never took the cycling proficiency test
Amount of cycling
Never took C.P.T. Passed C.P.T. Failed C.P.T. Aged Aged Aged Aged Aged Aged 6--10 12-16 6--10 12-16 6--10 12-16
Cycle very little 4% 9% 1% 10% Cycle quite a lot 3% 9% 1.5% 9% Cycle a great deal 2% 12% 2% 15%
2 % 16%
For the older age group there is, again, no sign that the C.P.T. was reducing the number of accidents. For those who failed the test the accident rate for the younger ages was comparable to those who had passed, it was for the older ages that the accident rate was higher. For those who passed the test the accident rate was, on the whole, lower for the younger age group than it was for the group who never took the C.P.T. This might indicate that they, or their parents, were more careful, or lived in safer areas, or had better maintained bicycles, which gives no mitigation to the fact that, overall, for the older ages the accident rate was slightly higher for the group who took the test.
Comparison of the accident rate of boys who had taken the test with those who were to take it but had not yet done so
To eliminate any possible differences between boys who took the test and boys who did not only the group who eventually passed the C.P.T. were considered. The accident rate for boys aged 10 and 11 before and after taking the test were compared.
Considering all amounts of cycling together, since the numbers were not sufficient to sub-divide, before the test 16 accidents were reported for 436 boys times years at risk, after the test 14 accidents for 511 boys times years at risk. The accident rate for boys aged l0 and 11 was 3.7% before taking the test and 2.7% afterwards. Though the accident rate appears less after training the difference is small and might well be due to chance. However it is likely that boys cycled more after taking the test. Questions on this were not asked in this survey, but in an earlier unpublished survey in the same district [Stan Deacon, 1967] parents were sent a questionnaire asking, amongst other things, whether they allowed their Children more freedom as to where they cycled after taking the test, and nearly two thirds replied that they did. Similarly in the Hereford and Worcester study [Darlington J. C., 1976] 79% of the parents replied that their children cycled more on the roads after passing the C.P.T.

36 B. PRESTON
There does seem to be some evidence that, at the ages of l0 and I 1 the Cycling Proficiency Training is reducing the number of accidents. The next question is whether this only applies to boys of this age or does the C.P.T. reduce the accident rate for a short period of time, a year or 18 months perhaps, whenever it is taken, and after that the effect wears off. An effect of this type was sought, but for boys of 12 and 13 there did not seem to be any reduction in accidents during the rest of that year or in the subsequent year.
Comparison of the accident rate for those trained on the roads and those only trained on the school playground
Since the numbers were small a check was made to see whether the proportions cycling different amounts varied much between the two groups. The differences in the amounts of cycling were small, so, apart from those who had given up cycling, the rest were considered together. All accidents after the age of 6 were considered. For those who took the C.P.T. on the playground only there were 8 accidents before the test, giving an annual rate of 2% and 32 accidents after the test giving an annual accident rate of 8%, for those who passed with a road test there were 48 accidents before the test, an accident rate of 3% and 130 after the test, an accident rate of 8.6%. There would seem therefore to be no discernable difference between the two types of training.
Comparison of severity of accidents All accidents to boys aged 10 years and over were classified as very slight, slight or serious.
It is not possible from the boys reports to be at all sure that the categories correspond to the usual police classifications. If in doubt I erred on the side of classifying as very slight. These very slight accidents varied from those reported mainly because the cycle was damaged, the boy on!y receiving very minor scratches and bruises to accidents which would probably not have been included in National statistics as the mother or neighbours treated the cuts and lacerations, though they were often reported as very painful. Slight injuries were those where the treatment was not just by parents or neighbours and serious injuries were those where the child was detained in hospital or suffered fractures, concussion or other head injuries. Obviously, since all these boys were in school when they filled in the questionnaires very severe injuries would not be reported. Accidents where front teeth were knocked out were classified as dental. There were no trends in the severity of the injuries for the different amounts of cycling, so all amounts of cycling were considered together. The severity of accidents for boys who passed, failed, or never took the cycling proficiency test are shown in
Table 3. Boys who passed the C.P.T. did not have less serious accidents.
Table 3. Severity of injuries to boys aged 10 or over who passed, failed, or never took the cycling proficiency test
Seriousness of injury Very slight Slight Dental Serious N % N % N % N %
Never took C.P.T. 256 76% 46 14% 2 0.6% 32 10% Passed C.P.T. 123 69% 24 14% 6 3% 24 14% Failed C.P.T. 14 (61%)* 6 (26%) 0 3 (13%)
*The total is too small for percentages to be meaningful, but it is given in brackets for comparison if required.
Comparison of types of accidents The cause of the accidents, as reported by the boys was tabulated, for accidents from the
age of 10 years. It is most unlikely that the drivers and others reported by the boys as being at fault would agree, on the other hand many boys seemed willing, to admit that they were not looking where they were going, that they were riding too fast, carrying awkward parcels, fooling around, riding "no hands" or trying to imitate Evel Knievel. Bearing in mind that the causes given are in no sense legal, but merely as it appeared to the boys, it is perhaps

Child cyclist accidents and cycling proficiency training
Table 4. Causes of accidents as reported by the boys who passed, failed, or never took the cycling proficiency test; all injury accidents
from the age of 10 years
Cause of accident
Never took Passed Failed C.P.T. C.P.T. C.P.T.
N % N % N %
Motor traffic 71 21 41 23 6 (26) Road surface 27 8 20 11 4 (17) Not concentrating 62 18 35 20 1 (4) Poor handling
of bicycle 28 8 7 4 I (4) Going too fast 20 6 9 5 3 (13) Mechanical fault
of bicycle 34 10 17 10 2 (9) Other cyclist 22 7 11 6 1 (4) Racing/fooling
no hands/2 on bike 24 7 12 7 3 (13) Pedestrian 13 4 2 1 0 Dog/cat 8 2 8 5 1 (4) Other 9 3 5 3 0 Not known 18 5 10 6 1 (4)
37
interesting for once to see causes from the point of view of the children involved. The causes of accidents reported by boys who had passed, failed, or never took the cycling proficiency test are shown in Table 4.
Four of the accidents due to other motor traffic were caused by careless opening of car doors. Accidents due to the road surface included icy roads, bumps and holes in the road, gravel, cinders and hot tar. The other cyclist at fault was nearly always another boy with whom the boy was cycling. Pedestrians included adults and other children. Five accidents were caused by cats. The other reasons included carrying heavy bags, getting things stuck in the wheel spokes, and various things that were each only mentioned once. The reported causes of accidents are extremely similar for boys who passed, failed and never took the C.P.T.
GIRLS
1,555 questionnaires were returned. 8 could not be used at all as the information was inadequate; 20 girls said that they could not ride a bike, so these were not applicable to the survey, leaving 1,527 questionnaires to be analysed.
The replies from the girls were analysed in the same way as for the boys. Figure 3 shows the
5%
-1 trained
O not trained
H 68=7
Age in years
8819 108dl 128d 148115
Fig. 3. Accident rates for girls, grouped into two year age groups for girls who had passed, and those who had not yet passed and those who never took the C.P.T.

38 B. PRESTON
accident rates for the girls who had passed, and for those who had not yet taken, or never took, the C.P.T. by ages.
For girls none of the differences were statistically significant. 966 girls did not take the C.P.T. (63%); 530 passed, (35%) and 31 fa i l ed~6% of those who took the test.
The crude accident rates, for all ages, for girls who passed, failed, and never took the C.P.T. are given in Table 5.
A higher proportion of girls who failed the C.P.T. reported accidents, but there was no overall difference between the group who passed the test and those who never took cycle training.
For girls as for boys the reports were analysed to give a comparison of the accident rates by ages and amount of cycling for those who passed, failed, and never took the C.P.T. This is shown in Table 6. Girls who failed the C.P.T. do not seem to have higher accident rates in this analysis because 4 of the 9 who reported accidents had stopped cycling and are not included
here. Apart from those who cycle a great dea l - -and even here the difference is not statistically
significant--the differences in accident rates seem to be for the younger ages only. As for the boys, this suggests that those who do not take the C.P.T. may come from areas where the dangers are greater for very young cyclists.
The accident rates for girls aged l0 and l l before and after passing the C.P.T. were compared. Before taking the test the accident rate was 1.5%, after taking the test 3.6%. So unlike the boys, the accident rate was greater after taking the C.P.T. It is possible that girls, rather than boys, cycle much more after taking the test, though this was not found to be the case in the Hereford and Worcester Survey [Darlington, 1976].
The accident rates of those who passed the C.P.T. on the playground only, and those who passed with a road test, were compared. For both groups the annual accident rate before the test was 2%, after the test it was 4% for those trained on the playground only, and 3% for girls trained on the roads, but the difference was not statistically significant.
The severity of accidents, after the age of 10, for girls who passed, failed or never took the C.P.T. is given in Table 7.
Table 5. Crude injury rates for girls who passed, failed, or never took the cycling proficiency test
Took C.P.T. and failed Out of 31 girls 9 reported accidents 29% Passed C.P.T. Out of 530 girls 105 reported accidents 20% Never took C.P.T. Out of 966 girls 193 reported accidents 20%
Table 6. Comparison of the injury rates per annum and amount of cycling for girls who passed, failed, or never took the cycling proficiency test
Amount of cycling
Never took C.P.T. Passed C.P.T. Failed C.P.T. Aged Aged Aged Aged Aged Aged 6-10 12-16 6--10 12-16 6-10 12-16
Cycle very little 3% 3% 2% 3% 1 Cycle quite a lot 3% 4% 2% 4% Cycle a great deal 3% 6% 2% 2%
2% 2%
Table 7. Severity of injuries to girls aged 10 or over who passed, failed, or never took the cycling proficiency test
Seriousness of injury Very slight Slight Dental Serious N % N % N % N %
Never took C.P.T. 89 71% 24 19% 3 2% 9 7% Passed C.P.T. 39 68% 11 19% 0 7 12% Failed C.P.T. 1 (25%) 0 0 3 (75%)
Child cyclist accidents and cycling proficiency training 39
For girls as for boys there was no indication that those who had been trained tended to have less serious accidents.
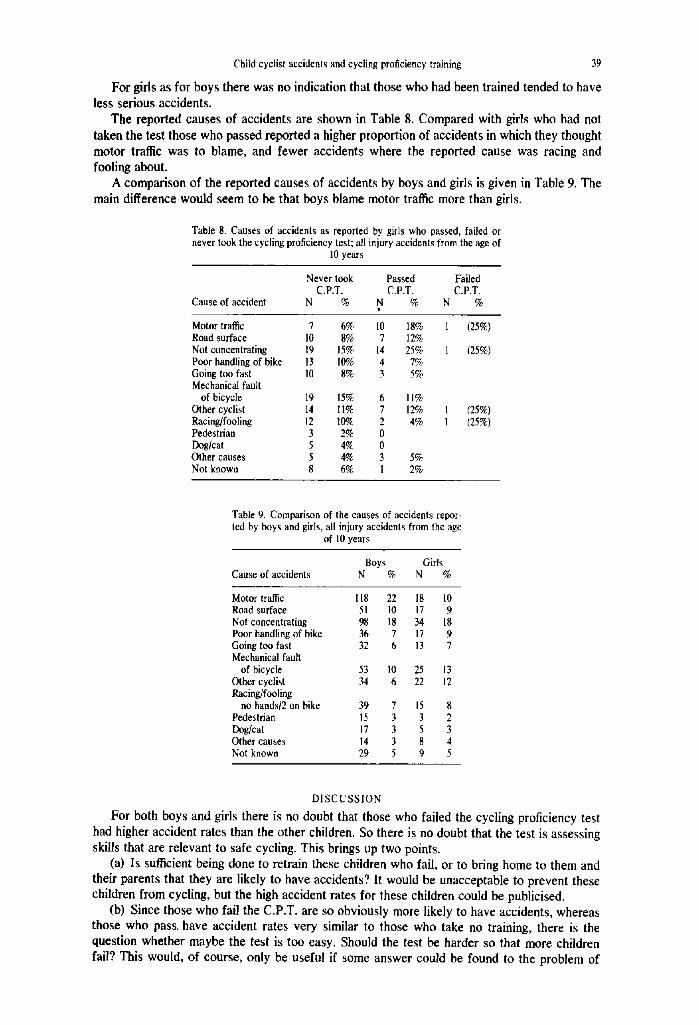
The reported causes of accidents are shown in Table 8. Compared with girls who had not taken the test those who passed reported a higher proportion of accidents in which they thought motor traffic was to blame, and fewer accidents where the reported cause was racing and fooling about.
A comparison of the reported causes of accidents by boys and girls is given in Table 9. The main difference would seem to be that boys blame motor traffic more than girls.
Table 8. Causes of accidents as reported by girls who passed, failed or never took the cycling proficiency test; all injury accidents from the age of
10 years
Never took Passed Failed C.P.T. C.P.T. C.P.T.
Cause of accident N % N % N %
Motor traffic 7 6% 10 18% 1 (25%) Road surface 10 8% 7 12% Not concentrating 19 15% 14 25% 1 (25%) Poor handling of bike 13 10% 4 7% Going too fast 10 8% 3 5% Mechanical fault
of bicycle 19 15% 6 11% Other cyclist 14 11% 7 12% 1 (25%) Racing/fooling 12 10% 2 4% 1 (25%) Pedestrian 3 2% 0 Dog/cat 5 4% 0 Other causes 5 4% 3 5% Not known 8 6% I 2%
Table 9. Comparison of the causes of accidents repor- ted by boys and girls, all injury accidents from the age
of 10 years
Boys Girls Cause of accidents N % N %
Motor traffic 118 22 18 10 Road surface 51 10 17 9 Not concentrating 98 18 34 18 Poor handling of bike 36 7 17 9 Going too fast 32 6 13 7 Mechanical fault
of bicycle 53 10 25 13 Other cyclist 34 6 22 12 Racing/fooling
no hands/2 on bike 39 7 15 8 Pedestrian 15 3 3 2 Dog/cat 17 3 5 3 Other causes 14 3 8 4 Not known 29 5 9 5
DISCUSSION
For both boys and girls there is no doubt that those who failed the cycling proficiency test had higher accident rates than the other children. So there is no doubt that the test is assessing skills that are relevant to safe cycling. This brings up two points.
(a) Is sufficient being done to retrain these children who fail, or to bring home to them and their parents that they are likely to have accidents? It would be unacceptable to prevent these children from cycling, but the high accident rates for these children could be publicised.
(b) Since those who fail the C.P.T. are so obviously more likely to have accidents, whereas those who pass. have accident rates very similar to those who take no training, there is the question whether maybe the test is too easy. Should the test be harder so that more children fail? This would, of course, only be useful if some answer could be found to the problem of

40 B. PRESTON
retraining the less skillful, or of deterring them from cycling. As things are now the training is presumed to be useful, but passing or failing the test has no impact.
For boys (but not for girls), aged 10 and 11 those who passed the test had fewer accidents than those who had not taken it. Though this difference was statistically significant many different analyses were tried, and 1 in 20 should be statistically significant by chance alone. However, this finding does seem to agree, to a certain extent, with the Alastair Risk and Raymond [1976] findings. It is therefore likely that children aged 10 or 11 have a lower accident rate for a limited period, a year or 18 months, after taking the C.P.T. This did not seem to apply to those who took the test when they were older. The numbers were small in this survey, but if this finding were substantiated by other surveys than there would be a case for concentrating the cycling proficiency training at the ages of 10 and 11, and trying to persuade all to train at that age. No reduction was found for girls, but it does not necessarily follow that the C.P.T. was useless for girls, or that boys not girls should be trained. It is quite possible that girls, but not boys, cycle more, and under more dangerous conditions, after passing the test, and that this annuls any advantage the test confers.
Girls do not cycle as much as boys, but this is not the full explanation of their lower accident rates as even when the amount of cycling is held roughly constant girls still have only about half the accident rates of boys. The reported causes of accidents give no clue as to why this should be so. Oddly, slightly more girls than boys give going too fast, racing, or fooling about as a cause of their accidents. But these, of course, are the girls who had accidents, we do not know about the behaviour of those who did not.
It is interesting that from the boys' point of view, 22% reported that their accidents were caused by motor traffic. Children are not alone in thinking that drivers are not always aware and considerate towards the needs of cyclists. The first recommendation of the County Engineer and County Planning Officer [1978] on the subject of cycling in Greater Manchester is that increased emphasis should be given to road safety campaigns to alert drivers to the needs and characteristic behaviour of cyclists. It would seem from the children's reports of their accidents that this is very important.
Acknowledgements--I would like to thank Stan Deacon and Jonne Ceserani for their help in this work and The Manpower SerVices Commission who provided money under the Job Creation Scheme for a research worker.
REFERENCES County Engineer and County Planning Officer, Hayes J. and Millar J. S., Cycling in Greater Manchester. Report to the
Greater Manchester Council, (unpublished), 1978. Darlington J. O., Children and Cycling. The County Council of Hereford and Worcester Highways and Transportation
Dept., County Buildings, Worcester WRI ITS, England, 1976. Deacon S., Stockport Road Safety Officer, Unpublished survey. Department of the Environment, Road Accidents 1969, H.M.S.O., London. 1971. Department of Transport, Road Accidents Great Britain, 1977, H.M.S.O. 1978. Risk A. and Raymond S., Child Cyclists. Road Safety Research Unit, Dept. of Civil Engineering, Salford University, Salford,
England, 1976.