chief executive officer’s report – april 2019 update · the chief executive officer’s report,...
TRANSCRIPT

CEO’s Report – April 2019 Update Page 1 of 2
For Information
Chief Executive Officer’s Report – April 2019 Update
Date: April 11, 2019
To: TTC Board
From: Chief Executive Officer
Summary
The Chief Executive Officer’s Report is submitted each month to the TTC Board, for information. Copies of the report are also forwarded to each City of Toronto Councillor, the Deputy City Manager, and the City Chief Financial Officer, for information. The report is also available on the TTC’s website.
Financial Summary
The monthly Chief Executive Officer’s Report focuses primarily on performance and service standards. There are no financial impacts associated with the Board’s receipt of this report.
Equity/Accessibility Matters
The TTC strives to deliver a reliable, safe, clean, and welcoming transit experience for all of its customers, and is committed to making its transit system barrier-free and accessible to all. This is at the forefront of TTC’s new Corporate Plan 2018-2022. The TTC strongly believes all customers should enjoy the freedom, independence, and flexibility to travel anywhere on its transit system. The TTC measures, for greater accountability, its progress towards achieving its desired outcomes for a more inclusive and accessible transit system that meets the needs of all its customers. This progress includes the TTC’s Easier Access Program, which is on track to making all subway stations accessible by 2025. It also includes the launch of the Family of Services pilot and improved customer service through better on-time service delivery with improved shared rides, and same day bookings to accommodate Family of Service Trips. These initiatives will help TTC achieve its vision of a seamless, barrier free transit system that makes Toronto proud.

CEO’s Report – April 2019 Update Page 2 of 2
Decision History
The Chief Executive Officer’s Report, which was created in 2012 to better reflect the Chief Executive Officer’s goal to completely modernize the TTC from top to bottom, was transformed to be more closely aligned with the TTC’s seven strategic objectives – safety, customer, people, assets, growth, financial sustainability, and reputation. In 2018, with the launch of the new Corporate Plan, this report has undergone progressive changes to align and reflect our reporting metrics to the TTC’s continued transformation.
Issue Background
For each strategic objective, updates of current and emerging issues and multi-year performance are now provided, along with a refreshed performance dashboard that reports on the customer experience. This information is intended to keep the reader completely up-to-date on the various initiatives underway at the TTC that, taken together, will help the TTC achieve its vision of a transit system that makes Toronto proud.
Contact
Ciaran Ryan, Manager – Research & Insights (Acting) 647-465-8659 [email protected]
Signature
Richard J. Leary Chief Executive Officer
Attachments
Attachment 1 – Chief Executive Officer’s Report – April 2019

Toronto Transit Commission
CEO’s Report April 2019
Performance scorecard 2 CEO’s commentary 9 Performance updates: Safety and security 12 Ridership 17 Customer experience 22

Ongoing trend indicators: Favourable Mixed Unfavourable *Represents four-quarter average of actual results
Toronto Transit Commission │ CEO’s Report │ April 2019 1

Ongoing trend indicators: Favourable Mixed Unfavourable *Represents four-quarter average of actual results
Toronto Transit Commission │ CEO’s Report │ April 2019 2
TTC performance scorecard – April 2019
Key performance indicator Description Latest measure Current Target Current
status Ongoing trend Page
Safety and security
Lost-time injuries Injuries per 100 employees Q4 2018 4.85 4.75* 12
Customer injury incidents Injury incidents per 1M boardings Q4 2018 0.95 1.06* 13
Offences against customers Offences per 1M boardings Q4 2018 0.64 1.00 14
Offences against staff Offences per 100 employees Q4 2018 4.11 3.88 15
Fitness for duty Cumulative total of random drug and alcohol test results Q4 2018 NA NA 16
Ridership
Ridership Monthly ridership Feb 2019 39.4M 41.5M 17
Ridership Year-to-date ridership 2019 YTD (to Feb) 85.2M 87.9M NA 17
Performance scorecard

Ongoing trend indicators: Favourable Mixed Unfavourable *Represents four-quarter average of actual results
Toronto Transit Commission │ CEO’s Report │ April 2019 3
Key performance indicator Description Latest measure Current Target Current
status Ongoing trend Page
PRESTO ridership Monthly ridership Feb 2019 31.7M 32.4M 19
PRESTO ridership Year-to-date ridership 2019 YTD (to Feb) 67M 67.9M NA 19
Wheel-Trans ridership Monthly ridership Feb 2018 288K 316K 21
Wheel-Trans ridership Year-to-date ridership 2019 YTD (to Feb) 621K 679K NA 21
Customer experience
Customer satisfaction Customer satisfaction score Q4 2018 79% 80% 22
Subway services
On-time performance Line 1
Scheduled headway performance at end terminals Feb 2019 90.5% 90% 23
On-time performance Line 2
Scheduled headway performance at end terminals Feb 2019 90.7% 90% 24
On-time performance Line 3
Scheduled headway performance at end terminals Feb 2019 91.8% 90% 25

Ongoing trend indicators: Favourable Mixed Unfavourable *Represents four-quarter average of actual results
Toronto Transit Commission │ CEO’s Report │ April 2019 4
Key performance indicator Description Latest measure Current Target Current
status Ongoing trend Page
On-time performance Line 4
Scheduled headway performance at end terminals Feb 2019 98.6% 90%
26
Capacity Line 1 Trains per hour during peak Feb 2019 95.1% 96% 27
Capacity Bloor Station Trains per hour – 8am to 9am Feb 2019 98% 96% NA 27
Capacity St George Station Trains per hour – 8am to 9am Feb 2019 99.6% 96% NA 27
Capacity Line 2 Trains per hour during peak Feb 2019 95.2% 96% 28
Capacity Line 3 Trains per hour during peak Feb 2019 93.8% 98% 29
Capacity Line 4 Trains per hour during peak Feb 2019 100% 98% 30
Amount of service Average weekly service hours delivered Feb 2018 11.4K 11K 31
Vehicle reliability T1 trains
Mean distance between failures Feb 2019 361,185
km 300,000
km 32
Vehicle reliability TR trains
Mean distance between failures Feb 2019 804,978
km 600,000
km 33

Ongoing trend indicators: Favourable Mixed Unfavourable *Represents four-quarter average of actual results
Toronto Transit Commission │ CEO’s Report │ April 2019 5
Key performance indicator Description Latest measure Current Target Current
status Ongoing trend Page
Service availability Daily average service delivered Feb 2019 100% 100% 34
Subway cleanliness Audit score Q4 2018 92.7% 90% 35
Streetcar services
On-time performance On-time departures from end terminals Feb 2019 52.2% 90% 36
Short turns Monthly total short turns Feb 2019 1,171 1,074 37
Amount of service Average weekly service hours Feb 2018 18.2K 18.3K 38
Vehicle reliability LFLRV (Low-Floor Light Rail Vehicle)
Mean distance between failures Feb 2019 13,304
km 35,000
km 39
Vehicle reliability CLRV (Canadian Light Rail Vehicle)
Mean distance between failures Feb 2019 3,114
km 6,000
km 40
Vehicle reliability ALRV (Articulated Light Rail Vehicle)
Mean distance between failures Feb 2019 NA NA NA NA 41
Road calls and change offs
Average daily road calls or vehicle change offs Feb 2019 11 2 42

Ongoing trend indicators: Favourable Mixed Unfavourable *Represents four-quarter average of actual results
Toronto Transit Commission │ CEO’s Report │ April 2019 6
Key performance indicator Description Latest measure Current Target Current
status Ongoing trend Page
Service availability Daily number of vehicles available for service Feb 2019 99.4% 100% 43
Streetcar cleanliness Audit score Q4 2018 91.8% 90% 44
Bus services
On-time performance On-time departures from end Terminals Feb 2019 71.5% 90% 45
Short turns Monthly total short turns Feb 2019 2,202 1,590 46
Amount of service Average weekly service hours Jan 2018 152k 150K 47
Vehicle reliability Mean distance between failures Feb 2019 20,000
km 12,000
km 48
Road calls and change offs
Average daily road calls or vehicle change offs Feb 2019 35 24 49
Service availability Daily average service delivered Feb 2019 102.8% 100% 50
Bus cleanliness Audit score Q4 2018 94% 90% 51

Ongoing trend indicators: Favourable Mixed Unfavourable *Represents four-quarter average of actual results
Toronto Transit Commission │ CEO’s Report │ April 2019 7
Key performance indicator Description Latest measure Current Target Current
status Ongoing trend Page
Wheel-Trans services
On-time performance % within 20 minutes of schedule Feb 2019 92.5% 90% 52
Vehicle reliability Mean distance between failures Feb 2019 16,210
km 12,000
km 53
Accommodation rate Percentage of requested trips completed Feb 2019 99.9% 99% 54
Station services
Station cleanliness Audit score Q4 2018 76.2% 75% 55
Elevator availability Percent available Feb 2019 98% 98% 56
Escalator availability Percent available Feb 2019 97.1% 97% 57
Fare gates equipped with PRESTO Percent available Jan 2018 97.3% 99.5% 58
PRESTO Fare Card Reader Percent available Feb 2019 98.9% 99.9% 59

Ongoing trend indicators: Favourable Mixed Unfavourable *Represents four-quarter average of actual results
Toronto Transit Commission │ CEO’s Report │ April 2019 8
Key performance indicator Description Latest measure Current Target Current
status Ongoing trend Page
PRESTO Fare Vending Machine
Percent available Feb 2019 94.2% 99.9% NA 60
PRESTO Self-serve Reload Machine
Percent available Feb 2019 98.6% 99.9% NA 61
PRESTO Fares and Transfer Machines
Percent available Feb 2019 98.6% 99.9% NA 62

Toronto Transit Commission │ CEO’s Report │ April 2019 9
I would like to welcome citizen Commissioner Julie Osborne to the TTC Board. Ms. Osborne’s appointment was confirmed by City Council on March 28 and she is scheduled to attend her first meeting on April 11. I also want to welcome back Vice-Chair Alan Heisey. Both their terms run until March 2023. The TTC is governed by a 10-member Board consisting of both City Councillors and members of the general public. Building on the TTC’s Corporate Plan 2018-2022, our Chief Customer Officer has initiated a Five-Year Service Plan and 10-Year Outlook, which will be undertaken in co-ordination with the City’s Mobility Lead Committee whose mandate is to strengthen Toronto’s mobility network. We have also started work on a Fare Strategy – a holistic and integrated approach that will guide fare policy, structure and collection for the next five years. A report on these initiatives is scheduled to be before the Board in June.
The Plan and Outlook will identify strategies and actions that the TTC will take to improve mobility so that residents from Toronto and outlying areas can access the many employment, educational and cultural opportunities our great city has to offer. We will undertake extensive communication and consultation involving our customers and stakeholders throughout the planning process. Between now and the end of 2019, we will work transparently and collaboratively to set a vision and identify opportunities to enhance mobility in Toronto – making the TTC more attractive for those who take the 1.7 million daily trips on the system. More details on the phases of work and deliverables will follow in the coming months. New fare rates took effect on April 1. Last January, the TTC Board approved the 2019 Operating Budget, including a fare increase, to protect and build on the service
improvements that we’ve made over the last several years, which are having real benefits for our customers. The TTC hasn’t increased fares since January 2017. Although it’s never a popular option, the average increase over the last two years was kept in line with the rate of inflation. The cash fare remains unchanged.
A new art installation was completed at Woodbine Station last month. Called Directions-Intersections-Connections, the artwork by artists Jennifer Marman and Daniel Borins now brightens
CEO’s commentary

Toronto Transit Commission │ CEO’s Report │ April 2019 10
the north-facing wall at bus platform level. The large-scale mural represents movement through the use of fins and vertical stripes of various colours. Customers can spot the mural from inside the station, from the bus platform stairwell or from buses entering the station. Check it out next time you are passing through Woodbine. In last month’s report we addressed a decrease in the reliability levels with our new accessible streetcars from Bombardier due to issues related to subsystems on the vehicle. At that time, we reported that various system modification programs by Bombardier and its subcontractors were being implemented to improve vehicle reliability, and that TTC staff was assisting Bombardier in finding solutions. On March 19, I met with the new president of Bombardier Transportation at TTC Head Office to discuss the reliability issues and he committed to come back in approximately one month with an expedited plan to address all outstanding items.
Last month, media reported about the TTC’s use of written cautions in lieu of tickets when discovering by-law offences on the system. Given the level of concern surrounding collection of data, and the possibility of disproportionate representation of racialized communities, I directed that we suspend use of the existing form, and expedite our ongoing efforts to revise and re-think the use of these forms. Warnings, and the discretion to issue such warnings in lieu of a ticket still exists for the benefit of our customers, but documentation of the encounter, along with retention policies governing that documentation will be the subject of our review. The April meeting agenda will include for Commissioners a report on the status of the transit realignment discussions with the Province. Recognizing the importance of the public’s engagement on this issue, City Council in late March directed the City Manager, in consultation
with me, to create and implement a public information campaign regarding its position on a transit upload. City Council directed public consultations deal with the following objectives: The accelerated implementation
of priority projects. The integration of transit
services across modes and agencies, such as the TTC, Metrolinx and other suburban 905 agencies.
The modernization and enhancement of the existing subway system, while ensuring the system is maintained in a state of good repair.
The continuity of safe, reliable service to all residents who depend on it for mobility and long-term sustainable, predictable funding model for the existing transit system and future transit needs.
Council also passed a motion requesting the Province, as part of ongoing discussions on transit in Toronto, publicly disclose a value-

Toronto Transit Commission │ CEO’s Report │ April 2019 11
for-money assessment of the projects outlined in the March 22, 2019 letter from the Special Advisor and Deputy Minister of Transportation to myself and the City Manager. Sunday, April 28 is National Day of Mourning. Companies and organizations across Canada, the TTC included, will remember our co-workers who were killed or injured on the job or suffered a work-related illness. We also hold in our hearts the families of our colleagues who have suffered by tragedies in the workplace. Across the TTC on Sunday the 28th, we will lower flags to half-mast as a tribute to those in our workforce who have perished or suffered serious injury. This is a day, also, to take a personal moment to reflect on the importance of safety at the TTC. Running a 24-hour transit system that carries the third largest ridership in North America requires a dedicated, committed and safety-first workforce.
On behalf of the TTC Executive, I would like to thank all the members of our joint management-union Health and Safety Committees. This group of committed workers plays a crucial role in our internal responsibility system, allowing workers and managers to equally participate in resolving health and safety concerns, and to enhance workplace safety on a continual basis. Our most important job at the TTC is to ensure the safety and security of our customers, employees and everyone around us.
Richard J. Leary Chief Executive Officer April 2019
Toronto Transit Commission │ CEO’s Report │ April 2019 12
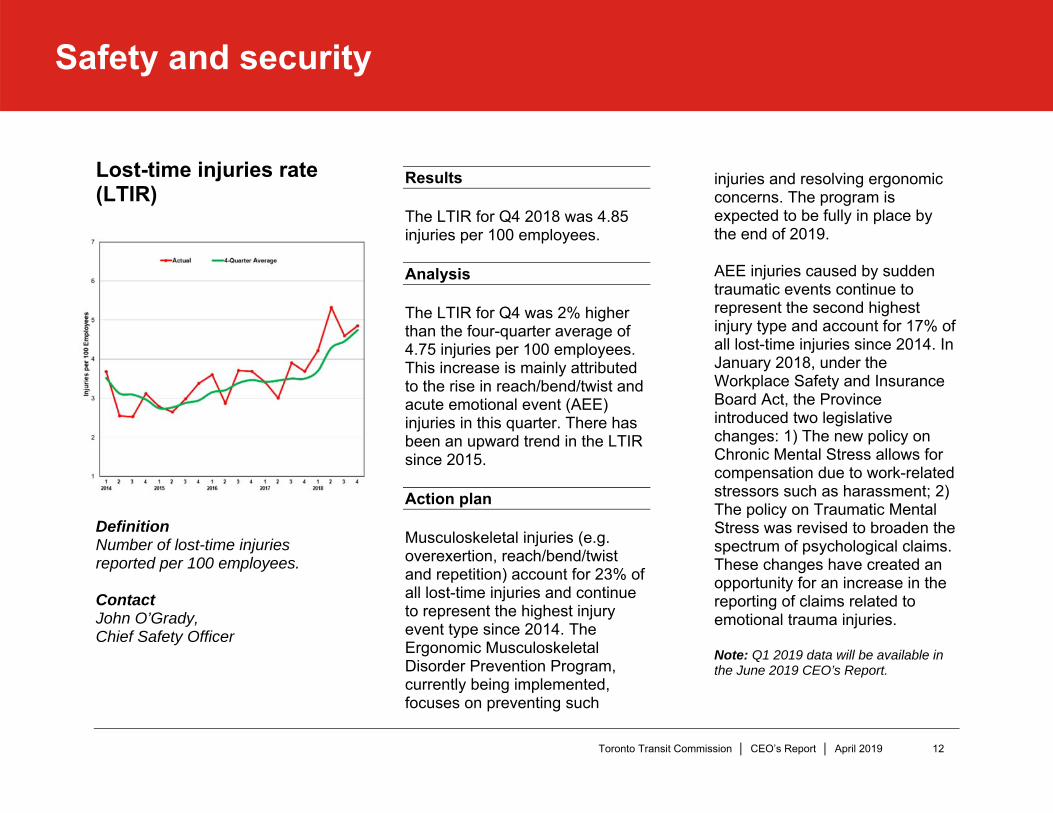
Lost-time injuries rate (LTIR)
Definition Number of lost-time injuries reported per 100 employees. Contact John O’Grady, Chief Safety Officer
Results
The LTIR for Q4 2018 was 4.85 injuries per 100 employees.
Analysis
The LTIR for Q4 was 2% higher than the four-quarter average of 4.75 injuries per 100 employees. This increase is mainly attributed to the rise in reach/bend/twist and acute emotional event (AEE) injuries in this quarter. There has been an upward trend in the LTIR since 2015.
Action plan
Musculoskeletal injuries (e.g. overexertion, reach/bend/twist and repetition) account for 23% of all lost-time injuries and continue to represent the highest injury event type since 2014. The Ergonomic Musculoskeletal Disorder Prevention Program, currently being implemented, focuses on preventing such
injuries and resolving ergonomic concerns. The program is expected to be fully in place by the end of 2019.
AEE injuries caused by sudden traumatic events continue to represent the second highest injury type and account for 17% of all lost-time injuries since 2014. In January 2018, under the Workplace Safety and Insurance Board Act, the Province introduced two legislative changes: 1) The new policy on Chronic Mental Stress allows for compensation due to work-related stressors such as harassment; 2) The policy on Traumatic Mental Stress was revised to broaden the spectrum of psychological claims. These changes have created an opportunity for an increase in the reporting of claims related to emotional trauma injuries.
Note: Q1 2019 data will be available in the June 2019 CEO’s Report.
Safety and security
Toronto Transit Commission │ CEO’s Report │ April 2019 13
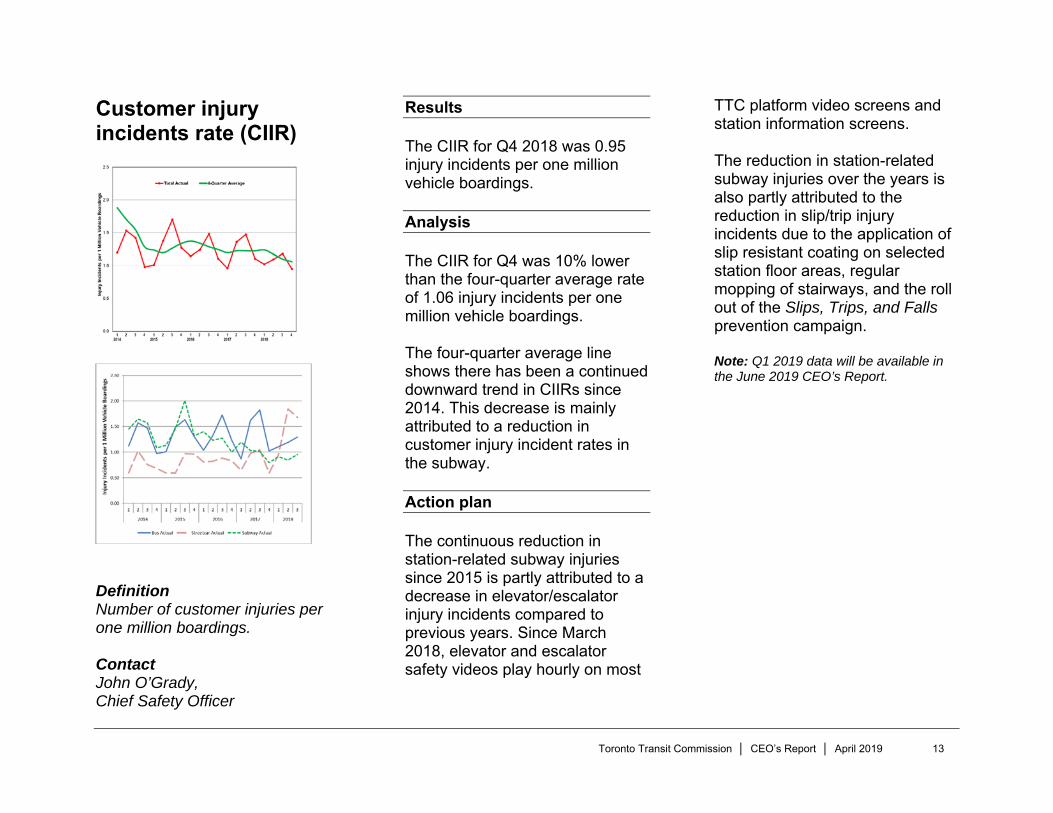
Customer injury incidents rate (CIIR)
Definition Number of customer injuries per one million boardings. Contact John O’Grady, Chief Safety Officer
Results
The CIIR for Q4 2018 was 0.95 injury incidents per one million vehicle boardings.
Analysis
The CIIR for Q4 was 10% lower than the four-quarter average rate of 1.06 injury incidents per one million vehicle boardings.
The four-quarter average line shows there has been a continued downward trend in CIIRs since 2014. This decrease is mainly attributed to a reduction in customer injury incident rates in the subway.
Action plan
The continuous reduction in station-related subway injuries since 2015 is partly attributed to a decrease in elevator/escalator injury incidents compared to previous years. Since March 2018, elevator and escalator safety videos play hourly on most
TTC platform video screens and station information screens.
The reduction in station-related subway injuries over the years is also partly attributed to the reduction in slip/trip injury incidents due to the application of slip resistant coating on selected station floor areas, regular mopping of stairways, and the roll out of the Slips, Trips, and Falls prevention campaign.
Note: Q1 2019 data will be available in the June 2019 CEO’s Report.

Toronto Transit Commission │ CEO’s Report │ April 2019 14
Offences against customers
Definition Number of offences against customers per one million vehicle boardings. Contact Collie Greenwood, Chief Service Officer
Results
Total offences against customers decreased in Q4 2018 to 0.64 offences per one million vehicle boardings. The current rate is 16.4% higher than the corresponding rate of 0.55 in Q4 2017.
Analysis
An increase in the Assaults category was observed in Q4. A slight increase in the Customer thefts and Other categories, as well as decreases in the Robberies and Sexual assaults categories were observed compared to the previous quarter.
Action plan
Transit Enforcement Special Constables continue to engage with the public to provide a visible presence across the system with a specific focus on areas identified as being high-risk for offences.

Toronto Transit Commission │ CEO’s Report │ April 2019 15
Offences against staff
Definition Number of offences per 100 employees. Contact Collie Greenwood, Chief Service Officer
Results
Total offences against staff increased in Q4 2018 to 4.11 offences per 100 employees. The current rate is 23.8% higher than the corresponding rate of 3.32 in Q4 2017. A slight decrease was observed in the moving annual rate of offences against staff, with Q4 2018 being 3.88, lower than the corresponding moving annual rate of 4.08 in Q4 2017.
Analysis
Increases were observed in all crime types - Assaults, Threats and Other compared to Q3 2018.
Action plan
Transit Enforcement Special Constables will continue to increase support to surface personnel via the BUS STOP (Bringing Uniform Support to Surface Operating Personnel) initiative, and conduct special details and initiatives to assist with ongoing and emerging issues identified by staff across the system.

Toronto Transit Commission │ CEO’s Report │ April 2019 16
Fitness for duty
Contact Megan MacRae, Executive Director of Human Resources
A total of 82 employees were non-compliant or refused to test under the random program from May 8, 2017 to December 31, 2018. During the same period, 4,299 employees (98.1%) tested under the random program were compliant. Data reflects the period through the end of Q4 2018.
The data shows the number of random tests conducted on designated TTC employees (safety sensitive, specified management, and designated executive) in the specified period of time. (Data is provided by DriverCheck Inc., the TTC’s third party provider)
Note: The next quarterly update will be provided in the May 2019 CEO’s Report.
2018 2017 Total * %Compliant Tests
2672 1627 4299 98.1%Unionized Employee Non‐Compliant Test Results (Drug, alcohol, refusal)
50 29 79 1.8%Staff Employee (non‐unionized) Non‐Compliant Test Results (Drug, alcohol, refusal) 0 3 3 0.1%Total 2722 1659 4381 100.0%
Category 2018 2017 Total PercentageDrug 47 24 71 86.6%Alcohol 2 5 7 8.5%Refusals 1 3 4 4.9%Total 50 32 82 100.0%
Random Testing Summary ‐ Q4 2018
Non‐Compliance Breakdown

Toronto Transit Commission │ CEO’s Report │ April 2019 17
Ridership
Definition Average number of journeys per week, including paid and free journeys (e.g. two-hour transfers and children 12 and under). A journey with transfers is counted as one journey. The total is derived from cash, tickets and token counts, Metropass and PRESTO data, diary studies and ridership analytics.
Contact Dan Wright, Chief Financial Officer
Results
Period 2 (February 3 to March 2, 2019) revenue ridership was 39.4 million or 9.9 million passengers per week. This was approximately 2.1 million (5.0%) below the budget of 41.5 million rides and 1.7 million (4.1%) below the same period last year.
Year-to-date (YTD) ridership at the end of period 2 was 85.2 million, 2.7 million (3.0%) below budget and 2.1 million (2.4%) below the comparable period in 2018.
Analysis
Ridership during the first two periods of 2019 appears to have been affected by two factors compared to early 2018: severe weather and higher PRESTO adoption.
Ridership is affected by heavy snow and severe cold temperatures. Our customers experienced more of both this winter, in particular five severe snow storms compared to none
during the comparable period last year. The data is still being studied, but it appears the more typical weather in March this year helped to reverse that trend with slightly higher ridership compared to last year.
Higher PRESTO adoption appears to have affected measured ridership in two ways. First, we now have more precise ridership data compared to counting tokens and weighing paper tickets. Second, about 80,000 or 25% of our monthly pass customers have converted to PRESTO pay-as-you e-purse, likely to take advantage of the two-hour transfer and for some the TTC/GO discounted co-fare. This would affect measured ridership to the extent that these customers ride less often than the assumed monthly average of 71 rides per adult monthly pass.
Compared to previous years, more frequent weekend subway closures has adversely impacted weekend ridership and the TTC may have also experienced an increase in fare
Ridership

Toronto Transit Commission │ CEO’s Report │ April 2019 18
evasion during the PRESTO implementation period.
Action plan
To re-establish sustained ridership growth, the Ridership Growth Strategy, an extension of the 2018-2022 TTC Corporate Plan, is being implemented with three main objectives: (1) Retain current customers; (2) Increase transit rides per current customer; and (3) Attract new customers to the system. With the discontinuation of the monthly Metropass in December 2018, during 2019 we plan to increase the monitoring of fare payment with PRESTO or otherwise via proof-of-payment.

Toronto Transit Commission │ CEO’s Report │ April 2019 19
PRESTO ridership
Definition Average number of journeys per week using PRESTO fare media, including PRESTO taps and PRESTO pass rides. Note: PRESTO ridership is included in TTC ridership totals. Contact Dan Wright, Chief Financial Officer
Results
Period 2 (February 3 to March 2, 2019) PRESTO ridership was 31.7 million or 7.9 million passengers per week. This was approximately 0.7 million (2.0%) below the budget and 22.2 million (233%) higher than February 2018 ridership of 9.5 million.
Year-to-date ridership at the end of period 2 was 67.0 million, 0.9 million (1.3%) below budget but up 46.8 million (232.1%) above the comparable period in 2018.
Analysis
Substantial progress has been made over last year with numerous fare products now available on PRESTO. Fare card readers have been installed on all buses and streetcars and PRESTO fare gates and fare vending machines at all subway entrances. Furthermore, the retirement of the legacy Metropass on December 31, 2018 encouraged a significant move of customers to PRESTO in January 2019, driving the increase of over 160,000 unique PRESTO card using the system in
January, resulting in an increase in PRESTO adoption from 45.5% in December 2018 to 77.1% in January 2019. An additional increase of 3,000 unique PRESTO cards using the system in February drove the PRESTO adoption rate slightly higher to approximately 80% in February 2019, using the current calculation methodology.
We are in discussions with Metrolinx about adoption rate calculation given measurement uncertainties related in particular to two-hour transfer and PRESTO monthly pass ridership. Regardless, PRESTO adoption has increased substantial over the past year, from about one-quarter of ridership in February 2018 to about three-quarters now and it has become the predominant TTC fare payment method.
Action plan
PRESTO adoption will continue to increase with the phasing out of legacy fare media, more fare options made available under PRESTO and a number of marketing and communication initiatives aimed at encouraging PRESTO adoption. The

Toronto Transit Commission │ CEO’s Report │ April 2019 20
PRESTO adoption rate is expected to continue to increase significantly during 2019, reaching approximately 95% once legacy fare media are no longer sold.

Toronto Transit Commission │ CEO’s Report │ April 2019 21
Wheel-Trans ridership
Definition Average number of journeys per week using both Wheel-Trans dedicated services and contracted services. Note: Wheel-Trans ridership is not included in the TTC ridership totals. Contact Dan Wright, Chief Financial Officer
Results Ridership in period 2 (February 3 to March 2, 2019) was 288,438 (or 72,100 passengers per week). This figure was 8.8% lower than the budgeted 79,100 customers per week. In terms of year-over-year growth, the February ridership of 288,438 is 8.3% lower compared to the same period in 2018.
Year-to-date ridership at the end of period 2 was 58,800 (8.7%) below budget and 60,900 (8.9%) below the comparable period in 2018.
Analysis
Wheel-Trans implemented its Severe Weather Contingency Plan for 14 of the 28 service days of Period 2. During this time, we did not offer same day trips to customers and they are asked to consider cancelling all non-essential trips. There were 48,000 more trips cancelled for Period 2 when compared to the same period of the previous year. This higher than normal cancellation rate experienced in 2019 has reduced our carried trips. If all scheduled trips were completed with the normal
cancellation rate, we would have experienced a positive growth rate of 7 percent for Period 2.
Action plan
We will continue to monitor the cancellation rate to determine the correlation of cancelled trips with adverse weather conditions. We are also working on the data collection of fully diverted family of services trips by customers to analyse the long term impact on ridership over and above the shorter trips expected through family of services. We have put in place several changes to the scheduling and dispatching software which will make the on-line web-booking process easier for our customers to book trips. A follow-up survey will be completed in Q2 2019 regarding diverted trips by customers in order to incorporate this information into the ridership trend analysis and understand the impact of full diversions on the overall ridership.
Toronto Transit Commission │ CEO’s Report │ April 2019 22
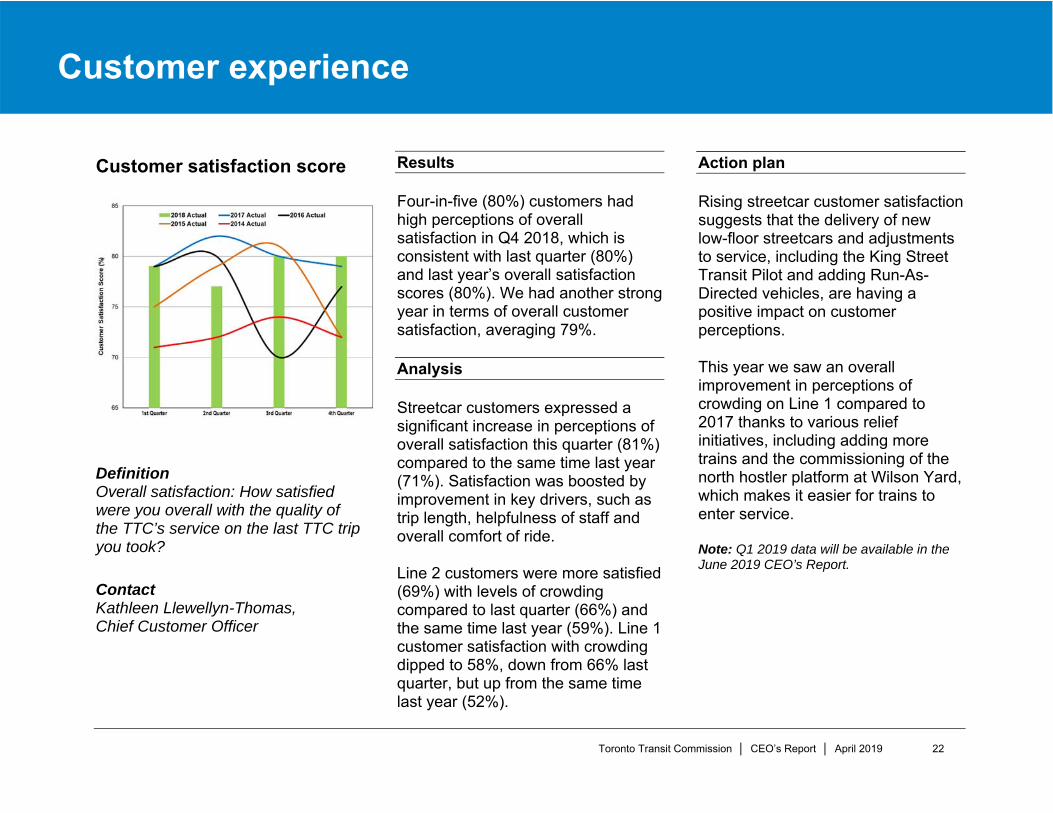
Customer satisfaction score
Definition Overall satisfaction: How satisfied were you overall with the quality of the TTC’s service on the last TTC trip you took? Contact Kathleen Llewellyn-Thomas, Chief Customer Officer
Results
Four-in-five (80%) customers had high perceptions of overall satisfaction in Q4 2018, which is consistent with last quarter (80%) and last year’s overall satisfaction scores (80%). We had another strong year in terms of overall customer satisfaction, averaging 79%.
Analysis
Streetcar customers expressed a significant increase in perceptions of overall satisfaction this quarter (81%) compared to the same time last year (71%). Satisfaction was boosted by improvement in key drivers, such as trip length, helpfulness of staff and overall comfort of ride.
Line 2 customers were more satisfied (69%) with levels of crowding compared to last quarter (66%) and the same time last year (59%). Line 1 customer satisfaction with crowding dipped to 58%, down from 66% last quarter, but up from the same time last year (52%).
Action plan
Rising streetcar customer satisfaction suggests that the delivery of new low-floor streetcars and adjustments to service, including the King Street Transit Pilot and adding Run-As-Directed vehicles, are having a positive impact on customer perceptions.
This year we saw an overall improvement in perceptions of crowding on Line 1 compared to 2017 thanks to various relief initiatives, including adding more trains and the commissioning of the north hostler platform at Wilson Yard, which makes it easier for trains to enter service.
Note: Q1 2019 data will be available in the June 2019 CEO’s Report.
Customer experience

Toronto Transit Commission │ CEO’s Report │ April 2019 23
Subway services Line 1 (Finch and Vaughan Metropolitan Centre terminal stations): On-time performance (OTP)
Definition OTP measures the headway adherence of all service trains at end terminals. Data represents Monday-to-Friday service between 6 a.m. and 2 a.m. To be on time a train must be within 1.5 times of its scheduled headway. Contact James Ross, Chief Operating Officer
Results
In February, performance increased from 87.7% to 90.9% at Finch and from 89.8% to 90.0% at Vaughan. The average OTP on Line 1 was 90.5%, meeting the target of 90%.
Analysis
Less severe weather in February resulted in improved performance. Automatic Train Control (ATC) on the north Spadina portion of Line 1 has removed many potential points of failure by eliminating the need for trainstops, a mechanism used to stop trains that go through a red signal.
Action plan
As we continue to roll out ATC on Line 1, winter weather delays caused by trainstops will be eliminated, further improving resilience to severe weather.
A renewed focus on crew changes at terminals is expected to improve train departures.
Toronto Transit Commission │ CEO’s Report │ April 2019 24
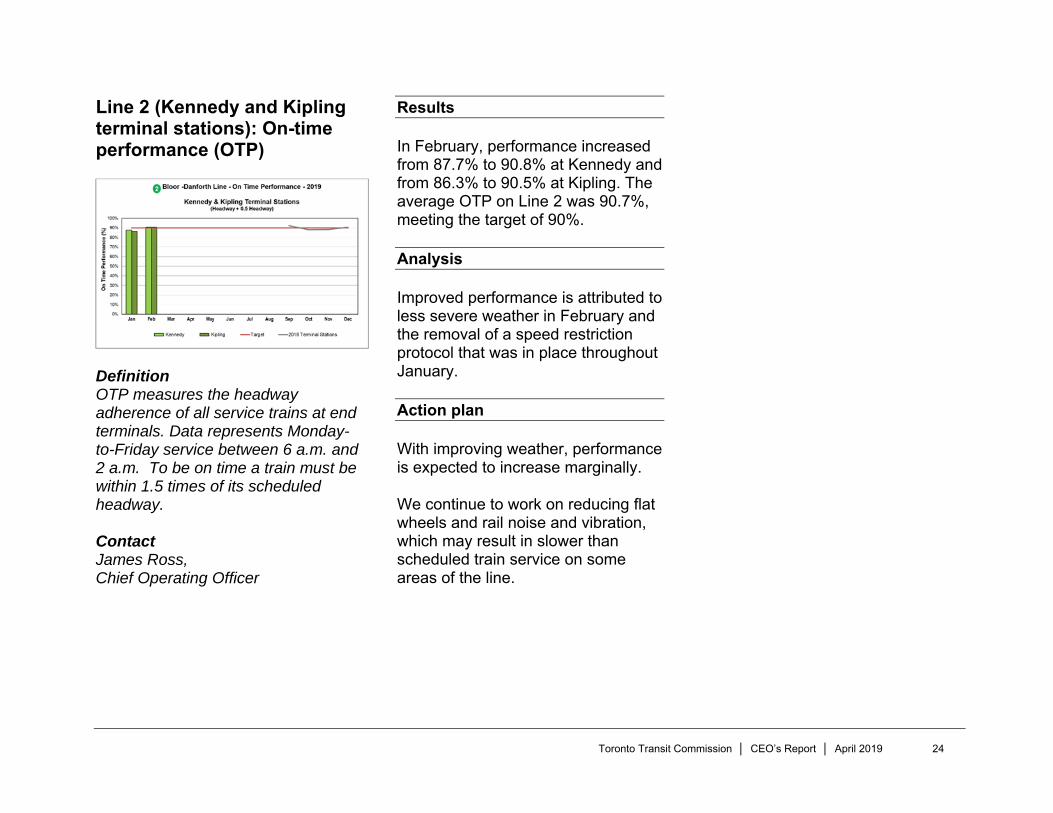
Line 2 (Kennedy and Kipling terminal stations): On-time performance (OTP)
Definition OTP measures the headway adherence of all service trains at end terminals. Data represents Monday-to-Friday service between 6 a.m. and 2 a.m. To be on time a train must be within 1.5 times of its scheduled headway. Contact James Ross, Chief Operating Officer
Results
In February, performance increased from 87.7% to 90.8% at Kennedy and from 86.3% to 90.5% at Kipling. The average OTP on Line 2 was 90.7%, meeting the target of 90%.
Analysis
Improved performance is attributed to less severe weather in February and the removal of a speed restriction protocol that was in place throughout January.
Action plan
With improving weather, performance is expected to increase marginally.
We continue to work on reducing flat wheels and rail noise and vibration, which may result in slower than scheduled train service on some areas of the line.

Toronto Transit Commission │ CEO’s Report │ April 2019 25
Line 3 (Kennedy and McCowan terminal stations): On-time performance (OTP)
Definition OTP measures the headway adherence of all service trains at end terminals. Data represents Monday-to-Friday service between 6 a.m. and 2 a.m. To be on time a train must be within 1.5 times of its scheduled headway. Contact James Ross, Chief Operating Officer
Results
In February, performance on Line 3 decreased to 91.8% from 93.4% at Kennedy and to 91.9% from 94.7% at McCowan. The average OTP on the line was 91.8%, meeting the target of 90%.
Analysis
Although year-to-date delay incidents are down from 2018 by 22.8%, inclement weather continues to challenge Line 3 operations. Service was suspended on the line for over four hours on February 12.
Action plan
In the coming months, this line will benefit from planned closures so that our crews can work on track, signalling, and improving our resilience to inclement weather, all of which will help to increase service reliability.

Toronto Transit Commission │ CEO’s Report │ April 2019 26
Line 4 (Don Mills and Sheppard terminal stations): On-time performance (OTP)
Definition OTP measures the headway adherence of all service trains at end terminals. Data represents Monday-to-Friday service between 6:00am and 2:00am. To be on time a train must be within 1.5 times of its scheduled headway. Contact James Ross, Chief Operating Officer
Results
Results for February were slightly lower at both terminals on Line 4, with average on-time departures across the line at 98.6%. The OTP target is 90%.
Analysis
With relatively few delay incidents, a consistent service throughout the day, and a shorter distance per round trip, this line continually performs well.
Action plan
The line continues to be managed in the same effective manner, providing consistent service to customers.

Toronto Transit Commission │ CEO’s Report │ April 2019 27
Line 1: Capacity
Definition Total number of trains that travelled through 12 key sampling points during a.m. and p.m. peak as a percentage of trains scheduled. Data is based on Monday-to-Friday service. Peak periods: 6 a.m. to 9 a.m. and 3 p.m. to 7 p.m. Contact James Ross, Chief Operating Officer
Results
Improvements in capacity were realized during both the a.m. and p.m. peaks on Line 1, achieving 92.7% in the a.m. and 98.4% in the p.m. Average peak period capacity delivered was 95.1%, failing to meet our target of 96%. Capacity delivered in the peak-of-the-peak at our interchanges was above target.
Analysis
Fewer issues related to severe weather resulted in improved service in February.
Action plan
Automatic Train Control operation is planned to be extended further down the line in Q2, increasing reliability and eliminating many of the issues that cause delayed service and poor capacity delivered in peak periods.

Toronto Transit Commission │ CEO’s Report │ April 2019 28
Line 2: Capacity
Definition Total number of trains that travelled through 10 key sampling points during a.m. and p.m. peak as a percentage of trains scheduled. Data based on Monday-to-Friday service. Peak periods: 6 a.m. to 9 a.m. and 3 p.m. to 7 p.m.
Note: Capacity delivered is the actual train count divided by the scheduled train count for each hour at sampled locations. Data is based on weekday service from Monday to Friday.
Contact James Ross, Chief Operating Officer
Results
Improvements in capacity were realized during both a.m. and p.m. peaks on Line 2, achieving 94.9% in the a.m. and 95.6% in the p.m. Average peak period capacity delivered was 95.2%, failing to meet our target of 96%.
Analysis
Fewer issues related to adverse weather resulted in improved service in February.
Action plan
Run-As-Directed trains, used successfully on Line 1, have been piloted on Line 2 and will be added for the p.m. peak in the coming months. This will help to maintain capacity when delay incidents occur and increase capacity during normal operations.

Toronto Transit Commission │ CEO’s Report │ April 2019 29
Line 3: Capacity
Definition Total number of trains that travelled through two key sampling points during a.m. and p.m. peak as a percentage of trains scheduled. Data is based on Monday to Friday service. Peak periods: 6 a.m. to 9 a.m. and 3 p.m. to 7 p.m. Contact James Ross, Chief Operating Officer
Results
Improvements in capacity were realized during both the a.m. and p.m. peaks on Line 3, achieving 95.9% in the a.m. and 92.1% in the p.m. Average peak period capacity delivered was 93.8%, failing to meet our target of 96%, but up significantly from 84% in January.
Analysis
Inclement weather with a combination of snow and freezing rain resulted in service being suspended on the line for over four hours on February 12. Aside from the impact of weather on the line's performance, year-to-date delay incidents are down from 2018 by 22.8%.
Action plan
Several workstreams are in progress in both vehicle and infrastructure reliability, including work that should improve the line's resilience in inclement weather.

Toronto Transit Commission │ CEO’s Report │ April 2019 30
Line 4: Capacity
Definition Total number of trains that travelled through two key sampling points during a.m. and p.m. peak as a percentage of trains scheduled. Data is based on Monday to Friday service. Peak periods: 6 a.m. to 9 a.m. and 3 p.m. to 7 p.m. Contact James Ross, Chief Operating Officer
Results
Line 4 continues to exceed the capacity target and remains at 100%.
Analysis
There was only one significant delay during peak service, where service was held for 14 minutes to attend to an ill customer. Overall, year-to-date delay incidents are down by 7.1% from this time last year.
Action plan
Line 4 continues to run as scheduled and consistently delivers at or near 100% capacity.

Toronto Transit Commission │ CEO’s Report │ April 2019 31
Subway: Weekly service hours
Definition Calculated duration of time that all revenue trains are in service. Contact Kathleen Llewellyn-Thomas, Chief Customer Officer
Results
In the January 2019 Board Period, 10,978 subway weekly hours were budgeted for service, while 11,069 subway weekly hours were scheduled to operate. This represents a variance of 0.83%.
Of the 11,069 subway weekly hours scheduled to operate, 11,411 weekly hours were actually delivered, which represents a variance of 3.09%.
Analysis
The variance from actual to scheduled is a result of extreme cold temperatures and high winds.
Action Plan
No action required at this time.

Toronto Transit Commission │ CEO’s Report │ April 2019 32
Subway T1 train: Mean distance between failures (MDBF)
Definition Total kilometres travelled in month compared to the number of rolling stock equipment incidents resulting in delays of five minutes or more. Includes all seven days of service. Contact Rich Wong, Chief Vehicle Officer
Results
The MDBF in February was 361,185 kilometres, exceeding the target of 300,000 kilometres and the February 2018 total of 288,961 kilometres. Analysis
In February, there were eight delay incidents greater than or equal to five minutes. The top offending system was the passenger door system with four delay incidents greater than or equal to five minutes. This was followed by the brake and body systems, each with two delay incidents. Action plan
The four passenger door system-related failures were a result of: Out of adjusted door guides and door gap, defective door cylinder and a loose door lock assembly. The door guides and door gap were adjusted back to specifications and the doors were tested to be working well. The door cylinder was replaced and the loose door lock assembly was secured. Both doors were tested multiple times, and are now
functioning properly. A program implemented in 2018 to install remanufactured door lock assemblies is helping restore reliability to the passenger door system. The brake-related incidents were a result of a faulty no motion relay on the friction brake electronic control unit (FBECU) and a loose connection on the active cab relay (ACR). The faulty no motion relay has since been replaced and car-tested positively. The loose connection on the ACR has been secured with no further car issues. The body related incidents were both related to faulty cab seats. The airline on one of the cab seats was replaced, while the other faulty cab seat was returned to the vendor for warranty. Both cars have repaired/replaced cab seats.

Toronto Transit Commission │ CEO’s Report │ April 2019 33
Subway TR train: Mean distance between failures (MDBF)
Definition Total kilometres travelled in month compared to the number of rolling stock equipment incidents resulting in delays of five minutes or more. Includes all seven days of service. Contact Rich Wong, Chief Vehicle Officer
Results
The MDBF in February was 804,978 kilometres, exceeding the target of 600,000 kilometres and the February 2018 total of 394,526.
Analysis
In February there were five delay incidents. The top offending system was the passenger door system with two delay incidents. This was followed by the traction motor, trainline and warning alarm systems, each with one delay incident greater than or equal to five minutes.
Action plan
The two passenger door-related incidents were due to a defective S2 door switch and a loose door coupling shaft. The S2 switch has been replaced, and the door coupling shaft has been repositioned properly and doors were tested to be fully operational. The traction motor incident was due to a broken high speed coupler. This high speed coupler has been
replaced, and train has been tested working positively. The trainline-related incident was a result of the train network not being fully operational. The train network was reset. The issue is being monitored closely due to its intermittent nature. The warning alarm incident was a result of the bell arm making contact to the bell. The bell arm was adjusted, and the bell tested positively.

Toronto Transit Commission │ CEO’s Report │ April 2019 34
Subway: Service availability
Definition Daily average number of trains put into service (including RADs) compared to the number of trains scheduled for the a.m. peak period. Data represents Monday to Friday only. Holidays excluded. Contact Rich Wong, Chief Vehicle Officer
Results
Vehicle availability in February was 100%.
Analysis
We continue to meet the service requirements meeting the target of 100% vehicle availability. All vehicles were available for service when required.
Action plan
Continue with the delivery of safe, reliable and clean vehicles to service on all subway lines.

Toronto Transit Commission │ CEO’s Report │ April 2019 35
Subway: Vehicle cleanliness
Definition Average results of third party audit conducted each quarter. Average of “prior” “mid-day” and “end of service” results. Audits conducted weekdays only, excluding holidays. Contact Rich Wong, Chief Vehicle Officer
Results
The average rating of 92.7% in Q4 2018 represents a slight increase of 0.3% from Q4 2017. It is above the target of 90%. We have recorded a score of greater than 90% since Q4 2016.
Analysis
Areas of strength in vehicle cleanliness across all fleets and lines were the ceilings, mandatory decals, lights, passenger seat conditions and walls. Major factors affecting the quarter-over-quarter cleanliness scores in Q4 2018, were the floors, the exterior cleanliness of the vehicle and the windows. The scores were lower than the previous quarter due to the winter weather. Action plan
Exterior vehicle washes were limited due to winter weather conditions in Q4 2018. Focused exterior programs will be picked up in the spring and summer months of 2019. The floors are addressed every 14 days during the floor wash cycle.

Toronto Transit Commission │ CEO’s Report │ April 2019 36
Streetcar: On-time performance (OTP)
Definition On-time performance measures vehicle departures from end terminals. Vehicles are considered on time if they depart within 59 seconds earlier or five minutes later than their scheduled departure time. Includes all seven days of service. Night routes are excluded. Contact Collie Greenwood, Chief Service Officer
Results OTP in February was 52.5%, a decrease compared to January (57.8%) and an increase from the same time last year (50.8%).
Analysis
All four weeks of the period were negatively impacted by inclement weather. In particular, on February 6, the network was impacted by a significant ice storm. For the entire day, streetcar service was reallocated to four core routings in order to concentrate service and maintain an ice-free overhead power supply system for the fleet. During this day, the entire network operated independent of schedule. Significant snowfall on February 27 also negatively impacted network performance. Planned infrastructure repair projects on the 512 St Clair route (February 16-17) and the 509 Harbourfront route (March 2) also impacted performance in that shuttle buses operated through one or both end terminals on a headway basis. The 505 Dundas route was the worst performing route of the period, largely due to ongoing construction
work along the route. On a positive note, the 512 St Clair route benefitted from a new weekday schedule that was introduced mid-month and significantly helped enhance the route's performance. During the last two weeks of the period, with the new weekday schedule, the route achieved just over 81% on-time departures from end terminals.
Action Plan The new process of determining schedule times, which has proven effective on the 512 St Clair route, will be delayed due to the King-Queen-Roncesvalles intersection project postponement. However, additional routes will see this approach to scheduling implemented as soon as the May Board Period.

Toronto Transit Commission │ CEO’s Report │ April 2019 37
Streetcar: Short turns
Definition Total short turns per month. Includes all seven days of service, excluding night routes. Contact Collie Greenwood, Chief Service Officer
Results There were 1,171 short turns in February, an increase compared to January (1,153) and a decrease from the same time last year (1,221).
Analysis
February figures were up slightly over the January 2019 figures, with short turn totals being driven by adverse weather conditions through much of February. With major snow falls on February 12 and 27, a significant amount of snow piled up in the curb lanes of many of the streetcar routes. This excessive snow led to a higher than usual amount of streetcars being delayed by parked vehicles blocking the streetcar tracks. Short turns were required so as to not trap additional streetcars. Extreme weather conditions also required extra care and attention by our operators in terms of travel speeds and observing/checking switches, which increased the need to short turn streetcars. The 501 Queen route made up almost one-third of the period total, with the 504 King route coming in at second. The 512 St
Clair route did show an improvement in the second half of the period, after the new weekday schedule was implemented. Once the revised weekday schedule was implemented on this route, the number of short turns dropped to less than half of that experienced during the first two weeks of the period.
Action plan
Ongoing route management efforts to use extra and Run-As-Directed vehicles strategically in order to decrease short turns will continue. Special attention will be paid to the 501 Queen route, with efforts made to limit the number of short turns on the route. Further, the upcoming planned schedule improvements will also help keep short turn figures below target.
Toronto Transit Commission │ CEO’s Report │ April 2019 38
Streetcar: Weekly service hours
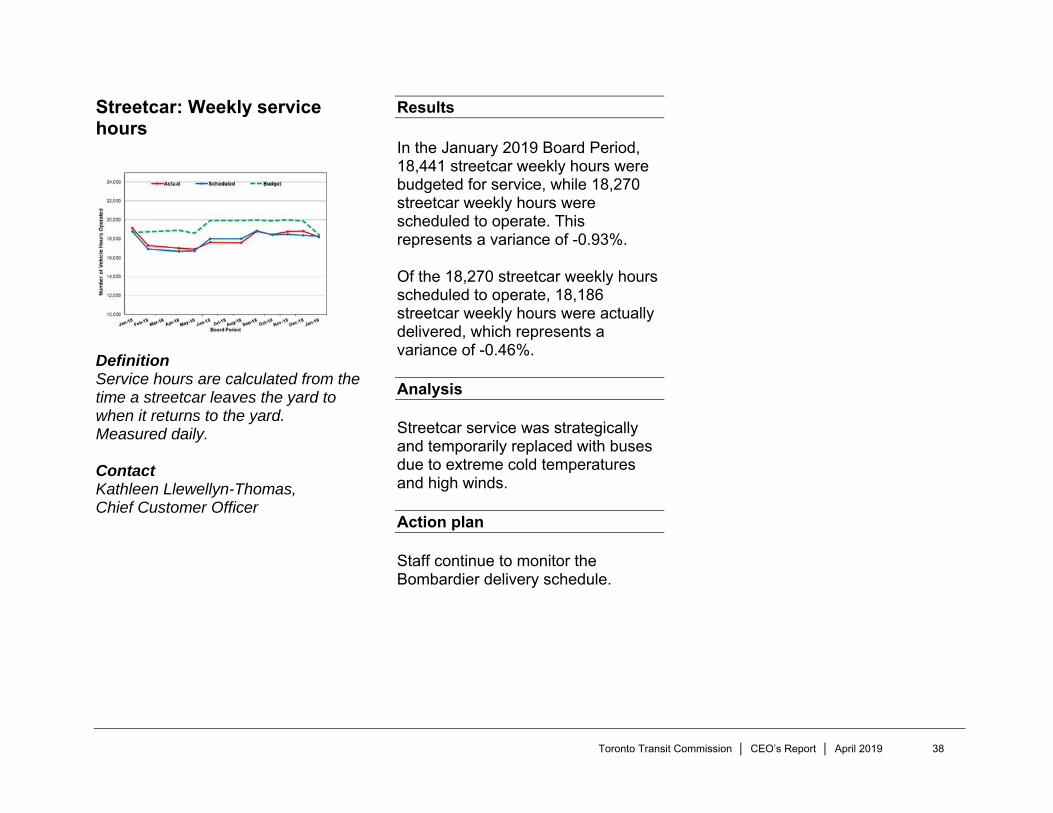
Definition Service hours are calculated from the time a streetcar leaves the yard to when it returns to the yard. Measured daily. Contact Kathleen Llewellyn-Thomas, Chief Customer Officer
Results
In the January 2019 Board Period, 18,441 streetcar weekly hours were budgeted for service, while 18,270 streetcar weekly hours were scheduled to operate. This represents a variance of -0.93%.
Of the 18,270 streetcar weekly hours scheduled to operate, 18,186 streetcar weekly hours were actually delivered, which represents a variance of -0.46%.
Analysis
Streetcar service was strategically and temporarily replaced with buses due to extreme cold temperatures and high winds.
Action plan
Staff continue to monitor the Bombardier delivery schedule.

Toronto Transit Commission │ CEO’s Report │ April 2019 39
LFLRV streetcar: Mean distance between failures (MDBF)
Definition Total kilometres travelled by the Low-Floor Light Rail Vehicle (LFLRV) compared to the number of mechanical incidents resulting in delays of five minutes or more. Includes all seven days of service. A threshold of 35,000 km was established to reflect the manufacturer’s obligations for reliability. Contact Rich Wong, Chief Vehicle Officer
Results
The MDBF for the LFLRV Fleet in February 2019 was 13,304 kilometres. This is a decrease of 5,549 kilometres when compared to February 2018 and an increase of 5,727 kilometres compared to January 2019.
The LFLRV MDBF remains below the 35,000 kilometre target.
Analysis
Reliability improved due to a reduction in the brake, door and communication systems equipment-related failures.
Action plan
Bombardier is aware of the failures affecting the LFLRV fleet and working to identify and implement solutions. Modification programs are underway to correct the brake and door system issues. TTC staff will continue to work with Bombardier to resolve other issues, including communication and train and cab control system failures.
Streetcar decommissioning schedule
Year CLRV ALRV Total2015 7 4 112016 16 4 202017 30 0 302018 28 33 612019 113 10 123Total 194 51 245

Toronto Transit Commission │ CEO’s Report │ April 2019 40
CLRV streetcar: Mean distance between failures (MDBF)
Definition Total kilometres travelled by the Canadian Light Rail Vehicle (CLRV) compared to the number of mechanical incidents resulting in delays of five minutes or more. Includes all seven days of service. Contact Rich Wong, Chief Vehicle Officer
Results
The MDBF for the CLRV Fleet in February was 3,114 kilometres. This was an increase of 354 kilometres from the same period last year and a decrease of 533 kilometers from last month. The MDBF continues to remain below the target of 6,000 kilometres
Analysis
The reliability of the CLRV fleet decreased in February due to a rise in sander, propulsion and disc brake-related equipment failures. The extreme cold temperatures resulted in frozen sanders and negatively impacted deteriorated electrical connections in the propulsion system
Action plan
We continue to decommission unreliable CLRV vehicles to improve overall reliability.
Toronto Transit Commission │ CEO’s Report │ April 2019 41
ALRV streetcar: Mean distance between failures (MDBF)
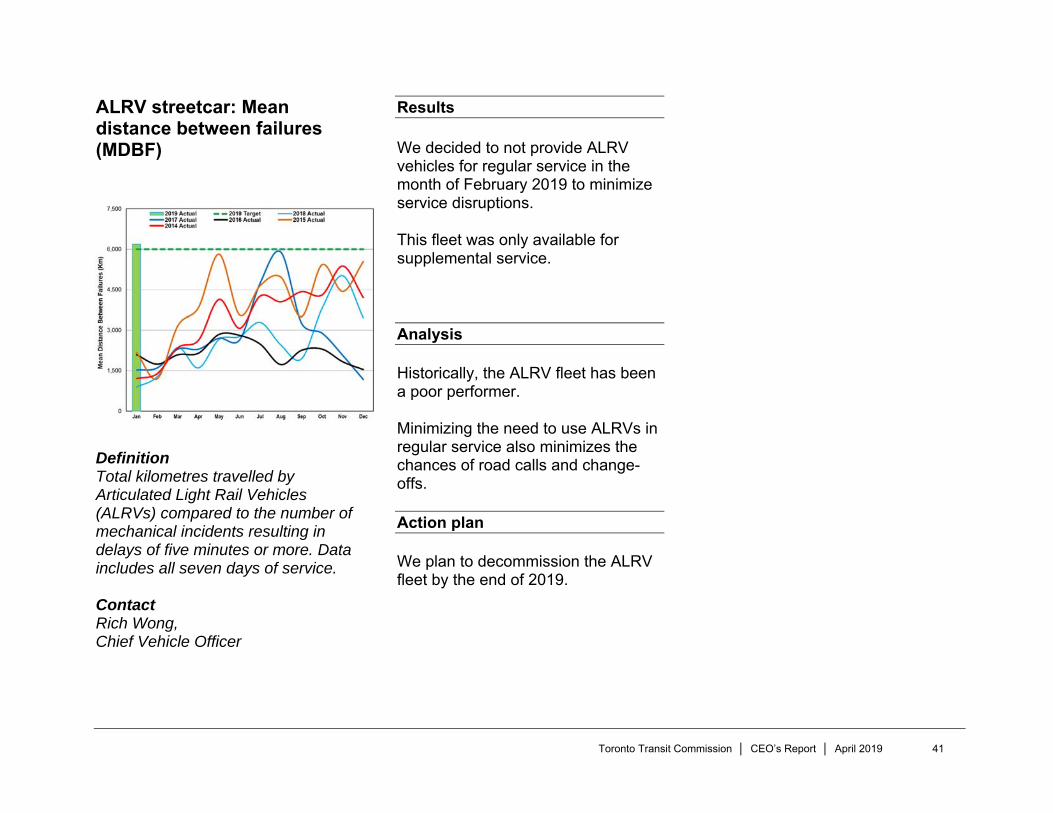
Definition Total kilometres travelled by Articulated Light Rail Vehicles (ALRVs) compared to the number of mechanical incidents resulting in delays of five minutes or more. Data includes all seven days of service. Contact Rich Wong, Chief Vehicle Officer
Results
We decided to not provide ALRV vehicles for regular service in the month of February 2019 to minimize service disruptions.
This fleet was only available for supplemental service.
Analysis
Historically, the ALRV fleet has been a poor performer.
Minimizing the need to use ALRVs in regular service also minimizes the chances of road calls and change-offs.
Action plan
We plan to decommission the ALRV fleet by the end of 2019.

Toronto Transit Commission │ CEO’s Report │ April 2019 42
Streetcar: Road calls and change offs (RCCOs)
Definition Average daily number of vehicle-equipment failures requiring a road call for service repair or a change off to a repair facility for a replacement vehicle. Includes Monday to Friday only. Contact Rich Wong Chief Vehicle Officer
Results
The target for the maximum number of RCCOs is 1.5% of peak daily service. In February, 6.9 % (or 11 of 158 vehicles) of the peak daily service, including Run-As-Directed vehicles, resulted in a RCCO. This was a decrease of 1.0% from the previous month.
Analysis
The decrease in RCCOs can be attributed to a reduction of disc brake-related failures on the LFLRV fleet.
Action plan
Pre-service inspection and prevention will continue to reduce the number of RCCOs. We are identifying vehicle/infrastructure areas of concern in order to resolve potential problems. TTC staff and Bombardier are also aware of the component reliability issues and continue to investigate the problems to determine a resolution. Decommissioning of unreliable
legacy fleets will help to reduce the number of RCCOs.

Toronto Transit Commission │ CEO’s Report │ April 2019 43
Streetcar: Service availability
Definition Daily average number of streetcars put into service (including RADs) compared to the number of streetcars scheduled for the a.m. peak period. Data represents Monday-to-Friday only. Holidays excluded. Contact Rich Wong, Chief Vehicle Officer
Results
In February, an average of 99.4% of the required 161 vehicles were provided for service. The target for streetcar availability is 100% of peak daily service, including Run-As-Directed vehicles.
Analysis
Due to severe snowfall conditions, some CLRV vehicles were not placed in service on February 13, which caused overall service availability targets to be missed.
Action plan
Streetcar maintenance will continue to commission LFLRV fleets and decommission legacy fleets in order to meet 100% service availability.

Toronto Transit Commission │ CEO’s Report │ April 2019 44
Streetcar: Cleanliness
Definition Average results of third-party audit conducted each quarter. Average of “prior,” “mid-day” and “end of service” results. Audits conducted weekdays only, excluding holidays. Contact Rich Wong, Chief Vehicle Officer
Results
The audit score for streetcar cleanliness for Q4 2018 was 91.8%. This is an increase from Q4 2017, but a decrease from Q3 2018. Streetcar cleanliness remains above the target of 90%.
Analysis
High demand for service vehicles limits availability for exterior/interior wash scheduling. Inclement weather has also affected cleanliness results, particularly flooring.
Action plan
Staff continue to investigate and identify further improvements, including additional equipment to make cleaning more efficient.
Toronto Transit Commission │ CEO’s Report │ April 2019 45
Bus Services Bus: On-time performance (OTP)
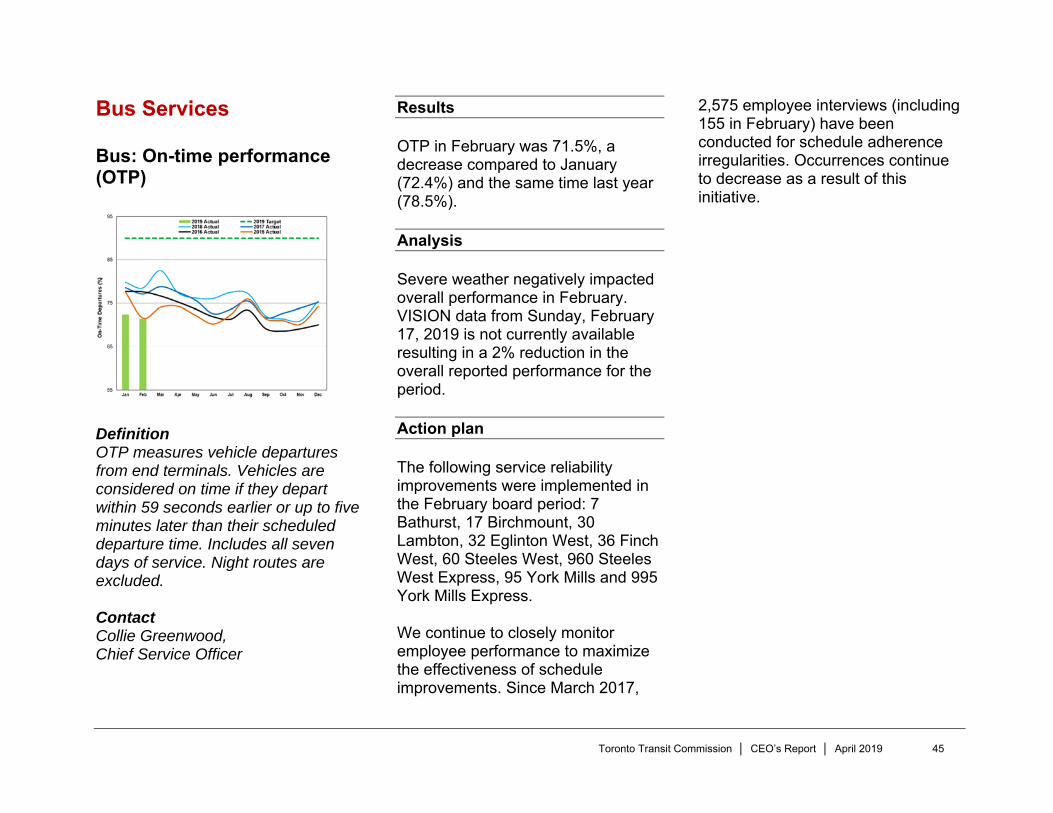
Definition OTP measures vehicle departures from end terminals. Vehicles are considered on time if they depart within 59 seconds earlier or up to five minutes later than their scheduled departure time. Includes all seven days of service. Night routes are excluded. Contact Collie Greenwood, Chief Service Officer
Results
OTP in February was 71.5%, a decrease compared to January (72.4%) and the same time last year (78.5%).
Analysis
Severe weather negatively impacted overall performance in February. VISION data from Sunday, February 17, 2019 is not currently available resulting in a 2% reduction in the overall reported performance for the period.
Action plan
The following service reliability improvements were implemented in the February board period: 7 Bathurst, 17 Birchmount, 30 Lambton, 32 Eglinton West, 36 Finch West, 60 Steeles West, 960 Steeles West Express, 95 York Mills and 995 York Mills Express.
We continue to closely monitor employee performance to maximize the effectiveness of schedule improvements. Since March 2017,
2,575 employee interviews (including 155 in February) have been conducted for schedule adherence irregularities. Occurrences continue to decrease as a result of this initiative.

Toronto Transit Commission │ CEO’s Report │ April 2019 46
Bus: Short turns
Definition Total short turns per month. Includes all seven days of service, night routes excluded. Contact Collie Greenwood, Chief Service Officer
Results
Short turns for February increased to 2,202, compared to 2,195 in January. The monthly target is 1,590.
Analysis
Weather-related short turns accounted for one-third of February's short turns. Almost half of all short turns occurred on February 6, 7, 13, 14, 27 and 28.
The top six routes for short turns were: 41 Keele (4.3%), 36 Finch West (4.1%), 63 Ossington (3.8%), 54 Lawrence East (3.4%), and 34 Eglinton East (3.7%), representing one-fifth of all short turns.
Action plan
Review and implement schedule changes to target high incident routes where increased traffic congestion has resulted in unreliable service and schedules that no longer reflect actual operating conditions.

Toronto Transit Commission │ CEO’s Report │ April 2019 47
Bus: Weekly service hours
Definition Service hours are calculated from the time a bus leaves a garage to the time it returns to the garage. Measured daily. Board Period total calculated using a weekly average. Contact Kathleen Llewellyn-Thomas, Chief Customer Officer
Results
In the January 2019 Board Period, 149,845 bus weekly hours were budgeted for service, while 150,152 bus weekly hours were scheduled to operate. This represents a variance of 0.2%.
Of the 150,152 bus weekly hours scheduled to operate, 152,130 weekly hours were actually delivered, representing a variance of 1.32%.
Analysis
The variance from scheduled to actual is a result of buses operating on streetcar routes due to fleet shortage and the temporary replacement service provided during extreme weather events. Extra service has also been provided on routes affected by construction across the system.
Action plan
No action required at this time.

Toronto Transit Commission │ CEO’s Report │ April 2019 48
Bus: Mean distance between failures (MDBF)
Definition Total kilometres accumulated over the entire fleet compared to the total number of chargeable mechanical road calls. Data included for all seven days of service. Contact Rich Wong Chief Vehicle Officer
Results
The February MDBF of 20,000 kilometres exceeded the target of 12,000 kilometres.
Analysis
In 2019, 68 new Nova hybrid buses entered revenue service. In February, 26% of all chargeable road calls were linked to coolant-related systems. This was the most prominent failure mode affecting our fleets.
Another 10% of chargeable road calls were related to hybrid components on the Orion VII hybrid bus series 1000 - 1149. Specifically, the Energy Storage System (batteries) were unable to retain their charge due to the extreme temperatures.
Action plan
New technical programs for the cooling system are being developed and will be rolled out in Q2. These programs will support improve: Coolant System Daily Inspection
(daily frequency, prior to service) & Coolant System State of Good Repair (SOGR), frequency will be once per year per bus.

Toronto Transit Commission │ CEO’s Report │ April 2019 49
Bus: Road calls and change offs (RCCOs)
Definition Average daily number of vehicle-equipment failures requiring a road call for service repair or a change off to a repair facility for a replacement vehicle. Monday to Friday data only. Contact Rich Wong, Chief Vehicle Officer
Results
The average number of RCCOs in February 2019 was 35 per day, which was one more than the January results. In February 2018, we also averaged 35 RCCOs. Peak revenue service was 1,650 buses per day, including Run-As-Directed buses in February 2019. The average number of RCCOs per day equates to 2.12% of service. Analysis
Two extreme weather events (snow storm followed by extreme cold temperatures) in February resulted in buses being stuck in the snow and component failure due to ice build-up and frigid temperatures.
Action plan
We are in the process of modifying the front door heat vent and developing an undercarriage snow deflector on the new Nova buses, to prevent snow build-up and freezing of the ramp. Glycol de-icer has been tested to mitigate ramp freezing during extreme cold events. Snow tires were installed on Nova articulated bus rear drive axles, as well as, aggressive all-season snow-rated tires for the front and mid axles. All 40' buses are equipped with all-season snow-rated tires.

Toronto Transit Commission │ CEO’s Report │ April 2019 50
Bus: Service availability
Definition Daily average number of buses put into service (including RADs) compared to the number of buses scheduled for the a.m. peak period. Data represents Monday to Friday only. Holidays excluded. Contact Rich Wong, Chief Vehicle Officer
Results
The average number of buses provided for a.m. peak service in February 2019 was 1,649 per day or 102.8% of planned service. This was well above the target of 1,597 buses. Analysis
The significant number of new bus procurements from years 2016 to 2018 (841 buses) has boosted fleet performance and permitted a lower than projected spare ratio. The lower spare ratio supports additional buses available for service. Action plan
Continue to monitor and improve on all aspects of maintenance to support vehicle reliability and availability.

Toronto Transit Commission │ CEO’s Report │ April 2019 51
Bus: Cleanliness
Definition Average results of third party audit conducted each quarter. Average of “prior,” “mid-day” and “end of service” results. Audits conducted weekdays only, excluding holidays. Contact Rich Wong, Chief Vehicle Officer
Results
The bus cleanliness audit score in Q4 2018 was 94.0%, which is above the target of 90%. The Q4 2018 score is slightly below Q3 2018 score of 94.7%, but higher than Q4 2017 score of 88.7%.
Analysis
The performance score takes into account pre-service, in-service and post-service audit results. Scores are impacted by changes in in-service operating conditions. Q1 2019 results are likely to have a minor negative variance due to inclement weather conditions.
Action plan
Continue manually cleaning the front and back of the bus exteriors. The mid-day cleaning trial continues to the end of Q1 2019 and will then be evaluated.

Toronto Transit Commission │ CEO’s Report │ April 2019 52
Wheel-Trans Services Wheel-Trans: On-time performance (OTP)
Definition Measures on-time performance of all trips conducted by Wheel-Trans buses. Seven days a week, all time periods included. To be on time, the trip must arrive within 20 minutes of its scheduled arrival. Contact Collie Greenwood, Chief Service Officer
Results
OTP in February decreased by 0.3% from the previous period to 92.5%, and is 8.2% above the same period in 2018.
Analysis
OTP decreased in February due to inclement weather. Service levels remained above target.
Action plan
Ridesharing allows us to efficiently utilize our buses and provide a better customer experience. Effective vehicle management will assist in the reduction of late vehicles.

Toronto Transit Commission │ CEO’s Report │ April 2019 53
Wheel-Trans: Mean distance between failures (MDBF)
Definition Total kilometres accumulated over the entire fleet compared to the total number of chargeable mechanical road calls. Data included for all seven days of service. Contact Rich Wong, Chief Vehicle Officer
Results
The February 2019 MDBF of 17,605 kilometres exceeded the target of 12,000 kilometres, and is above the February 2018 average of 12,087 kilometres. Analysis
The addition of the ProMaster bus is the driving force behind an above target MDBF. Wheel-Trans maintenance has begun decommissioning the Friendly bus fleet. Diesel exhaust fumes detected by operators continue to account for the most road calls and change-offs for the Friendly bus fleet. Lakeshore Garage maintenance manually engages the exhaust regeneration on property during servicing, to minimize the impact to our customers.
Action plan
To help mitigate exhaust system issues on the Friendly bus fleet, the Wheel-Trans maintenance team runs a series of checks on all Friendly buses following each major repair. A data logger is being used to download the diesel particulate filter (DPF) soot levels. DPF's are replaced if soot levels exceed the manufacturer's specifications. Lastly, an exhaust system smoke test is performed to eliminate any pre-existing exhaust system leaks.

Toronto Transit Commission │ CEO’s Report │ April 2019 54
Wheel-Trans: Accommodated service
Definition Accommodated rate is the percentage of passengers requesting Wheel-Trans services that are actually provided trips by either a Wheel-Trans bus, accessible taxi or sedan taxi. Contact Collie Greenwood, Chief Service Officer
Results
In February, the Wheel-Trans accommodated service rate was 99.9%. This is 0.9% higher than the target, and 0.4% above the same time last year.
Analysis
Our scheduling team manages to move and fit trips according to customer needs and effectively utilize all modes of service including Wheel-Trans buses, contractor taxis and Family of Service transfer points.
Action plan
With added Family of Service stops being implemented this year, access to on-demand contractor services and our customer's ability to book rides themselves via our improved Self Booking Website, we will always be able to provide a trip for our customers.

Toronto Transit Commission │ CEO’s Report │ April 2019 55
Station services Station cleanliness
Definition Average results of a third party audit conducted each quarter of all 75 stations. Audits are conducted weekdays only, excluding holidays. Contact James Ross, Chief Operating Officer
Results
The average station cleanliness score for Q4 2018 was 76.2%, exceeding the target of 75%.
Analysis
Enhanced cleaning projects, such as the accelerated re-lamping, Luxalon cleaning, station enhancement and blitz will run again, starting in March 2019.
Action plan
We continue to schedule extra cleaning projects during weekend closures, where possible, to ensure that stations are in top condition when reopened following the closure work.
Note: The Q1 2019 audit score will be available in the May 2019 CEO’s Report.

Toronto Transit Commission │ CEO’s Report │ April 2019 56
Elevator availability
Definition Percentage of total available subway elevator service hours during subway revenue service in a given month. Contact Fort Monaco, Chief Infrastructure and Engineering Officer
Results
Elevator availability was 98% in February, which represents a decrease of 0.1% from last month and an increase of 0.9% from the same time last year. Availability met the target of 98%.
Analysis
Elevator maintenance was completed as planned and scheduled.
Action plan
We will continue performing preventative maintenance to meet reliability and availability targets.

Toronto Transit Commission │ CEO’s Report │ April 2019 57
Escalator availability
Definition Percentage of total available escalator service hours during subway revenue service in a given month. Contact Fort Monaco, Chief Infrastructure and Engineering Officer
Results
Escalator availability was 97.1% in February, which represents a decrease of 0.35% from last month and an increase of 0.05% from the same time last year. Availability was above the target of 97%.
Analysis
Escalator maintenance was completed as planned and scheduled.
Action plan
We will continue performing preventative maintenance to meet reliability and availability targets.

Toronto Transit Commission │ CEO’s Report │ April 2019 58
Fare Gates Equipped with PRESTO
Definition Percentage of time fare gates are available for use. Availability data provided by manufacturer for 24 hours a day, seven days a week. Contact James Ross, Chief Operating Officer
Results
Fare gate availability averaged 97.33% in January, which represents a decrease of 0.79% from last month and an increase of 2.05% from the same time last year. Availability was below the target of 99.5%
Analysis
The decrease in availability reflects ongoing hardware and software issues with fare gates. In January, we experienced a number of issues with the heaters inside the gates, which directly affected reliability. We are working with our vendor, Scheidt and Bachmann (S&B), to address this issue.
Action plan
We are working with S&B to address ongoing hardware and software issues. A number of programs have been developed and are currently being implemented. These include:
A program to replace the industrial computers in the fare
gates, which is currently 50% complete
New software deployment scheduled for Q2
The replacement of current gate motors with a modified, more reliable version
These programs will help address common issues with reliability, including screen freezing, card reader failures, motor and heater failures. We have additional software updates scheduled, which will add functionality and provide further fixes to known problems.

Toronto Transit Commission │ CEO’s Report │ April 2019 59
PRESTO Fare Card Readers
Definition The total percentage of all PRESTO card readers that are in working order and available for customer use. PRESTO card readers are devices that are installed onboard TTC surface vehicles (buses and streetcars) and allow customers to pay their fare by tapping on the device. Contact Kirsten Watson, Deputy CEO - Operations
Results
PRESTO card reader availability averaged 98.88% in February, which represents an increase of 0.06% from last month and 2.63% from the same time last year. Availability was below the target of 99.9%.
Analysis
The average time to repair out-of-service devices dropped by 14% from last month (1.12 days to 0.96 days). This was primarily due to the PRESTO device maintenance team performing increased remote same-day device recovery using their monitoring tools. We continue to experience network connectivity issues.
Action plan
We are working with Metrolinx to implement additional controls to further improve availability and address network connectivity issues.

Toronto Transit Commission │ CEO’s Report │ April 2019 60
PRESTO Fare Vending Machine (FVM)
Definition The average percentage of daily availability of PRESTO FVMs based on duration of incidents from open to resolution. PRESTO FVMs allow customers to load funds onto their PRESTO cards via credit or debit payment, purchase new PRESTO cards, view balance and card history, and activate any products purchased online. The FVMs are installed at station entrances Contact Kirsten Watson, Deputy CEO - Operations
Results
PRESTO FVM availability averaged 94.19% during February, which represents a decrease of 2.18% from last month. This is below the target of 99.9%.
Analysis
The decrease in FVM availability is due to:
Improper installation of cash vaults by contracted cash collection service
Failure to accept bills due to a combination of faulty equipment and condition of the bills inserted
Action plan
Replacement of all degraded bank note acceptor equipment is scheduled for completion at the end of April 2019.
The maintenance process has been adjusted to include verification of the
equipment on a proactive basis. This will alleviate failures to accept bank notes. Metrolinx continues to address training with contracted services.

Toronto Transit Commission │ CEO’s Report │ April 2019 61
PRESTO Self-Serve Reload Machine (SSRM)
Definition The average percentage of daily PRESTO SSRM availability based on duration of incidents from open to resolution. PRESTO SSRMs allow customers to load funds onto their PRESTO cards via credit or debit payment. The device also allows customers to view their balance and card history, and activate any products purchased online. The SSRMs are installed at subway station entrances. Contact Kirsten Watson, Deputy CEO - Operations
Results
PRESTO SSRM availability averaged 98.58% in February, which represents a decrease of 1.01% from last month. This is below the target of 99.9%.
Analysis
Metrolinx has investigated the increase in failing SSRMs and determined the cause is defective card readers.
Action plan
Metrolinx has identified the problem and is working with the vendor to fix the defective devices. A schedule for the completion of the fix will be provided in the May CEO’s Report.

Toronto Transit Commission │ CEO’s Report │ April 2019 62
PRESTO Fares and Transfer Machine (FTM)
Definition The weighted percentage of all FTMs onboard and off board that are in working order and available for customer use. The FTMs are Single Ride Vending Machines, installed on the new TTC streetcars and at selected streetcar stops. These allow customers to purchase Proof of Payment tickets. Contact Kirsten Watson, Deputy CEO - Operations
Results
PRESTO FTM availability averaged 98.64% during February 2019, which represents an increase of 1.64% from last month. This is below the target of 99.9%.
Analysis
The improved availability is consistent with the expected results following the removal of the debit and credit payment feature from all FTMs located onboard streetcars in December 2018.
Eight machines have been replaced with upgraded versions. Two of these new machines each had a single maintenance issue in February. This is below the average of three maintenance issues for each of the remaining machines.
Action plan
We will continue to replace current machines with new equipment. Metrolinx will provide a schedule for the rollout to all machines.

Toronto Transit Commission │ CEO’s Report │ April 2019 63
For further information on TTC performance, projects and services, please visit ttc.ca

Toronto Transit Commission │ CEO’s Report │ April 2019 64