chickpea proteins for food - victoria university
TRANSCRIPT


CHICKPEA PROTEINS FOR FOOD APPLICATIONS
A thesis
presented for the Degree of Doctor of Philosophy
by
Liu Li Hui, BSc (Beijing, China)
• 5
Australia Food Industry Science Centre Werribee, Victoria
and
Department of Biology and Chemistry Victoria University of Technology
1996
FTS THESIS 664.805657 LIU 30001005044013 Liu, L1 Hui Chickpea proteins for food applications
STATEMENT
This thesis contains no material previously submitted for a degree or diploma in any University and to the best of my knowledge and behef, contains no material previously pubhshed or written by another person except where due reference is made in the text.
Liu Li Hui
PUBLICATIONS
Part of this work has been published in the following papers:
1. Liu, L.H.; Hung, T.V.; Black, R.G. and Trewhella, M.A. A study on solubility of grain
legume proteins by Infrared Spectroscopy, ASEAN Food J., 1994, 9: 24-29.
2. Hung, T.V.; Liu, L.H.; Black, R.G. and Trewhella, M.A. Water absorption in chickpea (C.
arietinum) ahd field pea {P. sativum) cultivars using the Peleg model. 1993, J. Food Sci., 58:
848-852.
3. Liu, L.H.; Hung, T.V.; Black, R.G. and Trewhella, M.A. Chickpea protein for human
consumption. Proceeding AIFST Convention, Adelaide, May, 1993, 28.
4. Liu, L.H.; Hung, T.V.; Panozzo, J. and Black, R.G. Functional properties of native and
modified chickpea proteins for food applications, Chem. Aust., 1994, 506.
5. Liu, L.H.; Hung, T.V.; Panozzo, J., Black, R.G. and Trewhella, M.A. Rheological
characteristics of wheat doughs supplemented with soy, native and modified chickpea
proteins. Proceedings of the 44th Australian Cereal Conference, Ballarat, Sept., 1994, 228-
235.
6. Liu, L.H.; Hung, T.V. and Panozzo, J. Pasting characteristics of wheat flour
supplemented with chickpea proteins, Australian Cereal Conference, Adelaide, Oct., 1995.
7. Liu, L.H.; Hung, T.V.; Panozzo, J. and Bason, M. Factors affecting the viscosity of
wheat flour pastes, supplemented with non wheat proteins. Handbook, 46th Australian
Cereal Conference, Sydney, 1996, 115.
ACKNOWLEDGMENTS
I wish to thank Dr Hung Tran of the Australian Food Industry Science Centre (AFISC) who
guided and encouraged me during this course of investigation.
Thanks are also due to Professor M. Trewhella (Victoria University of Technology) and Mr R.
Black (AFISC) for their help. Many fi-iends and colleagues at the Australian Food Industry
Science Centre and at the Victoria University of Technology (Werribee and Footscray
Campus) gave me valuable supports and encouragement. I would like to thank all of them,
particularly, Ms D. Womersley, Ms L. Ruddick, Mrs G. Digregorio, Ms S. Christodoulou and
Mr A. Keene. The assistance of Mr J. Panozzo, Ms J. Deckert (Victorian Institute for Dryland
Agriculture, Horsham) and Mr M. Bason (Newport Scientific, Sydney) for providing facilities
to complete a chapter on the rheological properties of wheat doughs is highly appreciated.
I am gratefiil to Dr B. Imison (AFISC) and Dr U. Singh (ICRISAT, India) for many
discussions of this work and the related publications. I am also gratefijl to Dr J. Reynolds for
helping me with various statistical analysis.
I thank the Victoria University of Technology and The Grains Research and Development
Corporation as a recipient of their scholarships.
Finally I thank my parents, Guang and my sister who supported me with their heart and love.
(- ;.ii
AIXCX^
CONTENTS
STATEMENT
ACKNOWLEDGEMENTS
PUBLICATIONS
CHAPTER 1 FOOD PROTEIN - GENERAL INTRODUCTION
1.1 PROTEINS AND THE BODY'S NEED
1.1.1 PROTEINS AND ESSENTIAL AMINO ACIDS (E.A.A.)
1.1.2 PROTEIN REQUIREMENT
1.2 PROTEIN CLASSIFICATION
1.3 WORLD FOOD SUPPLY AND PROTEIN CONSUMPTION
1.3.1 WORLD FOOD SUPPLY
1.3.2 PROTEIN CONSUMPTION AND AFFLUENCE
1.4 VEGETABLE PROTEINS
1.4.1 AN ECONOMIC SOURCE
1.4.2 ANTI NUTRITIONAL FACTORS
1.4.3 DIVERSE APPLICATIONS
1.5 FUNCTIONALITY OF VEGETABLE PROTEINS
1.6 OBJECTIVES OF THIS INVESTIGATION
CHAPTER 2 LITERATURE REVIEW—VEGETABLE PROTEINS AND
PROTEIN ISOLATION lo
2.1 SOYBEAN 11
2.1.1 SOY PROTEIN PRODUCTS 13
2.1.2 VEGETABLE PROTEIN ISOLATION 16
2.1.3 FUNCTIONAL PROPERTIES OF SOY PROTEINS 19
2.2 OTHER PROTEIN SOURCES 21
2.2.1 PEANUT 21
2.2.2 COTTONSEED 22
2.2.3 RAPESEED 23
2.2.4 SUNFLOWER SEEDS 24
2.2.5 LUPIN 25
2.2.6 SAFFLOWER 26
2.2.7 FABA BEAN . 27
2.2.8 FIELD PEA 28
2.2.9 SINGLE CELL PROTEIN 29
2.3 CHICKPEA
2.3.1.1 World Production
30
2.3.1 CHICKPEA PRODUCTION 30
30
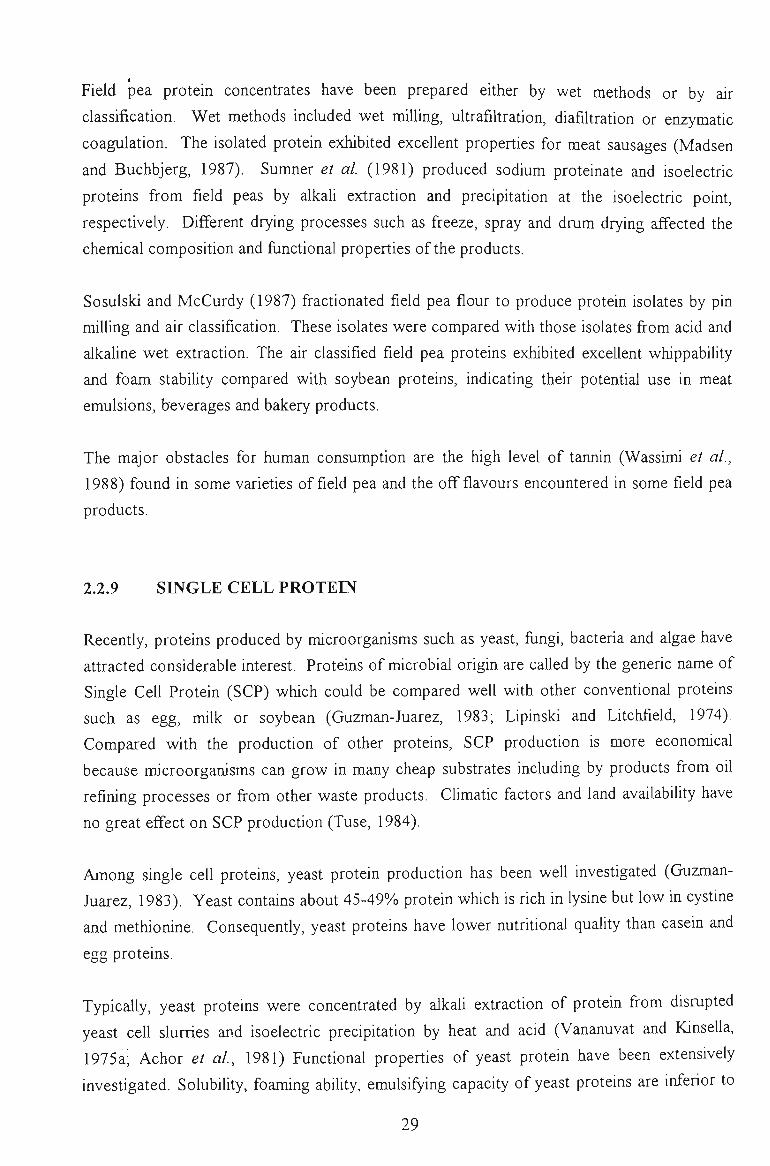
2.3.1.2 Australia Production 31
2.3.2 AGRONOMIC ASPECT 32
2.3.2.1 Classification 32
2.3.2.2 Botany 33
2.3.2.3 Distribution 33
2.3.2.4 Growth Condition 33
2.3.3 CHICKPEA COMPOSITION 34
2.3.3.1 Protein content and amino acid profile 3 4
2.3.3.2 Characterisation of chickpea proteins 3 5
2.3.3.3 Nutritional values of protein and protease inhibitors 3 6
2.3.3.4 Lipids 36
2.3.3.5 Carbohydrates, flatulence, hypocholesterolemic effect 36
2.3.4 CfflCKPEA FOOD APPLICATIONS 37
2.3.4.1 Beverage 37
2.3.4.2 Infant Formula 37
2.3.4.3 Meat Emulsion Extender 3 8
2.3.4.4 Bread and bakery products 3 8
2.4 REVIEW SUMMARY 38
CHAPTERS PROTEIN EXTRACTION AND CHARACTERISATION 40
3.1 WATER ABSORPTION 41
3.1.1 MOISTURE ABSORPTION CURVES 43
3.1.2 SEED SIZE AND WATER ABSORPTION RATE - WATER UPTAKE 45
3.1.3 EFFECT OF TEMPERATURE 47
3.1.4 SELECTION OF THE REPRESENTATIVE SAMPLE 49
3.2 EXTRACTION 49
3.2.1 PRELIMINARY EXTRACTION PROCEDURE 49
3.2.2 FACTORS AFFECTING EXTRACTION YIELD 51
3.2.2.1 Extraction in water 51
3.2.2.1.1 Effect of pH
3.2.2.1.2 Effect of temperature
3.2.2.1.3 Effect of grit particle size
3.22.1,4 Effect of extraction time
3.2.2.2 Exttaction in salt solution 5 4
3.2.2.2.1 Effect of pH and particle size
3.2.2.2.2 Effect of extraction temperature and time
3.2.3 STATISTICAL ANALYSIS 56
3.2.4 CONCLUSION 57
3.3 CHARACTERISATION OF WATER, ACIDIC AND ALKALI EXTRACTED
PROTEIN 59
3.3.1 AMINO ACID COMPOSITION 60
3.3.2 GEL FILTRATION 61
3.3.3 GEL ELECTROPHORESIS 61
3.3.4 DENSITOMETRIC SCANNING PROFILES 62
3.3.5 /A KZTi O DIGESTIBILITY 63
3.3.5.1 Gel filtiation profile of chickpea hydrolysates by papain and trypsin 64
3.3.5.2 Hydrolysis by papain, trypsin and pepsin. Relative activity 67
3.4 EXTRACTION AND CHARACTERISATION OF CHICKPEA ALBUMIN AND
GLOBULIN 69
3.4.1 PROTEIN EXTRACT ABILITY 6 9
3.4.2 AMINO ACID PROFILE 71
4.2.1 COMPARISON BETWEEN KJELDAHL AND MELKOSCAN METHOD 98
4.2.2 MILKOSCAN AND ACETAMIDE SOLUTIONS 100
4.3 CONCLUSION 105
CHAPTER 5 MODIFICATION OF CHICKPEA PROTEIN ISOLATES BY
ACETYLATION AND SUCCINYLATION 106
5.1 CHARACTERISATION OF ACYLATED CHICKPEA PROTEINS 108
5.1.1 EXTENT OF ACYLATION 108
5.1.2 AMINO ACID COMPOSITION 110
5.1.3 GEL FILTRATION 112
5.1.4 GEL ELECTROPHORESIS 112
5.1.5 DENSITOMETRIC SCANNING PROFILES 114
5.1.6 IN VITRO DIGESTIBILITY 116
5.1.7 CONCLUSION 119
5.2 FUNCTIONAL PROPERTIES OF ACETYLATED CHICKPEA PROTEINS 120
5.2.1 SOLUBILITY IN WATER 121
5.2.2 SOLUBn:.ITY IN SALT SOLUTIONS 123
5.2.3 WATER ABSORPTION CAPACITY 125
5.2.4 OIL ABSORPTION CAPACITY 126
5.2.5 EMULSIFYING CAPACITY 127
5.2.6 EMULSION STABILITY 130
5.2.7 CONCLUSION 137
5.3 FUNCTIONAL PROPERTIES OF SUCCINYLATED CHICKPEA PROTEINS 137
5.3.1 SOLUBILITY IN WATER 138
5.3.2 SOLUBILITY IN SALT SOLUTIONS 139
5.3.3 WATER ABSORPTION CAPACITY 141
5.3.4 OIL ABSORPTION CAPACITY 142
5.3.5 EMULSIFYING CAPACITY 142
5.3.6 EMULSION STABILITY 145
5.3.7 CONCLUSION 152
CHAPTER 6 RHEOLOGICAL PROPERTIES OF CfflCKPEA PROTEIN
DISPERSIONS 153
6.1 FLOW PROPERTIES OF UNMODIFIED CHICKPEA PROTEINS 157
6.1.1 EFFECT OF CONCENTRATION 157
6.1.2 EFFECT OF TEMPERATURE 160
6.1.3 EFFECT OF SALTS 162
6.1.4 EFFECT OF pH 164
6.1.5 EFFECT OF DENATURATING REAGENTS 165
6.1.6 CONCLUSION 166
6.2 FLOW PROPERTIES OF ACETYLATED CHICKPEA PROTEINS 167
6.2.1 EFFECTS OF PROTEIN CONCENTRATION AND ACETYLATION EXTENTS 168
6.2.2 EFFECT OF SALT CONCENTRATION 171
6.2.3 EFFECT OF TEMPERATURE 173
6.2.4 CONCLUSION 175
6.3 FLOW PROPERTIES OF SUCCINYLATED CHICKPEA PROTEIN DISPERSIONS 175
6.3.1 EFFECTS OF PROTEESf CONCENTRATION AND SUCINYLATION EXTENTS 176
6.3.2 EFFECT OF SALT CONCENTRATION 179
6.3.3 EFFECT OF TEMPERATURE 181
6.3.4 CONCLUSION 184
6.4 SUMMARY 184
CHAPTER? RHEOLOGICAL PROPERTIES OF WHEAT FLOUR
SUPPLEMENTED WITH CHICKPEA PROTEINS 186
7.1 RHEOLOGICAL PROPERTIES OF DOUGH 188
7.1.1 MIXING STAGE 189
7.1.2 MACHINING 190
7.1.3 PASTING PROPERTIES OF WHEAT FLOUR 191
7.2 FARINOGRAPH STUDY 194
7.2.1 WATER ABSORPTION 194
7.2.2 PEAK TIME 196
7.2.3 DOUGH BREAKDOWN 197
7.2.4 DOUGH STABILITY 198
7.3 EXTENSIGRAPH STUDY 199
7.4 PASTING PROPERTIES 202
7.4.1 EFFECTS ON VISCOSITY RELATED PARAMETERS 202
7.4.2 EFFECTS ON TIME RELATED PARAMETERS 204
7.4.3 EFFECTS ON SLOPE RELATED PARAMETERS 205
7.5 FACTORS AFFECTING THE PEAK VISCOSITY 207
7.6 BAKING PROPERTIES OF WHEAT FLOUR SUPPLEMENTED WITH
CHICKPEA FLOUR AND PROTEIN ISOLATES 212
CHAPTER 8 CONCLUSION 220
CHAPTER 9 EXPERIMENTAL 226
REFERENCES 266

SUMMARY
The potential applications of chickpea proteins (Cicer arietinum L. cv Kaniva) as food
ingredients have been investigated and presented in three major parts of this thesis.
The first part (chapter 3) identified different extraction conditions and their effects on the
extraction yield and characteristics of the isolated proteins.
The water absorption of chickpea seeds was defined. Chickpea protein extractabilities were
basically pH dependent. The combined effects of several factors affecting the extraction yield
were examiiied in forty eight different extractions. Extraction pH and particle size of the grits
were the most significant factors but extraction time and temperature had only a minor effect.
Salt solutions did not improve the extraction yield. Extraction under different conditions gave
different extraction yields and different types of proteins. Gel filtration patterns,
electrophoretic and densitometric analysis and enzymatic in vitro digestion studies indicated
that the water extracted proteins were characteristically more similar to those extracted at
alkaline pH than proteins extracted at acidic pH.
The relative amount of albumin and globulin in chickpea depended on extraction conditions and on variety. Fractionation with K2SO4 solutions produced highly purified albumins.
Depending on the procedure employed, albumin (>30% of the total protein) could be a major
protein fraction. This casts doubt on the perception that the albumin fraction of chickpea
only accounted for a minor proportion (10%) of the total proteins.
The structural differences of Kabuli and Desi chickpea albumins and globulins were identified.
The albumins were comprised of subunits with high molecular weight while the globulin
contained of low molecular weight subunits. Also, the level of essential amino acids in
albumin was always higher than that of globulin. Globulins prepared under different
conditions possessed a similar structure, but their in vitro digestibility was different, reflecting
the effect of processing conditions on their functional performance. Several pilot scale
extractions (500 kg) were conducted with commercial equipment, based on the concepts
developed in the laboratory and the isolated proteins were used for further investigations.
The second part (chapter 4) defined the functional properties of these isolated proteins and
relevant factors affecting their behaviour.
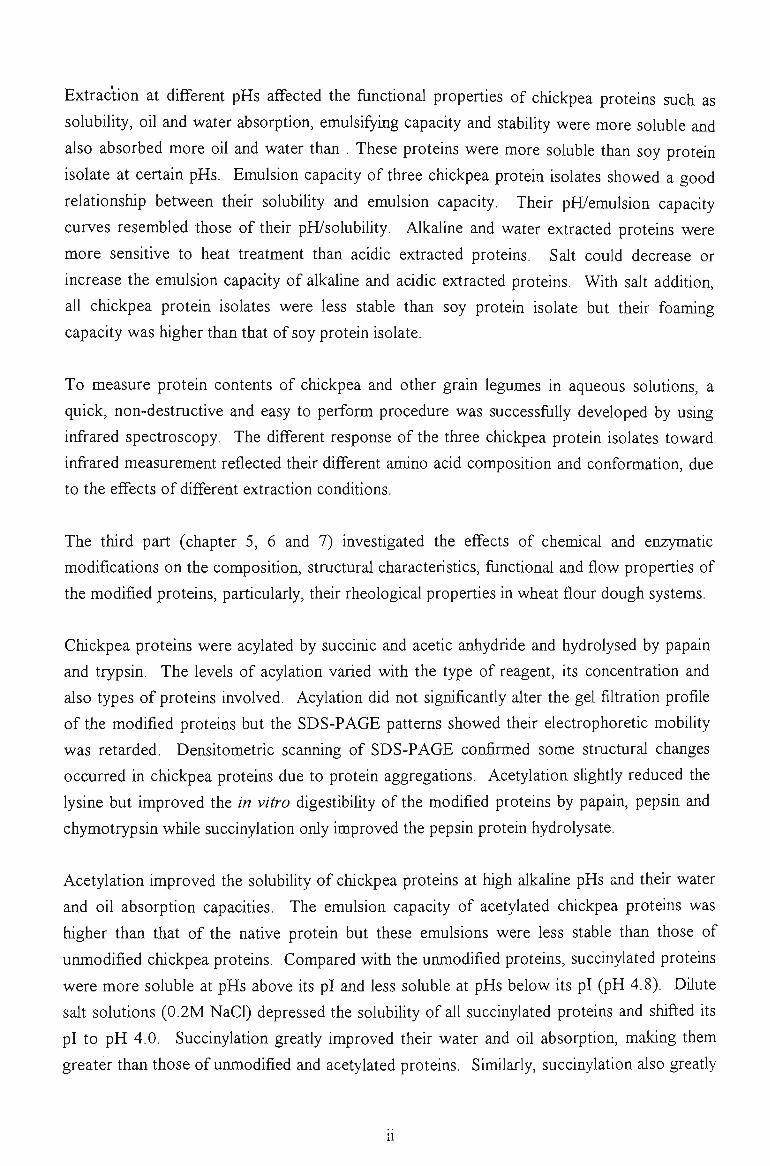
Extraction at different pHs affected the functional properties of chickpea proteins such as
solubility, oil and water absorption, emulsifying capacity and stability were more soluble and
also absorbed more oil and water than . These proteins were more soluble than soy protein
isolate at certain pHs. Emulsion capacity of three chickpea protein isolates showed a good
relationship between their solubility and emulsion capacity. Their pH/emulsion capacity
curves resembled those of their pH/solubility. Alkaline and water extracted proteins were
more sensitive to heat treatment than acidic extracted proteins. Salt could decrease or
increase the emulsion capacity of alkaline and acidic extracted proteins. With salt addition,
all chickpea protein isolates were less stable than soy protein isolate but their foaming
capacity was higher than that of soy protein isolate.
To measure protein contents of chickpea and other grain legumes in aqueous solutions, a
quick, non-destructive and easy to perform procedure was successfully developed by using
infi"ared spectroscopy. The different response of the three chickpea protein isolates toward
infrared measurement reflected their different amino acid composition and conformation, due
to the effects of different extraction conditions.
The third part (chapter 5, 6 and 7) investigated the effects of chemical and enzymatic
modifications on the composition, structural characteristics, functional and flow properties of
the modified proteins, particularly, their rheological properties in wheat flour dough systems.
Chickpea proteins were acylated by succinic and acetic anhydride and hydrolysed by papain
and trypsin. The levels of acylation varied with the type of reagent, its concentration and
also types of proteins involved. Acylation did not significantly alter the gel filtration profile
of the modified proteins but the SDS-PAGE patterns showed their electrophoretic mobility
was retarded. Densitometric scanning of SDS-PAGE confirmed some structural changes
occurred in chickpea proteins due to protein aggregations. Acetylation slightly reduced the
lysine but improved the in vitro digestibility of the modified proteins by papain, pepsin and
chymotrypsin while succinylation only improved the pepsin protein hydrolysate.
Acetylation improved the solubility of chickpea proteins at high alkaline pHs and their water
and oil absorption capacities. The emulsion capacity of acetylated chickpea proteins was
higher than that of the native protein but these emulsions were less stable than those of
unmodified chickpea proteins. Compared with the urmiodified proteins, succinylated proteins
were more soluble at pHs above its pl and less soluble at pHs below its pi (pH 4.8). Dilute
salt solutions (0.2M NaCl) depressed the solubility of all succinylated proteins and shifted its
pi to pH 4.0. Succinylation greatly improved their water and oil absorption, making them
greater than those of unmodified and acetylated proteins. Similarly, succinylation also greatly
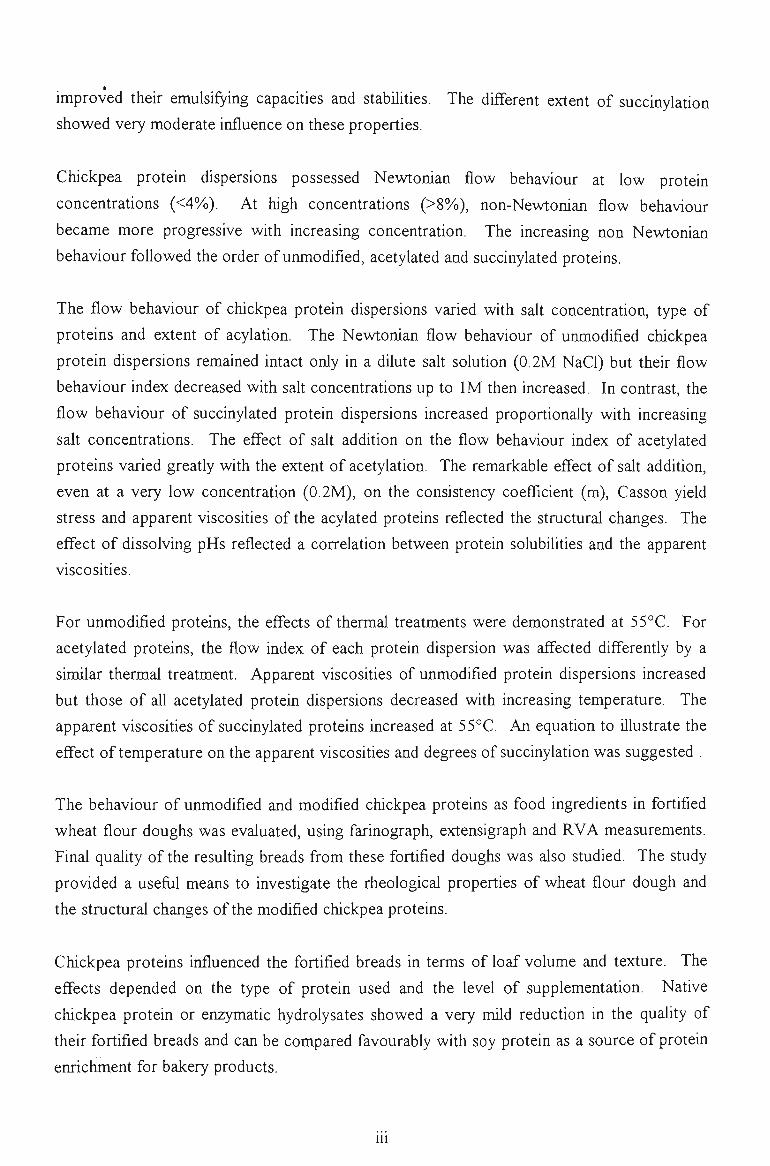
improved their emulsifying capacities and stabilities. The different extent of succinylation
showed very moderate influence on these properties.
Chickpea protein dispersions possessed NevW;onian flow behaviour at low protein
concentrations (<4%). At high concentrations (>8%), non-Newtonian flow behaviour
became more progressive with increasing concentration. The increasing non Newtonian
behaviour followed the order of unmodified, acetylated and succinylated proteins.
The flow behaviour of chickpea protein dispersions varied with salt concentration, type of
proteins and extent of acylation. The Newtonian flow behaviour of unmodified chickpea
protein dispersions remained intact only in a dilute salt solution (0.2M NaCl) but their flow
behaviour index decreased with salt concentrations up to IM then increased. In contrast, the
flow behaviour of succinylated protein dispersions increased proportionally with increasing
salt concentrations. The effect of salt addition on the flow behaviour index of acetylated
proteins varied greatly with the extent of acetylation. The remarkable effect of salt addition,
even at a very low concentration (0.2M), on the consistency coefficient (m), Casson yield
stress and apparent viscosities of the acylated proteins reflected the structural changes. The
effect of dissolving pHs reflected a correlation between protein solubilities and the apparent
viscosities.
For unmodified proteins, the effects of thermal treatments were demonstrated at 55°C. For
acetylated proteins, the flow index of each protein dispersion was affected differently by a
similar thermal treatment. Apparent viscosities of unmodified protein dispersions increased
but those of all acetylated protein dispersions decreased with increasing temperature. The
apparent viscosities of succinylated proteins increased at 55°C. An equation to illustrate the
effect of temperature on the apparent viscosities and degrees of succinylation was suggested .
The behaviour of unmodified and modified chickpea proteins as food ingredients in fortified
wheat flour doughs was evaluated, using farinograph, extensigraph and RVA measurements.
Final quality of the resulting breads from these fortified doughs was also studied. The study
provided a useful means to investigate the rheological properties of wheat flour dough and
the structural changes of the modified chickpea proteins.
Chickpea proteins influenced the fortified breads in terms of loaf volume and texture. The
effects depended on the type of protein used and the level of supplementation. Native
chickpea protein or enzymatic hydrolysates showed a very mild reduction in the quality of
their fortified breads and can be compared favourably with soy protein as a source of protein
enrichment for bakery products.
ni
CHAPTER 1
FOOD PROTEIN - GENERAL INTRODUCTION
FOOD PROTEIN - GENERAL INTRODUCTION
LI FOOD PROTEINS AND THE BODY'S NEEDS
1.1.1 PROTEINS AND ESSENTIAL AMINO ACIDS
Proteins are a constituent of every living cell and are essential to life as a vital part of the
nucleus and protoplasm. Proteins combine with nucleic acids to form nucleoproteins in the
cell nucleus which are responsible for the transmission of genetic information. As enzymes
or some parts of many hormones, proteins are essential in the regulation of body processes.
Proteins are important for the growth and repair of body tissues and can also be used as a
source of energy.
Proteins are continuously degraded and resynthesised to fulfil the body's needs for growth,
maintenance and function. Proteins are long chains of amino acids linked by peptide bonds.
Amino acids are the basic structural units from which proteins are synthesised and into
which they are degraded. Proteins can be synthesised by plant and animal cells.
Based on functional and nutritional basis, amino acids are classified into two groups:
essential and non essential. An amino acid that cannot be synthesised by the body at a rate
sufficient to meet the needs for growth and maintenance is defined as an essential amino acid
and must be provided by the diet. Nine essential amino acids (EAA) cannot be synthesised
by humans. Consequently, the ultimate value of a food protein lies in its amino acid
composition and proteins in foods are evaluated by their amino acid profiles.
1.1.2 PROTEIN REQUIREMENT
In 1992, sufficient food was available to feed all human being with a diet of 9,823 kJ /day.
The body needs amino acids, nitrogen, and organic acids rather than protein per se to
synthesise its own required proteins. Consequently the term protein requirement does not
strictly reflect the body requirement for proteins (Harper, 1977; Wilham et al., 1974).
Nevertheless, this term has been widely used. FAQ (Food and Agriculture Organisation,
1973) as well as the Food and Nutrition Board of the National Research Council in the USA
(1980) recommended a safe level of protein intake to meet all physiological needs of healthy
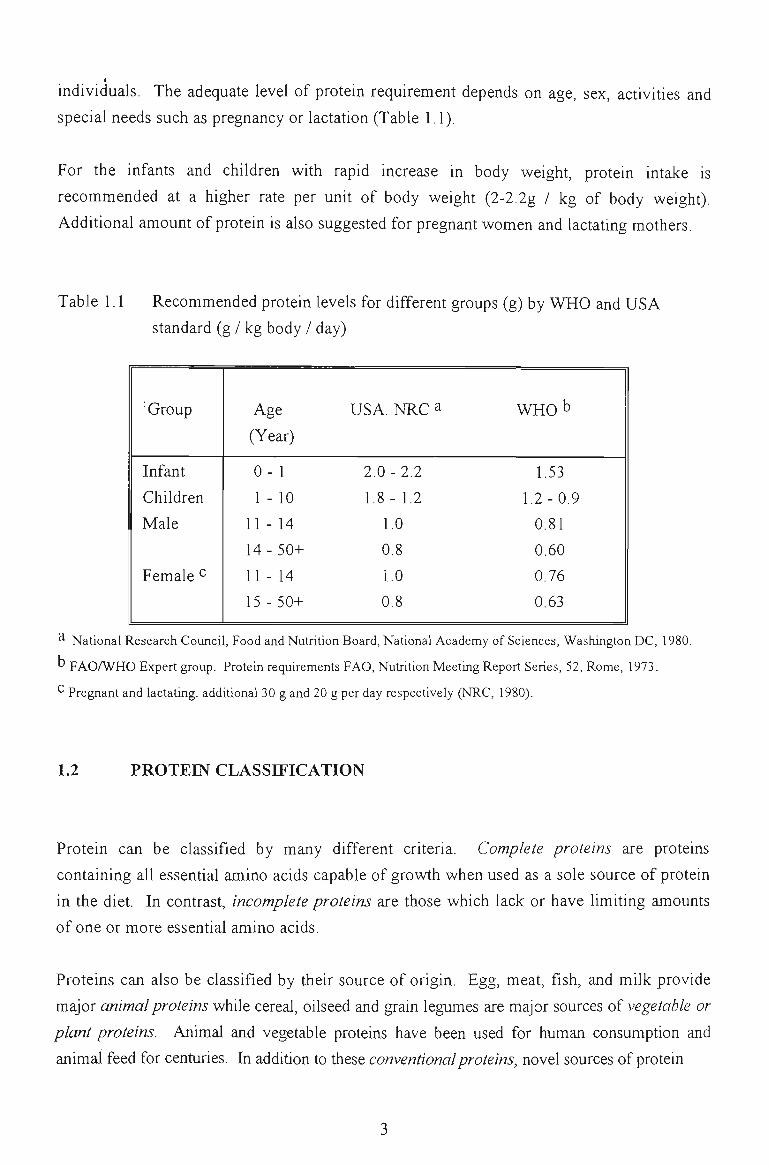
individuals. The adequate level of protein requirement depends on age, sex, activities and
special needs such as pregnancy or lactation (Table 1.1).
For the infants and children with rapid increase in body weight, protein intake is
recommended at a higher rate per unit of body weight (2-2.2g / kg of body weight).
Additional amount of protein is also suggested for pregnant women and lactating mothers.
Table 1.1 Recommended protein levels for different groups (g) by WHO and USA
standard (g / kg body / day)
Group
Infant
Children
Male
Female ^
Age
(Year)
0 - 1
1 -10
11 - 14
14 - 50+
11 - 14
15 - 50+
USA. NRC a
2 .0 -2 .2
1,8- 1.2
1.0
0.8
1.0
0.8
W H Q b
1.53
1.2-0.9
0.81
0.60
0.76
0.63
a National Research Council, Food and Nutrition Board, National Academy of Sciences, Washington DC, 1980.
^ FAQAVHO Expert group. Protein requirements FAQ, Nutrition Meeting Report Series, 52, Rome, 1973.
^ Pregnant and lactating. additional 30 g and 20 g per day respectively (NRC, 1980).
1.2 PROTEIN CLASSIFICATION
Protein can be classified by many different criteria. Complete proteins are proteins
containing all essential amino acids capable of growth when used as a sole source of protein
in the diet. In contrast, incomplete proteins are those which lack or have limiting amounts
of one or more essential amino acids.
Proteins can also be classified by their source of origin. Egg, meat, fish, and milk provide
major animal proteins while cereal, oilseed and grain legumes are major sources of vegetable or
plant proteins. Animal and vegetable proteins have been used for human consumption and
animal feed for centuries. In addition to these conventional proteins, novel sources of protein
have been extensively sought for the past twenty years. Some of these novel proteins were
produced by microorganisms such as yeast, fungi, bacteria and algae or by leaves and
grasses.
1.3 WORLD FOOD SUPPLY AND PROTEIN CONSUMPTION
1.3.1 WORLD FOOD SUPPLY
In 1992, sufficient food was produced to provide all human being with a diet of 9,823 kJ
/day/person. Based on this average calorie requirement, the current food production could
even support an extra 15% of the world's population (Uvin, 1994).
This estimation, however, only confirms that the world has sufficient knowledge and
resources to produce enough food for the whole population, but it does not provide an
equitable access to food supply. In the World Declaration on Nutrition in Rome, it is
estimated that 780 million people in developing countries still do not have access to enough
food to meet their basic nutritional needs (Rome, 1992). This inadequate status of food
distribution is not only a serious survival problem in the developing countries, but also a
social problem in affluent countries including the USA (Bistrian et al, 1974).
These figures reflect only the food energy but not the food quality. Although the 1992
world food supply could satisfy up to 115% of current world population, it could only
provide a healthy diet for between 59 and 11% of the world population. This would be for a
diet where 15-20% of the calories are derived from animal sources, including animal
proteins.
1.3.2 PROTEIN CONSUMPTION AND AFFLUENCE
Global food production has greatly increased but food consumption per head in
developing countries has not increased proportionately because of high birth rates.
Protein consumption in the affluent world and the developing world is also markedly
different. In 1980, the developing countries shared 16-20%) of the world's animal
protein. In contrast, people in all industrialised countries consumed about five times
more animal protein per person than those of the developing countries. In North
America a person consumed about 77 g of protein while some Africans had only 4-5g
per day as an extreme comparison (Hill and Patterson, 1989).
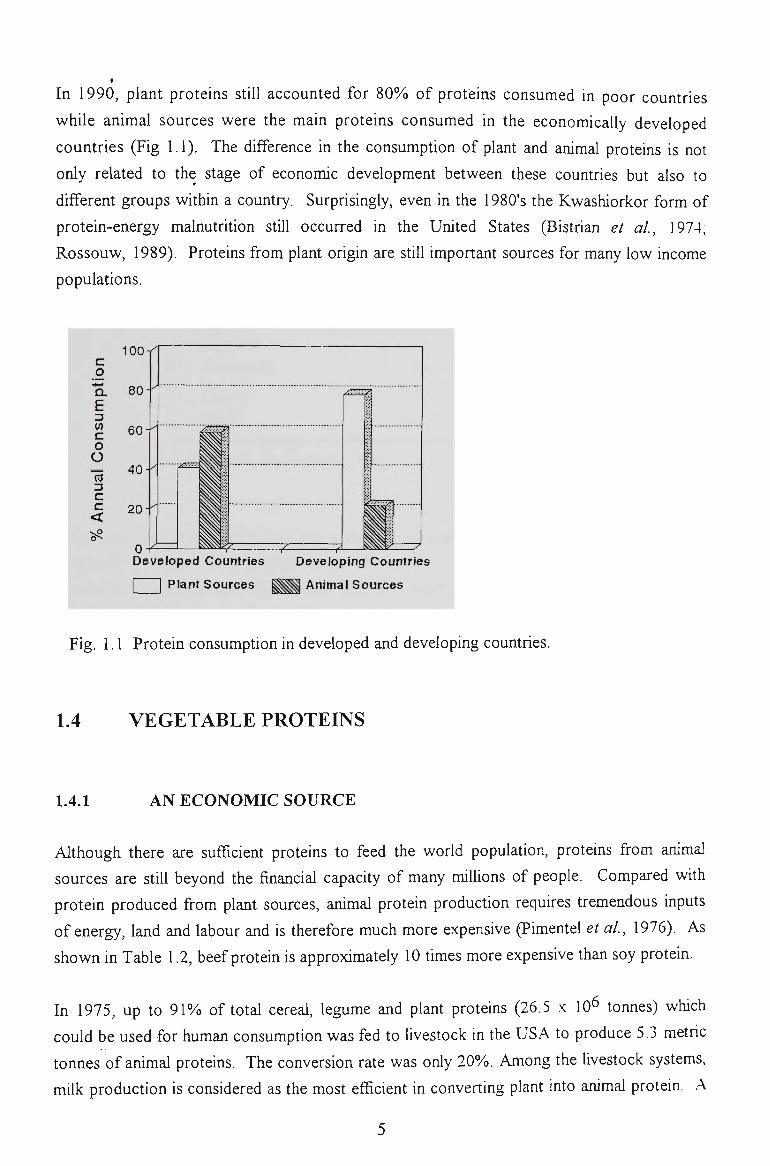
In 1990, plant proteins still accounted for 80% of proteins consumed in poor countries
while animal sources were the main proteins consumed in the economically developed
countries (Fig 1.1). The difference in the consumption of plant and animal proteins is not
only related to the stage of economic development between these countries but also to
different groups within a country. Surprisingly, even in the 1980's the Kwashiorkor form of
protein-energy malnutrition still occurred in the United States (Bistrian et al., 1974,
Rossouw, 1989). Proteins from plant origin are still important sources for many low income
populations.
c o "Q.
E W c o O "(5 3 C C
<
100
80
60
40
20
^i2S255
0 Developed Countries I I Plant Sources
»
1^
Developing Countries
^ Animal Sources
Fig. 1.1 Protein consumption in developed and developing countries.
1.4 VEGETABLE PROTEINS
1.4.1 AN ECONOMIC SOURCE
Although there are sufiBcient proteins to feed the world population, proteins from animal
sources are still beyond the financial capacity of many millions of people. Compared with
protein produced from plant sources, animal protein production requires tremendous inputs
of energy, land and labour and is therefore much more expensive (Pimentel et al, 1976). As
shown in Table 1.2, beef protein is approximately 10 times more expensive than soy protein.
In 1975, up to 91% of total cereal, legume and plant proteins (26.5 x 10^ tonnes) which
could be used for human consumption was fed to livestock in the USA to produce 5.3 metric
tonnes of animal proteins. The conversion rate was only 20%. Among the livestock systems,
milk production is considered as the most efficient in converting plant into animal protein. A
dairy cow needs 350g of plant protein to produce lOOg milk protein. In terms of energy
input, even with this most efficient system, for every kjoule of milk protein produced 30
kjoule of plant protein energy are required. The ratio is about 30:1 (Pimentel and Pimentel,
1977).
Table 1.2 ' Price of some major commercial proteins (USD/tonne)^
Protein
Soybean meal
Fish meal
Casein
Meat
Price
175-450.5
600
1,250 - 2,000
2,000 - 4,000
^ Source - Prave et al.. Interdisciplinary Science reviews 1980.
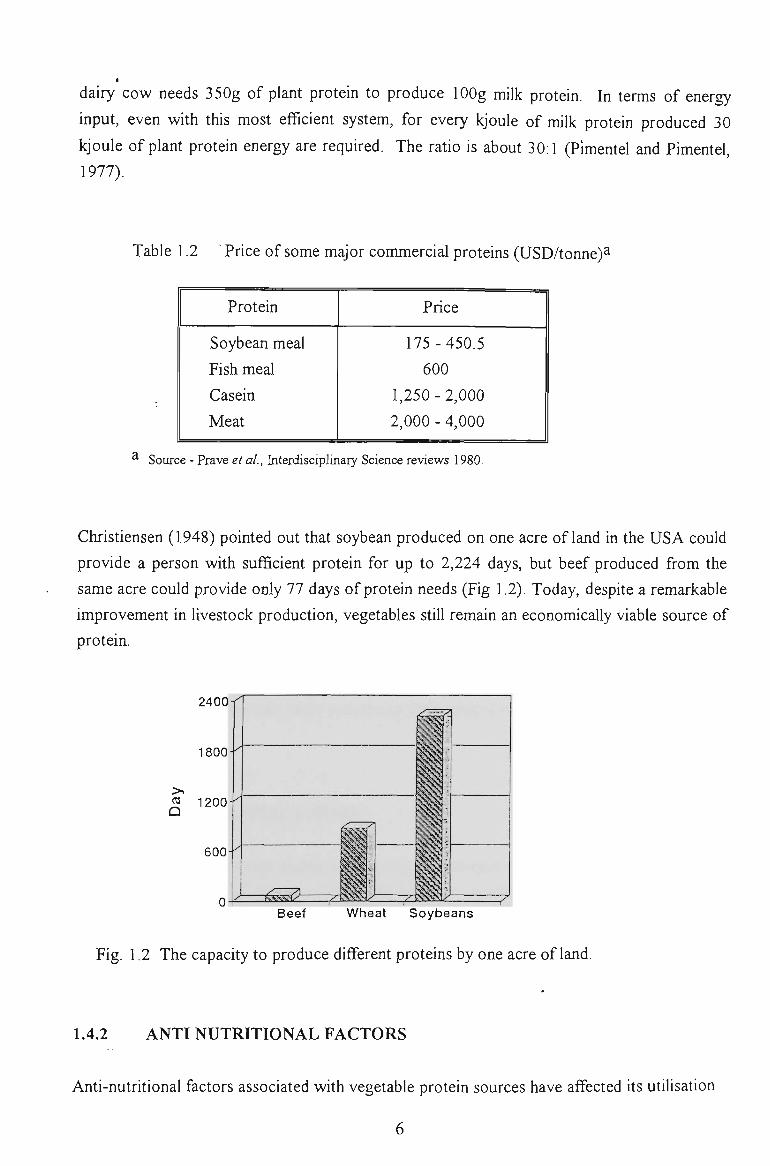
Christiensen (1948) pointed out that soybean produced on one acre of land in the USA could
provide a person with sufficient protein for up to 2,224 days, but beef produced from the
same acre could provide only 77 days of protein needs (Fig 1.2). Today, despite a remarkable
improvement in livestock production, vegetables still remain an economically viable source of
protein.
Beef Wheat Soybeans
Fig. 1.2 The capacity to produce different proteins by one acre of land.
1.4.2 ANTI NUTRITIONAL FACTORS
Anti-nutritional factors associated with vegetable protein sources have affected its utilisation
for human consumption. These anti-nutritional factors fall into two major groups: protein and
non protein factors (Chavan and Kadam, 1989).
Although grain legume seeds are a rich source of dietary protein, they are also a rich source
of anti nutritional proteins consisting mainly of proteinase inhibitors, phytohaemaglutinins and
food allergens. Proteinase inhibitors are polypeptides and proteins which inhibit proteolytic
enzyme activity. Two well characterised proteinase inhibitors found in soybean are the
Kunitz and Bowman-Birk inhibitor (Liener, 1976). Other inhibitors have also been isolated
from field pea, winged bean, cowpea and kidney bean. Phytohaemaglutinins are carbohydrate
binding proteins which can agglutinate erythrocytes. These glycoproteins are found in the
seed's cotyledons of many grain legumes. They have different molecular weights and varying
toxicities (Jaffe, 1980). Grain legumes are a common source of food allergens. Castor bean
and cottonseed are the most highly potent allergens while peanut is the most highly allergenic
grain legume consumed directly by man. In addition to these main anti nutritional proteins,
lipoxygenases in soybean and other grain legumes catalyse fat oxidation to produce typical
beany flavour. Myrosinase in rapeseed hydrolyses glucosinolates to harmflil compounds such
as isothiocyanates and oxazolidinethiones (Sosulski, 1983). Grain legume seeds also contain
several non-protein anti nutritional factors. For example, the seeds of some lupin varieties
have high levels of the alkaloid quinolizidines (Aquilera and Trier, 1978) and manganese
(Hung et al., 1986). Cottonseed contain toxic polyphenolic compound - gossypol (Jadhav et
al.^ 1989) while phytic and erucic acid in rapeseed adversely affect its utilisation (Reddy et
al.^ 1982).
However, these undesirable factors have been greatly reduced or eliminated by either
successful breeding programs or by processing technologies to improve the nutritional value
of vegetable proteins.
1.4.3 DIVERSE APPLICATIONS
Plant proteins are not merely an economic source of protein for low income populations, they
are increasingly used as valuable ingredients in many processed food systems. Processing
technology stimulated many swift and dramatic changes in the utilisation of vegetable
proteins, resulting in a tremendous increase in their production and use since the end of
World War II in 1945.
Traditional foods based on grain legumes, particularly soybean, had been initially limited to
China and other Asian communities. However, they have currently been produced by modern
technology thanks to extensive research and development efforts. UHT soy milk, long shelf
life aseptically packed tofu (a form of soy protein concentrate) and soy milk powder are
available worldwide. In addition to these traditional foods, vegetable proteins have also been
used as ingredients in many food systems. For example, soy proteins have been used in
soups, confectionery products, simulated meats, peanut butter-like spread, high protein
puddings and meaty flavoured products.
Like animal proteins, plant proteins have been used in many and diverse food applications
because, like animal proteins, they can interact with other ingredients to produce desirable
properties. This phenomenon is a result of extensive research activities on the functional
properties of vegetable proteins and their behaviour in food systems. These successfiil
applications have stimulated further investigations of functional properties to expand their
food uses.
1.5 FUNCTIONALITY OF VEGETABLE PROTEINS
Nutritional value is the primary criterion for a new protein. However, the nutritional
value is of Umited use only if the protein or the food in which it is incorporated is not
acceptable. The successful application of a protein as a food ingredient is greatly
dependent on its critical functional characteristics or fimctional properties. Solubility,
gelling, emulsifying and foaming properties, thermal stabihty and rheological properties
are some functional properties which must be considered before proteins can be
incorporated into foods. Functionality or functional properties of a protein are broadly
defined as any physicochemical properties which affect the processing and behaviour of
protein in food systems (Kinsella, 1976). These functional properties are consequences
of the inherent physical and chemical properties of the protein molecules. Consequently,
it is possible to predict, control and produce desirable functional properties for specific
end use applications if there is sufficient understanding of these basic molecular
properties.
Vegetable proteins have been successfully used as ingredients in many food systems.
Therefore there is a need to investigate extensively the fimctionality of vegetable proteins
for both academic understanding and commercial appUcations.
1.6 OBJECTIVES OF THIS INVESTIGATION
This tfiesis is a study of the food appUcations of proteins isolated from chickpea (Cicer
arietinum L). Chickpea is a protein rich grain legume which is widely grown around the
world and has become an important grain legume in Victoria, Australia. The study is
focussed on the preparation of chickpea protein isolates under different processing conditions
followed by the characterisation of these proteins. A pilot scale production of chickpea
protein isolates was conducted. The functional properties of chickpea concentrates or
isolates, prepared on a laboratory and pilot scale were extensively studied. The investigation
was particularly oriented towards an examination of chemical and enzymatic modification of
the isolated chickpea proteins. The effects of those modifications on the functional properties
of chickpea proteins and their consequent behaviours in some food systems were also
investigated.
CHAPTER 2
VEGETABLE PROTEINS and PROTEIN ISOLATION
LITERATURE REVIEW
VEGETABLE PROTEINS and PROTEIN ISOLATION LITERATURE REVIEW
As a main source of protein, grain legumes and oil seeds have played an important role in
human nutrition in China and other Asian countries. Cereals are widely used for bread and
bakery products but have a low level of protein. Pulses, however, not only have higher
protein content but can also be used for various appUcations. Since the nutritional and
economic values of grain legume proteins and particularly of soybean proteins were realised,
extensive investigations on many aspects of these proteins have been conducted. Among
pulses, soybean {Glycine max.) is the most economically important crop which has unique
characteristics of an oil seed and a grain legume. Extensive knowledge and technology
accumulated on this crop would assist the development of other grain legumes and oil seeds
for food applications. Consequently, a brief review of technological knowledge and various
food appUcations of soybean proteins is firstly presented. Then, the current research status
and food applications of proteins isolated from other grain legumes and oil seeds, particularly
of chickpea seeds are also reviewed.
2.1 SOYBEAN
Soybean {Glycine max (L) Merrill Leguminosae) is the most important crop in the US and
perhaps in the world due to its wide applications in animal feed, human foods and industrial
utilisations. Soybean contributes more fat and protein to the American diet than any other
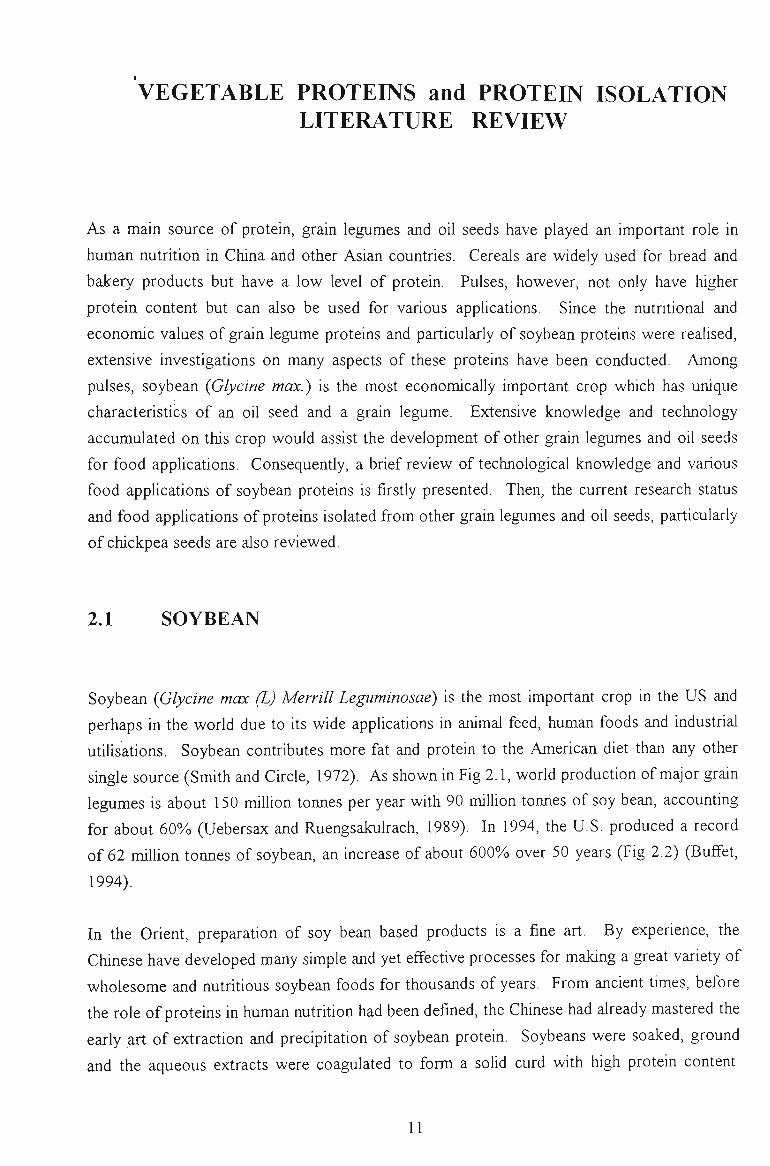
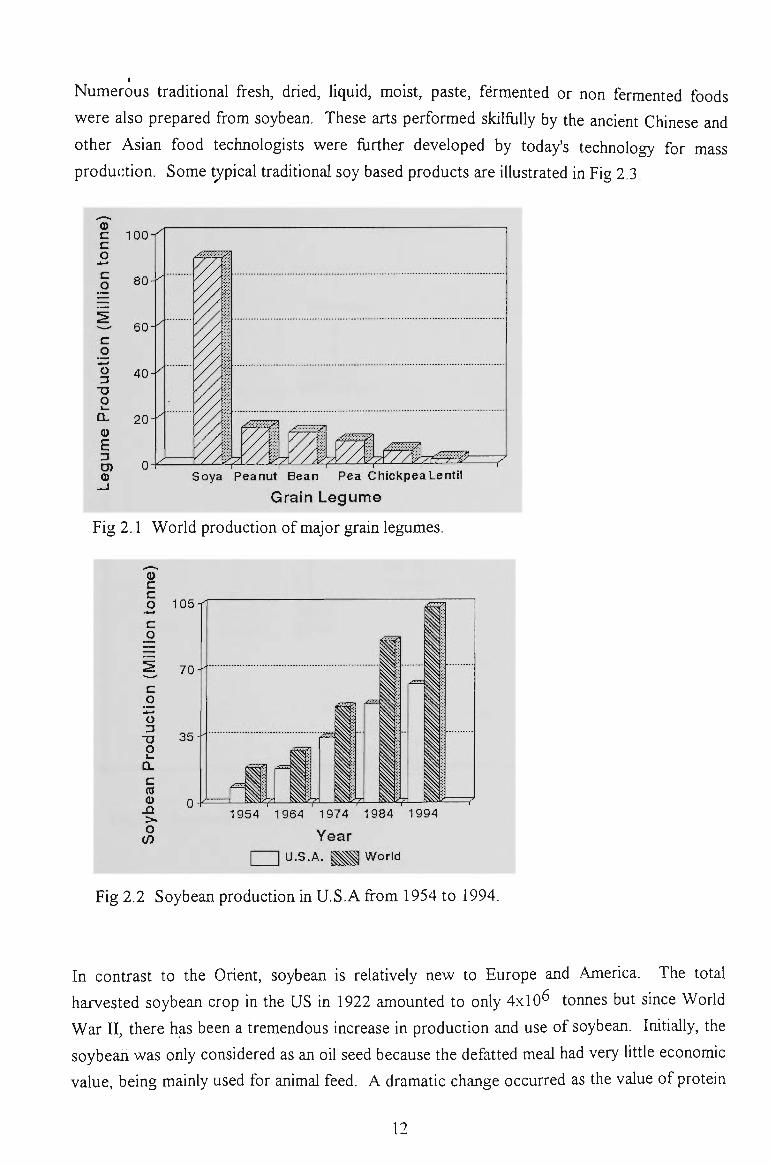
single source (Smith and Circle, 1972). As shown in Fig 2.1, world production of major grain
legumes is about 150 miUion tonnes per year with 90 million tonnes of soy bean, accounting
for about 60% (Uebersax and Ruengsakukach, 1989). In 1994, the U.S. produced a record
of 62 million tonnes of soybean, an increase of about 600% over 50 years (Fig 2.2) (Buffet,
1994).
In the Orient, preparation of soy bean based products is a fine art. By experience, the
Chinese have developed many simple and yet effective processes for making a great variety of
wholesome and nutritious soybean foods for thousands of years. From ancient times, before
the role of proteins in human nutrition had been defined, the Chinese had already mastered the
early art of extracfion and precipitation of soybean protein. Soybeans were soaked, ground
and the aqueous extracts were coagulated to form a solid curd with high protein content.
11
I
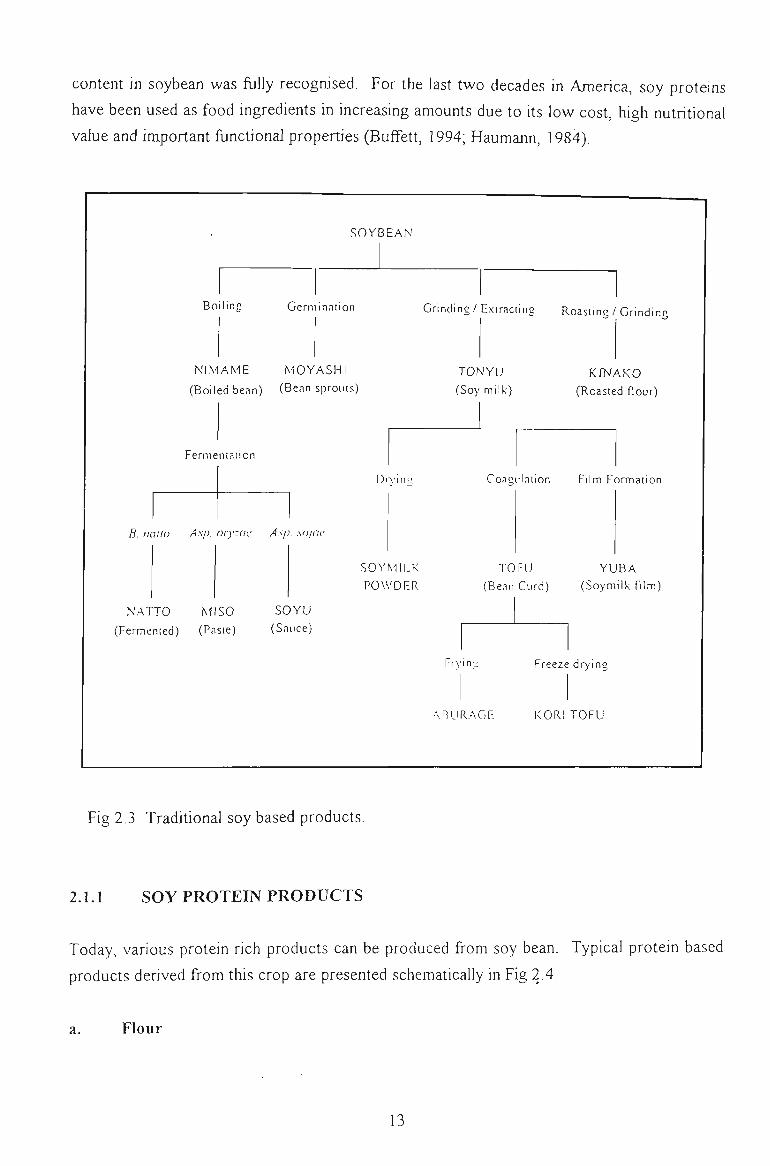
Numerous traditional fresh, dried, liquid, moist, paste, fermented or non fermented foods
were also prepared from soybean. These arts performed skilfully by the ancient Chinese and
other Asian food technologists were further developed by today's technology for mass
production. Some tjypical traditional soy based products are illustrated in Fig 2.3.
a.
E
0) Soya Peanut Bean Pea Chickpea Lentil
Grain Legume
Fig 2.1 World production of major grain legumes.
o c c o c o
c o
o
o
c (0 0) >. o (/}
105
1954 1964 1974 1984 1994
Year i World U.S.A.
Fig 2.2 Soybean production in U.S.A from 1954 to 1994.
In contrast to the Orient, soybean is relatively new to Europe and America. The total
harvested soybean crop in the US in 1922 amounted to only 4x10^ tonnes but since Worid
War II, there has been a tremendous increase in production and use of soybean. Initially, the
soybean was only considered as an oil seed because the defatted meal had very little economic
value, being mainly used for animal feed. A dramatic change occurred as the value of protein
12
content in soybean was fully recognised. For the last two decades in America, soy proteins
have been used as food ingredients in increasing amounts due to its low cost, high nutritional
value and important fimctional properties (Buffett, 1994; Haumann, 1984).
S O Y B E A N
Boi l ing Germination Grinding / E.xiracting Roast ing /Gr ind ing
NIMAME MOYASHI (Boiled bean) (Bean sprouts)
Fermentation
T O N Y U
(Soy milk)
KINAKO (Roasted flour)
Div inu Coagulation Film Formation
B. nana A.\p. oryzac A.s/i .sojac
N A T T O MfSO SOYU
(Fermented) (Paste) (Sauce)
S O Y M I L K
POWDER
TOFU Y U B A
(Bean Curd) (Soymilk f i lm)
Fn'in'. Freeze drying
•\RURAGE K O R I T O F U
Fig 2.3 Traditional soy based products.
2. L1 SOY PROTEIN PRODUCTS
Today, various protein rich products can be produced from soy bean. Typical protein based
products derived from this crop are presented schematically in Fig 2.4.
a. Flour
13
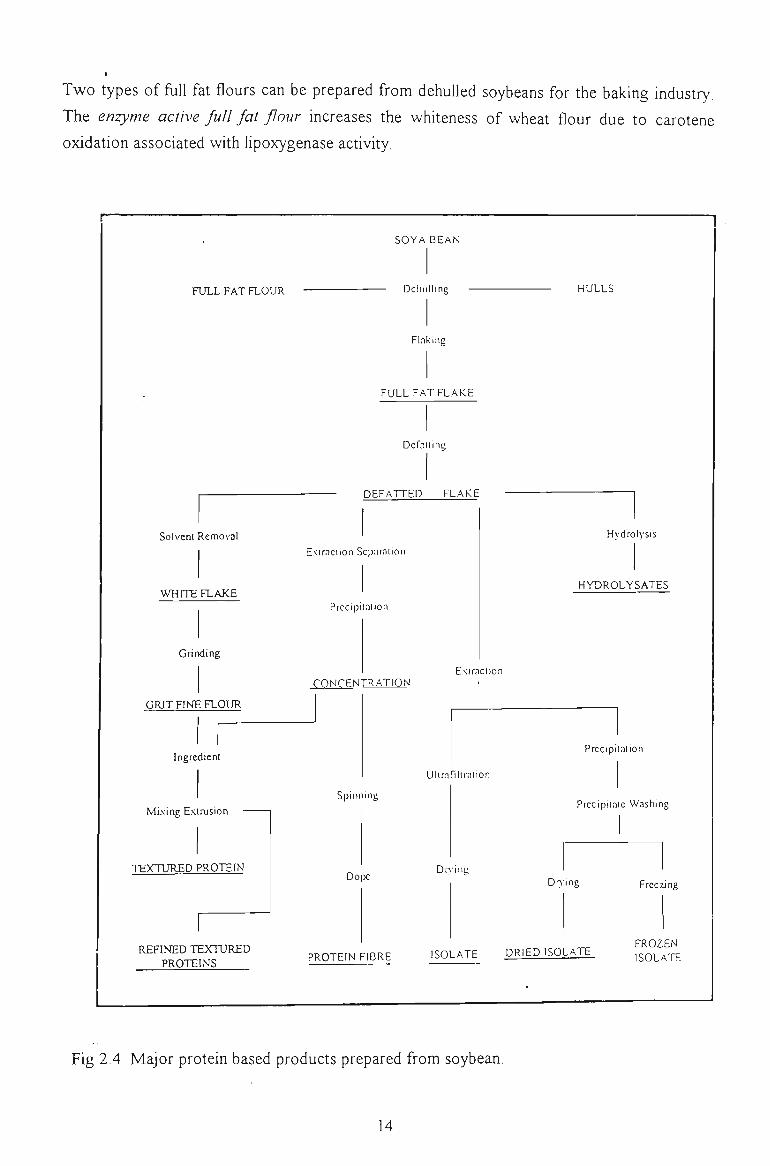
Two types of fiill fat flours can be prepared from dehulled soybeans for the baking industry.
The enzyme active full fat flour increases the whiteness of wheat flour due to carotene
oxidation associated with lipoxygenase activity.
FULL FAT FLOUR
Solvent Removal
WHITE FLAKE
Grinding
GRIT FINE FLOUR
Ingredient
Mbcing Extrusion
TEXTURED PROTEIN
REFINED TEXTURED PROTEINS
SOYA BEAN
Dcliulling
Flaking
FULL FAT FLAKE
Derailing
DEFATTED FLAKE
E.Niraciioii Separation
Prccipilalion
rONCENTRATIGN Exiraclion
Ullraniualion
Spinning
D0|5C Diving
HULLS
Hydrolysis
HYDROLYSATES
Prccipilalion
Prccipilaie Washing
DPiing
PROTEIN FIB RE ISOLATE DRIED ISOLATE
Freezing
FROZEN ISOLATE
Fig 2.4 Major protein based products prepared from soybean.
14
The flour also improves the machinability of a dough. The enzyme deactivated full fat flour
can be made from system treated and dried, dehulled soybeans. The protein content in the
full fat flours is about 25-50%. The shelf life of a flour is affected by the oil content. A high
oil flour will have more risk of fat oxidation and a shorter shelf life. Consequently, soybean
flour with low, medium and high oil levels are now prepared. Also, lecithinated soy flour is
produced by mixing lecithin at a 15%o level with low or defatted soy flour. Defatted flour can
be made from defatted conditioned soy meal or soy flakes. The oil extraction with hexane, at
a low temperature, will cause little denaturation of the protein. The temperature and process
used to extract oil affects the functional properties of soy protein.
b. Flakes and Grits
Dehulled soybeans are conditioned, pressed and roUed to thin flakes with 250-370|j,m in
thickness, before solvent extraction. The flaking process assists the oil extraction by
disrupting intact cotyledon cells, increasing the solvent penetration capacity by forming
suitable beds for solvent flow. The defatted flakes can be made into grits of various sizes:
coarse (750-3350|j,m), medium (400-750|j,m) and fine (170-400|im) particles. Soy grits have
been used in the largest volume by the food industry since grits are the most economic source
of protein concentrate with desirable functional properties. In fact, grits and defatted soy
flour, are differentiated only by particle size. Like defatted soy flours, the quality and
functional properties of grits are affected by the particle size and the degree of heat treatment.
c. Protein Concentrates
Soy protein concentrates with at least 65% protein content (FAO, 1987) are produced from
defatted flakes by removing non-protein soluble components such as carbohydrates, ash and
peptides. There are three principal processes to insolubiUse or concentrate proteins based on
heat, acid or alcohol treatment (Berry, 1987). For the heat treatment, the defatted flours or
flakes are extracted with hot water (65-95°C) at pH 5.5-7.5 and the solids are separated by
centrifiigation. For acid extraction, proteins are insolubiUsed at their isoelectric points (pH
4.5) and soluble carbohydrates, minor proteins and other non-protein materials are removed.
For ethanol extraction, defatted flours are mixed with 60-80%o concentration aqueous ethanol.
Most of the protein is insoluble and soluble oligosaccharides are removed. All three
processes give soy protein concentrates with similar composition but different functional
properties for different food systems.
d. Protein Isolates
Protein isolates contain over 90% protein, produced also from defatted flakes. The proteins
15
I
are initially solubilised with dilute alkali (pH 10). The soluble proteins are then separated
from insoluble carbohydrates and non-protein components by filtration or by centrifiigation.
The clarified extracts can be concentrated by either isoelectric precipitation or by membrane
filtration. The concentrated curd or precipitate is then washed several times to remove more
non protein components, neutraUsed, freeze dried or spray dried.
e. Textured Soy Proteins
Texturized soy proteins can be made from soy flours, grits or concentrates. These soy
components are mixed with other ingredients (flavours, colours, nutrients) then the mixture is
passed through a cooker-extruder. The wet protein mixture is converted into a plastic mass
by an elevated temperature and pressure inside the extruder, before being extruded through a
die. Due to the drop of pressure and temperature through the die, the plastic mass expands
and forms a fibrous product. When the dried fibrous product is hydrated, a chewy textured
protein is obtained.
f. Spinning Protein Isolates
Fibres are produced by extruding a soybean protein dispersion through spinnerets, into an
acidic coagulating bath. The fibres are then heated, neutralised, washed, and cut into
different lengths. Soy proteins can also be mixed with other proteins such as milk protein or
caseinate to enhance the nutritional value or to improve the performance of this process.
g. Protein Hydrolysates
Soy proteins can be hydrolysed by enzymes or acids to give a mixture of proteins with smaller
molecular weights, larger peptides and amino acids. The hydrolysed proteins or hydrolysates
are flavouring ingredients. They have also been used for infant formula.
2.1.2 VEGETABLE PROTEIN ISOLATION
Protein concentrates and protein isolates from animal sources such as milk or fish and
vegetable sources such as soybean or other oil seeds and non oilseeds could be prepared by
several procedures (Fig 2.5). Basically, there are two major approaches to fractionate plant
proteins: dry and wet methods. The former has rather limited appUcation because it fails to
fractionate oil seeds or seed with low starch level (Sosulski and McCurdy, 1987). The wet
method has wider application.
16
grinding
raw material
i SKIM MILK
by-products extraction Drying
Extraction
Protein Extraction
Precipitation of protein
Ultrafiltration
WHEY
FISH
PLANT LEAF
OIL SEED
BACTERIAL BIOMASS
Concentrated Protein
ra ski^l milk-powder
concentrated whey powder
fish protein concentrate
leaf protein concentrate
concentrates and isolates of oil seed proteins
high valued by-products
bacteria! protein isolates
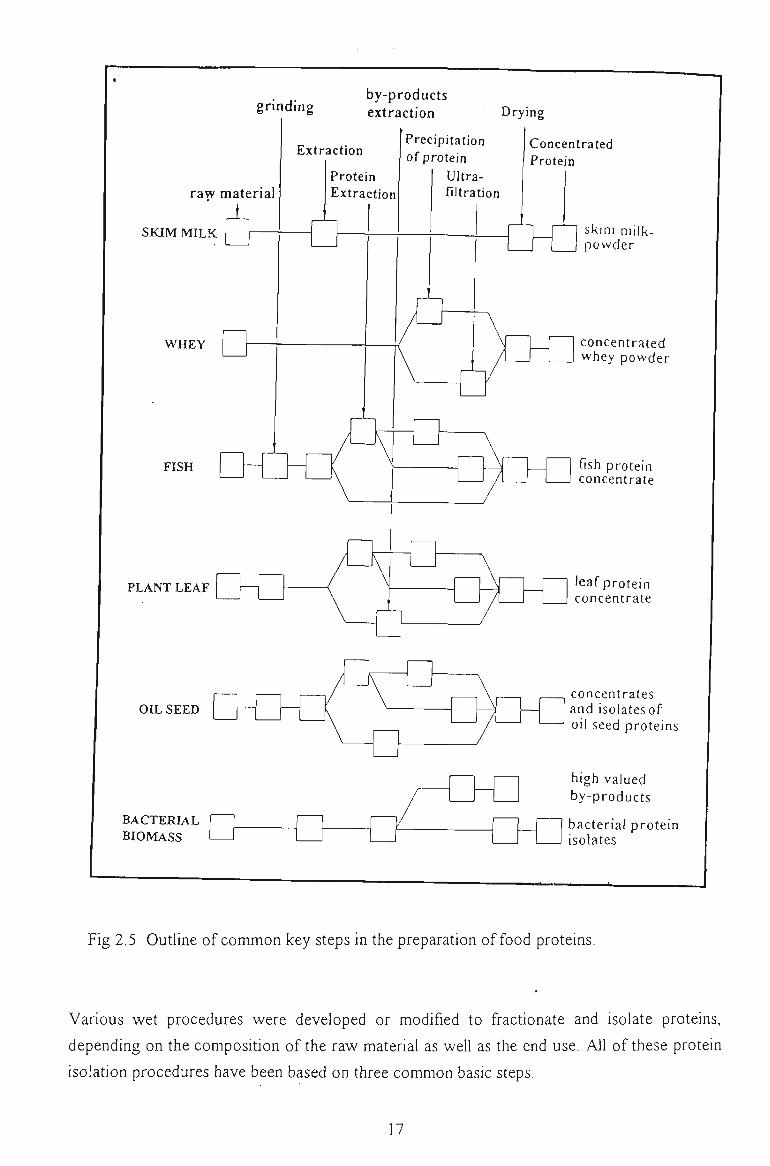
Fig 2.5 Outline of common key steps in the preparation of food proteins.
Various wet procedures were developed or modified to fractionate and isolate proteins,
depending on the composition of the raw material as weU as the end use. All of these protein
isolation procedures have been based on three common basic steps.
17
1. Solubilisation of proteins from raw materials
2. Concentration of solubilised proteins
3. Purification of isolated proteins
An extraction process is usually based on the specific protein solubiUty of the investigated
protein which is a function of extraction pH. For all grain legumes, proteins are most soluble
at alkaline or acidic pHs but almost insoluble at isoelectric pHs. A typical process includes
the solubilisation of proteins at pH 8.5-9 in aqueous medium followed by the concentration of
soluble proteins by precipitation at isoelectric pH (4.2-4.5). Finally, the concentrated protein
-curd or protein precipitate will be purified by washing several times to remove more
carbohydrates and non-protein components, before drying. This is a very common process,
employed for extraction of both oil seeds such as soybean (Johnson and Kikuchi, 1989),
cottonseed (Berardi et al, 1969), peanut (Cater et al, 1974) or non oil seeds such as field
pea (Madsen and Buchbjerg, 1987), lupin (Manrique and Thomas, 1976) and faba bean
(Gueguen, 1991).
Recently, ultrafiltration (UF) or membrane technology has also been used to fractionate and
concentrate solubilised proteins. Soy protein isolates have been produced by using a
combined UF and continuous diafiltration process (Pompeic et al, 1976). A soy protein
isolate with about 90%) purity was produced by discontinuous diafiltration or UF process
(Lawhon, 1983) while a soy flour extract was concentrated to produce an isolate with about
88% protein by direct ultrafiltration.
For oilseed such as soybean or rapeseed, the process was modified to simultaneously extract
and recover both oU and protein (Eapen et al, 1969; Lawson et al, 1981). The protein
solubilisation step can also be combined with other treatments to remove anti nutritional
factors. To deactivate proteinase inhibition, defatted soy flour was treated with heat before
being fractionated with aqueous alcohols to produce protein fractions with different
compositions and characteristics. Heat treatment was also used to remove gossypol from
cotton seeds (Lusas and Jividen, 1987) or inactivate myrosinase from rapeseed (Eapen et al,
1969). Sosulski et al. (1973) diffused chlorogenic and quinic acids from sunflower kernels
using aqueous solvents. Chango et al. (1993) debittered lupin proteins with calcium alginate.
The solubilised proteins could be concentrated mainly by coagulating at isoelectric pHs, using
acids. The precipitation usually occurs at a single pH but El Nockrasky et al (1977)
improved the yield of rapeseed protein isolate by a two stage precipitation procedure at pH
6.0 and 3.6. Salts were also used as coagulants, either calcium sulphate or nigari (seawater
salts) was used to produce tofii or bean curd.
18
•
There are several factors associated with various procedures presented in this review, which
could affect the protein extraction yield and the functional properties of the isolated proteins.
Information on the physicochemical properties and the effects of processing conditions on
the functional properties of the isolated proteins is essential for their application in food
systems.
2.1.3 FUNCTIONAL PROPERTIES OF SOY PROTEINS
As shown in Fig 2.3 and Fig 2.4, various traditional and convenience foods have been
prepared from whole soybean seeds or from soybean proteins. These products are well
accepted. Novel applications of soybean protein in food and related industries have been
extensively- sought. Nutritional quality and relatively low cost are two major factors
contributing to the great increase in soybean protein production and diverse protein
based food products. Another important factor affecting the utilisation of soybean
proteins is its functional attributes. Functional properties or functionality encompass
any physicochemical property which affects the behaviour of protein in a food system
(Kinsella, 1976). The major functional properties of soybean proteins are solubility,
water absorption, hydration and swelling, dispersity, coagulation and gelation, oil
absorption, emulsifying capacity and stability, foam forming capacity and stability, flow
properties and cohesion. As food ingredients, soy proteins have to provide one or more
of these key functional attributes in the storage, preparation and utilisation of a food
product. The functional contribution and modes of action of soy protein in different
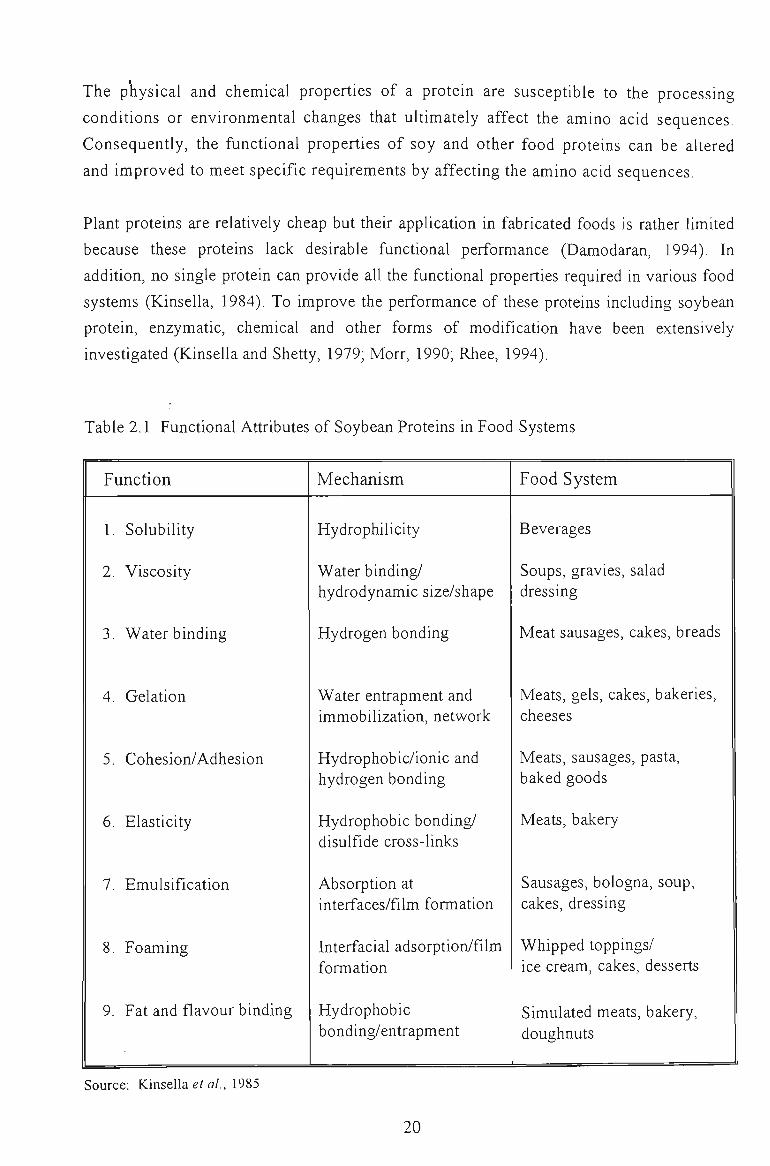
food systems are given in Table 2.1.
Like other food proteins, the functional properties of soybean protein are a consequence
of its inherent physical and chemical properties. The physical and chemical properties
affecting the functional properties of a protein are ultimately related to amino acid
sequence. The three dimensional structure of a protein is dictated by its amino acid
sequence. The thermodynamic stability, charge distribution and arrangement of
hydrophilic and hydrophobic patches are also influenced by the amino acid sequence.
Since the thermodynamic requirement dictates the folding of a protein, in order to
achieve the lowest possible level of the global free energy, hydrophobic groups are
buried inside while hydrophilic groups and charged residues are exposed on the protein
surface. However, not all hydrophobic groups are completely buried in the interior.
Some are located on the protein surface and the distribution of these hydrophobic
cavities influences the shape of a protein and also its functional properties (Damodaran,
1994).
19
The physical and chemical properties of a protein are susceptible to the processing
conditions or environmental changes that ultimately affect the amino acid sequences.
Consequently, the functional properties of soy and other food proteins can be altered
and improved to meet specific requirements by affecting the amino acid sequences.
Plant proteins are relatively cheap but their application in fabricated foods is rather limited
because these proteins lack desirable functional performance (Damodaran, 1994). In
addition, no single protein can provide all the functional properties required in various food
systems (Kinsella, 1984). To improve the performance of these proteins including soybean
protein, enzymatic, chemical and other forms of modification have been extensively
investigated (Kinsella and Shetty, 1979; Morr, 1990; Rhee, 1994).
Table 2.1 Functional Attributes of Soybean Proteins in Food Systems
Function
1. Solubility
2. Viscosity
3. Water binding
4. Gelation
5. Cohesion/Adhesion
6. Elasticity
7. Emulsification
8. Foaming
9. Fat and flavour binding
Mechanism
Hydrophilicity
Water binding/ hydrodynamic size/shape
Hydrogen bonding
Water entrapment and immobilization, network
Hydrophobic/ionic and hydrogen bonding
Hydrophobic bonding/ disulfide cross-links
Absorption at interfaces/film formation
Interfacial adsorption/film formation
Hydrophobic bonding/entrapment
Food System
Beverages
Soups, gravies, salad dressing
Meat sausages, cakes, breads
Meats, gels, cakes, bakeries, cheeses
Meats, sausages, pasta, baked goods
Meats, bakery
Sausages, bologna, soup, cakes, dressing
Whipped toppings/ ice cream, cakes, desserts
Simulated meats, bakery, doughnuts
Source: Kinsella e a/., 1985
20
The spectacular growth of soybean production and its enormous economic value has
attracted extensive research, particularly on protein fractions which were initially considered
only as a by product. This dramatic success has stimulated substantial investigations of other
protein bearing grain legumes as a new source of vegetable proteins (Hulse, 1991). The
search for novel applications of these vegetable proteins is expanding rapidly and the current
research and development status of these proteins is summarised in the following section.
2.2 OTHER PROTEIN SOURCES
2.2.1 PEANUT
Peanuts or ground nut (Arachis hypogae L.) account for 14% of oilseeds (2.8 x lO' tonnes)
and 4% of protein meal produced annually in the worid (4.4 x 10^ tonnes) (Lusas et al,
1989). India and China are the two major peanut producers. Interest in peanut proteins as
nutritional and functional ingredients in foods has increased due to the bland flavour and low
level of some anti nutritional factors (Ayres and Davenport, 1977; Conkerton and Ory, 1976).
Aflatoxin contamination is the only problem which requires attention.
Peanut protein concentrates and isolates with over 90% protein were obtained by
conventional processes including alkali extraction and isoelectric precipitation (McLean,
1941; Bock, 1968; Cater et al, 1974). An ultrafiltration membrane technique was also
developed (Lawhon and Lucas, 1984). Simultaneous aqueous extraction of oil and protein
was investigated (Rhee et al, 1972, 1973). The effect of pretreatments of peanut meal and
protein extraction conditions on the quality and functional properties of peanut proteins have
been extensively studied (McWalters et al, 1976; Ramanatham et al., 1978; Ihekoronye,
1987). Aboagye and Stanley (1985) reported that high temperature, high feed moisture and
low screw speed affected the characteristics of extruded peanut products.
The essential limiting amino acids in peanut protein are lysine, threonine and methionine. Mild
heat treatment can inactivate anti nutritional factors and enhance digestibility of peanut
proteins (Ananatharaman and Carpenter, 1969). The functional properties (Ramanatham et
al, 1978; McWatters et al, 1976) and the effects of chemical and biological modification of
peanut proteins (Beuchat, 1977) have been investigated.
For food use, peanut flours and proteins have been incorporated in snack food (Toft, 1986),
cake type doughnuts (McWatters, 1982), Chinese noodles (Chompreeda et al, 1987), breads
21
(KhaUl and Chushtai, 1984), hamburger and texture proteins (Ayres and Davenport, 1977;
Aboagye and Stanley, 1985).
2.2.2 COTTONSEED
Cotton seed {Gossypium Hirsutum L, Aboreum L.,Barbadense L or Herbaceum L.) is the
second major oilseed in the worid, (2.8 x lO' tonnes), with the potential to provide enough
protein at 45g / day / person for approximately 350 million people (Lusas and Jividen,
1987a). Although cottonseed contains about 22.5%) protein with good nutritional quality, a
high level of gossypol in the gland forms a major obstacle for food uses of this protein source
(Yoo and Hsueh, 1985; Valle et al, 1986)). Gossypol is a yellow green polyphenolic
compound, toxic to man and monogastric animals (Gray and Leffler, 1981). Consequently,
cottonseed and its derivatives have been limited primarily to cattle and other ruminants. The
American FDA and FAO/WHO have set a tolerance level of free gossypol for food use at
450-600 mg (Lusas and Jividen, 1987b).
Promising work has been done by McMichael and other workers (MiraviUe, 1972) to provide
glandless cottonseeds free of gossypol, using genetic engineering approaches or by plant
breeding. The level of total gossypol was reduced from 1.2% to 0.02% in glandless cotton
seeds (Lusas and Jividen, 1987). Other processes to remove gossypol include solvent
extraction, heat treatment or selectively binding gossypol with ionic salts (Lusas and Jividen,
1987; Gardner et al, 1976; Hanumantha Rao et al, 1987; Valle et al, 1985).
Cottonseed proteins were prepared from defatted glandless cottonseed flour. The proteins
consisted of two fractions. Storage protein was soluble at high and low pHs while non
storage protein was more soluble at neutral pH. The essential amino acids of each fraction
were slightly different (Martinez et al, 1969; Lawhon et al, 1975). Protein concentrates
were prepared by aqueous acidic extraction (Lawhon et al, 1972) and spray drying.
Concentrates were also prepared by pin milling and air classification (Martinez et al, 1969).
Isolates were prepared by dilute alkali extraction and acidic precipitation (Martinez and
Hopkins, 1974) or by leaching the proteins soluble at neutral pH with water, followed by
acidification (Berardi et al, 1969; El Tinay et al, 1980; El Tinay et al, 1988). Other
processes reported include aqueous extraction processing based on gravity separation (Rhee
et al, 1973) or by industrial ultrafiltration membrane processing (Lawhon et al, 1972;
Lawhon et al, 1974; Hensley et al, 1977). Lawhon (1983) combined the classical alkali
extraction of bland glandless cottonseed with the membrane separation of the extracts to give
a retentate of 7S and 1 IS type proteins. These were spray dried to yield the protein isolate.
22
Functional properties of cottonseed protein such as water holding, oil holding, emulsifying
and foaming capacities were greatly improved by acylation or enzymatic modification (Choi et
al, 1983; Childs and Forte, 1976).
The potential appUcation of cottonseed proteins for food use has not been extensively
investigated. The proteins, however, have been used in bread (Khan and Rooney, 1977; Khan
et al, 1976), children's foods or high protein curds (Hayes et al, 1986; Choi and Rhee,
1984), meat products (Lawhon et al, 1972; TerreU et al, 1981), beverages (Lawhon et al,
1974) and desserts (Simmons et al, 1980).
2.2.3 RAPESEED
Rapeseed or Canola {Brassica campestris L., B. napus L.) is a major oil seed, accounting for
10% (2 X 10^ tonnes) of world's oilseed production and 10% (1.1 x 10^ tonnes) of worid
protein meal (Lusas et al, 1987). The leading producers of rapeseed are China, Canada, the
European Economic Community (EEC) and India.
The protein content in the defatted rapeseed meal is low (34%o) but its protein contains an
excellent essential amino acid profile with 6% lysine and 3-4% methionine and cystine
(Sosulski, 1983). Phytic acid, erucic acid and glucosinolates in rapeseed have adversely
affected its utilisation. Phytic acid forms stable complexes with basic amino acid residue,
decreasing the solubility of rapeseed proteins and affecting their functional properties. The
glucosinolates are hydrolysed by the enzyme myrosinase, under some circumstances, to
produce physiologically harmful compounds such as isothiocyanates and oxazolidinethione
(Van Etten et al, 1969; Kozlowska, 1983). Excess erucic acid in the diet may cause liver
diseases. New varieties of rapeseed developed in Canada and in Europe are almost free of
erucic acid (less than \%) in the seed oil.
Several procedures were developed to remove glucosinolates and phenoUc compounds
including aqueous extractions of rapeseed meal or ground rapeseed or by diffijsion from
intact rapeseed (Ballaster et al, 1970; Sosulski et al, 1972). A typical process to produce
rapeseed protein includes mild heat treatment, myrosinase inactivation, solvent oil extraction
and glucosinolate removal (Eapen et al.. 1969; Mieth et al, 1983). Sosulski and Bakal
(1969) prepared rapeseed isolates by alkali extraction and acid precipitation. The process
gave a low protein recovery (50%)) and inferior quality products. El Nockrasky e/cr/. (1977)
improved the yield by a two stage precipitation procedure at pH 6.0 and pH 3.6, with the
isolates containing up to 98.6%) proteins. Recently, Tzeng et al (1990) designed a process
consisting of extraction of oil free meal at pH 10-12, isoelectric precipitation to recover
23
proteins and ultrafiltration followed by diafiltration to concentrate and purify the acid soluble
proteins. Compared with soy protein, rapeseed protein concentrates exhibit a lower solubility,
oil emulsification, whippability and viscosity (Sosulski etal, 1976).
Rapeseed proteins have been used in bread (Kodagoda et al, 1973) and meat products
(Sosulski et al, 1976). However, the use of rapeseed proteins in foods is limited (Tzeng et
al, 1990), due to their adverse organoleptic properties, the level of glucosinolates and
complex extraction process.
2.2.4 SUNFLOWER SEEDS
Sunflower seeds {Helianthus annuus L. var. marcocarpus DC.) account for 10%) of the
world's oil seed production and 7% of vegetable proteins is produced from the meal of
sunflower seeds (Lucas et al, 1989). The defatted flour contains about 60% protein which,
except for low lysine content, has an excellent amino acid balance (Lawhon et al, 1982;
Sosulski and Fleming, 1977).
Sunflower proteins have unique organoleptic and functional properties (Sosulski, 1979). A
most unique characteristic of sunflower is its very low level of toxic components (Lusas,
1985). The only major deterrent to the use of sunflower seed is its chlorogenic acid content.
This colourless phenolic compound, under alkali extraction conditions, will change to an
irreversible olive green colour (Sabir et al, 1974). As a result of the oxidation of
polyphenoUc compounds, either autolytically under alkaline conditions or by
polyphenoxidase, stable bonds are formed between phenoUc compounds and proteins and the
green colour is irreversible (Loomis and Battaile, 1966; Sosulski et al, 1972).
Several methods were developed to prevent this oxidation by controlling three factors
thought to be responsible for the colour development: alkaline pH, oxygen, and
polyphenoxidase. Sosulski et al. (1973) extracted chlorogenic and quinic acids from
sunflower kernels using aqueous solvents. Oxygen expulsion and exclusion techniques were
also investigated (Lawhon et al, 1982).
Functional properties of native (Brueckner et al, 1986; Lin and Humbert, 1974), chemically
(Schwenke and Ranschal, 1983) and enzymatically modified (Jones and Tung, 1983)
sunflower proteins have been investigated. Sunflower proteins have exceUent fat absorption,
oil emulsification and whipping properties. Succinylation and acetylation of sunflower protein
improved water solubility, water absorption and oil emulsification (KabiruUah and Wills,
24
1982). Protein solubility and water hydration capacity was increased by trypsin hydrolysis
(Jones and Tung, 1983).
Sunflower proteins are relatively low in lysine but rich in other essential amino acids,
particularly methionine and cysteine (Sosulski and Fleming, 1977). Sunflower proteins were
compared favourably with soybean flour and casein in terms of PER, feed consumption and
weight gain in rat feeding trials. There were significant differences in feed consumption and
weight gain but the PER of sunflower protein was much lower than that of soybean.
For food use, sunflower flour and proteins have been used in meat products (Brueckner et al.,
1982), in biscuits (WiUs et al, 1984) and in bread (Sosulski and Mahmoud, 1979).
2.2.5 LUPIN
Lupin {Lupinus spp) is a valuable source of protein for both animal feed and human
consumption because of the high yield of protein in the seed (up to 48%o), which compares
favourably with soybeans (Cerletti, 1983). Australia is the world's major lupin producer,
producing 916,000 toimes per year over 6 years to 1992 (Petterson and MacKintosh, 1994).
Although lupin is similar to soybean in terms of protein content and amino acid profile, its
application in human foods was Umited due to bitter and toxic alkaloids (up to 2.5%)
(Hudson, 1979) and, to some extent, a high level of manganese (up to 4,500 ppm) (Hung et
al, 1988). New sweet varieties, developed in Western Australia, almost free of quinoUzidine
alkaloids have enhanced the food use prospect of lupin (Aquilera and Trier, 1978).
Lupin proteins have been extensively investigated. Early works revealed different types of
globulin which constitute the major protein component (87%)). The albumin fraction accounts
for only 5-13%) of the total protein, which varied with varieties (Cerletti et al, 1978;
Blagrove and GiUespie, 1978). The globulin fraction was extensively studied by several
investigators (Blagrove and Gillespie, 1975; Casero etal, 1983).
Typically, lupin protein isolates were prepared by alkali extraction and acid precipitation from
commercial flours. The extract was dissolved at pH 7 and spray dried. Manrique and Thomas
(1976) employed various isolation procedures to prepare lupin protein concentrates and
isolates from lupin flour or whole seed. This included single and double extraction processes
in either alkaline or acidic conditions. The effect of extraction conditions on the functional
properties of the resultant proteins was also investigated. The isolates were also prepared by
ultrafiltration and diafiltration (Pompei and Lucisano, 1976). Recently, Chango et al (1993)
25
I
proposed a new process to precipitate and simultaneously debitter lupin proteins by
coagulating in an aqueous medium.
The functional properties of lupin isolates prepared under different conditions were
investigated (Oomah and Busmuk, 1983; King et al, 1985). Lupin protein isolates exhibited
better solubility than soy isolate and similar emulsification capacity. Swelling and gelation
were inferior but modification of extraction processes improved these properties. Foaming
capacity could also be improved by adding salt or some carbohydrates (Sathe et al, 1982).
The potential of lupins as a protein source for human consumption, and its nutritional
evaluations, have been extensively investigated (Egana et al, 1992). Various applications
have been studied including lupin sprouts, fermented foods from lupin seeds such as tempeh
and soy sauce (Hung et al, 1993), tofu supplemented with lupin extracts (Hung et al, 1986),
breads and noodles supplemented with lupin proteins or flours (Hung and Nithianandan,
1993; Ballester et al, 1984). Romana et al (1983) studied the quality of lupin protein in
children foods.
2.2.6 SAFFLOWER
World production of safflower {Carthamus tinctoria L.) has increased with the increasing
production of vegetable oU. By 1985, safflower seed and oil production were 1.2 and 0.4
milUon toimes, respectively (FAO, 1985). Defatted meal, a by-product of the oil extraction
has been considered as a potential source of vegetable protein for human consumption.
Mexico and India are the two major producers of safflower in the world. (Betschart, 1975,
1979)
Safflower proteins are low in lysine, threonine, isoleucine and leucine but contain adequate
amounts of other essential amino acids (Betschart and Sawnders, 1978; Paredez-Lopez and
Ordorica-Falomir, 1986). The PER values for all safflower protein isolates are lower than
those of casein. Also, the phenoUc glucosides associated with the bitter taste and cathartic
activity are undesirable factors, thus preventing the safflower meal from being utiUsed as a
food product (Lyon et al, 1982).
Safflower was originally grown for the dyestuff carthamin and recently for its excellent
polyunsaturated oil (80%) Unoleic acid). As an oilseed, safflower seed contains only 14-18%
protein. However, defatted safflower meal could contain up to 40%o protein and has been
used as the raw material for flours, protein concentrate and isolates (Paredez-Lopez and
Ordorica-Falomir, 1986).
26
Safflower proteins were prepared from the seed or defatted meal by alkaline extraction and
acid precipitation with 80%) protein recovery (Arntfield et al, 1985; Betschart and Saunders,
1978). Also, miceUization isolates could be prepared by a micelUzation technique comprising
a dilution of previously ultrafiUered protein concentrate extracts from a neutral salt solution
(Paredez-Lopez and Ordorica-Falomir, 1986).
Compared with soybean protein, safflower protein isolate (SPI) exhibits favourable solubility
and foaming properties (Paredez-Lopez and Ordorica-Falomir, 1986). Extraction conditions
such as the precipitation pH, neutralisation and precipitation could change the composition
and quality of SPI. For example, SPI precipitated at pH 6 was more soluble at acidic pH
values and performed better in wheat flour breads than did SPI precipitated at pH 5 or
isolates produced by a micelUzation technique. These isolates were more soluble than those
obtained from isoelectric precipitation (Paredez-Lopez and Ordorica-Falomir, 1986).
Various treatments for oil extraction showed only minor effects on the fimctional properties
of the resulting protein isolates.
The potential use of safflower protein for human food has been reviewed (Paredez-Lopez et
al, 1991). Safflower protein could be compared with soy protein in baked products and
beverages (Ranhotra et al, 1974; Bertchart et al, 1979). Food use of safflov/er protein is so
far limited. For wider application, the bitter flavour and harmful cathartic activity must be
removed (Palter et al, 1972).
2.2.7 FABA BEAN
The world production of faba bean or field bean {Vicia faba L.) from 1989 to 1991 was
estimated at 4.2 x 10^ tonnes per year and accounted for 7.3% of the world production
of major food and feed legumes (Oram, 1992). This old crop has recently attracted more
interest since the seeds have high protein levels.
Genetic and phenotypic factors greatly affect the level of protein which varies from 26-
39%) in the seed. Compared with soy bean protein, faba bean protein has lower sulphur
amino acid and a deficiency of tryptophan (Bhatty, 1974) Faba bean is stiU mainly used
for animal feeding but its appUcation for human foods has been extensively investigated.
Faba bean protein concentrates and isolates have been prepared by either wet or dry
processes. The wet processes employed by several investigators (Gueguen, 1991; Flink
and Christiansen, 1973; Vose et al, 1976; Gueguen, 1980) consisted of alkaU extraction
and acid precipitation steps. The process gave a recover)' yield of 65% total protein, with
27
highly purified (90-95%) protein isolates. This process was ftirther modified by a salt
extraction micelUzation technique (Arntfield et al, 1985), using ultrafiltration to recover
the extracted proteins instead of acidification (Olsen and Anderson, 1978; Berot et al,
1987). Other factors affecting the yield and quality of the extracted proteins, such as
extraction pH, solvent and ionic strength, have been examined (Ismond et al, 1986; Gueguen
1980).
Faba bean flour was fractionated into a starch and protein rich fraction by pin milUng and air
classification (Vose et al, 1976). This dry process produced two protein rich fractions
containing 69 and 50%o protein, respectively.
Functional properties of native and denatured faba bean proteins, and the influence of the
processing parameters on fijnctionality, have been reported (Schwenke et al, 1981;
Schwenke et al, 1983; Summer et al, 1981; Bau et al, 1979). Some functional properties
of faba bean proteins were improved by acetylation, succinylation or enzymatic treatments
(Schmandke et al, 1981; Ludwig and Ludwig, 1985). Combinations of enzymatic and
mechanical treatment could also improve some functional properties of faba bean proteins
(Behnke et al, 1982). Digestibility of native and modified faba bean protein has also been
examined (Krause et al, 1984).
A review of the food applications of faba bean proteins by Simpson (1983) summarises the
direct use of faba bean for human consumption (Simpson, 1983). Faba bean proteins were
incorporated into noodles, breads (Youssef and Bushuk, 1986) but major applications related
to meat products such as sausage (Muschiolik et al, 1982), fried hamburgers and frankfurter
type sausages (Muschiolik et al, 1982). Faba bean proteins have been used to prepare
special bread in USA (Lareo and Bresani, 1982), Egypt (Abdel-Hamid et al, 1986) and in
infant formulae (Begrat, 1981).
2.2.8 FIELD PEA
The total world production of field pea or garden pea {Pisum sativum L.) in 1991 was 1.7 x
10^ tonnes and accounted for 29% of major food and feed legumes (Oram, 1992). Field pea
is a high yield crop (1.8 tonne/ha). The yield increased about 59%o over the last ten years and
yields up to 4-5.5 tonnes/ha have been reported (Sunrner et al, 1979; FAO, 1990). The seed
has a high protein content (26-35%)) with an exceUent lysine level. To date, the major use of
field pea has been limited to animal feed, but more recently, the potential utilisation for human
consumption has attracted much interest (Klein and Raidh, 1986).
28
Field pea protein concentrates have been prepared either by wet methods or by air
classification. Wet methods included wet miUing, ultrafiltration, diafiltration or enzymatic
coagulation. The isolated protein exhibited exceUent properties for meat sausages (Madsen
and Buchbjerg, 1987). Sumner et al (1981) produced sodium proteinate and isoelectric
proteins from field peas by alkaU extraction and precipitation at the isoelectric point,
respectively. Different drying processes such as freeze, spray and drum drying affected the
chemical composition and functional properties of the products.
Sosulski and McCurdy (1987) fractionated field pea flour to produce protein isolates by pin
miUing and air classification. These isolates were compared with those isolates from acid and
alkaline wet extraction. The air classified field pea proteins exhibited excellent whippability
and foam stability compared with soybean proteins, indicating their potential use in meat
emulsions, beverages and bakery products.
The major obstacles for human consumption are the high level of tannin (Wassimi et al,
1988) found in some varieties of field pea and the off flavours encountered in some field pea
products.
2.2.9 SEVGLE CELL PROTEIN
Recently, proteins produced by microorganisms such as yeast, fungi, bacteria and algae have
attracted considerable interest. Proteins of microbial origin are called by the generic name of
Single CeU Protein (SCP) which could be compared well with other conventional proteins
such as egg, milk or soybean (Guzman-Juarez, 1983; Lipinski and Litchfield, 1974).
Compared with the production of other proteins, SCP production is more economical
because microorganisms can grow in many cheap substrates including by products from oil
refining processes or from other waste products. Climatic factors and land availability have
no great effect on SCP production (Tuse, 1984).
Among single cell proteins, yeast protein production has been well investigated (Guzman-
Juarez, 1983). Yeast contains about 45-49% protein which is rich in lysine but low in cystine
and methionine. Consequently, yeast proteins have lower nutritional quality than casein and
egg proteins.
Typically, yeast proteins were concentrated by alkaU extraction of protein from disrupted
yeast cell slurries ar.d isoelectric precipitation by heat and acid (Vananuvat and Kinsella,
1975a; Achor et al, 1981) Functional properties of yeast protein have been extensively
investigated. Solubility, foaming ability, emulsifying capacity of yeast proteins are inferior to
29
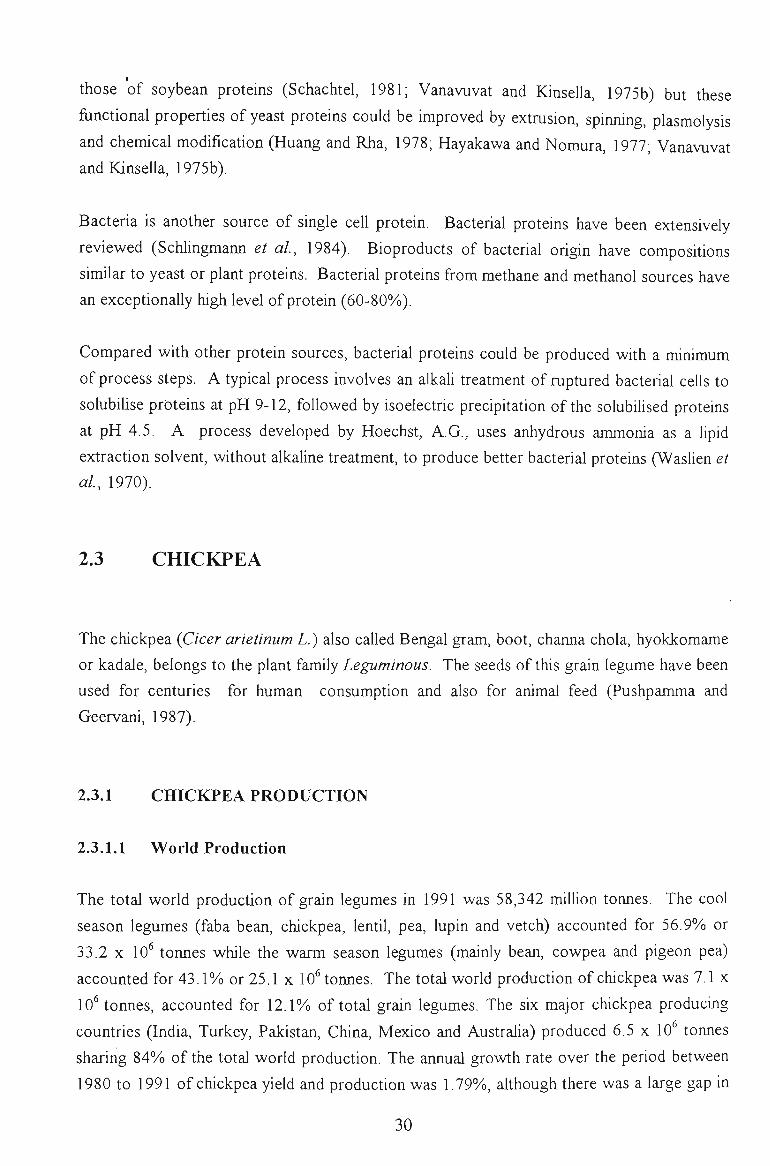
those of soybean proteins (Schachtel, 1981; Vanavuvat and Kinsella, 1975b) but these
functional properties of yeast proteins could be improved by extrusion, spinning, plasmolysis
and chemical modification (Huang and Rha, 1978; Hayakawa and Nomura, 1977; Vanavuvat
and Kinsella, 1975b).
Bacteria is another source of single cell protein. Bacterial proteins have been extensively
reviewed (Schlingmann et al, 1984). Bioproducts of bacterial origin have compositions
similar to yeast or plant proteins. Bacterial proteins from methane and methanol sources have
an exceptionally high level of protein (60-80%)).
Compared with other protein sources, bacterial proteins could be produced with a minimum
of process steps. A typical process involves an alkali treatment of ruptured bacterial cells to
solubiUse priateins at pH 9-12, followed by isoelectric precipitation of the solubUised proteins
at pH 4.5. A process developed by Hoechst, A.G, uses anhydrous ammonia as a lipid
extraction solvent, without alkaline treatment, to produce better bacterial proteins (Waslien et
al, 1970).
2.3 CHICKPEA
The chickpea {Cicer arietinum L.) also called Bengal gram, boot, channa chola, hyokkomame
or kadale, belongs to the plant family Leguminous. The seeds of this grain legume have been
used for centuries for human consumption and also for animal feed (Pushpamma and
Geervani, 1987).
2.3.1 CHICKPEA PRODUCTION
2.3.1.1 World Production
The total world production of grain legumes in 1991 was 58,342 million tonnes. The cool
season legumes (faba bean, chickpea, lentil, pea, lupki and vetch) accounted for 56.9%) or
33.2 X 10 tonnes while the warm season legumes (mainly bean, cowpea and pigeon pea)
accounted for 43.1% or 25.1 x 10 tonnes. The total world production of chickpea was 7.1 x
10 toimes, accounted for 12.1% of total grain legumes. The six major chickpea producing
countries (India, Turkey, Pakistan, China, Mexico and AustraUa) produced 6.5 x 10 tonnes
sharing 84%) of the total world production. The annual growth rate over the period between
1980 to 1991 of chickpea yield and production was 1.79%), although there was a large gap in
30
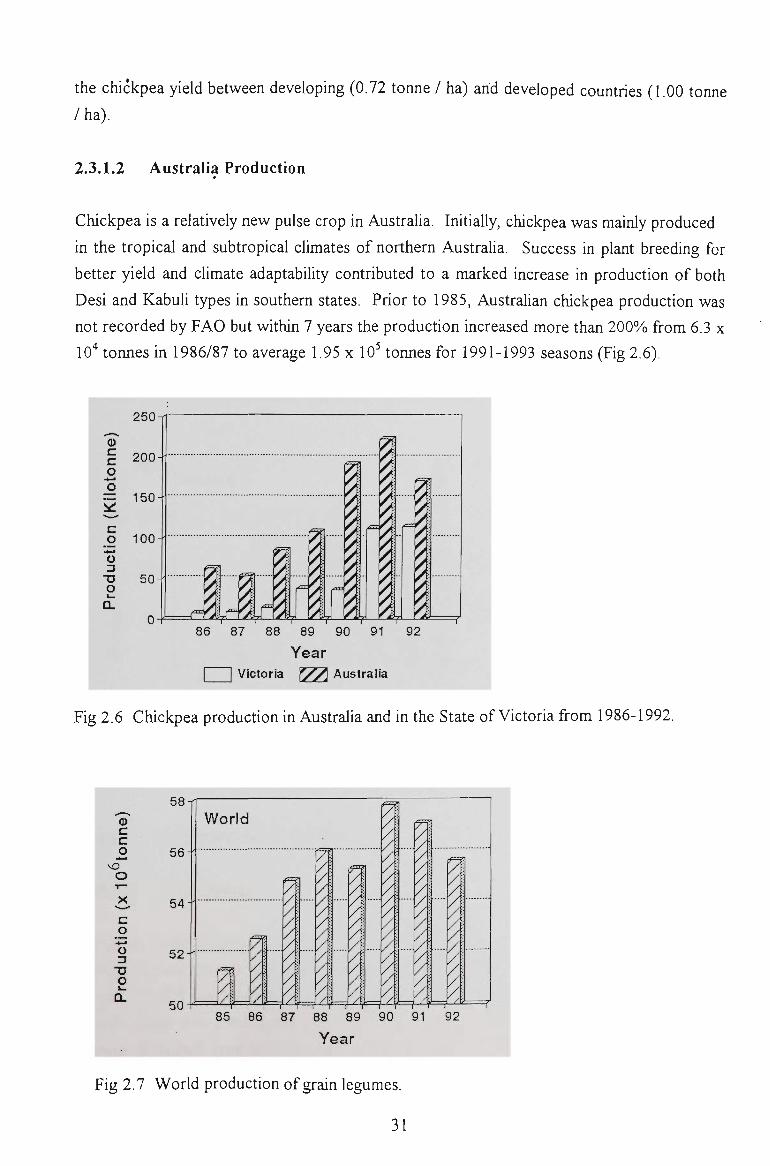
the chickpea yield between developing (0.72 tonne / ha) and developed countries (1.00 tonne
/ha).
2.3.1.2 Australia Production
Chickpea is a relatively new pulse crop in Australia. Initially, chickpea was mainly produced
in the tropical and subtropical climates of northern Australia. Success in plant breeding for
better yield and climate adaptability contributed to a marked increase in production of both
Desi and Kabuli types in southern states. Prior to 1985, AustraUan chickpea production was
not recorded by FAO but within 7 years the production increased more than 200% from 6.3 x
10* tonnes in 1986/87 to average 1.95 x 10 tonnes for 1991-1993 seasons (Fig 2.6).
250
Year Victoria X/y\ Australia
Fig 2.6 Chickpea production in Australia and in the State of Victoria from 1986-1992.
C c o
o
o
O
58
56
C- 54 c o
52
50
World
f=^
n
/%-4 A^X Xi-^ A}
O
85 86 87 88 89 90 91 92
Year
Fig 2.7 Worid production of grain legumes.
31
The increased production of chickpea reflects a strategically important change in Australian
agricultural production. Falling market values of traditional commodities such as coarse and
cereal grains in the 1970's prompted Australian farmers to consider oil seeds and grain
legumes as economic alternatives. Grain legumes also improved the soil by adding
inexpensive nitrogen through cereal-pulse rotation systems. Moreover many varieties can be
grown with limited water supplies on poor quality land. Consequently, while the world
production of grain legumes only increased by 8% over 7 years (1985-92) (Fig 2.7),
production of Australian grain legumes, over the same period, increased by almost 150%) (Fig
2.8). Within Australia, chickpea production increased rapidly in Victoria, perhaps due to the
suitable climate and soU type. In 1992, Victoria produced 115,000 tonnes, accounted for
69%o of total Australian chickpea production and this crop became an important new grain
legume in the state of Victoria (ABARE, 1993).
2000
o c c o
c o
"o
O
1 5 0 0 -
1000
500-
Australia
a
H4
/:
/: / A /
85 86 87 88 89 90 9
Year
/;
/;
/; /; /; / - •
/; /; /; /;
.A
92
140
-105
-70
35
0) w C3 G)
O
c
Production [ / ^ % Increase
Fig 2.8 Grain legumes production in Australia.
2.3.2 AGRONOMIC ASPECT
2.3.2.1 Classification
Chickpea, a self pollinated annual crop, is grouped into two types, Kabuli and Desi, based on
geographic distribution and colour of the seed and flower. The seeds of Kabuli type weigh
about 350-400 mg/ each and are light coloured with a smooth surface. The seeds of Desi
weight about 100-150 mg are smaller, yellow to black in colour with a rough surface. The
flower of Kabuli type is white while that of Desi type (Nene, 1987). The Kabuli type
chickpeas account for about 10-15% of a worid annual production, mainly grown in
32
Afghanistan, Western Asia, the Mediterranean and the Americas. The Desi type chickpeas
constitutes 85% of world total production, is mainly confined to the Indian Continent,
Ethiopia, Mexico and Iran (Summerfield et al, 1987).
2.3.2.2 Botany
There are 39 known species from the genus Cicer. The cultivated C. arietinum is closely
related to C. pinnatifidum. C. echinospermum and its hybrids have been obtained between C.
arietinum and its two closest relatives - C. echinospermum and C. reticulatum Ladz. The
International Crop Research Institute for the Semi Arid Tropics (ICRISAT, India) and the
International Centre for Agriculture Research in the Dry Areas (ICARDA, Syria) collected
over 14,000 and 6,000 chickpea germplasm lines, respectively, from 39 countries. A major
collection of chickpea is also kept at the National Seed Storage Laboratory at Pullman,
Washington, USA. In Australia, a chickpea centre is established in Horsham, Victoria.
(Browner and Mclntyre, 1992).
2.3.2.3 Distribution
The origin of the chickpea is unclear although both Kabuli and Desi chickpea types existed
from times of earliest record. The chickpea presence in India since 2000 BC was confirmed
by their Sanskrit and carbonised names (Singh, 1990). Recipes of chickpeas are also found
in some of the earliest Roman cookbooks (Oram, 1992). In the past, there were several
centres in Asia and eastern Mediterranean. From these centres of origin, chickpea was
spread throughout the Mediterranean region, south east Asian subcontinent and later
introduced into the Americas.
2.3.2.4 Growth Condition
As a subtropical crop, chickpea can grow best as a post monsoon, cool season crop in the
south east Asian subcontinent, during the dry season in North Africa and during spring and
summer in the Mediterranean region. The optimum growth temperature falls within the
range of 18-29°C. Chickpea is a drought resistant crop (650-750 mm per annum) but can be
grown successfully with a rainfall of 1000 mm per annum (Huda and Virmani, 1984). The
chickpea can be adapted to a wide range of soil types. Acidic soil is favourable but some
chickpea genotypes are reasonable tolerant to alkalinity and salinity (Rupela and Kumar Rao,
1984). Chickpea has been grown successfully on plains as well as at elevations of 300-1,200 m.
Chickpea is a low yield crop compared with cereal or other pulses (0.7-1.0 tonne/ha). At its
optimum growth conditions, chickpea could produce up to 3-4 tonnes/ha (Kay, 1979).
33
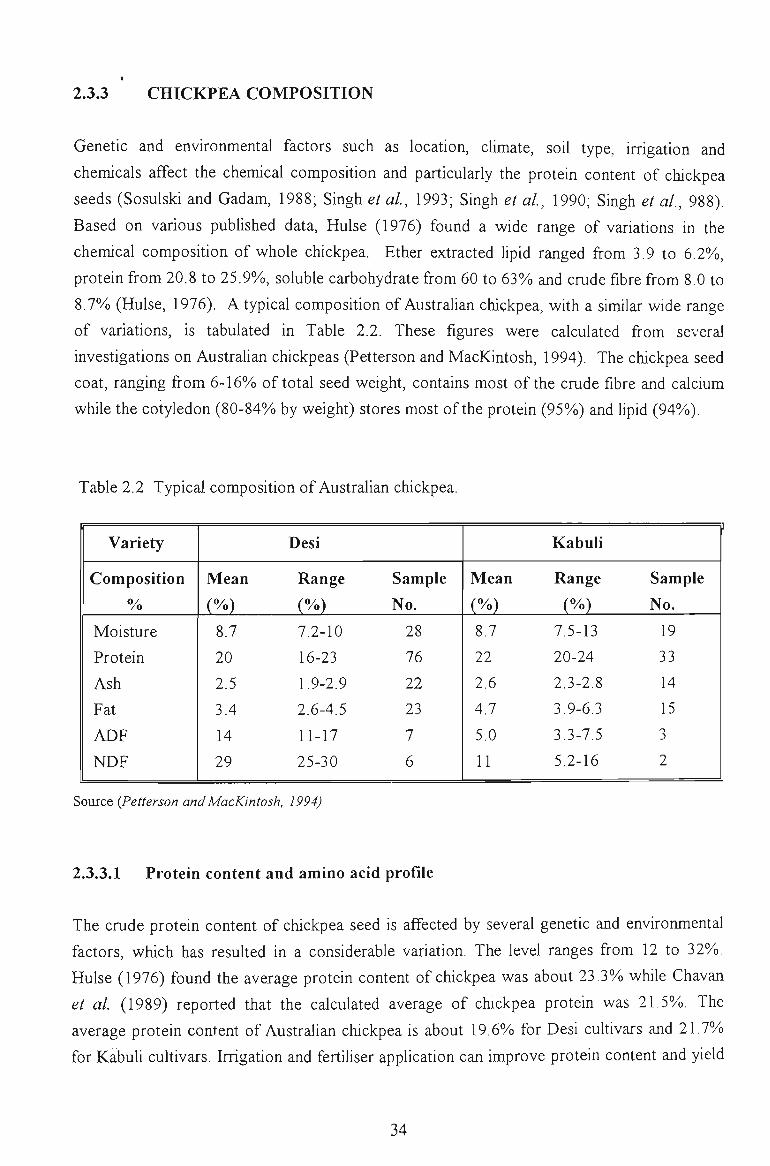
2.3.3 CHICKPEA COMPOSITION
Genetic and environmental factors such as location, climate, soil type, irrigation and
chemicals affect the chemical composition and particularly the protein content of chickpea
seeds (Sosulski and Gadam, 1988; Singh et al, 1993; Singh et al, 1990; Singh et al, 988).
Based on various published data, Hulse (1976) found a wide range of variations in the
chemical composition of whole chickpea. Ether extracted lipid ranged from 3.9 to 6.2%o,
protein from 20.8 to 25.9%), soluble carbohydrate from 60 to 63% and crude fibre from 8.0 to
8.7%) (Hulse, 1976). A typical composition of AustraUan chickpea, with a similar wide range
of variations, is tabulated in Table 2.2. These figures were calculated from several
investigations on AustraUan chickpeas (Petterson and MacKintosh, 1994). The chickpea seed
coat, ranging from 6-16%) of total seed weight, contains most of the crude fibre and calcium
while the cotyledon (80-84%) by weight) stores most of the protein (95%)) and lipid (94%)).
Table 2.2 Typical composition of Australian chickpea.
Variety
Composition
%
Moisture
Protein
Ash
Fat
ADF
NDF
Desi
Mean
(%)
8.7
20
2.5
3.4
14
29
Range
(%)
7.2-10
16-23
1.9-2.9
2.6-4.5
11-17
25-30
Sample
No.
28
76
22
23
7
6
Kabuli
Mean
(%)
8.7
22
2.6
4.7
5.0
11
Range
(%)
7.5-13
20-24
2.3-2.8
3.9-6.3
3.3-7.5
5.2-16
Sample
No.
19
33
14
15 •-1
2
Source {Petterson and MacKintosh, 1994)
2.3.3.1 Protein content and amino acid profile
The crude protein content of chickpea seed is affected by several genetic and environmental
factors, which has resuUed in a considerable variation. The level ranges from 12 to 32%.
Hulse (1976) found the average protein content of chickpea was about 23.3% while Chavan
et al (1989) reported that the calculated average of chickpea proteUi was 21.5%). The
average protein content of Australian chickpea is about 19.6%) for Desi cuUivars and 21.7%)
for KabuU cultivars. Irrigation and fertiUser application can improve protein content and yield
34
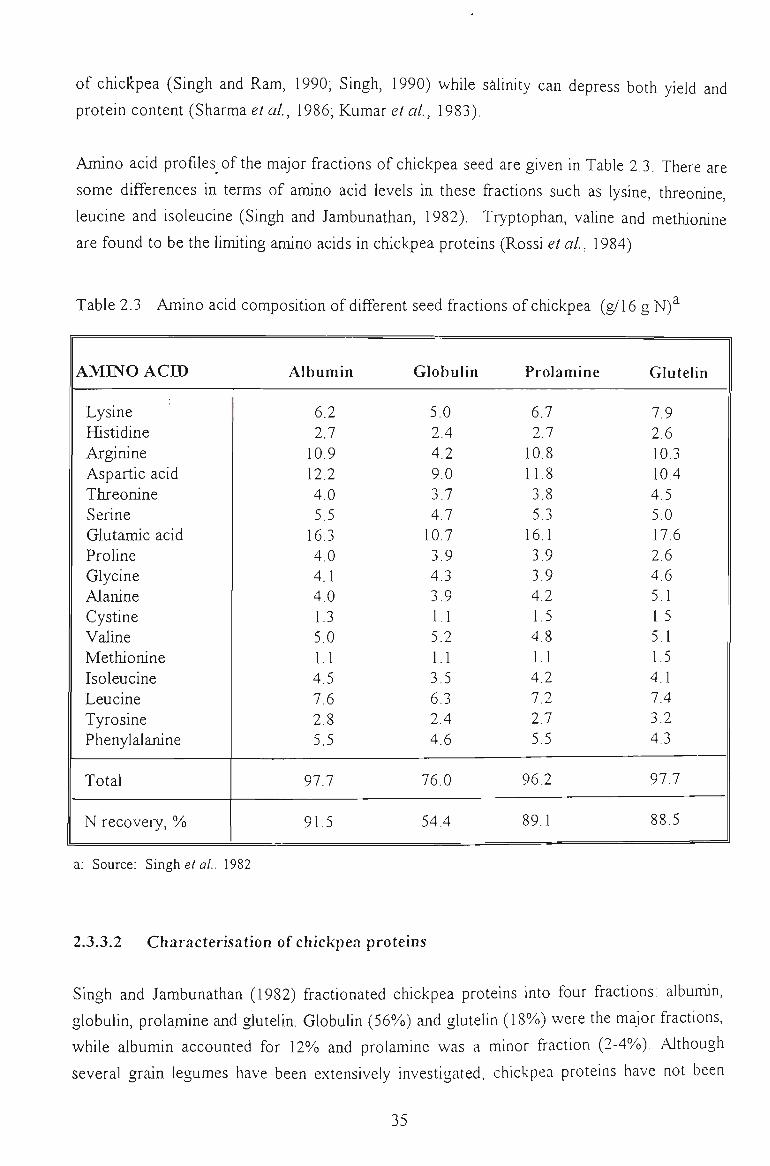
of chiclcpea (Singh and Ram, 1990; Singh, 1990) while silinity can depress both yield and
protein content (Sharma et al, 1986; Kumar et al, 1983).
Amino acid profiles^ of the major fractions of chickpea seed are given in Table 2.3. There are
some differences in terms of amino acid levels in these fractions such as lysine, threonine,
leucine and isoleucine (Singh and Jambunathan, 1982). Tryptophan, valine and methionine
are found to be the limiting amino acids in chickpea proteins (Rossi et al, 1984)
Table 2.3 Amino acid composition of different seed fractions of chickpea (g/16 g N)^
AMINO ACH)
Lysine Histidine Arginine Aspartic acid Threonine Serine Glutamic acid Proline Glycine Alanine Cystine Valine Methionine Isoleucine Leucine Tyrosine Phenylalanine
Total
N recovery, %)
Albumin
6.2 2.7
10.9 12.2 4.0 5.5
16.3 4.0 4.1 4.0 1.3 5.0 1.1 4.5 7.6 2.8 5.5
97.7
91.5
Globulin
5.0 2.4 4.2 9.0 3.7 4.7
10.7 3.9 4.3 3.9 1.1 5.2 1.1 3.5 6.3 2.4 4.6
76.0
54.4
Prolamine
6,7 2,7
10.8 11.8 3.8 5.3
16.1 3.9 3.9 4.2 1,5 4.8 1.1 4.2 7.2 2.7 5.5
96.2
89.1
Glutelin
7.9 2.6 10.3 10.4 4.5 5.0 17.6 2.6 4.6 5.1 1.5 5.1 1.5 4.1 7.4 3.2 4.3
97.7
88.5
a: Source: Singh ef a/.. 1982
2.3.3.2 Characterisation of chickpea proteins
Singh and Jambunathan (1982) fractionated chickpea proteins into four fractions: albumin,
globulin, prola,mine and glutelin. Globulin (56%) and glutelin (18%) were the major fractions,
while albumin accounted for 12% and prolamine was a minor fraction (2-4%). Although
several grain legumes have been extensively investigated, chickpea proteins have not been
35
adequately examined (Ganesh-Kumar and Venkataraman, 1980). Ganesh-Kumar and
Venkataraman (1975) found chickpea globulin as an oligomeric high molecular weigh protein
with three subunits.
2.3.3.3 Nutritional values of chickpea protein and protease inhibitors
Like other grain legumes, the nutritional values of chickpea proteins can be evaluated based
on the growth methods (PER, protein efficiency ratio; NPR, net protein retention; RPV,
relative protein value) and nitrogen balance methods (BV, biological value; NPU, net protein
utilisation, TD, true digestibility). Khan et al (1979) found that chickpea proteins had higher
TD, BV and NPU than mung beans and cowpea. The NPU and PER of chickpea proteins
were also higher than those of faba bean, mung beans and soy beans.
Trypsin and chymotrypsin inhibitors are the two main protease inhibitors in chickpea seed
proteins (Bansal et al, 1988). The level of these inhibitors varied greatly with cuUivars. For
example, Smirnoff e al (1986) found chickpea proteins had a lower trypsin inhibitor activity
than lentil and soybean proteins which were in contrast with the finding of Chavan and
Hejgaard(1981).
2.3.3.4 Lipid
Chickpea lipid range from 3 to 7%o with triglycerides as the major fraction of the neutral lipid.
Chickpea lipid contains mainly unsaturated fatty acids {61%) with Unoleic and oleic acid as
the two major fatty acids.
2.3.3.5 Carbohydrate, flatulence and hypocholesterolemic effect
The carbohydrate content of chickpea ranges from 52-71%o with starch as a major
constituent. Desi cultivars have lower level of starch than the Kabuli cuUivars. In chickpea
starch, amylose content (40%)) is usually lower than amylopectin {60%). Amylose has an
average chain length of 22 glucose units while amylopectin has a longer average chain length
of about 1,800 glucose units.
The total sugar content in chickpea ranges from 5 to 10%, depending on the cultivar. Kabuli
cultivars contain more sucrose, raffinose and soluble sugars than Desi cuUivars (Saini and
Knights, 1984). Chickpea contains more raffinose, stachyose and verbacose than many grain
legumes and these carbohydrates are believed to be responsible for the flatulence encountered
in human and animal (Jaya and Venkataraman, 1979). The flatulence can be reduced by
several processing procedures such as soaking, fermentation and germination.
36
The crude fibre level in Desi cultivars is higher than that in Kabuli cuUivars, perhaps due to a
close association between the seed coat content and fibre level (Singh, 1984). Fibre from the
chickpea seed coat was found to have a favourable hypocholesterolemic effect (Singh et al,
1983).
2.3.4 CHICKPEA FOOD APPLICATIONS
2.3.4.1 Beverage
Protein isolates from ten legume species including chickpea were evaluated as the protem
component in imitation milks. The isolates had a wide range of solubility, fat homogenisation,
viscosity and conductivity at the same protein level. Imitation milk prepared from chickpea
isolate was acceptable in terms of taste and texture (Sosulski et al, 1978). Soluble soUds
obtained from roasted chickpeas were used as ingredients of soluble imitation coffee powder
(ScanpelUno et al, 1983). Germinated chickpeas were used for a chocolate flavoured
beverage which compared favourably with a commercial chocolate milk (Luz Fermander and
Berry, 1987).
2.3.4.2 Infant Formula
Chickpea flour and proteins were used to formulate protein rich infant foods in Egypt and
Bangaldesh (Morcos et al, 1983; KabiruUah et al, 1976). Homemade weaning food
mixtures, with chickpea as supplementary ingredient, met the protein quality evaluated by
PER, NPR, RPU and NGI (nitrogen growth index) (Mathew and Pellett, 1986). The values of
PER, NPU and NPR obtained from a chickpea formula were similar to commercial calcium
caseinate or soybean based products (Sotelo et al, 1987 a,b). Recently, germinated chickpea
flours were blended with wheat flour to prepare nutritionally improved weaning food
(Livingston et al, 1993). These chickpea based formulas could be prepared at low cost but
stUl compUed with infant food specifications, set up by Codex AUmentarias Commission in
terms of lysine and S-containing amino acids (Valencia et al, 1988). These formulae could
be used to replace cow milk for lactose intolerant children (Sotelo et al, 1987b). Chickpea
protein concentrate, specially designed for infant formula (Ulloa et al, 1988) also obtained
from an ultrafiltration process.
2.3.4.3 Meat Emulsion Extender
El-Aswad et al. (1980) replaced beef in meat product with soy and chickpea and reported
that the chickpea fortified product was organoleptically similar to the meat product. The
37
emulsifying capacity and the water binding capacity of meat was not significantly affected by
replacing muscle proteins with chickpea proteins up to a 50%) level (Verma et al, 1984 a,b)
Abo Baker et al. (1986) found that inclusion of chickpea (up to 20%) in sausage meat
emulsion increased its water holding capacity and improved tenderness.
Verma et al. (1985) reported that up to 30% of meat protein could be substituted with
chickpea flour in skinless sausage without causing any significant loss of quality or
acceptability. The process was fiirther improved if the flour was subjected to heat treatment
(Verma et al, 1984). Net protein utiUsation, biological value and protein efficiency ratio
were unaffected by 30% meat protein replacement (Verma et al, 1985).
2.3.4.4 Bread and bakery products
Protein value of wheat flour used in bread making could be improved by the addition of
chickpea flour (Figuerola et al., 1987). Bread supplemented with chickpea flour up to 15%
level showed an increase in protein content, lysine, fibre, fat and a higher PER value (Estevez
et al, 1987). The effect of chickpea flour or protein isolates on wheat flour dough
characteristics and baking quality have been investigated (Liu et al, 1994). Noodles could be
supplemented with chickpea flour to about 12%) without taste and texture compromise (Hung
etal, 1993).
2.4 REVIEW SUMMARY
Chickpea is one of the most important grain legumes in the world in terms of production. The
seeds have been used for human consumption for centuries. Many traditional foods have
been made with chickpea in the Indian subcontinent. North Africa, Mediterranean, Central
and Latin American and also in some European regions.
Regardless of being a relatively new crop, chickpea production in AustraUa increased rapidly.
The crop is particularly popular in the state of Victoria with over 70%) of the total Australian
production. It is likely that chickpea production will be greatly expanded and the crop will
have an increasingly important role in the Victorian crop system. Nutritional studies indicate
that chickpea lipid, fibre and protein exhibit hypocholesterolemic effects. Chickpea proteins
show several nutritional values which could be compared favourably with those of soybean
and other grain legumes.
38
Chickpea seeds contain high levels of protein. This valuable components of chickpea could
be widely used for human foods like other grain legume proteins presented in this review.
However, unlike soy or some other grain legume proteins, chickpea proteins have not been
subjected to extensive investigation. A novel grain legume protein must exhibit some
desirable functional properties as food ingredient since in the industrial country, an economic
evaluation based greatly on its functionality more than its nutritional value. As pointed by
many investigators, information on the extraction and characterisation of proteins in chickpea
is not adequate. In particular, the functional properties of chickpea proteins require more
attention since the information on these properties is essential for any application in the
processing food industry.
Most research on vegetable food proteins and their functionality as food ingredients has been
focussed ori soy proteins. As described in detail in this review, many aspects in the soy
production and technology have also been appUed for other grain legumes. Consequently,
this investigation wiU take account of the knowledge and technology developed for soy and
other legumes in order to define the functionality and potential food applications of chickpea
proteins.
39
CHAPTER 3
PROTEIN EXTRACTION AND CHARACTERISATION
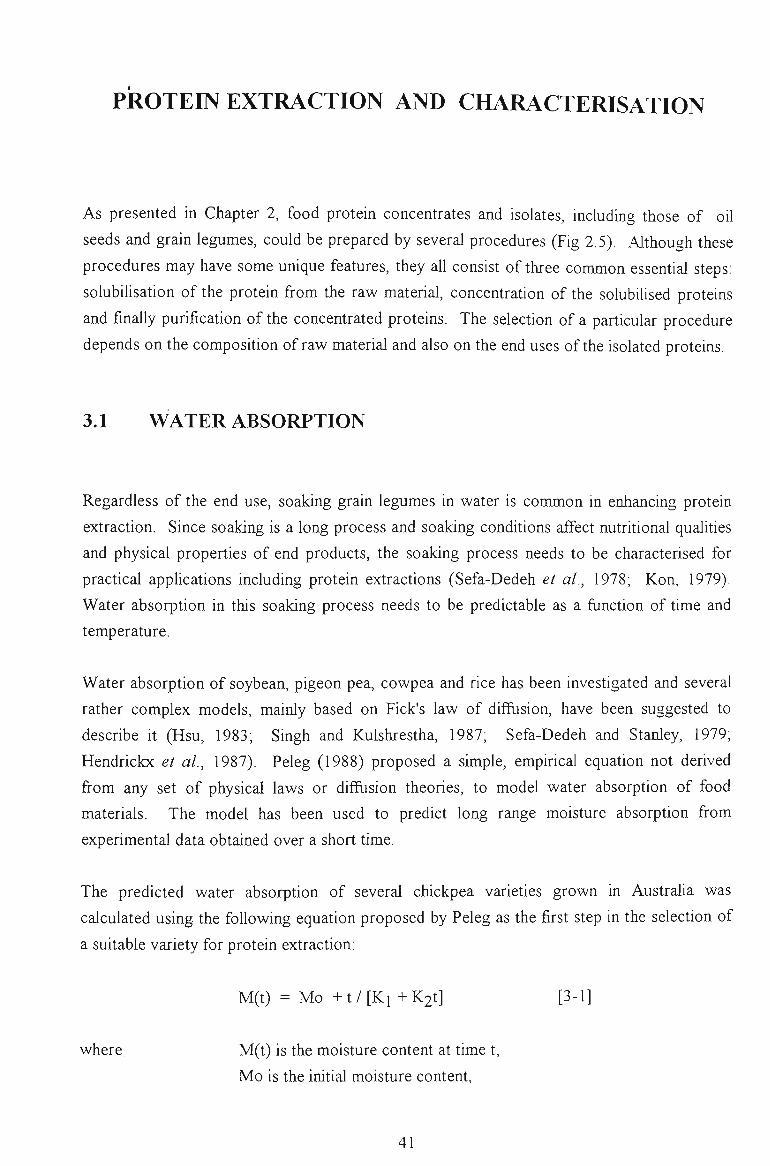
PROTEIN EXTRACTION AND CHARACTERISATION
As presented in Chapter 2, food protein concentrates and isolates, including those of oU
seeds and grain legumes, could be prepared by several procedures (Fig 2.5). .Although these
procedures may have some unique features, they aU consist of three common essential steps:
solubiUsation of the protein from the raw material, concentration of the solubilised proteins
and finally purification of the concentrated proteins. The selection of a particular procedure
depends on the composition of raw material and also on the end uses of the isolated proteins.
3.1 WATER ABSORPTION
Regardless of the end use, soaking grain legumes in water is common in enhancing protein
extraction. Since soaking is a long process and soaking conditions affect nutritional qualities
and physical properties of end products, the soaking process needs to be characterised for
practical applications including protein extractions (Sefa-Dedeh et al, 1978; Kon, 1979).
Water absorption in this soaking process needs to be predictable as a function of time and
temperature.
Water absorption of soybean, pigeon pea, cowpea and rice has been investigated and several
rather complex models, mainly based on Tick's law of diffusion, have been suggested to
describe it (Hsu, 1983; Singh and Kulshrestha, 1987; Sefa-Dedeh and Stanley, 1979;
Hendrickx et al, 1987). Peleg (1988) proposed a simple, empirical equation not derived
from any set of physical laws or diffusion theories, to model water absorption of food
materials. The model has been used to predict long range moisture absorption from
experimental data obtained over a short time.
The predicted water absorption of several chickpea varieties grown in Australia was
calculated using the foUowing equation proposed by Peleg as the first step in the selection of
a suitable variety for protein extraction:
M(t) = Mo + t / [ K i + K 2 t ] [3-1]
where M(t) is the moisture content at time t.
Mo is the initial moisture content.
41
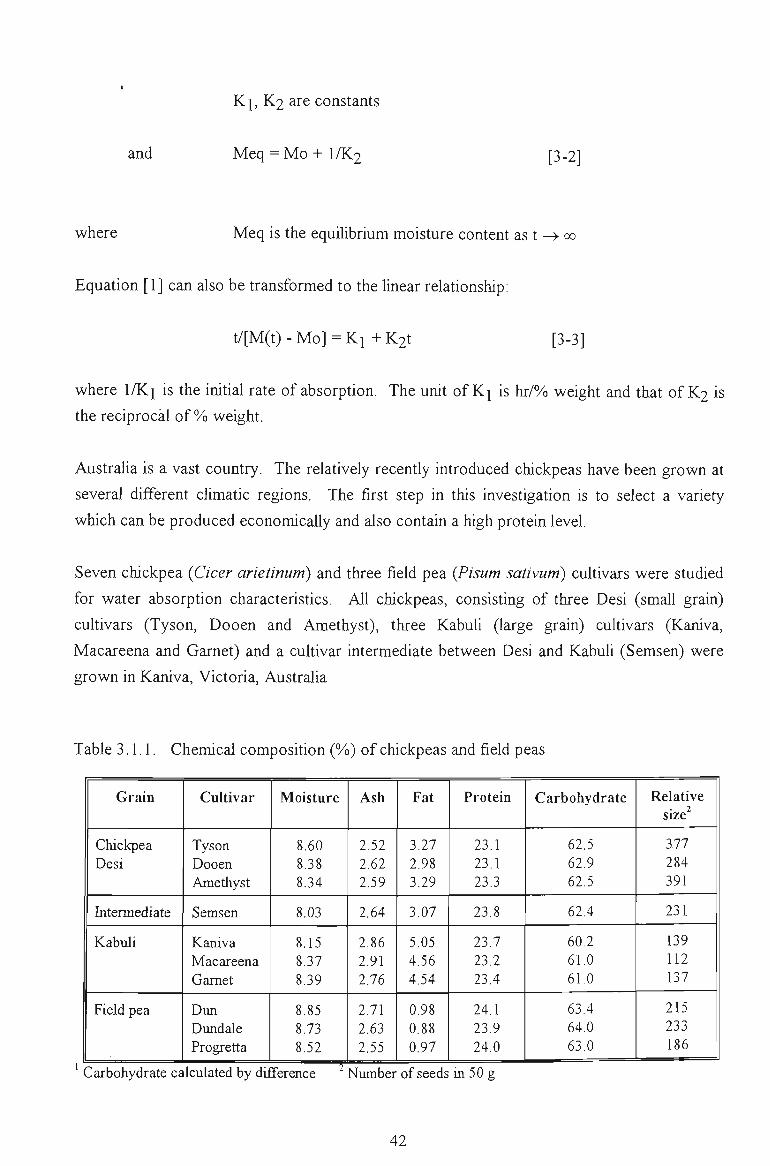
Kj, K2 are constants
and Meq = Mo + I/K2 [3-2]
where Meq is the equilibrium moisture content as t ^^ 00
Equation [1] can also be transformed to the Unear relationship:
t/[M(t) - Mo] = Ki + K2t [3-3]
where l/Kj is the initial rate of absorption. The unit of K^ is hr/%) weight and that of K2 is
the reciprocal of %) weight.
Australia is a vast country. The relatively recently introduced chickpeas have been grown at
several different climatic regions. The first step in this investigation is to select a variety
which can be produced economically and also contain a high protein level.
Seven chickpea {Cicer arietinum) and three field pea {Pisum sativum) cultivars were studied
for water absorption characteristics. All chickpeas, consisting of three Desi (small grain)
cultivars (Tyson, Dooen and Amethyst), three Kabuli (large grain) cultivars (Kaniva,
Macareena and Garnet) and a cultivar intermediate between Desi and Kabuli (Semsen) were
grown in Kaniva, Victoria, Australia
Table 3.1.1. Chemical composition (%>) of chickpeas and field peas
'(
Grain
Chickpea Desi
Intermediate
Kabuli
Field pea
-Carbohydrate ca
Cultivar
Tyson Dooen Amethyst
Semsen
Kaniva Macareena Garnet
Dun Dundale Progretta
Iculated by di;
Moisture
8.60 8.38 8.34
8.03
8.15 8.37 8.39
8.85 8.73 8.52
Terence
Ash
2.52 2.62 2.59
2.64
2.86 2.91 2.76
2.71 2.63 2.55
Niunber
Fat
3.27 2.98 3.29
3.07
5.05 4.56 4.54
0.98 0.88 0.97
of seeds
Protein
23.1 23.1 23.3
23.8
23.7 23.2 23.4
24.1 23.9 24.0
in50g
Carbohydrate
62.5 62.9 62.5
62.4
60.2 61.0 61.0
63.4 64.0 63.0
Relative size
377 284 391
231
139 112 137
215 233 186
42
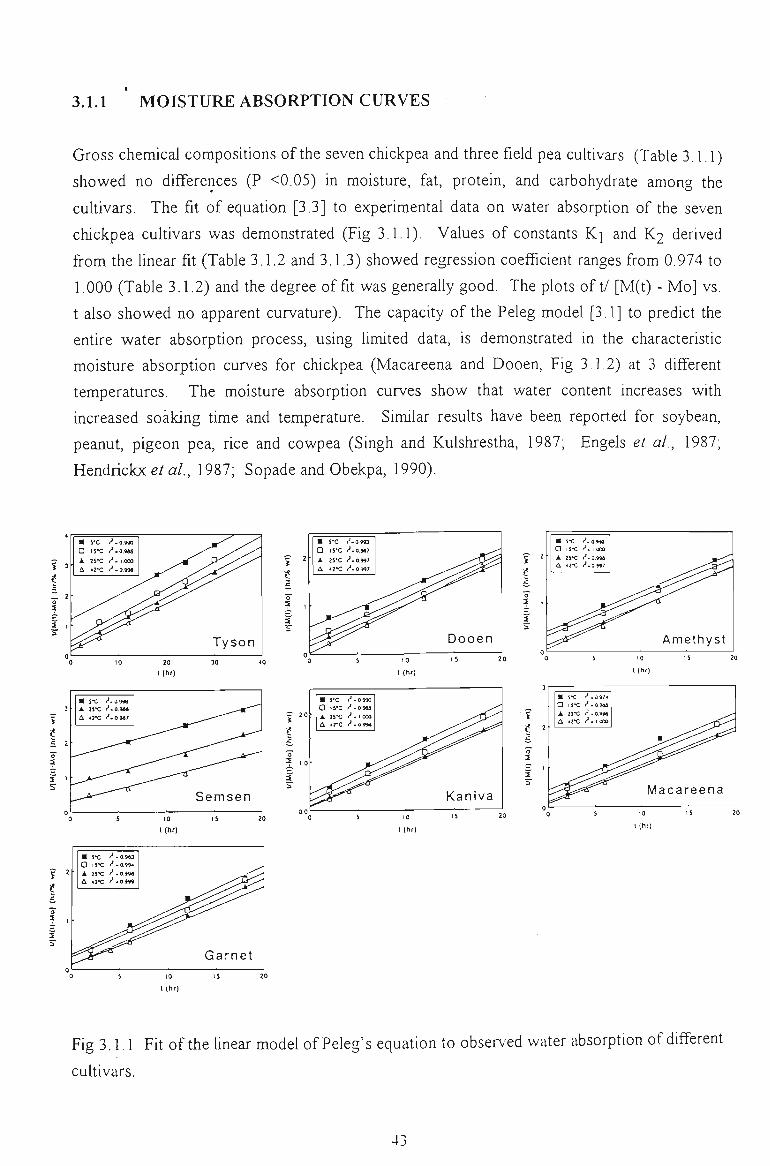
3.1.1 MOISTURE ABSORPTION CURVES
Gross chemical compositions of the seven chickpea and three field pea cultivars (Table 3.1.1)
showed no differences (P <0.05) in moisture, fat, protein, and carbohydrate among the
cultivars. The fit of equation [3.3] to experimental data on water absorption of the seven
chickpea cultivars was demonstrated (Fig 3.1.1). Values of constants K^ and K2 derived
from the linear fit (Table 3.1.2 and 3.1.3) showed regression coefficient ranges from 0.974 to
1.000 (Table 3.1.2) and the degree of fit was generally good. The plots oft/ [M(t) - Mo] vs.
t also showed no apparent curvature). The capacity of the Peleg model [3.1] to predict the
entire water absorption process, using limited data, is demonstrated in the characteristic
moisture absorption curves for chickpea (Macareena and Dooen, Fig 3.1,2) at 3 different
temperatures. The moisture absorption curves show that water content increases with
increased soaking time and temperature. Similar resuUs have been reported for soybean,
peanut, pigeon pea, rice and cowpea (Singh and Kulshrestha, 1987; Engels et al, 1987;
Hendrickx e/a/., 1987; Sopade and Obekpa, 1990).
1 3
_ 2 0 3
• 5*C ^-0.990 a IS'C f ' -0 .«3 A 2VC r*. 1.000 A 42"C f ' -o.wa
^J^^X^ Tyson
M $*C r'-OMa a IS'C ^-O.M7
• A 2S'C f'-0.997 A *2'C 1 -0 «7
^ ' - ^ ^
Dooen
l(h ' )
10
K M
£, 2
3
Semsen
•
• S*C f ^ -0«0
A IS'C f -1 coo
Kaniva
• s*c <^-09;4 a >s*C (^-09as A IS'C r- . Q.99« A 4J*C ^-1000
Macareena
10
K h f ) l ( h r )
• s*c ^ • 0 Ma a i3*c f ' - a s * * A 25*C ^ - 0-M« A 4?-C 1^-0999
^ ^
Garnet
l(hf)
Fig 3.1.1 Fit of the linear model of Peleg's equation to observed water absorption of different
cultivars.
43
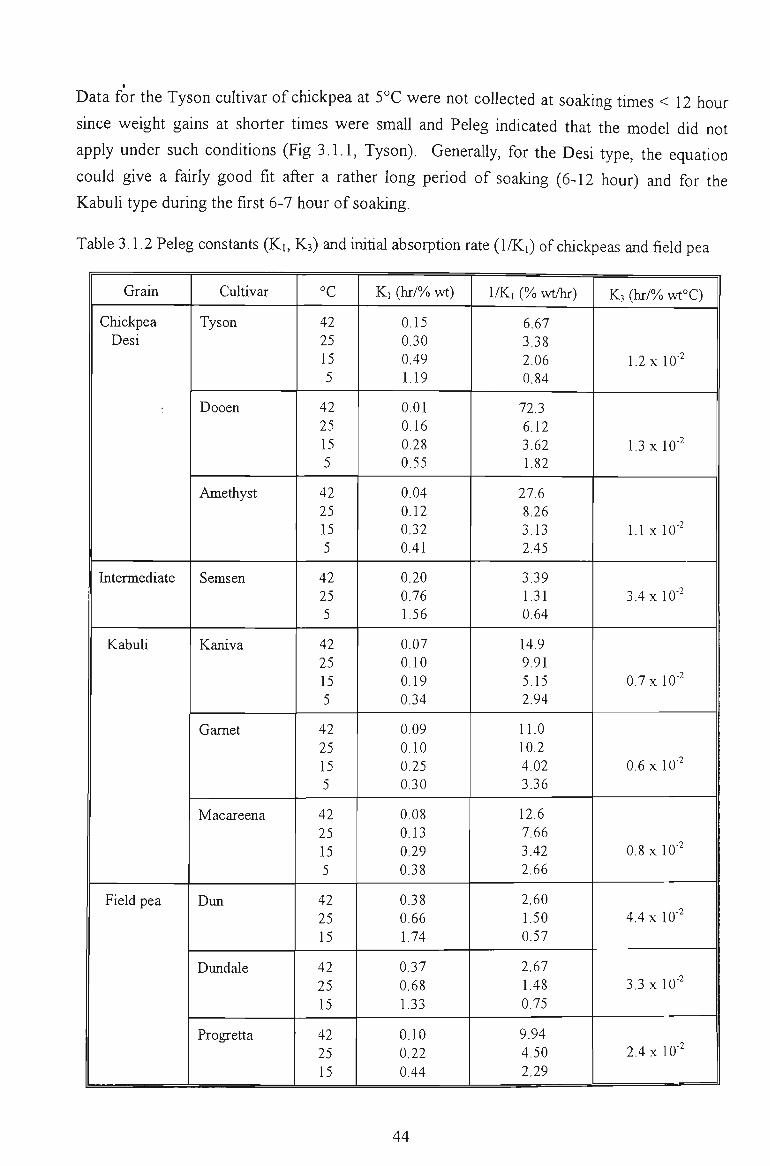
Data for the Tyson cultivar of chickpea at 5°C were not coUected at soaking times < 12 hour
since weight gains at shorter times were small and Peleg indicated that the model did not
apply under such conditions (Fig 3.1.1, Tyson). Generally, for the Desi type, the equation
could give a fairly good fit after a rather long period of soaking (6-12 hour) and for the
Kabuli type during the first 6-7 hour of soaking.
Table 3.1.2 Peleg constants (Ki, K3) and initial absorption rate (1/Ki) of chickpeas and field pea
Grain
Chickpea Desi
Intermediate
Kabuli
Field pea
Cultivar
Tyson
Dooen
Amethyst
Semsen
Kaniva
Garnet
Macareena
Dun
Dundale
Progretta
°C
42 25 15 5
42 25 15 5
42 25 15 5
42 25 5
42 25 15 5
42 25 15 5
42 25 15 5
42 25 15
42 25 15
42 25 15
Ki (hr/% wt)
0.15 0.30 0.49 1.19
0.01 0.16 0.28 0.55
0.04 0.12 0.32 0.41
0.20 0.76 1.56
0.07 0.10 0.19 0.34
0.09 0.10 0.25 0.30
0.08 0.13 0.29 0.38
0.38 0.66 1.74
0.37 0.68 1.33
0.10 0.22 0.44
1/Ki (% wt/hr)
6.67 3.38 2.06 0.84
72.3 6.12 3.62 1.82
27.6 8.26 3.13 2.45
3.39 1.31 0.64
14.9 9.91 5.15 2.94
11.0 10.2 4.02 3.36
12.6 7.66 3.42 2.66
2.60 1.50 0.57
2.67 148 0.75
9.94 4.50 2.29
K3 (hr/% wt°C)
1.2x10-^
1.3x10'^
1.1 X 10'
3.4x10"^
0.7x10-^
0.6x10-'
0.8 X 10-'
4.4 xlO'^
3.3 X 10'
2.4x10-'
44
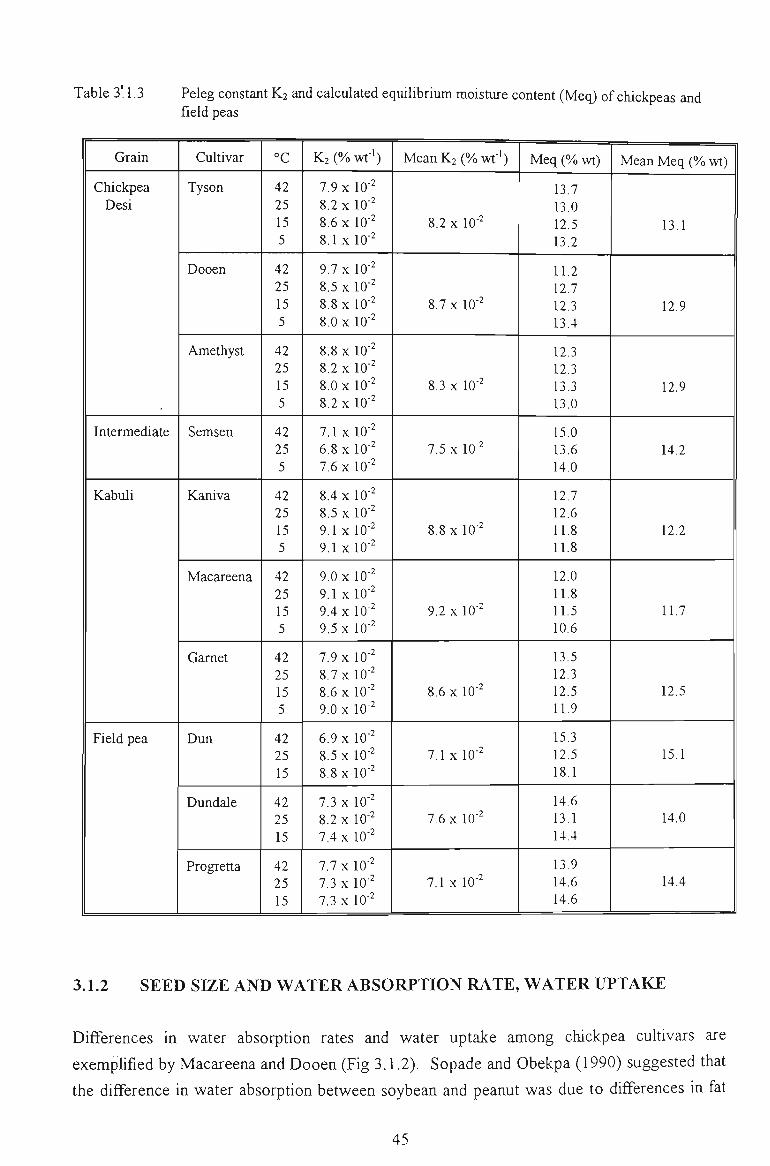
Table 3'. 1.3 Peleg constant K2 and calculated equilibrium moisture content (Meq) of chickpeas and field peas
Grain
Chickpea Desi
Intermediate
Kabuli
Field pea
Cultivar
Tyson
Dooen
Amethyst
Semsen
Kaniva
Macareena
Garnet
Dun
Dundale
Progretta
°C
42 25 15 5
42 25 15 5
42 25 15 5
42 25 5
42 25 15 5
42 25 15 5
42 25 15 5
42 25 15
42 25 15
42 25 15
K2 (% wt-^)
7.9 X 10"' 8.2 X 10'' 8.6 X 1 0 ' 8 .1x10" '
9.7 X 10-' 8.5 X 10-' 8.8 X 10"' 8.0 X 10"'
8.8 X 10"' 8.2 X 10"' 8.0 X 10"' 8.2 X 10"'
7 .1x10" ' 6.8 X 10"' 7.6 X 10''
8.4 X 10"' 8.5 X 10"' 9 .1x10" ' 9 .1x10- '
9.0 X 10"' 9 .1x10" ' 9.4 X 10"' 9.5 X 10"'
7.9 X 10"' 8.7 X 10"' 8.6 X 10"' 9.0 X 1 0 '
6.9 X 10"' 8.5 X 10"' 8.8 X 10"'
7.3 X 10"' 8.2 X 10"' 7.4 X 10"'
7.7 X 10"' 7.3 X 10"' 7.3 X 10"'
M e a n K 2 ( % w f ' )
8.2 X 10"'
8.7 X 10"'
8.3 X 10"'
7.5 X 10"'
8.8 X 10"'
9.2 X IQ-'
8.6 X 10"'
7 .1x10" '
7.6 X 10"'
7 .1x10" '
Meq (% wt)
13.7 13.0 12.5 13.2
11.2 12.7 12.3 13,4
12.3 12.3 13.3 13.0
15.0 13.6 14.0
12.7 12.6 11.8 11.8
12.0 11.8 11.5 10.6
13.5 12.3 12.5 11.9
15.3 12.5 18.1
14.6 13,1 14,4
13.9 14.6 14.6
Mean Meq (% wt)
13.1
12.9
12.9
14,2
12.2
11.7
12.5
15.1
14.0
14.4
3.1.2 SEED SIZE AND WATER ABSORPTION RATE, WATER UPTAKE
Differences in water absorption rates and water uptake among chickpea cultivars are
exemplified by Macareena and Dooen (Fig 3.1.2). Sopade and Obekpa (1990) suggested that
the difference in water absorption between soybean and peanut was due to differences in fat
45
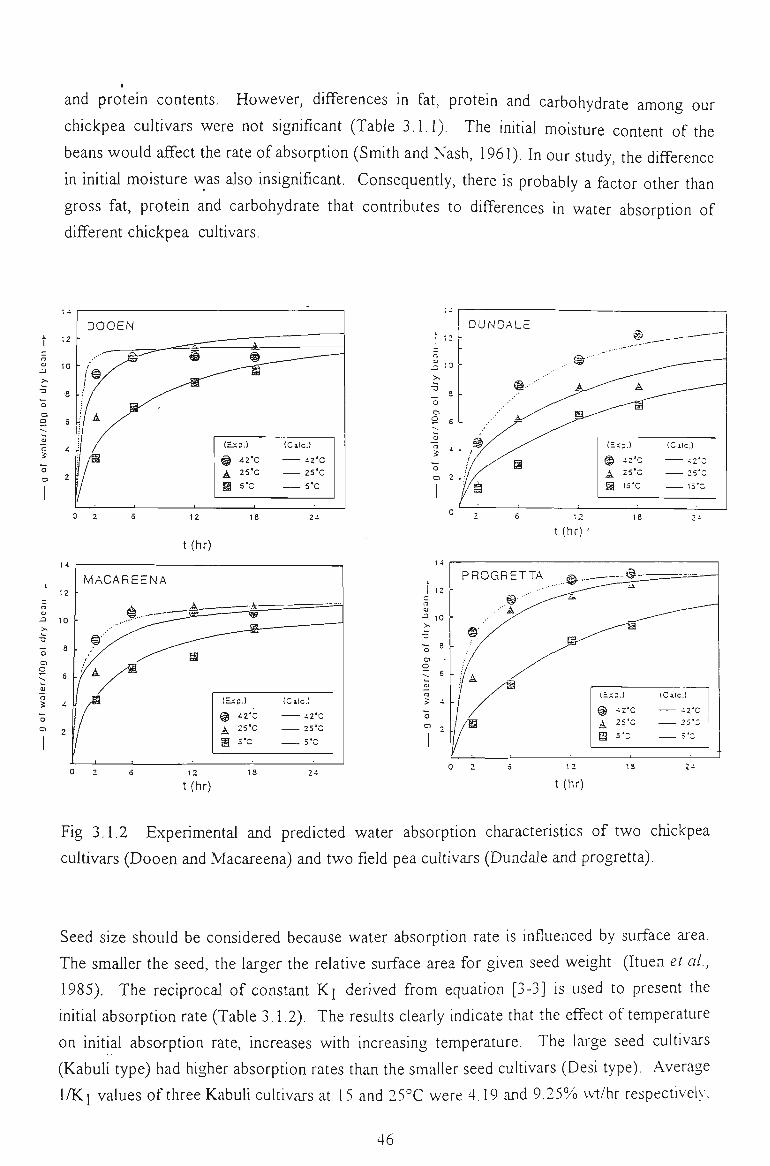
and protein contents. However, differences in fat, protein and carbohydrate among our
chickpea cuUivars were not significant (Table 3.1.1). The initial moisture content of the
beans would affect the rate of absorption (Smith and Nash, 1961). In our study, the difference
in initial moisture was also insignificant. Consequently, there is probably a factor other than
gross fat, protein and carbohydrate that contributes to differences in water absorption of
different chickpea cultivars.
DOOEN
la
t (h r )
MACAREENA
(Eip.l
@ -IZ'C A 25'C g 5'C
(Calc.)
i 2 ' C 25'C
S"C
(Exp.)
@ i 2 ' C A 25'C
a s-=
(Cilc.)
iZ'C 25'C
S"C
(H~P.)
@ -2*C
A 25*= a 5'C
(Cllc.)
i2 'C
5-=
t (h r )
12
t (h r )
Fig 3.1.2 Experimental and predicted water absorption characteristics of two chickpea
cultivars (Dooen and Macareena) and two field pea cultivars (Dundale and progretta).
Seed size should be considered because water absorption rate is influenced by surface area.
The smaller the seed, the larger the relative surface area for given seed weight (Ituen et al,
1985). The reciprocal of constant K^ derived from equation [3-3] is used to present the
imtial absorption rate (Table 3.1.2). The resuUs clearly indicate that the effect of temperature
on initial absorption rate, increases with increasing temperature. The large seed cuUivars
(Kabuli type) had higher absorption rates than the smaller seed cultivars (Desi type). Average
l/Kj values of three KabuU cuUivars at 15 and 25°C were 4,19 and 9.25% \vt/hr respectively.
46
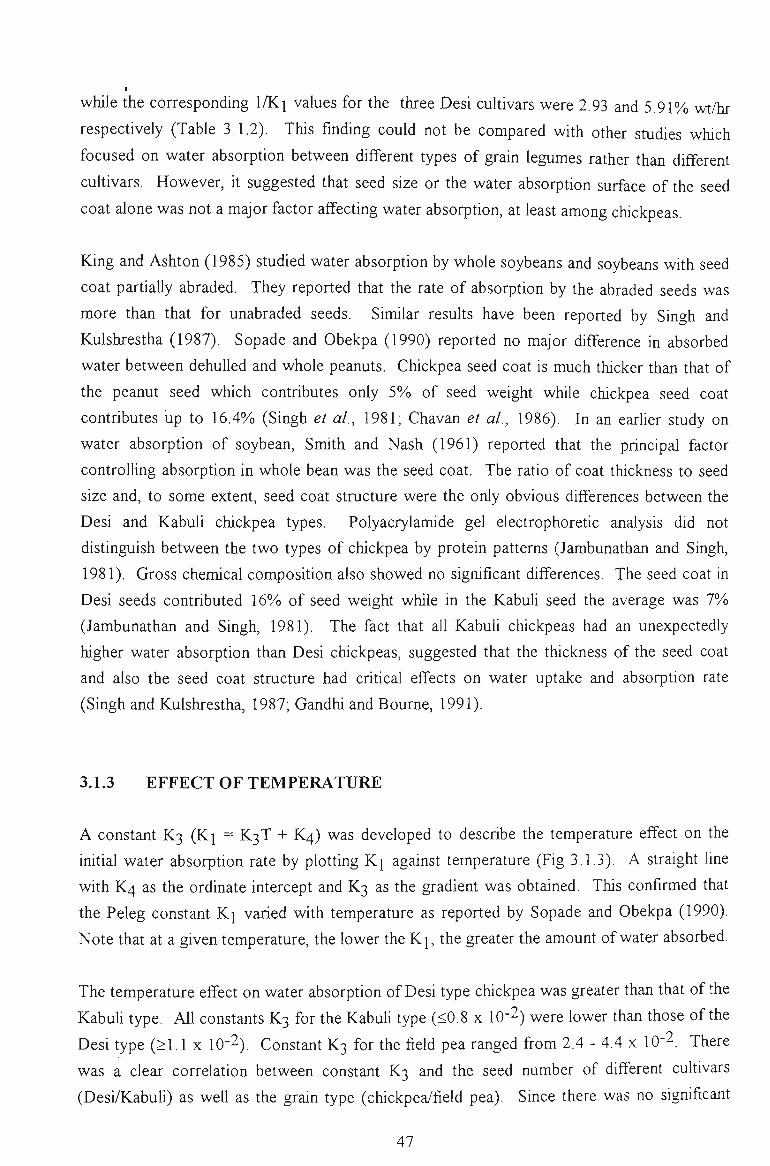
while the corresponding l/Kj values for the three Desi cultivars were 2.93 and 5.91% wt/hr
respectively (Table 3.1.2). This finding could not be compared with other studies which
focused on water absorption between different types of grain legumes rather than different
cultivars. However, it suggested that seed size or the water absorption surface of the seed
coat alone was not a major factor affecting water absorption, at least among chickpeas.
King and Ashton (1985) studied water absorption by whole soybeans and soybeans with seed
coat partially abraded. They reported that the rate of absorption by the abraded seeds was
more than that for unabraded seeds. Similar results have been reported by Singh and
Kulshrestha (1987). Sopade and Obekpa (1990) reported no major difference in absorbed
water between dehulled and whole peanuts. Chickpea seed coat is much thicker than that of
the peanut seed which contributes only 5%) of seed weight while chickpea seed coat
contributes up to 16.4%) (Singh et al, 1981; Chavan et al, 1986). In an earlier study on
water absorption of soybean. Smith and Nash (1961) reported that the principal factor
controlUng absorption in whole bean was the seed coat. The ratio of coat thickness to seed
size and, to some extent, seed coat structure were the only obvious differences between the
Desi and Kabuli chickpea types. Polyacrylamide gel electrophoretic analysis did not
distinguish between the two types of chickpea by protein patterns (Jambunathan and Singh,
1981). Gross chemical composition also showed no significant differences. The seed coat in
Desi seeds contributed 16%) of seed weight while in the Kabuli seed the average was 1%
(Jambunathan and Singh, 1981). The fact that all Kabuli chickpeas had an unexpectedly
higher water absorption than Desi chickpeas, suggested that the thickness of the seed coat
and also the seed coat structure had critical effects on water uptake and absorption rate
(Singh and Kulshrestha, 1987; Gandhi and Bourne, 1991).
3.1.3 EFFECT OF TEMPERATURE
A constant K3 (Kj = K3T + K4) was developed to describe the temperature effect on the
initial water absorption rate by plotting Kj against temperature (Fig 3.1,3). A straight line
with K4 as the ordinate intercept and K3 as the gradient was obtained. This confirmed that
the Peleg constant Kj varied with temperature as reported by Sopade and Obekpa (1990).
Note that at a given temperature, the lower the K^, the greater the amount of water absorbed.
The temperature effect on water absorption of Desi type chickpea was greater than that of the
Kabuli type. All constants K3 for the KabuU type (<0.8 x lO'^) were lower than those of the
Desi type (>1.1 x 10⁻²). Constant K3 for the field pea ranged fi-om 2.4 - 4.4 x 10⁻². xhere
was a clear correlation between constant K3 and the seed number of different cultivars
(Desi/Kabuii) as well as the grain type (chickpea/field pea). Since there was no significant
47
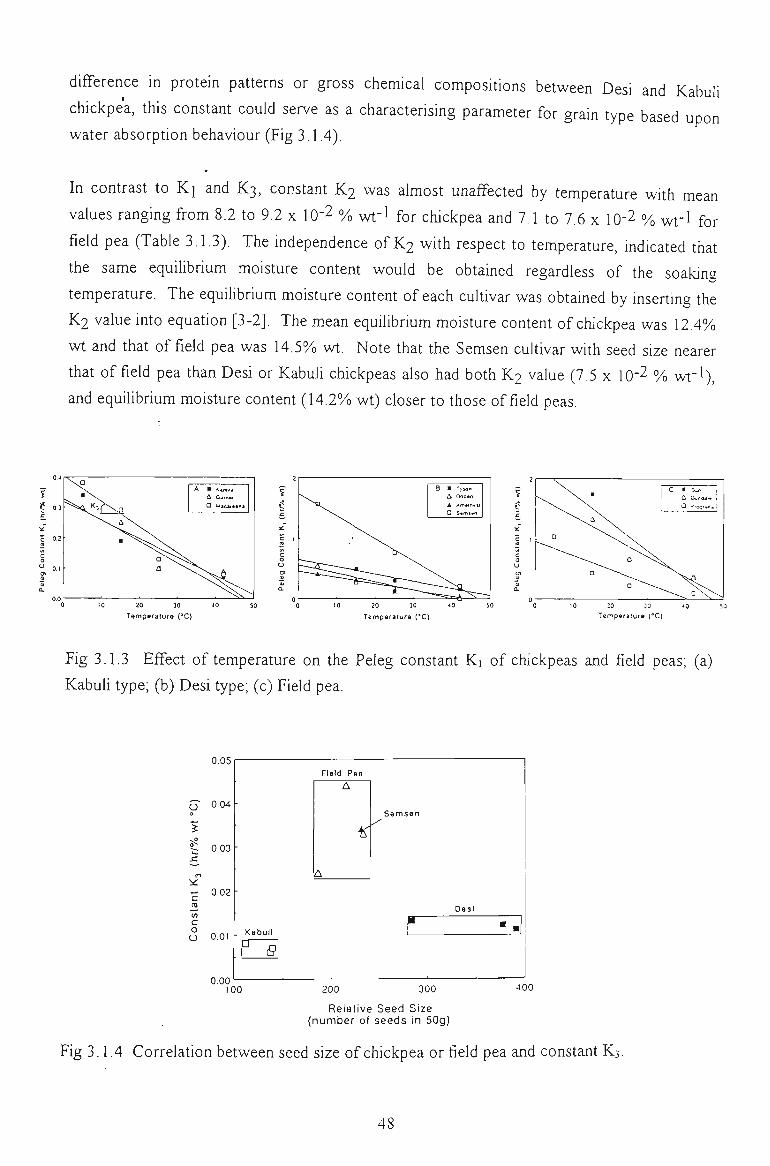
difference in protein patterns or gross chemical composUions between Desi and Kabuli
chickpea, this constant could serve as a characterising parameter for grain type based upon
water absorption behaviour (Fig 3.1,4).
In contrast to Kj and K3, constant K2 was almost unaffected by temperature with mean
values ranging from 8.2 to 9,2 x 10⁻² 0/ .^-1 ^ ^ chickpea and 7.1 to 7.6 x 10⁻² y^ ^ - 1 ^^
field pea (Table 3.1.3). The independence of K2 with respect to temperature, indicated that
the same equilibrium moisture content would be obtained regardless of the soakinc'
temperature. The equilibrium moisture content of each cuUivar was obtained by inserting the
K2 value into equation [3-2]. The mean equilibrium moisture content of chickpea was 12.4%
wt and that of field pea was 14.5% wt. Note that the Semsen cultivar with seed size nearer
that of field pea than Desi or Kabuli chickpeas also had both K2 value (7.5 x 10⁻² o/ wt-^),
and equilibrium moisture content (14.2%) wt) closer to those of field peas.
o
• \ \
^ " ^ • ^ ^ ^ D
^ " \ A \ .
A GatnM 0 Uacjj»*na
20 30 40 50
Temperature ("C)
' ^\^
A Ooo«n A Am..nT« 0 Sj(n««n
10 20 30 40
TemperalufB (*C)
\ . • C » > j . 1 & Ouro... 1
'~~"-~> a \ \
Temperature (°C)
Fig 3.1.3 Effect of temperature on the Peleg constant Ki of chickpeas and field peas; (a)
Kabuli type; (b) Desi type; (c) Field pea.
0,05
0.04 CJ o
%
? 0.03
- 0.02 m Vi c o O 0.01
0.00 100
-
-
Field Pea
A
A
ICahii l l
^ 6
Semsen
r OesI
• •
200 300 400
Relative Seed Size (number of seeds in 50g)
Fig 3.1.4 Correlation between seed size of chickpea or field pea and constant K3.
48
3.1.4 SUMMARY OF WATER FINDINGS AND SELECTION OF THE
REPRESENTATIVE SAMPLE
Moisture absorption in seven chickpea cultivars and three field pea cuUivars was investigated
at 5, 15, 25 and/or 42°C using the Peleg model (M (t) = Mo + t/[Ki + K2t]). The Peleg
constant Kj varied with temperature. At a given temperature, the lower the Kj, the more
water was absorbed. The Peleg constant K2 was almost unaffected by temperature and could
be used to predict the equilibrium water absorption. A constant K3 expressing the
temperature effect on water absorption {K\ = K3T + K4) was developed to distinguish two
types of chickpea - Desi and KabuU. All chickpeas had similar composition and initial
moisture. The difference in water absorption rate was probably due to thickness and
structure of the seed coat. The Peleg model could be used to predict water absorption in
chickpea and field pea.
The water absorption of chickpea and field pea cultivars could be described by using the
Peleg model. The initial moisture absorption rate (l/K^) and constant K3 were influenced by
the soaking temperature. Constant K2 was almost unaffected by temperature. Using only
short term soaking data, the Peleg model could provide a useflil approach to calculating the
equilibrium moisture content of chickpea and field pea at any soaking temperature.
The results revealed that all seven chickpea varieties, investigated in this section have a
similar chemical composition and also have a rather constant level of proteins (Table 3.1,1).
The selection of a representative variety had to be based on other factors other than solely
chemical composition or the protein level. Since the Kaniva is a very popular chickpea
variety in Victoria, consequently, the seed of this cultivar was selected for this investigation.
3.2 EXTRACTION
3.2.1 PRELIMINARY EXTRACTION PROCEDURE
Preliminary experiments were conducted to determine the optimum conditions for extraction,
concentration and purification of chickpea proteins based on a wet method, widely employed
to extract legume proteins.
Defatted chickpea grits with different sizes, prepared fi-om the Kaniva variety, grown in
Horsham, Victoria were used as raw materials. The grits were subjected to protein extraction
49
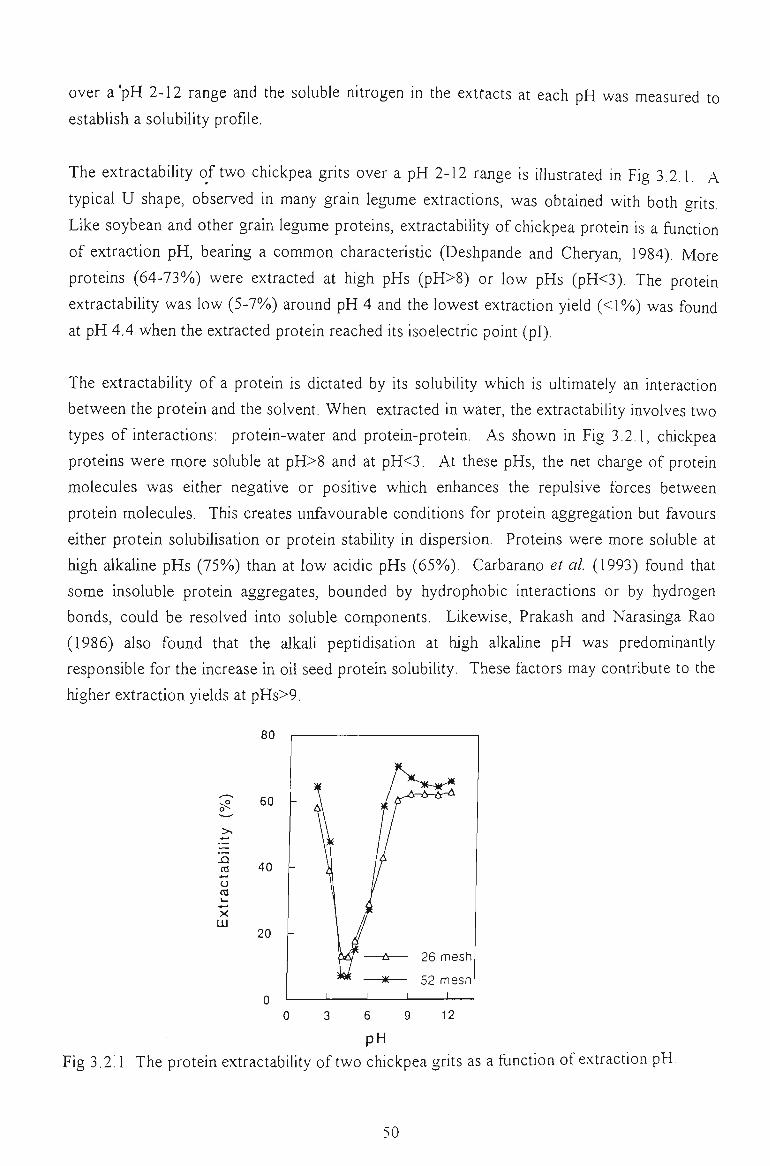
over a'pH 2-12 range and the soluble mtrogen in the extracts at each pH was measured to
establish a solubiUty profile.
The extractabUity of two chickpea grits over a pH 2-12 range is illustrated in Fig 3.2.1. A
typical U shape, observed in many grain legume extractions, was obtained with both grits.
Like soybean and other grain legume proteins, extractability of chickpea protein is a fianction
of extraction pH, bearing a common characteristic (Deshpande and Cheryan, 1984). More
proteins (64-73%)) were extracted at high pHs (pH>8) or low pHs (pH<3). The protein
extractability was low {5-1%) around pH 4 and the lowest extraction yield (<1%) was found
at pH 4.4 when the extracted protein reached Us isoelectric point (pl).
The extractability of a protein is dictated by its solubility which is uUimately an interaction
between the protein and the solvent. When extracted in water, the extractability involves two
types of interactions: protein-water and protein-protein. As shown in Fig 3.2.1, chickpea
proteins were more soluble at pH>8 and at pH<3. At these pHs, the net charge of protein
molecules was either negative or positive which enhances the repulsive forces between
protein molecules. This creates unfavourable condUions for protein aggregation but favours
either protein solubiUsation or protein stabUity in dispersion. Proteins were more soluble at
high alkaline pHs (75%) than at low acidic pHs (65%)). Carbarano et al. (1993) found that
some insoluble protein aggregates, bounded by hydrophobic interactions or by hydrogen
bonds, could be resolved into soluble components. Likewise, Prakash and Narasinga Rao
(1986) also found that the alkali peptidisation at high alkaline pH was predominantly
responsible for the increase in oil seed protein solubility. These factors may contribute to the
higher extraction yields at pHs>9.
80
60
ra 40 o
X UJ
20
26 mesh
52 mesh I
0 3 6 9 12
pH Fig 3.2:1 The protein extractability of two chickpea grits as a function of extraction pH.
50
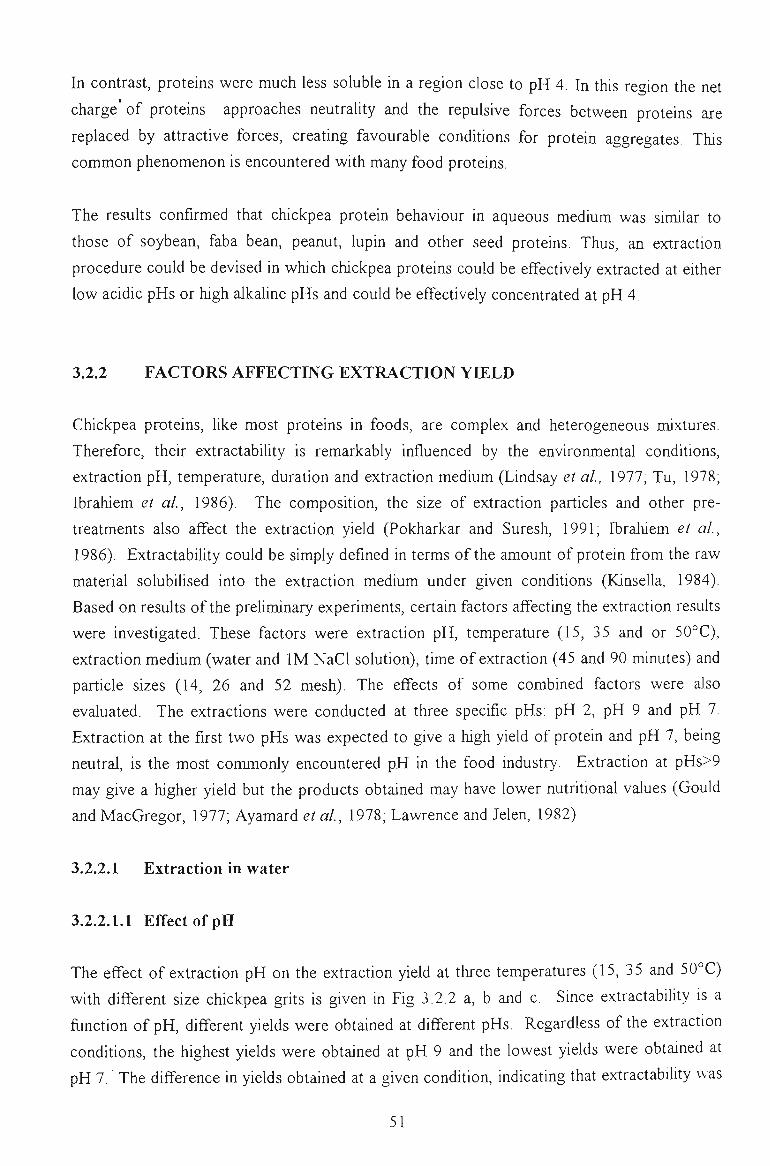
In contrast, proteins were much less soluble in a region close to pH 4. In this region the net
charge' of proteins approaches neutrality and the repulsive forces between proteins are
replaced by attractive forces, creating favourable conditions for protein aggregates. This
common phenomenon is encountered with many food proteins.
The results confirmed that chickpea protein behaviour m aqueous medium was similar to
those of soybean, faba bean, peanut, lupin and other seed proteins. Thus, an extraction
procedure could be devised in which chickpea proteins could be effectively extracted at either
low acidic pHs or high alkaline pHs and could be effectively concentrated at pH 4.
3.2.2 FACTORS AFFECTING EXTRACTION YIELD
Chickpea proteins, like most proteins in foods, are complex and heterogeneous mixtures.
Therefore, their extractability is remarkably influenced by the environmental conditions,
extraction pH, temperature, duration and extraction medium (Lindsay et al, 1977; Tu, 1978,
Ibrahiem et al, 1986). The composition, the size of extraction particles and other pre
treatments also affect the extraction yield (Pokharkar and Suresh, 1991; Ibrahiem et al,
1986). Extractability could be simply defined in terms of the amount of protein from the raw
material solubUised into the extraction medium under given conditions (Kinsella, 1984).
Based on results of the preliminary experiments, certain factors affecting the extraction results
were investigated. These factors were extraction pH, temperature (15, 35 and or 50°C),
extraction medium (water and IM NaCl solution), time of extraction (45 and 90 minutes) and
particle sizes (14, 26 and 52 mesh). The effects of some combined factors were also
evaluated. The extractions were conducted at three specific pHs: pH 2, pH 9 and pH 7.
Extraction at the first two pHs was expected to give a high yield of protein and pH 7, being
neutral, is the most commonly encountered pH in the food industry. Extraction at pHs>9
may give a higher yield but the products obtained may have lower nutritional values (Gould
and MacGregor, 1977; Ayamard et al, 1978; Lawrence and Jelen, 1982)
Z.l.l.X Extraction in water
3.2.2.1.1 Effect of pH
The effect of extraction pH on the extraction yield at three temperatures (15, 35 and 50°C)
wUh different size chickpea grits is given in Fig 3.2.2 a, b and c. Since extractability is a
fiinction of pH, different yields were obtained at different pHs. Regardless of the extraction
conditions, the highest yields were obtained at pH 9 and the lowest yields were obtained at
pH 7. The difference in yields obtained at a given condition, indicating that extractability was
51
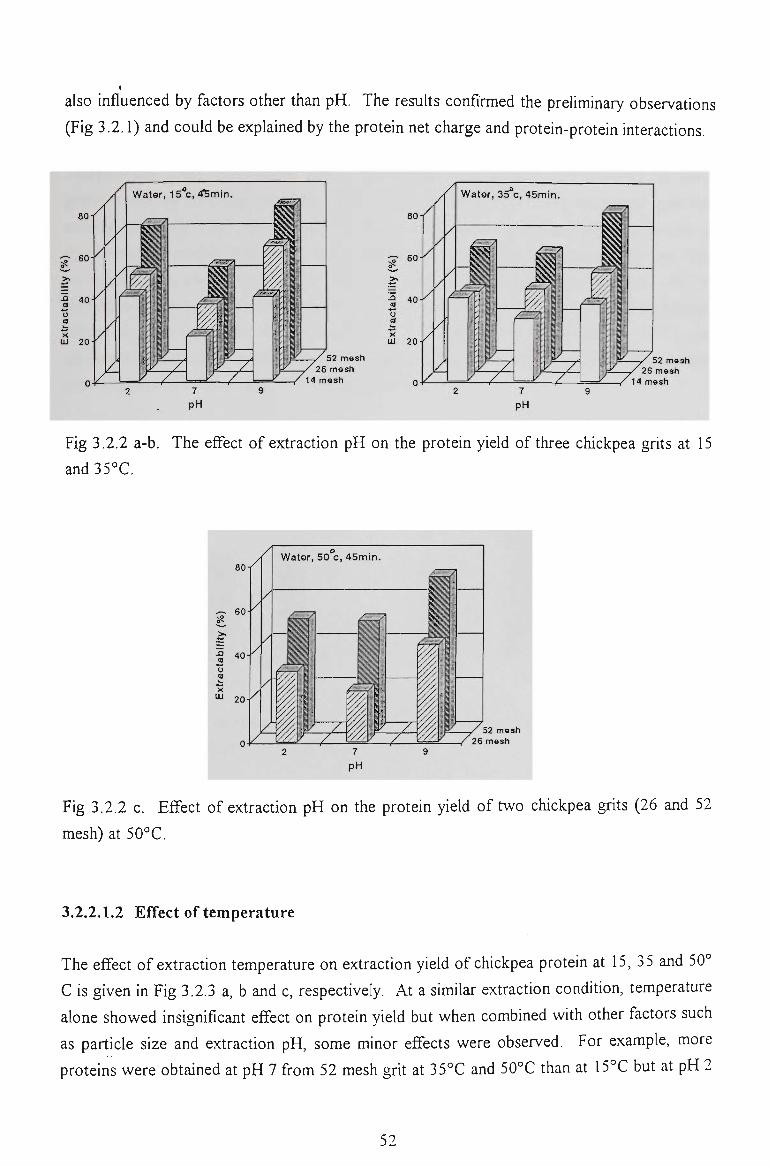
also influenced by factors other than pH. The resuUs confirmed the preliminary observations
(Fig 3.2.1) and could be explained by the protein net charge and protein-protein interactions.
80
60
40
m 20
/ •
/ /
Water, 15 c, 4Smin .
^
^
i iSI
i:«
•r
'EMA'I
I'i
ii -!f I f
J3
52 mesh y 26 mesh 14 mash
7
pH
14 mesh
Fig 3.2.2 a-b. The effect of extraction pH on the protein yield of three chickpea grits at 15
and35°C.
60
•S 40
/
Water, 50 c, 4 5 m i n .
4S7I
^?
:m
:z 7ZL
??•:
^:^^^^iA
52 mosh
7
pH
Fig 3.2.2 c. Effect of extraction pH on the protein yield of two chickpea grits (26 and 52
mesh) at 50°C.
3.2.2.1.2 Effect of temperature
The effect of extraction temperature on extraction yield of chickpea protein at 15, 35 and 50°
C is given in Fig 3.2.3 a, b and c, respectively. At a similar extraction condition, temperature
alone showed insignificant effect on protein yield but when combined with other factors such
as particle size and extraction pH, some minor effects were observed. For example, more
proteins were obtained at pH 7 from 52 mesh grit at 35°C and 50°C than at 15°C but at pH 2
52
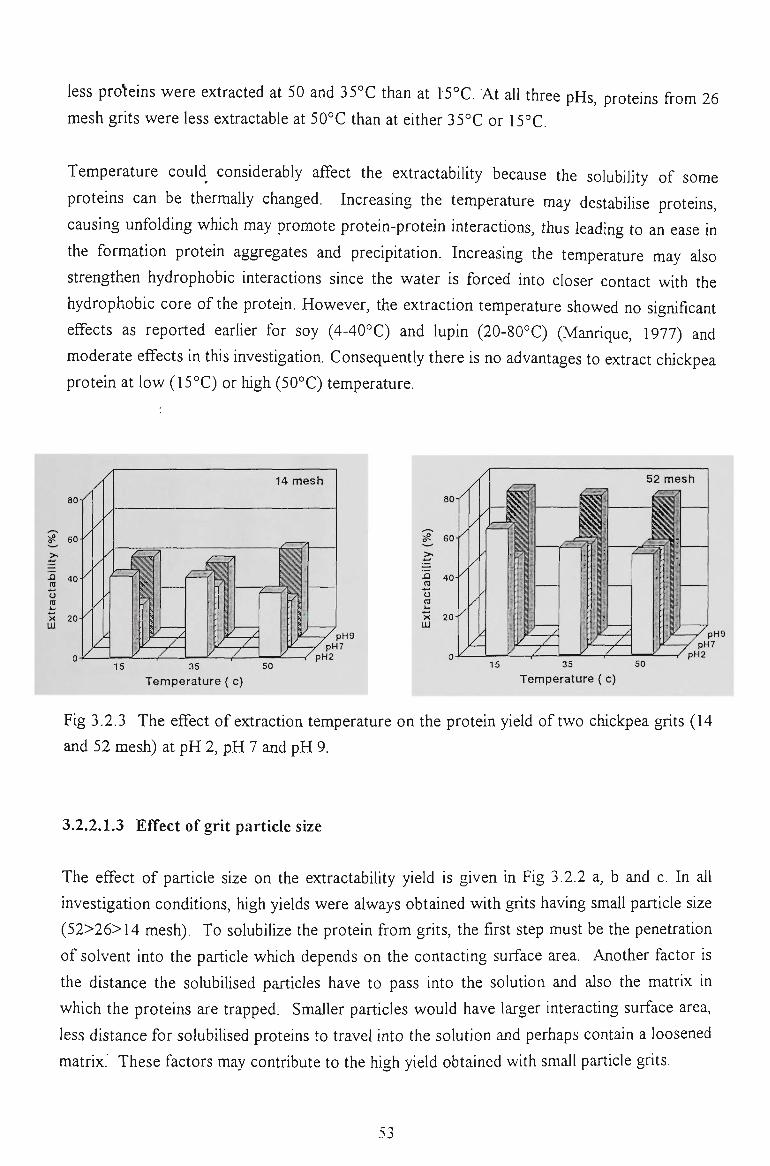
less proteins were extracted at 50 and 35°C than at 15°C, At aU three pHs, proteins from 26
mesh grits were less extractable at 50°C than at either 35°C or 15°C.
Temperature could considerably affect the extractability because the solubility of some
proteins can be thermally changed. Increasing the temperature may destabilise proteins,
causing unfolding which may promote protein-protein interactions, thus leading to an ease in
the formation protein aggregates and precipUation. Increasing the temperature may also
strengthen hydrophobic interactions since the water is forced into closer contact wUh the
hydrophobic core of the protein. However, the extraction temperature showed no significant
effects as reported eariier for soy (4-40°C) and lupin (20-80°C) (Manrique, 1977) and
moderate effects in this investigation. Consequently there is no advantages to extract chickpea
protein at low (15°C) or high (50°C) temperature.
/ !
s; 60
•2 40
. /
X 20 UJ
/ /
l£
i!L :z:
14 mesh
z: 15 35
Temperature ( c)
/ p H 9 pH7
pH2
80
o nj
LU
60
40
. / / 1
/ K
15
52 mesh
pH9 pH7
pH2
Temperature ( c)
Fig 3.2.3 The effect of extraction temperature on the protein yield of two chickpea grits (14
and 52 mesh) at pH 2, pH 7 and pH 9.
3.2.2.1.3 Effect of grit particle size
The effect of particle size on the extractability yield is given in Fig 3.2.2 a, b and c. In all
investigation condUions, high yields were always obtained wUh grits having small particle size
(52>26>14 mesh). To solubUize the protein from grUs, the first step must be the penetration
of solvent into the particle which depends on the contacting surface area. Another factor is
the distance the solubilised particles have to pass into the solution and also the matrix in
which the proteins are trapped. Smaller particles would have larger interacting surface area,
less distance for solubilised proteins to travel into the solution and perhaps contain a loosened
matrix. These factors may contribute to the high yield obtained wUh small particle grits.
: > j
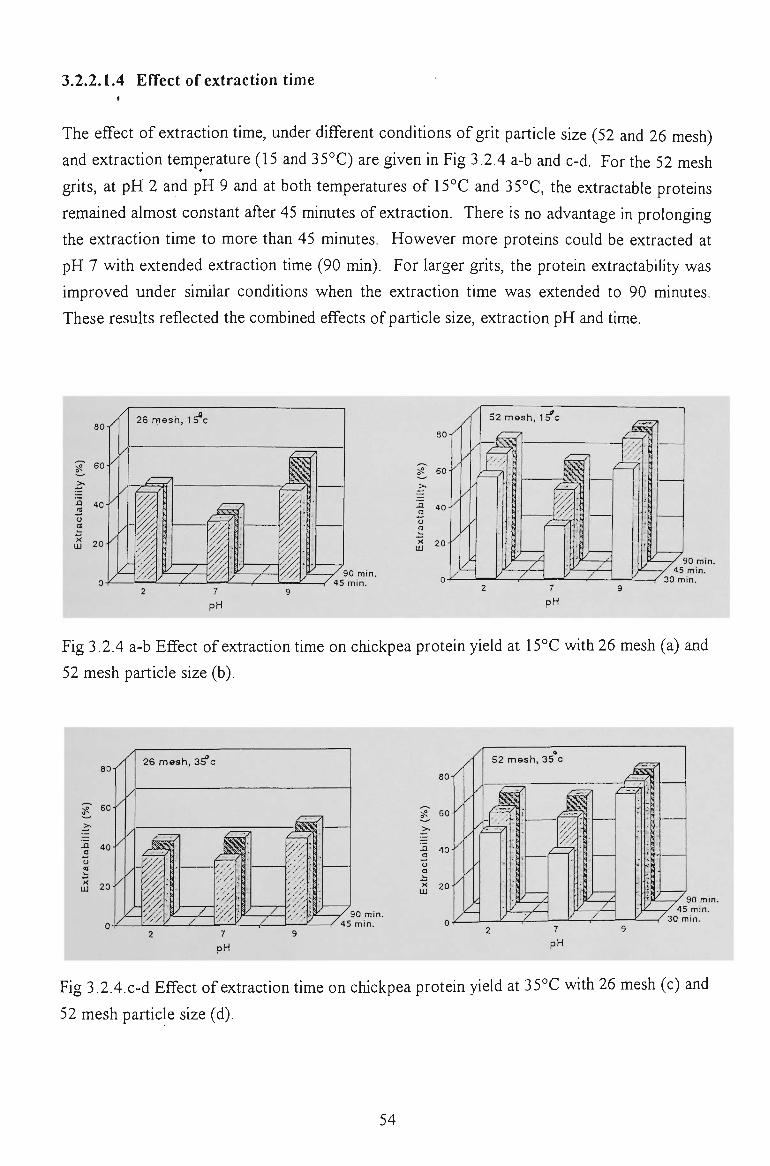
3.2.2.1.4 Effect of extraction time
The effect of extraction time, under different conditions of grit particle size (52 and 26 mesh)
and extraction temperature (15 and 35°C) are given in Fig 3,2,4 a-b and c-d. For the 52 mesh
grits, at pH 2 and pH 9 and at both temperatures of 15°C and 35°C, the extractable proteins
remained almost constant after 45 minutes of extraction. There is no advantage in prolonging
the extraction time to more than 45 minutes. However more proteins could be extracted at
pH 7 with extended extraction time (90 min). For larger grUs, the protein extractability was
improved under similar conditions when the extraction time was extended to 90 minutes.
These results reflected the combined effects of particle size, extraction pH and time.
80 26 mesh, 1 5^c
,fr\A.Vj
90 min.
80 /
i? 60-K
40
20
. /
/
/
/
52 mesh, 1 5'c
/L
pH
-^^
JL —V 90 min. T / 4 5 min.
Fig 3.2.4 a-b Effect of extraction time on chickpea protein yield at 15°C with 26 mesh (a) and
52 mesh particle size (b).
80
60-'
40
2 0 -
/
. /
/
/
26 mash, 3 ^ c
A// v: ~/_
pH
///.
y 90 min. 45 min.
80
-S 40
20
/ /
/
/
A
52 mesh , 35 c
A~A
7\i\
\L
Azy: y 90 min. 45 min.
30 min. 7
pH
Fig 3.2.4.c-d Effect of extraction time on chickpea protein yield at 35°C with 26 mesh (c) and
52 mesh particle size (d).
54
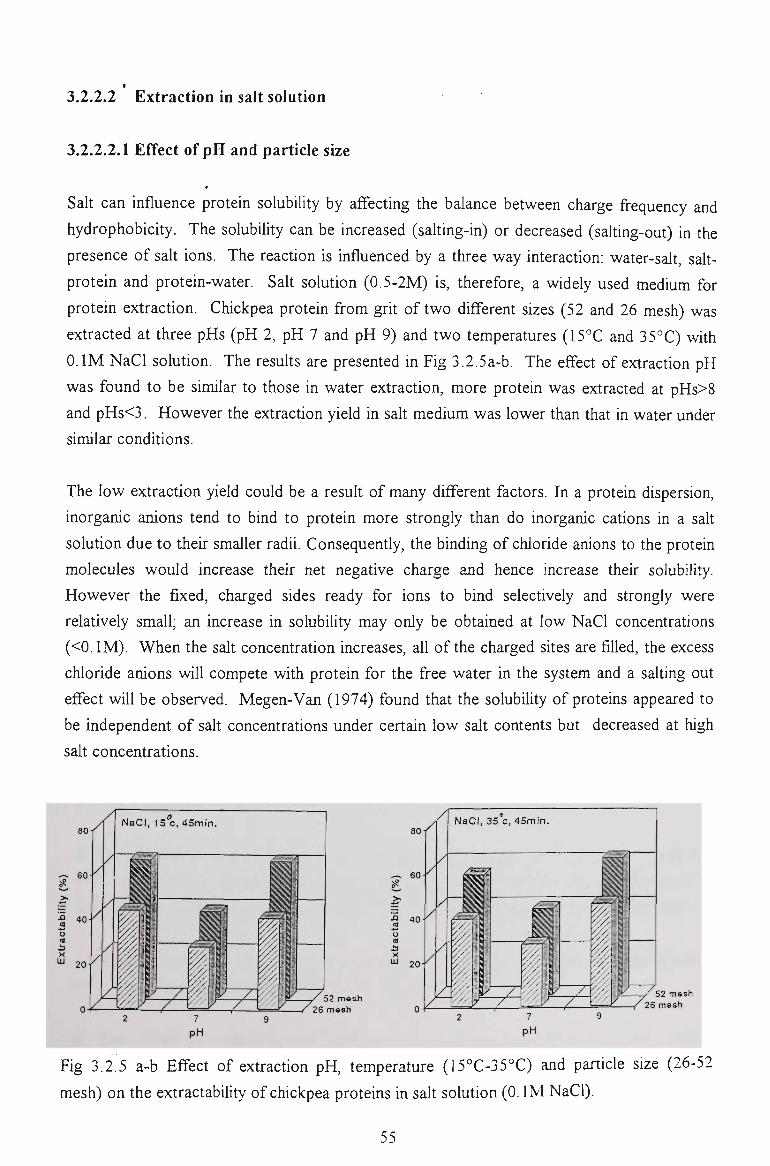
3.2.2.2 Extraction in salt solution
3.2.2.2.1 Effect of pH and particle size
Salt can influence protein solubility by affecting the balance between charge frequency and
hydrophobicity. The solubility can be increased (salting-in) or decreased (salting-out) in the
presence of salt ions. The reaction is influenced by a three way interaction: water-salt, salt-
protein and protein-water. SaU solution (0.5-2M) is, therefore, a widely used medium for
protein extraction. Chickpea protein from grit of two different sizes (52 and 26 mesh) was
extracted at three pHs (pH 2, pH 7 and pH 9) and two temperatures (15°C and 35°C) with
O.IM NaCl solution. The resuUs are presented in Fig 3.2.5a-b. The effect of extraction pH
was found to be similar to those in water extraction, more protein was extracted at pHs>8
and pHs<3. However the extraction yield in salt medium was lower than that in water under
similar conditions.
The low extraction yield could be a result of many different factors. In a protein dispersion,
inorgaiuc anions tend to bind to protein more strongly than do inorganic cations in a saU
solution due to their smaller radii. Consequently, the binding of chloride anions to the protein
molecules would increase their net negative charge and hence increase their solubUity.
However the fixed, charged sides ready for ions to bind selectively and strongly were
relatively small; an increase in solubility may only be obtained at low NaCl concentrations
(<0.1M). When the salt concentration increases, all of the charged sites are filled, the excess
chloride anions wiU compete with protein for the free water in the system and a salting out
effect wiU be observed. Megen-Van (1974) found that the solubility of proteins appeared to
be independent of salt concentrations under certain low salt contents but decreased at high
salt concentrations.
80 NaCI, 15 c, 4Smin. A
80 NaCJ, 35 c, 45min.
Fig 3.2.5 a-b Effect of extraction pH, temperature (I5°C-35°C) and particle size (26-52
mesh) on the extractability of chickpea proteins in salt solution (0. IM NaCl).
55
I
Particle size again showed a significant effect on extraction yield. A smaller grit size save
better yields at all extraction pHs and temperature. Yield increased about 50%o at aU three
extraction pHs and at both 15°C and 35°C when the grit particle size decreased from 26 mesh
to 52 mesh.
3.2.2.2.2 Effect of extraction temperature and extraction time
Prolonging extraction time from 45 minutes to 90 minutes in saU solutions only increased the
extraction yield by less than 10%o. The increase in yield due to extraction time did not show a
uniform pattern in terms of extraction pH or temperature. Interestingly, more proteins were
extracted at pH 2 at lower temperature (15°C) than at higher temperature (35°C). In contrast
less proteins were extracted at pH 7 and pH 9 at the same temperatures. There is no
significant advantage in increasing the extraction time.
3.2.3 STATISTICAL ANALYSIS
The results presented in this section indicate that the extractability of protein is greatly
influenced by several factors. It is difficult to describe the effect of a single factor on the yield
since the extraction process is always multifactorial. Thus, the combined effect of two or
more factors was examined, using factorial design, by constructing groupings to include every
combination of all factors at all the levels (Table 3.2.1). The resuU of forty eight
combinations were analysed with a factorial analysis of variance. The resuUs are presented in
Table 3.2.2. The main effect shown by the factorial analysis are as follows:
a. The particle size effect was the most significant (F(i,47) = 920.52, p<0.001). When the
particle size reduced from 52 mesh to 26 mesh, extraction yield increased from 38,5% to
57.5%, an increase of approximate 49%).
b. The pH and the solvent effects were the second most significant (F(2,47) = 272,7 and 'P(i,4r)
= 71.58, p<0.001). Extraction yield at pH 2, pH 7 and pH 9 were 49.7%, 38.4% and 56.1%,
respectively. Extraction yield in water (50.7%) was higher than in salt solutions (45.4%o).
c. The duration of extraction was not significant (F(9i,47) = 5.08, p<0.05). Extraction yield for
45 min and 90 min were 41.3% and 48.7%), respectively.
d. The effect of extraction temperature was not significant (F(i_47) = 2.08, p=0,17).
Extraction yield at 15°C and 35°C were 48.5% and 47.6%, respectively.
56
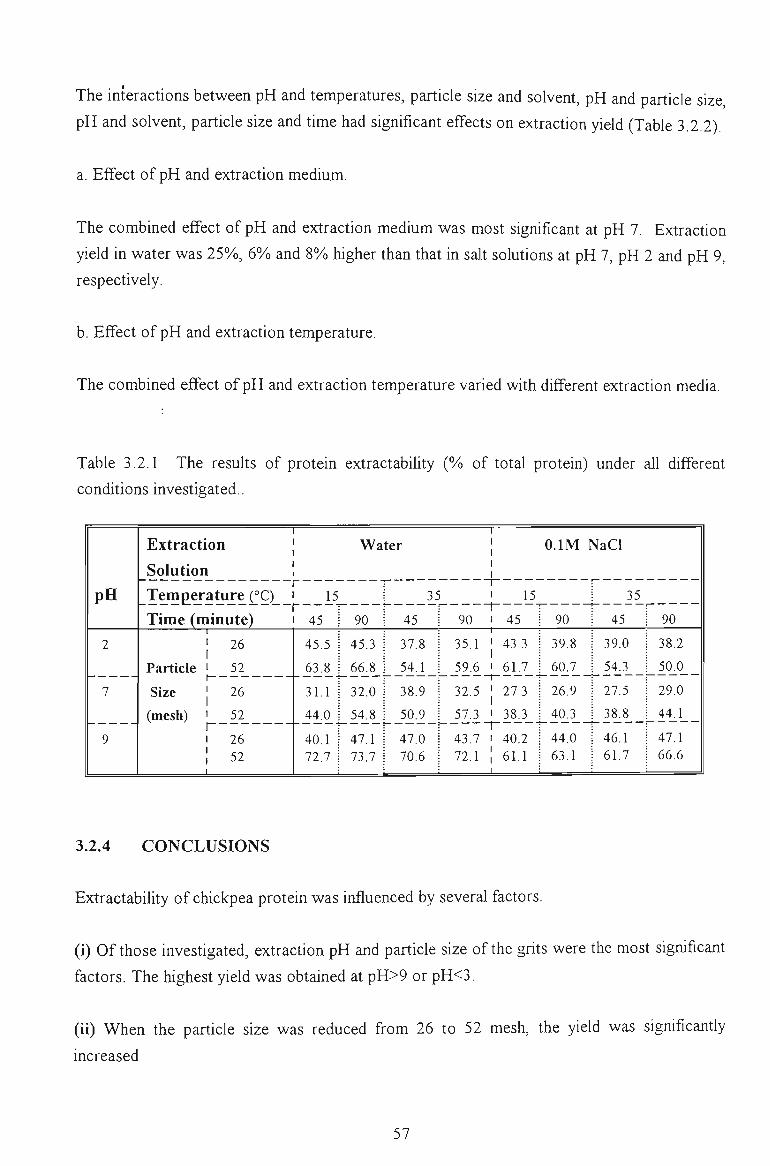
The interactions between pH and temperatures, particle size and solvent, pH and particle size,
pH and solvent, particle size and time had significant effects on extraction yield (Table 3.2.2).
a. Effect of pH and extraction medium.
The combined effect of pH and extraction medium was most significant at pH 7. Extraction
yield in water was 25%), 6%) and 8%) higher than that in salt solutions at pH 7, pH 2 and pH 9,
respectively.
b. Effect of pH and extraction temperature.
The combined effect of pH and extraction temperature varied with different extraction media.
Table 3.2.1 The results of protein extractability {%> of total protein) under all different
conditions investigated..
pH
2
7
9
1 1
Ext rac t ion [ Water ] O.IM NaCI
Solution 1 1 r
Temperature (°C) i 15 r Time (minute) i 45
1 - —
Particle i 52
Size 1 26 (mesh) 1 52
1 26 1 52 1
45.5
63.8
31.1
44.0
40.1 72.7
90
45.3
66.8
32.0
54.8
47.1 73.7
35 1 15
45
37.8
54.1
38.9
50.9
47.0 70.6
1 90 1 45
1 35.1 1 43.3
1
59.6 1 61.7
32.5 j 27.3
57.3 1 38.3
43.7 1 40.2 72.1 1 61.1
1
90
39.8
60.7
26.9
40.3
44.0 63.1
35
45
39.0
54.3
27.5
38.8
46.1 61.7
90
38.2
50.0
29.0
44.1
47.1 66.6
3.2.4 CONCLUSIONS
ExtractabUity of chickpea protein was influenced by several factors.
(i) Of those investigated, extraction pH and particle size of the grits were the most significant
factors. The highest yield was obtained at pH>9 or pH<3.
(ii) When the particle size was reduced from 26 to 52 mesh, the yield was significantly
increased
57
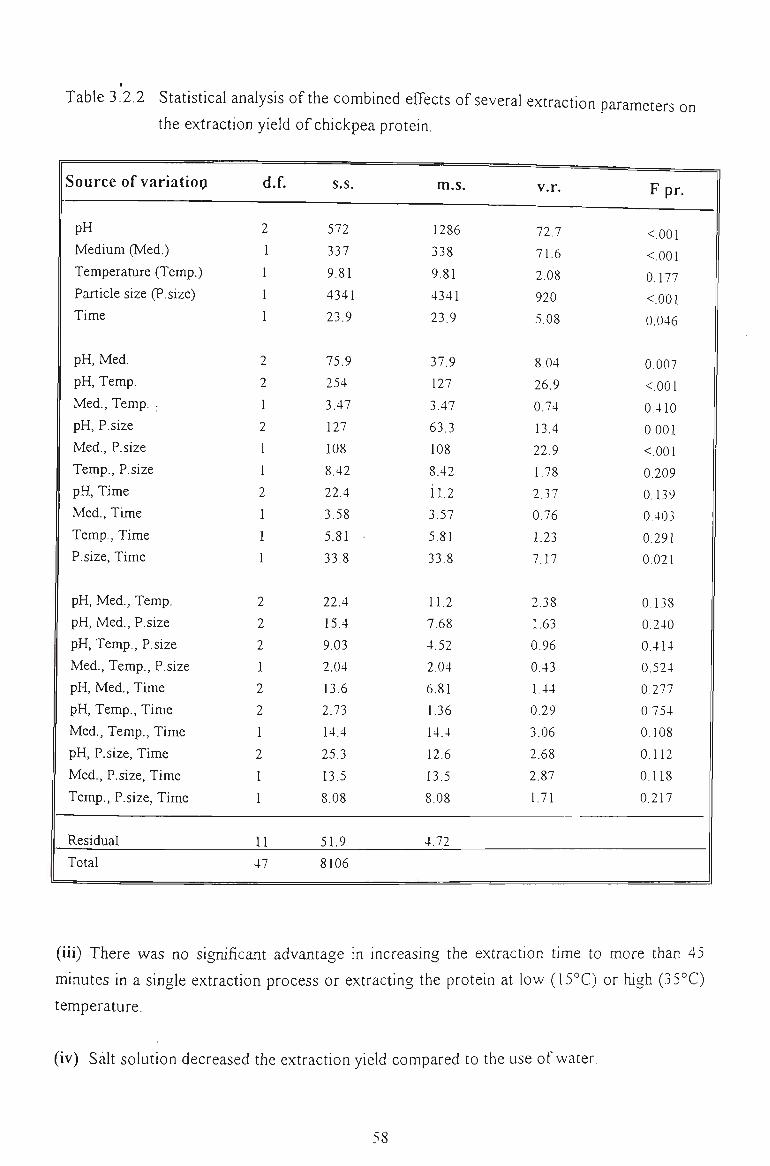
Table 3.2.2 Statistical analysis of the combined effects of several extraction parameters on
the extraction yield of chickpea protein.
Source of variation
pH
Medium (Med.)
Temperature (Temp.)
Particle size (P.size)
Time
pH, Med.
pH, Temp.
Med., Temp. .
pH, P.size
Med., P.size
Temp., P.size
pH, Time
Med., Time
Temp., Time
P. size, Time
pH, Med., Temp.
pH, Med., P.size
pH, Temp., P.size
Med., Temp., P.size
pH, Med., Time
pH, Temp., Time
Med., Temp., Time
pH, P.size, Time
Med., P.size, Time
Temp., P.size, Time
Residual
1 Total
d.f.
2
1
1
1
1
2
2
1
2
I
1
2
1
1
1
2
2
2
1
2
2
1
2
1
1
11
47
S.S.
572
337
9.81
4341
23.9
75.9
254
3.47
127
108
8,42
22.4
3.58
5.81 •
33,8
22.4
15.4
9.03
2.04
13,6
2.73
14.4
25.3
13.5
8.08
51.9
8106
m.s.
1286
338
9.81
4341
23.9
37.9
127
3.47
63.3
108
8.42
ii.2
3,57
5.81
33.8
11.2
7,68
4,52
2.04
6.81
1.36
14.4
12.6
13.5
8.08
4.72
v.r.
72.7
71.6
2.08
920
5.08
8.04
26.9
0,74
13,4
22.9
1.78
2.37
0.76
1.23
7.17
2.38
1,63
0.96
0.43
1,44
0.29
3.06
2.68
2.87
1.71
Fpr.
<.001
<001
0.177
<.001
0.046
0,007
<.001
0.410
0.001
<.001
0.209
0.139
0,403
0,291
0.021
0.138
0.240
0.414
0,524
0,277
0.754
0.108
0.112
0.118
0.217
(iii) There was no significant advantage in increasing the extraction time to more than 45
minutes in a single extraction process or extracting the protein at low (15°C) or high (35°C)
temperature,
(iv) Salt solution decreased the extraction yield compared to the use of water.
58
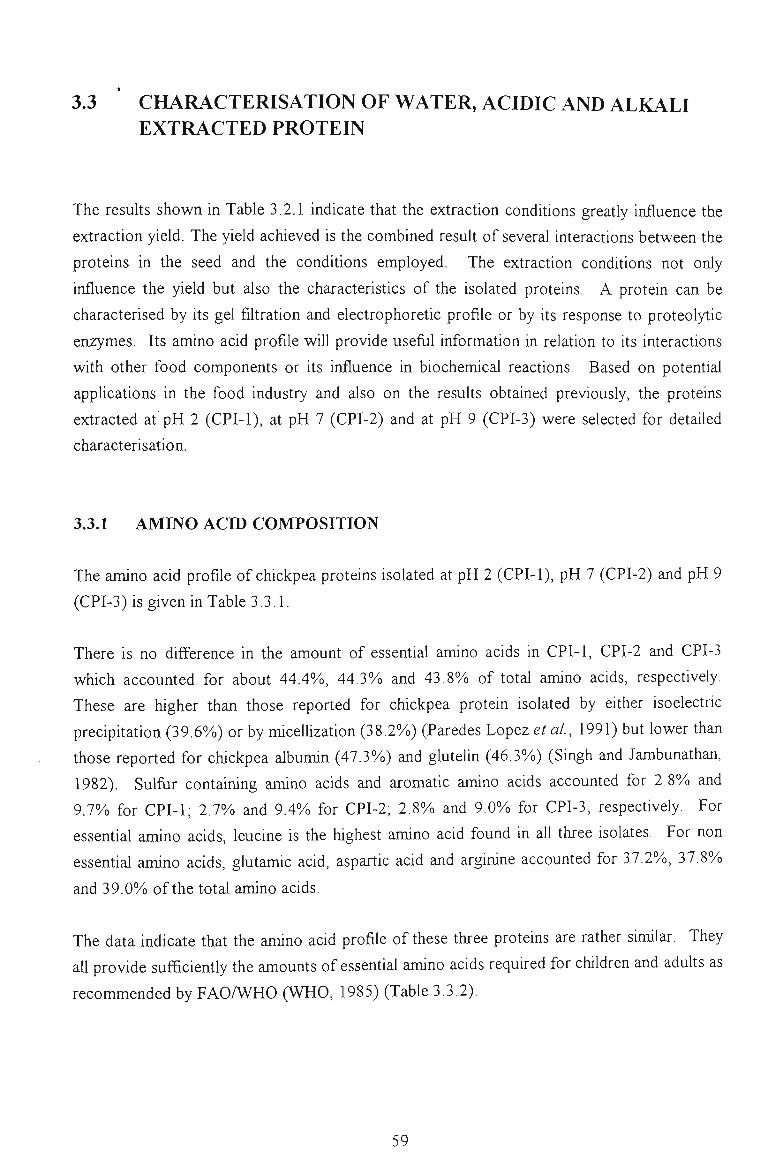
3.3 CHARACTERISATION OF WATER, ACIDIC AND ALKALI EXTRACTED PROTEIN
The resuUs shown in Table 3.2.1 indicate that the extraction conditions greatly influence the
extraction yield. The yield achieved is the combined result of several interactions between the
proteins in the seed and the conditions employed. The extraction conditions not only
influence the yield but also the characteristics of the isolated proteins. A protein can be
characterised by its gel filtration and electrophoretic profile or by its response to proteolytic
enzymes. Its amino acid profile wiU provide useful information in relation to Us interactions
with other food components or its influence in biochemical reactions. Based on potential
applications in the food industry and also on the results obtained previously, the proteins
extracted at'pH 2 (CPI-1), at pH 7 (CPI-2) and at pH 9 (CPI-3) were selected for detailed
characterisation.
3.3.1 AMINO ACID COMPOSITION
The amino acid profile of chickpea proteins isolated at pH 2 (CPI-1), pH 7 (CPI-2) and pH 9
(CPI-3) is given in Table 3.3.1.
There is no difference in the amount of essential amino acids in CPI-1, CPI-2 and CPI-3
which accounted for about 44.4%), 44.3%) and 43.8%) of total amino acids, respectively.
These are higher than those reported for chickpea protein isolated by eUher isoelectric
precipUation (39.6%) or by micelUzation (38.2%) (Paredes Lopez et al, 1991) but lower than
those reported for chickpea albumin (47.3%) and glutelin (46.3%) (Singh and Jambunathan,
1982). Sulfiir containing amino acids and aromatic amino acids accounted for 2.8%) and
9.7% for CPI-1; 2.7% and 9.4% for CPI-2; 2.8% and 9.0% for CPI-3, respectively. For
essential amino acids, leucine is the highest amino acid found in all three isolates. For non
essential amino acids, glutamic acid, aspartic acid and arginine accounted for 37.2%, 37.8%
and 39.0% of the total amino acids.
The data indicate that the amino acid profile of these three proteins are rather similar. They
all provide sufficiently the amounts of essential amino acids required for children and aduUs as
recommended by FAOAVHO (WHO, 1985) (Table 3.3.2).
59
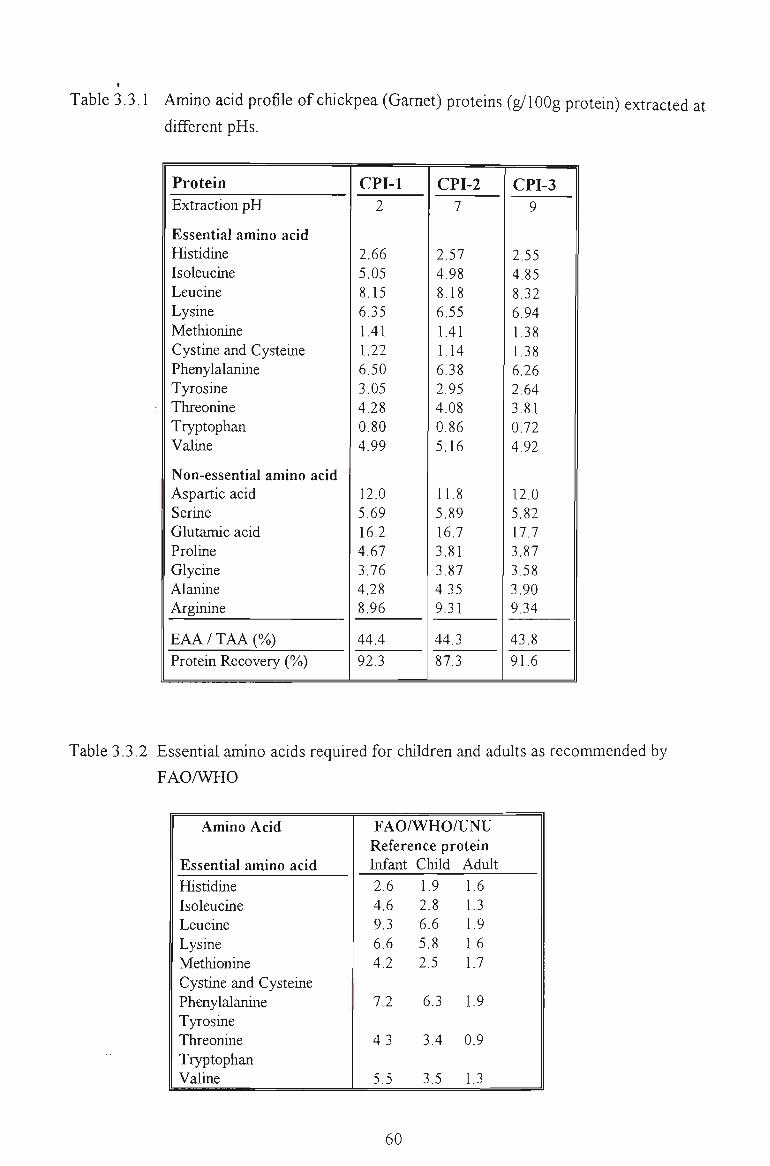
Table 3.3.1 Amino acid profile of chickpea (Garnet) proteins (g/1 OOg protein) extracted at
different pHs.
Protein Extraction pH
Essential amino acid Histidine Isoleucine Leucine Lysine Methionine Cystine and Cysteine Phenylalanine Tyrosine Threonine Tryptophan Valine
Non-essential amino acid Aspartic acid Serine Glutamic acid Proline Glycine Alanine Arginine
EAA/TAA(%) Protein Recovery (%)
CPI-1 2
2.66 5.05 8.15 6.35 1.41 1.22 6.50 3.05 4.28 0.80 4.99
12.0 5.69 16.2 4.67 3.76 4.28 8.96
44.4 92.3
CPI-2 7
2.57 4.98 8.18 6.55 1.41 1.14 6.38 2.95 4.08 0.86 5.16
11.8 5.89 16.7 3.81 3.87 4.35 9.31
44.3 87.3
CPI-3 9
2.55 4.85 8.32 6.94 1.38 1.38 6.26 2.64 3.81 0.72 4,92
12.0 5.82 17.7 3.87 3.58 3.90 9.34
43.8 91.6
Table 3.3.2 Essential amino acids required for children and adults as recommended by
FAOAVHO
Amino Acid
Essential amino acid Histidine Isoleucine Leucine Lysine Methionine Cystine and Cysteine Phenylalanine Tyrosine Threonine Tryptophan Valine
FAOAVHO/UNU Reference protein Infant Child Adult 2.6 1,9 1.6 4.6 2.8 1.3 9.3 6.6 1.9 6.6 5.8 1,6 4.2 2.5 1.7
7.2 6.3 1.9
4.3 3.4 0.9
5.5 3.5 1.3
60
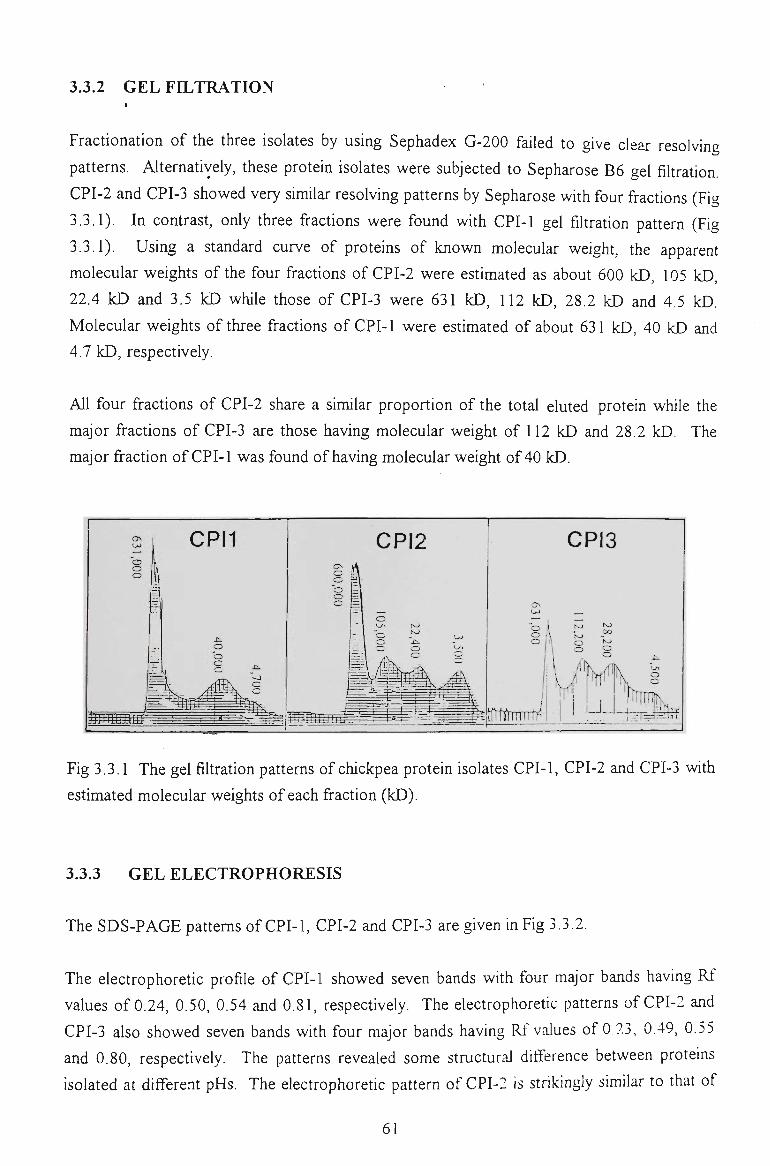
3.3.2 GEL FILTRATION
Fractionation of the three isolates by using Sephadex G-200 failed to give clear resolving
patterns. Alternatively, these protein isolates were subjected to Sepharose B6 gel filtration.
CPI-2 and CPI-3 showed very similar resolving patterns by Sepharose with four fractions (Fig
3.3.1). In contrast, only three fractions were found with CPI-1 gel filtration pattern (Fig
3.3.1). Using a standard curve of proteins of known molecular weight, the apparent
molecular weights of the four fractions of CPI-2 were estimated as about 600 kD, 105 kD,
22.4 kD and 3.5 kD while those of CPI-3 were 631 kD, 112 kD, 28.2 kD and 4,5 kD.
Molecular weights of three fractions of CPI-1 were estimated of about 631 kD, 40 kD and
4.7 kD, respectively.
All four fractions of CPI-2 share a similar proportion of the total eluted protein while the
major fractions of CPI-3 are those having molecular weight of 112 kD and 28.2 kD, The
major fraction of CPI-1 was found of having molecular weight of 40 kD.
Fig 3.3.1 The gel filtration patterns of chickpea protein isolates CPI-1, CPI-2 and CPI-3 with
estimated molecular weights of each fraction (kD).
3.3.3 GEL ELECTROPHORESIS
The SDS-PAGE patterns of CPI-1, CPI-2 and CPI-3 are given in Fig 3.3.2.
The electrophoretic profile of CPI-1 showed seven bands wUh four major bands having Rf
values of 0.24, 0.50, 0.54 and 0.81, respectively. The electrophoretic patterns of CPI-2 and
CPI-3 also showed seven bands with four major bands having Ri values of 0.23, 0,49, 0.55
and 0.80, respectively. The patterns revealed some structural difference between proteins
isolated at different pHs, The electrophoretic pattern of CPI-2 is strikingly similar to that of
61
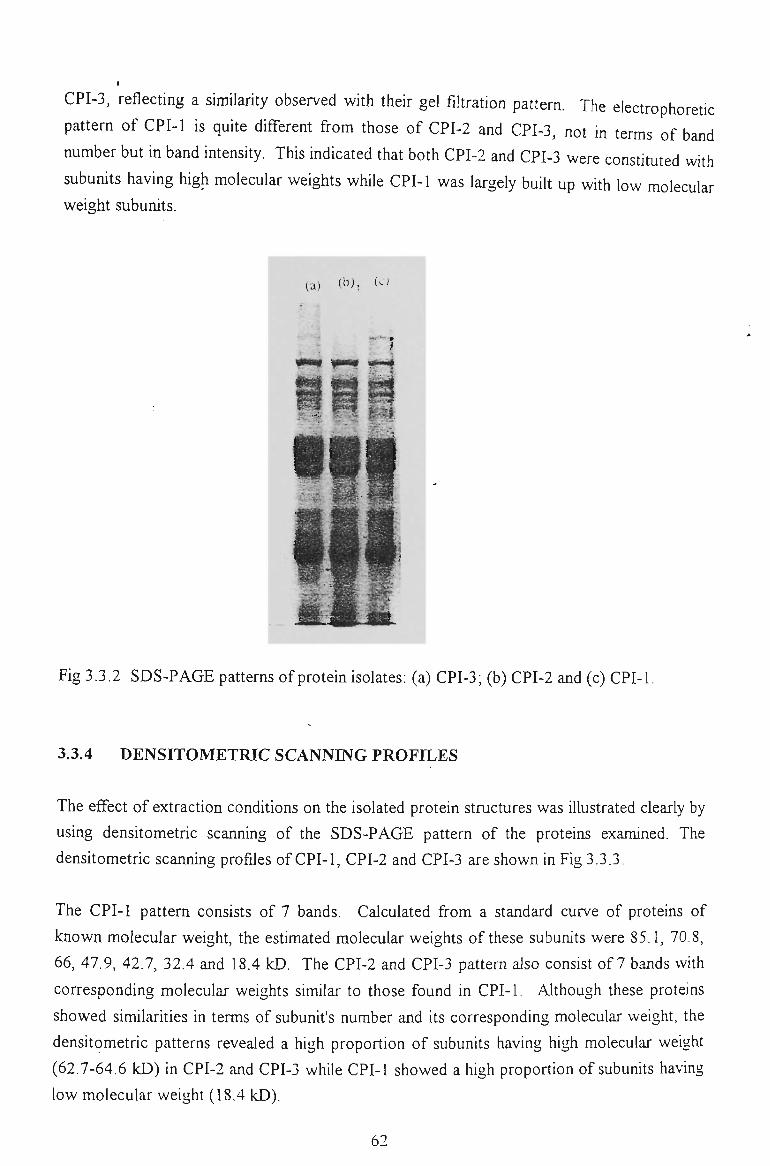
CPI-3, reflecting a similarity observed with their gel filtration pattern. The electrophoretic
pattern of CPI-1 is quite different from those of CPI-2 and CPI-3, not in terms of band
number but in band intensity. This indicated that both CPI-2 and CPI-3 were constituted with
subunits having high molecular weights while CPI-1 was largely buiU up wUh low molecular
weight subunits.
Fig 3.3.2 SDS-PAGE patterns of protein isolates: (a) CPI-3; (b) CPI-2 and (c) CPI-1,
3.3.4 DENSITOMETRIC SCANNING PROFILES
The effect of extraction conditions on the isolated protein structures was Ulustrated clearly by
using densitometric scanning of the SDS-PAGE pattern of the proteins examined. The
densUometric scanning profiles of CPI-1, CPI-2 and CPI-3 are shown in Fig 3.3.3.
The CPI-1 pattern consists of 7 bands. Calculated from a standard curve of proteins of
known molecular weight, the estimated molecular weights of these subunits were 85.1, 70,8,
66, 47.9, 42.7, 32.4 and 18.4 kD. The CPI-2 and CPI-3 pattern also consist of 7 bands with
corresponding molecular weights similar to those found in CPI-1. Although these proteins
showed similarities in terms of subunU's number and Us corresponding molecular weight, the
densUometric patterns revealed a high proportion of subunUs having high molecular weight
(62.7-64.6 kD) in CPI-2 and CPI-3 while CPI-1 showed a high proportion of subunUs having
low molecular weight (18.4 kD).
62
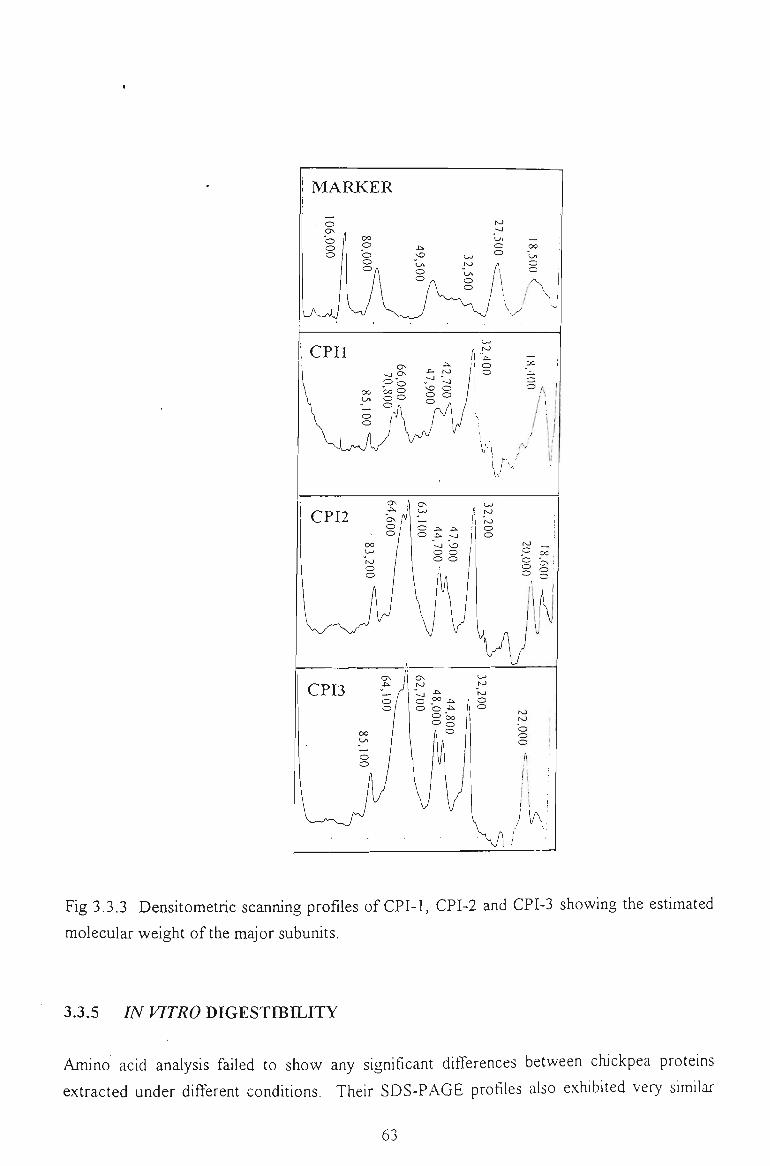
Fig 3.3.3 DensUometric scanning profiles of CPI-1, CPI-2 and CPI-3 showing the estimated
molecular weight of the major subunits.
3.3.5 IN VITRO DIGESTIBILITY
Amino acid analysis failed to show any significant differences between chickpea proteins
extracted under different condUions. Their SDS-PAGE profiles also exhibUed very similar
63
3.3.5 IN VITRO DIGESTIBILITY
Amino acid analysis failed to show any significant differences between chickpea proteins
extracted under different conditions. Their SDS-PAGE profiles also exhibUed very similar
patterns. The obvious differences that exist among these three proteins were only recognised
with their densitometric scanning profiles. These profiles suggested that the proteins extracted
at neutral and alkaUne pH (CPI-2 and CPI-3) were predominantly constUuted of subunits
having high molecular weight in a similar proportion while the protein extracted at acidic pH
(CPI-1) were made with a higher proportion of low molecular weight subunits. The difference
in their composition and structure, undetected clearly by their SDS-PAGE profile, could be
recognised by their interactions with other components or in their in vitro enzymatic
hydrolysis.
3.3.5.1 Gel filtration profile of chickpea hydrolysates by papain and trypsin
The effect of different extraction conditions on the protein structure could be illustrated by
analysing their in vitro digestibility profile. The hydrolysates obtained from each of the three
proteins by trypsin and papain at several digestion times were subjected to Sepharose
filtration. Their resolving patterns are given in Fig 3.3.4 and Fig 3.3.5.
a. Trypsin
As shown in Fig 3.3.4, fractions with low molecular weight (4.70 kD-40 kD) of the CPI-1
were hydrolysed very rapidly within 30 minutes of incubation. The fraction having molecular
weight of 40 kD was almost completely broken down to 3.2 - 5,7 kD fraction but the fraction
with a molecular weight of 630 kD remained almost intact. This fraction was gradually
degraded after 3 hours but a small part of this fraction still remained after 24 hours of
incubation. Similar observations were also obtained with the CPl-2 and CPI-3. The only
noted difference was the more susceptiveness to enzymatic hydrolysis of the fraction with
highest molecular weight (630 kD) of these two proteins. This fraction was almost completely
degraded after 0.5 hour of digestion in the case of CPI-2 and 3 hours in the case of CPI-3.
b. Papain
Fractions with low molecular weight (4.7 kD-44 kD) of the CPI-1 were hydrolysed more
slowly with papain than wUh trypsin wUhin 30 minutes of incubation. Like trypsin, papain has
also failed to completely degrade the fraction wUh the highest molecular weight (630 kD) of
this protein isolate after 24 hours of incubation. In contrast, CPI-2 and CPI-3 were more
susceptive to papain than CPI-1. The first fraction of both proteins (630 kD) was almost
64
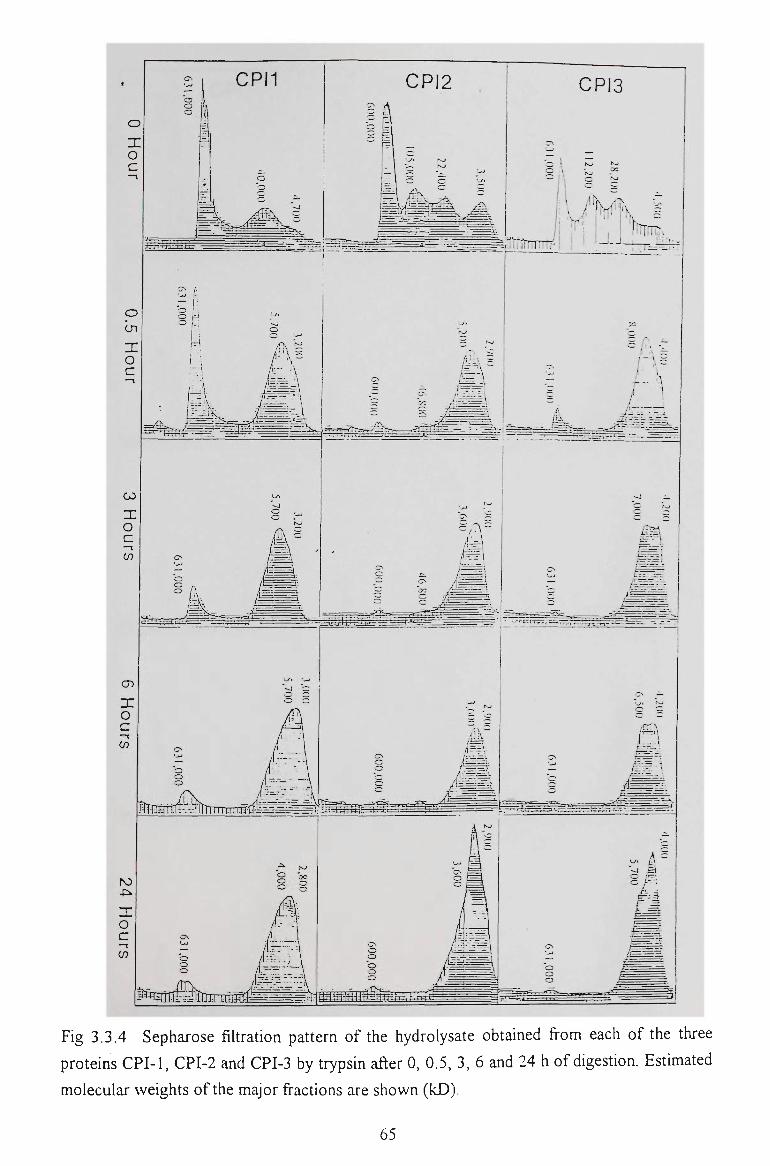
en z: o c CO
CPU CPI2 CP13
^h^^^r^...^
5 C, .^
4^
X o C —t
"^mm-^.h^mxmrm^X^^.
r—S
— —Vfarrrja::!.
faiTrirrmtf^—-^ S i H I
Fig 3.3.4 Sepharose filtration pattern of the hydrolysate obtained from each of the three
proteins CPI-1, CPI-2 and CPI-3 by trypsin after 0, 0.5, 3, 6 and 24 h of digestion. Estimated
molecular weights of the major fractions are shown (kD).
65
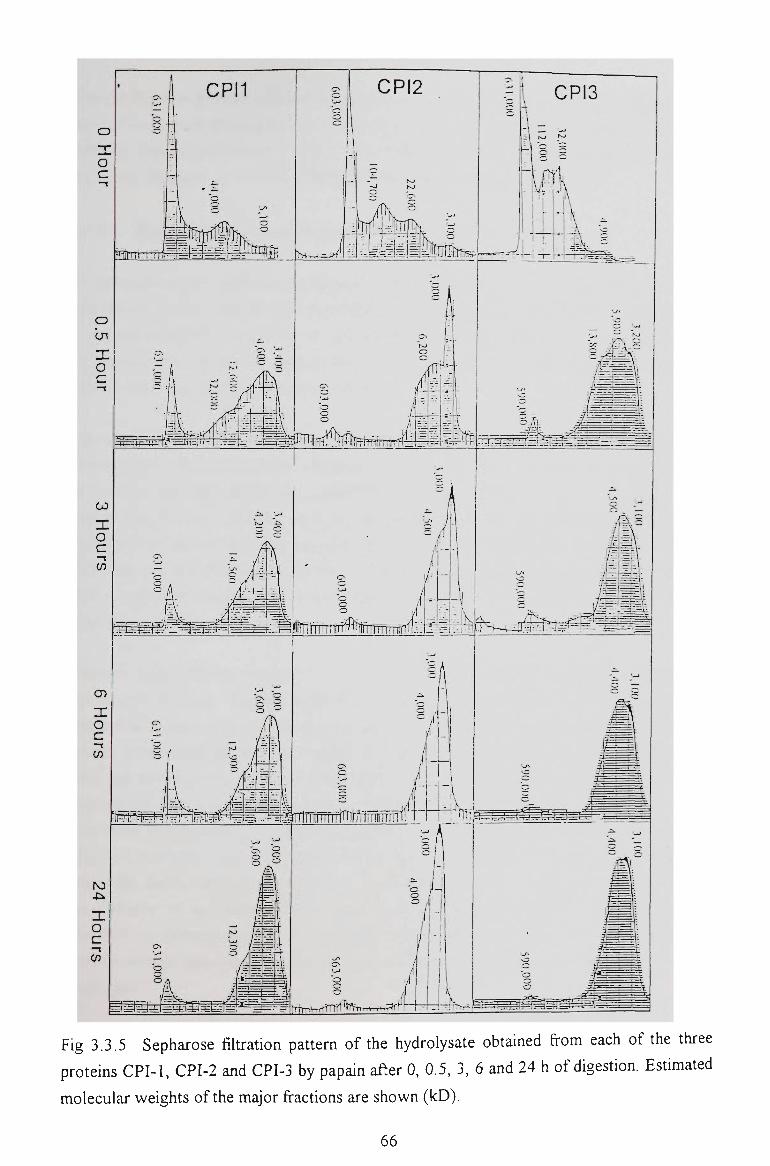
CPU
X o c
o In
CO
o c
llll]
mtrrrir ; ; ; ^ ^ ; ^ ^ l i l t %
cn X O c —t
(/)
E&-ii:ii4'-_-^-^e=;
^FAMnbWil
ilfmtTTtmrrl
IPrt*!
X o C cn o
c
igflS{^%t^~^#TTlTTliTrf^
(3-;
=lI^ajj.l=uBgl^^ty^'^^-#|tTtTT•w^^lms^^v^.-^^^'
Fig 3.3.5 Sepharose filtration pattern of the hydrolysate obtained from each of the three
proteins CPI-1, CPI-2 and CPI-3 by papain after 0, 0.5, 3, 6 and 24 h of digestion. Estimated
molecular weights of the major fractions are shown (kD).
66
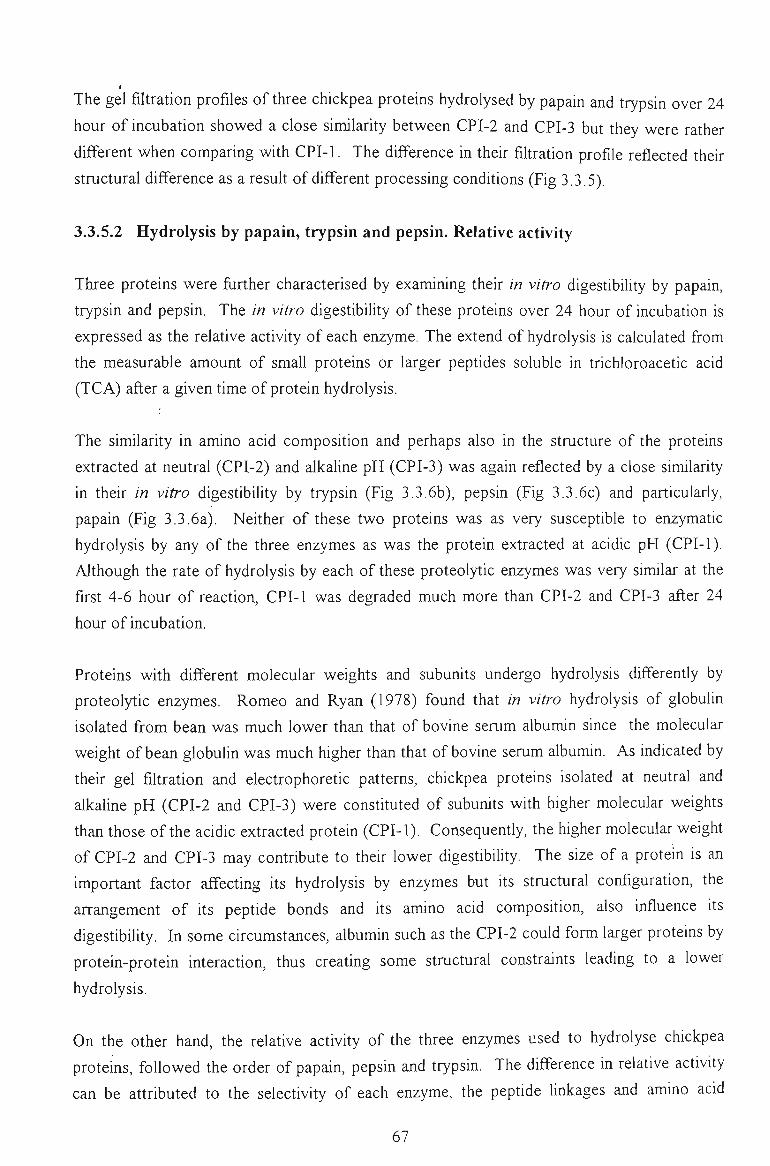
The gel filtration profiles of three chickpea proteins hydrolysed by papain and trypsin over 24
hour of incubation showed a close similarity between CPI-2 and CPI-3 but they were rather
different when comparing with CPI-1. The difference in their filtration profile reflected their
structural difference as a result of different processing conditions (Fig 3.3.5).
3.3.5.2 Hydrolysis by papain, trypsin and pepsin. Relative activity
Three proteins were fiirther characterised by examining their in vitro digestibility by papaiti,
trypsin and pepsin. The in vitro digestibility of these proteins over 24 hour of incubation is
expressed as the relative activity of each enzyme. The extend of hydrolysis is calculated from
the measurable amount of smaU proteins or larger peptides soluble in trichloroacetic acid
(TCA) after a given time of protein hydrolysis.
The similarity in amino acid composition and perhaps also in the structure of the proteins
extracted at neutral (CPI-2) and alkaline pH (CPI-3) was again reflected by a close similarity
in their in vitro digestibUity by trypsin (Fig 3.3.6b), pepsin (Fig 3.3.6c) and particularly,
papain (Fig 3.3.6a). Neither of these two proteins was as very susceptible to enzymatic
hydrolysis by any of the three enzymes as was the protein extracted at acidic pH (CPI-1).
Although the rate of hydrolysis by each of these proteolytic enzymes was very similar at the
first 4-6 hour of reaction, CPI-1 was degraded much more than CPI-2 and CPI-3 after 24
hour of incubation.
Proteins with different molecular weights and subumts undergo hydrolysis differently by
proteolytic enzymes. Romeo and Ryan (1978) found that in vitro hydrolysis of globulin
isolated from bean was much lower than that of bovine serum albumin since the molecular
weight of bean globulin was much higher than that of bovine serum albumin. As indicated by
their gel filtration and electrophoretic patterns, chickpea proteins isolated at neutral and
alkaline pH (CPI-2 and CPI-3) were constituted of subunits with higher molecular weights
than those of the acidic extracted protein (CPI-1). Consequently, the higher molecular weight
of CPI-2 and CPI-3 may contribute to their lower digestibility. The size of a protein is an
important factor affecting Us hydrolysis by enzymes but Us structural configuration, the
arrangement of Us peptide bonds and Us amino acid composition, also influence Us
digestibility. In some circumstances, albumin such as the CPI-2 could form larger proteins by
protein-protein interaction, thus creating some structural constraints leading to a lower
hydrolysis.
On the other hand, the relative activity of the three enzymes used to hydrolyse chickpea
proteins, foUowed the order of papain, pepsin and trypsin. The difference in relative activity
can be attributed to the selectivity of each enzyme, the peptide linkages and amino acid
67
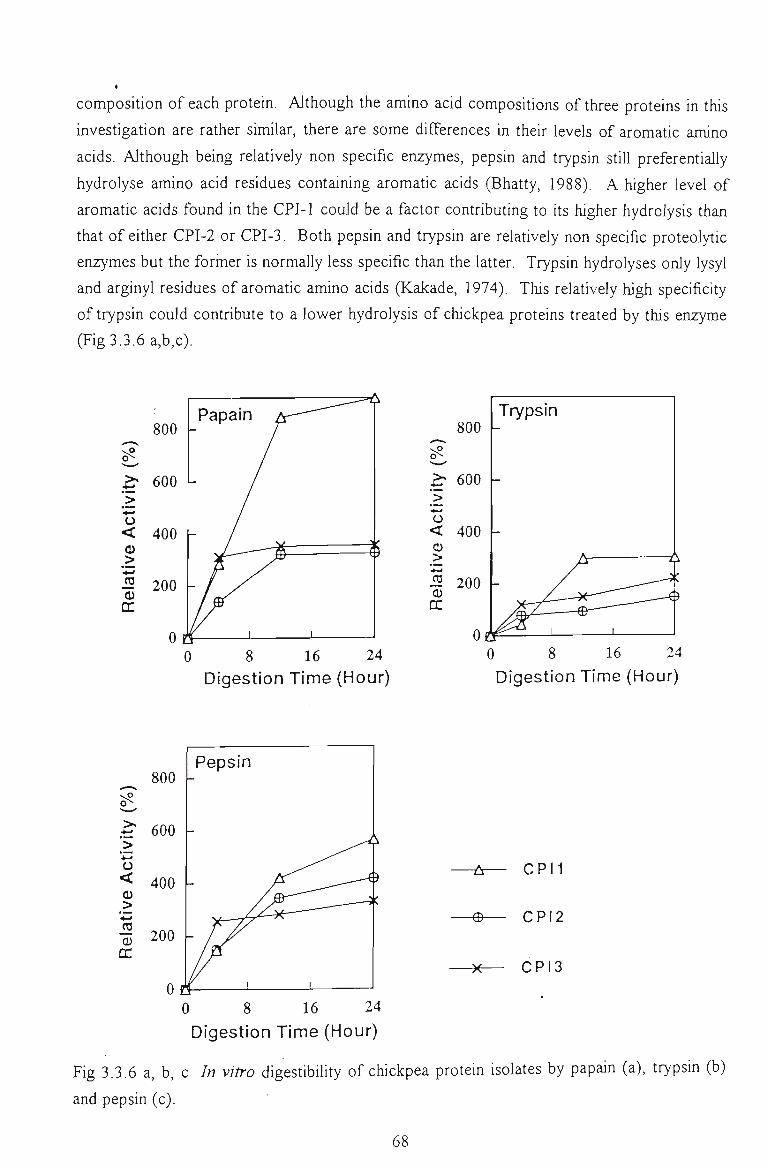
composition of each protein. Although the amino acid compositions of three proteins in this
investigation are rather similar, there are some differences in their levels of aromatic amino
acids. Although being relatively non specific enzymes, pepsin and trypsin still preferentially
hydrolyse amino acid residues containing aromatic acids (Bhatty, 1988). A higher level of
aromatic acids found in the CPI-1 could be a factor contributing to its higher hydrolysis than
that of eUher CPI-2 or CPI-3. Both pepsin and trypsin are relatively non specific proteolytic
enzymes but the former is normally less specific than the latter. Trypsin hydrolyses only lysyl
and arginyl residues of aromatic amino acids (Kakade, 1974). This relatively high specificity
of trypsin could contribute to a lower hydrolysis of chickpea proteins treated by this enzyme
(Fig 3.3.6 a,b,c).
> o <
0) DC
800 -
600
400 -
200 -
0 8 16 24 Digestion Time (Hour)
800 -
^ > *-' o < Q> >
•-<
ro 0) cc
600
400
200
0 0 8 16 24
Digestion Time (Hour)
^ 800
o^
^ 600
o < 400 o _> *->
•o 200
Pepsin
/ 1 1 ..
-©-
CPU
CPI2
CPI3
0 8 16 24
Digestion Time (Hour)
Fig 3.3.6 a, b, c In vitro digestibility of chickpea protein isolates by papain (a), trypsin (b)
and pepsin (c).
68
I
The investigation proved that extraction of chickpea seed proteins under different conditions
would not only give different extraction yields but also yield different types of protein. A
high yield was obtained at extraction pH 2 and pH 9. Gel fiUration patterns, electrophoretic
and densitometric analysis together with enzymatic in vitro digestion studies indicated that
water extracted proteins (CPI-2) are characteristically more similar to those extracted at
alkaUne pH (CPI-3) than proteins extracted at acidic pH (CPI-1).
3.4 EXTRACTION AND CHARACTERISATION OF CHICKPEA ALBUMIN AND GLOBULIN
Like other legume proteins, chickpea albumin is a rich source of essential amino acids (Singh
et al, 1981). The sulfur containing amino acids, tryptophan, threonine and lysine are all
higher in albumin than in globulin (Bhatty, 1982). Albumin was also found to be readily
hydrolysed by proteolytic enzymes (Murray and Roxburgh, 1984). Regardless of these
desirable nutritional values, only a few investigations of this protein fraction have been
reported. This may be due to the fact that albumin was generally accepted as only a minor
fraction while globulin and gluteUn were considered as major protein fractions. Singh et al.
(1981) reported that the albumin fraction extracted from chickpea with NaCl solutions
accounted for only 12% of the total protein. Similar resuUs were also reported by Bhatty
(1982) and Singh et al (1988). Schroeder et al. (1988) found an albumin/globulin ratio of
0.23 for Hyprosok, a high yield chickpea variety.
As described in Section 3.2 a major water soluble protein fraction (48%) was obtained in our
search for economical means of quantUatively extracting chickpea proteins The different
resuUs obtained in this study compared wUh those reported by other investigators suggests
that the yield of this protein fraction might vary considerably, depending on extraction
conditions and the physico chemical procedures used (Bhatty, 1988). Because of Us high
nutritional values and the potential applications in food uses, the albumin fraction warrants
fiirther investigation.
3.4.1 PROTEIN EXTRACTABILITY
The yield of the albumin and globulin fractions of three chickpea varieties, extracted by three
procedures is summarised in Table 3.4.1. The protein yields varied with the procedure
employed and wUh varieties, accounting for 43-77% of protein in the defatted flours. More
proteins were extracted by using eUher NaCl (Method B) or K2SO4 solution (Method .A),
69
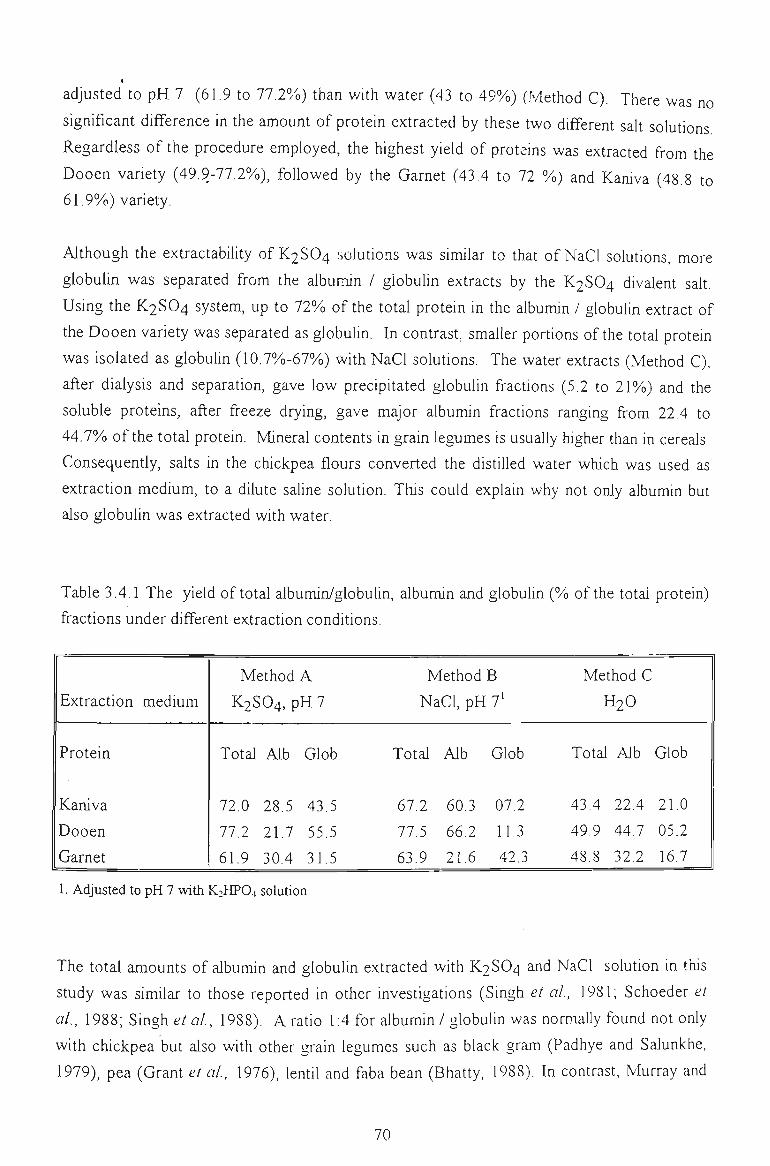
adjusted to pH 7 (61.9 to 77.2%) than v/ith water (43 to 49%) (Method C). There was no
significant difference in the amount of protein extracted by these two different salt solutions
Regardless of the procedure employed, the highest yield of proteins was extracted from the
Dooen variety (49.9-77.2%), followed by the Garnet (43.4 to 72 %) and Kaniva (48.8 to
61.9%) variety.
Although the extractability of K2SO4 .solutions was similar to that of NaCl solutions, more
globulin was separated from the albumin / globulin extracts by the K2SO4 divalent saU.
Using the K2SO4 system, up to 12% of the total protein in the albumin / globulin extract of
the Dooen variety was separated as globuUn. In contrast, smaller portions of the total protein
was isolated as globuUn (10.7%)-67%) with NaCl solutions. The water extracts (Method C),
after dialysis and separation, gave low precipUated globulin fractions (5.2 to 21%) and the
soluble proteins, after freeze drying, gave major albumin fractions ranging from 22.4 to
44.1% of the total protein. Mineral contents in grain legumes is usually higher than in cereals.
Consequently, salts in the chickpea flours converted the distiUed water which was used as
extraction medium, to a dilute saUne solution. This could explain why not only albumin but
also globulin was extracted with water.
Table 3.4.1 The yield of total albumin/globuUn, albumin and globulin (% of the total protein)
fractions under different extraction conditions.
Extraction medium
Protein
Kaniva
Dooen
Garnet
Method A
K2SO4, pH 7
Total Alb Glob
72.0 28.5 43.5
77.2 21.7 55.5
61.9 30.4 31.5
Method B
NaCl, pH f
Total Alb Glob
67.2 60.3 07.2
77.5 66.2 11,3
63.9 21.6 42.3
Method C
H2O
Total Alb Glob
43,4 22,4 21.0
49.9 44.7 05.2
48.8 32.2 16.7
1. Adjusted to pH 7 with K2HPO4 solution
The total amounts of albumin and globulin extracted wUh K2SO4 and NaCl solution in this
study was similar to those reported in other investigations (Singh et al, 1981; Schoeder et
al, 1988; Singh et al, 1988). A ratio 1:4 for albumin / globulin was normally found not only
with chickpea but also with other grain legumes such as black gram (Padhye and Salunkhe,
1979), pea (Grant et al, 1976), lentil and faba bean (Bhatty, 1988), In contrast, Murray and
70
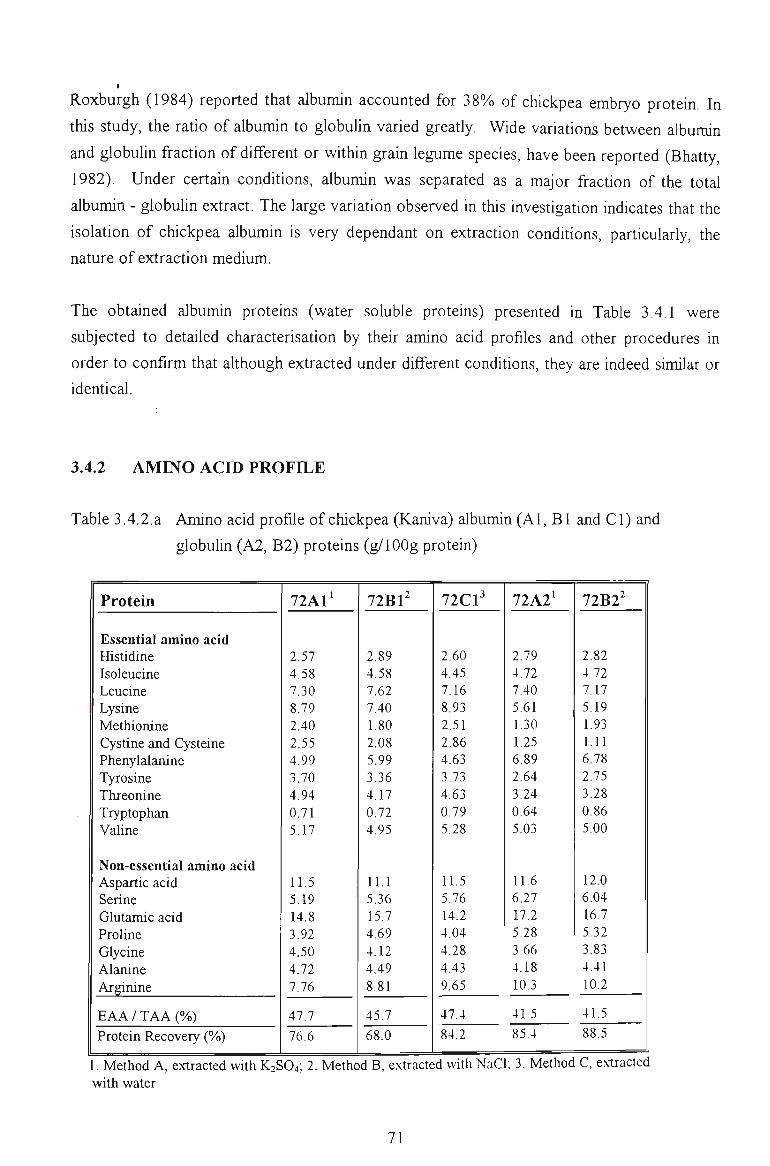
Roxburgh (1984) reported that albumin accounted for 38% of chickpea embryo protein. In
this study, the ratio of albumin to globulin varied greatly. Wide variations between albumin
and globulin fraction of different or within grain legume species, have been reported (Bhatty,
1982). Under certain conditions, albumin was separated as a major fraction of the total
albumin - globulin extract. The large variation observed in this investigation indicates that the
isolation of chickpea albumin is very dependant on extraction condUions, particularly, the
nature of extraction medium.
The obtained albumin proteins (water soluble proteins) presented in Table 3.4.1 were
subjected to detaUed characterisation by their amino acid profiles and other procedures Ui
order to confirm that although extracted under different conditions, they are indeed similar or
identical.
3.4.2 AMINO ACID PROFELE
Table 3.4.2.a Amino acid profile of chickpea (Kaniva) albumin (Al, Bl and CI) and
globulin (A2, B2) proteins (g/1 OOg protein)
Protein
Essential amino acid Histidine Isoleucine Leucine Lysine Methionine Cystine and Cysteine Phenylalanine Tyrosine Threonine Tryptophan Valine
Non-essential amino acid Aspartic acid Serine Glutamic acid Proline Glycine Alanine Arginine
EAA / TAA (%) Protein Recovery (%)
1. Method A, extracted with K2S
72A1^
2.57 4.58 7.30 8.79 2.40 2.55 4.99 3.70 4.94 0.71 5.17
11.5 5.19 14.8 3.92 4.50 4.72 7.76
47.7 76.6
O4; 2. Methc
72B1^
2.89 4.58 7.62 7.40 1.80 2.08 5.99 3.36 4.17 0.72 4.95
11.1 5.36 15.7 4.69 4.12 4.49 8.81
45.7 68.0
id B, extracte
72C1'
2.60 4.45 7.16 8.93 2.51 2.86 4.63 3.73 4.63 0.79 5.28
11.5 5.76 14.2 4.04 4.28 4,43 9,65
47.4 84.2
;d with NaC
72A2^
2.79 4,72 7.40 5.61 1.30 1.25 6.89 2.64 3.24 0.64 5.03
11.6 6.27 17.2 5.28 3.66 4.18 10.3
41.5 85.4
I; 3. Methoc
72B2^
2.82 4,72 7.17 5.19 1.93 1.11 6.78 2.75 3.28 0.86 5.00
12.0 6.04 16.7 5.32 3.83 4,41 10.2
41.5
88.5
C, extracted
with water
71
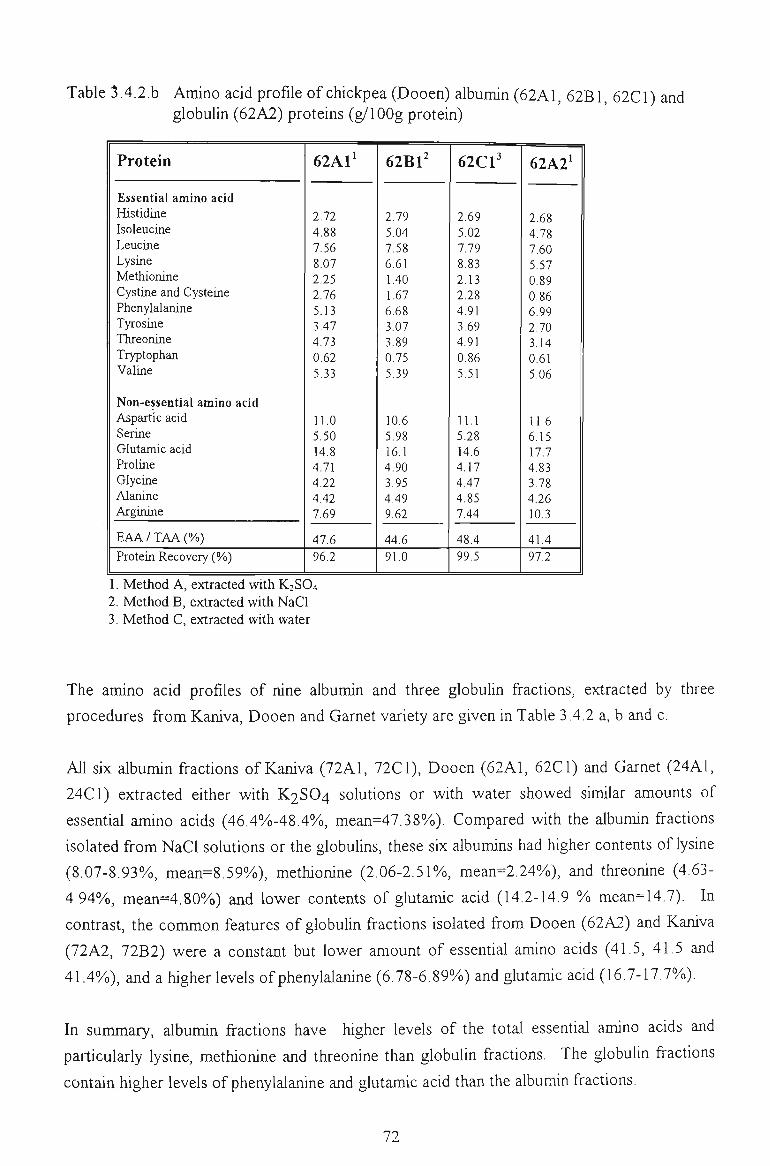
Table 3.4.2.b Amino acid profile of chickpea (Dooen) albumin (62A1, 62B1, 62C1) and globulin (62A2) proteins (g/1 OOg protein)
Protein
Essential amino acid Histidine Isoleucine Leucine Lysine Methionine Cystine and Cysteine Phenylalanine Tyrosine Threonine Tryptophan Valine
Non-essential amino acid Aspartic acid Serine Glutamic acid Proline Glycine Alanine Arginine
EAA/TAA(%) Protein Recovery (%)
62 Al'
2.72 4.88 7.56 8.07 2.25 2.76 5.13 3.47 4,73 0.62 5.33
11.0 5.50 14.8 4.71 4.22 4.42 7.69
47.6 96.2
62B1^
2.79 5.04 7,58 6.61 1,40 1,67 6.68 3.07 3.89 0.75 5.39
10.6 5,98 16.1 4.90 3.95 4,49 9,62
44.6 91.0
62C1'
2.69 5.02 7.79 8.83 2.13 2.28 4.91 3.69 4.91 0,86 5.51
11.1 5,28 14.6 4.17 4,47 4,85 7,44
48.4 99.5
62A2'
2.68 4,78 7.60 5.57 0.89 0.86 6.99 2.70 3.14 0.61 5.06
11,6 6.15 17.7 4.83 3.78 4.26 10.3
41.4 97,2
1. Method A, extracted with K2SO4 2. Method B, extracted with NaCI 3. Method C, extracted with water
The amino acid profiles of nine albumin and three globulin fractions, extracted by three
procedures from Kaniva, Dooen and Garnet variety are given in Table 3.4.2 a, b and c.
All six albumin fractions of Kaniva (72A1, 72C1), Dooen (62A1, 62C1) and Garnet (24A1,
24C1) extracted either with K2SO4 solutions or wUh water showed similar amounts of
essential amino acids (46.4%)-48.4%, mean=47.38%). Compared with the albumin fractions
isolated from NaCl solutions or the globuUns, these six albumins had higher contents of lysine
(8.07-8.93%, mean=8.59%), methionine (2.06-2.51%, mean=2.24%), and threonine (4.63-
4.94%), mean=4.80%)) and lower contents of glutamic acid (14.2-14.9 %o mean=14.7). In
contrast, the common features of globulin fractions isolated from Dooen (62A2) and Kaniva
(72A2, 72B2) were a constant but lower amount of essential amino acids (41.5, 41.5 and
41.4%), and a higher levels of phenylalanine (6.78-6.89%) and glutamic acid (16.7-17.7%).
In summary, albumin fractions have higher levels of the total essential amino acids and
particularly lysine, methionine and threonine than globulin fractions. The globulin fractions
contain higher levels of phenylalanine and glutamic acid than the albumin fractions.
72
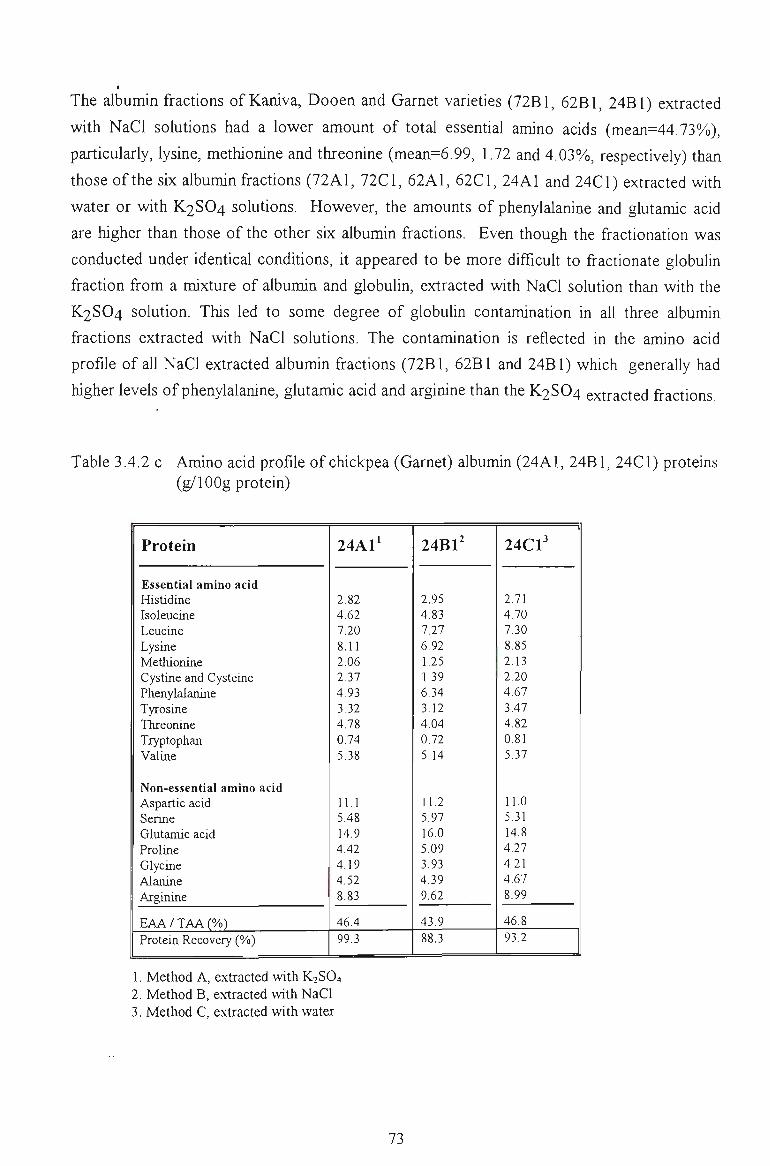
The albumin fractions of Kaniva, Dooen and Garnet varieties (72B1, 62B1, 24B1) extracted
with NaCl solutions had a lower amount of total essential amino acids (mean=44.73%)),
particularly, lysine, methionine and threonine (mean=6.99, 1.72 and 4.03%), respectively) than
those of the six albumin fractions (72A1, 72C1, 62A1, 62C1, 24A1 and 24C1) extracted with
water or with K2SO4 solutions. However, the amounts of phenylalanine and glutamic acid
are higher than those of the other six albumin fractions. Even though the fractionation was
conducted under identical conditions, it appeared to be more difficult to fractionate globulin
fraction from a mixture of albumin and globulin, extracted with NaCl solution than with the
K2SO4 solution. This led to some degree of globulin contamination in all three albumin
fractions extracted with NaCl solutions. The contamination is reflected in the amino acid
profile of all NaCl extracted albumin fractions (72B1, 62B1 and 24B1) which generally had
higher levels of phenylalarune, glutamic acid and arginine than the K2SO4 extracted fractions
Table 3.4.2 c Amino acid profile of chickpea (Garnet) albumin (24A1, 24B1, 24C1) proteins (g/1 OOg protein)
Protein
Essential amino acid Histidine Isoleucine Leucine Lysine Methionine Cystine and Cysteine Phenylalanine Tyrosine Threonine Tryptophan Valine
Non-essential amino acid Aspartic acid Serine Glutamic acid Proline Glycine Alanine Arginine
EAA/TAA(%) Protein Recovery (%)
24A1'
2.82 4.62 7.20 8.11 2.06 2.37 4.93 3.32 4.78 0.74 5,38
11,1 5.48 14,9 4.42 4,19 4,52 8.83
46.4 99.3
24B1^
2.95 4,83 7,27 6,92 1,25 1.39 6.34 3.12 4.04 0.72 5.14
11,2 5,97 16.0 5,09 3,93 4.39 9.62
43,9 88,3
24C1'
2.71 4.70 7.30 8.85 2.13 2.20 4.67 3,47 4.82 0.81 5.37
11.0 5.31 14.8 4.27 4.21 4.67 8.99
46.8 93.2
1. Method A, extracted with K2SO4 2. Method B, extracted with NaCl 3. Method C, extracted with water
73
3.4.3 GEL FILTRATION
All albumin fractions of Kaniva, Dooen and Garnet varieties isolated by the three procedures
were subjected to gel filtration on Sephadex G-200 and Sepharose B-6. Sephadex G-200
produced very poor resolving patterns. In contrast, the Sepharose B-6 fiUration showed a
similar resolving pattern for all the nine albumin fractions (Fig 3.4.1) wUh four clear fractions.
The chromatogram of these albumins was similar but the amount of protein in each individual
fraction was different. Based on a protein standard curve of proteins of known molecular
weight, five peaks in the albumin chromatogram were estimated at approximately 665 kD, 68
kD, 46 kD, 19 kD and 13 kD, respectively.
The protein eluded at the void volume (665 kD) could be an agglomerate of several proteins
and accounted for only a smaU amount (15%)) of the total eluded protein. The major fractions
were the ones having molecular weight of 46-68 kD and of 13-19 kD, respectively. The
proportion of these two fractions varied with the procedure employed and with the varieties
investigated. For example, Kaniva protein extracted with water or with K2SO4 showed an
approximately equal amount of proteins between these two fractions (Fig 3.4.1). When
extracted with NaCl, the amount of protein in first fraction (68 kD) was higher than the
second fraction (13 kD and 46 kD). This reflected some degree of globulin's contamination
in the albumin extracted with NaCl solution. This observation was supported by the gel
filtration pattern of Dooen and Garnet albumin fractions extracted with K2SO4 which
showed an approximately equal amount of protein in the first and second fraction.
The results suggests that chickpea albumin consisted of four distinct protein fractions wUh
estimated molecular weights of 68, 46, 19 and 13 kD, respectively. The gel filtration
chromatogram of chickpea globulin showed four fractions having estimated molecular
weights of 74 kD, 44 kD, 20 kD and 10 kD, respectively.
3.4.4 GEL ELECTROPHORESIS
The SDS-PAGE patterns of the albumin and globulin fraction of seven chickpea varieties
extracted with water, K2SO4 and NaCl solutions are given in Fig 3.4.2.
There was no difference in SDS-PAGE patterns (subunits) of all the albumins extracted under
different conditions, except their intensity. The electrophoretic profiles of all albumin
fractions were characterised by seven distinct subunits. These subunits were identified by the
Rf values of 0.23, 0.27, 0.38, 0.55, 0.64, 0.87 and 0.93. For the albumin fractions extracted
with NaCl, an increase in intensity of subumts wUh Rf values of 0.55-0.64 and 0.87-0.93 was
74
I
observed. This only difference in the electrophoretic profile of all of the albumin fractions
confirmed a globulin contamination in the albumin fractions extracted with NaCl solution.
The electrophoretic profile of all globulin fractions was similar but U was clearly different to
that of the albumin. The globulin fraction was also characterised by seven distinct subunits,
having Rf values of 0.35, 0.41, 0.47, 0.53, 0.73, 0.77 and 0.85, respectively. The globulin
electrophoretic pattern was different with that of albumin, both in terms of intensity and
mobility. Compared with those of albumins, the electrophoretic characteristics of globuUn
show a smaller number of bands with faster band mobility and a higher intensity of the lower
molecular weight subunits.
The SDS-PAGE pattern failed to distinguish the cultivar difference but the albumin and
globulin fraction of chickpea proteins could be identified by their clearly different
electrophoretic pattern. In an attempt to characterise several protein fractions of chickpea,
Singh et al. (1981) also found little difference between the SDS-PAGE profiles of Kabuli and
Desi varieties.
3.4.5 DENSITOMETRIC SCANNING PROFILES
The electrophoretic characteristics of chickpea albumins and globulins were examined more
closely by densUometric scanning of their SDS-PAGE patterns. DensUometric scanning
profiles of nine albumin and globuUn fractions of Kaniva, Dooen and Garnet, extracted by the
three procedures are given in Fig 3.4.3.
The densUometric scanning profiles of six albumin fractions (Kaniva, Dooen and Garnet)
extracted with eUher K2SO4 or water were almost identical, as characterised by six distinct
peaks. The molecular weight of these subunits were estimated to be 96, 84, 65, 38.5, 32.5
and 20 kD, respectively. The albumin fraction from each of three chickpea varieties extracted
with NaCl solutions also showed the six distinct subunits as observed previously. There were
a few extra peaks found in the ranges of 18-26 kD and also at 41-46 kD. These subunits
indicated some degree of globulin contamination.
The densUometric scanning profile of all nine chickpea globulin fractions showed similar
patterns. They were generally characterised by five distinct subunits with molecular weights
estimated to be 69, 42, 40, 24.5 and 22 kD, respectively. The profiles of the globulins
extracted wUh NaCl solution did not reveal individual peaks as sharp as those extracted with
either K2SO4 or water. There was also a reduction of some subunits with molecular weight
of about 65 kD. This indicated that not all albumin was separated from the globulin when
75
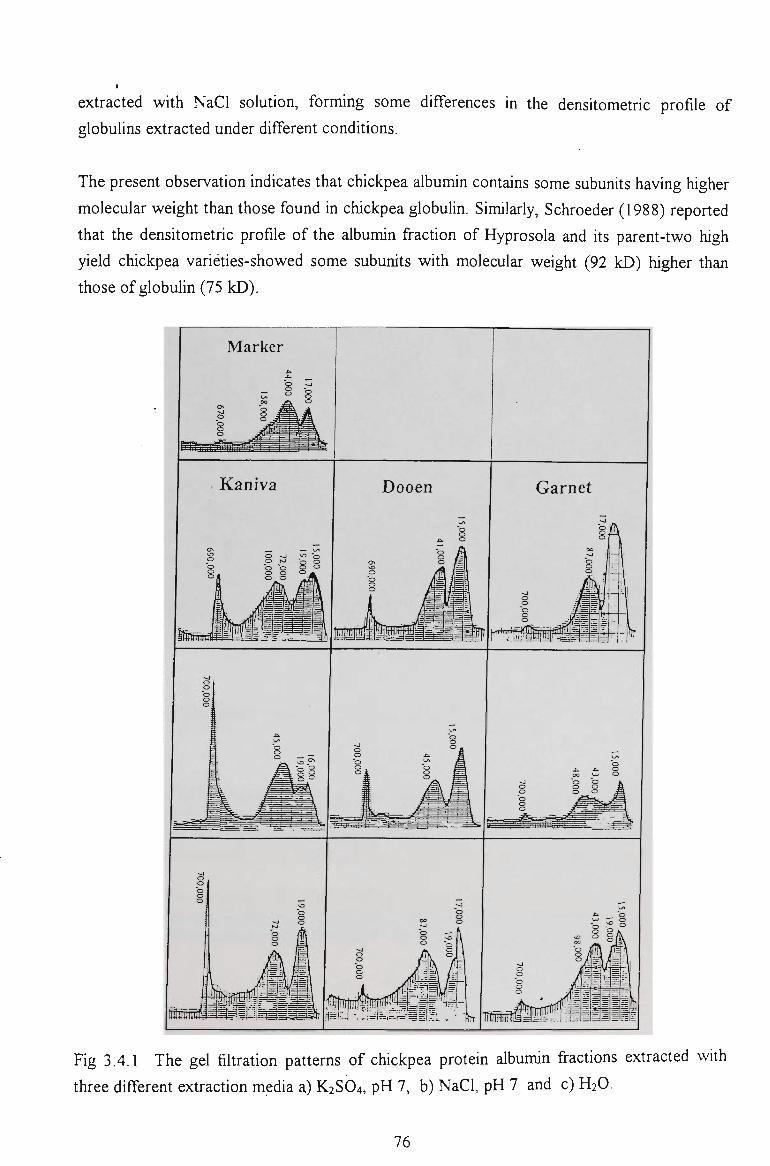
extracted with NaCl solution, forming some differences in the densitometric profile of
globulins extracted under different conditions.
The present observation indicates that chickpea albumin contains some subunUs having higher
molecular weight than those found in chickpea globulin. Similarly, Schroeder (1988) reported
that the densitometric profile of the albumin fraction of Hyprosola and its parent-two high
yield chickpea varieties-showed some subunits with molecular weight (92 kD) higher than
those of globulin (75 kD).
Fig 3.4.1 The gel filtration patterns of chickpea protein albumin fractions extracted with
three different extraction media a) K2SO4, pH 7, b) NaCl, pH 7 and c) H2O.
76
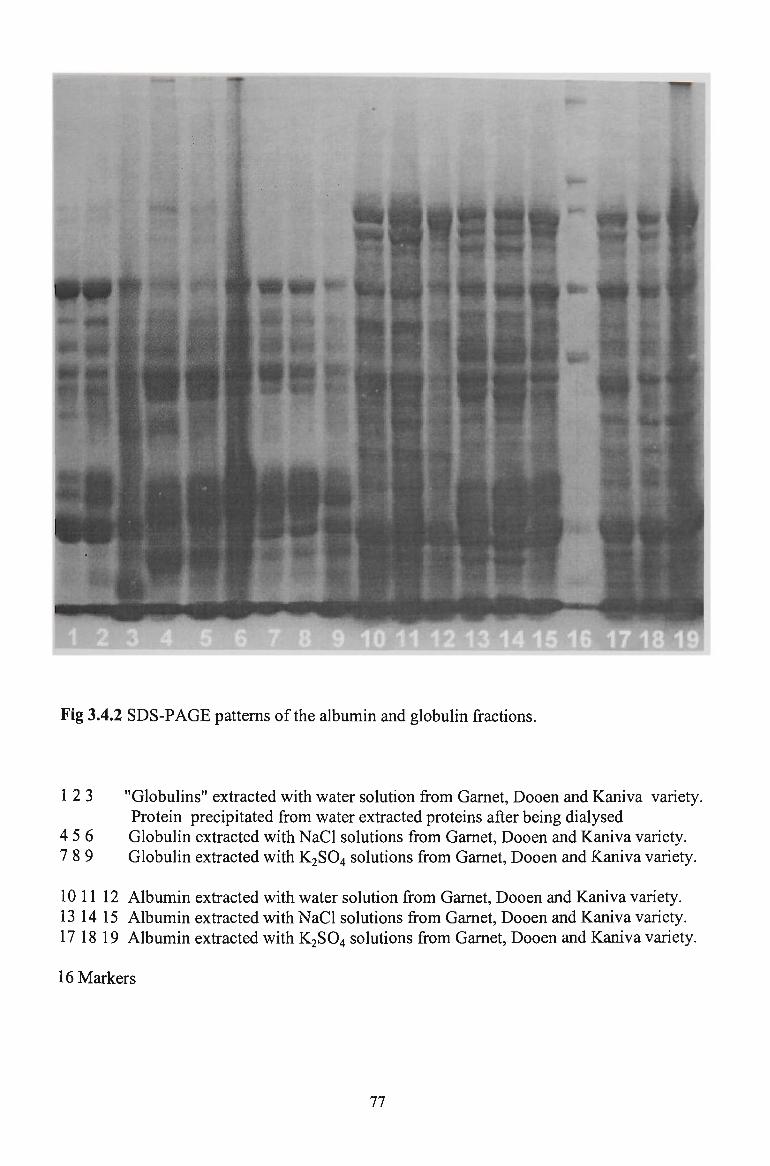
Fig 3.4.2 SDS-PAGE patterns of the albimiin and globulin fractions.
1 2 3 "Globulins" extracted with water solution from Garnet, Dooen and Kaniva variety. Protein precipitated from water extracted proteins after being dialysed
4 5 6 Globulin extracted with NaCl solutions from Garnet, Dooen and Kaniva variety. 7 8 9 Globulin extracted with K2SO4 solutions from Garnet, Dooen and Kaniva variety.
10 11 12 Albimiin extracted with water solution from Garnet, Dooen and Kaniva variety. 13 14 15 Albumin extracted with NaCl solutions from Garnet, Dooen and Kaiuva variety. 17 18 19 Albimiin extracted with K2SO4 solutions from Garnet, Dooen and Kaniva variety.
16 Markers
77
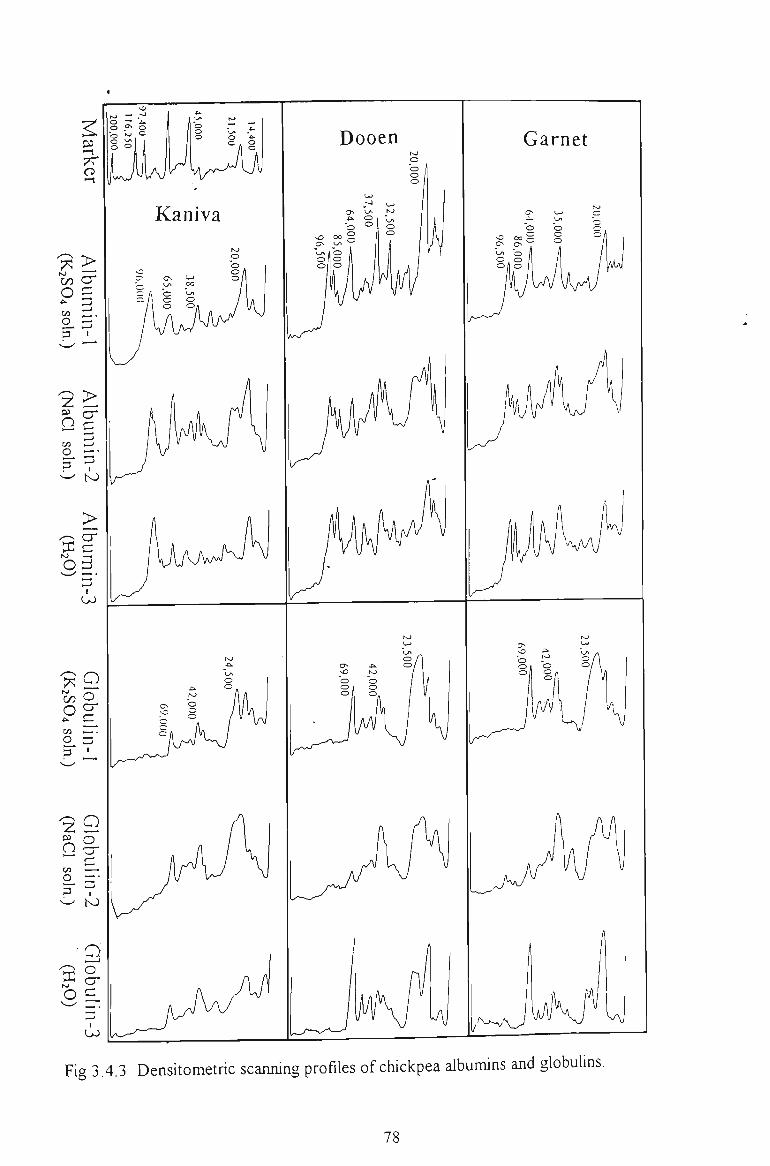
Fie 3.4.3 DensUometric scanning profiles of chickpea albumins and globuhns.
78
3.4.6 IN VITRO DIGESTIBILITY
1. Albumin
The in vitro digestibility of Kaniva albumin by papain, trypsin, pepsin and chymotrypsin over
24 h of digestion is given in Fig 3.4.4 a-d.
The in vitro digestibility of aU three extracted albumins by each of four proteolytic enzymes is
very similar. There were only few minor differences in their digestibility behaviours of these
albumins. Chymotrypsin showed a slightly higher activity towards the albumin than pepsin
and trypsin but there was no sigiUficant difference in the in vitro digestibility of albumin
fractions by pepsin and trypsin. However, the relative activity of papain towards the albumin
was higher than those of the other three enzymes. After 18 hour of digestion, the NaCl
extracted albumin was hydrolysed more than that extracted with either K2SO4 or water. An
increase in relative activity of papain found with this albumin was perhaps due to the
hydrolysis of some globulin which failed to be removed from the albumin fraction.
Regardless of their different extraction conditions, the similarity in the in vitro digestibility of
the three extracted albumins by four enzymes suggests that these albumins all have a similar
structure.
2. Globulin
The in vitro digestibility by four enzymes of chickpea globulins extracted with three
procedures is shown in Fig 3.4.5 a-d.
The common feature of all extracted globulin fractions was that they were more susceptible to
proteolytic enzymes than their corresponding albumin fractions. The protein hydrolysing
capacity of four enzymes on globulin fraction was, in decreasing order, pepsin, papain,
chymotrypsin and trypsin. Pepsin was found to be the most reactive enzyme, its relative
activity increased about 12 fold within 4 h of digestion while the relative activity of trypsin
increased only 4 fold after 24 h of digestion. The different rates and degrees of hydrolysis of
chickpea globulin by pepsin and trypsin reflected the enzyme specificities. Being a non
specific enzyme, pepsin can catalyse the hydrolysis of a wide range of substrates while
trypsin, being more specific, can only hydrolyse lysyl and arginyl residues (Kakade, 1974).
The resuUs indicated that chickpea globuUns were more susceptible to proteolytic hydrolysis
than albumins. Similar observation were obtained with great Northern bean albumins and
globulins hydrolysed by trypsin and chymotrypsin (Sathe et al, 1981; Romero and Ryan,
79
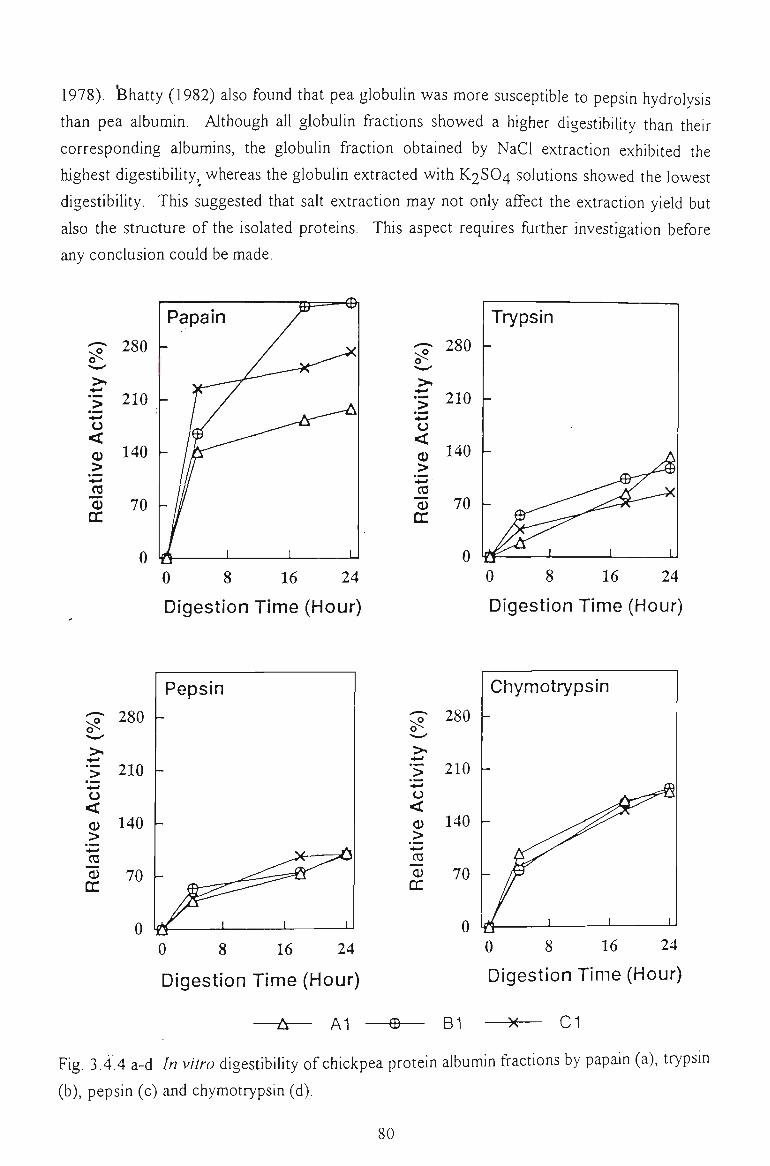
1978). bhatty (1982) also found that pea globuUn was more susceptible to pepsin hydrolysis
than pea albumin. Although all globulin fractions showed a higher digestibility than their
corresponding albumins, the globulin fraction obtained by NaCl extraction exhibited the
highest digestibility, whereas the globulin extracted with K2SO4 solutions showed the lowest
digestibility. This suggested that saU extraction may not only affect the extraction yield but
also the structure of the isolated proteins. This aspect requires fiirther investigation before
any conclusion could be made.
>.
• >
o <
>
cc
280
210
140
70
0
Papain
T /
- /A''^^^
- i
a '
m—— (Di
' '
0 8 16 24
Digestion Time (Hour)
T 280 ^ ^ - i "
>» ••g 210 •*-^ 0 < 0 140 >
^ - j '
CO 0) 70 DC
0
Trypsin
-
A fl^-^
^^.-®y ^ - - ^ ' ^ A ^ ^ x
- . . . / - ' ^ ^ ^ - ^ ^ ^ ^ ^ ^
^ ^ ^ ^ / ^ . . 0 8 16 24
Digestion Time (Hour)
CS- 280 0^
•? 210
0
Q) 140 > ro 0 70
0
Peps in
.^^-^t^ ' ^ ^ ^ ^ \ \ L
0 8 16 24
Digestion Time (Hour)
—i^— Al
{%)
>. +-> >
•tf-l
0 < Q) > *-< ca <D
OC
280
210
140
70
Chymotryps in
J \ \ \
-©- B1
0 8 16 24
Digestion Time (Hour)
— X — 01
Fig. 3.4.4 a-d In vitro digestibility of chickpea protein albumin fractions by papain (a), trypsm
(b), pepsin (c) and chymotrypsin (d).
80
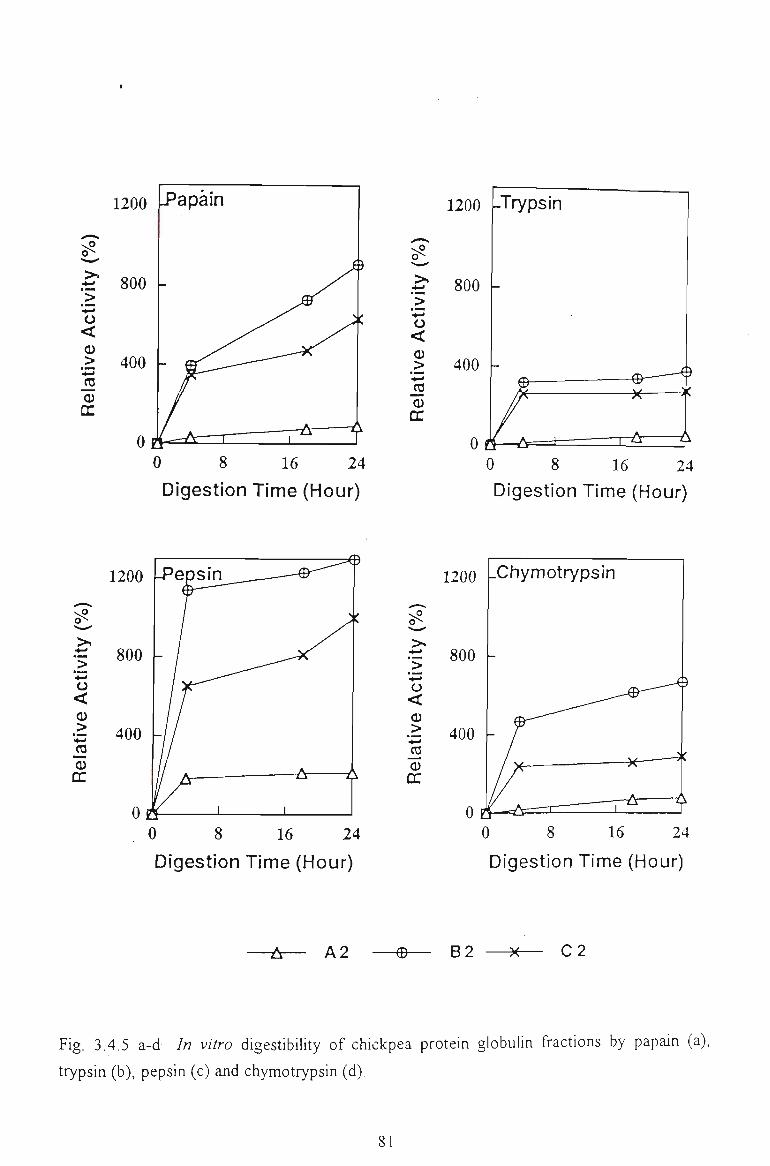
1200
£ 800 -> .
>
<
> > 400 -J5 o
DC
0 8 16 24
Digestion Time (Hour)
o
>
">
<
m 0)
CC
1200 -Trypsin
^ 800
400 -
0 8 16 24
Digestion Time (Hour)
1200
^ 800
o
• >
O <
> •^ 400 i5 o
CC
0
-Pejpsin____
- /
- / /
^ /
[A I 1
7%.
U
(%)
Act
ivit
y (e
lati
ve
LL
0 8 16 24
Digestion Time (Hour)
1200 LChymotrypsin
0 8 16 24
Digestion Time (Hour)
A 2 -©- B2 0 2
Fig. 3.4.5 a-d In vitro digestibility of chickpea protein globulin fractions by papain (a),
trypsin (b), pepsin (c) and chymotrypsin (d).
3.5 ' CONCLUSIONS
The results of the present study suggest that the relative amount of albumin and globuUn in
chickpea depend on extraction conditions. The extractable yields of the two fractions vary
with extraction medium and also wUh different variety. Depending on the procedure
employed, the albumin can be a major protein fraction. This casts doubt on the perception
that the albumin fraction of chickpea only accounts for a minor proportion of the total
proteins. Fractionation with K2SO4 solution produced highly purified albumins.
The structural differences of Kabuli and Desi chickpea albumins and globulins were clearly
identified by their corresponding distinct electrophoretic patterns. The albumins are
comprised of higher molecular weight subunits than those present in the globuUn. The level
of essential amino acids in albumin is higher than that in globulin.
Regardless of the similar structure found among globulins prepared under different
conditions, the effect of processing conditions on some of their fimctionality was detected by
their different in vitro digestibility.
82
CHAPTER 4
THE FUNCTIONAL PROPERTIES OF CHICKPEA PROTEINS
THE FUNCTIONAL PROPERTIES OF CHICKPEA PROTEINS
Grain legumes and oU seeds have been studied as an economically viable source of protems
for human consumption. As presented in previous chapters, chickpea {Cicer arietinum) is
one of the most protein rich crops, ranked as the world's fifth most important grain legume,
in terms of production. In addition, the nutritional quality of chickpea proteins can be
compared favourably with soybean and other grain legumes such as faba bean and mung bean
(Williams and Singh, 1987; Mohamed et al, 1989). However, the effective utiUsation of a
protein, particularly in processed food, depends not only on its nutritional value but also on
its behaviour in complex food systems. The behaviour of a food protein reflects its functional
properties. Unlike soybean proteins, the physicochemical and functional properties of
chickpea proteins have not been extensively investigated. As emphasised by Chavan and
Kadam (1989), more information on the fimctionality of chickpea proteins is required for its
successfiil application in the food industry.
Functional properties of proteins encompass any physicochemical properties which affect
their processing conditions and behaviour in food systems. These include solubUity, water
and fat absorption, emulsifying and foaming properties, whipping and rheological properties
(ICinseUa, 1976; Schchtel, 1981). These in turn are affected by intrinsic and environmental
factors such as protein composition and conformation, or, by the food system in which the
protein is incorporated (Pour El, 1981; Acton and Saffle, 1970). Processing conditions also
influence the fimctionality of proteins (Lopez de Ogara et al, 1992).
Functional properties of major protein rich grain legumes or oil seeds such as soybean, lupin,
rapeseed, sunflower and peanut have been extensively investigated (Ayres and Davenport,
1977; Sosulski et al, 1976; Schwenke and Rauschal, 1983; King et al, 1985; KabiruUah and
WiUs, 1982; Mieth et al, 1983; McWatters and Holmes, 1979). Certain fimctional properties
of chickpea flour have been examined during their incorporation in imitation milk or dried
powder (Bencini, 1986; Abdel-Aal-El et al, 1986; Batistuti et al, 1991). Recently, Paredes
Lopez etal (1991) investigated only some physicochemical and functional properties of the
chickpea proteins isolated by isoelectric precipUation o'r by micelUsation.
The objectives of this chapter are to obtain more extensive information on the fimctional
properties of chickpea proteins and to identify how these properties are influenced by
different extraction conditions. The proteins extracted at pH 2 (CPI-1), pH 7 (CPI-2) and
84
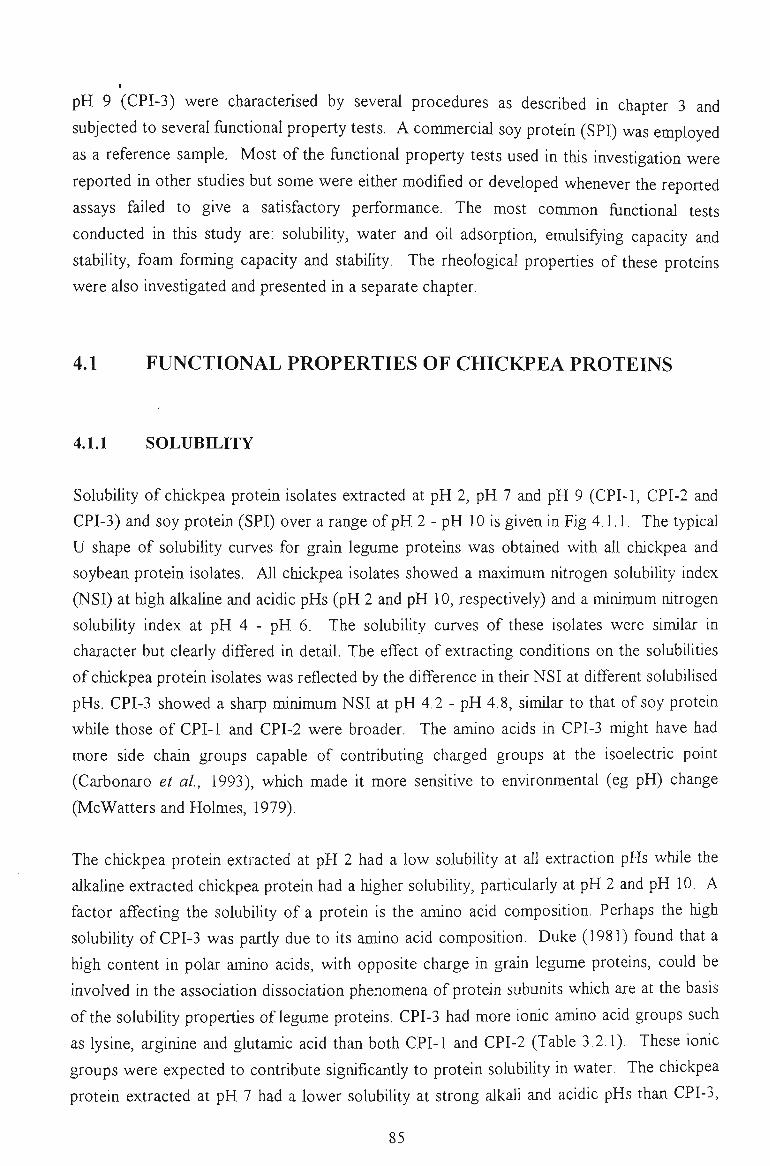
pH 9 (CPI-3) were characterised by several procedures as described m chapter 3 and
subjected to several functional property tests. A commercial soy protein (SPI) was employed
as a reference sample. Most of the functional property tests used in this investigation were
reported in other studies but some were either modified or developed whenever the reported
assays failed to give a satisfactory performance. The most common fianctional tests
conducted in this study are: solubility, water and oil adsorption, emulsifying capacity and
stability, foam forming capacity and stability. The rheological properties of these proteins
were also investigated and presented in a separate chapter.
4.1 FUNCTIONAL PROPERTIES OF CHICKPEA PROTEINS
4.1.1 SOLUBILITY
Solubility of chickpea protein isolates extracted at pH 2, pH 7 and pH 9 (CPI-1, CPI-2 and
CPI-3) and soy protein (SPI) over a range of pH 2 - pH 10 is given in Fig 4.1.1. The typical
U shape of solubility curves for grain legume proteins was obtained with all chickpea and
soybean protein isolates. All chickpea isolates showed a maximum nitrogen solubiUty index
(NSI) at high alkaline and acidic pHs (pH 2 and pH 10, respectively) and a minimum nitrogen
solubility index at pH 4 - pH 6. The solubility curves of these isolates were similar in
character but clearly differed in detail. The effect of extracting conditions on the solubiUties
of chickpea protein isolates was reflected by the difference in their NSI at different solubilised
pHs. CPI-3 showed a sharp minimum NSI at pH 4.2 - pH 4.8, simUar to that of soy protein
while those of CPI-1 and CPI-2 were broader. The amino acids in CPI-3 might have had
more side chain groups capable of contributing charged groups at the isoelectric point
(Carbonaro et al, 1993), which made U more sensitive to environmental (eg pH) change
(McWatters and Holmes, 1979).
The chickpea protein extracted at pH 2 had a low solubUity at aU extraction pHs while the
alkaline extracted chickpea protein had a higher solubility, particularly at pH 2 and pH 10. A
factor affecting the solubility of a protein is the amino acid composition. Perhaps the high
solubility of CPI-3 was partly due to Us amino acid composition. Duke (1981) found that a
high content in polar amino acids, with opposUe charge in grain legume proteins, could be
involved in the association dissociation phenomena of protein subunits which are at the basis
of the solubility properties of legume proteins. CPI-3 had more ionic amino acid groups such
as lysine, arginine and glutamic acid than both CPI-1 and CPI-2 (Table 3.2.1). These ionic
groups were expected to contribute significantly to protein solubility in water. The chickpea
protein extracted at pH 7 had a lower solubility at strong alkali and acidic pHs than CPI-3,
85
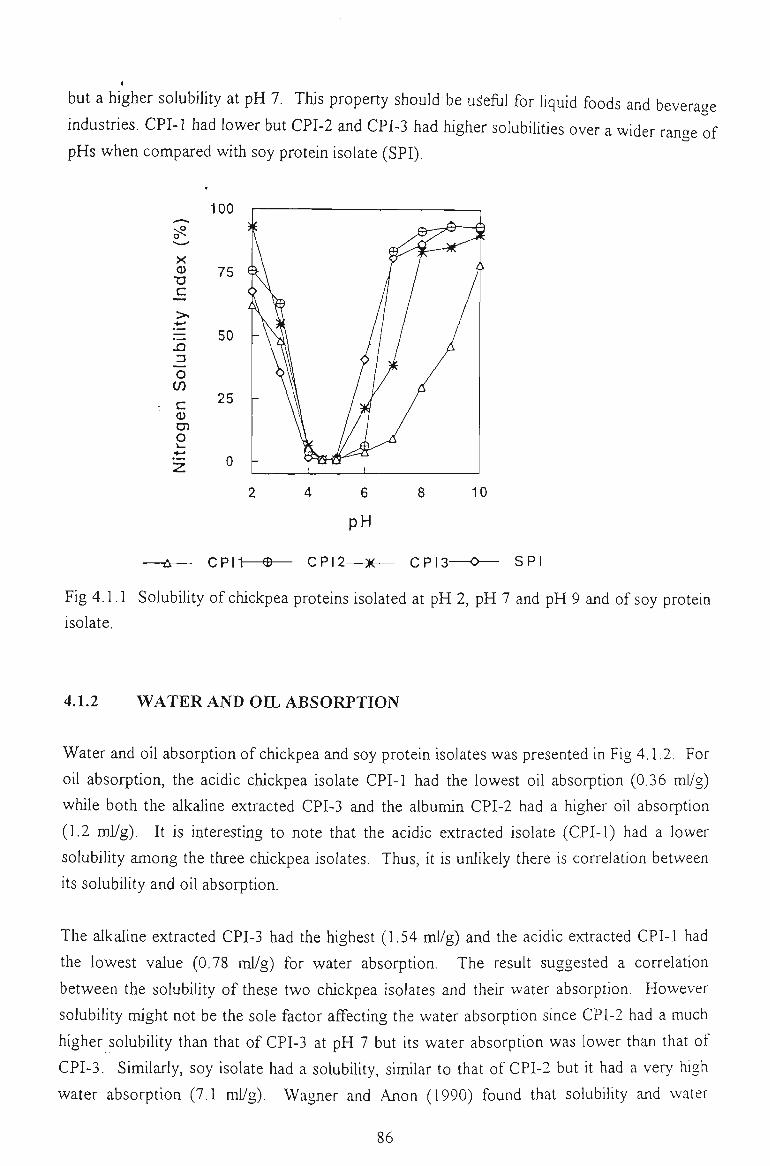
but a higher solubility at pH 7. This property should be u^efiil for Uquid foods and beverage
industries. CPI-1 had lower but CPI-2 and CPI-3 had higher solubilities over a wider range of
pHs when compared with soy protein isolate (SPI).
X 0) u c
100
75
. - 50 -
o
c 0) cn o
25
CPI1—©-
4 6
pH
CPI2—5K-
10
CPI3- SPl
Fig 4.1.1 Solubility of chickpea proteins isolated at pH 2, pH 7 and pH 9 and of soy protein
isolate.
4.1.2 WATER AND OIL ABSORPTION
Water and oU absorption of chickpea and soy protein isolates was presented in Fig 4.1.2. For
oil absorption, the acidic chickpea isolate CPI-1 had the lowest oU absorption (0.36 ml/g)
while both the alkaline extracted CPI-3 and the albumin CPI-2 had a higher oU absorption
(1.2 ml/g). It is interesting to note that the acidic extracted isolate (CPI-1) had a lower
solubility among the three chickpea isolates. Thus, it is unlikely there is correlation between
its solubiUty and oil absorption.
The alkaline extracted CPI-3 had the highest (1.54 ml/g) and the acidic extracted CPI-1 had
the lowest value (0.78 ml/g) for water absorption. The resuU suggested a correlation
between the solubility of these two chickpea isolates and their water absorption. However
solubility might not be the sole factor affecting the water absorption since CPI-2 had a much
higher solubility than that of CPI-3 at pH 7 but its water absorption was lower than that of
CPI-3. SimUarly, soy isolate had a solubility, similar to that of CPI-2 but U had a very high
water absorption (7.1 mVg). Wagner and Anon (1990) found that solubility and water
86
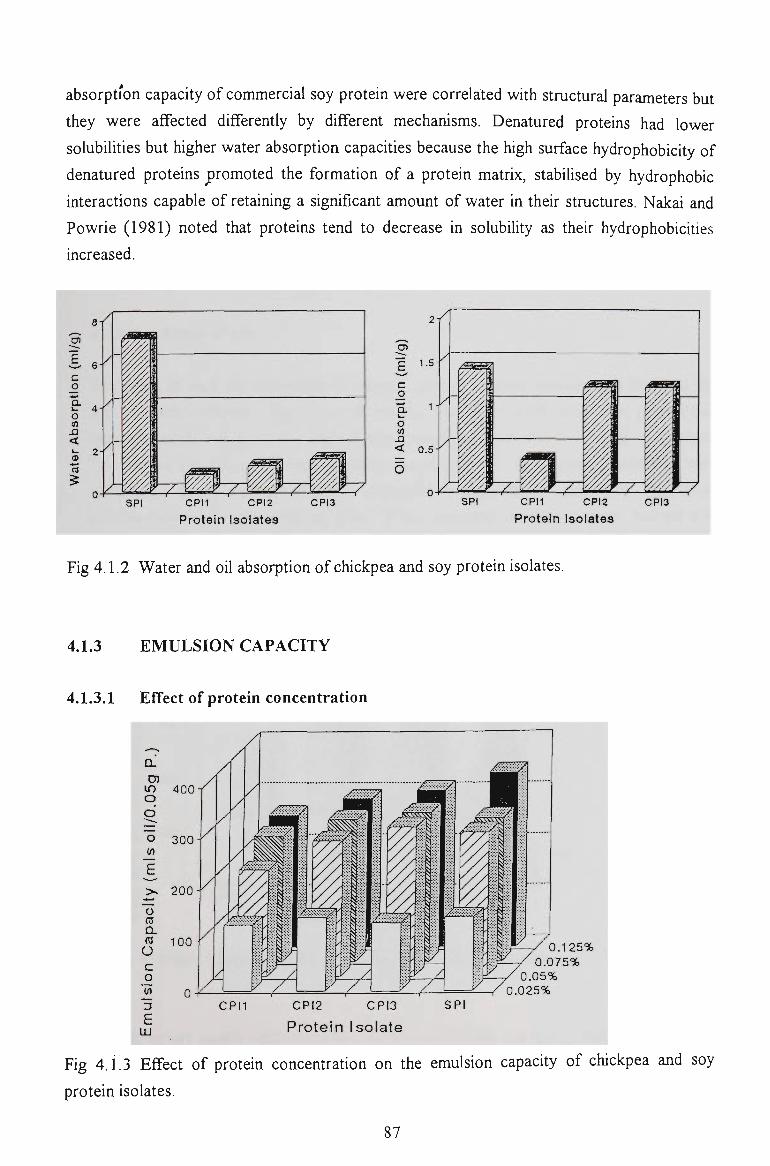
absorption capacity of commercial soy protein were correlated with structural parameters but
they were affected differently by different mechanisms. Denatured proteins had lower
solubilities but higher water absorption capacities because the high surface hydrophobicity of
denatured proteins promoted the formation of a protein matrix, stabilised by hydrophobic
interactions capable of retaining a significant amount of water in their structures. Nakai and
Powrie (1981) noted that proteins tend to decrease in solubility as their hydrophobicities
increased.
O)
c o
o
< 0)
5 ^H^
CPU CPI2 CPI3
cn
c o
o n <
O
SPI
Protein Isolates
CPU CPI2
Protein Isolates CPI3
Fig 4.1.2 Water and oA absorption of chickpea and soy protein isolates.
4.1.3 E M U L S I O N CAPACITY
4.1.3.1 Effect of protein concentration
cn in o o
"o
"o <s a
O c o
'to
E UJ
400
300
200
1 0 0 - 0 .125% 0 .075%
•:^ -y 0 .05% ^ i-- /0.025%
CPU CPI2 CPI3 SPI
P r o t e i n I s o l a t e
Fig 4.1.3 Effect of protein concentration on
protein isolates.
the emulsion capacity of chickpea and soy
87
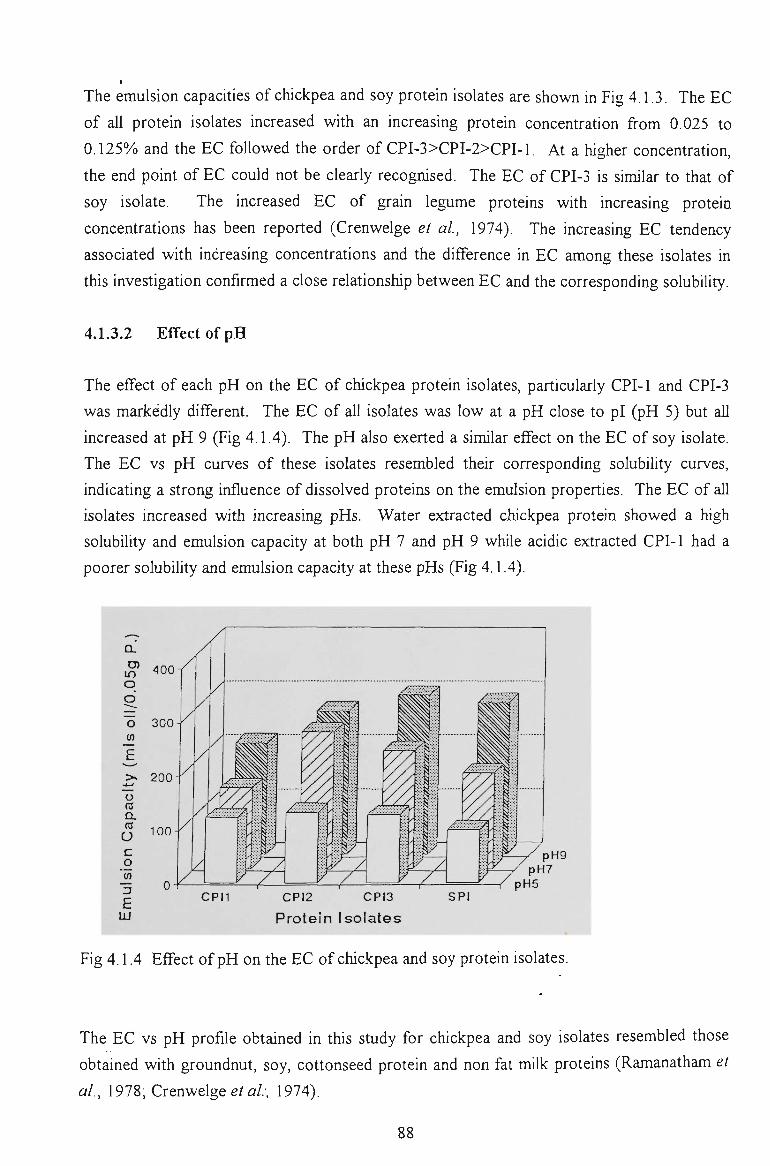
The emulsion capacities of chickpea and soy protein isolates are shown in Fig 4.1.3. The EC
of aU protein isolates increased with an increasing protein concentration from 0.025 to
0.125% and the EC followed the order of CPI-3>CPI-2>CPI-1, At a higher concentration,
the end point of EC could not be clearly recognised. The EC of CPI-3 is similar to that of
soy isolate. The increased EC of grain legume proteins wUh increasing protein
concentrations has been reported (Crenwelge et al, 1974). The increasing EC tendency
associated with increasing concentrations and the difference in EC among these isolates in
this investigation confirmed a close relationship between EC and the corresponding solubility.
4.1.3.2 Effect of pH
The effect of each pH on the EC of chickpea protein isolates, particularly CPI-1 and CPI-3
was markedly different. The EC of all isolates was low at a pH close to pi (pH 5) but aU
increased at pH 9 (Fig 4.1.4). The pH also exerted a similar effect on the EC of soy isolate.
The EC vs pH curves of these isolates resembled their corresponding solubility curves,
indicating a strong influence of dissolved proteins on the emulsion properties. The EC of all
isolates increased with increasing pHs. Water extracted chickpea protein showed a high
solubUity and emulsion capacity at both pH 7 and pH 9 while acidic extracted CPI-1 had a
poorer solubility and emulsion capacity at these pHs (Fig 4.1.4).
cn in o
o (0
400
300
>> 200
o m a a
O c o
"(0 "5 E
LU
100--
C P U CPI2 CPI3 SPI pH5
Protein Isolates
Fig 4.1.4 Effect of pH on the EC of chickpea and soy protein isolates.
The EC vs pH profile obtained in this study for chickpea and soy isolates resembled those
obtained with groundnut, soy, cottonseed protein and non fat milk proteins (Ramanatham et
al, 1978, Crenwelge e/a/.; 1974).
88
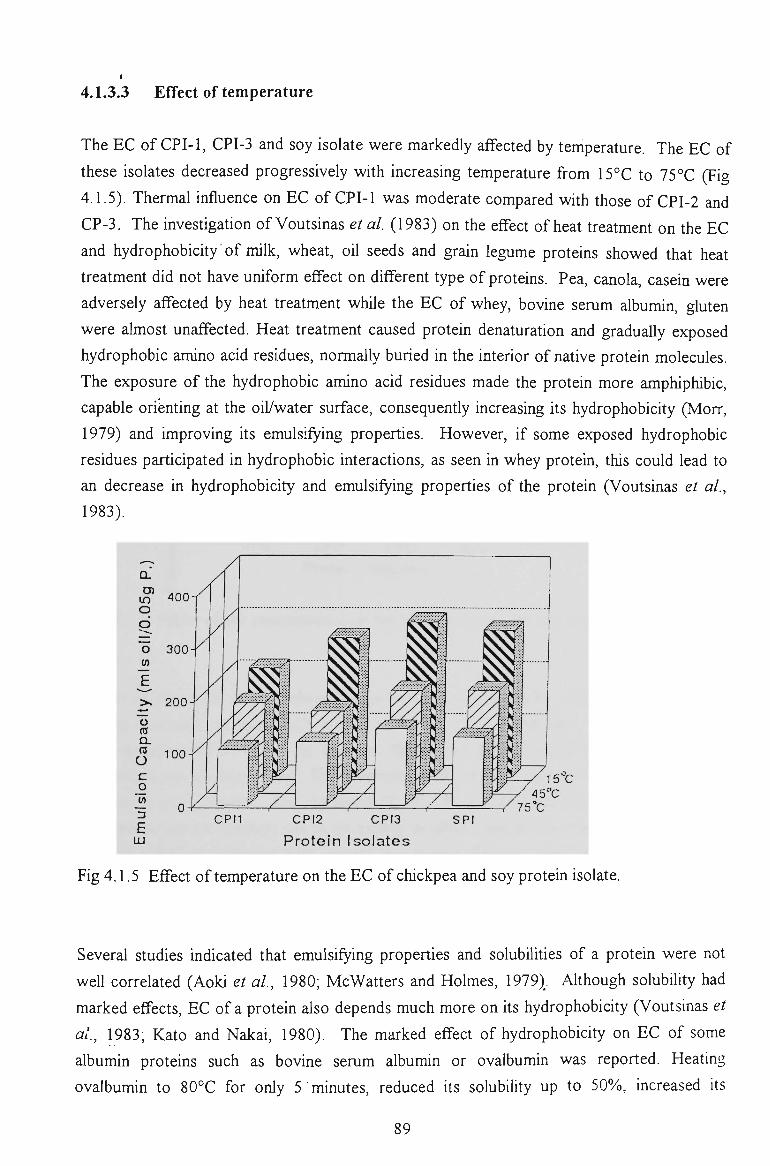
4.1.3.3 Effect of temperature
The EC of CPI-1, CPI-3 and soy isolate were markedly affected by temperature. The EC of
these isolates decreased progressively with increasing temperature from 15°C to 75°C (Fi«
4.1.5). Thermal influence on EC of CPI-1 was moderate compared with those of CPI-2 and
CP-3. The investigation of Voutsinas et al. (1983) on the effect of heat treatment on the EC
and hydrophobicity of milk, wheat, oil seeds and grain legume proteins showed that heat
treatment did not have uniform effect on different type of proteins. Pea, canola, casein were
adversely affected by heat treatment whUe the EC of whey, bovine serum alburrun, gluten
were almost unaffected. Heat treatment caused protein denaturation and gradually exposed
hydrophobic amino acid residues, normally buried in the interior of native protein molecules.
The exposure of the hydrophobic amino acid residues made the protein more amphiphibic,
capable orienting at the oil/water surface, consequently increasing Us hydrophobicity (Morr,
1979) and improving its emulsifying properties. However, if some exposed hydrophobic
residues participated in hydrophobic interactions, as seen in whey protein, this could lead to
an decrease in hydrophobicity and emulsifying properties of the protein (Voutsinas et al,
1983).
^ 400 o
£ UJ
CPU CPI2 CPI3
Protein Isolates SPI
Fig 4.1.5 Effect of temperature on the EC of chickpea and soy protein isolate.
Several studies indicated that emulsifying properties and solubUities of a protein were not
well correlated (Aoki et al, 1980; McWatters and Holmes, 1979) . Although solubiUty had
marked effects, EC of a protein also depends much more on Us hydrophobicity (Voutsinas et
al, 1983; Kato and Nakai, 1980). The marked effect of hydrophobicity on EC of some
albumin proteins such as bovine serum albumin or ovalbumin was reported. Heating
ovalbumin to 80°C for only 5 minutes, reduced its solubUity up to 50%, increased its
89
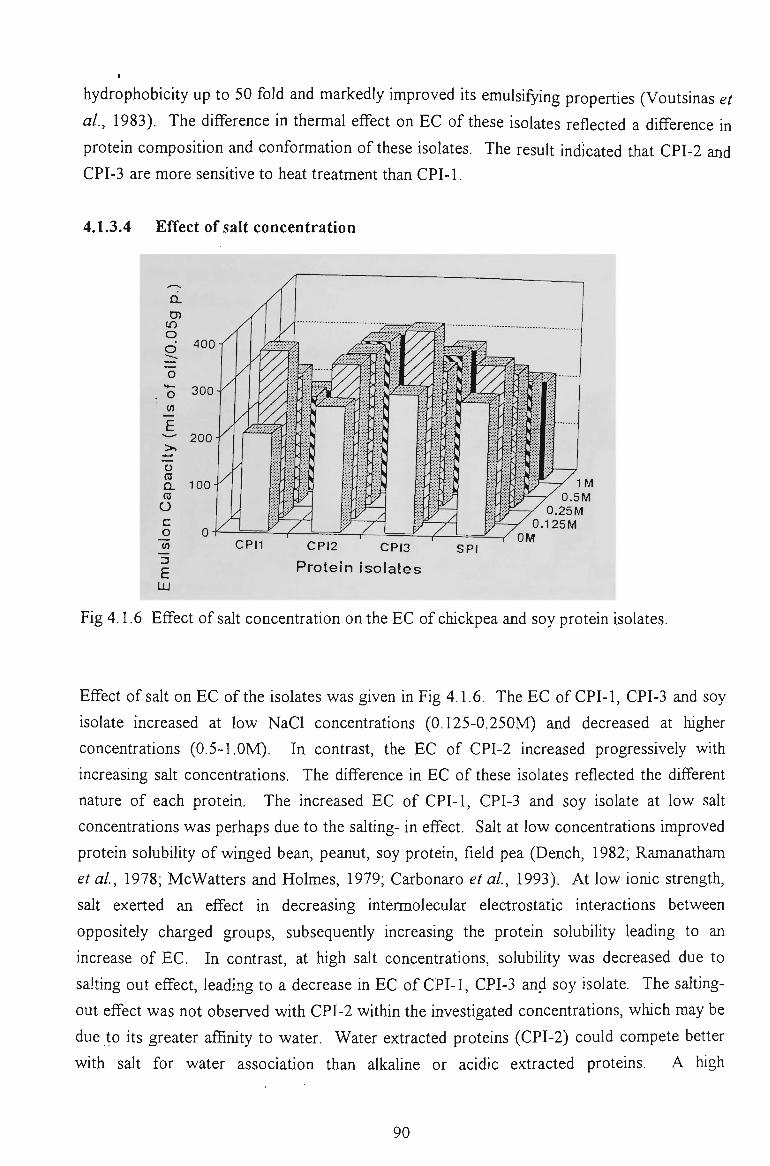
hydrophobicity up to 50 fold and markedly improved its emulsifying properties (Voutsinas et
al, 1983). The difference in thermal effect on EC of these isolates reflected a difference in
protein composition and conformation of these isolates. The result indicated that CPI-2 and
CPI-3 are more sensitive to heat treatment than CPI-1.
4.1.3.4 Effect of salt concentration
o
o J2 E
400
300
o Q. ro
O c
E UJ
200--
100 I M 0.5M
0.25M 0.125M
CPU CPI2 CPI3
Protein isolates SPI
Fig 4.1.6 Effect of salt concentration on the EC of chickpea and soy protein isolates.
Effect of salt on EC of the isolates was given in Fig 4.1.6. The EC of CPI-1, CPI-3 and soy
isolate increased at low NaCl concentrations (0.125-0.250M) and decreased at higher
concentrations (0.5-l.OM). In contrast, the EC of CPI-2 increased progressively with
increasing salt concentrations. The difference in EC of these isolates reflected the different
nature of each protein. The increased EC of CPI-1, CPI-3 and soy isolate at low salt
concentrations was perhaps due to the salting- in effect. Salt at low concentrations improved
protein solubility of winged bean, peanut, soy protein, field pea (Dench, 1982; Ramanatham
et al, 1978; McWatters and Holmes, 1979; Carbonaro et al, 1993). At low ionic strength,
salt exerted an effect in decreasing intermolecular electrostatic interactions between
oppositely charged groups, subsequently increasing the protein solubility leading to an
increase of EC. In contrast, at high salt concentrations, solubUity was decreased due to
salting out effect, leading to a decrease in EC of CPI-1, CPI-3 and soy isolate. The salting-
out effect was not observed with CPl-2 within the investigated concentrations, which may be
due to its greater affinity to water. Water extracted proteins (CPI-2) could compete better
with salt for water association than alkaline or acidic extracted proteins. A high
90
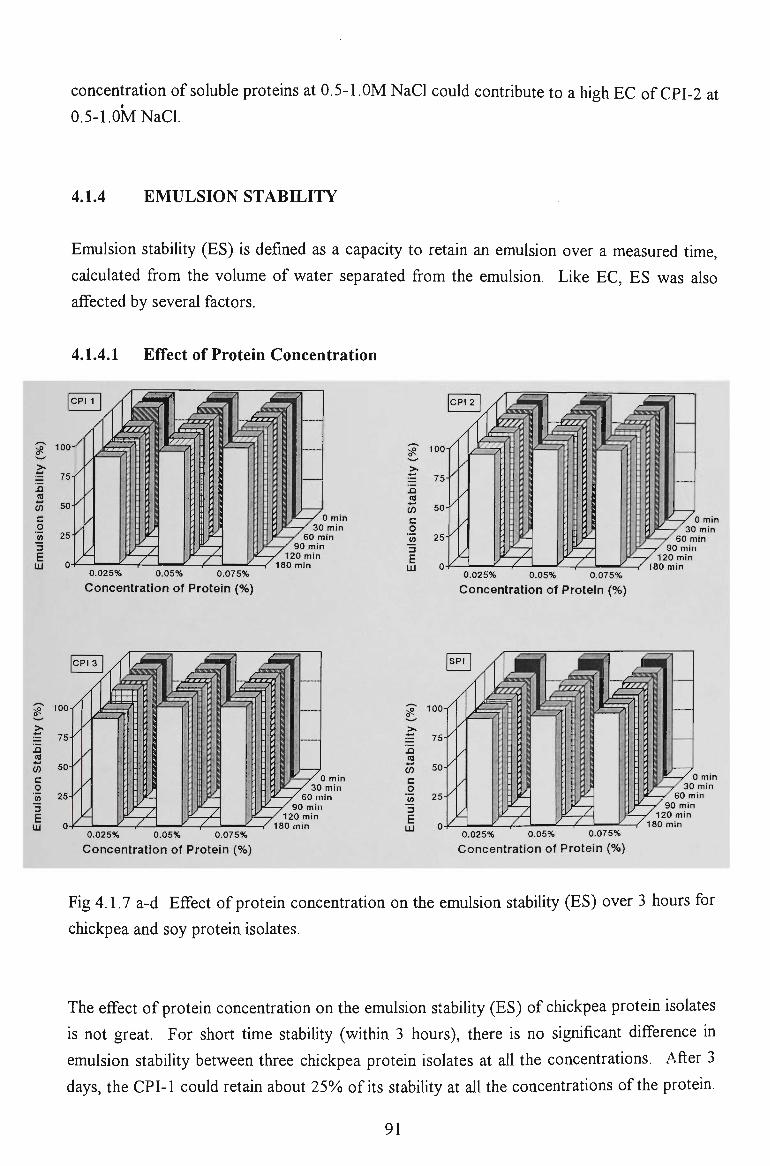
concentration of soluble proteins at 0.5-l.OM NaCl could contribute to a high EC of CPI-2 at
0.5-l.OM NaCl.
4.1.4 EMULSION STABILITY
>.
ra (/) c o
3 E Ui
Emulsion stability (ES) is defined as a capacity to retain an emulsion over a measured time,
calculated from the volume of water separated from the emulsion. Like EC, ES was also
affected by several factors.
4.1.4.1 Effect of Protein Concentration
100
0.025% 0.05% 0.075%
Concentration of Protein {%)
0 min 30 min
60 min 90 min
120 min 180 min
£. >.
!5
w c o j2 3 E LU
100
0.025% 0.05% 0.075%
Concentration of Protein (%)
0 min 30 min
60 min 90 min
120 min 180 min
>.
B n +.•
(f) c o
E UJ
100
0 min 30 min
60 min 90 min
120 min 180 min
0.025% 0.05% 0.075%
Concentration of Protein (%)
.Q (0
CO
c o jo 3
0 min 30 min
60 min 90 min
20 min 180 min
0,025% 0,05% 0,075%
Concentration of Protem (%)
Fig 4.1.7 a-d Effect of protein concentration on the emulsion stability (ES) over 3 hours for
chickpea and soy protein isolates.
The effect of protein concentration on the emulsion stabUity (ES) of chickpea protein isolates
is not great. For short time stability (wUhin 3 hours), there is no significant difference in
emulsion stabUity between three chickpea protein isolates at all the concentrations. After 3
days, the CPI-1 could retain about 25% of Us stability at all the concentrations of the protein.
91
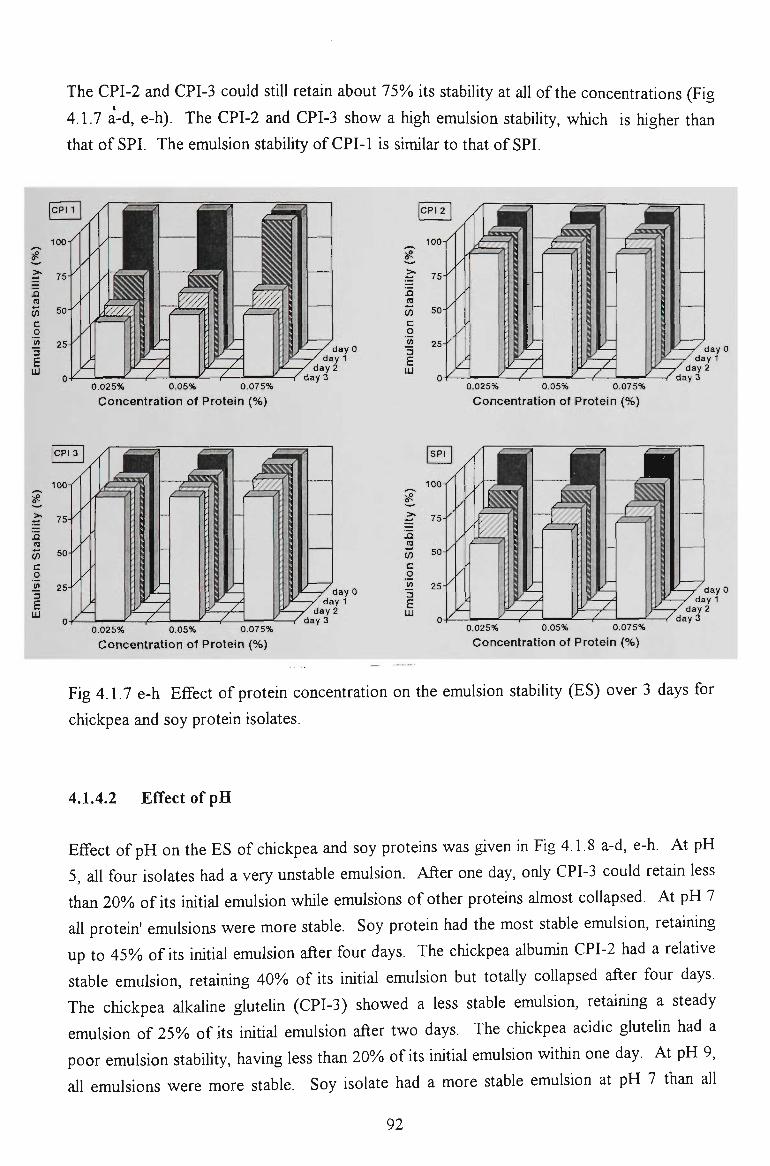
The CPI-2 and CPI-3 could stiU retain about 75% Us stability at all of the concentrations (Fig
4.1.7 a-d, e-h). The CPI-2 and CPI-3 show a high emulsion stability, which is higher than
that of SPI. The emulsion stability of CPI-1 is similar to that of SPI.
day 0 day 1
0.025% 0.05% 0,075%
Concentration of Protein (%)
CPI 2
J3
W c o
/ 100
. /
50
25 - /
/
/
?s - / ^ ^
^
day 0
0.025% 0,05% 0,075%
-—/ day 1 T ^ d a y 2
day 3
Concentration of Protein (%)
a n V) c o
3 day 0
0.025% 0.05% 0.075%
—r day 1 / d a y 2 day 3
Concentration of Protein (%)
(0
c o J2 25
100-
S 75 . /
50
/ /
. /
/
/
,5
0.025% 0.05% 0.075%
Concentration of Protein (%)
day
/ d a y 0 day 1 i y 2 3
Fig 4.1.7 e-h Effect of protein concentration on the emulsion stability (ES) over 3 days for
chickpea and soy protein isolates.
4.1.4.2 Effect of pH
Effect of pH on the ES of chickpea and soy proteins was given in Fig 4.1.8 a-d, e-h. At pH
5, all four isolates had a very unstable emulsion. After one day, only CPI-3 could retain less
than 20% of its initial emulsion while emulsions of other proteins almost coUapsed. At pH 7
all protein' emulsions were more stable. Soy protein had the most stable emulsion, retaining
up to 45% of Us initial emulsion after four days. The chickpea albumin CPI-2 had a relative
stable emulsion, retaining 40% of Us initial emulsion but totally collapsed after four days.
The chickpea alkaline glutelin (CPI-3) showed a less stable emulsion, retaining a steady
emulsion of 25% of its initial emulsion after two days. The chickpea acidic glutelin had a
poor emulsion stability, having less than 20% of Us initial emulsion within one day. At pH 9,
all emulsions were more stable. Soy isolate had a more stable emulsion at pH 7 than all
92
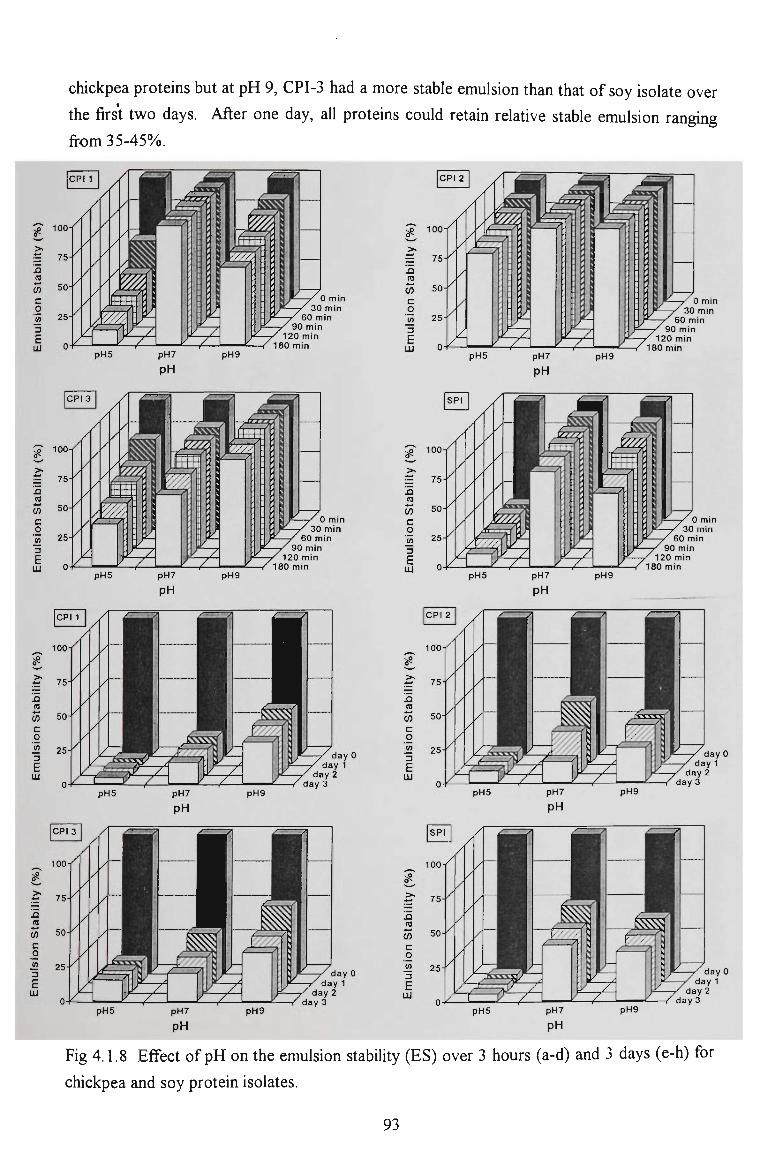
chickpea proteins but at pH 9, CPI-3 had a more stable emulsion than that of soy isolate over
the first two days. After one day, all proteins could retain relative stable emulsion rangmg
from 35-45%.
0 min 30 min
60 min 90 min
20 min 180 min
0 min 30 min
60 min 90 min
120 min 180 min
pH5 pH7
pH pH9
day 0
day 0
day 3
n ra
c o
3 E LU
ra in c o
3 E
LU
100
0 min 30 min
60 min 90 min
120 min 180 min
100
0 min 30 min
60 min 90 min
120 min 180 min
p H 5 pH7
pH p H 9
Fig 4.1.8 Effect of pH on the emulsion stabUity (ES) over 3 hours (a-d) and 3 days (e-h) for
chickpea and soy protein isolates.
93
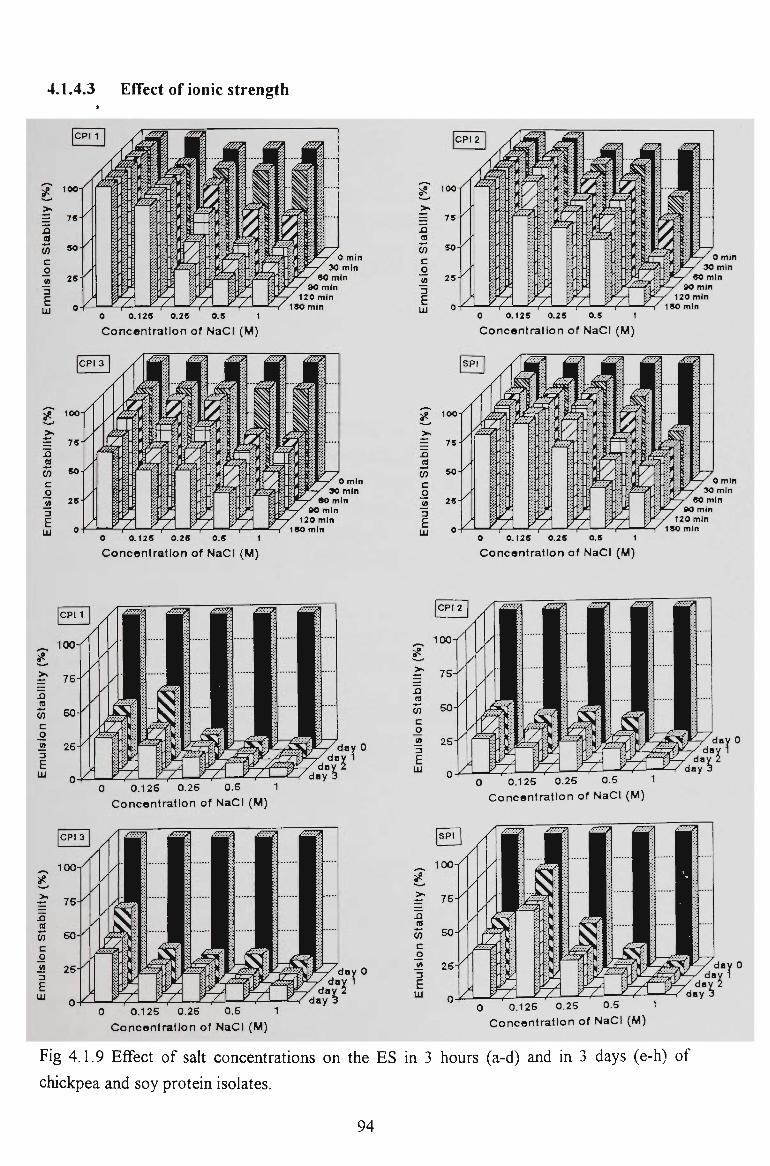
4.1.4.3 Effect of ionic strength
100
n a 35 c o 3 E
LU
0 min 30 min
SO min 90 min
120 min ISO min
0 0.12S 0.2S O.S 1
Concentration of NaCI (M)
•—'
Si 55 c £ VI
3
E LU
NP 100
n a w c £ 3 E
LU 0 0.125 0.25 0.5 1
Concentration of NaCI (M)
>>
55 c 2, 3 E
100
0 min 30 min
SO min 00 min
120 min 180 min
0 0.12S 0.2S O.S 1
Concentration of NaCI (M)
0 0.125 0.25 O.S 1
Concentration of NaCI (M)
0 0.126 0.25 O.S 1 Concen t ra t i on of NaCI (M)
0 0.126 0.25 0.5 1 Concentration of NaCI (M)
0 0.125 0.25 0,5 1 Concentration of NaCI (M)
day 0 day 1
day 0
0 0.126 0.25 0.5 1
Concen t ra t i on of NaCl (M)
Fig 4.1.9 Effect of salt concentrations on the ES in 3 hours (a-d) and in 3 days (e-h) of
chickpea and soy protein isolates.
94
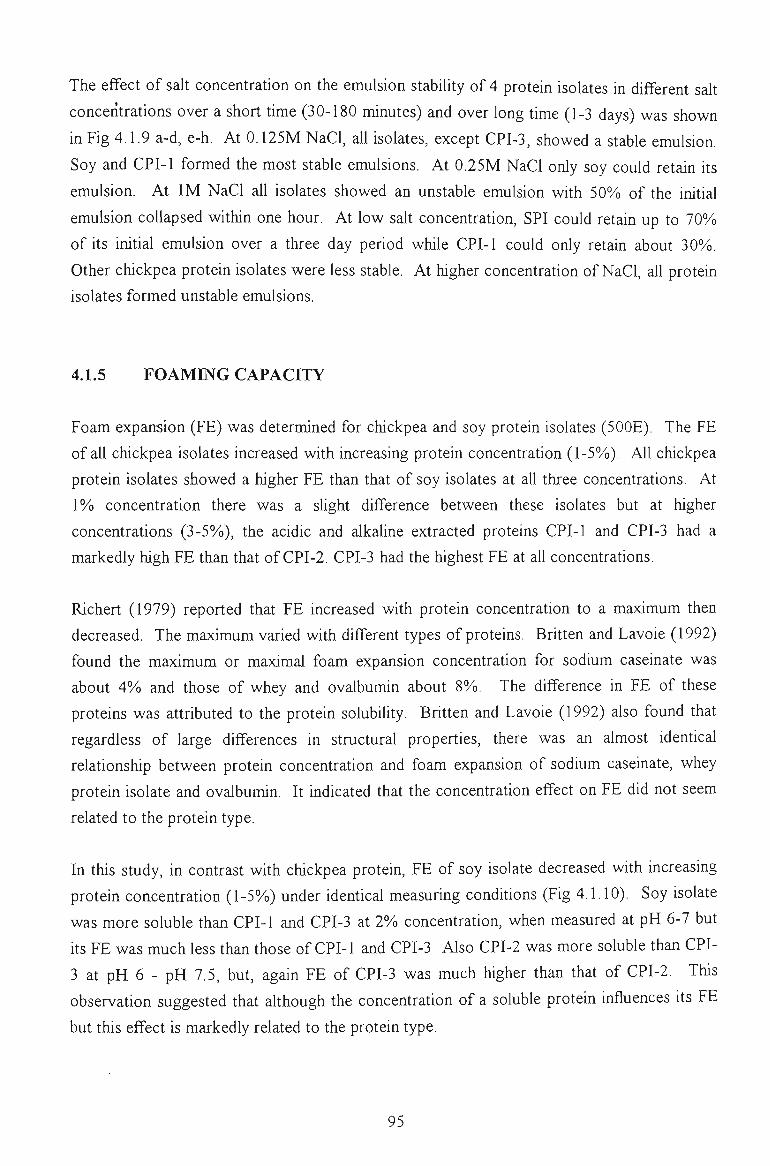
The effect of salt concentration on the emulsion stability of 4 protein isolates in different salt
conceiitrations over a short time (30-180 minutes) and over long time (1-3 days) was shown
in Fig 4.1.9 a-d, e-h. At 0.125M NaCl, aU isolates, except CPI-3, showed a stable emulsion.
Soy and CPI-1 formed the most stable emulsions. At 0.25M NaCl only soy could retain Us
emulsion. At IM NaCl aU isolates showed an unstable emulsion with 50% of the initial
emulsion collapsed within one hour. At low salt concentration, SPI could retain up to 70%
of Us iiUtial emulsion over a three day period while CPI-1 could only retain about 30%.
Other chickpea protein isolates were less stable. At higher concentration of NaCl, all protem
isolates formed unstable emulsions.
4.1.5 FOAMING CAPACITY
Foam expansion (FE) was determined for chickpea and soy protein isolates (500E). The FE
of aU chickpea isolates increased with increasing protein concentration (1-5%). All chickpea
protein isolates showed a higher FE than that of soy isolates at all three concentrations. At
1% concentration there was a slight difference between these isolates but at higher
concentrations (3-5%o), the acidic and alkaUne extracted proteins CPI-1 and CPI-3 had a
markedly high FE than that of CPI-2. CPI-3 had the highest FE at all concentrations.
Richert (1979) reported that FE increased with protein concentration to a maximum then
decreased. The maximum varied with different types of proteins. Britten and Lavoie (1992)
found the maximum or maximal foam expansion concentration for sodium caseinate was
about 4% and those of whey and ovalbumin about 8%. The difference in FE of these
proteins was attributed to the protein solubility. Britten and Lavoie (1992) also found that
regardless of large differences in structural properties, there was an almost identical
relationship between protein concentration and foam expansion of sodium caseinate, whey
protein isolate and ovalbumin. It indicated that the concentration effect on FE did not seem
related to the protein type.
In this study, in contrast with chickpea protein, FE of soy isolate decreased with increasing
protein concentration (1-5%) under identical measuring conditions (Fig 4.1.10). Soy isolate
was more soluble than CPI-1 and CPI-3 at 2% concentration, when measured at pH 6-7 but
its FE was much less than those of CPI-1 and CPI-3 Also CPI-2 was more soluble than CPI-
3 at pH 6 - pH 7.5, but, again FE of CPI-3 was much higher than that of CPI-2. This
observation suggested that although the concentration of a soluble protein influences Us FE
but this effect is markedly related to the protein type.
95
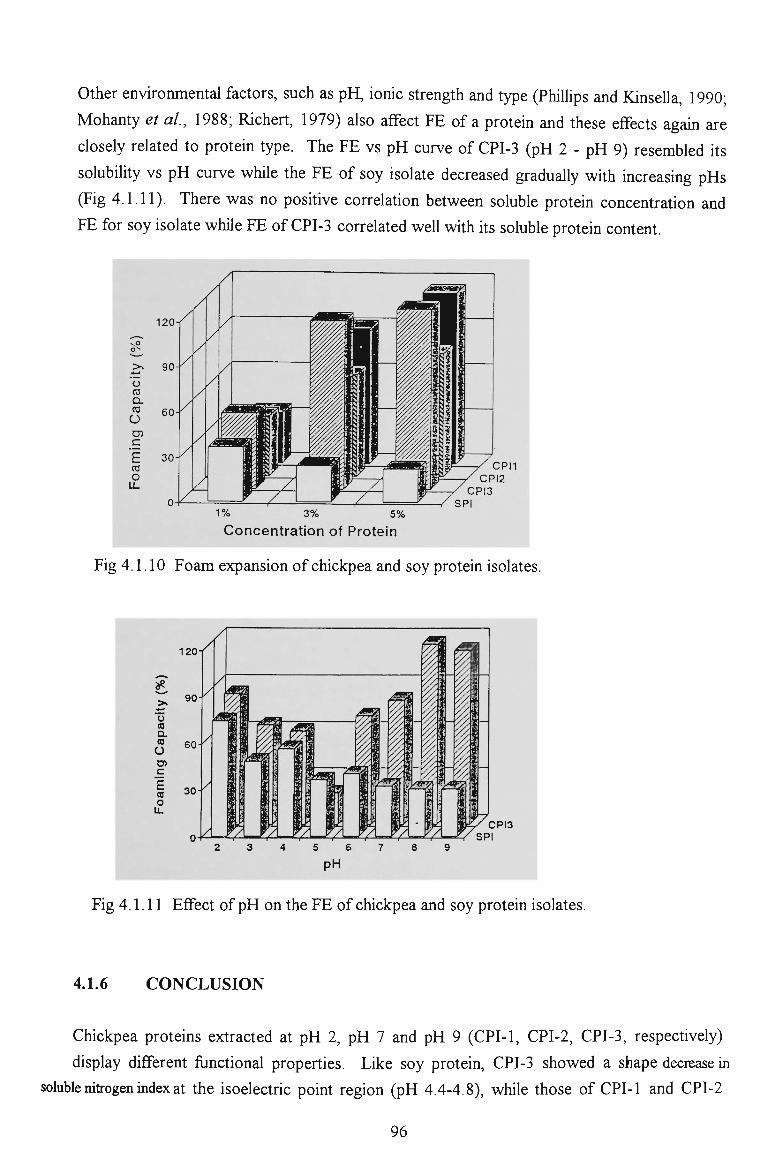
Other environmental factors, such as pH, ionic strength and type (Phillips and KinseUa, 1990;
Mohanty et al, 1988; Richert, 1979) also affect FE of a protein and these effects agam are
closely related to protein type. The FE vs pH curve of CPI-3 (pH 2 - pH 9) resembled Us
solubility vs pH curve while the FE of soy isolate decreased gradually with increasing pHs
(Fig 4.1.11). There was no positive correlation between soluble protein concentration and
FE for soy isolate while FE of CPI-3 correlated well with Us soluble protein content.
Fig 4.1.10 Foam expansion of chickpea and soy protein isolates.
Fig 4.1.11 Effect of pH on the FE of chickpea and soy protein isolates.
4.1.6 CONCLUSION
Chickpea proteins extracted at pH 2, pH 7 and pH 9 (CPI-1, CPI-2, CPI-3, respectively)
display different fimctional properties. Like soy protein, CPI-3 showed a shape decrease in
soluble mtrogen index at the isoelectric point region (pH 4.4-4.8), while those of CPI-1 and CPI-2
96
were broader. CPI-3, CPI-2 were more soluble than CPI-1, over a range of pH 2-10. At
certain'pHs they were more soluble than soy protein isolate (SPI). CPI-3 and CPI-2 also
absorbed more oil and water than CPI-1.
Emulsion capacity (EC) of three chickpea protein isolates increased wUh increasing protein
concentration and showed a good relationship between their solubUity and EC. Their pH/EC
curves resembled those of their pH/solubility. Thermal effect on EC of CPI-3 and CPI-2 was
greater than that of CPI-1 which indicates that CPI-3 and CPI-2 were more sensUive to heat
treatment than CPI-1. Depending on the concentration, salt could decrease or increase the
EC of CPI-1, CPI-3 and SPI. The saU effect was less with ES of CPI-2. All emulsions were
stable at pH 9 and EC of CPI-3 was more stable than that of SPI at pH 9. WUh saU addUion,
aU chickpea protein isolates were less stable than soy protein isolates. Foaming capacity (FC)
of all chickpea protein isolates, particularly CPI-3, was higher than that of soy protein isolate.
The difference in these functional properties reflected the difference in their composition and
structures due to different processing conditions.
4.2 SOLUBILITY OF CHICKPEA PROTEINS MEASURED BY INFRARED SPECTROSCOPY
As indicated in the previous section (4.1), functional properties of chickpea proteins were
affected by processing conditions. These properties, in turn, affected the potential
appUcation of these proteins in the food industry. Solubility is considered as the most
important fimctional property of a protein eUher for practical application or for research
interests. Most food applications are presented in aqueous or semi aqueous forms. On the
other hand, solubility shows a closer link with other functional properties of a protein such as
water absorption, hydration capacity and emulsifying capacity.
To examine the protein solubUity, the Kjeldahl procedure is widely used to determine the
nitrogen in extracts of the protein over a range of pH levels (Bradstreet, 1965). Regardless
of several modifications including semi- automation, the Kjeldahl procedure is stiU a time
consuming and rather laborious assay (Pearson and Pertz, 1976; Fosdick er a/., 1982; Hach
etal, 1987;Devanie/fl/., 1989; Barbano e^a/., 1990).
WUh increasing interest in food applications of vegetable proteins, there is a need for an
accurate, rapid and less laborious method to examine their solubility. Infrared spectroscopy
may provide a quick, non-destructive and easy to perform alternative procedure. Goulden
(1964) and other investigators (Biggs, 1979; Sjaunta and Schaar, 1984) have successfiilly
97
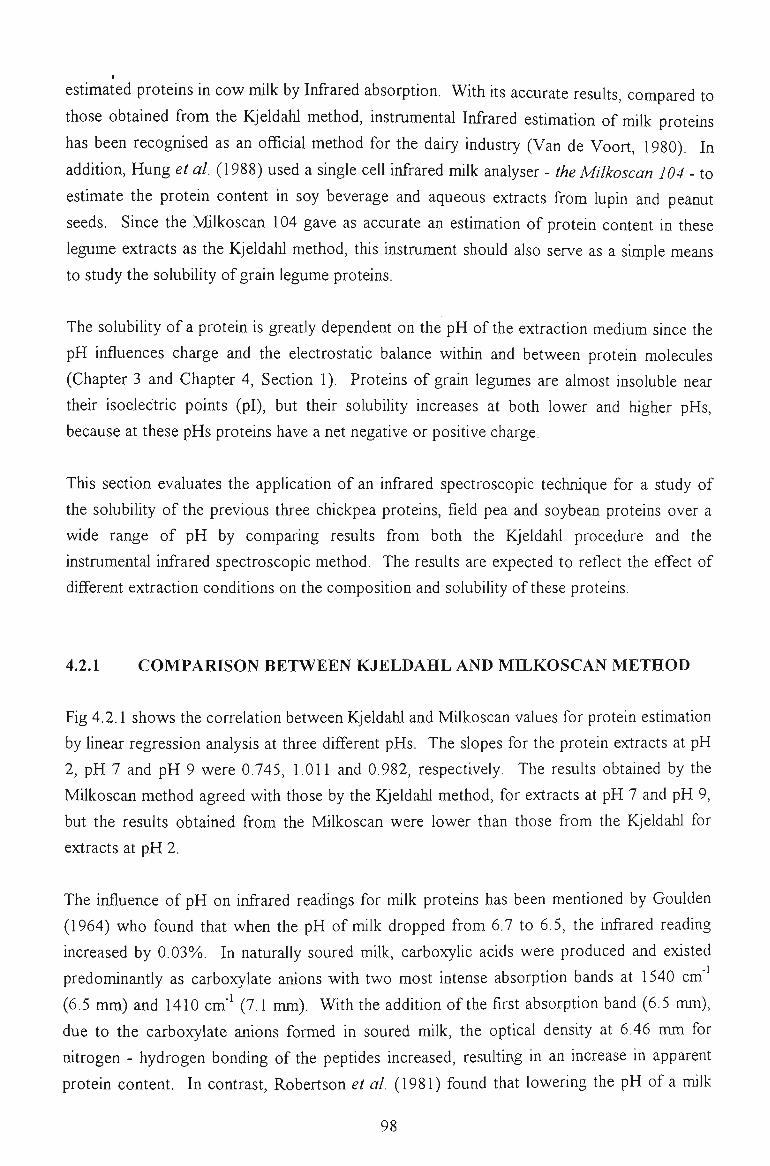
estimated proteins in cow milk by Infrared absorption. With Us accurate results, compared to
those obtained from the Kjeldahl method, instrumental Infrared estimation of miUc protems
has been recognised as an official method for the dairy industry (Van de Voort, 1980). In
addition. Hung et al. (1988) used a single ceU infrared mUk analyser - the Milkoscan 104 - to
estimate the protein content in soy beverage and aqueous extracts from lupin and peanut
seeds. Since the Milkoscan 104 gave as accurate an estimation of protein content in these
legume extracts as the Kjeldahl method, this instrument should also serve as a sUnple means
to study the solubility of grain legume proteins.
The solubility of a protein is greatly dependent on the pH of the extraction medium since the
pH influences charge and the electrostatic balance wUhin and between protein molecules
(Chapter 3 and Chapter 4, Section 1). Proteins of grain legumes are almost insoluble near
their isoelectric points (pi), but their solubility increases at both lower and higher pHs,
because at these pHs proteins have a net negative or positive charge.
This section evaluates the application of an infrared spectroscopic technique for a study of
the solubility of the previous three chickpea proteins, field pea and soybean proteins over a
wide range of pH by comparing resuUs from both the Kjeldahl procedure and the
instrumental infrared spectroscopic method. The results are expected to reflect the effect of
different extraction conditions on the composition and solubUity of these proteins.
4.2.1 COMPARISON BETWEEN KJELDAHL AND MILKOSCAN METHOD
Fig 4.2.1 shows the correlation between Kjeldahl and Milkoscan values for protein estimation
by Unear regression analysis at three different pHs. The slopes for the protein extracts at pH
2, pH 7 and pH 9 were 0.745, 1.011 and 0.982, respectively. The resuUs obtained by the
Milkoscan method agreed with those by the Kjeldahl method, for extracts at pH 7 and pH 9,
but the results obtained from the Milkoscan were lower than those from the Kjeldahl for
extracts at pH 2.
The influence of pH on infrared readings for milk proteins has been mentioned by Goulden
(1964) who found that when the pH of milk dropped from 6.7 to 6.5, the Uifrared reading
increased by 0.03%). In naturally soured milk, carboxylic acids were produced and existed
predominantly as carboxylate anions with two most intense absorption bands at 1540 cm
(6.5 mm) and 1410 cm" (7.1 mm). With the addition of the first absorption band (6.5 mm),
due to the carboxylate anions formed in soured milk, the optical density at 6.46 mm for
mtrogen - hydrogen bonding of the peptides increased, resulting in an increase in apparent
protein content. In contrast, Robertson et al. (1981) found that lowering the pH of a milk
98
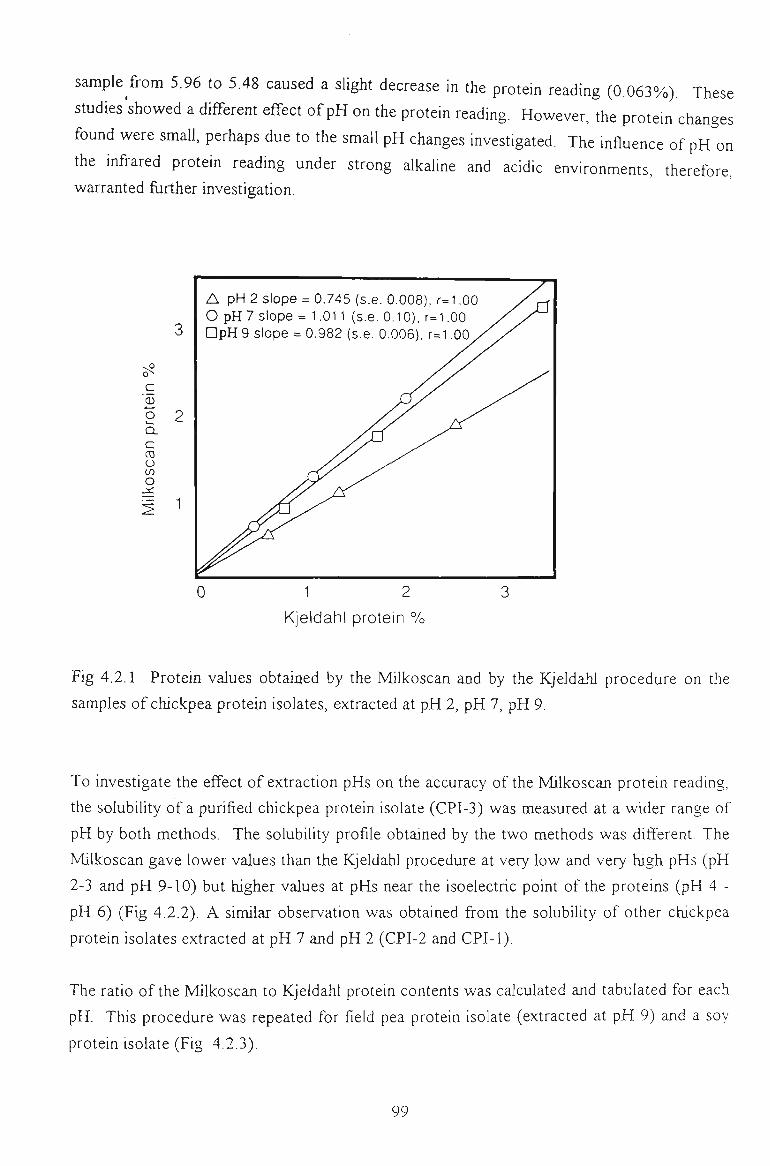
sample^from 5.96 to 5.48 caused a slight decrease in the protein reading (0.063%). These
studies showed a different effect of pH on the protein reading. However, the protein changes
found were small, perhaps due to the small pH changes investigated. The influence of pH on
the infrared protein reading under stiong alkaUne and acidic environments, therefore,
warranted further investigation.
C '_a) o CL
c O
O
• 1
A pH 2 slope = 0.745 (s.e. 0.008), r=l .00 O pH 7 slope = 1.011 (s.e. 0.10), r=l .00 DpH 9 slope = 0.982 (s.e. 0.006), r=1.00
0 1 2
Kjeldahl protein %
Fig 4.2.1 Protein values obtained by the Milkoscan and by the Kjeldahl procedure on the
samples of chickpea protein isolates, extracted at pH 2, pH 7, pH 9.
To investigate the effect of extraction pHs on the accuracy of the Milkoscan protein reading,
the solubility of a purified chickpea protein isolate (CPI-3) was measured at a wider range of
pH by both methods. The solubility profile obtained by the two methods was different. The
Milkoscan gave lower values than the Kjeldahl procedure at very low and very high pHs (pH
2-3 and pH 9-10) but higher values at pHs near the isoelectric point of the proteins (pH 4 -
pH 6) (Fig 4.2.2). A similar observation was obtained from the solubility of other chickpea
protein isolates extracted at pH 7 and pH 2 (CPI-2 and CPI-1).
The ratio of the Milkoscan to Kjeldahl protein contents was calculated and tabulated for each
pH. This procedure was repeated for field pea protein isolate (extracted at pH 9) and a soy
protein isolate (Fig 4.2.3).
99
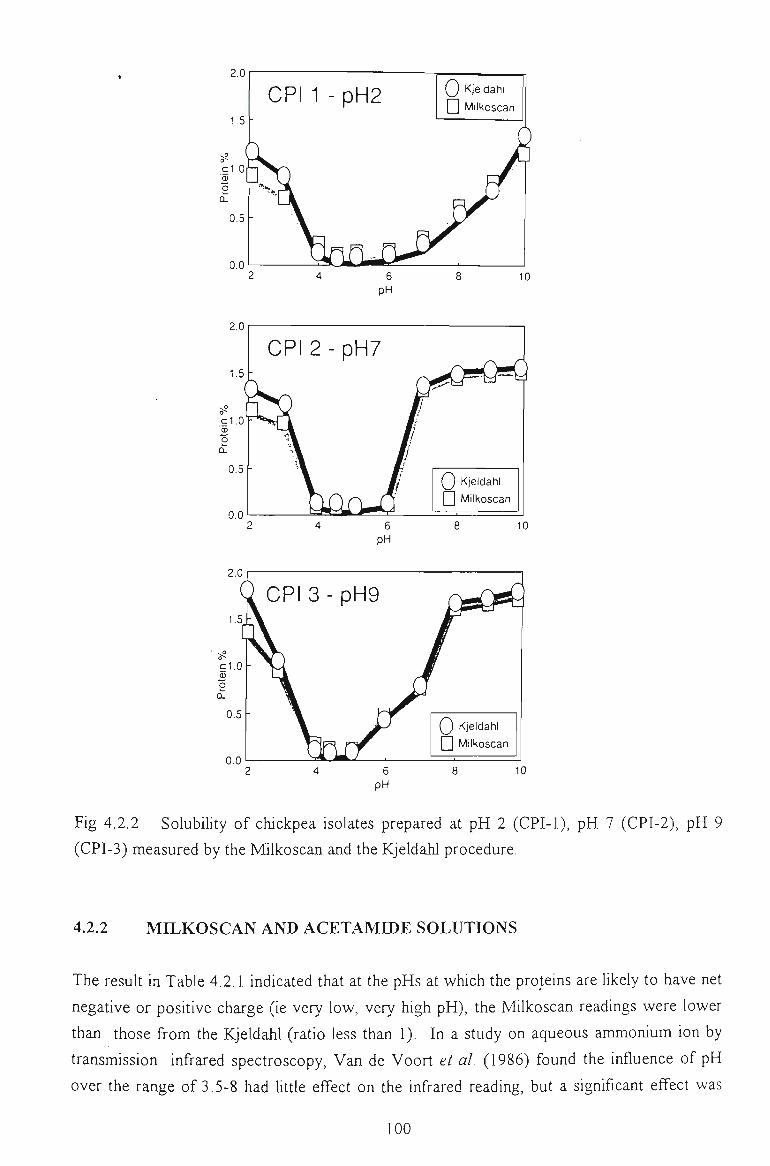
2,0
1,5
c1,0
o
0.5
0.0
2.0
CPU -pH2
1 " *-r\
0 Kjeldahl
Q Milkoscan
,
2.0
1.5
cl.O 2 o QZ
0.5 -
0.0
6 pH
10
CP12-pH7
} CPI3-pH9
0 Kjeldahl Q Milkoscan
6 pH
10
Fig 4.2.2 Solubility of chickpea isolates prepared at pH 2 (CPI-1), pH 7 (CPI-2), pH 9
(CPI-3) measured by the Milkoscan and the Kjeldahl procedure.
4.2.2 MELKOSCAN AND ACETAMDDE SOLUTIONS
The result in Table 4.2.1 indicated that at the pHs at which the proteins are likely to have net
negative or posUive charge (ie very low, very high pH), the Milkoscan readings were lower
than those from the Kjeldahl (ratio less than 1). In a study on aqueous ammonium ion by
transmission infrared spectroscopy. Van de Voort et al (1986) found the influence of pH
over the range of 3.5-8 had Uttie effect on the infrared reading, but a significant effect was
100
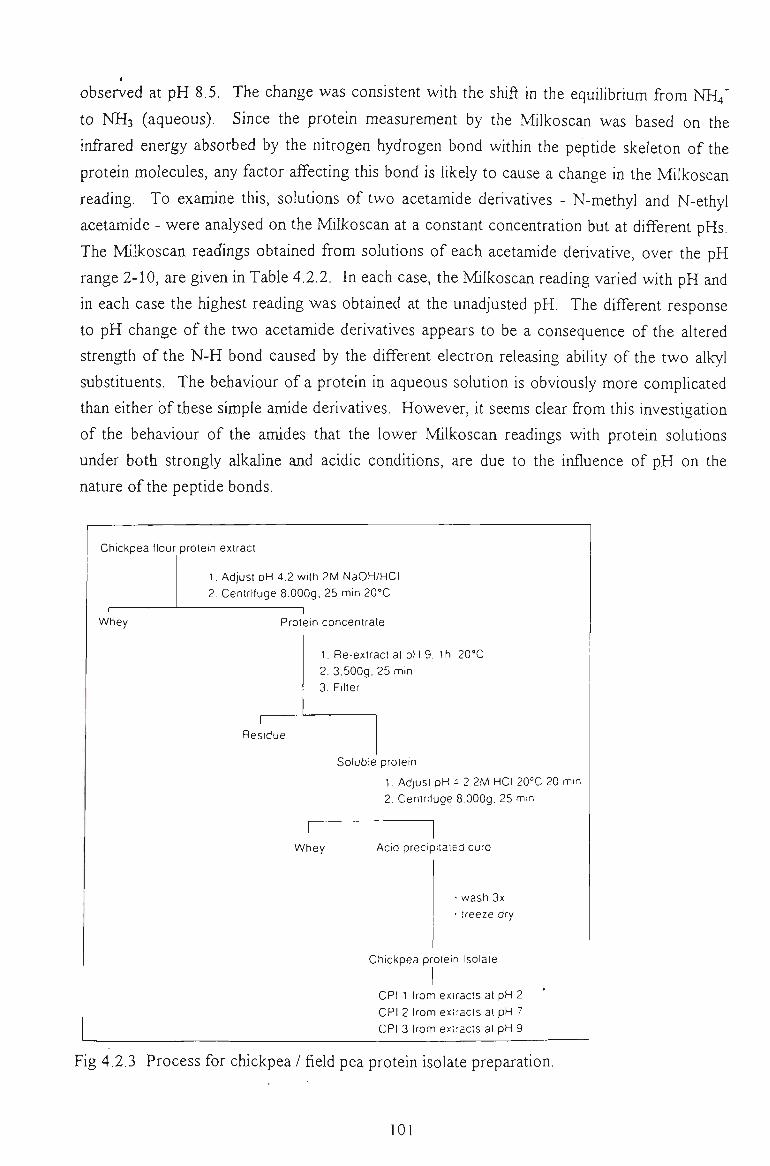
observed at pH 8.5. The change was consistent with the shift in the equilibrium from NH4
to NH3 (aqueous). Since the protein measurement by the Milkoscan was based on the
infrared energy absorbed by the nitrogen hydrogen bond within the peptide skeleton of the
protein molecules, any factor affecting this bond is likely to cause a change in the Milkoscan
reading. To examine this, solutions of two acetamide derivatives - N-methyl and N-ethyl
acetamide - were analysed on the Milkoscan at a constant concentration but at different pHs.
The Milkoscan readings obtained from solutions of each acetamide derivative, over the pH
range 2-10, are given in Table 4.2.2. In each case, the Milkoscan reading varied wUh pH and
in each case the highest reading was obtained at the unadjusted pH. The different response
to pH change of the two acetamide derivatives appears to be a consequence of the altered
strength of the N-H bond caused by the different electron releasing ability of the two alkyl
substituents. The behaviour of a protein in aqueous solution is obviously more compUcated
than either of these simple amide derivatives. However, it seems clear from this investigation
of the behaviour of the amides that the lower Milkoscan readings with protein solutions
under both strongly alkaline and acidic conditions, are due to the influence of pH on the
nature of the peptide bonds.
Chickpea flour protein extract
1, Adjust pH 4.2 with 2M NaOH/HCI 2. Centrifuge S.OOOg, 25 min 20°G
Whey Protein concentrate
1, Re-extract at pH 9, 1 h, ZO'C 2, 3,500g, 25 min 3, Filter
Residue
Soluble protein
1. Adjust pH i 2 2M HCI 20°C 20 min 2, Centrifuge S.OOOg, 25 mm
Whey Acid precipitaied curd
• wash 3x • freeze dry
Chickpea protein Isolate
CPI 1 from extracts at pH 2 CPI 2 Irom extracts at pH 7 CPI 3 from exfacts at pH 9
Fig 4.2.3 Process for chickpea / field pea protein isolate preparation.
101
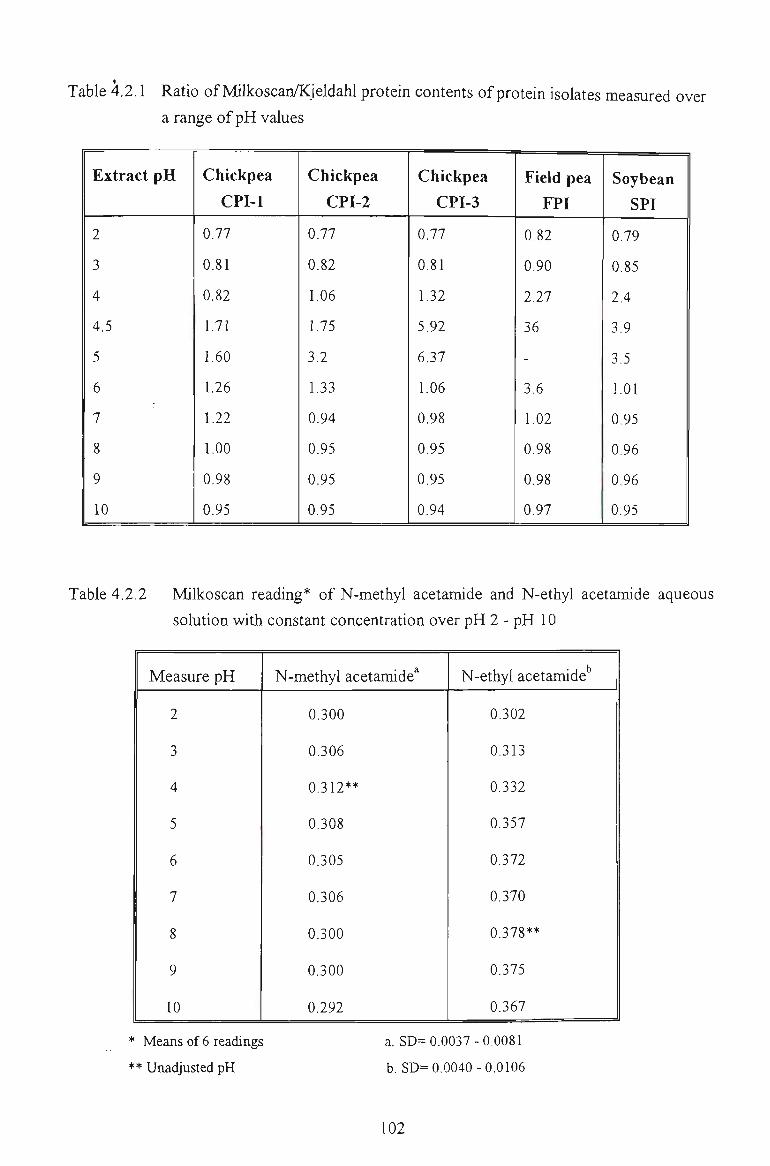
I
Table 4.2.1 Ratio of Milkoscan/Kjeldahl protein contents of protein isolates measured over
a range of pH values
Extract pH
2
3
4
4.5
5
6
7
8
9
10
Chickpea
CPI-1
0.77
0.81
0.82
1.71
1.60
1.26
1.22
1.00
0.98
0.95
Chickpea
CPI-2
0.77
0.82
1.06
1.75
3.2
1.33
0.94
0.95
0.95
0.95
Chickpea
CPI-3
0.77
0.81
1.32
5.92
6.37
1.06
0.98
0.95
0.95
0.94
Field pea
FPI
0.82
0.90
2.27
36
-
3.6
1.02
0.98
0.98
0.97
Soybean
SPI
0.79
0.85
2.4
3.9
3.5
1.01
0.95
0.96
0.96
0.95
Table 4.2.2 Milkoscan reading* of N-methyl acetamide and N-ethyl acetamide aqueous
solution with constant concentration over pH 2 - pH 10
Measure pH
2
3
4
5
6
7
8
9
10
N-methyl acetamide^
0.300
0.306
0.312**
0.308
0.305
0.306
0.300
0.300
0.292
N-ethyl acetanUde
0.302
0.313
0.332
0.357
0.372
0.370
0.378**
0.375
0.367
* Means of 6 readings
** Unadjusted pH
a. SD= 0.0037-0.0081
b. SD= 0.0040-0.0106
102
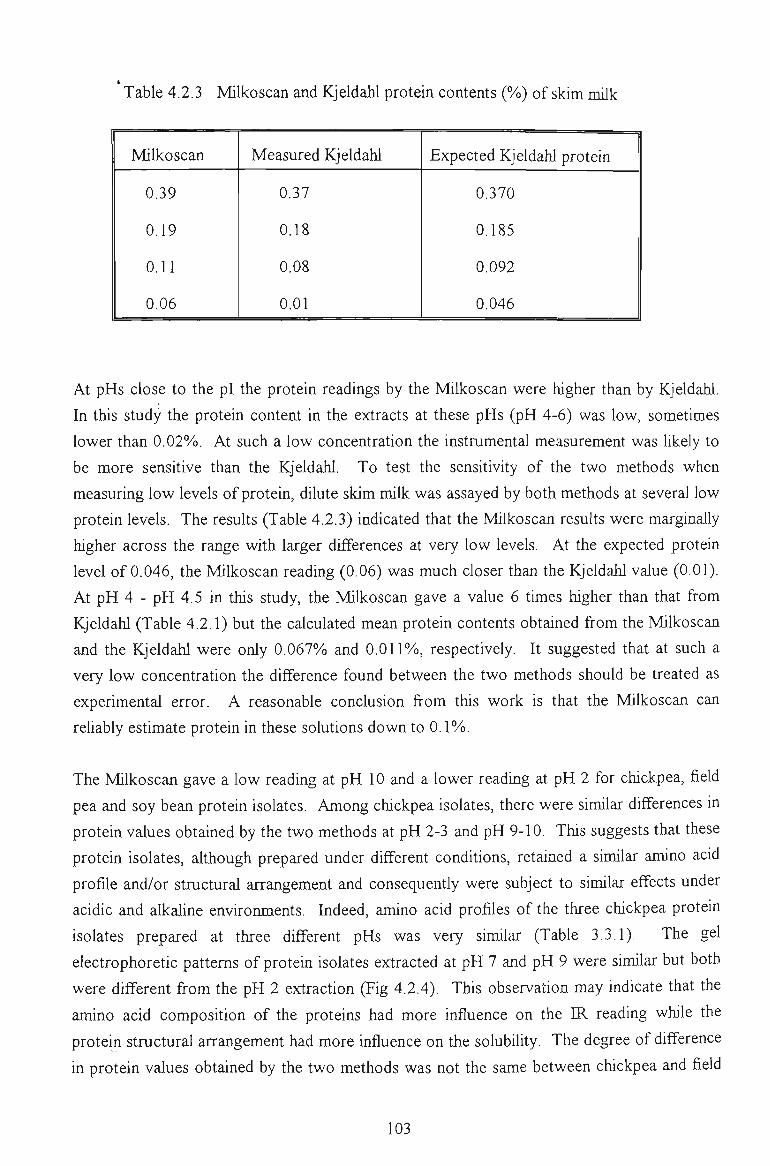
I
Table 4.2.3 Milkoscan and Kjeldahl protein contents (%) of skim milk
Milkoscan
0.39
0.19
0.11
0.06
Measured Kjeldahl
0.37
0.18
0.08
0.01
Expected Kjeldahl protein
0.370
0,185
0.092
0.046
At pHs close to the pi the protein readings by the Milkoscan were higher than by Kjeldahl.
In this study the protein content in the extracts at these pHs (pH 4-6) was low, sometimes
lower than 0.02%. At such a low concentration the instrumental measurement was likely to
be more sensitive than the Kjeldahl. To test the sensitivity of the two methods when
measuring low levels of protem, dilute skim milk was assayed by both methods at several low
protein levels. The results (Table 4.2.3) indicated that the Milkoscan results were marginally
higher across the range with larger differences at very low levels. At the expected protein
level of 0.046, the Milkoscan reading (0.06) was much closer than the Kjeldahl value (0.01).
At pH 4 - pH 4.5 in this study, the Milkoscan gave a value 6 times higher than that from
Kjeldahl (Table 4.2.1) but the calculated mean protein contents obtained from the Milkoscan
and the Kjeldahl were only 0.067% and 0.011%), respectively. It suggested that at such a
very low concentration the difference found between the two methods should be treated as
experimental error. A reasonable conclusion from this work is that the Milkoscan can
reUably estimate protein in these solutions down to 0.1%).
The Milkoscan gave a low reading at pH 10 and a lower readUig at pH 2 for chickpea, field
pea and soy bean protein isolates. Among chickpea isolates, there were simUar differences in
protein values obtained by the two methods at pH 2-3 and pH 9-10. This suggests that these
protein isolates, although prepared under different condUions, retained a similar amino acid
profile and/or structural arrangement and consequentiy were subject to sUnilar effects under
acidic and alkaline environments. Indeed, amino acid profiles of the three chickpea protein
isolates prepared at three different pHs was very similar (Table 3.3.1). The gel
electrophoretic patterns of protein isolates extracted at pH 7 and pH 9 were simUar but both
were different from the pH 2 extraction (Fig 4.2.4). This observation may indicate that the
amino acid composition of the proteins had more influence on the IR reading while the
protein structural arrangement had more influence on the solubility. The degree of difference
in protein values obtained by the two methods was not the same between chickpea and field
103
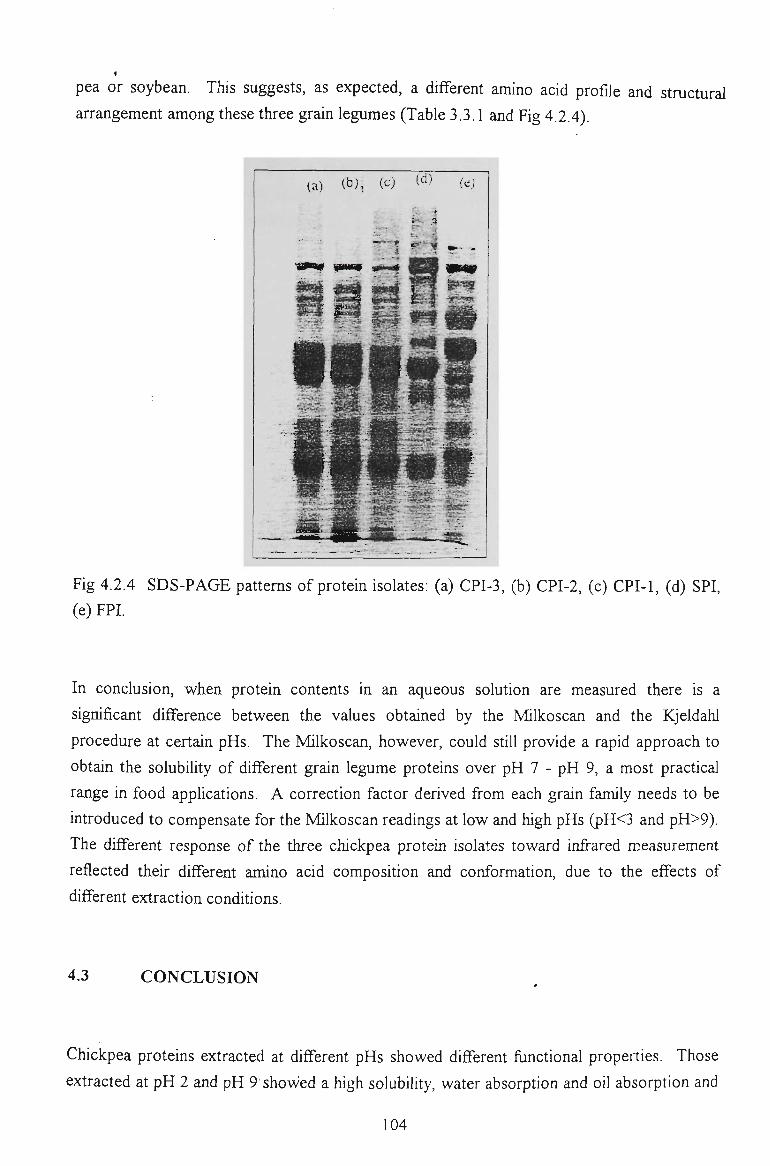
pea or soybean. This suggests, as expected, a different amino acid profile and structural
arrangement among these three grain legumes (Table 3.3.1 and Fig 4.2.4).
(a) (bj , (c; (fl) (cj
'^ w ,
~" ' t w ^ ^
Fig 4.2.4 SDS-PAGE patterns of protein isolates: (a) CPI-3, (b) CPI-2, (c) CPI-1, (d) SPI,
(e) FPI.
In conclusion, when protein contents in an aqueous solution are measured there is a
significant difference between the values obtained by the Milkoscan and the Kjeldahl
procedure at certain pHs. The Milkoscan, however, could still provide a rapid approach to
obtain the solubUity of different grain legume proteins over pH 7 - pH 9, a most practical
range in food appUcations. A correction factor derived from each grain family needs to be
introduced to compensate for the Milkoscan readings at low and high pHs (pH<3 and pH>9).
The different response of the three chickpea protein isolates toward infrared measurement
reflected their different amino acid composition and conformation, due to the effects of
different extraction conditions.
4.3 CONCLUSION
Chickpea proteins extracted at different pHs showed different fimctional properties. Those
extracted at pH 2 and pH 9' showed a high solubility, water absorption and oil absorption and
104
could be compared with those of a commercial soy protein isolate. The EC of all chickpea
isolates increased with increasing protein concentration, suggesting a correlation between
their EC and solubility. Also their pH / EC curves correlated wUh then: pH/solubUity curves.
In addition, the different effect of thermal treatments and saU addition on the EC and FE
depended on each protein isolate. These different fimctional properties reflected theU
different composition and structures due to different processing conditions.
105
CHAPTER 5
MODIFICATION OF CHICKPEA PROTEIN ISOLATES BY ACETYLATION AND SUCCINYLATION
MODIFICATION OF CHICKPEA PROTEIN ISOLATES BY ACETYLATION AND SUCCINYLATION
Chickpea proteins have been used as protein ingredients in meat (Verma et al, 1984),
beverage (Luz Fermander and Berry, 1987), infant formula (Livingston et al, 1993) and
bakery products (Hung et al, 1993) on a laboratory scale. Currently, other novel
applications are also being sought. However, like other food proteins, the effective
application of chickpea proteins in the food industry depends partly on their nutritional values
but mainly on their fianctional properties. So far only limited information on functional
properties of chickpea proteins is avaUable. The effects of extraction condUions on some
functional properties such as the solubility, water and oil absorption and surfactant related
properties of chickpea proteins were investigated and presented in Chapter 4. The resuUs
confirmed that these properties are affected by intrinsic and environmental factors such as
protein composUion, conformation, salt and pH and at the same time indicated that there was
also a need to improve these properties.
There is no single protein which can satisfy all the fimctional properties required by different
food systems. However, the functional properties of a food protein can be altered or
modified to improve their behaviour in various food systems (Kinsella, 1976; Olsen and Adler
Nissen, 1979; Rhee, 1989). Also proteins are modified for structure-functional relation
studies (Damodaran, 1994). There are several chemical and biological means to modify the
functional properties of a protein (Vojdani and Whitaker, 1994).
Of several chemical modification approaches, acylation with acetic and succirUc anhydride
was widely used to improve functional properties of various food proteins (Schwenke and
Rauschal, 1980). By introducing acetyl groups into the protein molecules, acetylation
improved emulsifying capacity, emulsion stability, foam capacity and stability and water
absorption of pea (Johnson and Brekke, 1983; Mendoza-Martinez et al, 1988), soy (Kim and
Rhee, 1989), winged bean (Narayana and Narasinga Rao, 1984) and rapeseed proteins
(Gwiazda et al, 1989). Similarly, the addition of succinic groups with succinylation
improved some functional properties of peanut (Beuchat, 1977; Kim and Kinsella, 1987), egg
(Sato and Nakamura, 1977), fish (Chen et al, 1975), casein (Strange et al, 1993), sunflower
(Schwenke et al, 1986), field pea (Schwenke et al, 1993) and canola proteins (Paulson and
Tung, 1987, 1988; Niteckae^a/., 1986).
The modification of chickpea proteins warrants a detail investigation since this can serve as a
107
means'to improve some of their functional properties and also to enhance its utilisation m
processed foods. It also assists in the understanding of the effect of protein's structure on
functional performance. Consequentiy, this chapter reports on the modification of chickpea
proteins by acetylation and succinylation, the characterisation and functional properties of
the acylated proteins.
The chickpea protein concentrates (CPC) and isolates (CPI) were prepared on a pilot scale
plant (40 kg flour) at the food processing centre of the Australian Food Industry Science
Centre, using the flour of C. arietinum cv Kaniva. Two concentrates (CPC2, CPC3) were
extracted at pH 7 and pH 9 and two corresponding isolates (CPI2, CPI3) having 79%, 81%
90%) and 92%) protein content were acylated with acetic and succUiic anhydride at several
levels.
Eight acylated proteins (8) from one isolate (CPI3 or NCP) were selected for further
investigation. Four succinylated proteins (SCP 16, SCP72, SCP73 and SCP79) with 16, 72,
73 and 79%) succinylated levels and four acetylated proteins (ACP6, ACP26, ACP45 and
ACP49) with 6, 26, 45, 49% acetylated level were subjected to a detailed study.
5.1 CHARACTERISATION OF MODIFIED CHICKPEA PROTEINS
5.1.1 EXTENT OF ACYLATION
The extent of acylation of chickpea protein concentrates and isolates by acetic and succinic
anhydride is given in Fig 5.1.1 (a-b). For all investigated protein concentrates and isolates,
the level of acylation increased with increasing ratio of acylating reagents to proteins.
However the acylation was almost unchanged above certain acylating reagent / protein
ratios. High levels of acetylation for protein isolates extracted at pH 7 (71%) and at pH 9
(72%) were obtained with 20 and 40% acetic anhydride. High levels of succinylation were
achieved at 10 and 20% succinic anhydride for proteins isolated at pH 7 (84%) and pH 9
(85%). Protein concentrates also reached high levels of acylation at certain acylating
reagent / protein ratios. Canella et al. (1979) found that increasing the succinic anhydride
from 50%) to 100% only increased the level of succinylation of sunflower protein from 86%
to 88%). The results indicated that protein isolates were more acylated than concentrates.
The extent of acylation was also affected by different acylating reagents. Eisele and Brekke
(1981) found that acetic anhydride was the most effective acylation reagent, compared with
108
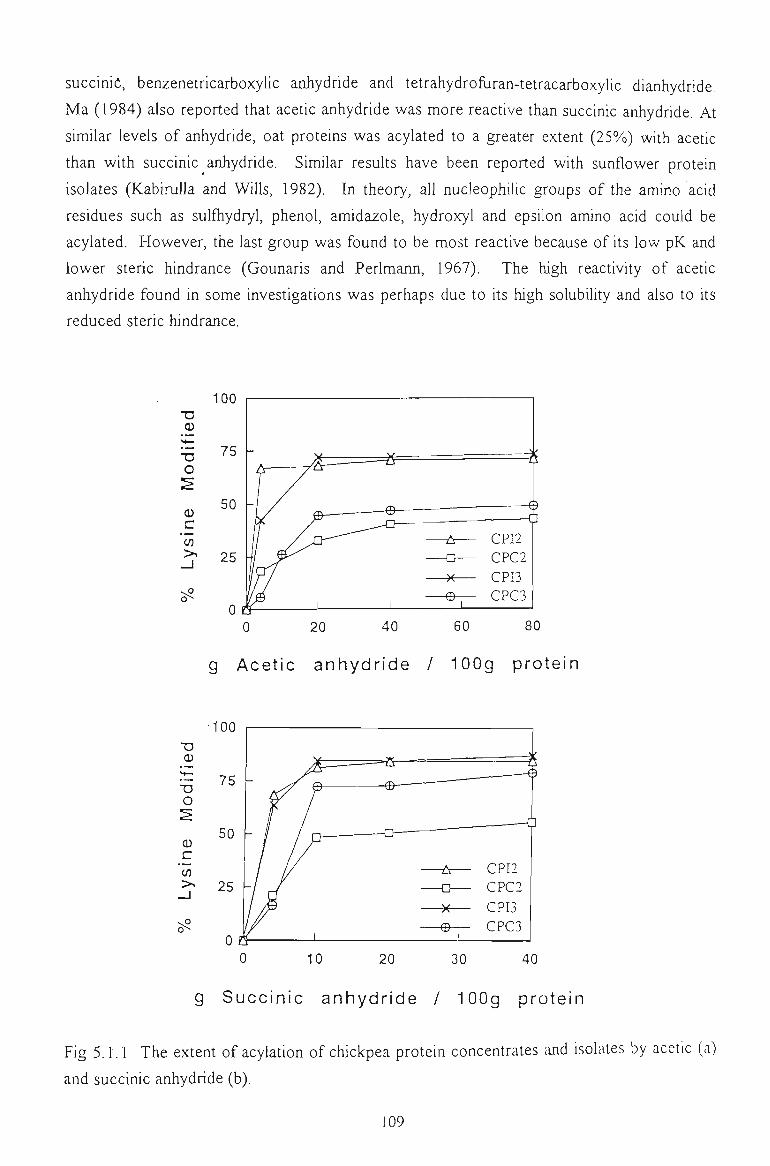
succinic, benzenetricarboxylic anhydride and tetrahydrofuran-tetracarboxylic dianhydride.
Ma (1984) also reported that acetic anhydride was more reactive than succinic anhydride. At
similar levels of anhydride, oat proteins was acylated to a greater extent (25%) with acetic
than with succinic anhydride. Similar results have been reported with sunflower protein
isolates (KabiruUa and Wills, 1982). In theory, aU nucleophilic groups of the amino acid
residues such as sulfhydryl, phenol, amidazole, hydroxyl and epsilon amino acid could be
acylated. However, the last group was found to be most reactive because of Us low pK and
lower steric hindrance (Gounaris and Perlmaim, 1967). The high reactivity of acetic
aiUiydride found in some investigations was perhaps due to Us high solubility and also to Us
reduced steric hindrance.
100
g Acet ic anhydr ide / 100g prote in
100 T3 <U
., •— U o
0) c <J) >.
/s
50
25
9 Succ in ic anhydr ide / 100g protein
Fig 5.1.1 The extent of acylation of chickpea protein concentrates and isolates by acetic (a)
and succinic anhydride (b).
109
Some investigations indicated that there was no significant difference in the effect of acetic
and succinic anhydride on the acylation of winged bean flour (Narayana and Rao, 1984),
peanut (Shyma Sunda and Rao, 1980) and cotton seed flour (Rhama and Narasinga, 1983).
In this study, succinic anhydride was found to be more reactive than acetic anhydride. At a
4% of succinic anhydride / protein ratio, more than 63%) of epsilon amino groups in lysine
were succinylated and the level of succinylation increased to 85% at a 10%) succinic
anhydride/ protein ratio. The acetylation level increased to 74% and 78%, but U required
40% and 80%) acetic anhydride/ protein ratio, respectively. Acetic anhydride was found less
reactive than succiiUc anhydride in the acetylation of sunflower proteins (Canella et al,
1979). The high reactivity of succinic anhydride was demonstrated by a rapid succinylation
of rapeseed albumin by a smaU amount of succinic anhydride (Nitecka et al, 1986). Fungal
proteins were succinylated to 20% with only a 2.5% ratio of succinic anhydride / protein and
increased greatly to 85% at a ratio of 20% succinic anhydride/ protein. Tobacco leaf (Sheen,
1991), canola (Paulson and Tung, 1988), casein (Kim and KinseUa, 1985), bovine serum
albumin (Alford et al, 1984) and soy proteins (Franzen and Kinsella, 1976) were all
succinylated to over 90%. The reactivity of succinic anhydride was also affected by the type
of protein investigated. Under identical treatment, casein, field bean protein, sunflower
globuUn was succinylated to levels of 98, 93 and 83%, respectively.
Consequently, the acylation of chickpea proteins indicated that the effect of acylation reagents
(acetic and succinic anhydride) on the level of modification varied not only wUh the type of
reagent and Us concentration but also wUh the different types of proteins involved in the
system.
5.1.2 AMINO ACID COMPOSITION
The amino acid profile of the native, acetylated and succinylated chickpea protein isolates at
several levels of acylation is given in Table 5.1.1.
The essential amino acids of the native protein accounted for 46% of total amino acids. This
is higher than those reported for chickpea protein isolated by isoelectric precipUation (39.6%)
and micelUzation (38.2%) (Paredes Lopez et al, 1991). Sulfiir containing amino acids and
aromatic amino acids accounted for 1.8 and 9.7% while lysine (7.4%) and leucine (9.7%)
were the highest essential amino acids. For non essential amino acids, glutamic, aspartic acid
and arginine accounted for 36% of the total amino acids.
Succinylation up to 79% and acetylation up to 49% did not alter the essential amino acid
110
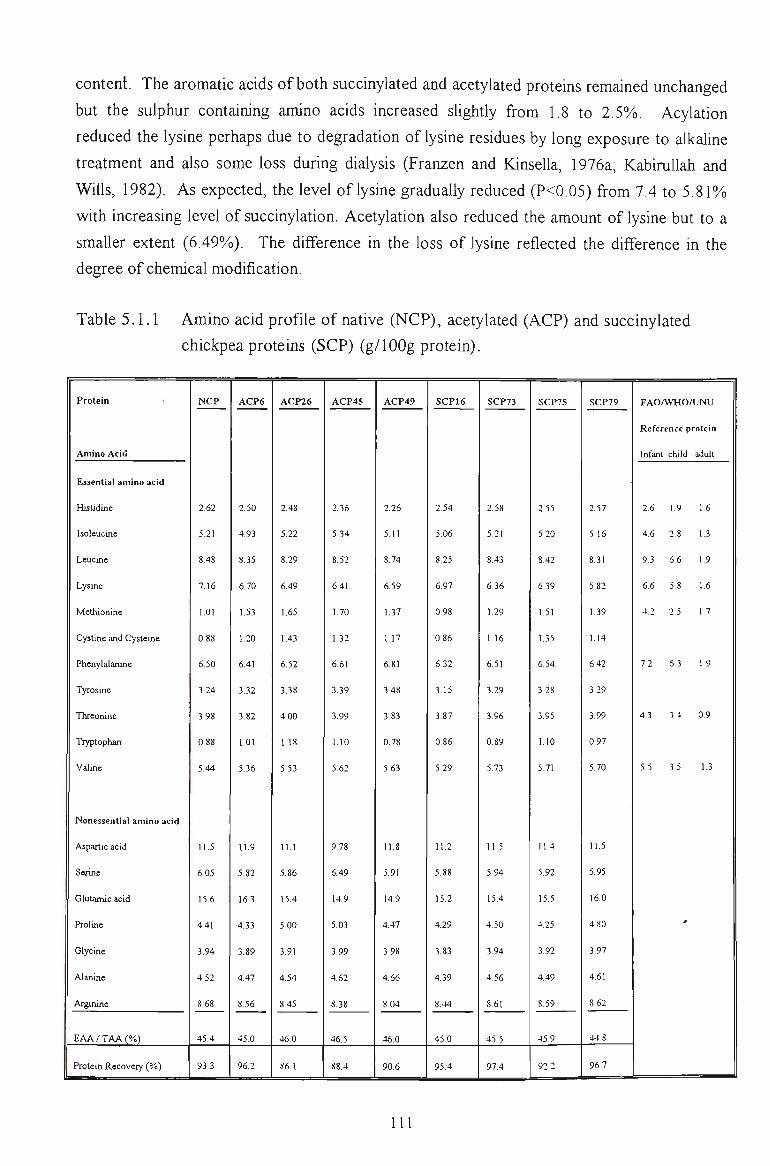
content. The aromatic acids of both succinylated and acetylated proteins remained unchanged
but the sulphur containing amino acids increased slightly from 1.8 to 2.5%. Acylation
reduced the lysine perhaps due to degradation of lysine residues by long exposure to alkaline
treatment and also some loss during dialysis (Franzen and KinseUa, 1976a; KabiruUah and
WiUs, 1982). As expected, the level of lysine gradually reduced (P<0.05) from 7.4 to 5.81%
with increasing level of succinylation. Acetylation also reduced the amount of lysine but to a
smaller extent (6.49%). The difference in the loss of lysine reflected the difference in the
degree of chemical modification.
Table 5.1.1 Amino acid profile of native (NCP), acetylated (ACP) and succinylated
chickpea proteins (SCP) (g/lOOg protein).
Protein
Amino Acid
Essential amino acid
Histidine
Isoleucine
Leucine
Lysine
Methionine
Cystine and Cysteine
Phenylalanine
Tyrosine
Threonine
Tryptophan
Valine
Nonessential amino acid
Aspartic acid
Serine
Glutamic acid
Proline
Glycine
Alanine
Arginine
E A A / T A A ( % 1
Protein Recovery (%)
NCP
2,62
5,21
8,48
716
1,01
0,88
6,50
3,24
3,98
0,88
5,44
11,5
6,05
15,6
4,41
3,94
4,52
8.68
45,4
93.3
ACP6
2,50
4,93
8,35
6.70
1,53
1,20
6,41
3,32
3,82
1,01
5.36
11,9
5,82
16.3
4,33
3,89
4,47
8,56
45,0
96,2
ACP26
2,48
5.22
8,29
6,49
1,65
1,43
6,52
3,38
4,00
1.18
5,53
11,1
5,86
15,4
5,00
3,91
4,54
8.45
46.0
86,1
ACP45
2,36
5.34
8,52
6.41
1,70
1.32
6.61
3,39
3,99
1,10
5,62
9,78
6,49
14,9
5,03
3.99
4,62
8,38
46.5
88,4
ACP49
2,26
5.11
8,74
6.59
1,37
1,17
6,81
3,48
3,83
0,78
5,63
11,8
5.91
14,9
4,47
3.98
4,66
8.04
46,0
90.6
SCP16
2,54
5.06
8.25
6,97
0.98
0.86
6,32
3,15
3,87
0,86
5,29
11,2
5,88
15.2
4.29
3,83
4,39
8.44
45,0
95.4
SCP73
2.58
5,21
8.43
6.36
1.29
1,16
6,51
3,29
3,96
0.89
5,73
11.5
5,94
15,4
4.50
3,94
4,56
8.61
45.5
97.4
SCP75
2,55
S,20
8.42
6,39
1.51
1,35
6,54
3,28
3,95
1,10
5.71
11.4
5.92
15,5
425
3,92
4.49
8.59
45.9
gi 2
SCP79
2,57
5.16
8,31
5,82
1.39
1 14
6,42
3.29
3,99
0.97
5.70
11.5
5.95
16.0
4.80
3.97
461
8,62
44.8
96.7
FAOAVHOAJNU
Reference protein
Infant child adult
2.6 1,9 1.6
4.6 2.8 1.3
9 3 6,6 1,9
6.6 5.8 1.6
4 2 2.5 1.7
7 2 6.3 1,9
4,3 3 4 0,9
5.5 3.5 1.3
*
111
The data indicated that chickpea protein contained all essential acids required for pre school
children and aduUs as recommended by FAO/WHO (WHO, 1985). Only lysine and threonine
were slightly lower than those recommended for infant. Although acylation reduced some
lysine, essential amino acids including lysine in acylated chickpea proteins still met the
required level for pre school children and adults.
5.1.3 GEL FBLTRATION
Native, acetylated (6, 26, 45 and 49%) and succinylated (16, 73, 74 and 19%) protein isolates
of chickpea were subjected to Sepharose B6 gel filtration. All these isolates showed very
similar resolving patterns by Sepharose with three major fractions. Molecular weight of these
three fractions calculated from a standard curve of proteins of known molecular weight were
approximate 912, 52.5 and 20.9 kD for the native protein; 923, 58.9 and 22.9 kD for 6% and
45%) acetylated proteins. The proportion of these three main fractions from the unmodified
protein was approximately 30, 42 and 28%), respectively. Although the chromatogram of
these proteins was very similar, the quantity of protein in each individual peak was somewhat
different. As the level of acetylation increased, the proportion between the peaks changed.
The peak eluted at void volume decreased to 19% while the second peak increased to 44.7%
when the protein was acetylated to 49%). The resuUs indicated that some protein
rearrangement occurred with the dissociation of high molecular weight proteins and the
agglomeration of proteins with low MW.
5.1.4 GEL ELECTROPHORESIS
The SDS-PAGE patterns of the unmodified and acetylated, succinylated chickpea proteins at
several levels is given in Fig 5.1.2.
The electrophoretic profile of the native protein showed seven bands with three major bands
found in the range of 0.21, 0.33 and 0.83 Rf, respectively. This profile contained less band
than those reported for protein isolates prepared by miceUization and isoelectric precipitation
(Paredes Lopez etal, 1991).
There were some similarities between the electrophoretic patterns of the native and
succinylated proteins as illustrated by several major bands. However, the electrophoretic
profile of succinylated proteins showed a new distinct band at 0.32 Rf. As the level of
succinylation increased several minor bands in the range of 0.34 to 0.83 Rf gradually
decreased in their intensity and completely disappeared at 79% succinylation. These
112
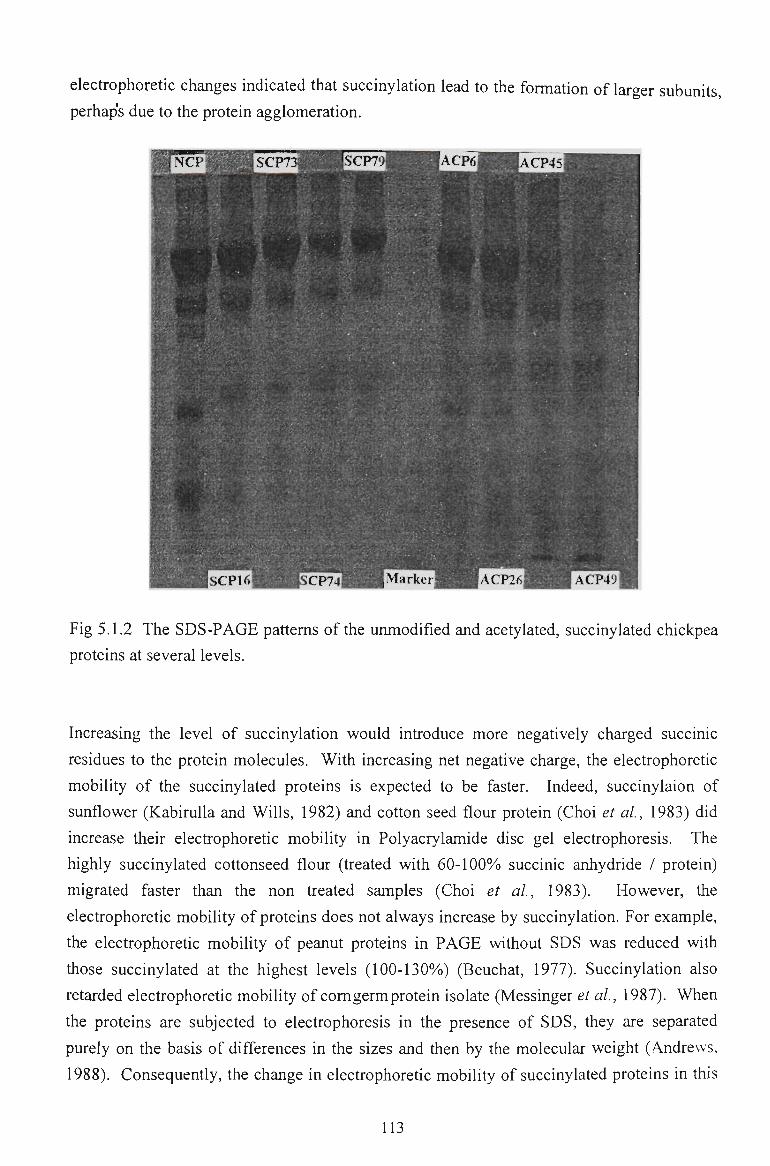
electrophoretic changes indicated that succinylation lead to the formation of larger subunits,
perhaps due to the protein agglomeration.
Fig 5.1.2 The SDS-PAGE patterns of the unmodified and acetylated, succinylated chickpea
proteins at several levels.
Increasing the level of succinylation would introduce more negatively charged succinic
residues to the protein molecules. With increasing net negative charge, the electrophoretic
mobility of the succinylated proteins is expected to be faster. Indeed, succinylaion of
sunflower (Kabirulla and Wills, 1982) and cotton seed flour protein (Choi et al, 1983) did
increase their electrophoretic mobility in Polyacrylamide disc gel electrophoresis. The
highly succinylated cottonseed flour (treated with 60-100% succinic anhydride / protein)
migrated faster than the non treated samples (Choi et al, 1983). However, the
electrophoretic mobility of proteins does not always increase by succinylation. For example,
the electiophoretic mobility of peanut proteins in PAGE without SDS was reduced with
those succinylated at the highest levels (100-130%) (Beuchat, 1977). Succinylation also
retarded electrophoretic mobility of com germ protein isolate (Messinger et al, 1987). When
the proteins are subjected to electrophoresis in the presence of SDS, they are separated
purely on the basis of differences in the sizes and then by the molecular weight (Andrews.
1988). Consequentiy, the change in electrophoretic mobility of succinylated proteins in this
113
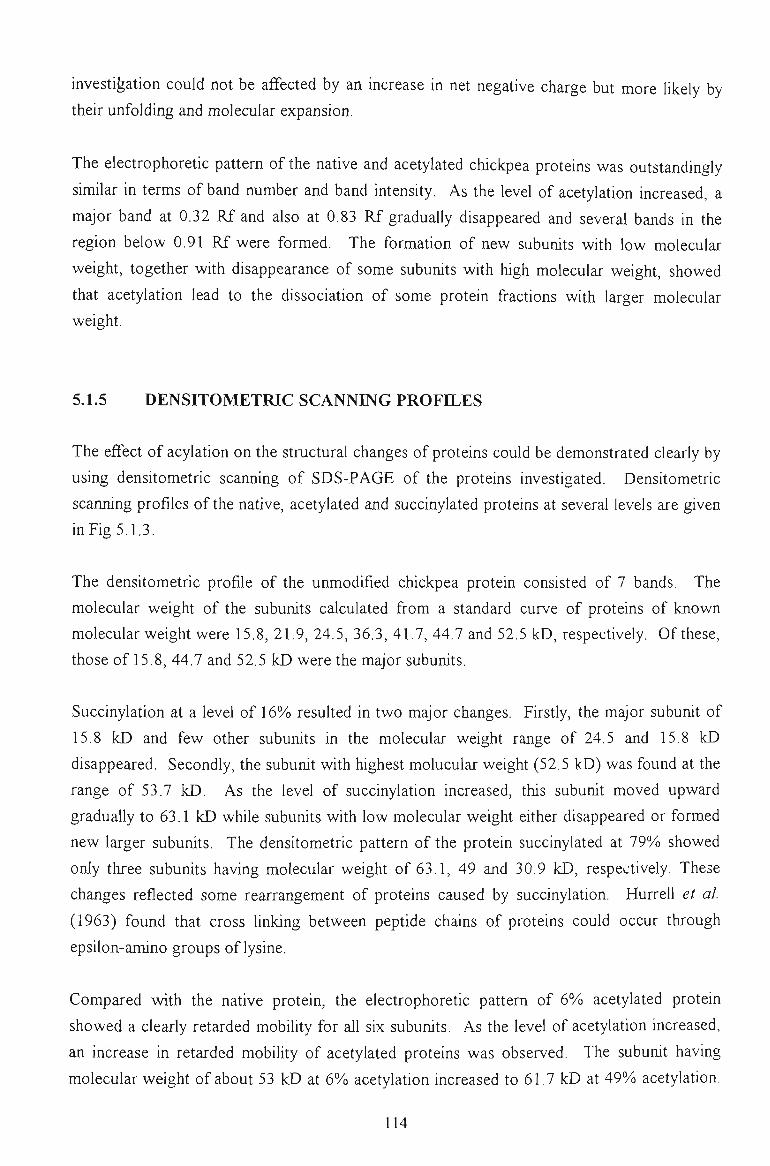
investigation could not be affected by an increase in net negative charge but more likely by
their unfolding and molecular expansion.
The electrophoretic pattern of the native and acetylated chickpea proteins was outstandingly
similar in terms of band number and band intensity. As the level of acetylation increased, a
major band at 0.32 Rf and also at 0.83 Rf gradually disappeared and several bands in the
region below 0.91 Rf were formed. The formation of new subunits with low molecular
weight, together wUh disappearance of some subunits wUh high molecular weight, showed
that acetylation lead to the dissociation of some protein fractions wUh larger molecular
weight.
5.1.5 DENSITOMETRIC SCANNING PROFELES
The effect of acylation on the structural changes of proteins could be demonstrated clearly by
using densitometric scanning of SDS-PAGE of the proteins investigated. DensUometric
scarming profiles of the native, acetylated and succinylated proteins at several levels are given
in Fig 5.1.3.
The densitometric profile of the unmodified chickpea protein consisted of 7 bands. The
molecular weight of the subunits calculated from a standard curve of proteins of known
molecular weight were 15.8, 21.9, 24.5, 36.3, 41.7, 44.7 and 52.5 kD, respectively. Of these,
those of 15.8, 44.7 and 52.5 kD were the major subunits.
Succinylation at a level of 16% resulted in two major changes. Firstly, the major subunit of
15.8 kD and few other suburuts in the molecular weight range of 24.5 and 15.8 kD
disappeared. Secondly, the subunit with highest molucular weight (52.5 kD) was found at the
range of 53.7 kD. As the level of succinylation increased, this subunit moved upward
gradually to 63.1 kD while subunUs with low molecular weight either disappeared or formed
new larger subunits. The densitometric pattern of the protein succinylated at 79%) showed
only three subunits having molecular weight of 63.1, 49 and 30.9 kD, respectively. These
changes reflected some rearrangement of proteins caused by succinylation. Hurrell et al
(1963) found that cross linking between peptide chains of proteins could occur through
epsilon-amino groups of lysine.
Compared with the native protein, the electrophoretic pattern of 6% acetylated protein
showed a clearly retarded mobility for all six subunits. As the level of acetylation increased,
an increase in retarded mobility of acetylated proteins was observed. The subuiut having
molecular weight of about 53 kD at 6% acetylation increased to 61.7 kD at 49% acetylation.
114
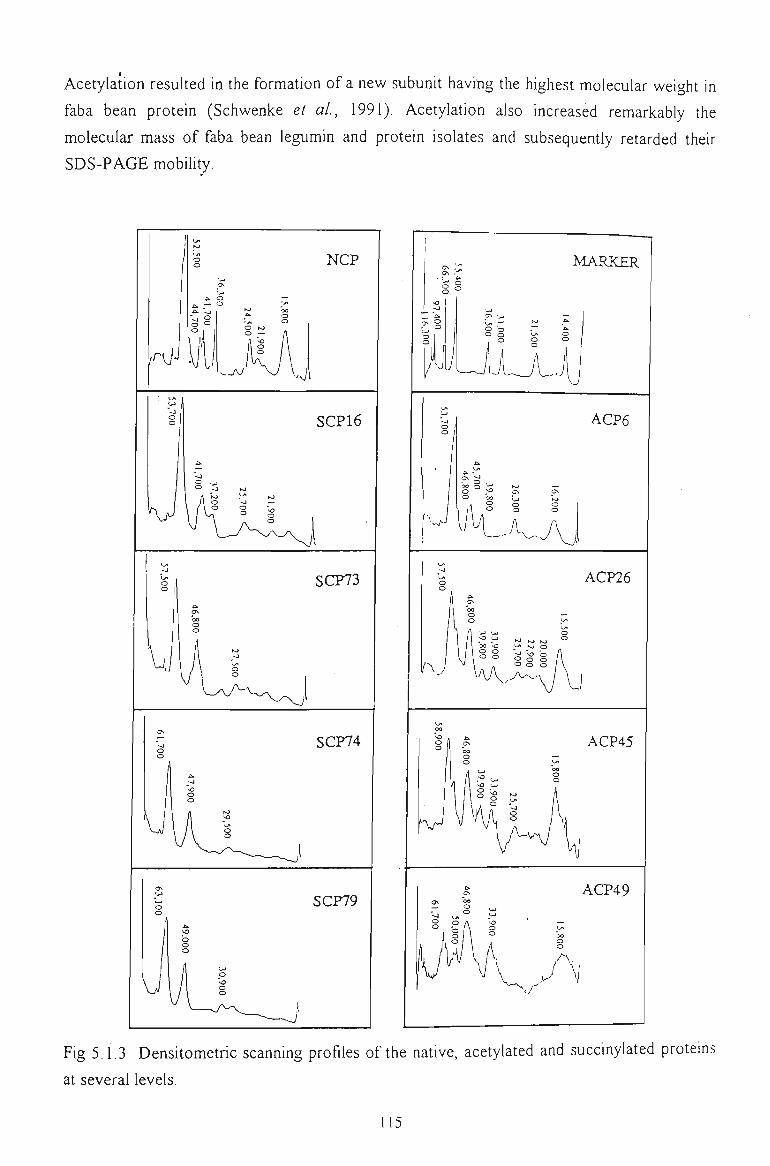
Acetylation resulted in the formation of a new subunit having the highest molecular weight in
faba bean protein (Schwenke et al, 1991). Acetylation also increased remarkably the
molecular mass of faba bean legumin and protein isolates and subsequently retarded their
SDS-PAGE mobility.
NCP
SCP16
\ i
SCP73
SCP74
ACP6
oa f~\ -^
A V - v
ACP26
SCP79
ACP45
ACP49
Fig 5.1.3 DensUometric scanning profiles of the native, acetylated and succinylated proteins
at several levels.
115
The electrophoretic profiles revealed some structural differences between acetylated and
succinylated proteins. Some subumts wUh low molecular weight (<20 kD) of succinylated
proteins gradually disappeared whUe those of acetylated proteins associated as the level of
acylation increased. At high level of acetylation (45-49%)) these subunits agglomerated to
form a new subunit having molecular weight of 16.2 kD while subunits wUh high molecular
weight (45 kD) partly dissociated. These structural change may lead to some change in
fimctional properties of ACP45 and ACP49 (Liu and Hung, 1996).
5.1.6 IN VITRO DIGESTIBILITY
The in vitro digestibility of the native, acetylated and succinylated chickpea proteins by
trypsin, chymotrypsin, pepsin and papain, presented as relative activity (%RA) is given in Fig
5.1.4 a-d and Fig 5.1.5 a-d.
5.1.6.1 Acetylated proteins
Papain
The papain degradation of native and acetylated proteins is given in Fig 5.1.4a. The effect of
acetylation on the digestibility of papain was only shown after a long digestion time (24
hours). After 6 hours of digestion there was no difference in the protein hydrolysis of all
isolates, except ACP6. The relative activity of papain to all protein isolates increased about 4
to 8 fold after 24 hours of digestion. Acetylated proteins were hydrolysed much more than
the native protein but the increase in RA of papain did not vary proportionally with the level
of acetylation.
Trypsin
Trypsin poorly degraded all chickpea proteins compared with other three proteases. After 24
hours of digestion, its RA increased only to about 2 fold. In addition, the resuU indicated that
acetylation reduced the digestibility of proteins by trypsin (Fig 5.1.4b).
Pepsin
Although there was no significant difference in the protein hydrolysis between the native and
6% acetylated protein, digestibility of highly acetylated proteins (ACP26, ACP45 and
ACP49) was improved by pepsin. After 6 and 24 hours of digestion, the digestibility of these
three acetylated proteins increased up to 3 to 6 folds (Fig 5.1.4c). The difference in
116
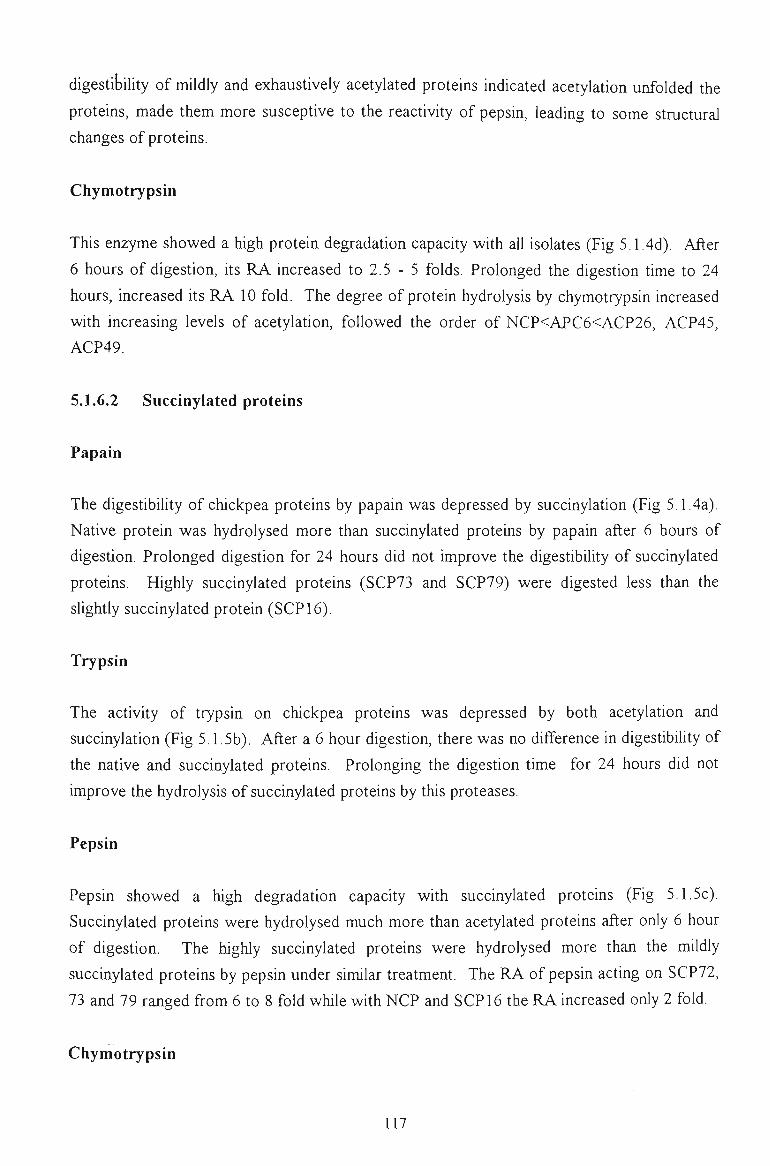
digestibility of mildly and exhaustively acetylated proteins indicated acetylation unfolded the
proteins, made them more susceptive to the reactivity of pepsin, leading to some structural
changes of proteins.
Chymotrypsin
This enzyme showed a high protein degradation capacity with all isolates (Fig 5.1.4d). After
6 hours of digestion, its RA increased to 2.5 - 5 folds. Prolonged the digestion time to 24
hours, increased Us RA 10 fold. The degree of protein hydrolysis by chymotrypsin mcreased
with increasing levels of acetylation, foUowed the order of NCP<APC6<ACP26, ACP45,
ACP49.
5.1.6.2 Succinylated proteins
Papain
The digestibility of chickpea proteins by papain was depressed by succinylation (Fig 5.1.4a),
Native protein was hydrolysed more than succinylated proteins by papain after 6 hours of
digestion. Prolonged digestion for 24 hours did not improve the digestibility of succinylated
proteins. Highly succinylated proteins (SCP73 and SCP79) were digested less than the
slightly succinylated protein (SCP 16).
Trypsin
The activity of trypsin on chickpea proteins was depressed by both acetylation and
succinylation (Fig 5.1.5b). After a 6 hour digestion, there was no difference in digestibUity of
the native and succinylated proteins. Prolonging the digestion time for 24 hours did not
improve the hydrolysis of succinylated proteins by this proteases.
Pepsin
Pepsin showed a high degradation capacity with succinylated proteins (Fig 5.1.5c).
Succinylated proteins were hydrolysed much more than acetylated proteins after only 6 hour
of digestion. The highly succinylated proteins were hydrolysed more than the mildly
succinylated proteins by pepsin under similar treatment. The RA of pepsin acting on SCP72,
73 and 79 ranged from 6 to 8 fold while with NCP and SCP 16 the RA increased only 2 fold.
Chymotrypsin
117
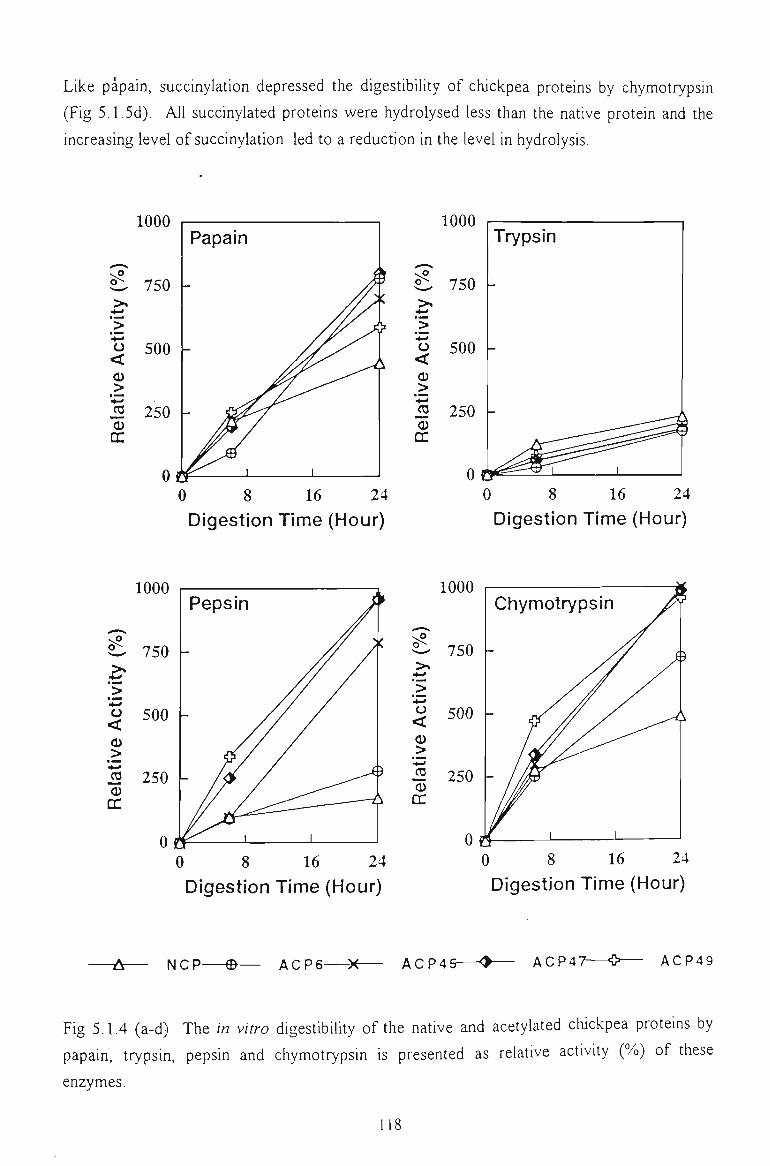
Like papain, succinylation depressed the digestibility of chickpea proteins by chymotrypsin
(Fig 5.1.5d). All succinylated proteins were hydrolysed less than the native protein and the
increasing level of succinylation led to a reduction in the level in hydrolysis.
„.. ^ o^ >>
4-«
> H ^
o < o >
••- '
(0 a> CC
A U U U
750
500
250
oJ
Papain
^ ^ 1 1
0 8 16 24
Digestion Time (Hour)
_
> . 4-"
> ^-> o < (1) >
^ - l
ro o CL
750
500
250
0 ^
Trypsin
-
—
i
y i ^ 1
0 8 16 24
Digestion Time (Hour)
,..^
sS ^ >
i * - "
o < 0) >
• - «
ro (1) CC
J.UUU
750
500
250
Of"
Pepsin f
— yy /
4 ^ 1 1
1000
0 8 16 24
Digestion Time (Hour)
l> O < >
_ro
CC
0 8 16 24 Digestion Time (Hour)
-b. NCP © ACP6 X ACP45- ACP47 * ACP49
Fig 5.1.4 (a-d) The in vitro digestibility of the native and acetylated chickpea proteins by
papain, trypsin, pepsin and chymotrypsin is presented as relative activity (%) of these
enzymes.
118
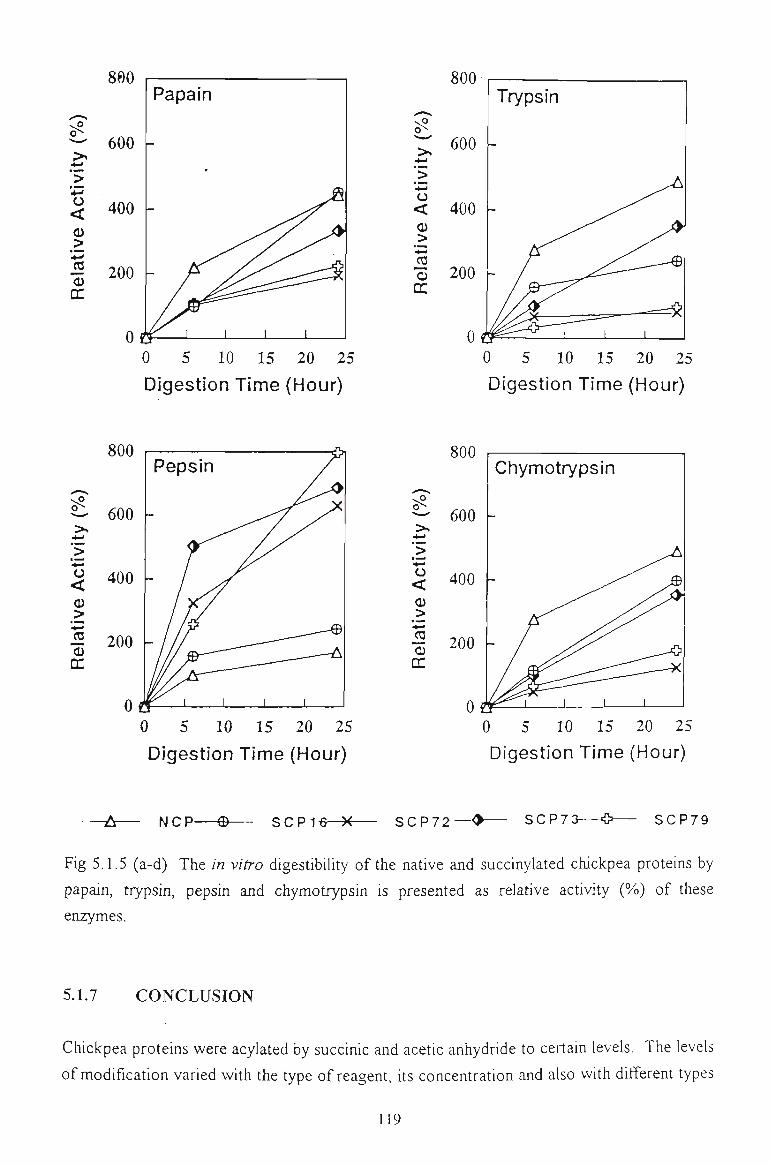
>
o <
<D >
o CC
800
600 -
400
•r 200 -
0 5 10 15 20 25
Digestion Time (Hour)
|>
O < Ci > _ro 0)
0 5 10 15 20 25
Digestion Time (Hour)
800
">
O <
>
•^ 200 _ro o
CC
800
0 5 10 15 20 25
Digestion Time (Hour)
2-. > .
'>
o <
>
_ro
cn
0 5 10 15 20 25
Digestion Time (Hour)
NCP—®- SCP1€—><- SCP72 • SCP73 O- S C P 7 9
Fig 5.1.5 (a-d) The in vitro digestibility of the native and succinylated chickpea proteins by
papain, trypsin, pepsin and chymotrypsin is presented as relative activity (%) of these
enzymes.
5.1.7 CONCLUSION
Chickpea proteins were acylated by succinic and acetic anhydride to certain levels. The levels
of modification varied with the type of reagent. Us concentration and also wUh different types
of prof eins involved in the system. The lysines were slightly reduced but the proportion of
essential amino acids of acylated proteins was unchanged and still met the required nutrition
level for children and adults. Acylation did not significantly alter the gel filtration profile of
the modified proteins but the SDS-PAGE patterns showed their electrophoretic mobility was
retarded. Densitometric scanning of SDS-PAGE confirmed some structural changes
occurred in chickpea proteins due to protein aggregations. Acetylation improved the in vitro
digestibUity of the modified proteins by papain, pepsin and chymotrypsin while succinylation
orUy improved the modified protein hydrolysis of pepsin.
5.2 FUNCTIONAL PROPERTIES OF ACETYLATED CHICKPEA PROTEINS
In previous Section (5.1) the effects of acetylation on the characteristics of chickpea proteins
have been described. This chemical modification resulted in several changes in the structure
and composition of the modified proteins as reflected in their amino acid composition, in vitro
digestibility, gel fiUration and SDS-PAGE patterns. A structural modification normally lead
to some changes in the functional properties of a protein.
Functional properties of proteins such as solubility, emulsifying and rheological properties can
be chemically or enzymatically modified (Campbell et al, 1992; Hamada, 1992; Lahl and
Braun, 1994). Enzymatic modification could improve functional properties of proteins but
bitter peptides could also be formed from extensive protein hydrolysis (Shiraishi et al, 1973;
Aral et al, 1975). Of various chemical approaches, acetylation has been the most widely
employed to alter functional properties of food proteins by introducing acetyl groups into the
protein.
Acetylation improved the solubility of winged bean (Narayana and Narasinga Rao, 1984),
glandless cottonseed flour (Childs and Park, 1976), soy (Franzen and KinseUa, 1976a), leaf
protein (Franzen and Kinsella, 1976b), arachin (Shyama Sunda and Rajagopal Rao, 1982)
rapeseed (Gwiazda et al, 1989) and castor bean pomace protein (Yoon, 1980). Acetylation
also improved water absorption and oU adsorption of winged bean, field pea, soy and
rapeseed proteins. Emulsifying capacity and stabUity of glycinin (Kim and Rhee, 1990), faba
bean (Muschiolik, 1989) and arachin (Shyama Sundar and Rajagopal Rao, 1982) were
improved by acetylation.
These improvements were attributed to the conformational changes in these protein
molecules. The conformational changes and subsequent changes in functionality of these
120
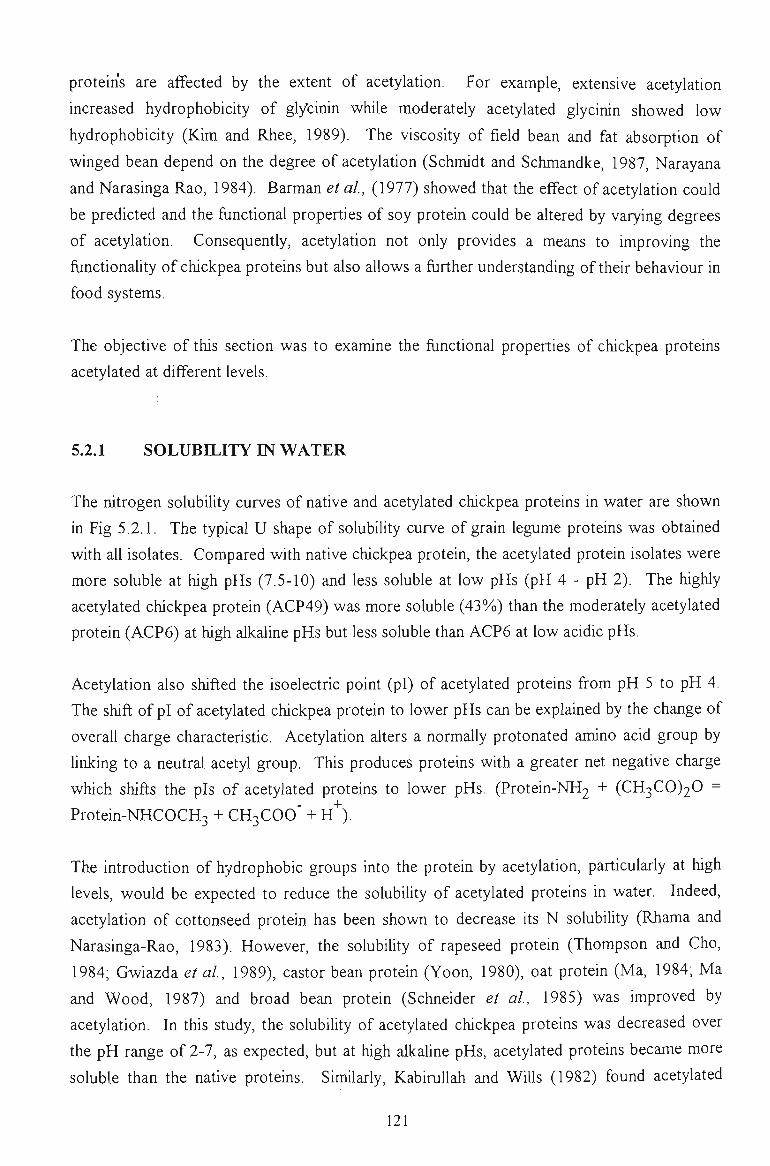
proteins are affected by the extent of acetylation. For example, extensive acetylation
increased hydrophobicity of glycinin while moderately acetylated glycinin showed low
hydrophobicity (Kim and Rhee, 1989). The viscosity of field bean and fat absorption of
winged bean depend on the degree of acetylation (Schmidt and Schmandke, 1987, Narayana
and Narasinga Rao, 1984). Barman et al, (1977) showed that the effect of acetylation could
be predicted and the functional properties of soy protein could be altered by varying degrees
of acetylation. Consequently, acetylation not only provides a means to improving the
functionality of chickpea proteins but also aUows a further understanding of their behaviour in
food systems.
The objective of this section was to examine the functional properties of chickpea proteins
acetylated at different levels.
5.2.1 SOLUBILITY IN WATER
The lUtrogen solubility curves of native and acetylated chickpea proteins in water are shown
in Fig 5.2.1. The typical U shape of solubility curve of grain legume proteins was obtained
with all isolates. Compared with native chickpea protein, the acetylated protein isolates were
more soluble at high pHs (7.5-10) and less soluble at low pHs (pH 4 - pH 2). The highly
acetylated chickpea protein (ACP49) was more soluble (43%)) than the moderately acetylated
protein (ACP6) at high alkaline pHs but less soluble than ACP6 at low acidic pHs.
Acetylation also shifted the isoelectric point (pi) of acetylated proteins from pH 5 to pH 4.
The shift of pi of acetylated chickpea protein to lower pHs can be explained by the change of
overall charge characteristic. Acetylation alters a normally protonated amino acid group by
linking to a neutral acetyl group. This produces proteins wUh a greater net negative charge
which shifts the pis of acetylated proteins to lower pHs. (Protein-NH2 + (CH3CO)20 =
Protein-NHCOCHg + CH3COO" + H^),
The introduction of hydrophobic groups into the protein by acetylation, particularly at high
levels, would be expected to reduce the solubility of acetylated proteins in water. Indeed,
acetylation of cottonseed protein has been shown to decrease its N solubility (Rhama and
Narasinga-Rao, 1983). However, the solubUity of rapeseed protein (Thompson and Cho,
1984; Gwiazda et al, 1989), castor bean protein (Yoon, 1980), oat protein (Ma, 1984; Ma
and Wood, 1987) and broad bean protein (Schneider et al, 1985) was improved by
acetylation. In this study, the solubUity of acetylated chickpea proteins was decreased over
the pH range of 2-7, as expected, but at high alkaline pHs, acetylated proteins became more
soluble than the native proteins. Similarly, KabiruUah and Wills (1982) found acetylated
121
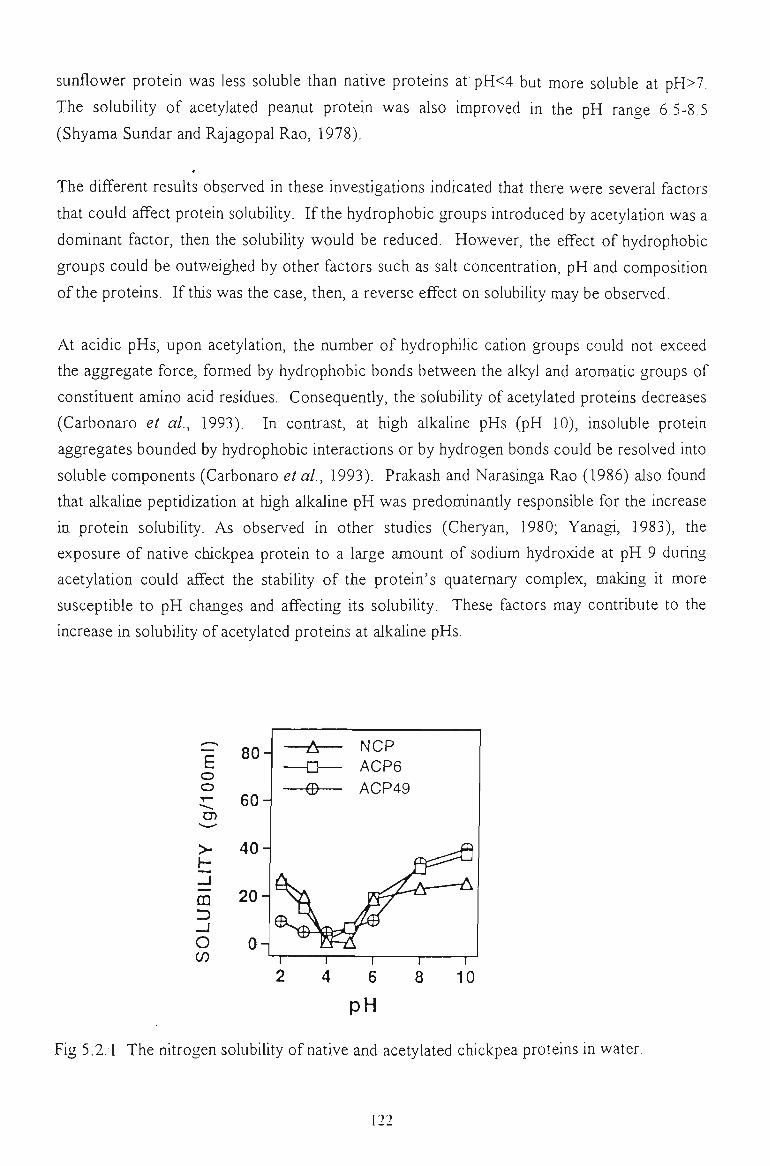
sunflower protein was less soluble than native proteins at' pH<4 but more soluble at pH>7.
The solubility of acetylated peanut protein was also improved in the pH range 6.5-8.5
(Shyama Sundar and Rajagopal Rao, 1978).
The different results observed in these investigations indicated that there were several factors
that could affect protein solubUity. If the hydrophobic groups introduced by acetylation was a
dominant factor, then the solubility would be reduced. However, the effect of hydrophobic
groups could be outv/eighed by other factors such as saU concentration, pH and composUion
of the proteins. If this was the case, then, a reverse effect on solubUity may be observed.
At acidic pHs, upon acetylation, the number of hydrophilic cation groups could not exceed
the aggregate force, formed by hydrophobic bonds between the alkyl and aromatic groups of
constituent amino acid residues. Consequently, the solubility of acetylated proteins decreases
(Carbonaro et al, 1993). In contrast, at high alkaline pHs (pH 10), insoluble protein
aggregates bounded by hydrophobic interactions or by hydrogen bonds could be resolved into
soluble components (Carbonaro et al, 1993). Prakash and Narasinga Rao (1986) also found
that alkaline peptidization at high alkaline pH was predominantly responsible for the increase
in protein solubility. As observed in other studies (Cheryan, 1980; Yanagi, 1983), the
exposure of native chickpea protein to a large amount of sodium hydroxide at pH 9 during
acetylation could affect the stability of the protein's quaternary complex, making U more
susceptible to pH changes and affecting Us solubiUty. These factors may contribute to the
increase in solubility of acetylated proteins at alkaline pHs.
E o o
m
o 05
pH
Fig 5.2.1 The nitrogen solubiUty of native and acetylated chickpea proteins in water.
122
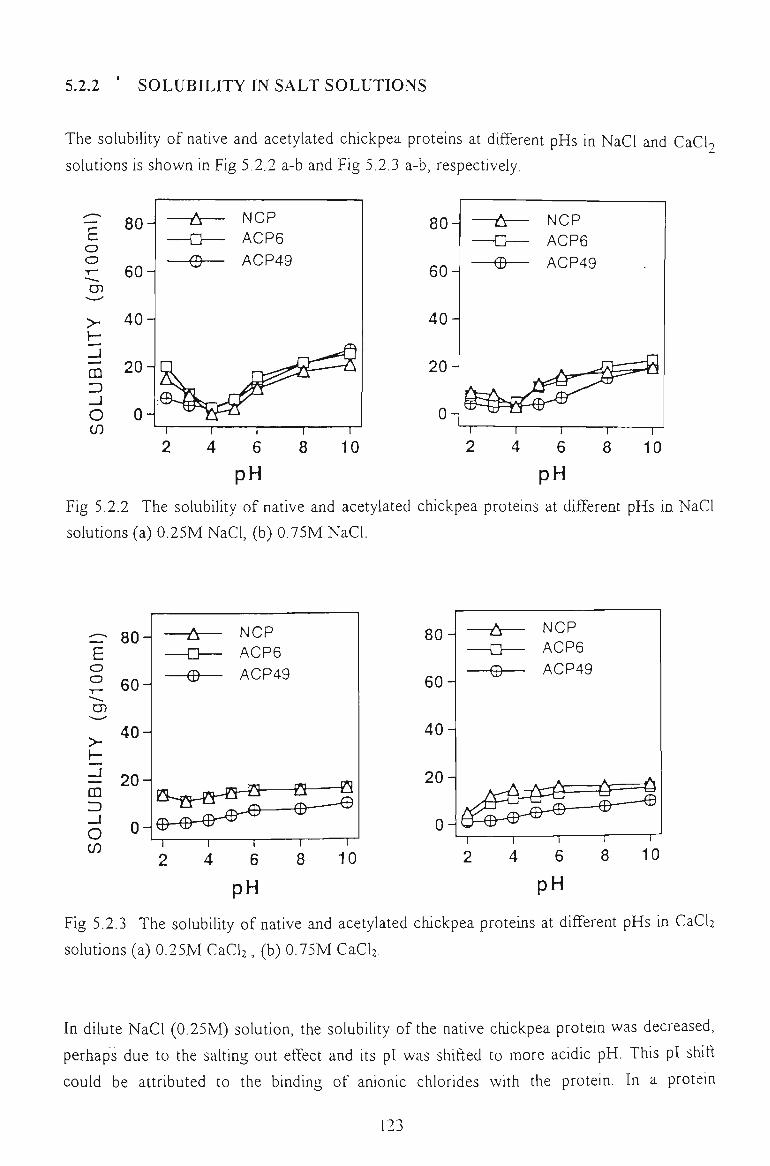
5.2.2 ' SOLUBILITY IN SALT SOLUTIONS
The solubUity of native and acetylated chickpea proteins at different pHs in NaCl and CaCl9
solutions is shown in Fig 5.2.2 a-b and Fig 5.2.3 a-b, respectively.
8 0 -
6 0 -
4 0 -
2 0 -
PH
Fig 5.2.2 The solubility of native and acetylated chickpea proteins at different pHs in NaCl
solutions (a) 0.25M NaCl, (b) 0.75M NaCl.
• - ~ -
E o o *"«.. O)
^~—'
> h-_J
m Z3 _J o (/)
80-
60-
40-
20-
0-
Fig 5.2.3 The solubility of native and acetylated chickpea proteins at different pHs in CaCb
solutions (a) 0.25M CaCb , (b) 0.75M CaCb.
In dilute NaCl (0.25M) solution, the solubility of the native chickpea protein was decreased,
perhaps due to the salting out effect and Us pl was shifted to more acidic pH. This pl shift
could be attributed to the binding of anionic chlorides with the protein. In a protein
[23
dispersion, inorganic anions due to their smaller hydrated radii could attain a closer proximity
to the protein molecule and bind to proteins more strongly than the inorgaiUc cations.
Consequently, wUh the addition of NaCl and the binding of the chloride aiuons, the negative
charge of the protein at the original isoelectric point would increase. More acid is therefore
required to estabUsh a new pi which is located at a more acidic pH (Paulson and Tung, 1987;
Schut, 1976).
Acetylated chickpea proteins were more soluble than the native protein at pHs above the pi
but less soluble at pHs below the pi. The decrease in solubility at pHs below the pi could be
due to a combined effect of increased net negative charge due to acetylation, resulting in the
formation of more rigid protein complexes together with the competition with NaCl for the
water in the system. The highly acetylated chickpea protein (ACP49) could have less net
negative charge, making it possible for increasing the amount of insoluble protein complexes
and leading to lower solubility, compared with the moderately acetylated protein (ACP6).
The increase in solubility at alkaline pHs, once again could be a combined effect of several
factors. At high alkaUne pHs, it is likely that more anionic chlorides are bound to the protein
rather than Na" cations, resulting in an increase in the net negative charge and hence solubility
(Hamm, 1975, Gillberg and Toernell, 1976).
The effect of increasing salt concentration (0.75M) on protein solubility was more
pronounced with acetylated than native proteins. In more concentrated NaCl (0.75M)
solutions, the solubUity of all proteins decreased. In a study of the effect of salt at several
pHs on the solubility of soy protein isolates. Van Megen (1974) found that under certain saU
contents, the solubility of the proteins appeared to be independent of salt concentration but in
fact at high salt concentrations, saUing out might occur. Since there were small fixed,
charged sites to which ions could bind selectively and strongly, this type of salt binding was
the most extensive at low levels of salt addition. The effect of anionic chlorides at high saU
concentrations was not profound. In contrast, Na"" cations may also bind with protein,
neutralise some negatively charged groups and reduce the net negative charge of the protein,
resulting in a decrease of protein solubUity.
Regardless of the salt concentration, the addition of CaCl2 greatly changed and reduced the
solubility of both native and acetylated proteins. The typical U shape of the protein solubility
curve was replaced by an almost linear Une for native chickpea protein in 0.25M CaCl2
solution. This, was due to an increase in solubility in the pi region and a decrease at alkaUne
pHs. In the study of solubUity of rapeseed protein, Gillberg (1978) found that at high pHs,
Ca "" cations had a higher tendency than Na' cations to bind with carboxyl groups in the
protein. This reduced the net negative charge and, under some circumstances, created the
most favourable conditions for the formation of insoluble complexes. However, at pHs close
124
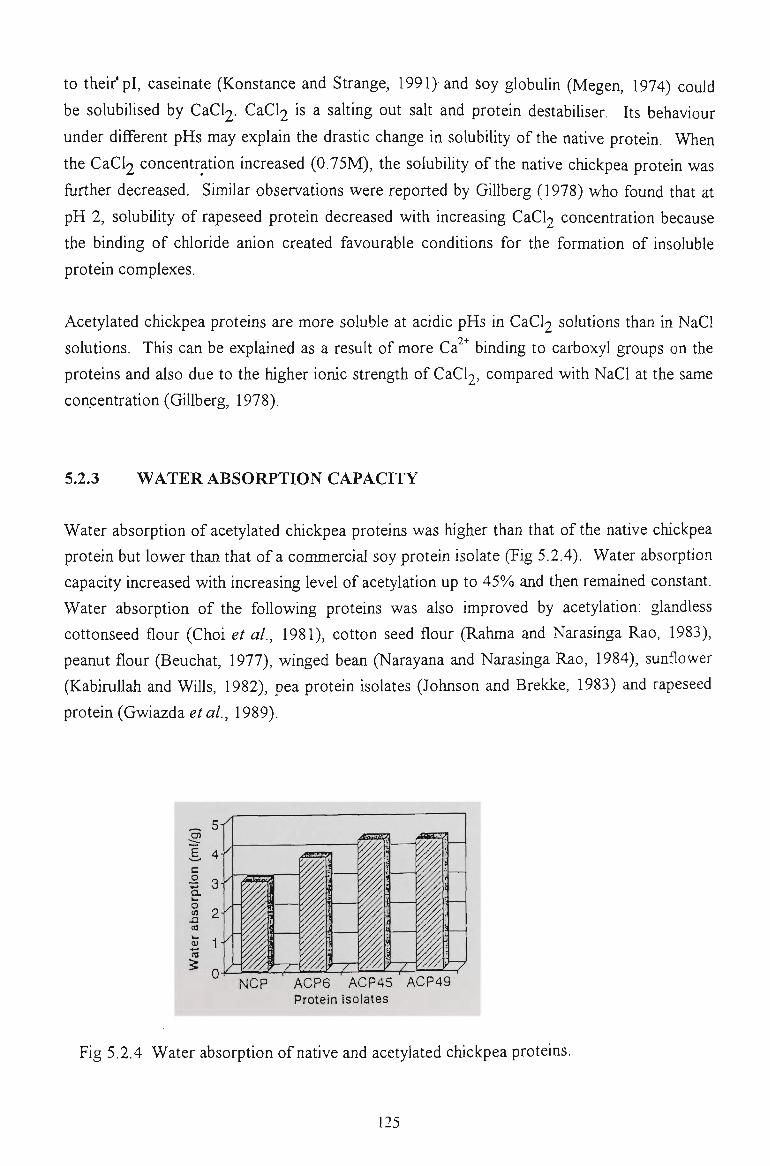
to their'pi, caseinate (Konstance and Strange, 1991) and Soy globulin (Megen, 1974) could
be solubilised by CaCl2. CaCl2 is a salting out salt and protein destabiliser. Its behaviour
under different pHs may explain the drastic change in solubility of the native protein. When
the CaCl2 concentration increased (0.75M), the solubility of the native chickpea protein was
further decreased. Similar observations were reported by Gillberg (1978) who found that at
pH 2, solubility of rapeseed protein decreased with increasing CaCl2 concentration because
the binding of chloride anion created favourable conditions for the formation of insoluble
protein complexes.
Acetylated chickpea proteins are more soluble at acidic pHs in CaCl2 solutions than in NaCl
solutions. This can be explained as a result of more Ca ^ binding to carboxyl groups on the
proteins and also due to the higher ioiuc strength of CaCl2, compared wUh NaCl at the same
concentration (Gillberg, 1978).
5.2.3 WATER ABSORPTION CAPACITY
Water absorption of acetylated chickpea proteins was higher than that of the native chickpea
protein but lower than that of a commercial soy protein isolate (Fig 5.2.4). Water absorption
capacity increased with increasing level of acetylation up to 45% and then remained constant.
Water absorption of the foUowing proteins was also improved by acetylation: glandless
cottonseed flour (Choi et al, 1981), cotton seed flour (Rahma and Narasinga Rao, 1983),
peanut flour (Beuchat, 1977), winged bean (Narayana and Narasinga Rao, 1984), sunflower
(KabiruUah and WiUs, 1982), pea protein isolates (Johnson and Brekke, 1983) and rapeseed
protein (Gwiazda et al, 1989).
cn
1 c: o
o to
S 1 - /
22Sr?
I
.ifirrm
^
" K " " ^ , / * i^23
:z: NCP ACP6 ACP45 ACP49 Protein Isolates
Fig 5.2.4 Water absorption of native and acetylated chickpea proteins.
125
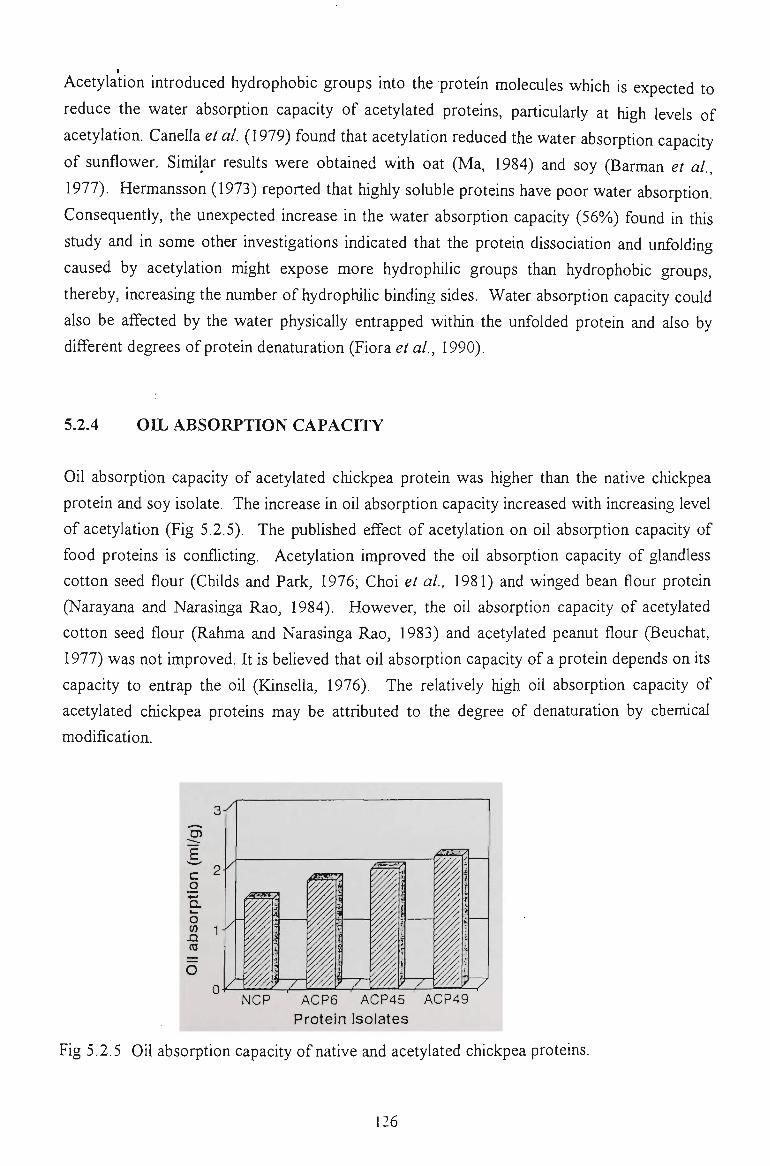
f
Acetylation introduced hydrophobic groups into the protein molecules which is expected to
reduce the water absorption capacity of acetylated proteins, particulariy at high levels of
acetylation. Canella et al. (1979) found that acetylation reduced the water absorption capacity
of sunflower. Similar resuUs were obtained wUh oat (Ma, 1984) and soy (Barman et al,
1977). Hermansson (1973) reported that highly soluble proteins have poor water absorption.
Consequently, the unexpected increase in the water absorption capacity (56%) found in this
study and in some other investigations indicated that the protein dissociation and unfolding
caused by acetylation might expose more hydrophilic groups than hydrophobic groups,
thereby, increasing the number of hydrophilic binding sides. Water absorption capacity could
also be affected by the water physically entrapped within the unfolded protein and also by
different degrees of protein denaturation (Flora et al, 1990).
5.2.4 OEL ABSORPTION CAPACITY
Oil absorption capacity of acetylated chickpea protein was higher than the native chickpea
protein and soy isolate. The increase in oil absorption capacity increased with increasing level
of acetylation (Fig 5.2.5). The published effect of acetylation on oU absorption capacity of
food proteins is conflicting. Acetylation improved the oil absorption capacity of glandless
cotton seed flour (Childs and Park, 1976; Choi et al, 1981) and winged bean flour protein
(Narayana and Narasinga Rao, 1984). However, the oil absorption capacity of acetylated
cotton seed flour (Rahma and Narasinga Rao, 1983) and acetylated peanut flour (Beuchat,
1977) was not improved. It is believed that oil absorption capacity of a protein depends on Us
capacity to entrap the oil (Kinsella, 1976). The relatively high oil absorption capacity of
acetylated chickpea proteins may be attributed to the degree of denaturation by chemical
modification.
NCP ACP6 ACP45 ACP49 Protein isolates
Fig 5.2.5 Oil absorption capacity of native and acetylated chickpea proteins.
126
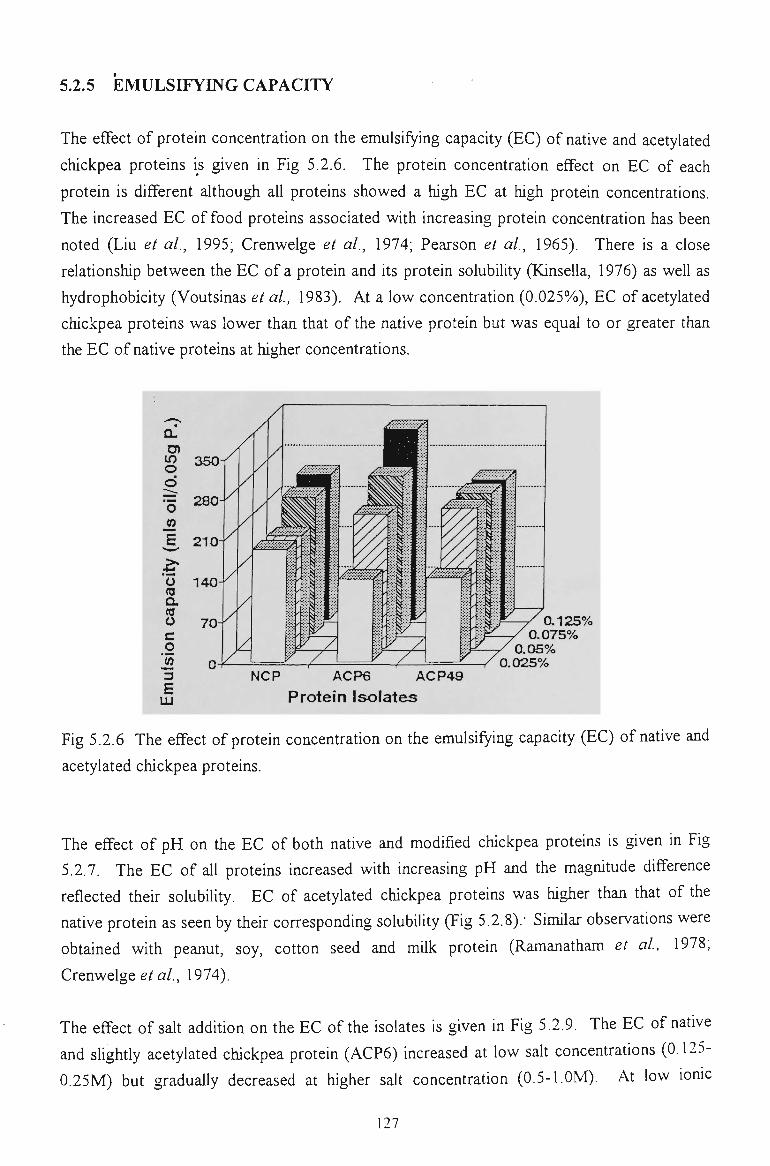
5.2.5 EMULSIFYEVG CAPACITY
The effect of protein concentration on the emulsifying capacity (EC) of native and acetylated
chickpea proteins is given in Fig 5.2.6. The protein concentration effect on EC of each
protein is different although all proteins showed a high EC at high protein concentrations.
The increased EC of food proteins associated with increasing protein concentration has been
noted (Liu et al, 1995; Crenwelge et al, 1974; Pearson et al, 1965). There is a close
relationship between the EC of a protein and its protein solubUity (Kinsella, 1976) as weU as
hydrophobicity (Voutsinas et al, 1983). At a low concentration (0.025%), EC of acetylated
chickpea proteins was lower than that of the native protein but was equal to or greater than
the EC of native proteins at higher concentrations.
j2
£ LU
a 125% 0.075%
0.05% 0.025%
NCP ACP6 ACP49
Protein Isolates
Fig 5.2.6 The effect of protein concentration on the emulsifying capacity (EC) of native and
acetylated chickpea proteins.
The effect of pH on the EC of both native and modified chickpea proteins is given in Fig
5.2.7. The EC of all proteins increased with increasing pH and the magnitude difference
reflected their solubility. EC of acetylated chickpea proteins was higher than that of the
native protein as seen by their corresponding solubility (Fig 5.2.8).' SimUar observations were
obtained with peanut, soy, cotton seed and mUk protein (Ramanatham et al, 1978;
Crenwelge e/a/., 1974).
The effect of salt addition on the EC of the isolates is given in Fig 5,2.9. The EC of native
and slightly acetylated chickpea protein (ACP6) increased at low salt concentrations (0.125-
0.25M) but gradually decreased at higher salt concentration (0.5-l.OM). At low ionic
127
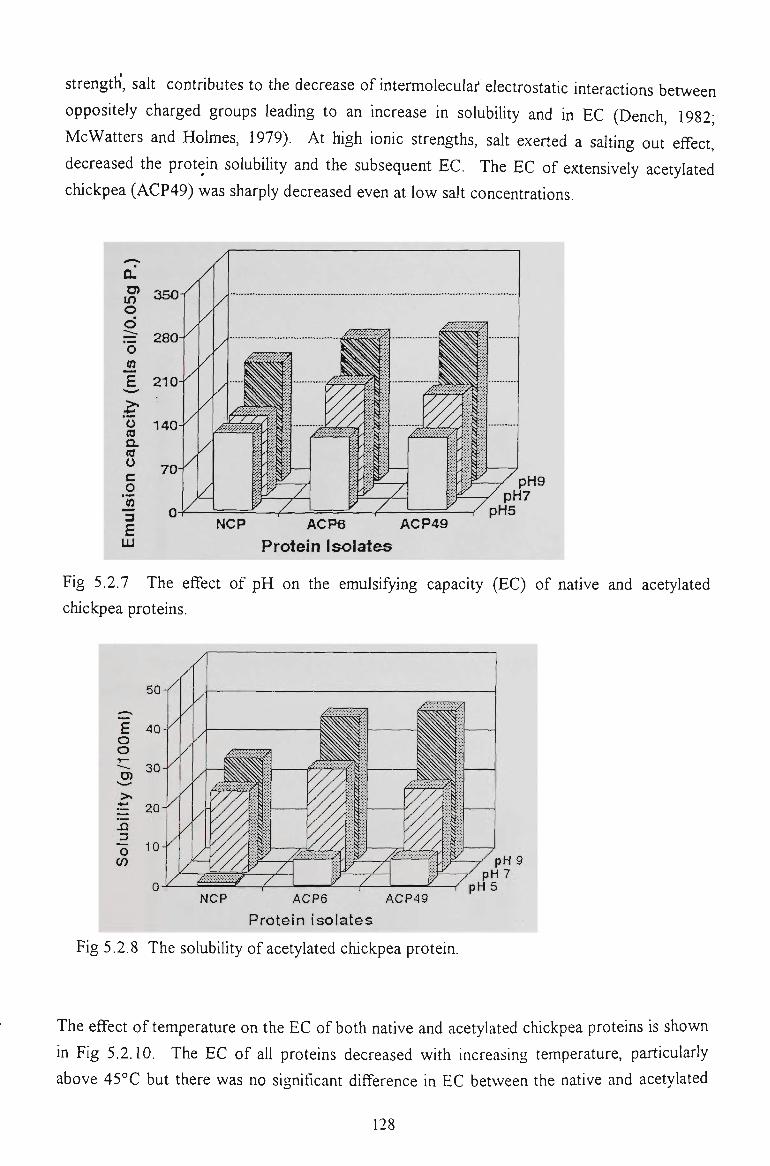
strength, salt contributes to the decrease of intermoleculai* electrostatic interactions between
opposUely charged groups leading to an increase in solubility and in EC (Dench, 1982;
McWatiers and Holmes, 1979). At high ionic strengths, salt exerted a salting out effect,
decreased the protein solubiUty and the subsequent EC. The EC of extensively acetylated
chickpea (ACP49) was sharply decreased even at low salt concentrations.
350 U) If) o d := 2 8 0 O
E
o Q . CO o c _o
'3. E
LU
210
140
NCP ACP6 ACP49
Protein Isolates
Fig 5.2.7 The effect of pH on the emulsifying capacity (EC) of native and acetylated
chickpea proteins.
50
40
30
E o o
Q)
>. ~ 20
3 o 10
/m:
m
_iSS r: NCP ACP6 ACP49
Protein isolates
pH 5
Fig 5.2.8 The solubility of acetylated chickpea protein.
The effect of temperature on the EC of both native and acetylated chickpea proteins is shown
in Fig 5.2.10. The EC of aU proteins decreased with increasing temperature, particularly
above 45°C but there was no significant difference in EC between the native and acetylated
128
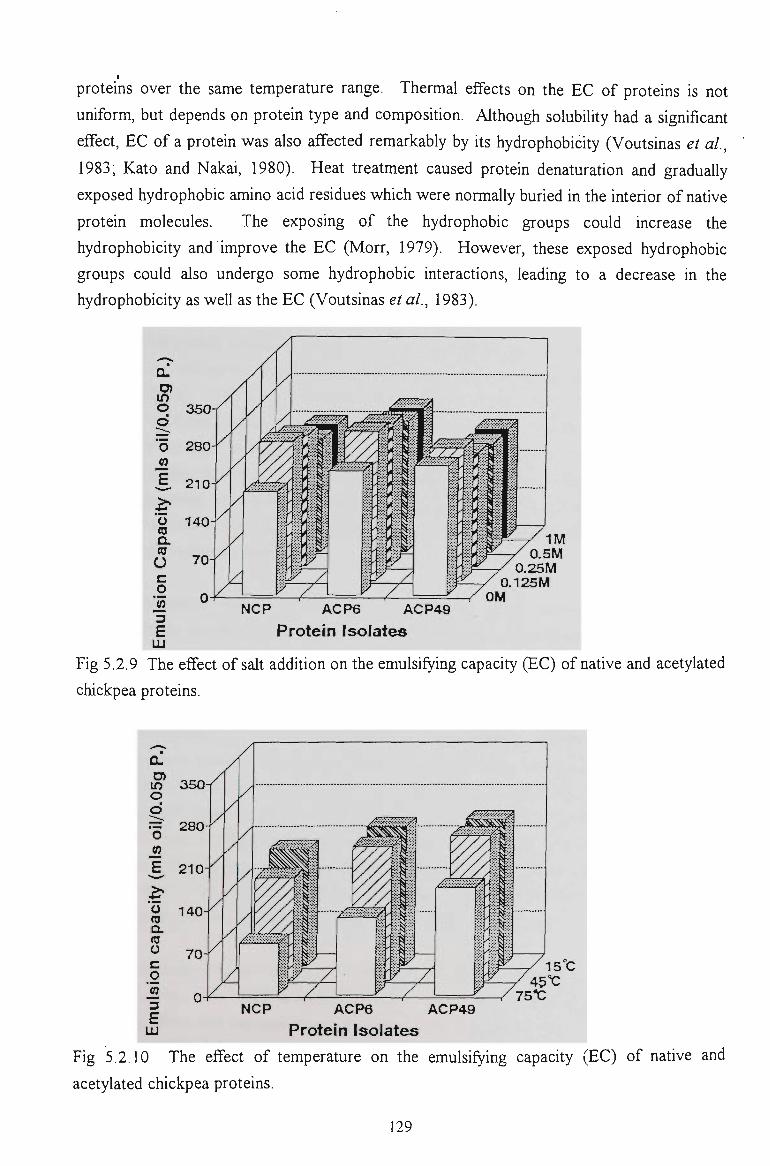
proteins over the same temperature range. Thermal effects on the EC of proteins is not
uniform, but depends on protein type and composition. Although solubility had a significant
effect, EC of a protein was also affected remarkably by Us hydrophobicity (Voutsinas et al,
1983; Kato and Nakai, 1980). Heat treatment caused protein denaturation and gradually
exposed hydrophobic amino acid residues which were normally buried in the interior of native
protein molecules. The exposing of the hydrophobic groups could increase the
hydrophobicity and improve the EC (Morr, 1979). However, these exposed hydrophobic
groups could also undergo some hydrophobic interactions, leading to a decrease in the
hydrophobicity as weU as the EC (Voutsinas et al, 1983).
o d "o
E
o a CI O c _o
is E
LLI
350
280
210
140 I M
0.5M 0.25M
NCP ACP6 ACP49
P r o t e i n I s o l a t e s
0.125M OM
Fig 5.2.9 The effect of salt addition on the emulsifying capacity (EC) of native and acetylated
chickpea proteins.
ACP6 ACP49
P r o t e i n I s o l a t e s
Fig 5.2.10 The effect of temperature on the emulsifying capacity (EC) of native and
acetylated chickpea proteins.
129
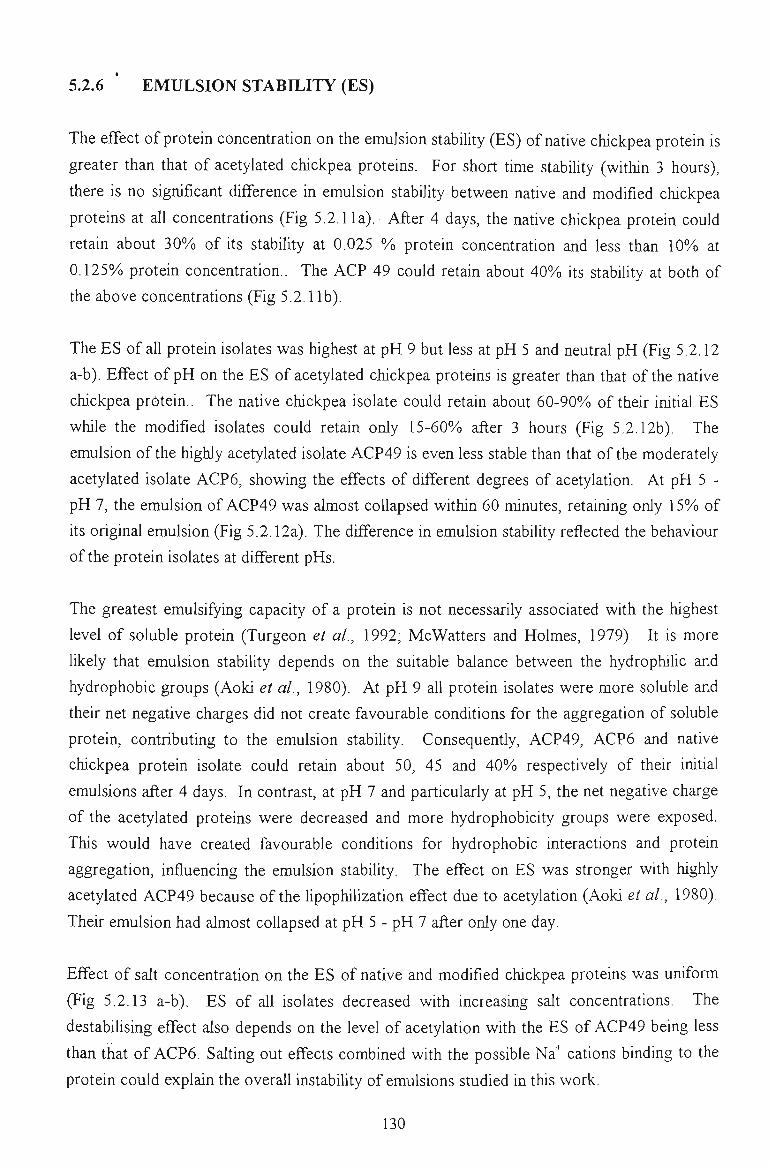
5.2.6 EMULSION STABILITY (ES)
The effect of protein concentration on the emulsion stability (ES) of native chickpea protein is
greater than that of acetylated chickpea proteins. For short time stability (within 3 hours),
there is no significant difference in emulsion stabUity between native and modified chickpea
proteins at all concentrations (Fig 5.2.11a). After 4 days, the native chickpea protein could
retain about 30%o of Us stability at 0.025 %» protein concentration and less than \0% at
0.125%) protein concentration.. The ACP 49 could retain about 40% Us stability at both of
the above concentrations (Fig 5.2.11b).
The ES of aU protein isolates was highest at pH 9 but less at pH 5 and neutral pH (Fig 5.2.12
a-b). Effect of pH on the ES of acetylated chickpea proteins is greater than that of the native
chickpea protein.. The native chickpea isolate could retain about 60-90% of their initial ES
while the modified isolates could retain oiUy 15-60% after 3 hours (Fig 5.2.12b). The
emulsion of the highly acetylated isolate ACP49 is even less stable than that of the moderately
acetylated isolate ACP6, showing the effects of different degrees of acetylation. At pH 5 -
pH 7, the emulsion of ACP49 was almost coUapsed within 60 minutes, retaining oiUy 15% of
Us original emulsion (Fig 5.2.12a). The difference in emulsion stability reflected the behaviour
of the protein isolates at different pHs.
The greatest emulsifying capacity of a protein is not necessarily associated with the highest
level of soluble protein (Turgeon et al, 1992; McWatters and Holmes, 1979). It is more
likely that emulsion stability depends on the suitable balance between the hydrophilic and
hydrophobic groups (Aoki et al, 1980). At pH 9 aU protein isolates were more soluble and
their net negative charges did not create favourable conditions for the aggregation of soluble
protein, contributing to the emulsion stability. Consequently, ACP49, ACP6 and native
chickpea protein isolate could retain about 50, 45 and 40%o respectively of their initial
emulsions after 4 days. In contrast, at pH 7 and particularly at pH 5, the net negative charge
of the acetylated proteins were decreased and more hydrophobicity groups were exposed.
This would have created favourable condUions for hydrophobic interactions and protein
aggregation, influencing the emulsion stability. The effect on ES was stronger with highly
acetylated ACP49 because of the lipophilization effect due to acetylation (Aoki et al, 1980).
Their emulsion had almost coUapsed at pH 5 - pH 7 after oiUy one day.
Effect of salt concentration on the ES of native and modified chickpea proteins was uiUform
(Fig 5.2.13 a-b). ES of all isolates decreased with increasing salt concentrations. The
destabiUsing effect also depends on the level of acetylation with the ES of ACP49 being less
than that of ACP6. Salting out effects combined with the possible Na"" cations binding to the
protein could explain the overall instability of emulsions studied in this work.
130
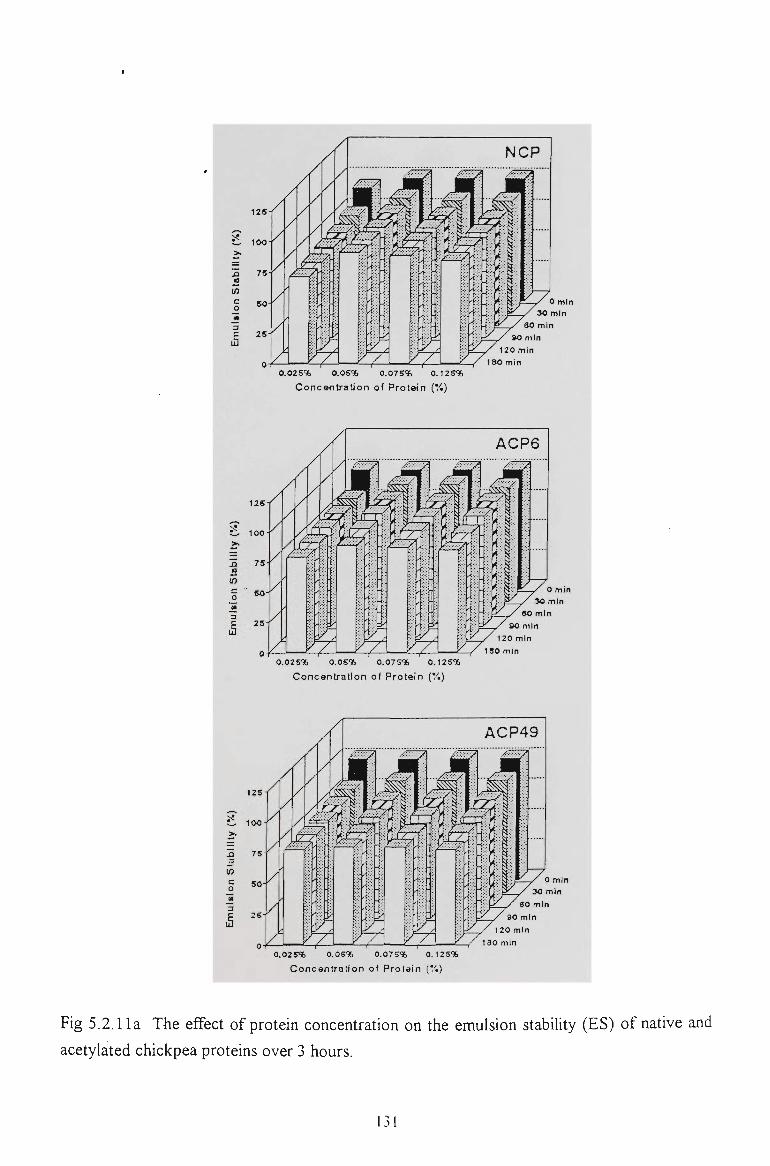
NCP
0.025% 0.05% 0.075% 0.125%
Concen t ra t ion of Pro te in (%)
ACP6
0.025% 0.05% 0,075% 0,125%
Concen t ra t ion of Pro te in ("/.)
ACP49
0.025% 0,05% 0.07S% 0.125%
Concen t ra t i on of Pro te in {'/.)
Fig 5.2.11a The effect of protein concentration on the emulsion stability (ES) of native and
acetylated chickpea proteins over 3 hours.
13i
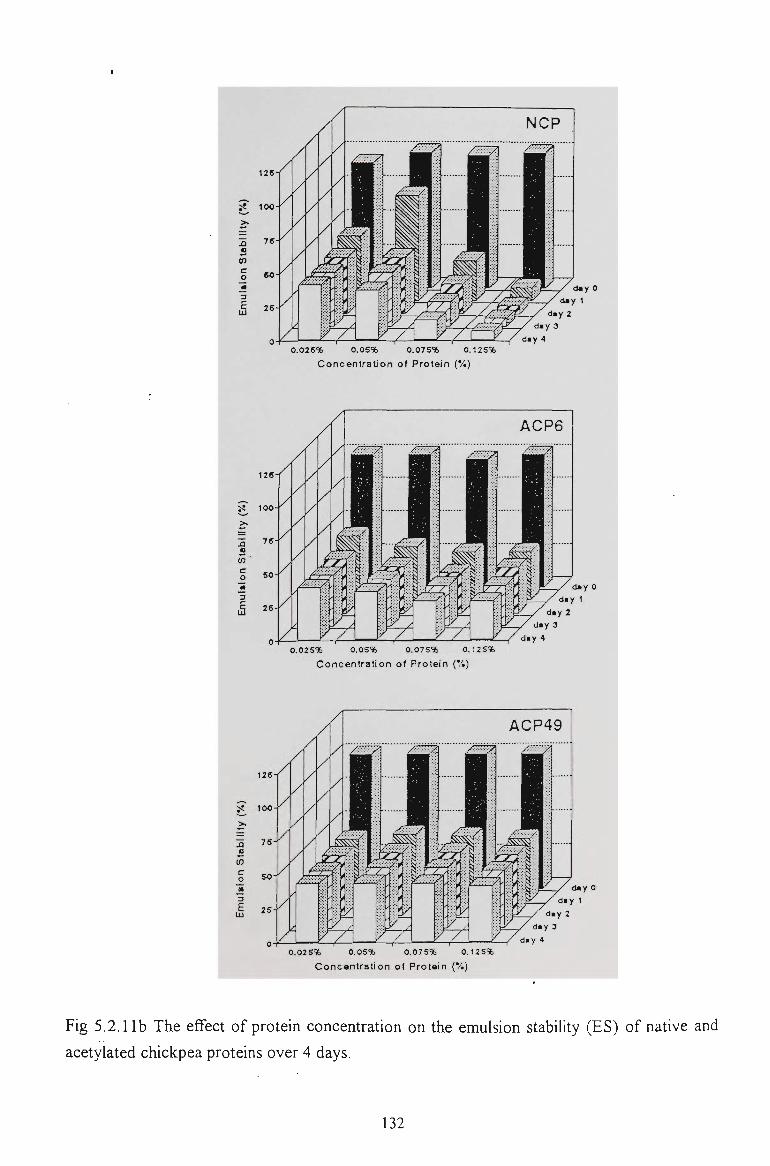
;« 100
to c
0 .025% 0 .05% 0,075% 0.125%
C o n c e n t r a t i o n o f P r o t e i n ('/.)
125
J3 S3
7) ' c o
0.025% 0.05% 0.075% 0.125%
C o n c e n t r a t i o n o f P r o t e i n ('/.)
12S
100
0 .025% 0,05% 0,075% 0,125%
C o n c e n t r a t i o n o f P r o t e i n (*/.)
Fig 5.2.1 lb The effect of protein concentration on the emulsion stability (ES) of native and
acetylated chickpea proteins over 4 days.
132
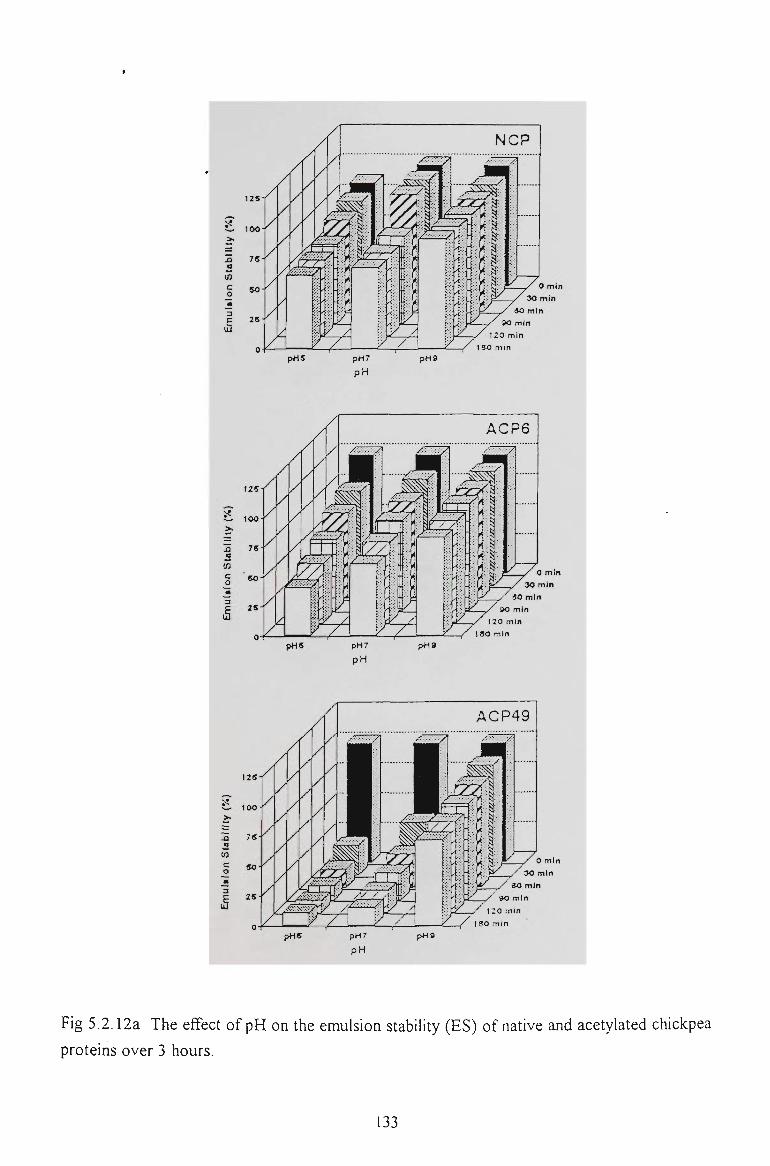
^ 100
tn c
3 U3
ACP6
c
Fig 5.2.12a The effect of pH on the emulsion stability (ES) of native and acetylated chickpea
proteins over 3 hours.
133
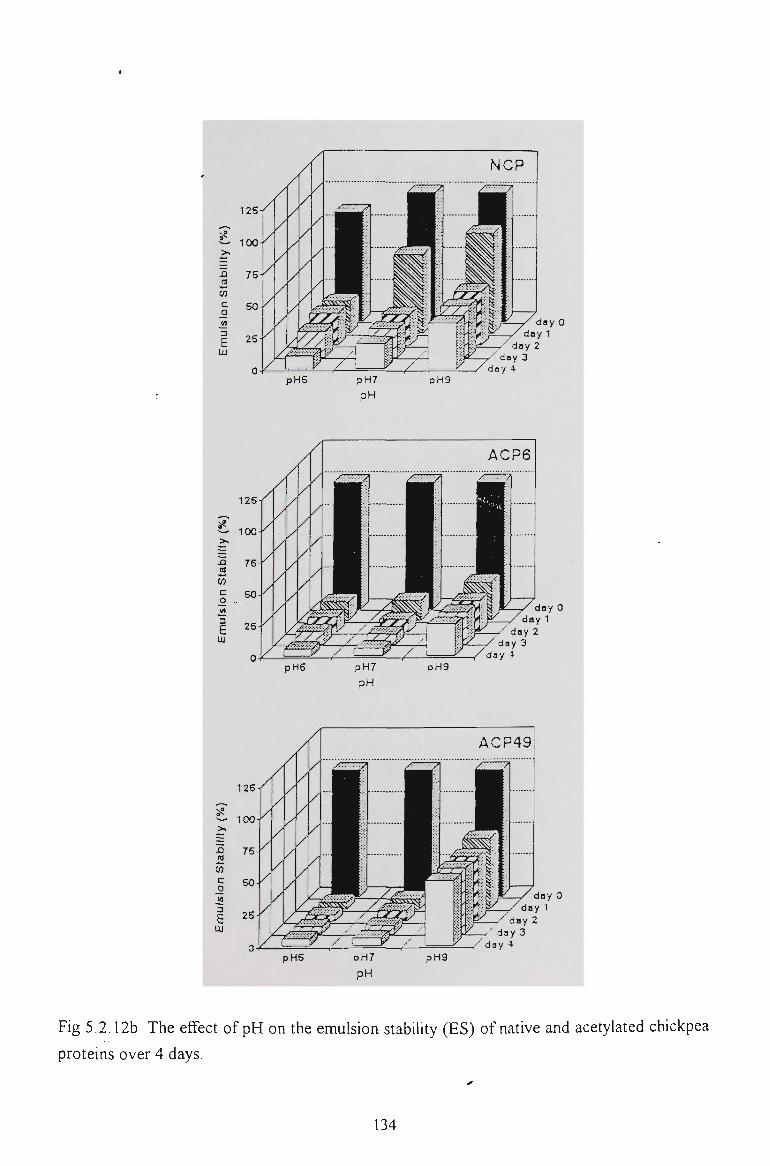
day 0
^
J3 M
CO C
:: E
LU
126
100
day 0
day 0 day 1
Fig 5.2.12b The effect of pH on the emulsion stability (ES) of native and acetylated chickpea
proteins over 4 days.
134
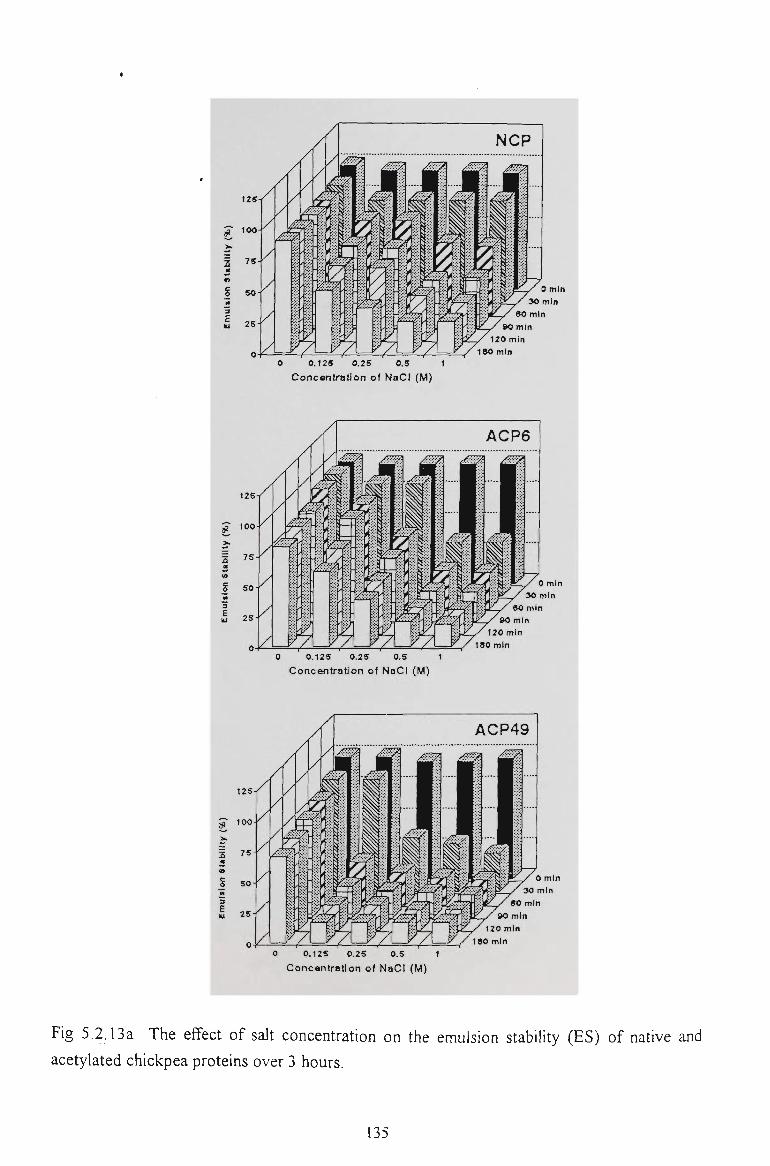
0 0.125 0.25 0,5 1
Concentration of NaCl (M)
126
§ 50
ACP6
0 0.125 0.25 0.5 1
Concentration of NaCI (M)
ACP49
0 0.125 0.25 0.5 1
Concantratlon of NaCI (M)
Fig 5.2.13a The effect of salt concentration on the emulsion stability (ES) of native and
acetylated chickpea proteins over 3 hours.
135
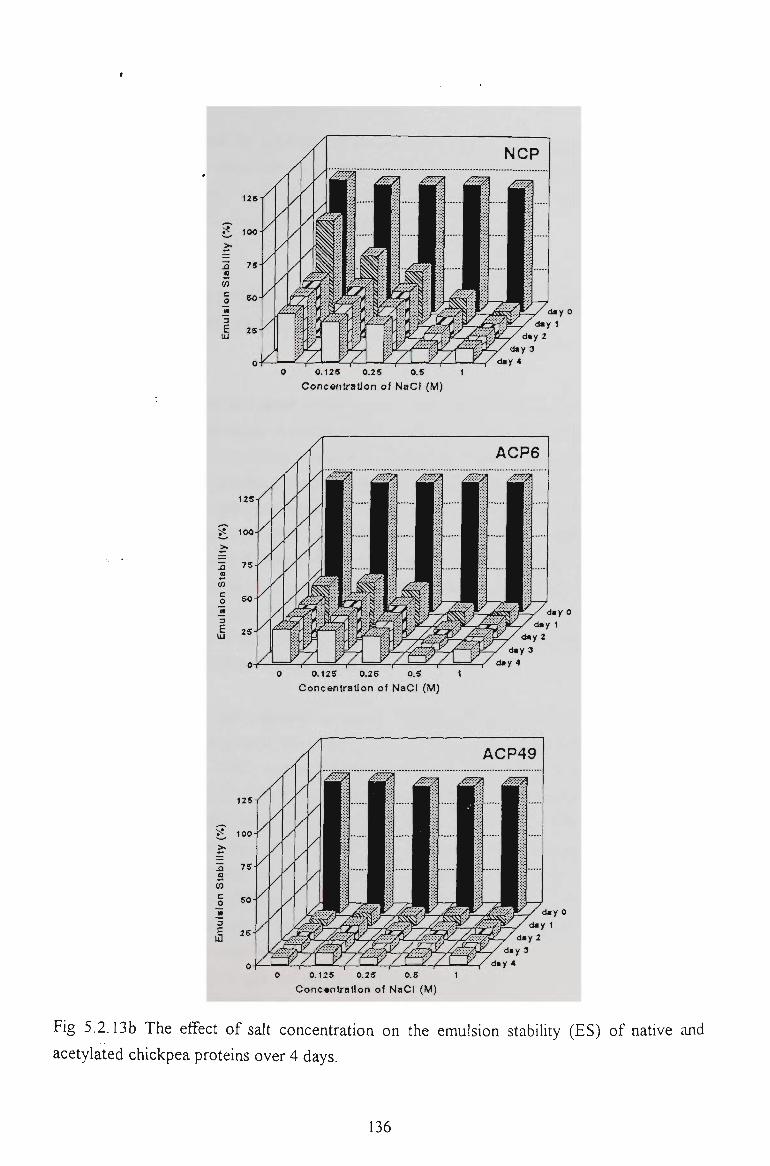
it t oo - ^
.a a
3 E
125
.a a U) c
125
100
0 0.126 0.25 O.S 1
Concentration of NaCI (M)
0 0.125 0.25 0.5 1
Concentration of NaCI (M)
O 0.125 0.25 0.5 1
Concentration of NaCI (M)
Fig 5.2.13b The effect of salt concentration on the emulsion stability (ES) of native and
acetylated chickpea proteins over 4 days.
136
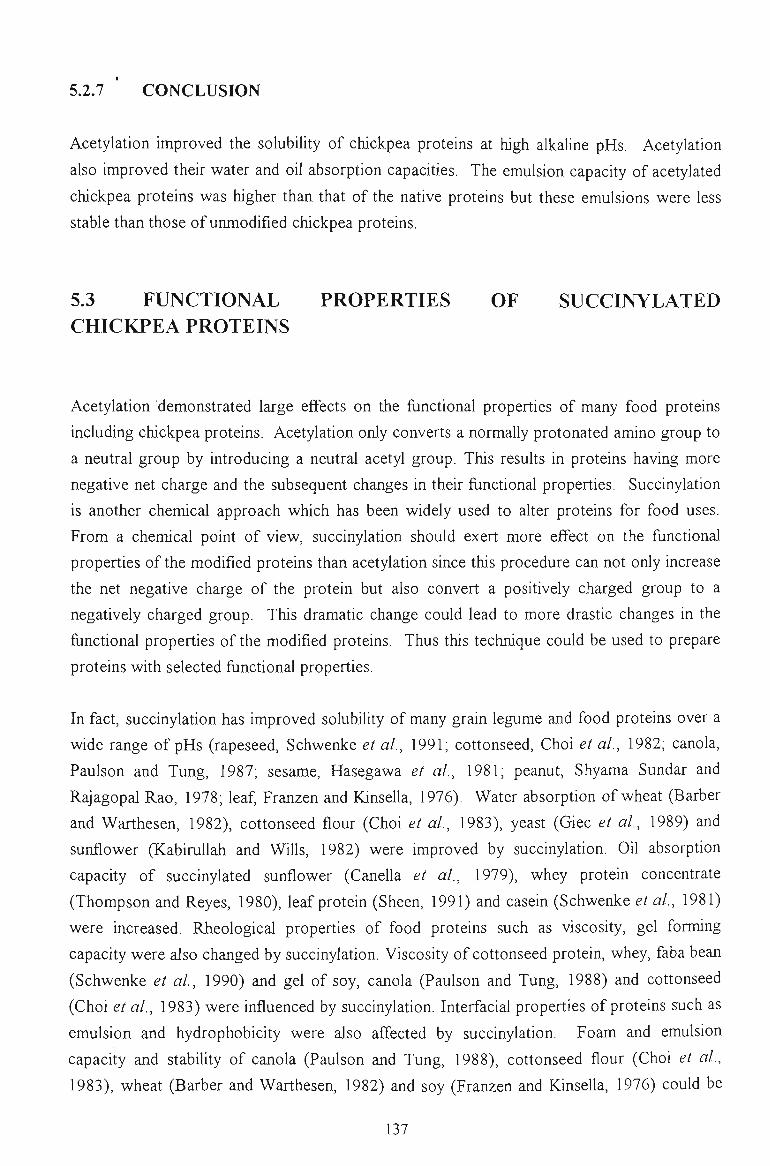
5.2.7 CONCLUSION
Acetylation improved the solubility of chickpea proteins at high alkaUne pHs. Acetylation
also improved their water and oil absorption capacities. The emulsion capacity of acetylated
chickpea proteins was higher than that of the native proteins but these emulsions were less
stable than those of unmodified chickpea proteins.
5.3 FUNCTIONAL PROPERTIES OF SUCCINYLATED CHICKPEA PROTEINS
Acetylation demonstrated large effects on the fimctional properties of many food proteins
including chickpea proteins. Acetylation only converts a normally protonated amino group to
a neutral group by introducing a neutral acetyl group. This results in proteins having more
negative net charge and the subsequent changes in their functional properties. Succinylation
is another chemical approach which has been widely used to alter proteins for food uses.
From a chemical point of view, succinylation should exert more effect on the fimctional
properties of the modified proteins than acetylation since this procedure can not only increase
the net negative charge of the protein but also convert a positively charged group to a
negatively charged group. This dramatic change could lead to more drastic changes in the
fimctional properties of the modified proteins. Thus this technique could be used to prepare
proteins with selected functional properties.
In fact, succinylation has improved solubility of many grain legume and food proteins over a
wide range of pHs (rapeseed, Schwenke et al, 1991; cottonseed, Choi et al, 1982; canola,
Paulson and Tung, 1987; sesame, Hasegawa et al, 1981; peanut, Shyama Sundar and
Rajagopal Rao, 1978; leaf, Franzen and Kinsella, 1976). Water absorption of wheat (Barber
and Warthesen, 1982), cottonseed flour (Choi et al, 1983), yeast (Giec et al, 1989) and
sunflower (KabiruUah and WiUs, 1982) were improved by succinylation. OU absorption
capacity of succinylated sunflower (CaneUa et al, 1979), whey protein concentrate
(Thompson and Reyes, 1980), leaf protein (Sheen, 1991) and casein (Schwenke et al, 1981)
were increased. Rheological properties of food proteins such as viscosity, gel forming
capacity were also changed by succinylation. Viscosity of cottonseed protein, whey, faba bean
(Schwenke et al, 1990) and gel of soy, canola (Paulson and Tung, 1988) and cottonseed
(Choi et al, 1983) were influenced by succinylation. Interfacial properties of proteins such as
emulsion and hydrophobicity were also affected by succinylation. Foam and emulsion
capacity and stability of canola (Paulson and Tung, 1988), cottonseed flour (Choi et al,
1983), wheat (Barber and Warthesen, 1982) and soy (Franzen and KinseUa, 1976) could be
137
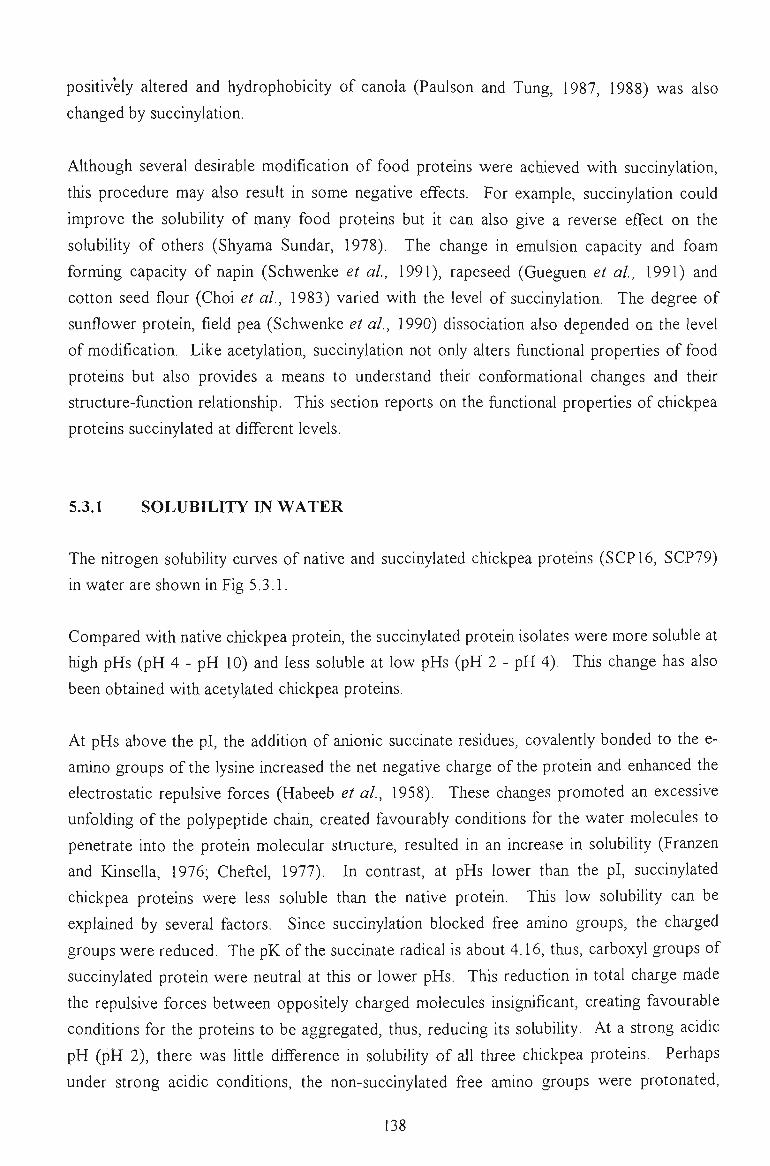
posUiv'ely aUered and hydrophobicity of canola (Paulson and Tung, 1987, 1988) was also
changed by succinylation.
Although several desirable modification of food proteins were achieved with succinylation,
this procedure may also result in some negative effects. For example, succUiylation could
improve the solubility of many food proteins but it can also give a reverse effect on the
solubility of others (Shyama Sundar, 1978). The change in emulsion capacity and foam
forming capacity of napin (SchwerUie et al, 1991), rapeseed (Gueguen et al, 1991) and
cotton seed flour (Choi et al, 1983) varied with the level of succinylation. The degree of
sunflower protein, field pea (Schwenke et al, 1990) dissociation also depended on the level
of modification. Like acetylation, succinylation not orUy alters functional properties of food
proteins but also provides a means to understand their conformational changes and their
structure-function relationship. This section reports on the fimctional properties of chickpea
proteins succinylated at different levels.
5.3.1 SOLUBILITY IN WATER
The rutrogen solubUity curves of native and succinylated chickpea proteins (SCP 16, SCP79)
in water are shown in Fig 5.3.1.
Compared with native chickpea protein, the succinylated protein isolates were more soluble at
high pHs (pH 4 - pH 10) and less soluble at low pHs (pH 2 - pH 4). This change has also
been obtained with acetylated chickpea proteins.
At pHs above the pl, the addition of anionic succinate residues, covalently bonded to the e-
amino groups of the lysine increased the net negative charge of the protein and enhanced the
electrostatic repulsive forces (Habeeb et al, 1958). These changes promoted an excessive
unfolding of the polypeptide chain, created favourably conditions for the water molecules to
penetrate into the protein molecular structure, resuUed in an increase in solubility (Franzen
and Kinsella, 1976; Cheftel, 1977). In contrast, at pHs lower than the pi, succinylated
chickpea proteins were less soluble than the native protein. This low solubility can be
explained by several factors. Since succinylation blocked free amino groups, the charged
groups were reduced. The pK of the succinate radical is about 4.16, thus, carboxyl groups of
succinylated protein were neutral at this or lower pHs. This reduction in total charge made
the repulsive forces between opposUely charged molecules insigruficant, creating favourable
conditions for the proteins to be aggregated, thus, reducing Us solubUity. At a strong acidic
pH (pH 2), there was little difference in solubility of all three chickpea proteins. Perhaps
under strong acidic condUions, the non-succinylated free amino groups were protonated,
138
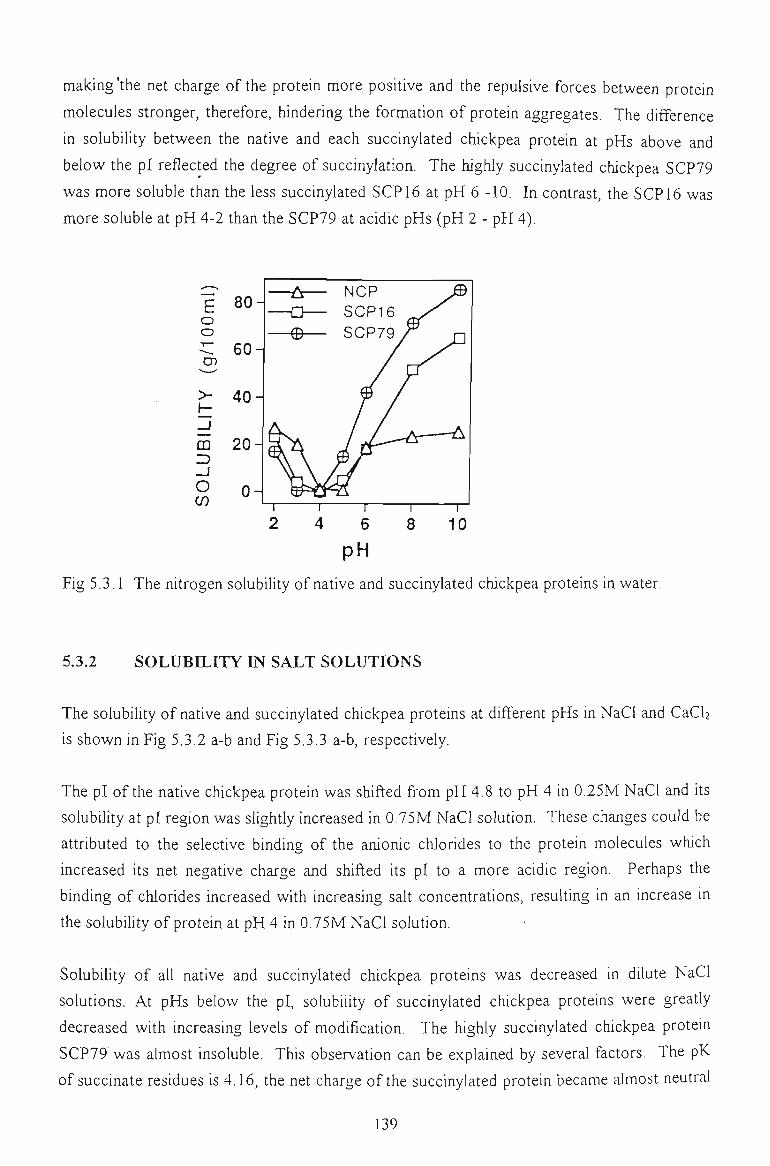
making 'the net charge of the protein more positive and the repulsive forces between protein
molecules stronger, therefore, hindering the formation of protein aggregates. The difference
in solubility between the native and each succinylated chickpea protein at pHs above and
below the pi reflected the degree of succinylation. The highly succinylated chickpea SCP79
was more soluble than the less succinylated SCP16 at pH 6 -10. In contrast, the SCP16 was
more soluble at pH 4-2 than the SCP79 at acidic pHs (pH 2 - pH 4).
pH
Fig 5.3.1 The nitrogen solubUity of native and succinylated chickpea proteins in water.
5.3.2 SOLUBILITY IN SALT SOLUTIONS
The solubiUty of native and succinylated chickpea proteins at different pHs in NaCl and CaCb
is shown in Fig 5,3.2 a-b and Fig 5.3.3 a-b, respectively.
The pi of the native chickpea protein was shifted from pH 4.8 to pH 4 in 0.25M NaCl and Us
solubility at pi region was slightly increased in 0.75M NaCl solution. These changes could be
attributed to the selective binding of the anionic chlorides to the protein molecules which
increased Us net negative charge and shifted its pi to a more acidic region. Perhaps the
binding of chlorides increased with increasing saU concentrations, resulting in an increase in
the solubility of protein at pH 4 in 0.75M NaCI solution.
Solubility of aU native and succinylated chickpea proteins was decreased in dilute NaCl
solutions. At pHs below the pi, solubiUty of succinylated chickpea proteins were greatly
decreased wUh increasing levels of modification. The highly succinylated chickpea protein
SCP79 was almost insoluble. This observation can be explained by several factors. The pK
of succinate residues is 4.16, the net charge of the succinylated protein became almost neutral
139
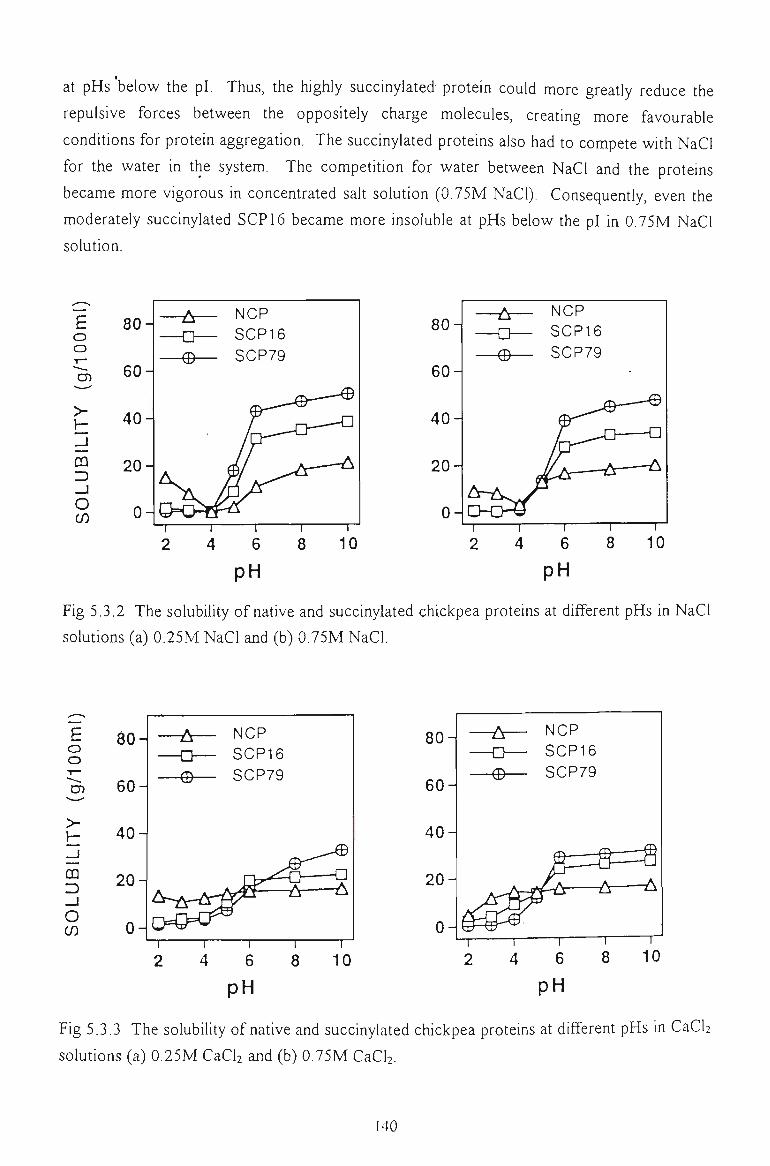
at pHs below the pi. Thus, the highly succinylated protein could more greatly reduce the
repulsive forces between the oppositely charge molecules, creating more favourable
condUions for protein aggregation. The succinylated proteins also had to compete with NaCl
for the water in the system. The competition for water between NaCl and the proteins
became more vigorous in concentrated salt solution (0.75M NaCl). Consequently, even the
moderately succinylated SCP 16 became more insoluble at pHs below the pi in 0.75M NaCl
solution.
E o o
>
_J
CQ = ) _J
O
pH pH
Fig 5.3.2 The solubility of native and succinylated chickpea proteins at different pHs in NaCl
solutions (a) 0.25M NaCl and (b) 0.75M NaCl.
E o o T—
cn
>
_J CQ
- J O CO
pH pH
Fig 5.3.3 The solubility of native and succinylated chickpea proteins at different pHs in CaCb
solutions (a) 0.25M CaCb and (b) 0.75M CaCb.
140
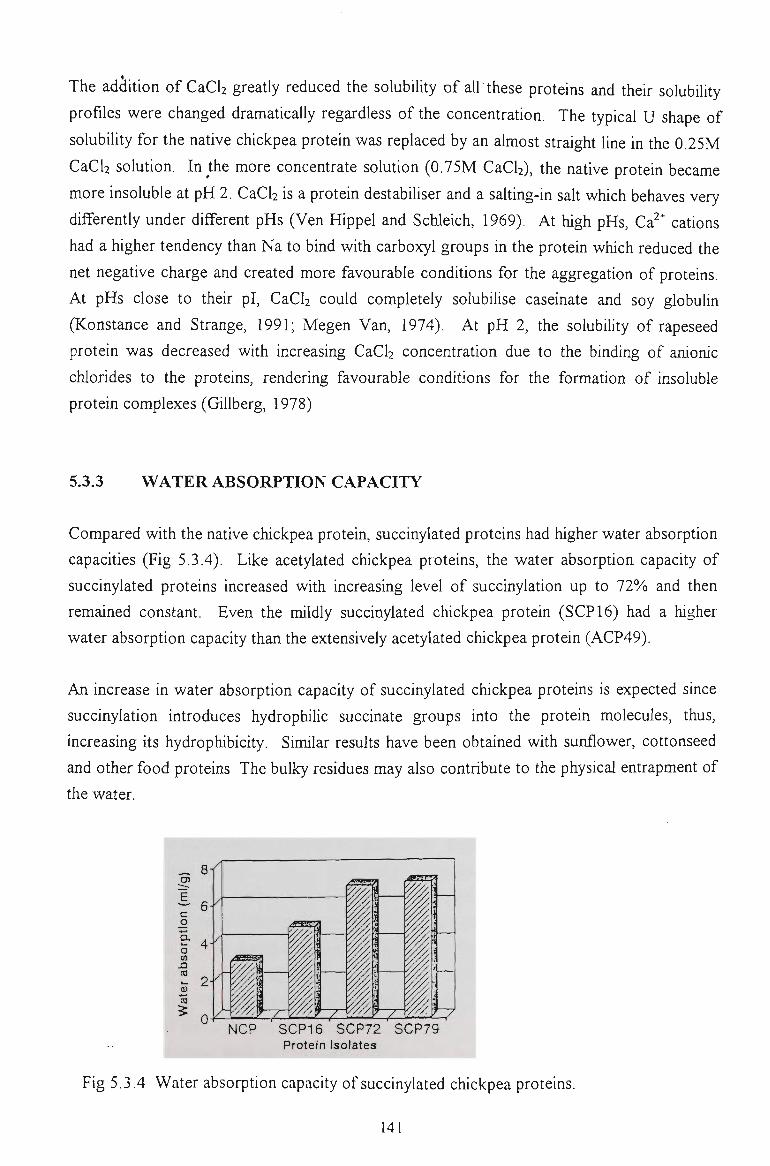
The addition of CaCla greatly reduced the solubUity of aU'these proteins and their solubility
profiles were changed dramatically regardless of the concentration. The typical U shape of
solubility for the native chickpea protein was replaced by an almost straight line in the 0.25M
CaCb solution. In the more concentrate solution (0.75M CaCb), the native protein became
more insoluble at pH 2. CaCb is a protein destabiliser and a saUing-in salt which behaves very
differently under different pHs (Ven Hippel and Schleich, 1969). At high pHs, Ca^" cations
had a higher tendency than Na to bind with carboxyl groups in the protein which reduced the
net negative charge and created more favourable condUions for the aggregation of proteins.
At pHs close to their pi, CaCla could completely solubiUse caseinate and soy globulin
(Konstance and Strange, 1991; Megen Van, 1974). At pH 2, the solubility of rapeseed
protein was decreased with increasing CaCl2 concentration due to the binding of aruonic
chlorides to the proteins, rendering favourable conditions for the formation of insoluble
protein complexes (Gillberg, 1978)
5.3.3 WATER ABSORPTION CAPACITY
Compared with the native chickpea protein, succinylated proteins had higher water absorption
capacities (Fig 5.3.4). Like acetylated chickpea proteins, the water absorption capacUy of
succinylated proteins increased with increasing level of succinylation up to 72% and then
remained constant. Even the mildly succinylated chickpea protein (SCP 16) had a higher
water absorption capacity than the extensively acetylated chickpea protein (ACP49).
An increase in water absorption capacity of succinylated chickpea proteins is expected since
succinylation introduces hydrophilic succinate groups into the protein molecules, thus,
increasing its hydrophibicity. Similar resuUs have been obtained with sunflower, cottonseed
and other food proteins The bulky residues may also contribute to the physical entrapment of
the water.
.assr
NCP SCP16 SCP72 SCP79 Protein Isolates
Fig 5.3.4 Water absorption capacity of succinylated chickpea proteins.
141
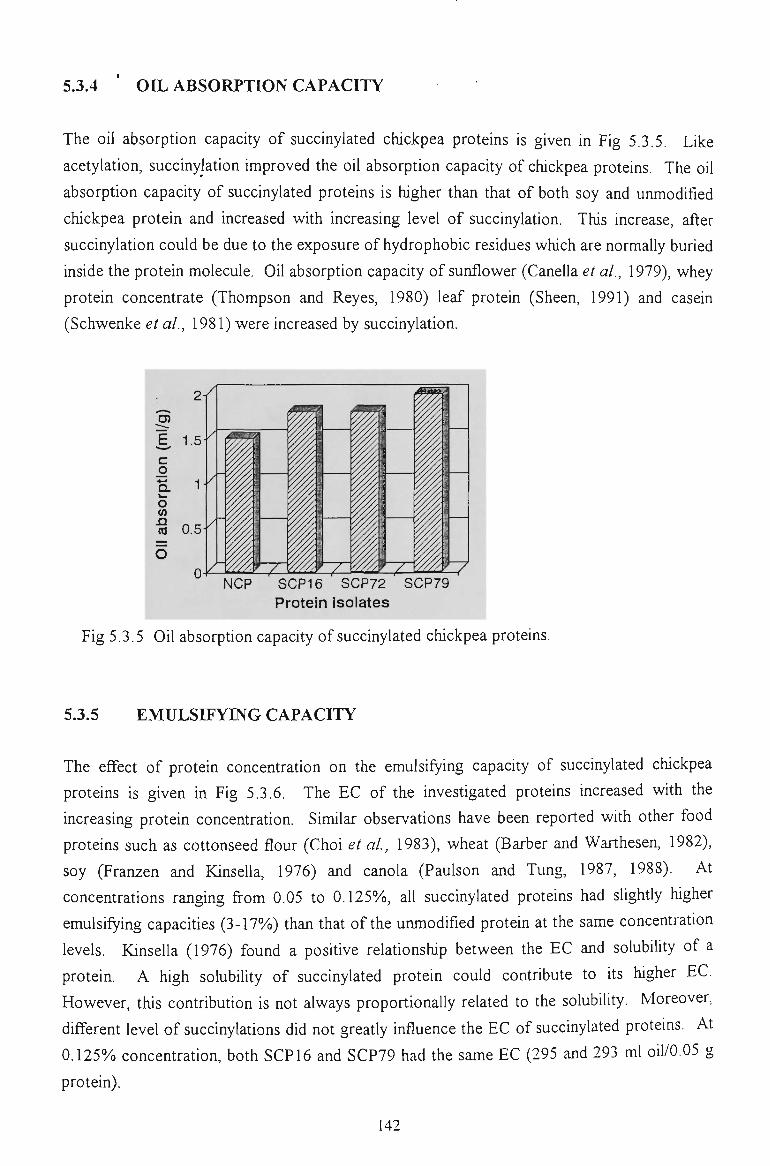
5.3.4 OIL ABSORPTION CAPACITY
The oil absorption capacity of succinylated chickpea proteins is given in Fig 5.3.5. Like
acetylation, succinylation improved the oil absorption capacity of chickpea proteins. The oil
absorption capacity of succinylated proteins is higher than that of both soy and unmodified
chickpea protein and increased with increasing level of succinylation. This increase, after
succinylation could be due to the exposure of hydrophobic residues which are normally buried
inside the protein molecule. OU absorption capacity of sunflower (Canella et al, 1979), whey
protein concentrate (Thompson and Reyes, 1980) leaf protein (Sheen, 1991) and casein
(Schwenke et al, 1981) were increased by succinylation.
-5?
c o
o (0 n to
NCP ^ ^
SCP16 SCP72 SCP79 Protein isolates
Fig 5.3.5 OU absorption capacity of succinylated chickpea proteins.
5.3.5 EMULSIFYING CAPACITY
The effect of protein concentration on the emulsifying capacity of succinylated chickpea
proteins is given in Fig 5.3.6. The EC of the investigated proteins increased with the
increasing protein concentration. Similar observations have been reported with other food
proteins such as cottonseed flour (Choi et al, 1983), wheat (Barber and Warthesen, 1982),
soy (Franzen and KinseUa, 1976) and canola (Paulson and Tung, 1987, 1988). At
concentrations ranging from 0.05 to 0.125%, all succinylated proteins had slightly higher
emulsifying capacities (3-17%) than that of the unmodified protein at the same concentration
levels. Kinsella (1976) found a positive relationship between the EC and solubility of a
protein. A high solubUity of succinylated protein could contribute to Us higher EC.
However, this contribution is not always proportionally related to the solubiUty. Moreover,
different level of succinylations did not greatly influence the EC of succinylated proteins. At
0.125% concentration, both SCP16 and SCP79 had the same EC (295 and 293 ml oil/0,05 g
protein).
142
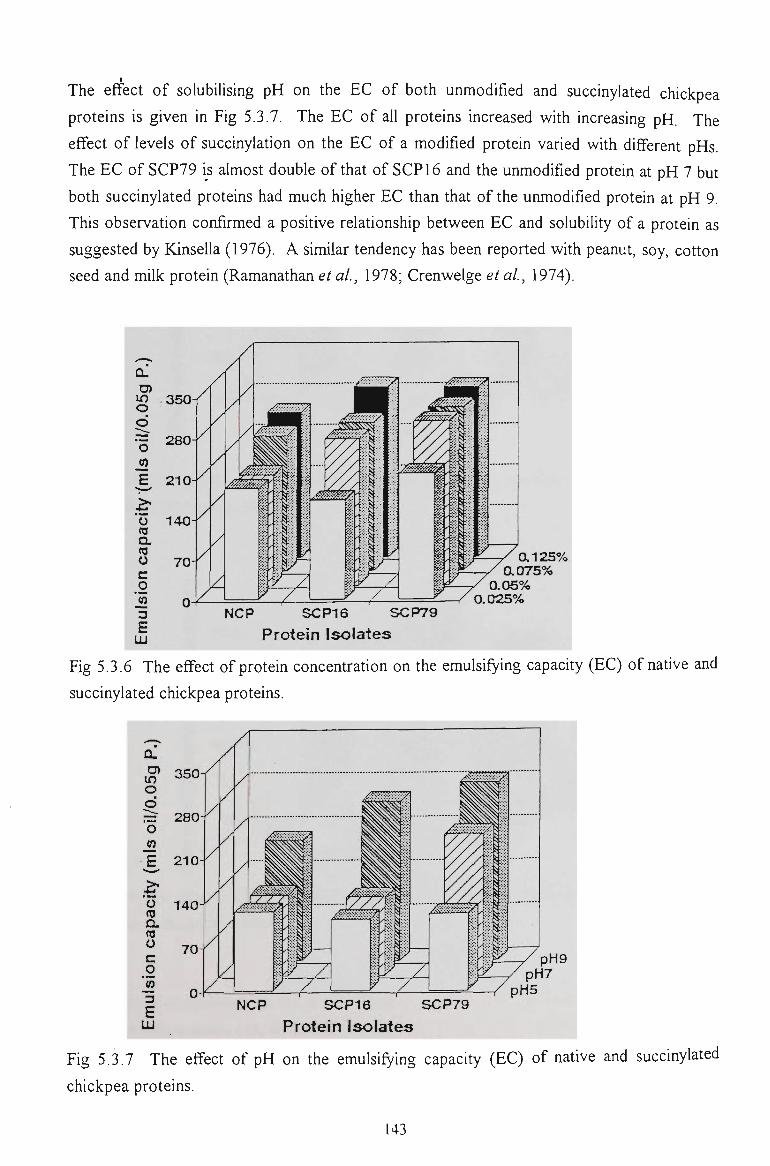
The effect of solubilising pH on the EC of both unmodified and succinylated chickpea
proteins is given in Fig 5.3.7. The EC of all proteins increased with increasing pH. The
effect of levels of succinylation on the EC of a modified protein varied with different pHs.
The EC of SCP79 is almost double of that of SCP 16 and the unmodified protein at pH 7 but
both succinylated proteins had much higher EC than that of the unmodified protein at pH 9.
This observation confirmed a positive relationship between EC and solubility of a protein as
suggested by Kinsella (1976). A simUar tendency has been reported with peanut, soy, cotton
seed and milk protein (Ramanathan et al, 1978; Crenwelge et al, 1974).
2 1 0
O
d o
o a 3 c o ]« "5 E
UJ
3 5 0
= 2 8 0
140
a 125% a 075%
0.05% 0 .025%
NCP SCP16 S C P 7 9
Protein Isolates
Fig 5.3.6 The effect of protein concentration on the emulsifying capacity (EC) of native and
succinylated chickpea proteins.
210
^ 3 5 0 o d •= 280 O
E
o (0 Q. o c o
E LU
140
NCP S C P 1 6 S C P 7 9
Protein Isolates
Fig 5.3.7 The effect of pH on the emulsifying capacity (EC) of native and succinylated
chickpea proteins.
143
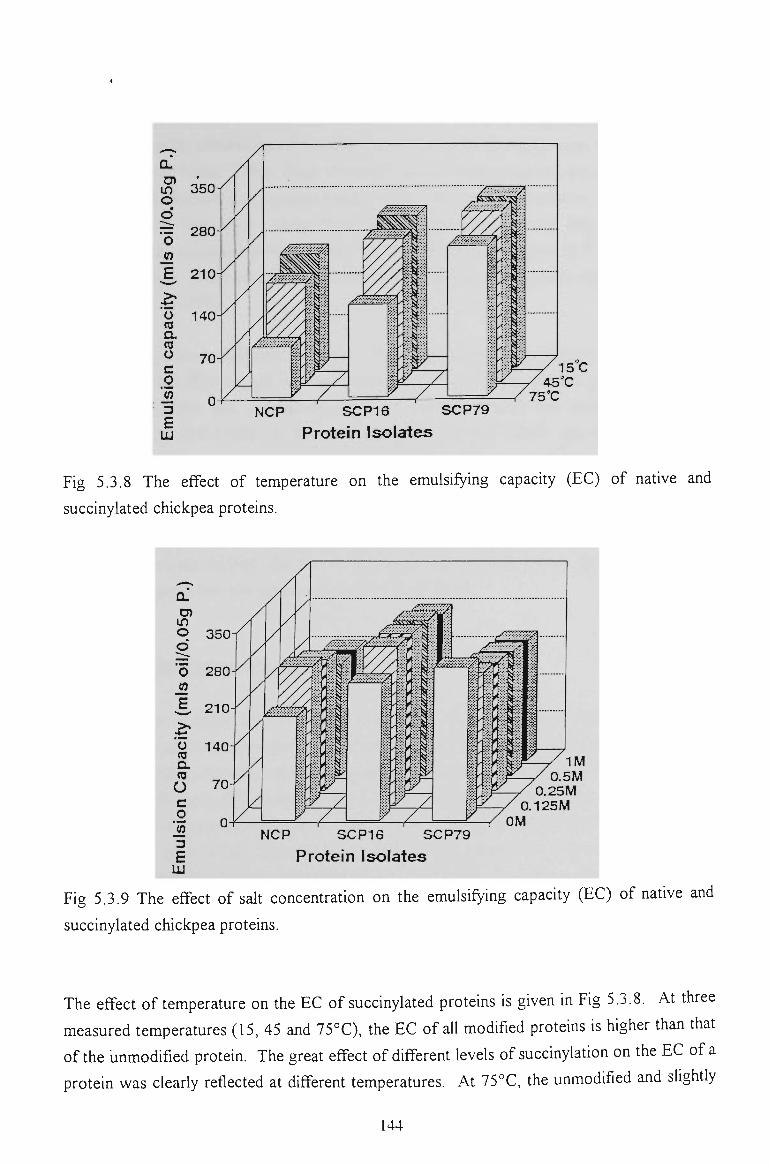
o 350
140
= 280 O 9) E
o Q.
8 c o
3. 3 E LU
210
NCP SCP16 SCP79
Protein Isolates
Fig 5.3.8 The effect of temperature on the emulsifying capacity (EC) of native and
succinylated chickpea proteins.
CL cn m o d
"o _n E
o «n a. <a O c o J2 u E
LU
350
280
210
140
0.25M 0.125M
NCP SCP16 SCP79
Protein Isolates
Fig 5.3.9 The effect of salt concentration on the emulsifying capacity (EC) of native and
succinylated chickpea proteins.
The effect of temperature on the EC of succinylated proteins is given in Fig 5.3.8. At three
measured temperatures (15, 45 and 75°C), the EC of all modified proteins is higher than that
of the unmodified protein. The great effect of different levels of succinylation on the EC of a
protein was clearly reflected at different temperatures. At 75°C, the unmodified and slightly
144
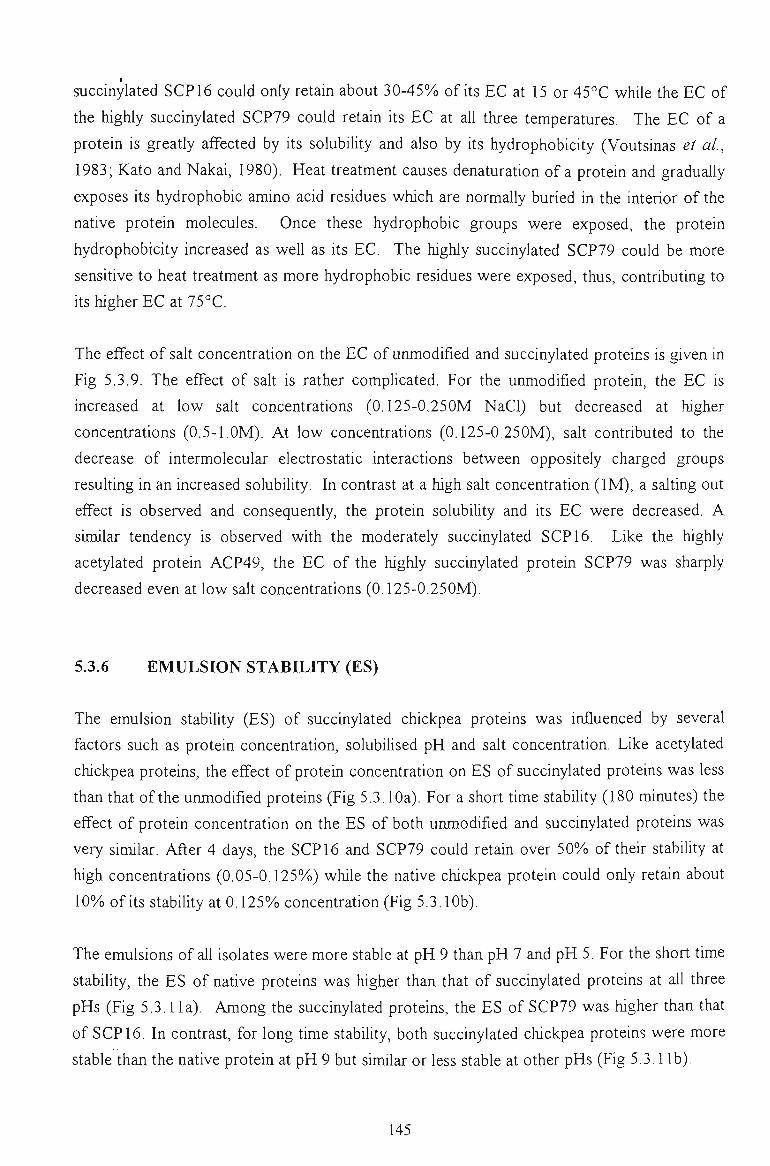
succinylated SCP 16 could only retain about 30-45% of Us EC at 15 or 45°C while the EC of
the highly succinylated SCP79 could retain Us EC at aU three temperatures. The EC of a
protein is greatly affected by Us solubility and also by Us hydrophobicity (Voutsinas et al,
1983; Kato and Nakai, 1980). Heat treatment causes denaturation of a protein and graduaUy
exposes its hydrophobic amino acid residues which are normally buried in the interior of the
native protein molecules. Once these hydrophobic groups were exposed, the protein
hydrophobicity increased as well as its EC. The highly succinylated SCP79 could be more
sensitive to heat treatment as more hydrophobic residues were exposed, thus, contributing to
Us higher EC at 75°C.
The effect of salt concentration on the EC of unmodified and succinylated proteins is given in
Fig 5.3.9. The effect of salt is rather complicated. For the unmodified protein, the EC is
increased at low salt concentrations (0.125-0.250M NaCl) but decreased at higher
concentrations (0.5-l.OM). At low concentrations (0.125-0.250M), saU contributed to the
decrease of intermolecular electrostatic interactions between oppositely charged groups
resulting in an increased solubility. In contrast at a high salt concentration (IM), a salting out
effect is observed and consequently, the protein solubility and its EC were decreased. A
similar tendency is observed with the moderately succinylated SCP 16. Like the highly
acetylated protein ACP49, the EC of the highly succinylated protein SCP79 was sharply
decreased even at low salt concentrations (0.125-0.250M).
5.3.6 EMULSION STABILITY (ES)
The emulsion stability (ES) of succinylated chickpea proteins was influenced by several
factors such as protein concentration, solubilised pH and salt concentration. Like acetylated
chickpea proteins, the effect of protein concentration on ES of succinylated proteins was less
than that of the unmodified proteins (Fig 5.3.10a). For a short time stabUity (180 minutes) the
effect of protein concentration on the ES of both unmodified and succinylated proteins was
very similar. After 4 days, the SCP 16 and SCP79 could retain over 50% of their stability at
high concentrations (0.05-0.125%) while the native chickpea protein could only retain about
10% of its stability at 0.125% concentration (Fig 5.3.10b).
The emulsions of all isolates were more stable at pH 9 than pH 7 and pH 5. For the short time
stability, the ES of native proteins was higher than that of succinylated proteins at all three
pHs (Fig 5.3.1 la). Among the succinylated proteins, the ES of SCP79 was higher than that
of SCP 16. In contrast, for long time stability, both succinylated chickpea proteins were more
stable than the native protein at pH 9 but similar or less stable at other pHs (Fig 5.3.1 lb).
145
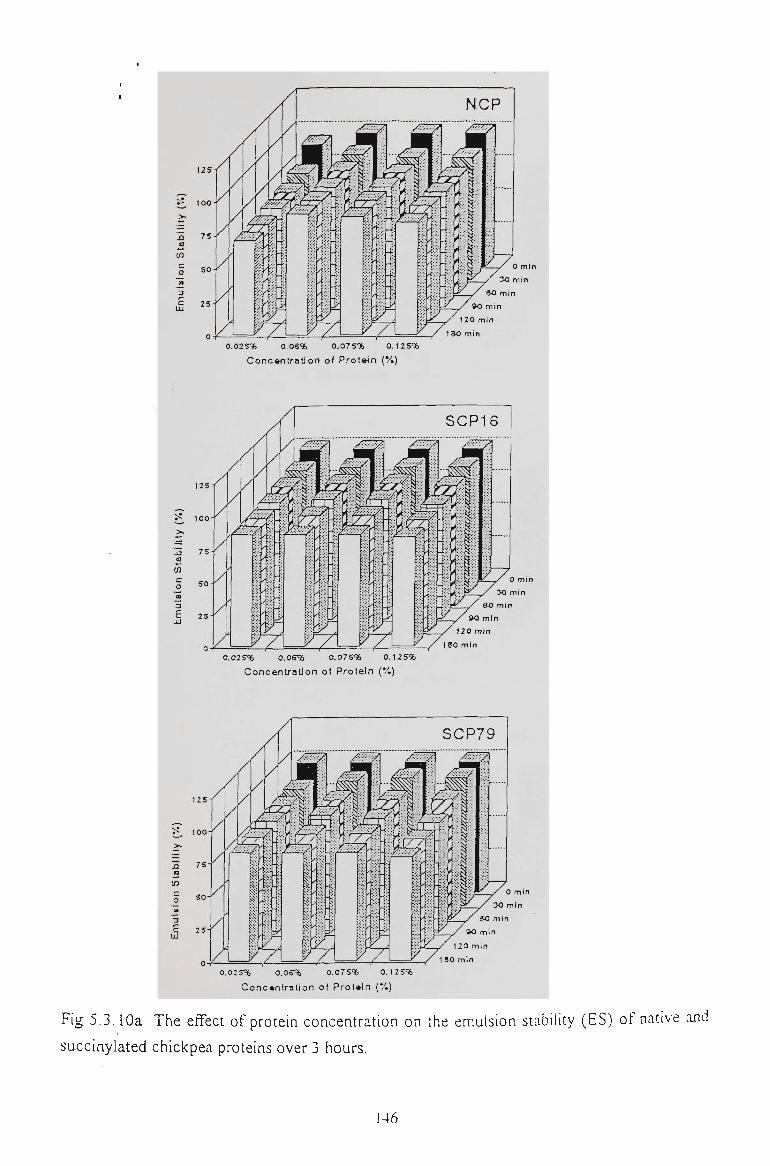
NCP
I 2 5 i
2S% 0.0S% 0.075% 0.125%
ConcentraUon of Pro te in (*/.)
0.02 5% 0,05% 0.07 5% 0.12 5%
Concentration o( Protein ('/.)
J3
in
5
SCP79
0.025% 0,05% 0,075% 0.125%
Conc«nt ra l lon of Pro t» ln {'/.)
Fig 5.3, lOa The effect of protein concentration on the emulsion stability (ES) of native and
succinylated chickpea proteins over 3 hours.
146
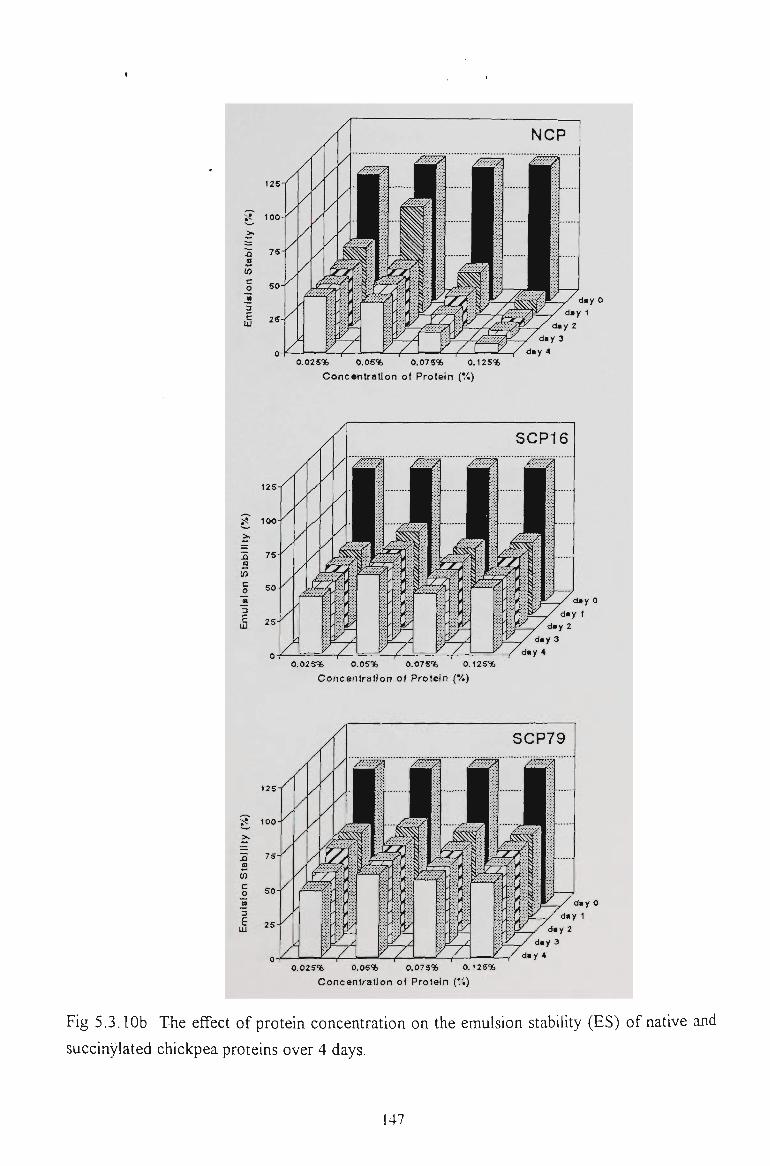
1 2 5
100
to c
E UJ
0.025% 0.05% 0.075% 0.125% Concentration of Protein (%)
125
i? 100
J3 S (O c o
0.025% 0.05% 0.075% 0.125%
Concen t ra t i on of Pro te in (%)
SCP79
0.025% 0.05% 0.075% 0,125%
Concen t ra t i on of Prote in ('/.)
Fig 5.3.10b The effect of protein concentration on the emulsion stabUity (ES) of native and
succinylated chickpea proteins over 4 days.
147
125
C. 100
150 min
125
C- 100
(O
SCP16
JO
a
SCP79
120 m(n 180 min
Fig 5.3.11a The effect of pH on the emulsion stabUity (ES) of native and succinylated
chickpea proteins over 3 hours.
148
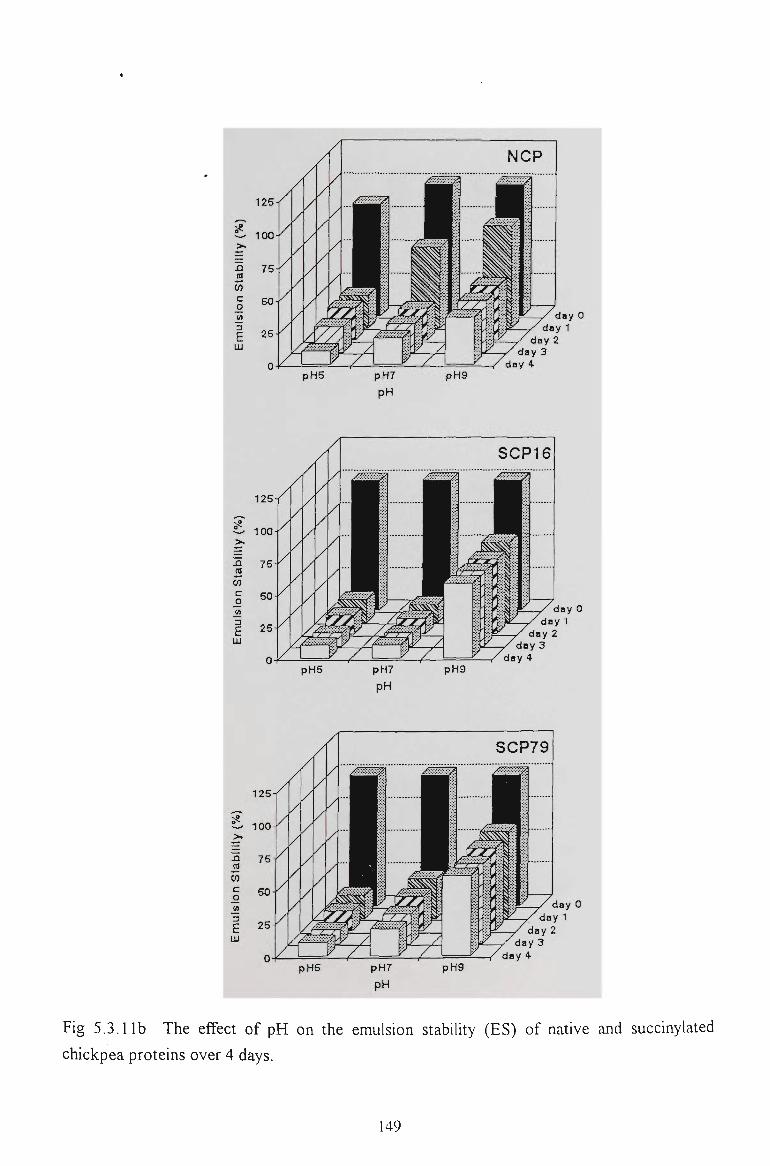
day 0
a w c o
3
E UJ
125
100
day 0
Fig 5.3.11b The effect of pH on the emulsion stabUity (ES) of native and succinylated
chickpea proteins over 4 days.
149
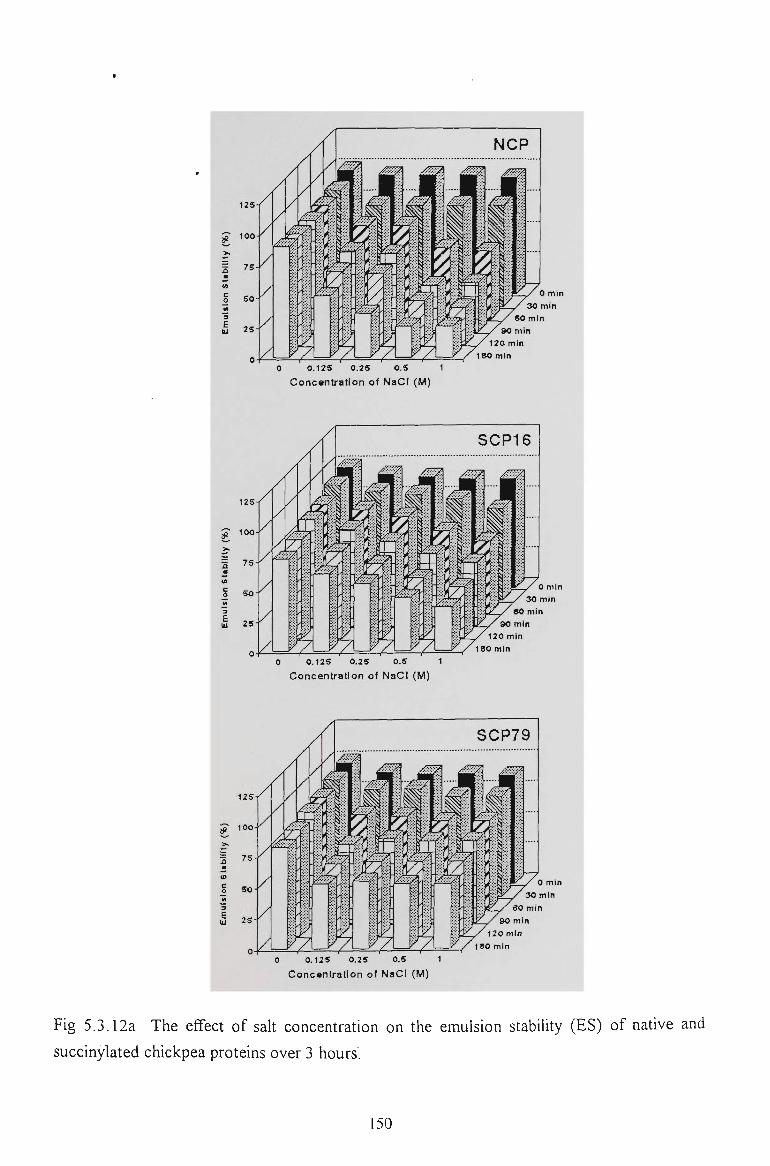
0 0.125 0.25 0.5 1 Concentration of NaCI (M)
SCP16
0 0.125 0.25 0.5 1
Concentration of NaCI {M)
0 0.125 0.25 O.S 1
Concentration of NaCI (M)
Fig 5.3.12a The effect of salt concentration on the emulsion stability (ES) of native and
succinylated chickpea proteins over 3 hours.
150
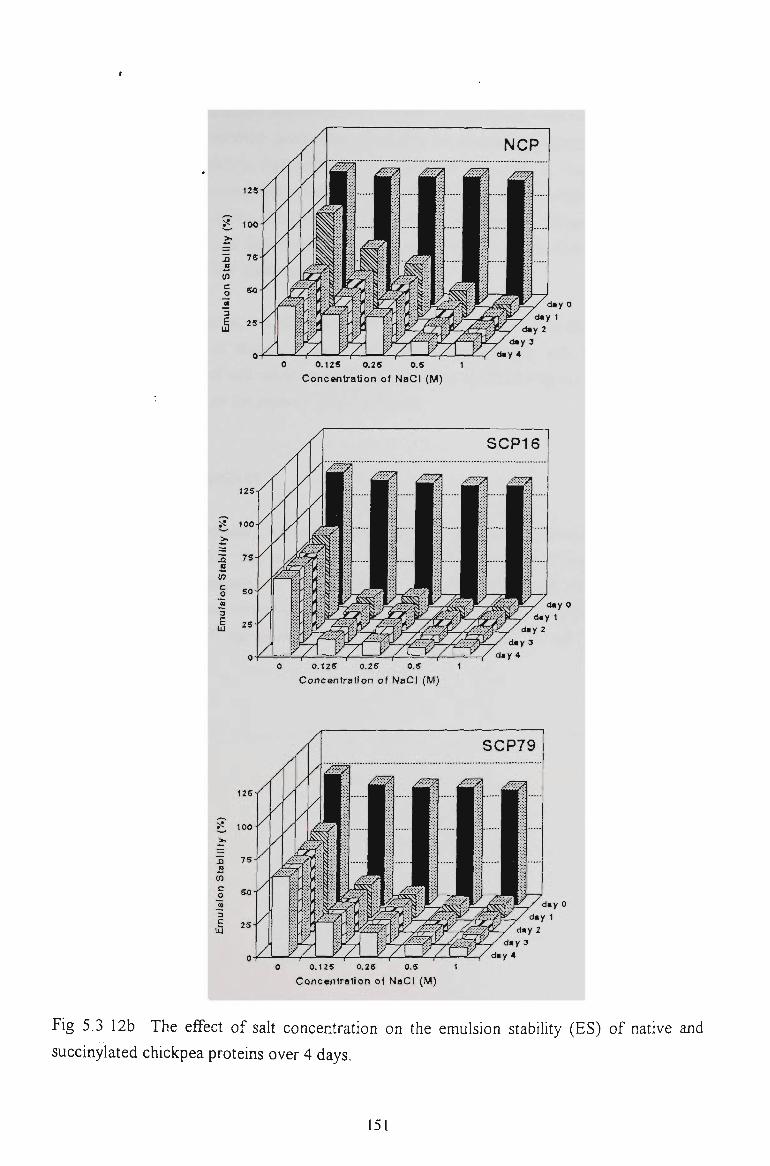
125
.a B 0) c o
NCP
0 0.125 0.25 0.5 1
Concentration ol NaCI (M)
125
j a
c
jg "a E UJ
0 0 .125 0.25 O.S 1
Concen t ra t i on of NaCI (fW)
SCP16
0 0.125 0.25 0.5 1
Concentration of NaCI (M)
SCP79
Fig 5.3,12b The effect of saU concentration on the emulsion stability (ES) of native and
succinylated chickpea proteins over 4 days.
151
The difference in the emulsion stability of these proteins at different pHs reflected the
difference in their structure and behaviour. At pH 9, all proteins were more soluble and their
net charge did not establish favourable condUions for protein aggregation. This contributed
to the emulsion stabUity. Succinylation increased the net negative charge of the modified
proteins, thus, enhancing their solubility at pH 9. This might also contribute to their higher
ES. In contrast at lower pHs (pH 7 and pH 5) the net negative charge of the succinylated
proteins decreased and favourable conditions were formed for protein aggregation, which
contributed to their less stable emulsions at low pHs.
Like acetylated proteins, the effect of salt concentrations on the ES of all protein isolates was
similar. The ES of these proteins decreased with increasing salt concentrations. The
destabUising effect of salt could be explained in terms of the salting out effect and possible
Na" cations binding to the proteins (Fig 5.3,12a-b).
5.3.7 CONCLUSION
Compared with acetylation, succinylation greatly improved the solubility of chickpea proteins
at high alkaline pHs. The water and oil absorption capacities of succinylated chickpea
proteins were also improved. The emulsion capacity of succinylated chickpea proteins was
higher than that of native and acetylated chickpea proteins. These emulsions were also more
stable than those of native and acetylated chickpea proteins at high concentrations and
particularly at pH 9.
152
CHAPTER 6
FLOW PROPERTIES OF CHICKPEA PROTEINS
FLOW PROPERTIES OF CHICKPEA PROTEINS
Fluid foods make up the major portion of human's food intake. As infants, they can rely
entirely on fluid foods to grow and develop. At a later stage, humans can rely, once again,
on fluid foods when sick or old. Fluid foods are stUl important parts of our current food
system. Chickpea proteins have been used as ingredients in only a few fluid foods such as
imitation milk or beverages but fluid foods can be used as a means to introduce these
proteins in wider applications in processed foods
Flow properties are an important factor in deciding how a protein dispersion can be utilised
in fluid foods. There are numerous investigations on the flow properties of liquid or fluid
foods (Rao, 1977). These studies highlighted the diverse and anomalous flow behaviour of
food materials. The investigation of the rheological properties of a protein solution is
normally based on the measurement of the viscosity. This, in turn, relates to shear stress and
shear rate. Flow behaviour of the protein dispersion is investigated by measuring its
viscosity over a range of shear rates. A flow curve is constructed by plotting the measured
shear stress against the corresponding shear rate. Although the flow properties of a food
material, including its protein dispersion, are rather diverse and anomalous, they can
normally be described by the so called power law equation.
n [6.1,1] a = m y *- ^
or logo = nlog y + logm [6.1.2]
a is the shear stress (mPa), y is the shear rate (sec' ), n is the flow index, m is the
consistency coefficient. Depending on the values of these constants, the flow characteristic
of a fluid can be characterised as Newtonian or non-Newtonian behaviour.
The flow characteristics of a fluid can also be described by the yield value (a=ko ) of the
protein dispersions which is related to the network structure of the material. This can be
calculated by the Casson equation which is normally used to describe the yield stress of
chocolates.
a^^^-k^ + kiY^^^ [6.1.3]
For a number of dispersions, shear stiess appears to be constant at low shear rates. This
tendency indicates the existence of a yield stiess. This is the minimum amount of stiess
154
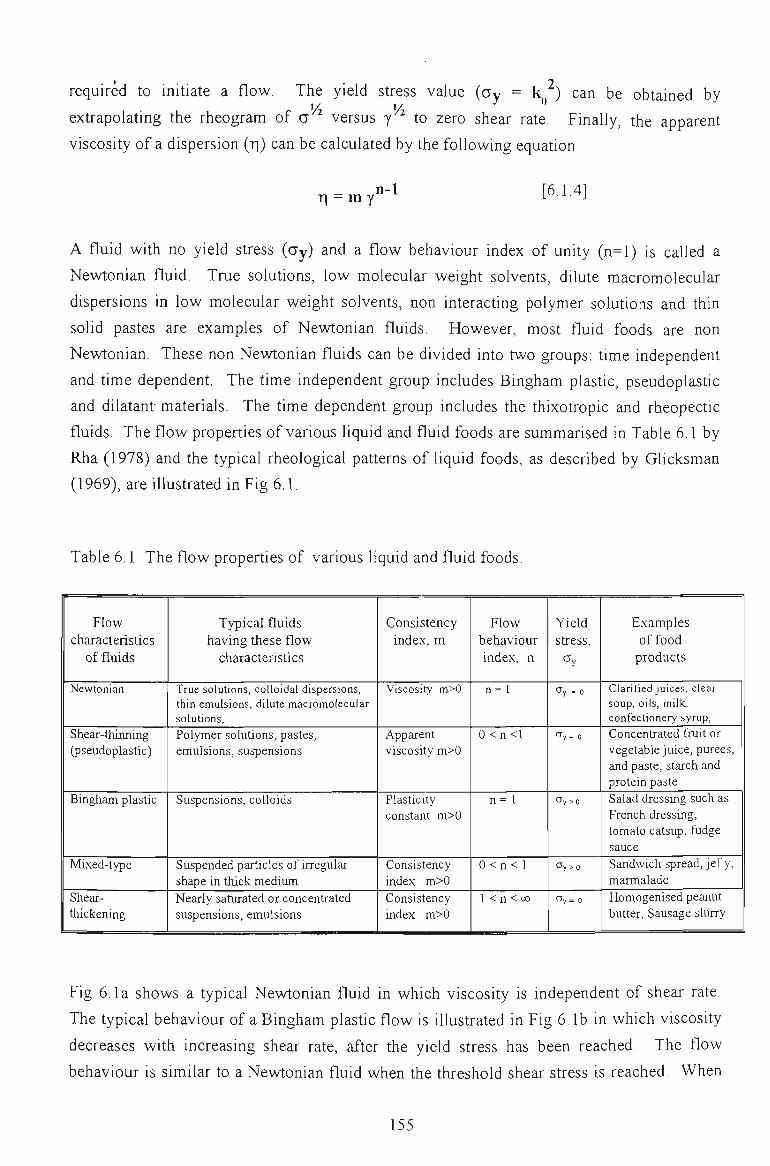
required to initiate a flow. The yield stress value (ay = k ) can be obtained by
extrapolating the rheogram of CT versus y ^ to zero shear rate. Finally, the apparent
viscosity of a dispersion {r\) can be calculated by the following equation
r\ = my n-1 [6.1.4]
A fluid with no yield stress (ay) and a flow behaviour index of unity (n=l) is called a
Newtonian fluid. True solutions, low molecular weight solvents, dilute macromolecular
dispersions in low molecular weight solvents, non interacting polymer solutions and thin
solid pastes are examples of Newtonian fluids. However, most fluid foods are non
Newtonian. These non Newtonian fluids can be divided into two groups: time independent
and time dependent. The time independent group includes Bingham plastic, pseudoplastic
and dilatant materials. The time dependent group includes the thixotropic and rheopectic
fluids. The flow properties of various liquid and fluid foods are summarised in Table 6.1 by
Rha (1978) and the typical rheological patterns of liquid foods, as described by Glicksman
(1969), are illustrated in Fig 6.1.
Table 6.1 The flow properties of various liquid and fluid foods.
Flow characteristics
of fluids
Newtonian
Shear-thinning (pseudoplastic)
Bingham plastic
Mixed-type
Shear-tliickening
Typical fluids having these flow
characteristics
True solutions, colloidal dispersions, thin emulsions, dilute macromolecular solutions. Polymer solutions, pastes, emulsions, suspensions
Suspensions, colloids
Suspended particles of irregular shape in thick medium Nearly saturated or concentrated suspensions, emulsions
Consistency index, m
Viscosity m>0
Apparent viscosity m>0
Plasticity constant m>0
Consistency index m>0 Consistency index m>0
Flow behaviour index, n.
n= 1
0 < n < l
n = l
0 < n < l
1 <n<oo
Yield stress,
CTy = 0
CTy= 0
tJy >0
Cfy >0
Cfy= 0
Examples of food
products
Clarified Juices, clear soup, oils, milk, confectionery syrup. Concentrated fruit or vegetable juice, purees, and paste, starch and protein paste Salad dressing such as French dressing, tomato catsup, fudge sauce Sandwich spread, jelly, marmalade Homogenised peanut butter, Sausage sltirry
Fig 6.1a shows a typical Newtonian fluid in which viscosity is independent of shear rate.
The typical behaviour of a Bingham plastic flow is illustrated in Fig 6. lb in which viscosity
decreases with increasing shear rate, after the yield stress has been reached. The flow
behaviour is similar to a Newtonian fluid when the threshold shear stress is reached. When
155
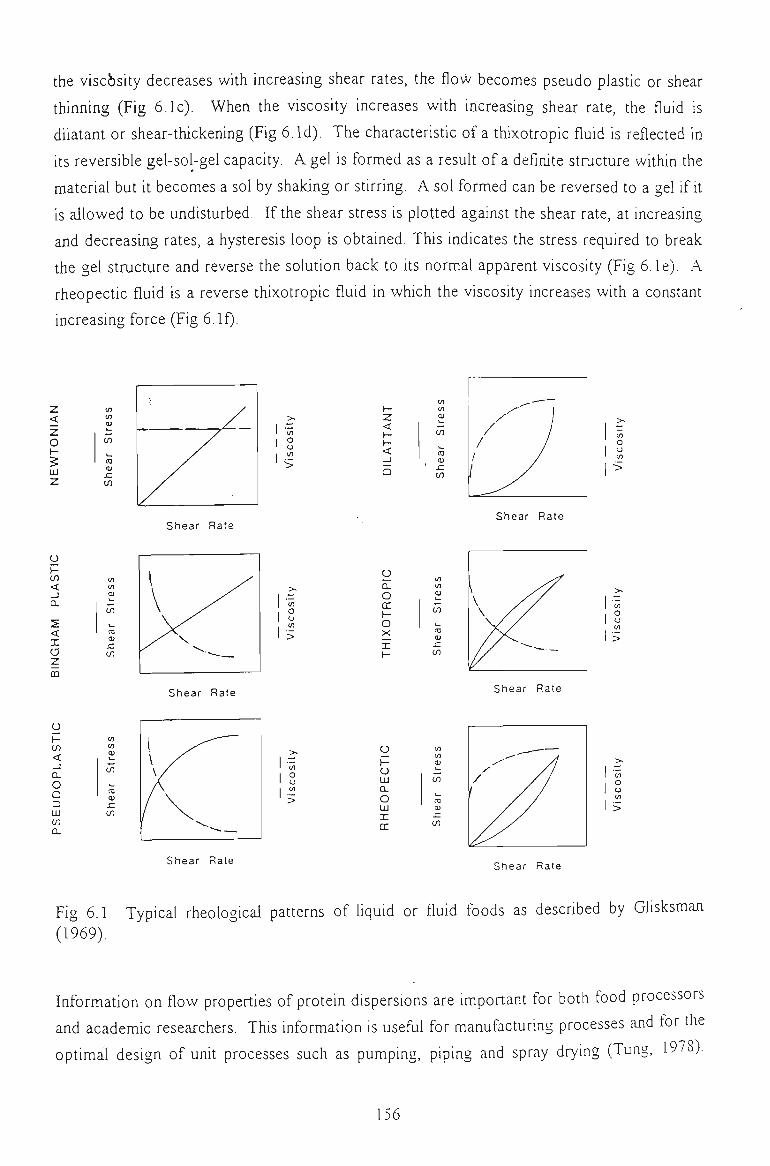
the viscbsity decreases with increasing shear rates, the flow becomes pseudo plastic or shear
thinning (Fig 6.1c). When the viscosity increases with increasing shear rate, the fluid is
dilatant or shear-thickening (Fig 6. Id), The characteristic of a thixotropic fluid is reflected in
Us reversible gel-sol-gel capacity, A gel is formed as a resuU of a definite structure within the
material but U becomes a sol by shaking or stirring. A sol formed can be reversed to a gel if U
is allowed to be undisturbed. If the shear stress is plotted against the shear rate, at increasing
and decreasing rates, a hysteresis loop is obtained. This indicates the stress required to break
the gel structure and reverse the solution back to Us normal apparent viscosity (Fig 6.1e). A
rheopectic fluid is a reverse thixotropic fluid in which the viscosity increases with a constant
increasing force (Fig 6. If).
z < z o H
5 LU Z
in tn k _
(J)
^ <a r CO
l l
H Z < ( -1-<
Shear Rate Shear Rate
o
O I -
<
< o z ca
.c CO
o Q .
O cr o X X H
m cu
05
t _
ra 0) sz (T)
Shear Rate Shear Rate
O I-
< _l a. o Q D LU CO Q.
sz CO
I °
o t-o LU CL
o LU X cn
m tfi (U
, CO
nj OJ
sz tj)
Shear Rate Shear Rate
Fig 6.1 Typical rheological patterns of liquid or fluid foods as described by GUsksman (1969).
Information on flov^/ properties of protein dispersions are important for both food processors
and academic researchers. This information is useful for manufacturing processes and for the
optimal design of unit processes such as pumping, piping and spray drying (Tung, 19 )•
.56
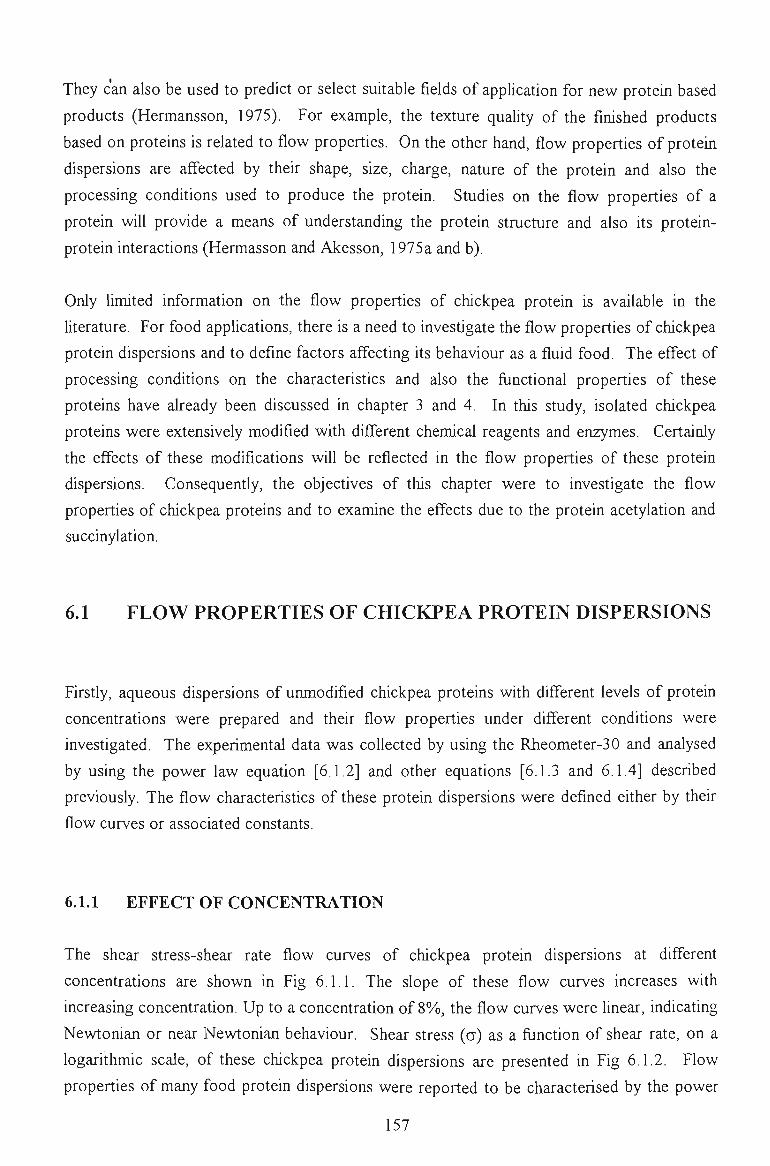
They can also be used to predict or select suitable fields of application for new protein based
products (Hermansson, 1975). For example, the texture quality of the finished products
based on proteins is related to flow properties. On the other hand, flow properties of protem
dispersions are affected by their shape, size, charge, nature of the protein and also the
processing conditions used to produce the protein. Studies on the flow properties of a
protein will provide a means of understanding the protein structure and also its protein-
protein interactions (Hermasson and Akesson, 1975 a and b).
Only limited information on the flow properties of chickpea protein is available in the
Uterature. For food applications, there is a need to investigate the flow properties of chickpea
protein dispersions and to define factors affecting its behaviour as a fluid food. The effect of
processing conditions on the characteristics and also the functional properties of these
proteins have already been discussed in chapter 3 and 4. In this study, isolated chickpea
proteins were extensively modified with different chemical reagents and enzymes. Certainly
the effects of these modifications wiU be reflected in the flow properties of these protein
dispersions. Consequently, the objectives of this chapter were to investigate the flow
properties of chickpea proteins and to examine the effects due to the protein acetylation and
succinylation.
6.1 FLOW PROPERTIES OF CHICKPEA PROTEIN DISPERSIONS
Firstly, aqueous dispersions of unmodified chickpea proteins with different levels of protein
concentrations were prepared and their flow properties under different conditions were
investigated. The experimental data was coUected by using the Rheometer-30 and analysed
by using the power law equation [6.1.2] and other equations [6.1.3 and 6.1.4] described
previously. The flow characteristics of these protein dispersions were defined eUher by their
flow curves or associated constants.
6.1.1 EFFECT OF CONCENTRATION
The shear stress-shear rate flow curves of chickpea protein dispersions at different
concentrations are shown in Fig 6.1.1. The slope of these flow curves increases with
increasing concentration. Up to a concentration of 8%, the flow curves were linear, indicating
Newtonian or near Newtoiuan behaviour. Shear stress (a) as a function of shear rate, on a
logarithmic scale, of these chickpea protein dispersions are presented in Fig 6.1.2. Flow
properties of many food protein dispersions were reported to be characterised by the power
157
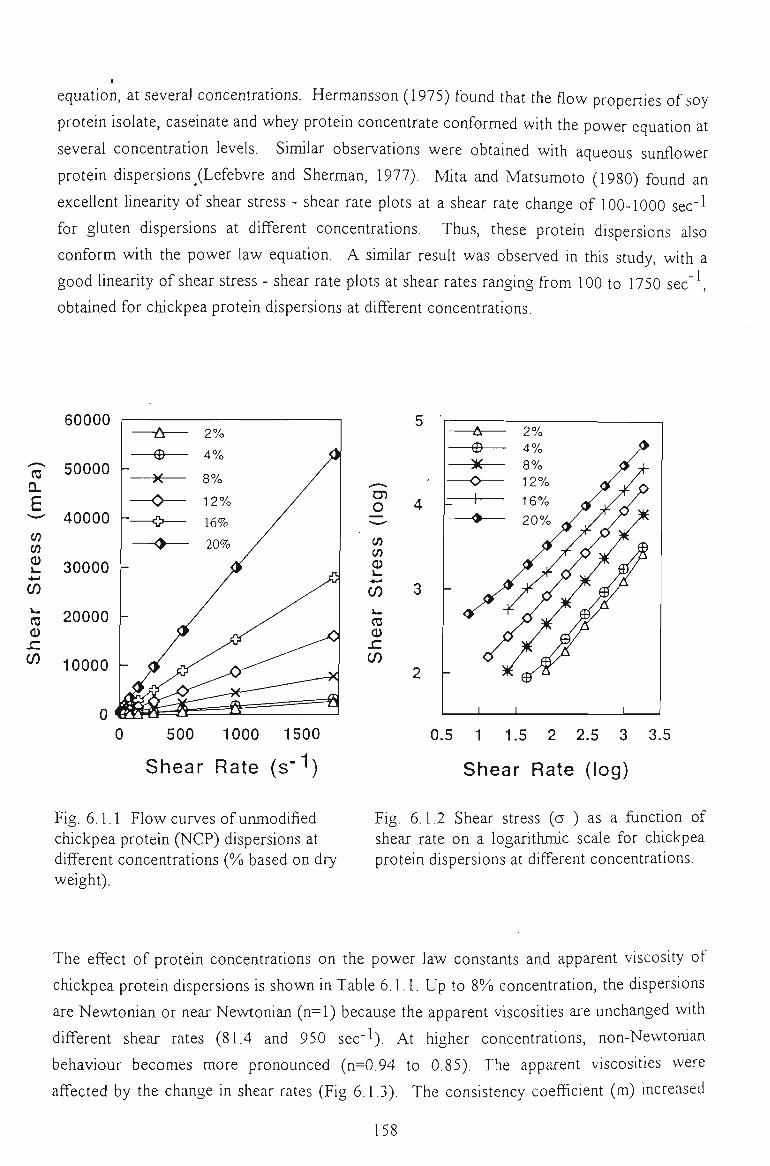
equation, at several concentrations. Hermansson (1975) found that the flow properties of soy
protein isolate, caseinate and whey protein concentrate conformed with the power equation at
several concentration levels. Similar observations were obtained with aqueous sunflower
protein dispersions (Lefebvre and Sherman, 1977). Mita and Matsumoto (1980) found an
excellent linearity of shear stress - shear rate plots at a shear rate change of 100-1000 sec"^
for gluten dispersions at different concentrations. Thus, these protein dispersions also
conform with the power law equation. A similar resuU was observed in this study, with a
good linearity of shear stress - shear rate plots at shear rates ranging from 100 to 1750 sec'^
obtained for chickpea protein dispersions at different concentrations.
'c?
g
Str
e
She
60000
50000
40000
30000
20000
monn
0
A A (T> yV
V /^
- — * — /% v
- <J ^
- 2%
- 4% <)
8% /
12% /
• 16% /
- 20% X
J—•==«— ^ "" "" n
0 500 1000 1500
Shear Rate (s""')
o
(/) </i o
CO
cs 0) sz CO
0.5 1 1.5 2 2.5 3 3.5
Shear Rate (log)
Fig. 6.1.1 Flow curves of unmodified chickpea protein (NCP) dispersions at different concentrations (% based on dry weight).
Fig. 6.1.2 Shear stress (a ) as a function of shear rate on a logarithmic scale for chickpea protein dispersions at different concentrations.
The effect of protein concentrations on the power law constants and apparent viscosity of
chickpea protein dispersions is shown in Table 6.1.1. Up to 8% concentration, the dispersions
are Newtonian or near Newtonian (n=l) because the apparent viscosities are unchanged with
different shear rates (81.4 and 950 sec"^). At higher concentrations, non-Newtonian
behaviour becomes more pronounced (n=0,94 to 0.85). The apparent viscosUies were
affected by the change in shear rates (Fig 6.1.3). The consistency coefficient (m) increased
,58
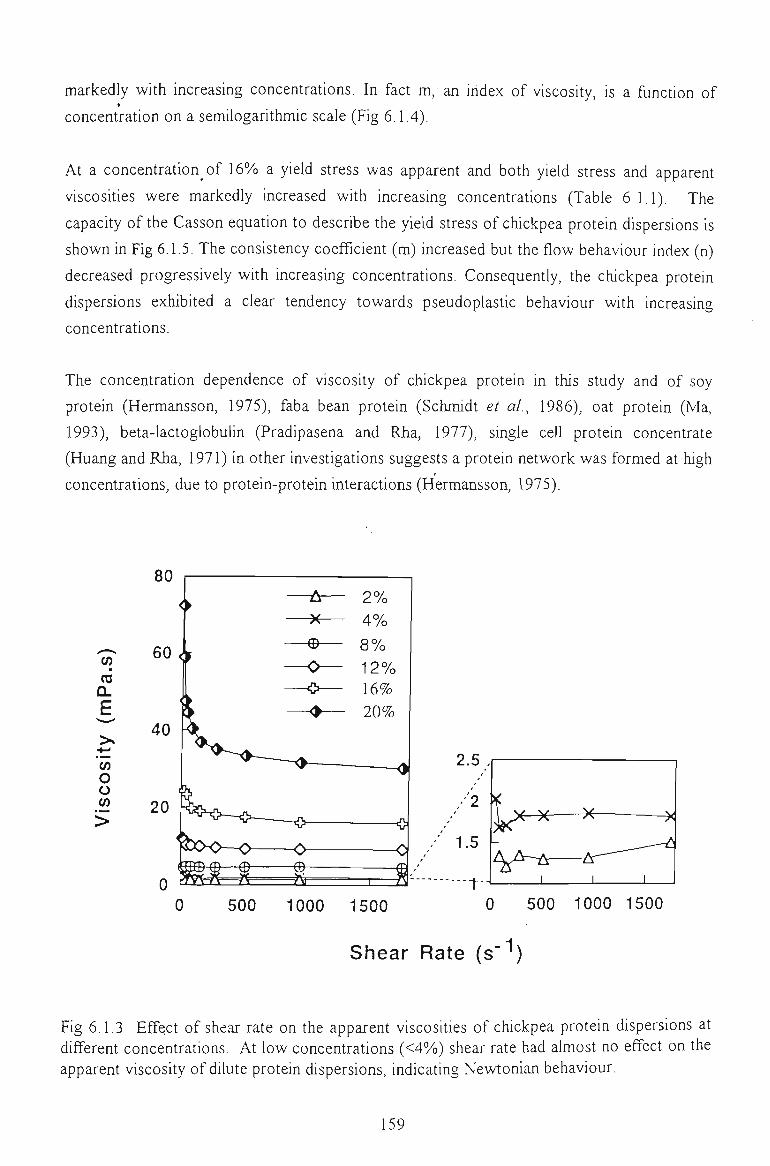
markedly with increasing concentrations. In fact m, an index of viscosity, is a fijnction of •
concentration on a semilogarithmic scale (Fig 6.1.4).
At a concentration of 16% a yield stress was apparent and both yield stress and apparent
viscosities were markedly increased wUh increasing concentrations (Table 6.1.1). The
capacity of the Casson equation to describe the yield stress of chickpea protein dispersions is
shown in Fig 6.1.5. The consistency coefficient (m) increased but the flow behaviour index (n)
decreased progressively with increasing concentrations. Consequently, the chickpea protein
dispersions exhibited a clear tendency towards pseudoplastic behaviour with increasing
concentrations.
The concentration dependence of viscosity of chickpea protein in this study and of soy
protein (Hermansson, 1975), faba bean protein (Schmidt et al, 1986), oat protein (Ma,
1993), beta-lactoglobulin (Pradipasena and Rha, 1977), single cell protein concentrate
(Huang and Rha, 1971) in other investigations suggests a protein network was formed at high
concentrations, due to protein-protein interactions (Hermansson, 1975).
Q.
E
o o
500 1000 1500 500 1000 1500
Shear Rate (s"'')
Fig 6.1.3 Effect of shear rate on the apparent viscosities of chickpea protein dispersions at different concentrations. At low concentrations (<4%) shear rate had almost no effect on the apparent viscosity of dilute protein dispersions, indicating Newtonian behaviour.
,59
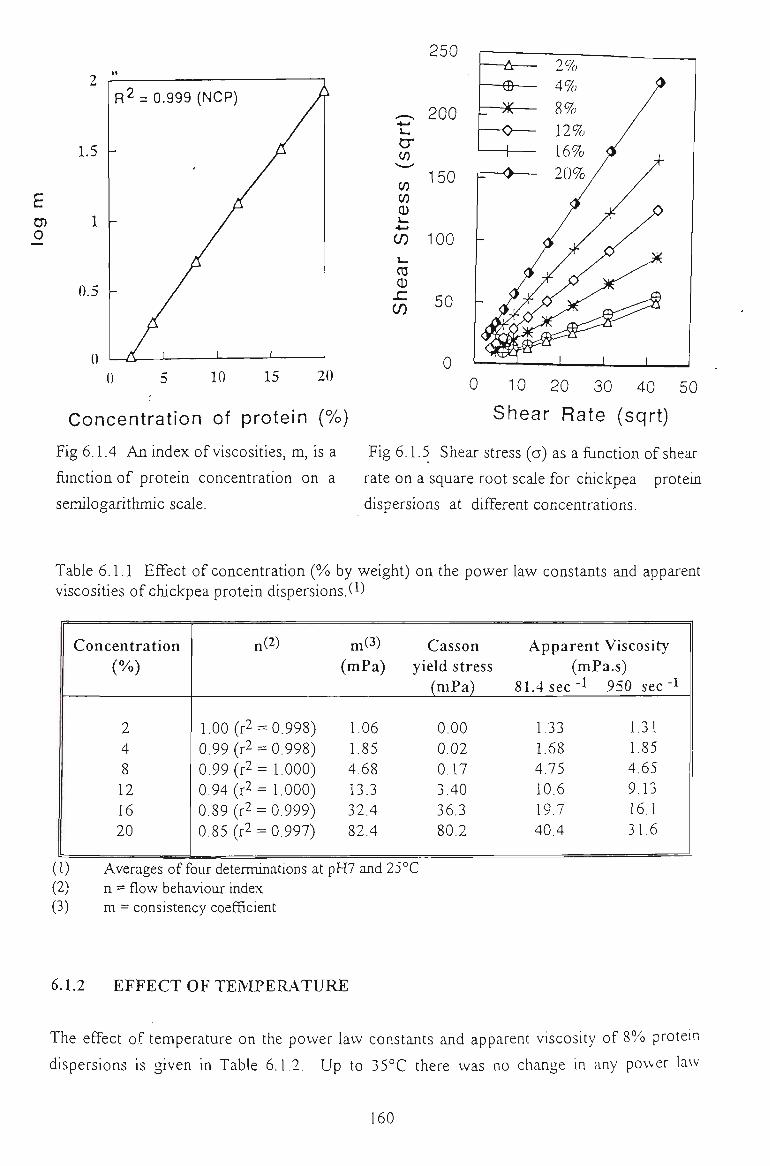
O) 0
1.5 -
0.5 -
Concentration of protein (%)
Fig 6.1.4 An index of viscosities, m, is a
function of protein concentration on a
a-(/)
CD
250 r-
200 -
150 -
semilogarithmic scale.
(/) 100
ca
(S 50
0 0 10 20 30 40
Shear Rate (sqrt)
Fig 6.1.5 Shear stress (a) as a function of shear
rate on a square root scale for chickpea protein
dispersions at different concentrations.
Table 6.1.1 Effect of concentration (% by weight) on the power law constants and apparent viscosities of chickpea protein dispersions.(^)
Concentration (%)
2 4 8 12 16 20
n(2)
1.00 (r2 = 0.998) 0.99 (r2 = 0.998) 0.99 (r2 = 1.000) 0.94 (r2= 1.000) 0.89 (r2 = 0.999) 0.85 (r2 = 0.997)
m(3)
(mPa)
1.06 1.85 4.68 13.3 32.4 82.4
Casson yield stress
(mPa)
0.00 0.02 0.17 3.40 36.3 80.2
Apparent Viscosity (mPa.s)
81.4 sec •! 950 sec '^
1.33 1.31 1.68 1.85 4,75 4.65 10.6 9.13 19.7 16.1 40.4 31.6
(1) Averages of four determinations at pH7 and 25°C (2) n = flow behaviour index (3) m = consistency coefficient
6.1.2 EFFECT OF TEMPERATURE
The effect of temperature on the power law constants and apparent viscosity of 8% protein
dispersions is given in Table 6.1.2. Up to 35°C there was no change in any power law
160
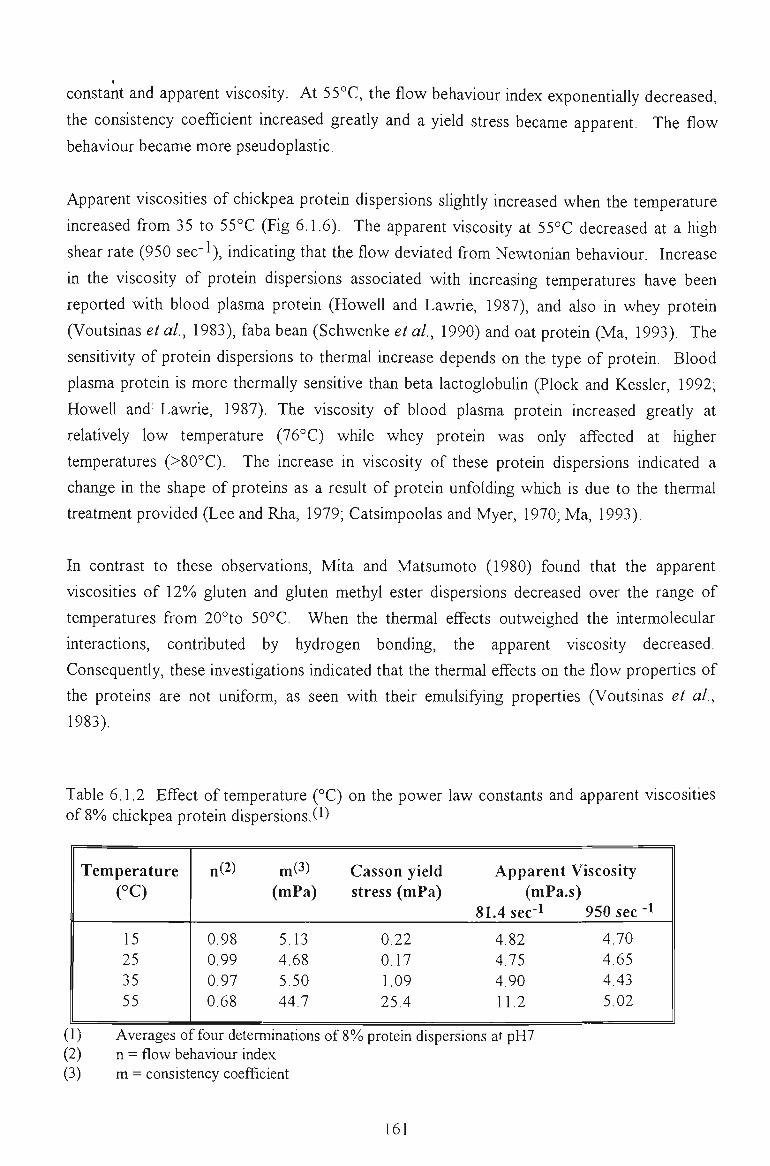
constant and apparent viscosity. At 55°C, the flow behaviour index exponentially decreased,
the consistency coefficient increased greatly and a yield stress became apparent. The flow
behaviour became more pseudoplastic.
Apparent viscosities of chickpea protein dispersions slightly increased when the temperature
increased from 35 to 55°C (Fig 6.1.6). The apparent viscosity at 55°C decreased at a high
shear rate (950 sec"l), indicating that the flow deviated from Newtonian behaviour. Increase
in the viscosity of protein dispersions associated with increasing temperatures have been
reported with blood plasma protein (Howell and Lawrie, 1987), and also in whey protein
(Voutsinas et al, 1983), faba bean (Schwenke et al, 1990) and oat protein (Ma, 1993). The
sensitivity of protein dispersions to thermal increase depends on the type of protein. Blood
plasma protein is more thermally sensitive than beta lactoglobuUn (Plock and Kessler, 1992;
Howell and' Lawrie, 1987). The viscosity of blood plasma protein increased greatly at
relatively low temperature (76°C) while whey protein was only affected at higher
temperatures (>80°C). The increase in viscosity of these protein dispersions indicated a
change in the shape of proteins as a resuU of protein unfolding which is due to the thermal
treatment provided (Lee and Rha, 1979; Catsimpoolas and Myer, 1970; Ma, 1993).
In contrast to these observations, Mita and Matsumoto (1980) found that the apparent
viscosities of 12% gluten and gluten methyl ester dispersions decreased over the range of
temperatures from 20°to 50°C. When the thermal effects outweighed the intermolecular
interactions, contributed by hydrogen bonding, the apparent viscosity decreased.
Consequently, these investigations indicated that the thermal effects on the flow properties of
the proteins are not uniform, as seen with their emulsifying properties (Voutsinas et al,
1983).
Table 6.1.2 Effect of temperature (°C) on the power law constants and apparent viscosUies of 8%) chickpea protein dispersions,(1)
Temperature (°C)
15 25 35 55
n(2)
0.98 0.99 0.97 0.68
m(3) (mPa)
5.13 4.68 5.50 44.7
Casson yield stress (mPa)
0.22 0.17 1.09 25.4
Apparent Viscosity (mPa.s)
81.4 sec-1 950 sec "1
4.82 4.70 4.75 4.65 4.90 4.43 11.2 5.02
(1) Averages of four determinations of 8 % protein dispersions at pH7 (2) n = flow behaviour index (3) m = consistency coefficient
161
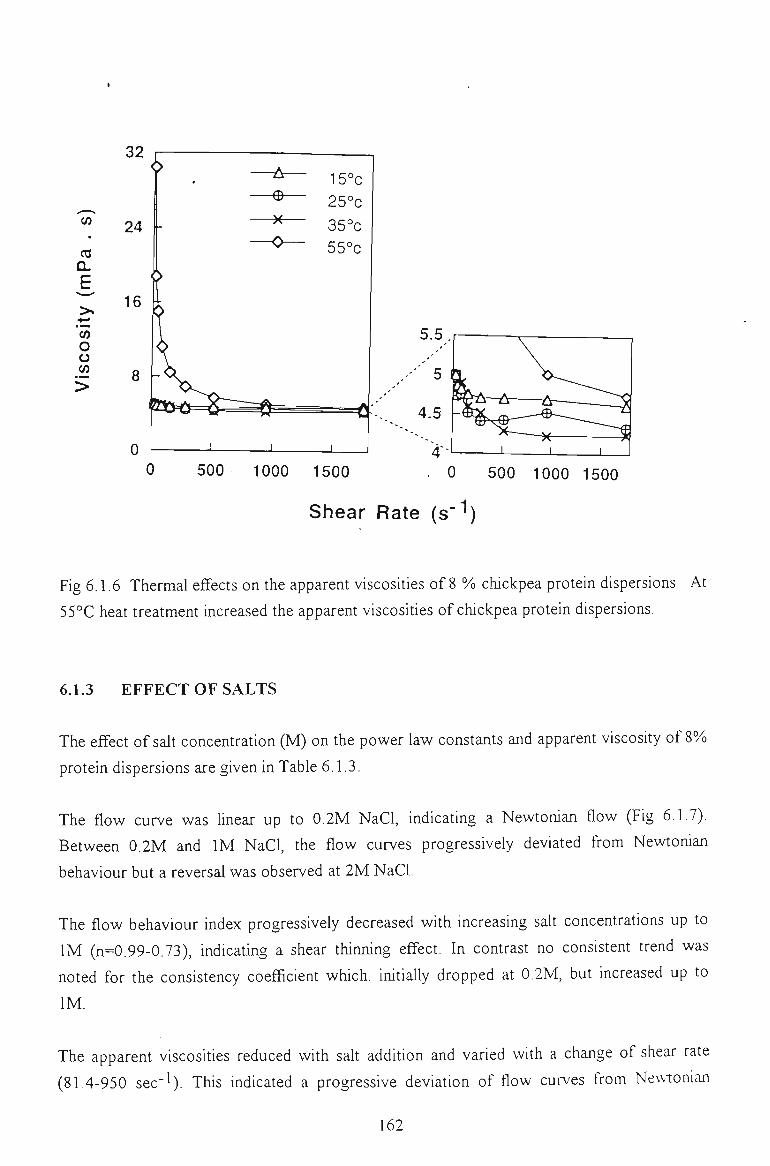
ro
E
w o o CO
500 1000 1500 . 0 500 1000 1500
Shear Rate (s""')
Fig 6.1.6 Thermal effects on the apparent viscosities of 8 %> chickpea protein dispersions. At
55°C heat treatment increased the apparent viscosUies of chickpea protein dispersions.
6.1.3 EFFECT OF SALTS
The effect of salt concentration (M) on the power law constants and apparent viscosity of 8%
protein dispersions are given in Table 6.1.3.
The flow curve was linear up to 0.2M NaCl, indicating a Newtonian flow (Fig 6.1.7).
Between 0.2M and IM NaCl, the flow curves progressively deviated from Newtonian
behaviour but a reversal was observed at 2M NaCl.
The flow behaviour index progressively decreased with increasing salt concentrations up to
IM (n=0.99-0.73), indicating a shear thinning effect. In contrast no consistent trend was
noted for the consistency coefficient which, initially dropped at 0.2M, but increased up to
IM.
The apparent viscosities reduced with saU addition and varied with a change of shear rate
(81.4-950 sec-^). This indicated a progressive deviation of flow curves from Newtonian
162
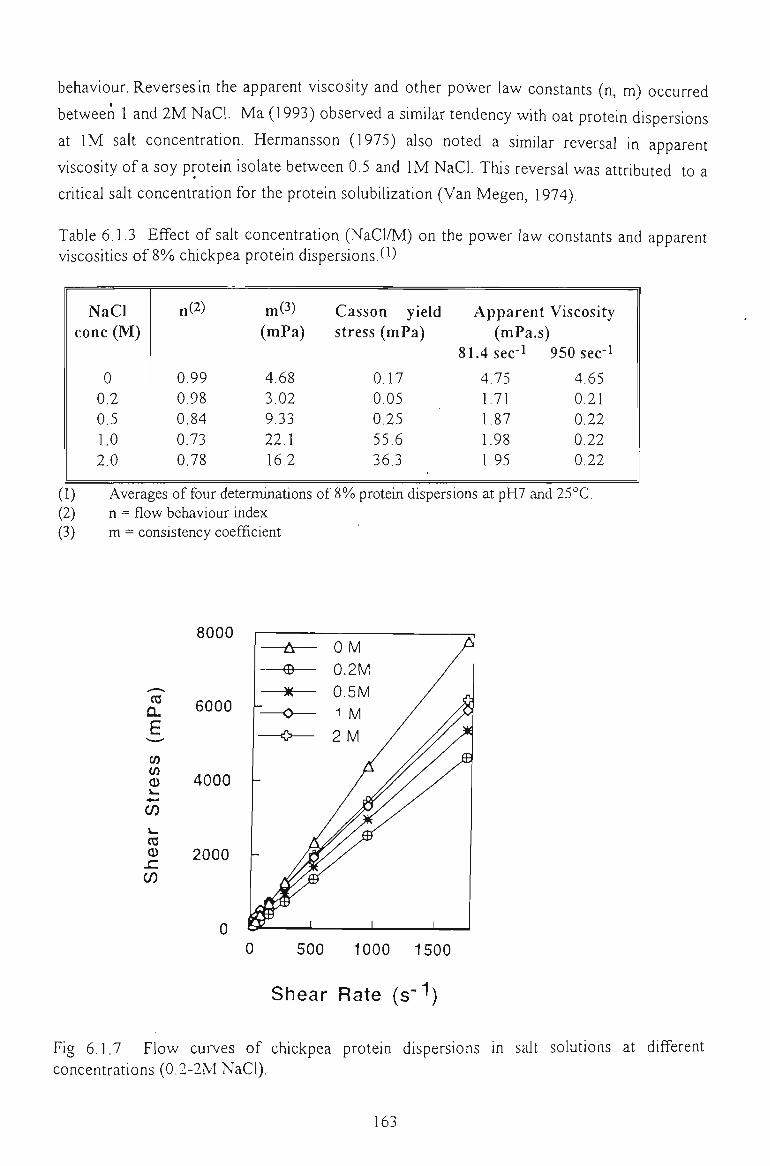
behaviour. Reverses in the apparent viscosity and other power law constants (n, m) occurred
between 1 and 2M NaCl. Ma (1993) observed a similar tendency wUh oat protein dispersions
at IM saU concentration. Hermansson (1975) also noted a similar reversal in apparent
viscosity of a soy protein isolate between 0.5 and IM NaCl. This reversal was attributed to a
critical saU concentration for the protein solubiUzation (Van Megen, 1974).
Table 6.1.3 Effect of salt concentration (NaCl/M) on the power law constants and apparent viscosities of 8% chickpea protein dispersions.(1)
NaCl cone (M)
0 0.2 0.5 1.0 2.0
n(2)
0.99 0.98 0.84 0.73 0.78
m(3) (mPa)
4.68 3.02 9.33 22.1 16.2
Casson yield stress (mPa)
0.17 0.05 0.25 55.6 36.3
Apparent Viscosity (mPa.s)
81.4 sec-1 950 sec"!
4.75 4.65 1.71 0.21 1.87 0.22 1.98 0.22 1.95 0.22
(1) Averages of four determinations of 8% protein dispersions at pH7 and 25°C. (2) n = flow behaviour index (3) m = consistency coefficient
ro
a w 03 O L_
* - < CO
ro
JC C/)
8000
6000 -
4000 -
2000 -
0 500 1000 1500
Shear Rate (s""^)
Fig 6.1.7 Flow curves of chickpea protein dispersions in salt solutions at different concentrations (0.2-2M NaCl).
163
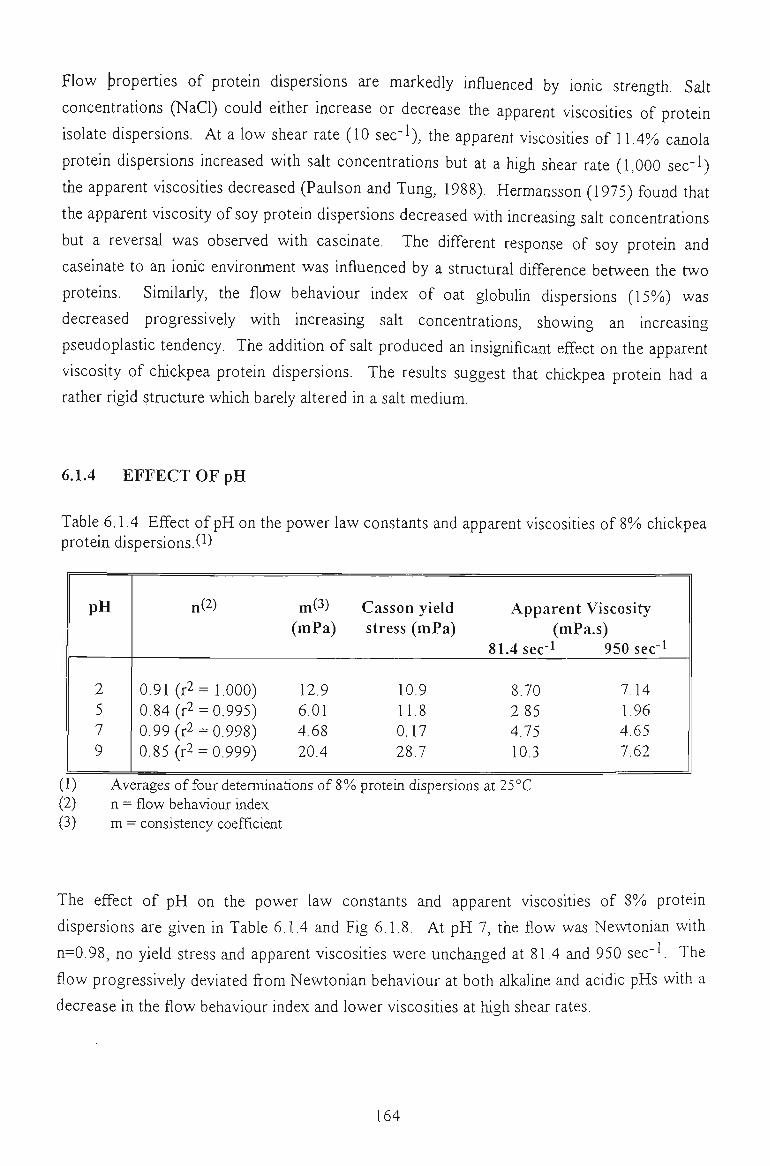
Flow {properties of protein dispersions are markedly influenced by ionic strength. Salt
concentrations (NaCl) could either increase or decrease the apparent viscosities of protein
isolate dispersions. At a low shear rate (10 sec'l), the apparent viscosities of 11.4% canola
protein dispersions increased with salt concentrations but at a high shear rate (1,000 sec~l)
the apparent viscosities decreased (Paulson and Tung, 1988). Hermansson (1975) found that
the apparent viscosity of soy protein dispersions decreased wUh increasing salt concentrations
but a reversal was observed with caseinate. The different response of soy protein and
caseinate to an ionic environment was influenced by a structural difference between the two
proteins. Similarly, the flow behaviour index of oat globuUn dispersions (15%) was
decreased progressively with increasing saU concentrations, showing an increasing
pseudoplastic tendency. The addition of salt produced an insignificant effect on the apparent
viscosity of chickpea protein dispersions. The resuUs suggest that chickpea protein had a
rather rigid structure which barely altered in a salt medium.
6.1.4 EFFECT OF pH
Table 6.1.4 Effect of pH on the power law constants and apparent viscosities of 8%) chickpea protein dispersions.(^)
pH
2 5 7 9
n(2)
0.91 (r2= 1.000) 0.84 (r2 = 0.995) 0.99 (r2 = 0.998) 0.85 (r2 = 0.999)
m(3)
(mPa)
12.9 6.01 4.68 20.4
Casson yield stress (mPa)
10.9 11.8 0.17 28.7
Apparent Viscosity (mPa.s)
81.4 sec-1 950 sec"!
8.70 7.14 2.85 1,96 4.75 4.65 10.3 7.62
(1) Averages of four detemiinations of 8% protein dispersions at 25°C. (2) n = flow behaviour index (3) m = consistency coefficient
The effect of pH on the power law constants and apparent viscosUies of 8%) protein
dispersions are given in Table 6.1.4 and Fig 6.1.8. At pH 7, the flow was Newtonian with
n=0.98, no yield stress and apparent viscosities were unchanged at 81.4 and 950 sec'V The
flow progressively deviated from NeAvtonian behaviour at both alkaline and acidic pHs with a
decrease in the flow behaviour index and lower viscosities at hish shear rates.
164
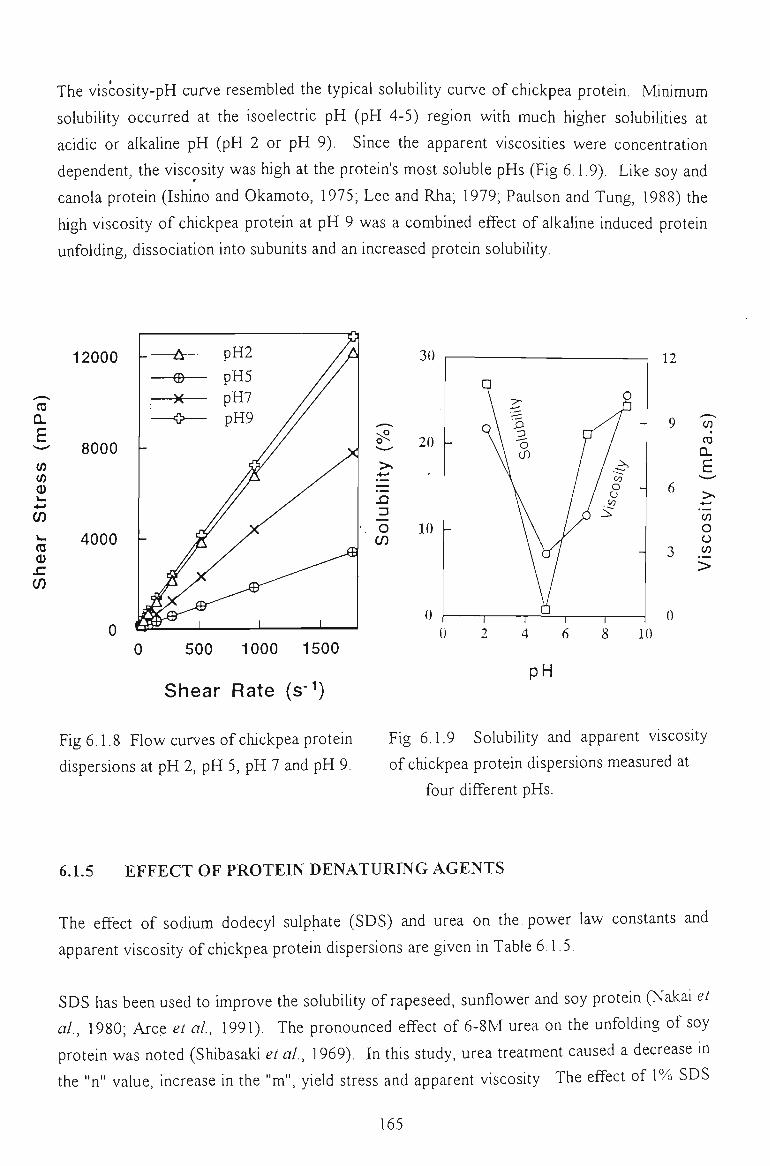
The viscosity-pH curve resembled the typical solubility curve of chickpea protein. Minimum
solubility occurred at the isoelectric pH (pH 4-5) region with much higher solubiUties at
acidic or alkaline pH (pH 2 or pH 9). Since the apparent viscosities were concentration
dependent, the viscosity was high at the protein's most soluble pHs (Fig 6.1.9). Like soy and
canola protein (Ishino and Okamoto, 1975; Lee and Rha; 1979; Paulson and Tung, 1988) the
high viscosity of chickpea protein at pH 9 was a combined effect of alkaline induced protein
unfolding, dissociation into subunits and an increased protein solubility.
ro o
J::
12000
ro Q. E ^ 8000 -(0
4000 -
500 1000 1500
Shear Rate (s"^)
o^
SI
o
20
10
0
\ ' \ " — •
o\ S \ \ '-' \ \ "o w
1 1
y^ 1 ~
/ / ^ / / c? / / O -/ / C) / / .<^
6 ^
-
i 1
pH
12
- 9
3 .^
10
ro Q. E
CO o o CO
Fig 6.1.8 Flow curves of chickpea protein Fig 6.1.9 Solubility and apparent viscosity
dispersions at pH 2, pH 5, pH 7 and pH 9. of chickpea protein dispersions measured at
four different pHs.
6.1.5 EFFECT OF PROTEIN DENATUREVG AGENTS
The effect of sodium dodecyl sulphate (SDS) and urea on the,power law constants and
apparent viscosity of chickpea protein dispersions are given in Table 6.1.5.
SDS has been used to improve the solubility of rapeseed, sunflower and soy protein (Nakai et
al, 1980; Arce et al, 1991). The pronounced effect of 6-8M urea on the unfolding of soy
protein was noted (Shibasaki et al, 1969). In this study, urea treatment caused a decrease m
the "n" value, increase in the "m", yield stress and apparent viscosity. The effect of 1% SDS
165
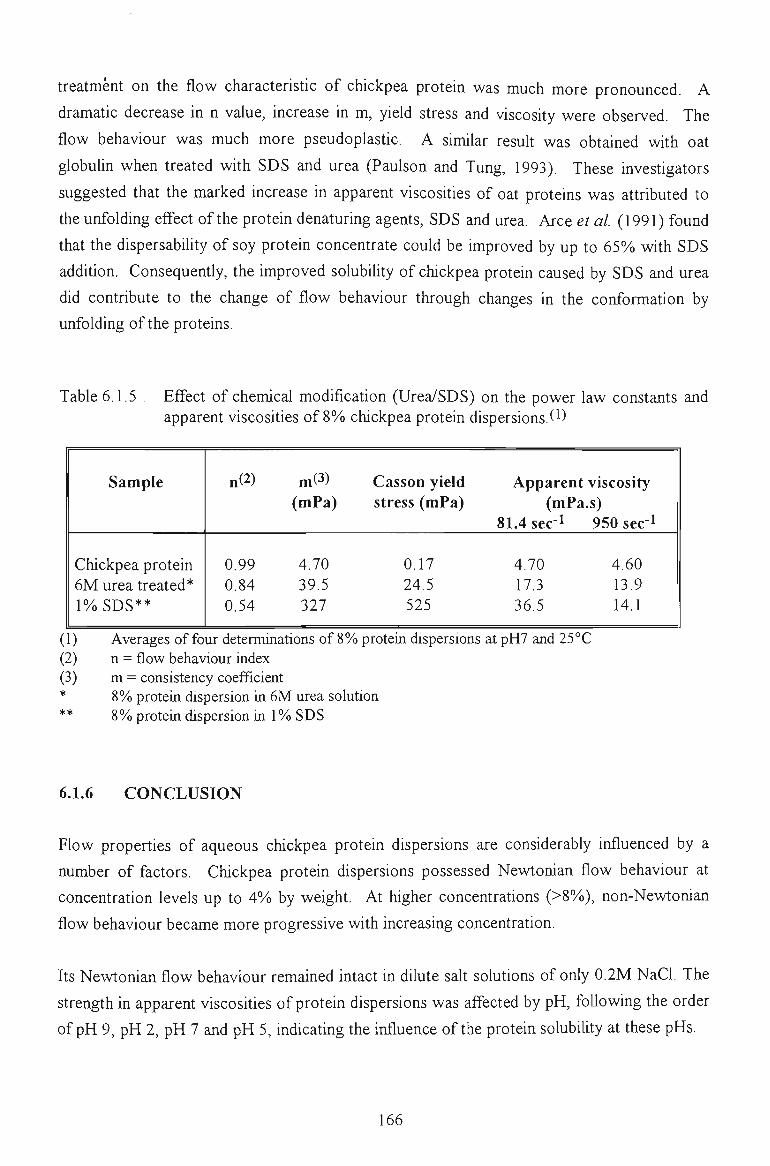
treatment on the flow characteristic of chickpea protein was much more pronounced. A
dramatic decrease in n value, increase in m, yield stress and viscosity were observed. The
flow behaviour was much more pseudoplastic. A similar resuU was obtained wUh oat
globulin when treated with SDS and urea (Paulson and Tung, 1993). These investigators
suggested that the marked increase in apparent viscosities of oat proteins was attributed to
the unfolding effect of the protein denaturing agents, SDS and urea. Arce et al (1991) found
that the dispersability of soy protein concentrate could be improved by up to 65%) with SDS
addition. Consequently, the improved solubility of chickpea protein caused by SDS and urea
did contribute to the change of flow behaviour through changes Ui the conformation by
unfolding of the proteins.
Table 6.1.5 . Effect of chemical modification (Urea/SDS) on the power law constants and apparent viscosities of 8%o chickpea protein dispersions.(1)
Sample n(2) m(-*) Casson yield Apparent viscosity (mPa) stress (mPa) (mPa.s)
81.4 sec-1 950 sec'l
Chickpea protein 6M urea treated* 1% SDS**
0.99 4.70 0.17 4.70 4.60 0.84 39.5 24.5 17.3 13.9 0.54 327 525 36.5 14.1
(1) Averages of four determinations of 8% protein dispersions at pH7 and 25°C (2) n = flow behaviour index (3) m = consistency coefficient * 8% protein dispersion in 6M urea solution
8% protein dispersion m 1% SDS **
6.1.6 CONCLUSION
Flow properties of aqueous chickpea protein dispersions are considerably influenced by a
number of factors. Chickpea protein dispersions possessed Newtonian flow behaviour at
concentration levels up to 4% by weight. At higher concentrations (>8%)), non-Newtonian
flow behaviour became more progressive with increasing concentration.
Its Newtoruan flow behaviour remained intact in dilute salt solutions of only 0.2M NaCl. The
strength in apparent viscosUies of protein dispersions was affected by pH, foUowing the order
of pH 9, pH 2, pH 7 and pH 5, indicating the influence of the protein solubility at these pHs.
166
I
Within the investigated temperatures (15, 25, 35 and 55°C), all the power law constants were
unchanged up to 35°C but the flow behaviour became non-Newtonian at 55°C. This
suggested a formation of a protein network induced by thermal treatment.
Denaturation by urea and sodium dodecyl sulphate (SDS) increased the consistency index
(m), Casson yield stress and apparent viscosities, and the flow became more pseudoplastic
with a decrease in the flow index (n). These changes were attributed to the unfolding effect
of the protein denaturing agents.
In conclusion, changes in flow behaviour of these protein dispersions resuUed from the
formation of a protein network, dissociation, ionic and hydrophobic interactions and
particularly the solubility of chickpea proteins under different environmental condUions.
6.2 FLOW PROPERTIES OF ACETYLATED CHICKPEA PROTEINS
As briefly discussed in Chapter 5, functional properties of proteins can be chemically or
enzymatically modified (Matheis and Whitetaker, 1984; Campbell et al, 1992). Acetylation
has been used to improve several fimctional properties of some native proteins with low
functionalities. By introducing acetyl groups to the protein molecules, acetylation improved
the emulsifying capacity, emulsion stability, foam capacity and stability and water absorption
in pea (Johnson and Brekke, 1983), soy (Kim and Rhee, 1989), winged bean (Narayana and
Narasinga Rao, 1984) and rapeseed proteins (Gwiazda et al, 1989).
The effect of acetylation on these functional properties varied with the degree of modification
and also with different types of proteins. For example, acetylation could increase or decrease
the interfacial tension at the oil/water interface of rapeseed protein dispersions, depending on
the degree of modification (Schwenke et al, 1991). Hydrophobicity of glycinin could
increase at high degrees of acetylation but could also decrease at low degrees of acetylation
(Kim and Rhee, 1989). These observations suggested composition and also conformation
changes in the protein molecules at different levels due to modifications, leading to different
changes in several functional properties of the acetylated proteins.
Acetylation, therefore, does not only improve functionality, tastes and appearances of some
proteins for wider usage in the food industries (Rhama and Rao, 1983; Franzen and Kinsella,
1976a,b) but U also provides a means to more clearly understand their fianctional properties
(Rhee, 1989). The effect of acetylation on the flow and other rheological properties of some
167
food proteins has been investigated (Ma, 1993). Acetylation caused an increase in the
specific viscosity of glycinin since Us globular conformation was expanded and denatured due
to Us chemical modification (Kim and Rhee, 1989). Yamauchi and co workers (1979)
showed that highly acetylated glycinin underwent drastic conformational changes m which
most of the modified proteins were polymerised or dissociated to smaller protein molecules.
Their conformational changes affected their viscosities. Acetylation increased the viscosity of
both low and high density lipoproteins of egg yolk (Tsutsui et al, 1980). Viscosity behaviour
of faba bean and field peas protein dispersions were also affected by the degree of acetylation
(Schmidt etal, 1986; Schmidt and Schmandke, 1987).
The rheological behaviour of native chickpea protein dispersions was mvestigated and
presented in the previous section. This section reports on the flow properties of acetylated
chickpea protein dispersions in an attempt to elucidate the effect of acetylation at different
levels on the flow properties of protein dispersions.
6.2.1 EFFECT OF PROTEIN CONCENTRATION AND EXTENT OF
ACETYLATION
The flow curves of 6% acetylated chickpea protein (ACP6) dispersions at different
concentrations are given in Fig 6.2.1. The slope of these flow curves increases remarkably
with increased concentrations. At 1%) concentration, the flow curve was linear, indicating
Newtoruan behaviour. At higher concentrations {14%), the flow curves became non linear,
showing a deviation from the Newtonian characteristics. The effect of protein concentration
on the power law constants and apparent viscosities of the acetylated chickpea dispersions is
Ulustrated in Table 6.2.1. For comparison, the previously pubhshed data on native chickpea
protein (NCP) is also given.
The flow exhibited both shear thinning and thickening behaviour, depending on the protein
concentration. At a very dilute concentration {\%), the flow index increased (n=1.10) while
at higher concentrations (4-20%)) the flow index decreased (n=0.77-0.38), indicating a great
deviation from Newtoruan behaviour. The pronounced increasing pseudo plasticity
associated with increasing protein concentration of acetylated chickpea proteins was reflected
by a drastic increase in the consistency coefficient (m), yield stress and apparent viscosities.
Fig 6.2.2 shows the consistency coefficient on a semi logarithmic scale for acetylated
chickpea proteins which was much higher than that of the native one at the same protein
concentration. Apparent viscosUies of acetylated chickpea proteins increased exponentially
from 6.4 mPa.s to 1,298 mPa.s while those of native chickpea proteins only increased from
1.68 to 40.4 mPa.s when protein concentrations increased from 4 to 20%).
168
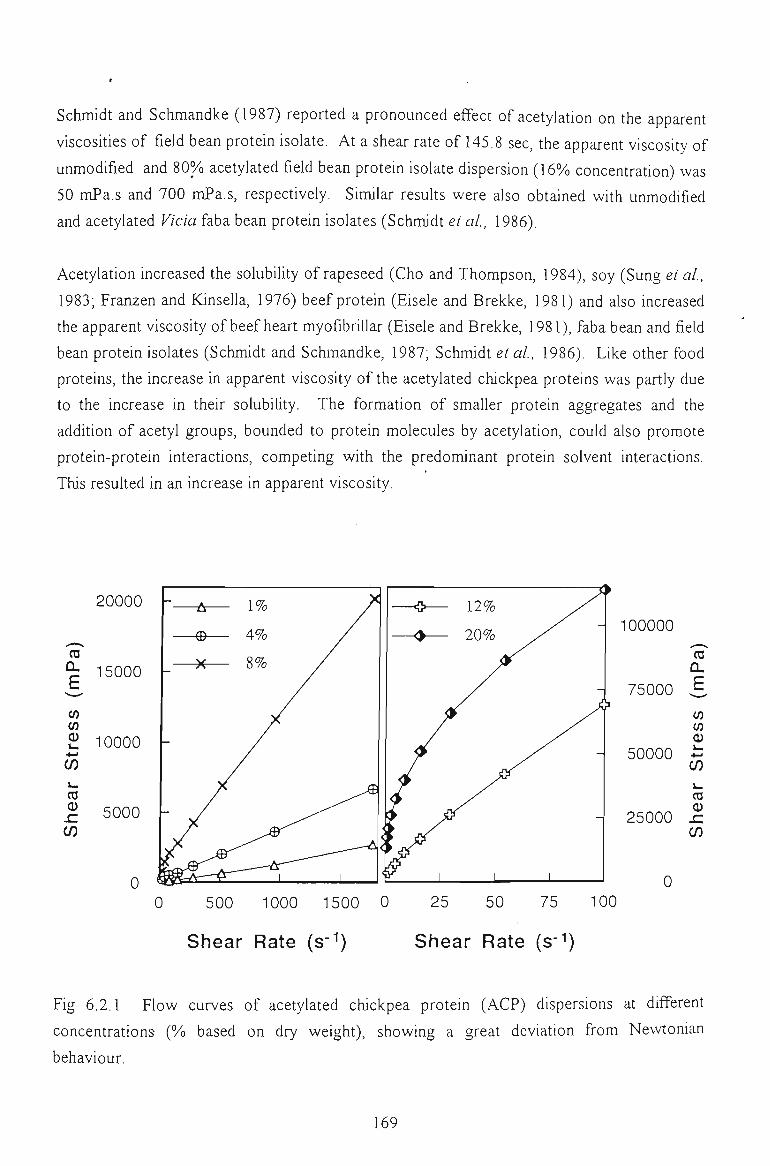
Schmidt and Schmandke (1987) reported a pronounced effect of acetylation on the apparent
viscosities of field bean protein isolate. At a shear rate of 145.8 sec, the apparent viscosity of
unmodified and 80% acetylated field bean protein isolate dispersion (16%) concentration) was
50 mPa.s and 700 mPa.s, respectively. Similar resuUs were also obtained wUh unmodified
and acetylated Vicia faba bean protein isolates (Schmidt et al, 1986).
Acetylation increased the solubUity of rapeseed (Cho and Thompson, 1984), soy (Sung et al,
1983; Franzen and Kinsella, 1976) beef protein (Eisele and Brekke, 1981) and also increased
the apparent viscosity of beef heart myofibriUar (Eisele and Brekke, 1981), faba bean and field
bean protein isolates (Schmidt and Schmandke, 1987; Schmidt et al, 1986). Like other food
proteins, the increase in apparent viscosity of the acetylated chickpea proteins was partly due
to the increase in their solubility. The formation of smaller protein aggregates and the
addition of acetyl groups, bounded to protein molecules by acetylation, could also promote
protein-protein interactions, competing with the predominant protein solvent Uiteractions.
This resulted in an increase in apparent viscosity.
20000
ro CL
g
Str
ess
ro sz C/3
15000
10000
5000
0
100000
75000
ro Q. E Cfl (0 <u
H 50000 i : C/5
ro 25000 .c
CO
0 0 500 1000 1500 0 25 50 75 100
Shear Rate (s""") Shear Rate (s-^)
Fig 6.2.1 Flow curves of acetylated chickpea protein (ACP) dispersions at different
concentrations (%> based on dry weight), showing a great deviation from Newtonian
behaviour.
169
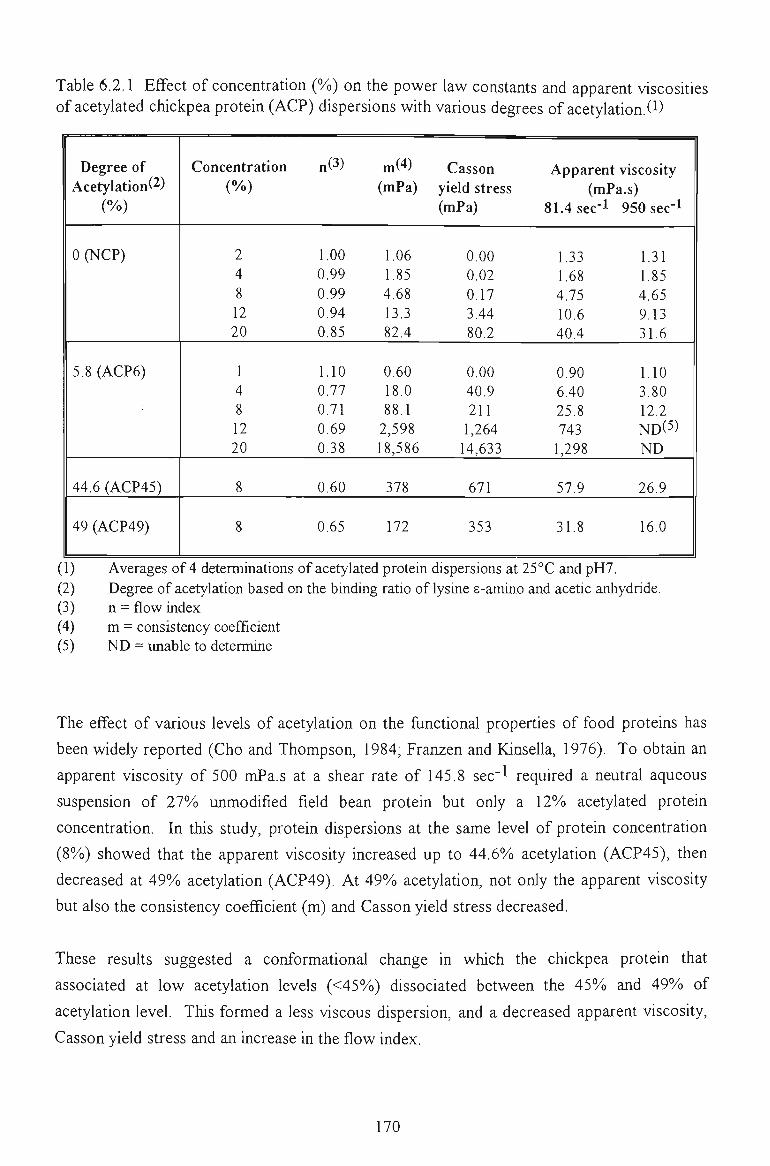
Table 6.2.1 Effect of concentration {%) on the power law constants and apparent viscosities of acetylated chickpea protein (ACP) dispersions with various degrees of acetylation. (1)
Degree of Acetylation(2)
(%)
0(NCP)
5.8 (ACP6)
44.6 (ACP45)
49 (ACP49)
Concentration (%)
2 4 8 12 20
1 4 8 12 20
8
8
n(3)
1.00 0.99 0.99 0.94 0.85
1.10 0.77 0.71 0.69 0.38
0.60
0.65
m(4) (mPa)
1.06 1.85 4.68 13.3 82.4
0.60 18.0 88.1
2,598 18,586
378
172
Casson yield stress (mPa)
0.00 0.02 0.17 3.44 80.2
0.00 40.9 211
1,264 14,633
671
353
Apparent viscosity (mPa.s)
81.4sec-l 950sec-l
1.33 1.31 1.68 1.85 4.75 4.65 10.6 9.13 40.4 31.6
0.90 1.10 6.40 3.80 25.8 12.2 743 ND(5)
1,298 ND
57.9 26.9
31.8 16.0
(1) Averages of 4 determinations of acetylated protein dispersions at 25°C and pH7. (2) Degree of acetylation based on the binding ratio of lysine s-amino and acetic anhydride. (3) n = flow index (4) m = consistency coefficient (5) ND = vmable to determine
The effect of various levels of acetylation on the functional properties of food proteins has
been widely reported (Cho and Thompson, 1984; Franzen and KinseUa, 1976). To obtain an
apparent viscosity of 500 mPa.s at a shear rate of 145.8 sec'l required a neutral aqueous
suspension of 27%) unmodified field bean protein but only a 12%o acetylated protein
concentration. In this study, protein dispersions at the same level of protein concentration
(8%) showed that the apparent viscosity increased up to 44.6%) acetylation (ACP45), then
decreased at 49%) acetylation (ACP49). At 49%) acetylation, not only the apparent viscosity
but also the consistency coefficient (m) and Casson yield stress decreased.
These results suggested a conformational change in which the chickpea protein that
associated at low acetylation levels (<45%)) dissociated between the 45%) and 49%) of
acetylation level. This formed a less viscous dispersion, and a decreased apparent viscosity,
Casson yield stress and an increase in the flow index.
170
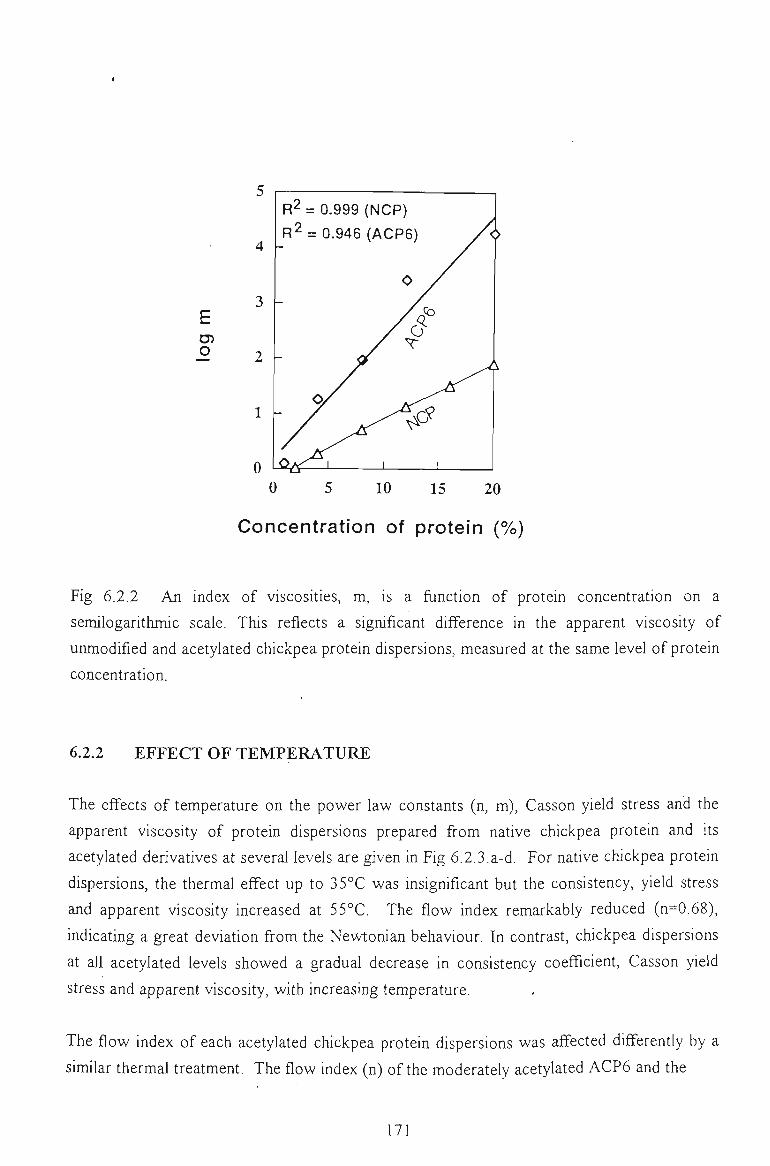
o
R2 = 0.999 (NCP)
R2 = 0.946 (ACP6)
0 10 15 20
Concentration of protein (%)
Fig 6.2.2 An index of viscosities, m, is a function of protein concentration on a
semilogarithmic scale. This reflects a significant difference in the apparent viscosity of
unmodified and acetylated chickpea proteiri dispersions, measured at the same level of protein
concentration.
6.2.2 EFFECT OF TEMPERATURE
The effects of temperature on the power law constants (n, m), Casson yield stress and the
apparent viscosity of protein dispersions prepared from native chickpea protein and its
acetylated derivatives at several levels are given in Fig 6.2.3.a-d. For native chickpea protein
dispersions, the thermal effect up to 35°C was insignificant but the consistency, yield stress
and apparent viscosity increased at 55°C. The flow index remarkably reduced (n=0.68),
indicating a great deviation from the Newtonian behaviour. In contrast, chickpea dispersions
at all acetylated levels showed a gradual decrease in consistency coefficient, Casson yield
stress and apparent viscosity, with increasing temperature.
The flow index of each acetylated chickpea protein dispersions was affected differently by a
similar thermal treatment. The flow index (n) of the moderately acetylated ACP6 and the
171
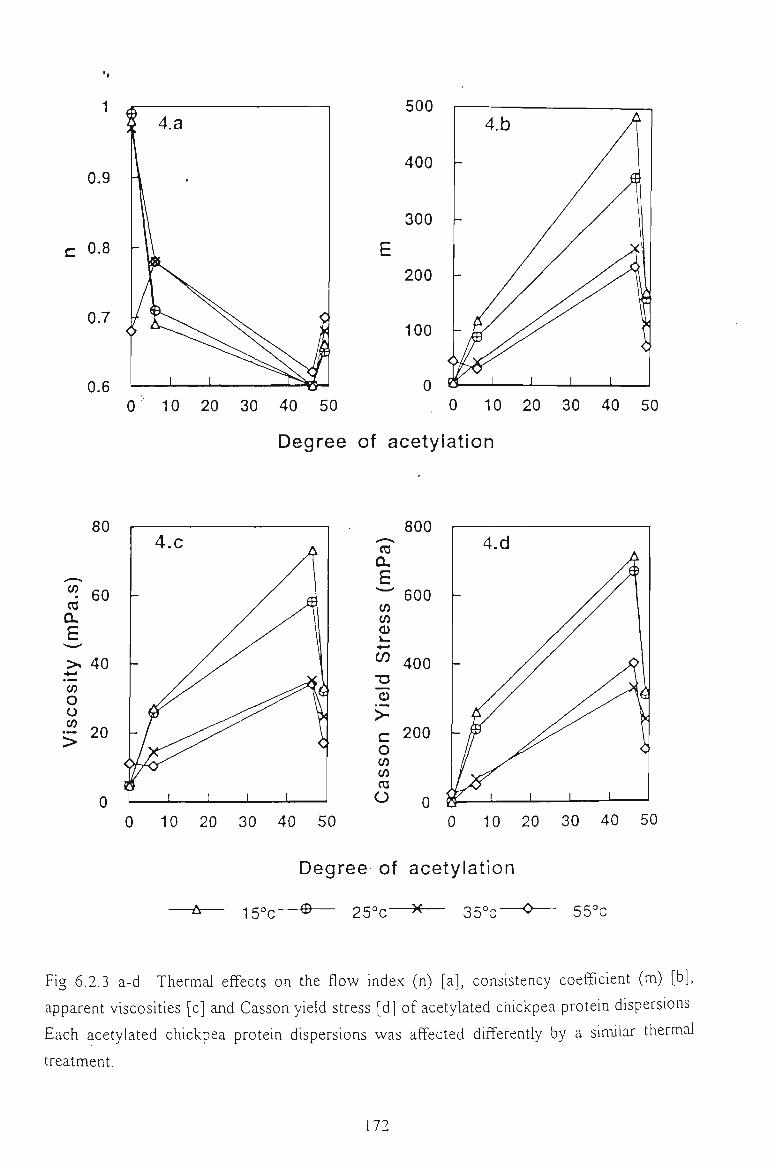
0.9
0.8
0.7
0.6
500
400 -
300
200 -
100 -
O' 10 20 30 40 50 .0 10 20 30 40 50
Degree of acetylation
ro CL
g w CO 0) )ta
•*->
(fi
o > c o cn (fi ro O
800
600 -
400 -
200 -
10 20 30 40 50 10 20 30 40 50
Degree of acetylation
15°c—®— 2 5 ° c — ^ 35°c- 55°c
Fig 6.2.3 a-d Thermal effects on the flow index (n) [a], consistency coefficient (m) [b],
apparent viscosities [c] and Casson yield stress [d] of acetylated chickpea protein dispersions.
Each acetylated chickpea protein dispersions was affected differently by a similar thermal
treatment.
172
exhaustively acetylated ACP49 increased (n^O.69-0.78; n=0.66-0.70, respectively) with
increasing temperature (15 to 55°C). That of ACP45 was almost constant (n=0.60). The
flow index of acetylated chickpea proteins in this study seems to be a function of acetylation
extent (Fig 6.2.3.a). Regardless of treated temperatures, ACP45 always exhibited the lowest
flow index. This observation indicated that the native chickpea proteins could be associated
to form large units up to 44.5%) level of acetylation, but at higher levels of acetylation the
associated proteins could be gradually dissociated, resulting in an increase in the flow index.
All acetylated chickpea protein dispersions showed a decrease in the consistency coefficient
(Fig 6.2.3.b), Casson yield stress (Fig 6.2.3.d) and their subsequent apparent viscosities (Fig
6.2.3.C), with those of ACP6 and ACP49 being much lower than that of ACP45. Apparent
viscosities of all acetylated chickpea proteins decreased with increasing temperatures (Fig
6.2.3.C). Similar observations were reported with gluten, gluten methyl ester (Mita and
Matsumoto, 1980), egg albumen (Tung et al, 1971) and succinylated chickpea proteins (Liu
and Hung, 1995). However, Howell and Lawrie (1987) found that the viscosity of blood
plasma proteins increased remarkably when the temperature increased from 20 to 76°C,
Apparent viscosities of faba bean proteins and field pea proteins increased exponentially
with an increase in temperature and the degree of acetylation (Schmidt et al, 1986, 1987),
Flow behaviour of these proteins indicated that thermal treatments do not uniformly affect
their consistency coefficient and also their apparent viscosities. Protein type and the level of
chemical modification influenced their flow characteristics. Viscosity changes in the
partially acetylated protein isolates from pollack muscle were almost identical to those of
unacetylated isolates (Pavlova et al, 1991).
Viscosity changes under the same thermal treatment in this study reflected the effect of
degree of acetylation. High viscosities of ACP45 over a wide range of temperatures
followed by lower viscosities of ACP49 once again suggested a maximum for the acetylated
state. Above it, the associated proteins were dissociated. In the present study, the different
behaviour of acetylated chickpea protein dispersions under thermal treatments indicated the
great effect of acetylation on these protein conformations and their viscosities. As seen with
emulsifying properties (Voutsinas et al, 1983; Zhu and Damodaran, 1994), flow properties
are remarkably influenced by the type of protein.
6.2.3 EFFECT OF SALT CONCENTRATION
The effect of adding salt on the power law constants and apparent viscosities of native and
acetylated chickpea protein dispersions is illustrated in Table 6.2,2, Salt addition affects
173
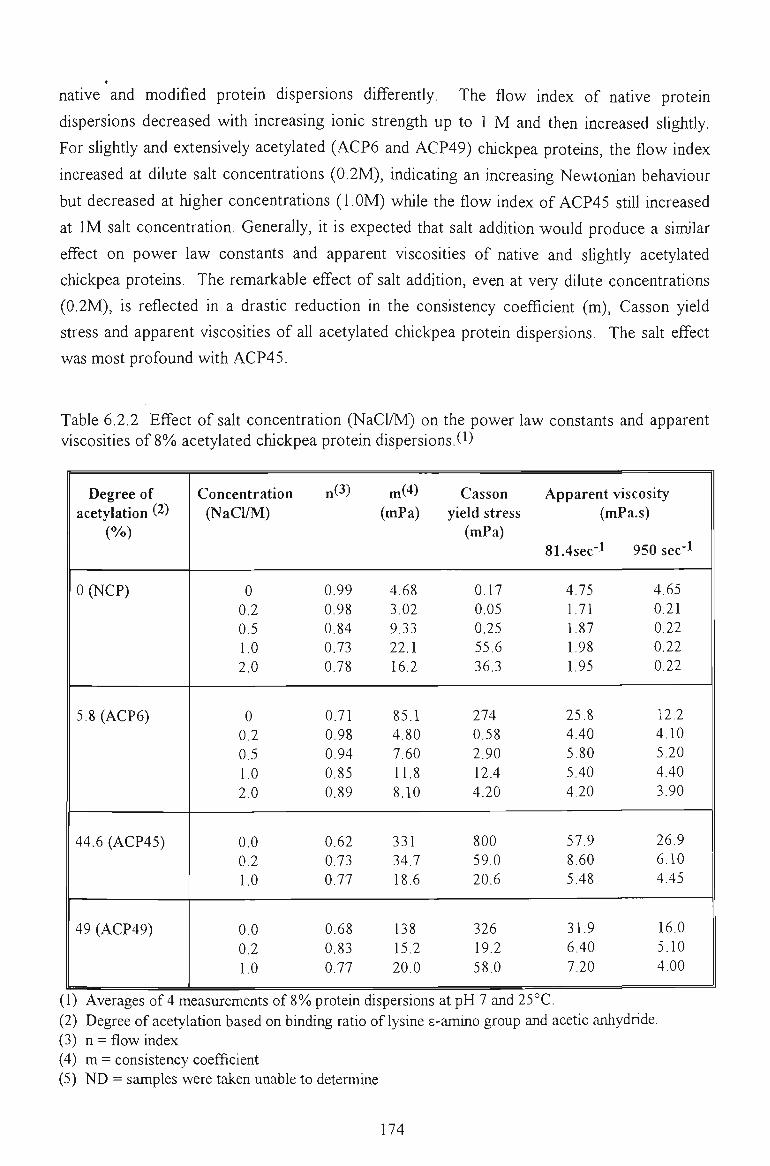
native and modified protein dispersions differently. The flow index of native protein
dispersions decreased with increasing ionic strength up to 1 M and then increased slightly.
For slightly and extensively acetylated (ACP6 and ACP49) chickpea protems, the flow mdex
increased at dilute saU concentrations (0.2M), indicating an increasing Newtonian behaviour
but decreased at higher concentrations (l.OM) while the flow index of ACP45 stiU increased
at IM salt concentration. Generally, it is expected that saU addUion would produce a similar
effect on power law constants and apparent viscosities of native and sUghtly acetylated
chickpea proteins. The remarkable effect of salt addition, even at very dilute concentrations
(0.2M), is reflected in a drastic reduction in the consistency coefficient (m), Casson yield
stress and apparent viscosities of all acetylated chickpea protein dispersions. The salt effect
was most profound with ACP45.
Table 6.2.2 Effect of salt concentration (NaCl/M) on the power law constants and apparent viscosUies of 8%) acetylated chickpea protein dispersions.(l)
Degree of acetylation (2)
(%>)
0(NCP)
5.8 (ACP6)
44.6 (ACP45)
49 (ACP49)
Concentration (NaCl/M)
0 0.2 0.5 1.0 2.0
0 0.2 0.5 1.0 2.0
0.0 0.2 1.0
0.0 0.2 1.0
n(3)
0.99 0.98 0.84 0.73 0.78
0.71 0.98 0.94 0.85 0.89
0.62 0.73 0.77
0.68 0.83 0.77
m(4) (mPa)
4,68 3,02 9.33 22.1 16.2
85.1 4.80 7.60 11.8 8.10
331 34.7 18.6
138 15.2 20.0
Casson yield stress
(mPa)
0.17 0.05 0.25 55.6 36.3
274 0.58 2.90 12.4 4.20
800 59.0 20.6
326 19.2 58.0
Apparent viscosity (mPa.s)
81.4sec-l 950 sec'^
4.75 4.65 1.71 0.21 1.87 0.22 1.98 0.22 1.95 0.22
25.8 12.2 4.40 4.10 5.80 5.20 5.40 4.40 4.20 3.90
57.9 26.9 8.60 6.10 5.48 4.45
31.9 16.0 6.40 5.10 7.20 4.00
(1) Averages of 4 measurements of 8% protein dispersions at pH 7 and 25°C. (2) Degree of acetylation based on binding ratio of lysme s-amino group and acetic anhydride. (3) n = flow index (4) m = consistency coefficient (5) ND = samples were taken unable to determine
174
Flow properties of protein dispersions can be markedly influenced by salt concentrations.
Urbanski et al. (1982) found that saU addition increased the flow index and decreased the
consistency coefficients of soy proteins. Similarly, Hermansson (1975) found that the
apparent viscosities of soy isolate dispersions decreased with increasing salt concentrations
but had little effect on whey proteins. The consistency coefficient of succinylated fish and
chickpea proteins was reduced with salt addition (Groninger, 1973).
Like all succinylated chickpea proteins, the consistency and apparent viscosities of acetylated
chickpea proteins were reduced with salt addition, even at very dilute concentrations.
WUhout saU addUion, all the water in the dispersion is available for protein association and a
strong network can be formed, reflected by a high consistency coefficient and Casson yield
stress. When salt is added, the free water in the system becomes less available for water
protein interactions because sodium chloride has a greater affinity for water. More water
interacts with sodium chloride than with proteins and the flow becomes more Newtonian (n
closer to 1). In a dispersion, water in the system tends to associate with smaU molecular
weight solutes such as salt or sugar, thus the gel system becomes weaker and the viscosity of
the dispersion reduces.
6.2.4 CONCLUSION
Like native protein, flow properties of acetylated protein dispersions are influenced by a
number of environmental conditions and particularly by the degree of acetylation. Compared
with the native proteins, acetylated chickpea protein dispersions exhibit a much stronger
pseudo plastic behaviour. This is reflected in some compositional and conformational
changes due to acetylation.
Salt addition reduces markedly Us yield stress, consistency coefficient and apparent
viscosities.
The effect of thermal treatment on the flow behaviour was influenced by the degree of
acetylation.
The changes in flow properties of acetylated chickpea proteins such as the flow index (n),
consistency coefficient (m), Casson yield stress and apparent viscosities suggests that
chickpea proteins were associated up to 45%o acetylation but the associated chickpea proteins
gradually dissociated to smaller units at higher levels of acetylation.
175
6.3 FLOW PROPERTIES OF SUCCINYLATED CHICKPEA PROTEIN DISPERSIONS
The effects of acetylation on the flow properties of chickpea protein isolates have been
presented in Section (6.2). The resuUs clearly indicated that altering the protein structure by
means of chemical modifications lead to many changes in their flow properties. Among
various modification approaches, succinylation is normally found to influence functional
properties of the modified protein more greatly than acetylation (Chapter 5).
Several fianctional properties of peanut, egg, fish, soy, casein, canola proteins were improved
by succinylation (Beuchat, 1977; Sato and Nakamura, 1977; Chen et al, 1975; Strange et al,
1993; Paulson and Tung, 1988). Gandhi et al (1968) altered the heat coagulation properties
of egg white and Evans and Irons (1970) improved emulsifying properties of egg yolk by
succinylation. Nakai and Li Chan (1989) reported that succinylation increased aqueous
solubility, modified surfactant properties such as emulsifying and foaming and altered the
viscosity of milk proteins. McElwain et al. (1975) found that the emulsion of a succinylated
protein isolate from a single cell protein had a higher viscosity than that of a native single cell
protein.
The apparent viscosity of modified canola was affected by the extent of succinylation.
Succinylation of oat globulin protein markedly reduced apparent viscosity (Paulson and Tung,
1988) The pronounced effects of acetylation on the flow properties of chickpea proteins have
been discussed. However, the introduction of neutral acetyl groups to the protein molecules
by acetylation orUy neutralised some normally protonated groups.
Succinylation not only increase the net negative charge of the protein but also can convert the
net positively charged molecule to a net negatively charged molecule. This dramatic change
results in many changes in the functional properties of food proteins. It is likely that
succinylation would give some more pronounced effects on the flow properties of the
modified proteins. A number of products prepared with chickpea are fluid foods such as
pastes or beverages (Fermandez and Berry, 1987). Flow properties of chickpea proteins may
be modified by succinylation to meet the requirements of a specific food, once the relationship
between flow properties and environmental conditions is defined.
This section reports on the flow properties of succinylated chickpea protein dispersions under
various environmental conditions. The effect of succinylation at different levels was
compared wUh those of acetylated and unmodified proteins.
176
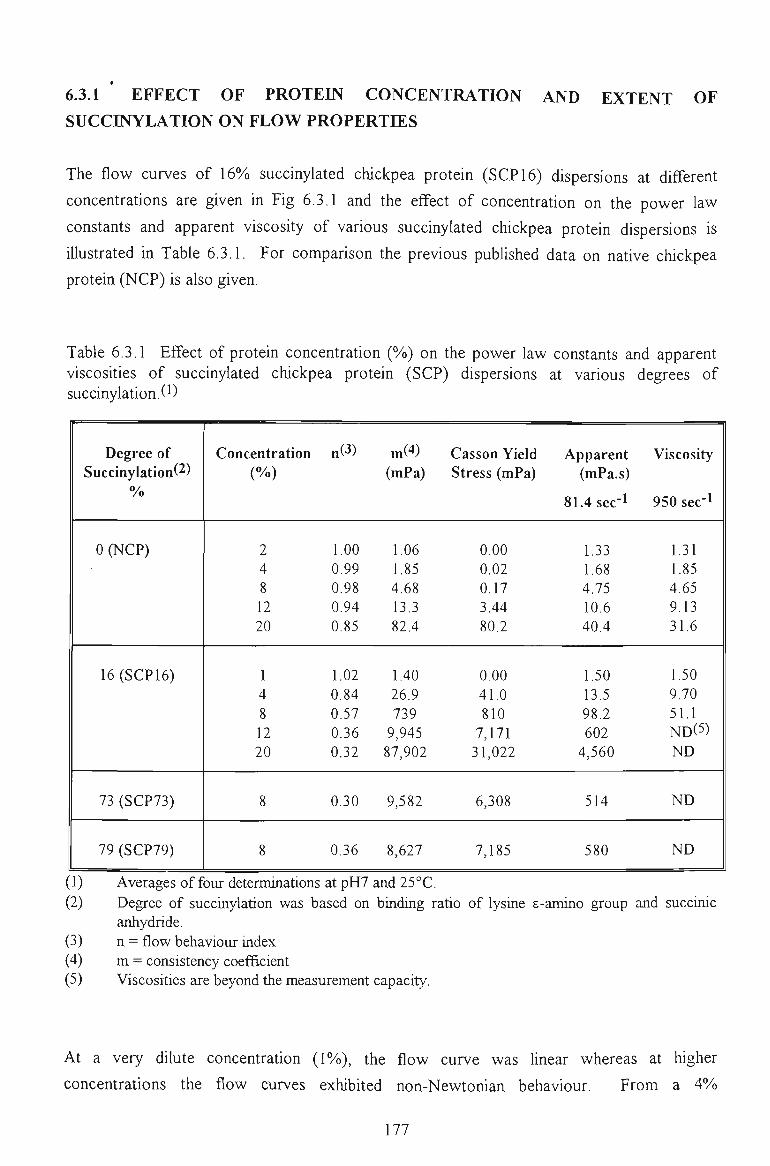
6.3.1 EFFECT OF PROTEIN CONCENTRATION AND EXTENT OF
SUCCINYLATION ON FLOW PROPERTIES
The flow curves of 16%) succinylated chickpea protein (SCP 16) dispersions at different
concentrations are given in Fig 6.3.1 and the effect of concentration on the power law
constants and apparent viscosity of various succinylated chickpea protein dispersions is
illustrated in Table 6.3.1. For comparison the previous published data on native chickpea
protein (NCP) is also given.
Table 6.3.1 Effect of protein concentration {%) on the power law constants and apparent viscosities of succinylated chickpea protein (SCP) dispersions at various degrees of succinylation. (1)
Degree of SuccinyIation(2)
Vo
0(NCP)
16 (SCP16)
73 (SCP73)
79 (SCP79)
Concentration (%o)
2 4 8 12 20
1 4 8 12 20
8
8
n(3)
1.00 0.99 0.98 0.94 0.85
1.02 0.84 0.57 0.36 0.32
0.30
0.36
m(4) (mPa)
1.06 1.85 4.68 13.3 82.4
1.40 26.9 739
9,945 87,902
9,582
8,627
Casson Yield Stress (mPa)
0.00 0.02 0.17 3.44 80.2
0.00 41.0 810
7,171 31,022
6,308
7,185
Apparent (mPa.s)
81.4 sec-1
1.33 1.68 4.75 10.6 40.4
1.50 13.5 98.2 602
4,560
514
580
Viscosity
950 sec-1
1.31 1.85 4.65 9.13 31.6
1.50 9.70 51.1 ND(5) ND
ND
ND
(1) Averages of four determinations at pH7 and 25°C. (2) Degree of succinylation was based on binding ratio of lysine s-amino group and succinic
anhydride. (3) n = flow behaviour index (4) m = consistency coefficient (5) Viscosities are beyond the measurement capacity.
At a very dilute concentration (l%o), the flow curve was linear whereas at higher
concentrations the flow curves exhibUed non-Newtonian behaviour. From a 4%
177
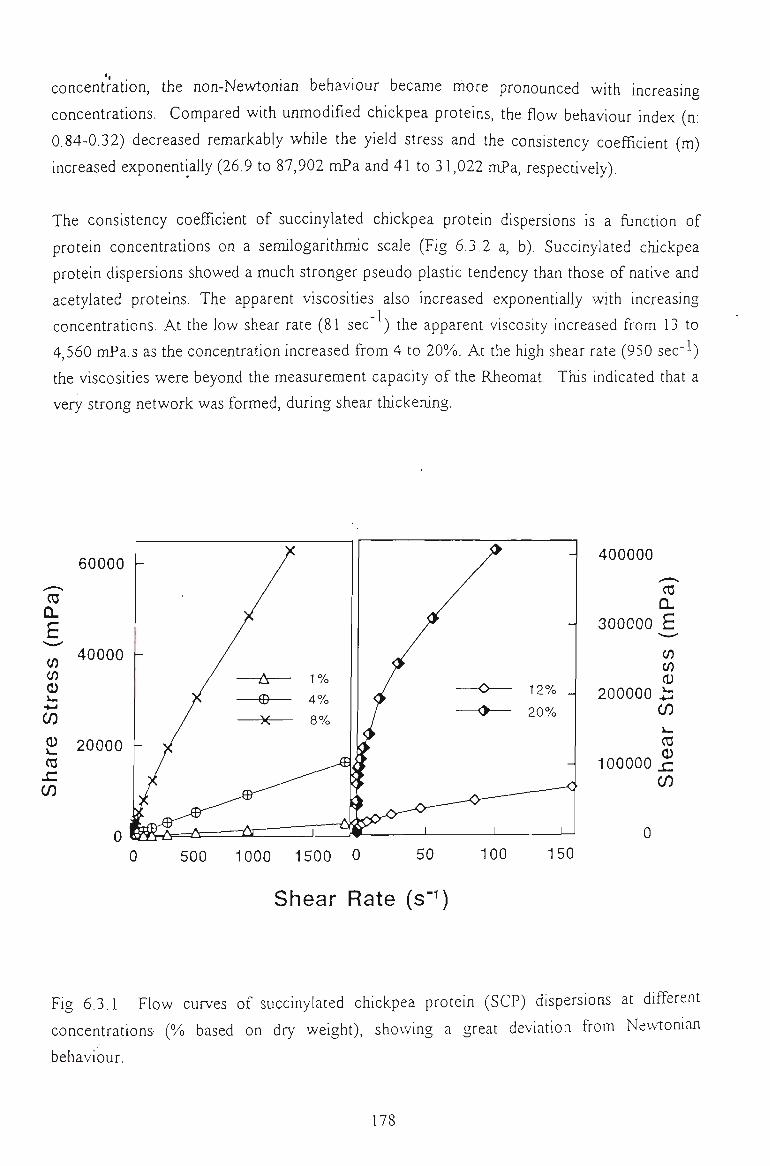
concentration, the non-Newtonian behaviour became more pronounced with increasing
concentrations. Compared with unmodified chickpea proteins, the flow behaviour index (n:
0.84-0.32) decreased remarkably while the yield stress and the consistency coefficient (m)
increased exponentially (26.9 to 87,902 mPa and 41 to 31,022 mPa, respectively).
The consistency coefficient of succinylated chickpea protein dispersions is a fiinction of
protein concentrations on a semilogarithmic scale (Fig 6.3,2 a, b). Succinylated chickpea
protein dispersions showed a much stronger pseudo plastic tendency than those of native and
acetylated proteins. The apparent viscosities also increased exponentially with increasing
concentrations. At the low shear rate (81 sec' ) the apparent viscosity increased from 13 to
4,560 mPa.s as the concentration increased from 4 to 20%. At the high shear rate (950 sec'^)
the viscosities were beyond the measurement capacity of the Rheomat, This indicated that a
very strong network was formed, during shear thickening.
60000 - 400000
Q.
300000 g
(fi (fi CD
200000 i: </)
OS
1 0 0 0 0 0 ^ cn
0 500 1000 1500 0
Shear Rate (s"^)
Fig 6.3.1 Flow curves of succinylated chickpea protein (SCP) dispersions at different
concentrations (% based on dry weight), showing a great deviation from Newionian
behaviour.
178
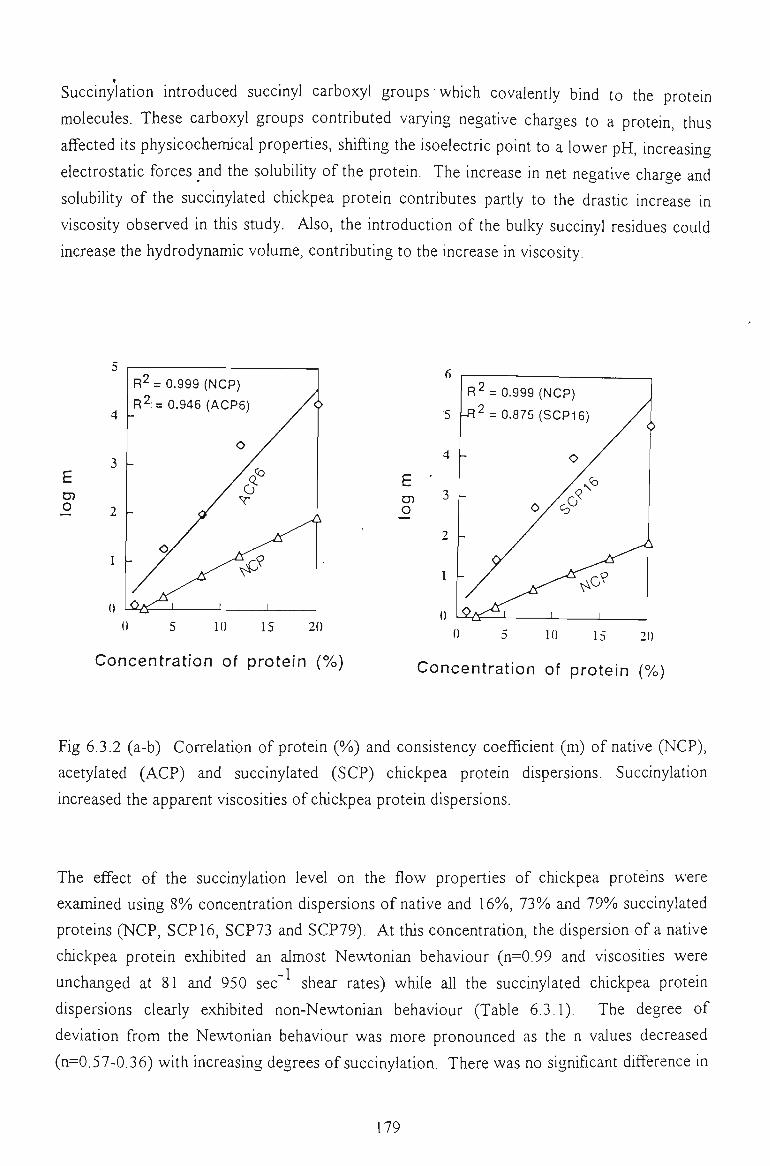
Succinylation introduced succinyl carboxyl groups which covalently bind to the protein
molecules. These carboxyl groups contributed varying negative charges to a protein, thus
affected Us physicochemical properties, shifting the isoelectric point to a lower pH, increasing
electrostatic forces and the solubility of the protein. The increase in net negative charge and
solubiUty of the succinylated chickpea protein contributes partly to the drastic increase in
viscosity observed in this study. Also, the introduction of the bulky succinyl residues could
increase the hydrodynamic volume, contributing to the increase in viscosity.
D1 o
R2 = 0.999 (NCP)
R2 := 0.946 (ACP6)
0 LA 0 5 10 15 20
Concentration of protein (%)
<) 5 1 0 1 5 20
Concentration of protein (%)
Fig 6.3.2 (a-b) Correlation of protein (%>) and consistency coefficient (m) of native (NCP),
acetylated (ACP) and succinylated (SCP) chickpea protein dispersions. Succinylation
increased the apparent viscosities of chickpea protein dispersions.
The effect of the succinylation level on the flow properties of chickpea proteins were
examined using 8%) concentration dispersions of native and 16%), 73%) and 19% succinylated
proteins (NCP, SCP 16, SCP73 and SCP79). At this concentration, the dispersion of a native
chickpea protein exhibUed an almost NeAvtonian behaviour (n=0.99 and viscosities were
unchanged at 81 and 950 sec' shear rates) while all the succinylated chickpea protein
dispersions clearly exhibUed non-Newtoruan behaviour (Table 6.3.1). The degree of
deviation from the Newtonian behaviour was more pronounced as the n values decreased
(n=0.57-0.36) with increasing degrees of succinylation. There was no significant difference in
179
all the power law constants and apparent viscosities between SCP73 and SCP79, perhaps due
to their similar level of succinylation.
The influence of succinylation on the viscosity of protein dispersions is complex since U varies
with different proteins and also with different degrees of succinylation. Viscosity of faba bean
isolates increases gradually wUh increasing degrees of succinylation whereas those of
sunflower and rapeseed proteins stayed almost unchanged up to 60 %> succinylation, then
increased sharply (Schwenke et al, 1990). This observation indicated that succinylation
caused a continuous conformational change in faba bean proteins but a sudden
conformational change in sunflower and rapeseed proteins. Succinylation of chickpea protein
caused a gradual increase in viscosity with increasing degree of succinylation (Table 6.3.1)
like field pea, faba bean and canola protein (Schwenke et al, 1986; Paulson and Tung, 1988).
The different effect of succinylation on the apparent viscosity of these proteins reflected their
different conformational structures.
6.3.2 EFFECT OF SALT CONCENTRATION
The effect of salt addition on the power law constants and apparent viscosities of succinylated
chickpea proteins is Ulustrated in Table 6.3.2. The flow behaviour index of unmodified
(NCP) protein decreased with salt concentrations up to IM then slightly increased while
those of succinylated proteins (SCP 16, 73 and 79) increased proportionally with increasing
salt concentrations. The increase was more pronounced at a high level of succinylation. Both
the consistency coefficient and yield stress of aU succinylated chickpea proteins decreased by
adding salt. The effect was very pronounced even at dilute concentrations. A 0.2M salt
solution decreased the m value and Casson yield stress of SCP73 up to 20 and 5 fold,
respectively.
Unlike succinylated chickpea proteins, the effect of ioruc strength on the consistency
coefficient and yield stress of unmodified proteins was rather complex. At 0.2M salt, both the
m value and yield stress decreased, then increased up to IM, followed by a slight decrease.
Salt addition decreased the apparent viscosities of both unmodified and modified chickpea
proteins, even at a dilute concentration (0.2M).
The effect of salt concentrations on the apparent viscosity (AV) at 81.4 sec"^ was modelled
by linear regressions of AV and the logarithm of AV (log(AV)) on the salt concentration
(SC) and degree of succinylation (DS), and their logarithms. The best fitting regression
equation was:
180
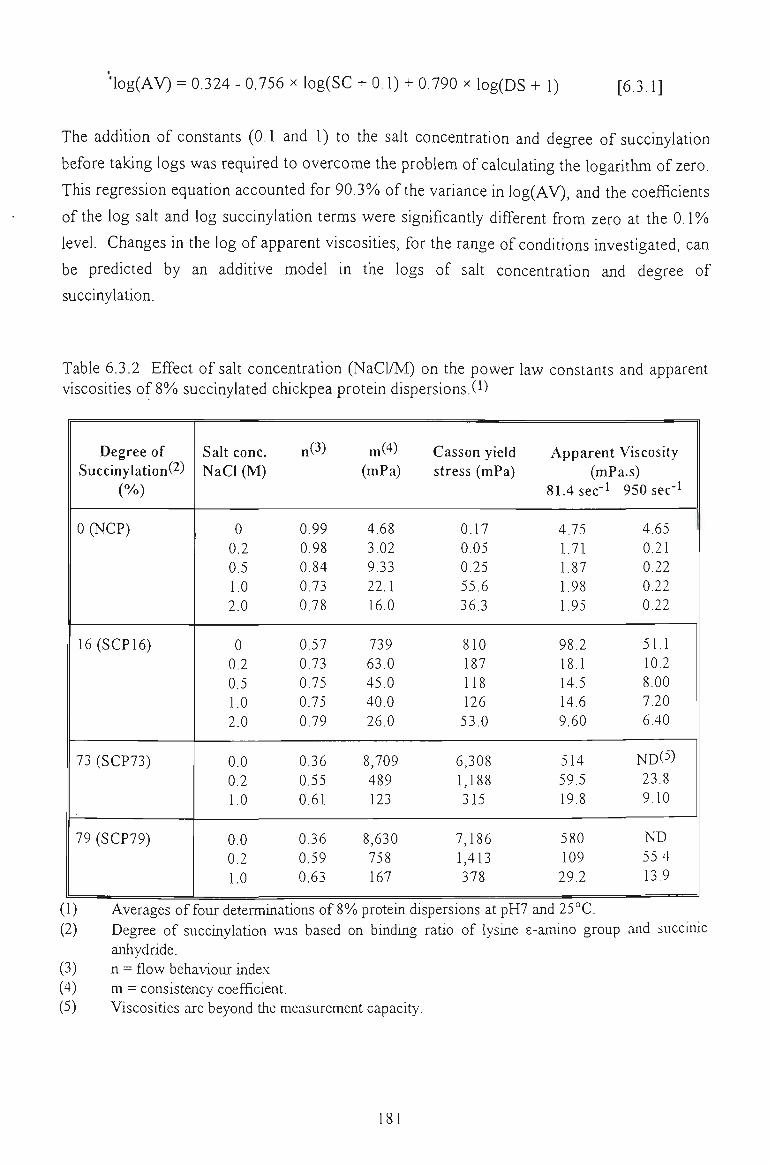
'log(AV) = 0.324 - 0.756 x log(SC + 0.1) + 0.790 x log(DS + 1) [6.3.1]
The addition of constants (0.1 and 1) to the saU concentration and degree of succinylation
before taking logs was required to overcome the problem of calculating the logarithm of zero.
This regression equation accounted for 90.3% of the variance in log(AV), and the coefficients
of the log saU and log succinylation terms were significantly different from zero at the 0.1%
level. Changes in the log of apparent viscosUies, for the range of condUions investigated, can
be predicted by an additive model in the logs of salt concentration and degree of
succinylation.
Table 6.3.2 Effect of saU concentration (NaCl/M) on the power law constants and apparent viscosities of 8%) succinylated chickpea protein dispersions. (1)
Degree of Succinylation(2)
(%)
0 (NCP)
16 (SCP16)
73 (SCP73)
79 (SCP79)
Salt cone. NaCl (M)
0 0.2 0.5 1.0 2.0
0 0.2 0.5 1.0 2.0
0.0 0.2 1.0
0.0 0.2 1.0
nP)
0.99 0.98 0.84 0.73 0.78
0.57 0.73 0.75 0.75 0.79
0.36 0.55 0.61
0.36 0.59 0.63
m(4) (mPa)
4.68 3.02 9.33 22.1 16.0
739 63.0 45.0 40.0 26.0
8,709 489 123
8,630 758 167
Casson yield stress (mPa)
0.17 0.05 0.25 55.6 36.3
810 187 118 126 53.0
6,308 1,188 315
7,186 1,413 378
Apparent Viscosity (mPa.s)
81.4sec-l 950sec-l
4.75 4.65 1.71 0.21 1.87 0.22 1.98 0.22 1.95 0.22
98.2 51.1 18.1 10.2 14.5 8.00 14.6 7.20 9.60 6.40
514 ND(5)
59.5 23.8 19.8 9.10
580 ND 109 55.4 29.2 13.9
(1) Averages of four determinations of 8% protein dispersions at pH7 and 25°C. (2) Degree of succinylation was based on binding ratio of lysine s-armno group and succinic
anhydride. (3) n = flow behaviour index (4) m = consistency coefficient. (5) Viscosities are beyond the measurement capacity.
181
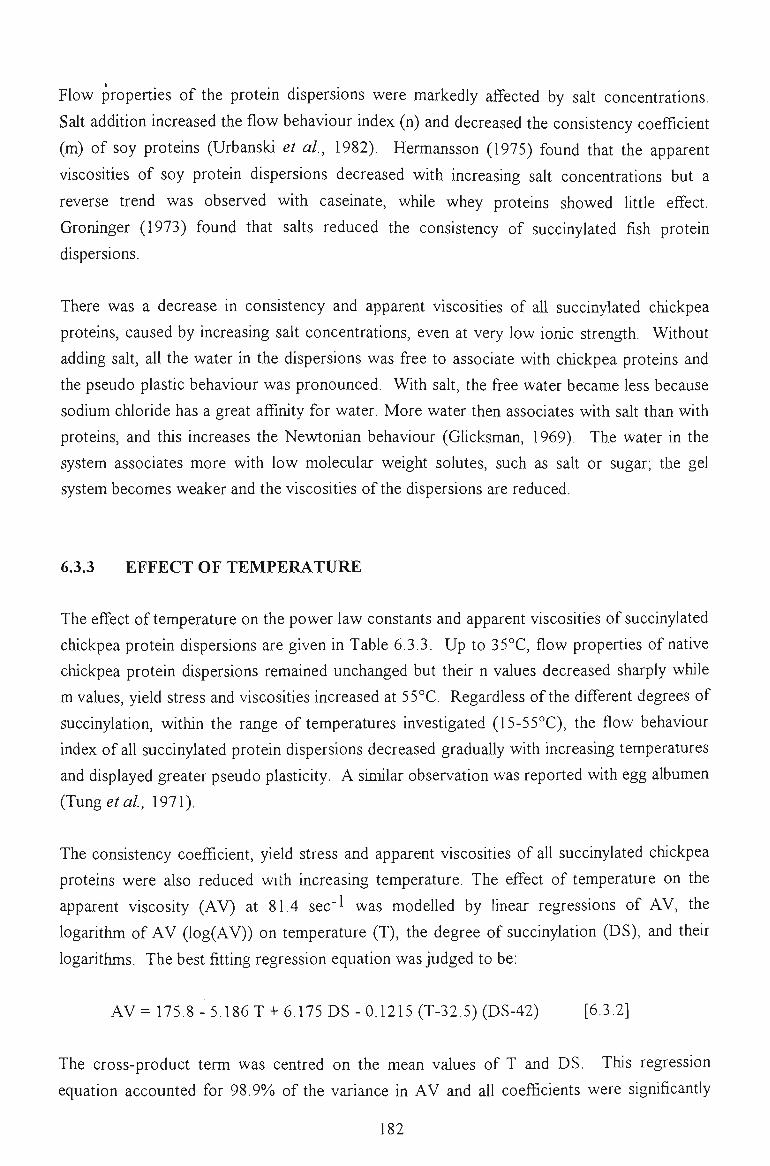
Flow properties of the protein dispersions were markedly affected by salt concentrations.
Salt addUion increased the flow behaviour index (n) and decreased the consistency coefficient
(m) of soy proteins (Urbanski et al, 1982). Hermansson (1975) found that the apparent
viscosUies of soy protein dispersions decreased with increasing salt concentrations but a
reverse trend was observed with caseinate, while whey proteins showed little effect.
Groninger (1973) found that salts reduced the consistency of succinylated fish protein
dispersions.
There was a decrease in consistency and apparent viscosities of all succinylated chickpea
proteins, caused by increasing salt concentrations, even at very low ionic strength. Without
adding salt, all the water in the dispersions was free to associate with chickpea proteins and
the pseudo plastic behaviour was pronounced. With salt, the free water became less because
sodium chloride has a great affinity for water. More water then associates with salt than with
proteins, and this increases the Newtonian behaviour (Glicksman, 1969). The water in the
system associates more with low molecular weight solutes, such as salt or sugar; the gel
system becomes weaker and the viscosities of the dispersions are reduced.
6.3.3 EFFECT OF TEMPERATURE
The effect of temperature on the power law constants and apparent viscosities of succinylated
chickpea protein dispersions are given in Table 6.3.3. Up to 35°C, flow properties of native
chickpea protein dispersions remained unchanged but their n values decreased sharply while
m values, yield stress and viscosities increased at 55°C. Regardless of the different degrees of
succinylation, within the range of temperatures investigated (15-55°C), the flow behaviour
index of all succinylated protein dispersions decreased gradually with increasing temperatures
and displayed greater pseudo plasticity. A similar observation was reported with egg albumen
(Tung e a/., 1971).
The consistency coefficient, yield stress and apparent viscosities of all succinylated chickpea
proteins were also reduced with increasing temperature. The effect of temperature on the
apparent viscosity (AV) at 81.4 sec"^ was modeUed by linear regressions of AV, the
logarithm of AV (log(AV)) on temperature (T), the degree of succinylation (DS), and their
logarithms. The best fitting regression equation was judged to be:
AV = 175.8 - 5.186 T + 6.175 DS - 0.1215 (T-32.5) (DS-42) [6.3.2]
The cross-product term was centred on the mean values of T and DS. This regression
equation accounted for 98.9%o of the variance in AV and all coefficients were significantly
182
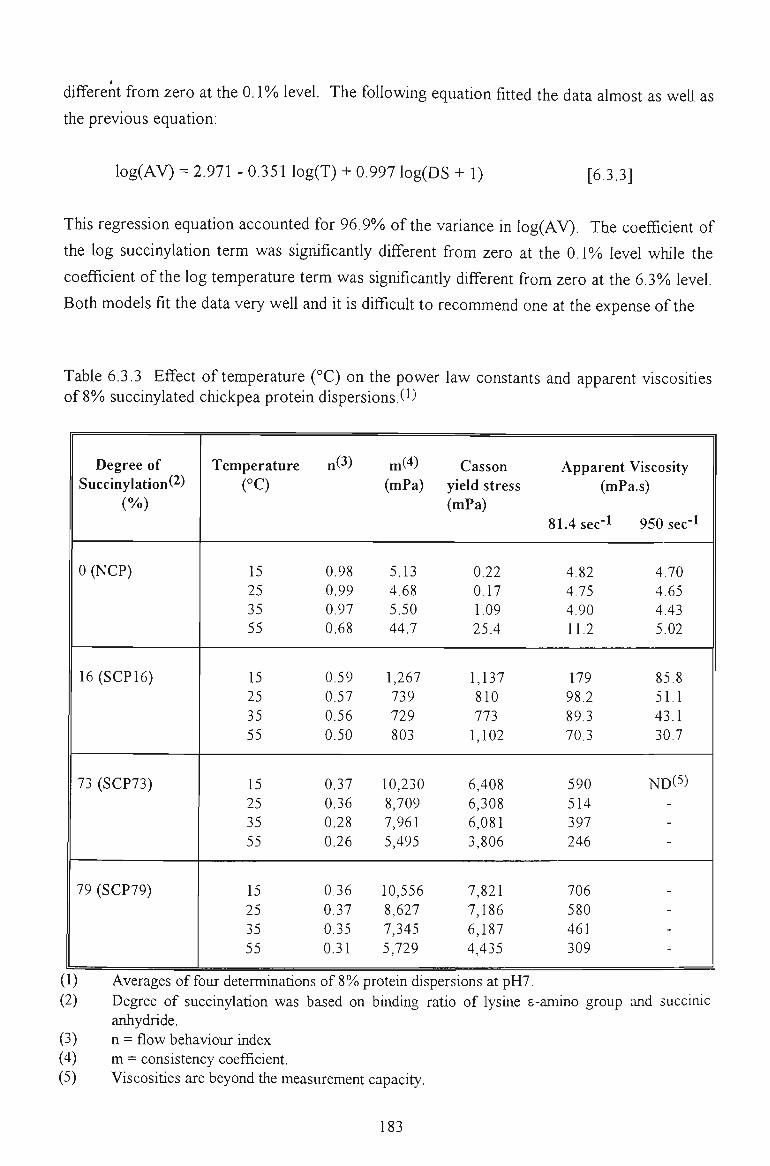
different from zero at the 0. \% level. The following equation fitted the data almost as weU as
the previous equation:
log(AV) = 2.971 - 0.351 log(T) + 0.997 log(DS + 1) [6.3.3]
This regression equation accounted for 96.9%) of the variance in log(AV). The coefficient of
the log succinylation term was significantly different from zero at the 0.1%) level while the
coefficient of the log temperature term was significantly different from zero at the 6.3%) level.
Both models fit the data very well and U is difficuU to recommend one at the expense of the
Table 6.3.3 Effect of temperature (°C) on the power law constants and apparent viscosities of 8%) succinylated chickpea protein dispersions.(^)
Degree of SuccinyIation(2)
(%)
0(NCP)
16 (SCP 16)
73 (SCP73)
79 (SCP79)
) Averages off
Temperature (°C)
15 25 35 55
15 25 35 55
15 25 35 55
15 25 35 55
our determination
n(3)
0.98 0.99 0.97 0.68
0.59 0.57 0.56 0.50
0.37 0.36 0.28 0.26
0.36 0.37 0.35 0.31
so f8%t
m(4) (mPa)
5.13 4.68 5.50 44.7
1,267 739 729 803
10,230 8,709 7,961 5,495
10,556 8,627 7,345 5,729
)rotein disc
Casson yield stress (mPa)
0.22 0.17 1.09 25.4
1,137 810 773
1,102
6,408 6,308 6,081 3,806
7,821 7,186 6,187 4,435
ersions at DH7.
Apparent Viscosity (mPa.s)
81.4 sec-1 950 sec'l
4.82 4.70 4.75 4.65 4.90 4.43 11.2 5.02
179 85.8 98.2 51.1 89.3 43.1 70.3 30.7
590 ND(5)
514 397 246
706 580 461 309
(2) Degree of succinylation was based on binding ratio of lysine s-amino group and succinic anhydride.
(3) n = flow behaviour index (4) m = consistency coefficient. (5) Viscosities are beyond the measurement capacity.
183
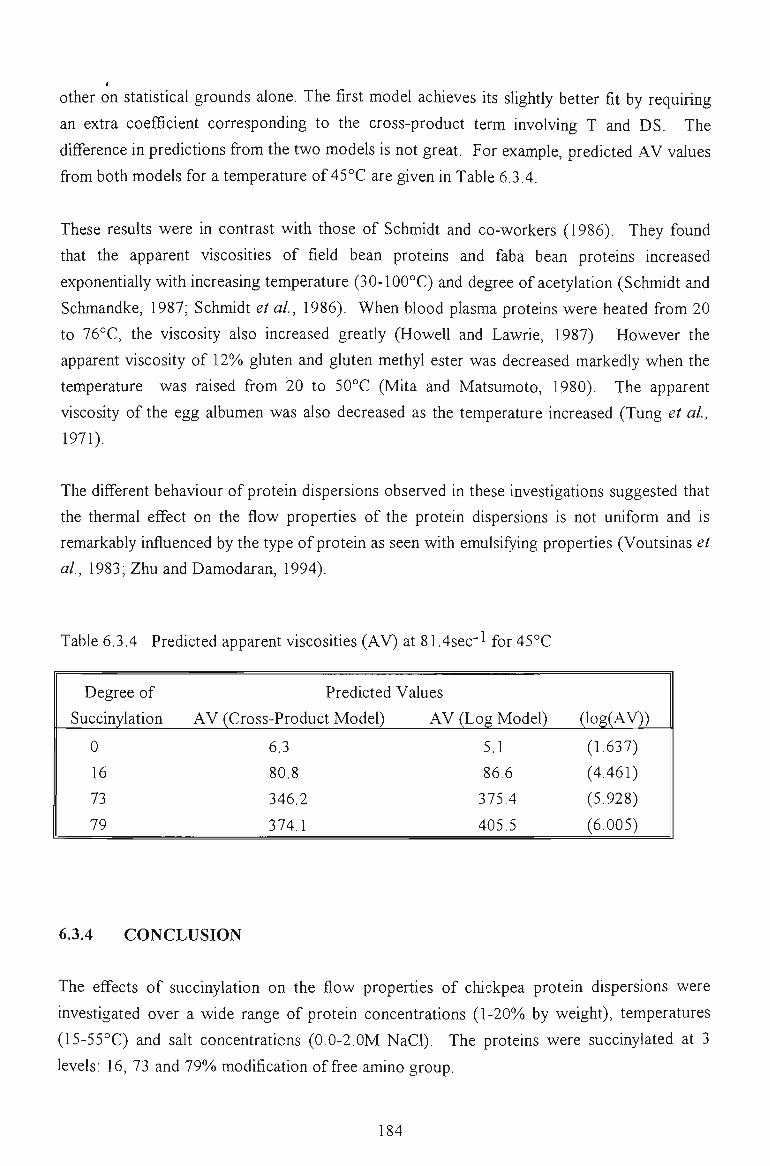
other on statistical grounds alone. The first model achieves Us slightly better fit by requiring
an extra coefficient corresponding to the cross-product term involving T and DS. The
difference in predictions from the two models is not great. For example, predicted AV values
from both models for a temperature of 45°C are given in Table 6.3.4.
These resuUs were in contrast with those of Schmidt and co-workers (1986). They found
that the apparent viscosUies of field bean proteins and faba bean proteins increased
exponentially with increasing temperature (30-100°C) and degree of acetylation (Schmidt and
Schmandke, 1987; Schmidt et al, 1986). When blood plasma proteins were heated from 20
to 76°C, the viscosity also increased greatly (Howell and Lawrie, 1987). However the
apparent viscosity of 12%) gluten and gluten methyl ester was decreased markedly when the
temperature was raised from 20 to 50°C (Mita and Matsumoto, 1980). The apparent
viscosity of the egg albumen was also decreased as the temperature increased (Tung et al,
1971).
The different behaviour of protein dispersions observed in these investigations suggested that
the thermal effect on the flow properties of the protein dispersions is not uniform and is
remarkably influenced by the type of protein as seen with emulsifying properties (Voutsinas et
al, 1983; Zhu and Damodaran, 1994).
Table 6.3.4 Predicted apparent viscosities (AV) at 81.4sec"l for 45°C
Degree of
Succinylation
0
16
73
79
AV
Predicted Values
(Cross-Product Model)
6.3
80.8
346.2
374.1
AV (Log Model)
5.1
86.6
375.4
405.5
(log(AV))
(1.637)
(4.461)
(5.928)
(6.005)
6.3.4 CONCLUSION
The effects of succinylation on the flow properties of chickpea protein dispersions were
investigated over a wide range of protein concentrations (1-20%) by weight), temperatures
(15-55°C) and salt concentrations (0.0-2.0M NaCl). The proteins were succinylated at 3
levels: 16, 73 and 79%) modification of free amino group.
184
Compared with the native and acetylated chickpea proteins, the succmylated protein
dispersions exhibUed a stronger pseudoplastic behaviour. At the same protein concentration,
the flow behaviour index (n) decreased while the consistency coefficient (m), yield stress and
apparent viscosUies (AV) were dramatically increased by the extent of succinylation.
At 81.4 sec' of a shear rate the consistency coefficient, yield stress and the apparent
viscosities of succinylated protein dispersions increased exponentially with increasing protein
concentrations.
Flow properties of native chickpea protein dispersions were virtually unchanged up to 35°C
and were only slightly affected at 55°C. In contrast, for highly succinylated chickpea proteins
(73-79%), the consistency coefficient, yield stress and apparent viscosities dramatically
decreased with increasing temperatures, even at 25°C. The effect of temperature on flow
properties of these proteins varied with the extent of succinylation. A model to predict the
effect of increasing temperature on the apparent viscosity of succinylated proteins was
suggested.
The flow behaviour index increased while the yield stress, consistency coefficient and
apparent viscosity decreased with increasing salt concentrations and also with the extent of
chemical modification.
6.4 SUMMARY
Flow properties of aqueous umnodified, acetylated and succinylated chickpea protein
dispersions are considerably influenced by a number of factors. These flows have some
common characteristics.
At low protein concentrations (<4%) by weight), chickpea protein dispersions exhibUed
Newtonian flow behaviour. At high concentrations (>8%o by weight), non-Newtoruan flow
behaviour became more pronounced with increasing concentration. The extent of non
Newtonian increased as one moved from an umnodified protein system to acetylated and
succinylated proteins.
The effect of salt addition on the flow behaviour varied with salt concentration, with different
type of proteins and also with different levels of acylation. The Newtonian flow behaviour of
unmodified chickpea protein dispersions remained intact orUy in a dilute salt solution (0.2M
NaCl). The flow behaviour index of the unmodified protein decreased wUh salt
185
concentrations up to 1 M then increased, whilst, those of succinylated proteins increased
proportionally with increasing saU concentrations. The effect of salt addition on the flow
behaviour index of acetylated proteins varied greatly with the level of acetylation. The
remarkable effect of saU addition on the consistency coefficient (m), Casson yield stress and
apparent viscosity reflected the protein structural changes due to their chemical modification
by acylation.
The effect of dissolving pHs reflected a correlation between protein solubUities and the
apparent viscosities of the dispersions.
Thermal effects on the flow properties of the protein dispersions varied with different types of
proteins and the levels of acylation. For unmodified proteins, the effects of thermal
treatments were demonstrated at 55°C. For acetylated proteins, the flow index of each
protein dispersion was affected differently by a similar thermal treatment. Apparent
viscosities of unmodified protein dispersions increased but those of all acetylated protein
dispersions decreased with increasing temperature. The apparent viscosities of succinylated
proteins increased at 55°C. A regression equation was suggested to illustrate the effect of
temperature on the apparent viscosities and degrees of succinylation.
Chemical modifications by acetylation and succinylation greatly influenced many aspects of
the flow properties of the modified chickpea proteins. The effects varied with the type of
acylating reagents used and the levels of acylation.
186
CHAPTER 7
RHEOLOGICAL PROPERTIES OF WHEAT FLOUR SUPPLEMENTED WITH CHICKPEA PROTEINS
RHEOLOGICAL PROPERTIES OF WHEAT FLOUR SUPPLEMENTED WITH CHICKPEA PROTEINS
Numerous products can be made from wheat flours. These include breads, biscuits, cakes,
pasta, noodles, breakfast cereals and other bakery products that are consumed worldwide. In
Western countries, the annual consumption of various bakery products is estimated at 100 kg
per capita (Pomeranz, 1988). More wheat products are also consumed in developing
countries (Esuono and Bamiro, 1995). Wheat protein quality is lower than fliat of most
cereals due to its low levels of lysine, methionine and threonine (Pomeranz, 1988).
Regardless of these inferior nutritional values, demand for wheat based bakery products is
increasing. The nutritional quality of these products could be improved by supplementation
with non wheat proteins including those from grain legumes. Fortification with grain legume
protein would increase the protein content and improve the essential amino acid balance of the
bakery products. On the other hand, bakery products which have long shelf-life are easy to
transport and have wide acceptance. They can serve as an effective means of promoting the
utilisation of grain legume proteins for human consumption (Chavan and Kadam, 1993),
The reason for the large number and diversity of products made from wheat flour is attributed
to its unique characteristics which can be demonstrated clearly by a bread making process.
When mixing with water, wheat flour forms a cohesive dough with viscoelastic properties
whereas other cereal flours fail to do so. The wheat flour dough, once formed, can retain gas
which is an essential condition for the formation of light, leavened products. Another
characteristic of wheat flour dough is its ability to transform to bread in an oven, by dramatic
changes in viscosity, while retaining its shape.
The rheological properties of wheat flour dough are very complex (Matsuo et al, 1972;
Honesty and Rogers, 1990). They are, in fact, a result of ingredient interactions during
fermentation and dough mixing. Flour, water, air and yeasts have great effects on the
rheological properties of the dough formed but other minor ingredients such as fats, enzymes
and emulsifiers also influence the dough's properties. The quality of bread is strongly
influenced by the level and quality of protein in the dough (Dexter and Matsuo, 1977; Wasik
and Bushuk, 1975). Protein is the major factor that accounts for the variation in bread's loaf
volume, made from a single variety of wheat (Pomeranz et al, 1976). Consequently, most
studies have focussed on the effect of wheat proteins on the viscoelastic properties of wheat
dough. It is believed that the viscous behaviour of wheat dough is influenced by small
188
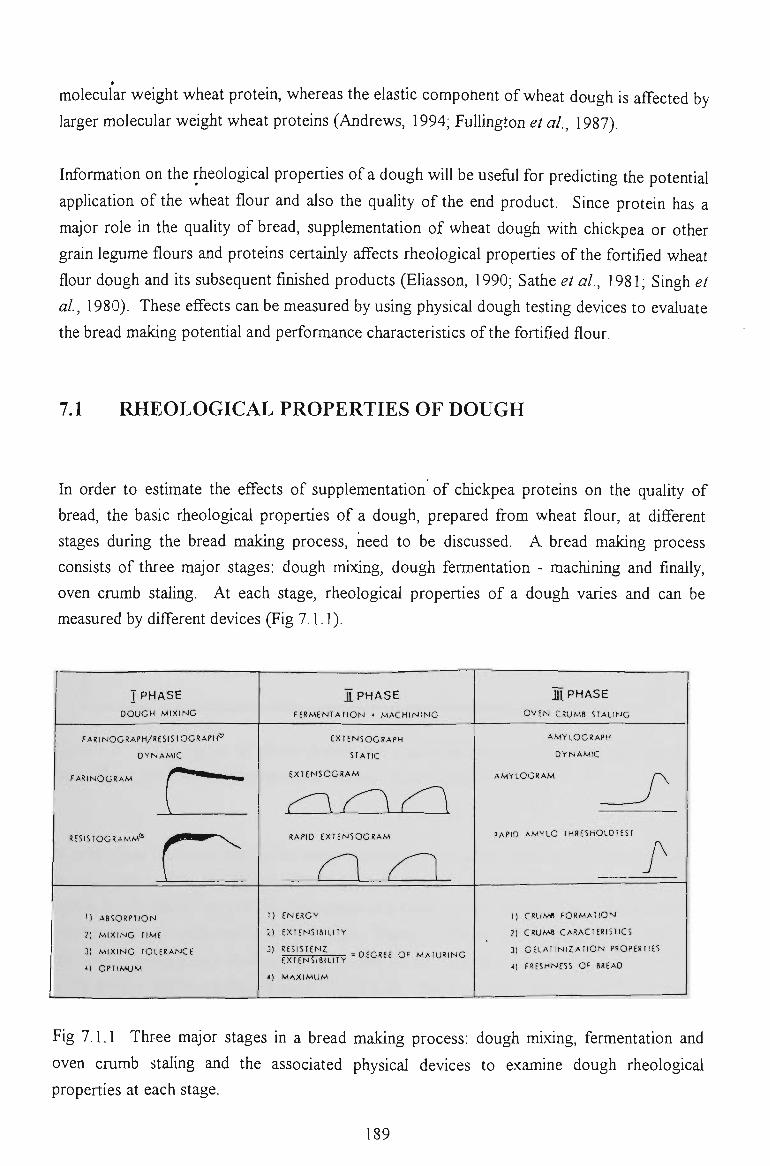
molecular weight wheat protein, whereas the elastic compohent of wheat dough is affected by
larger molecular weight wheat proteins (Andrews, 1994; FuUington et al, 1987).
Information on the rheological properties of a dough wiU be useflil for predicting the potential
appUcation of the wheat flour and also the quality of the end product. Since protein has a
major role in the quality of bread, supplementation of wheat dough with chickpea or other
grain legume flours and proteins certainly affects rheological properties of the fortified wheat
flour dough and Us subsequent finished products (EUasson, 1990; Sathe et al, 1981; Singh et
al, 1980). These effects can be measured by using physical dough testing devices to evaluate
the bread making potential and performance characteristics of the fortified flour.
7.1 RHEOLOGICAL PROPERTIES OF DOUGH
In order to estimate the effects of supplementation of chickpea proteins on the quality of
bread, the basic rheological properties of a dough, prepared from wheat flour, at different
stages during the bread making process, need to be discussed. A bread making process
consists of three major stages: dough mixing, dough fermentation - machining and finally,
oven crumb staling. At each stage, rheological properties of a dough varies and can be
measured by different devices (Fig 7.1.1).
•
]PHASE DOUGH M I X I N G
f ARINOGRAPH/RESISIOGRAPH*
DYNAMIC
RESISIOGRAMM** ^ ^ ^ ^ t ^ - \ ^
M ASSORPIION
2) M I X I N G TIME
3) M I X I N G TOLERANCE
<) OPTIMUM
11. PHASE
f E R M E N I A t l O N • M A C H I N I N G
EXTEN50GRAPH
STATIC
EXIENSOGRAM
r-\r-\A^ RAPID EXTENSOGRAM
r\ A^ 1) ENERGY
'i) EXTENSIBILITY
^ ' ^ l ^ l - L ^ . O E G R E E OP MATURING
<) M A X I M U M
i l l PHASE
OVEN CRUMB STALING
AMYLOGRAPH
DYNAMIC
AMYLOGRAM r ^
BAPIO A M Y L O I H R E S H O L O I E S T
f 1) CRUMe FORMATION
2) CRUM8 CARACTERISTICS
3) G E L A I I N I Z A I I O N PROPERTIES
i) FRESHNESS OF BREAD
Fig 7.1.1 Three major stages in a bread making process: dough mixing, fermentation and
oven crumb staling and the associated physical devices to examine dough rheological
properties at each stage.
189
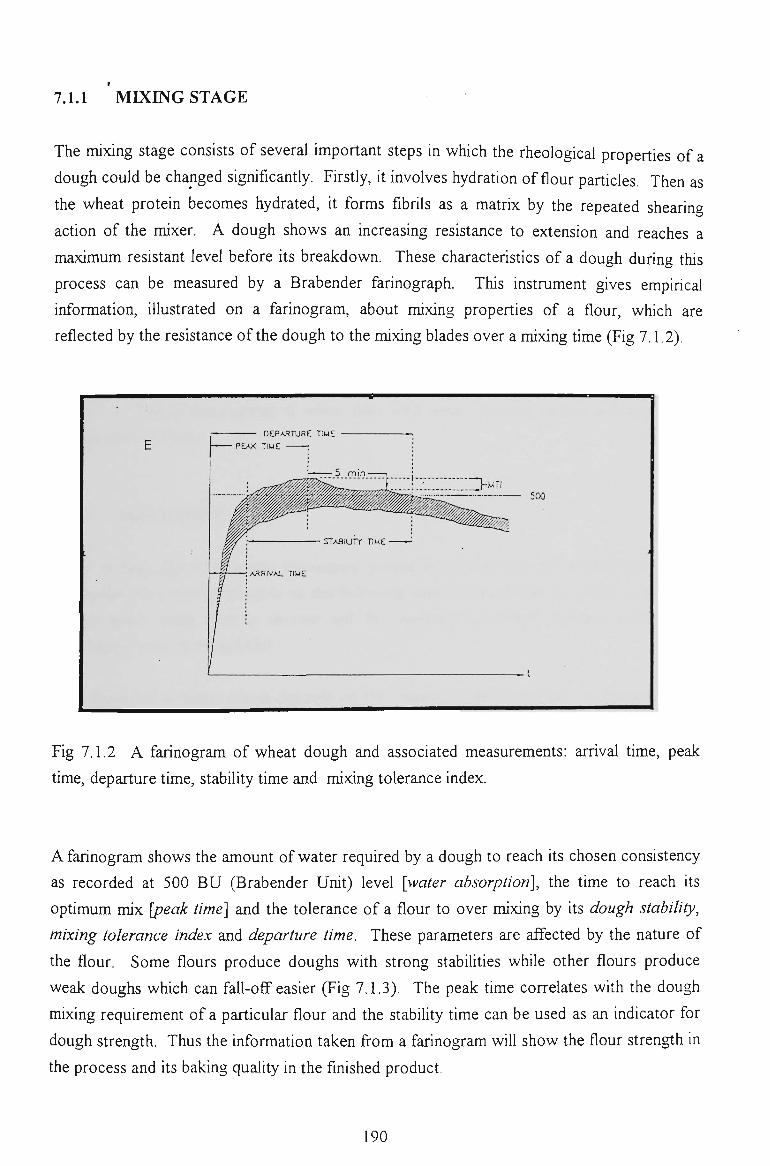
7.1.1 MIXING STAGE
The nuxing stage consists of several important steps in which the rheological properties of a
dough could be changed significantly. Firstly, U involves hydration of flour particles. Then as
the wheat protein becomes hydrated, it forms fibrils as a matrix by the repeated shearing
action of the mixer. A dough shows an increasing resistance to extension and reaches a
maximum resistant level before its breakdown. These characteristics of a dough during this
process can be measured by a Brabender farinograph. This instrument gives empirical
information, illustrated on a farinogram, about mixing properties of a flour, which are
reflected by the resistance of the dough to the mixing blades over a mixing time (Fig 7.1.2).
E PC AK TIME - ; 1
'. 5 m i n 1. ;
AJ=!RrVAi, T1U£
I>Mri 500
- t
Fig 7.1.2 A farinogram of wheat dough and associated measurements: arrival time, peak
time, departure time, stability time and mixing tolerance index.
A farinogram shows the amount of water required by a dough to reach its chosen consistency
as recorded at 500 BU (Brabender Unit) level [water absorption], the time to reach its
optimum mix [peak time] and the tolerance of a flour to over mixing by Us dough stabihty,
mixing tolerance index and departure time. These parameters are affected by the nature of
the flour. Some flours produce doughs with strong stabilities while other flours produce
weak doughs which can fall-off easier (Fig 7.1.3). The peak time correlates wUh the dough
mixing requirement of a particular flour and the stability time can be used as an indicator for
dough strength. Thus the information taken from a farinogram will show the flour strength in
the process and its baking quality in the finished product.
190
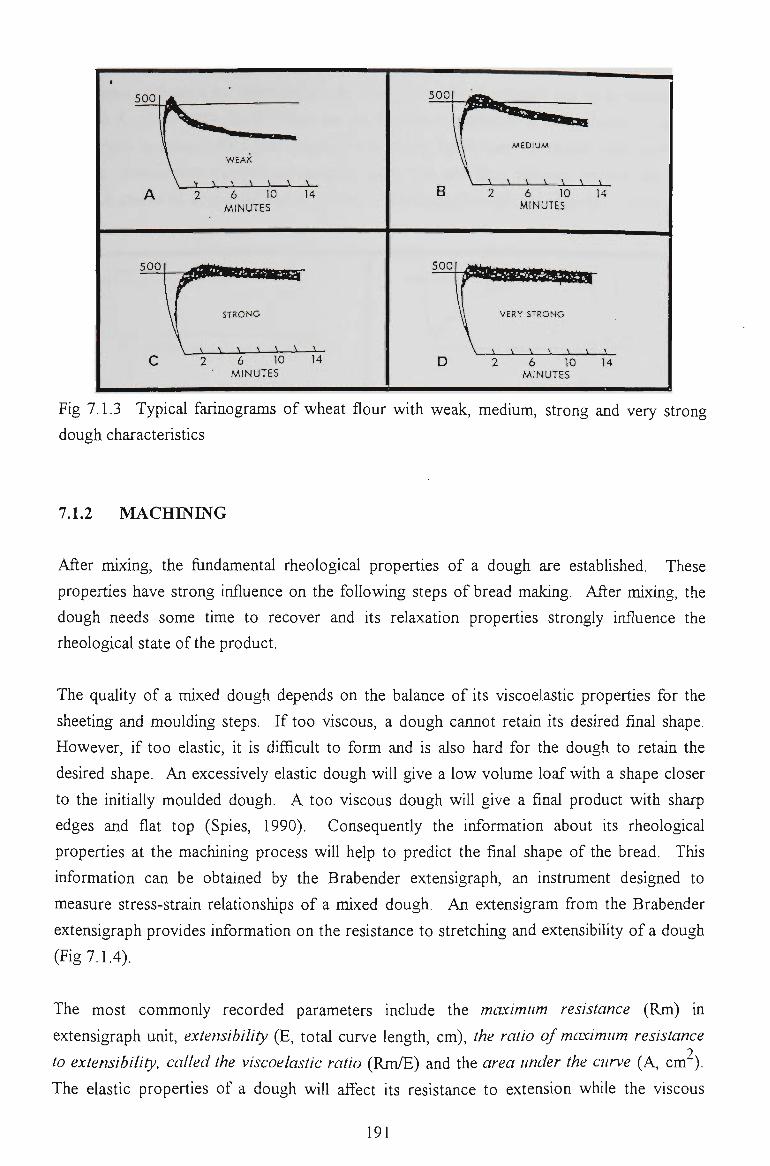
500
6 10 MINUTES
\ N N 5 i — V _ 2 6 10 14
MINUTES
300
6 10 14 MINUTES
VERY STRONG
_i i i i N \ N
2 6 10 14 MINUTES
Fig 7.1.3 Typical farinograms of wheat flour with weak, medium, strong and very strong
dough characteristics
7.L2 MACHINING
After mixing, the fundamental rheological properties of a dough are established. These
properties have strong influence on the foUowing steps of bread making. After mixing, the
dough needs some time to recover and its relaxation properties strongly influence the
rheological state of the product.
The quality of a mixed dough depends on the balance of its viscoelastic properties for the
sheeting and moulding steps. If too viscous, a dough cannot retain its desired final shape.
However, if too elastic, it is difficult to form and is also hard for the dough to retain the
desired shape. An excessively elastic dough will give a low volume loaf with a shape closer
to the initially moulded dough. A too viscous dough will give a final product with sharp
edges and flat top (Spies, 1990). Consequently the information about Us rheological
properties at the machining process wiU help to predict the final shape of the bread. This
information can be obtained by the Brabender extensigraph, an instrument designed to
measure stress-strain relationships of a mixed dough. An extensigram from the Brabender
extensigraph provides information on the resistance to stretching and extensibility of a dough
(Fig 7.1.4).
The most commonly recorded parameters include the maximum resistance (Rm) in
extensigraph unit, extensibility (E, total curve length, cm), the ratio of maximum resistance
to extensibility, called the viscoelastic ratio (Rm/E) and the area under the curve (A, cm").
The elastic properties of a dough will affect its resistance to extension while the viscous
191
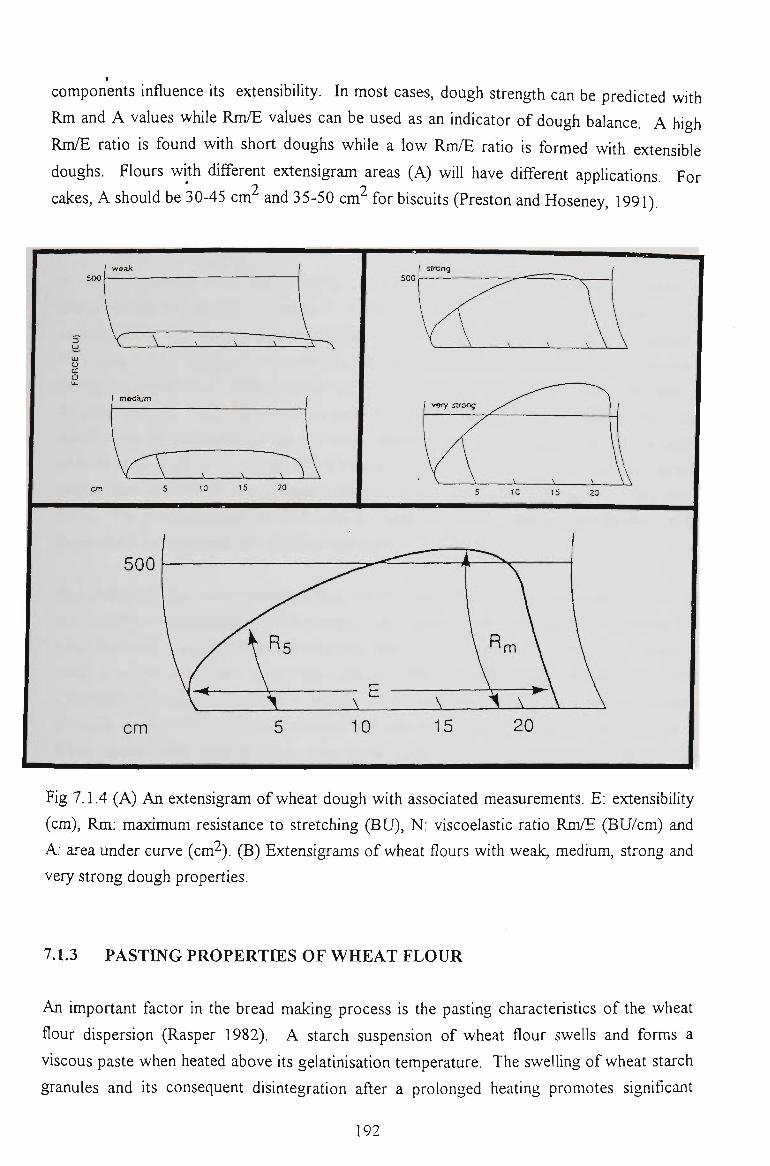
•
components influence Us extensibility. In most cases, dough strength can be predicted with
Rm and A values while Rm/E values can be used as an indicator of dough balance. A high
Rm/E ratio is found with short doughs while a low Rm/E ratio is formed with extensible
doughs. Flours with different extensigram areas (A) wiU have different applications. For
cakes, A should be 30-45 cm and 35-50 cm^ for biscuUs (Preston and Hoseney, 1991).
medium
500
cm 10 15 20
Fig 7.1.4 (A) An extensigram of wheat dough with associated measurements. E: extensibility
(cm), Rm: maximum resistance to stretching (BU), N: viscoelastic ratio Rm/E (BU/cm) and
A; area under curve (cm^). (B) Extensigrams of wheat flours with weak, medium, strong and
very strong dough properties.
7.1.3 PASTING PROPERTIES OF WHEAT FLOUR
An important factor in the bread making process is the pasting characteristics of the wheat
flour dispersion (Rasper 1982). A starch suspension of wheat flour swells and forms a
viscous paste when heated above Us gelatinisation temperature. The swelling of wheat starch
granules and its consequent disintegration after a prolonged heating promotes significant
192
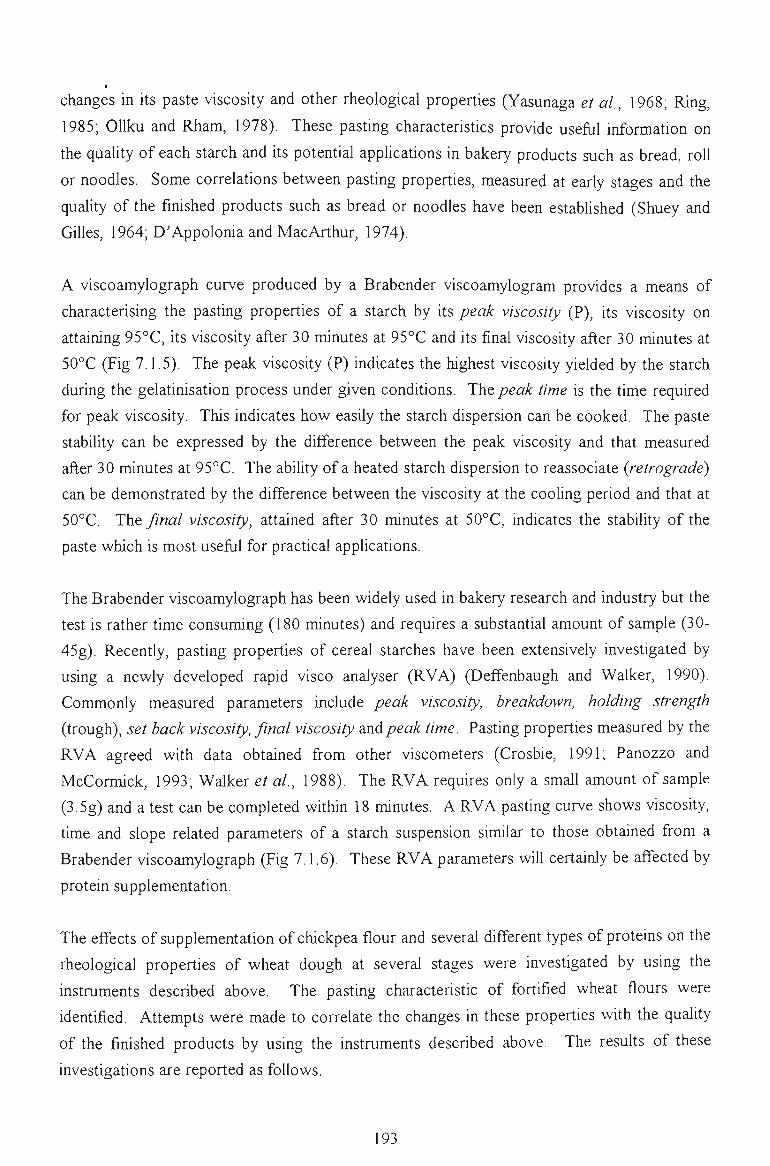
changes in Us paste viscosity and other rheological properties (Yasunaga et al, 1968; Ring,
1985; OUku and Rham, 1978). These pasting characteristics provide useful information on
the quality of each starch and Us potential applications in bakery products such as bread, roll
or noodles. Some correlations between pasting properties, measured at early stages and the
quality of the finished products such as bread or noodles have been estabUshed (Shuey and
Gilles, 1964; D'Appolonia and MacArthur, 1974).
A viscoamylograph curve produced by a Brabender viscoamylogram provides a means of
characterising the pasting properties of a starch by its peak viscosity (P), Us viscosity on
attaining 95°C, its viscosity after 30 minutes at 95°C and Us final viscosity after 30 minutes at
50°C (Fig 7.1.5). The peak viscosity (P) indicates the highest viscosity yielded by the starch
during the gelatirusation process under given conditions. Th.t peak time is the time required
for peak viscosity. This indicates how easily the starch dispersion can be cooked. The paste
stability can be expressed by the difference between the peak viscosity and that measured
after 30 minutes at 95°C. The abUity of a heated starch dispersion to reassociate {retrograde)
can be demonstrated by the difference between the viscosity at the cooling period and that at
50°C. The final viscosity, attained after 30 minutes at 50°C, indicates the stabUity of the
paste which is most useflil for practical applications.
The Brabender viscoamylograph has been widely used in bakery research and industry but the
test is rather time consuming (180 minutes) and requires a substantial amount of sample (30-
45g). Recently, pasting properties of cereal starches have been extensively investigated by
using a newly developed rapid visco analyser (RVA) (Deffenbaugh and Walker, 1990).
Commonly measured parameters include peak viscosity, breakdown, holding strength
(trough), set back viscosity, final viscosity and peak time. Pasting properties measured by the
RVA agreed with data obtained from other viscometers (Crosbie, 1991; Panozzo and
McCormick, 1993; Walker et al, 1988). The RVA requires only a small amount of sample
(3.5g) and a test can be completed within 18 minutes. A RVA pasting curve shows viscosity,
time and slope related parameters of a starch suspension similar to those obtained from a
Brabender viscoamylograph (Fig 7.1.6). These RVA parameters wiU certainly be affected by
protein supplementation.
The effects of supplementation of chickpea flour and several different types of proteins on the
rheological properties of wheat dough at several stages were investigated by using the
instruments described above. The pasting characteristic of fortified wheat flours were
identified. Attempts were made to correlate the changes in these properties wUh the quality
of the finished products by using the instruments described above. The resuUs of these
investigations are reported as follows.
193
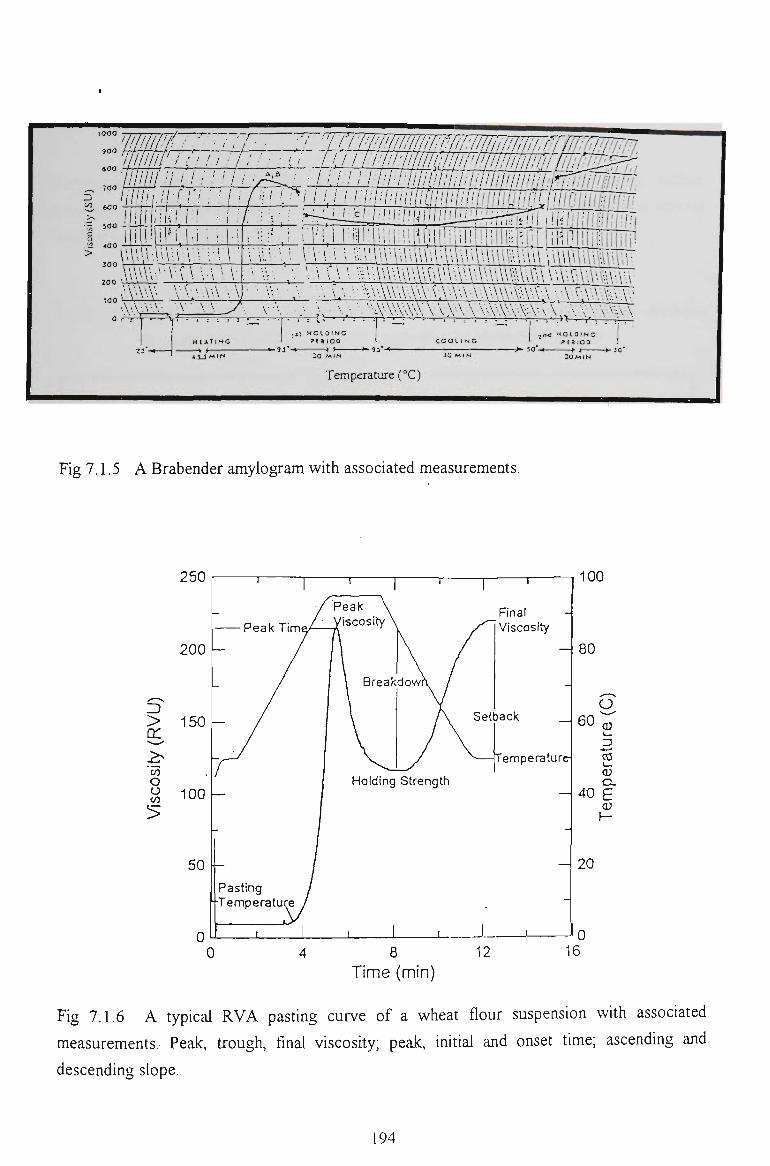
'ZL-iZiimm^^
20
TOO
0
p \ U ' \ i \ M \ • V
„ . m \ - . ^ ' v \ A \ A - . \ m - . \ \ V ^ - \ A ' . . \
I i ; u l ! l l HO
. . . \ -\ ^MmMMMK\M\m \\\\'
I
; ^,A-XA^\\^xsm'}^-mm\S'A mA^Am\-
, H H O L D I N G ? ( a lOO
_ ^ 9 3 " - < > i k- 9 3 ' - * -
j n d H o L 0 ) N G c txioo
-<• ) >-3a
Temperature (°C)
Fig 7.1.5 A Brabender amylogram with associated measurements.
250
Pasting jTemperature
100
Time (min)
Fig 7.1.6 A typical RVA pasting curve of a wheat flour suspension with associated
measurements. Peak, trough, final viscosity; peak, initial and onset time; ascending and
descending slope.
194

7.2 FARINOGRAPH STUDY
Farinograph parameters of wheat flour doughs fortified with chickpea flours, native,
acetylated, succinylated, enzymatically treated chickpea proteins and soy protein at several
levels are given in Table 7.2.1 and Table 7.2.2.
Table 7.2.1 Effect of adding soy protein, native and modified chickpea proteins and chickpea
flours on the water absorption and peak time of wheat flour doughs.
Dough Characteristic
Protein added %
Soy
Chickpea protein (CP)
ACP6
ACP45
ACP49
SCP16
SCP73
SCP79
Papain treated CP
Trypsin treated CP
Chickpea flour
Wheat flour
Water absorpt
1
62.4
61.8
62.9
62.3
62.3
62.9
62.9
62.3
61.6
62.0
8
60.7
2
63.2
63.3
63.2
63.4
63.0
63.6
63.5
63.5
61.2
62.3
15
60.4
ion (%)
4
64.9
64.2
64.2
64.5
64.0
64.3
64.6
64.5
60.7
63.2
25
60.1
8
-
67.2
-
-
66.2
-
-
64.0
-
-
62.5
Peak time (min.)
1
2.50
3.00
2.00
2.75
3.00
2.50
2.75
2.75
3.75
3.75
8
5.50
2
2.75
2.50
2.35
2.50
2.50
2.75
2.75
2.75
5.90
3.00
15
5.50
4
3.00
2.20
2.40
2.40
2.30
3.00
2.75
2.50
6.00
2.75
25
6.00
8
-
-
-
2.20
-
-
2.00-
-
-
3.00
7.2.1 WATER ABSORPTION
a. Flour Substitution
Substituting wheat flour with 8%, 15% and 25% chickpea flour reduced water absorption
about 2%. Water absorption decreased with increasing amount of chickpea flour added. This
observation is in contrast with a similar study by Dodok et al. (1993) who reported that
195
replacement of wheat flour by 20% chickpea flour increased water absorption about 2%.
However, in an eariier study, Yousseff ef al. (1976) found that substitution of wheat flour
with 5%) chickpea flour resuUed in a \%o reduction in water absorption on average. Siroilar
resuU was also reported by Ferdinandez and Berry (1989).
A reduction in water absorption in this study can be attributed to two possible factors:
composition and physical difference. Replacing wheat flour with 15-25% chickpea flour did
not reduce the total protein content in the system but U did replace wheat protein by a non
wheat protein. Firstly, if U was replaced by a protein wUh less Unbibition or absorption
power, the water absorption of fortified wheat dough would be reduced. As a major
constituent of flour, starch may also have similar influences on water absorption. Secondly,
chickpea flour with particle size larger than those of wheat flour would have reduced surface
area, thus, reducing Us water absorption capacity (Wong and LeUevre, 1982).
Supplementation of wheat flour with flours from oil seeds or grain legumes could eUher
increase or decrease water absorption of the fortified dough. Flours obtained from oilseeds
such as cottonseed, peanut, safflower, soy (Matthews et al, 1970), sunflower (Zimmermann
et al, 1984; Fleming and Sosulski, 1977) or from grain legumes such as lupin (Campos and
El Dash, 1978; Ballester et al, 1984), Great northern bean (Sathe et al. 1981) and navy bean
(D'Appoloiua, 1978) did increase the farinograph absorption. In contrast, adding flours
obtained from faba bean, pinto bean, mung bean, lentUs and field pea (D'Appolonia, 1977;
Fleming and Sosulski, 1977) did reduce the farinograph absorption. Interestingly, adding
horsebean flour did not affect water absorption of supplemented wheat flour (Patel and
Johnson, 1975). In addition, faba bean flour and protein isolates reduced water absorption of
Neepa wheat flour but showed no effect on that of gleiUea flour which has very strong dough
mixing properties (Yousseff and Bushuk, 1986). These different effects on the water
absorption of composite flours could be attributed to several factors: diverse nature of
starches in supplemented proteins, different particle sizes and the type of protein investigated
and also the nature of the wheat used.
b. Protein Substitution
Replacing wheat flour with native, acetylated, succinylated, trypsin treated chickpea protems
and soy protein isolate increased farinograph absorption of wheat flour. Water absorption
increased with the increasing level of protein substitution. In general, protein
supplementation at 2%) resuUed in a 1% absolute increase in water absorption. Chickpea
protein with different levels of acetylation or succinylation showed no difference on the
effect of water absorption. Unlike other chickpea proteins, papain hydrolysed chickpea
protein decreased the water absorption of the fortified dough. Overall, the change in water
196
absorption of protein supplemented doughs could likely be caused by the level of protein
added rather than the replacement of wheat starch. Similar increase in water absorption was
obtained with cottonseed (Khan et al, 1976), Great northern bean (Sathe et al, 1981), soy
(Zimmermann and Mieth, 1986), sunflower (Zimmermann et al, 1984) and lupin protein
(Ballester et al, 1984) fortified wheat flour.
7.2.2 PEAK TIME
a. Flour Substitution
In an earlier study on rheological properties of wheat dough, Markley and Bailey (1938)
found a correlation between water absorption and peak time. As water absorption increased,
the peak time increased. This observation was fiarther supported by Pulkki (1938), who
noted when particle size of the flour was reduced, the peak time was increased. An inverse
relationship between peak time and water absorption was found wUh fortified wheat flour in
this study. As the water absorption decreased (62.05% - 60.1%) with increasing level of
chickpea flour added (0 - 25%)), the peak time accordingly increased ( 3 - 6 minutes),
indicating an inhibition of starch hydration and delayed swelling. This observation was in
contrast to the results reported by Dodok et al (1993), done also on wheat dough fortified
wUh chickpea flour.
Deshpande et al (1983) found that as the level of navy bean flour in composite doughs
increased, farinograph absorption increased but peak time decreased. While using the same
navy bean flour, Silaula et al. (1989) found a contrasting resuU. In a study on the effect of
flour fraction and bean grade on rheological parameters of wheat dough, Lorimer et al
(1991) showed that although the water absorption of dough fortified with navy bean flour
increased, the peak time could either be increased (prime fines 5-10%)) or decreased (prime
cotyledon 5-10%)), depending on the flour composition. Prime fine flour contained 46%)
protein, double the protein level in the cotyledon flour.
b. Protein Substitution
The positive correlation between water absorption and peak time observed by Markley and
Bailey (1938) was found with some, but not with all, proteins investigated. When wheat flour
was replaced with soy protein isolate (1-4%), both water absorption (62.4-64.9%)) and peak
time (2.50-3.00 minutes) increased. Similar resuUs were also obtained wUh slightly acylated
chickpea proteins (ACP 16 and SCP26). For unmodified, extensively acetylated and
succinylated chickpea proteins, as the water absorption increased with increasing level of
197
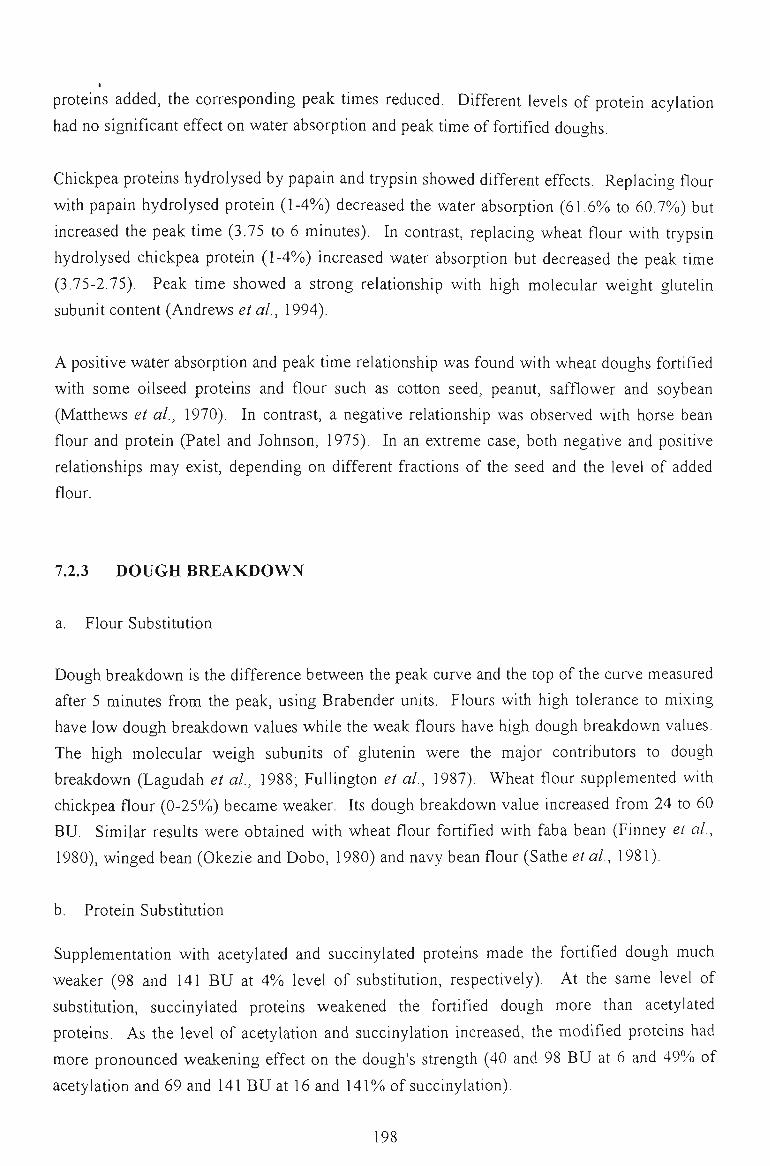
proteins added, the corresponding peak times reduced. Different levels of protein acylation
had no significant effect on water absorption and peak time of fortified doughs.
Chickpea proteins hydrolysed by papain and trypsin showed different effects. Replacing flour
with papain hydrolysed protein (1-4%) decreased the water absorption (61.6% to 60.7%) but
increased the peak time (3.75 to 6 minutes). In contrast, replacing wheat flour with trypsin
hydrolysed chickpea protein (1-4%) increased water absorption but decreased the peak time
(3.75-2.75). Peak time showed a strong relationship with high molecular weight glutelin
subunit content (Andrews et al, 1994).
A positive water absorption and peak time relationship was found with wheat doughs fortified
with some oilseed proteins and flour such as cotton seed, peanut, safflower and soybean
(Matthews et al, 1970). In contrast, a negative relationship was observed with horse bean
flour and protein (Patel and Johnson, 1975), In an extreme case, both negative and positive
relationships may exist, depending on different fractions of the seed and the level of added
flour.
7.2.3 DOUGH BREAKDOWN
a. Flour Substitution
Dough breakdown is the difference between the peak curve and the top of the curve measured
after 5 minutes from the peak, using Brabender unUs. Flours with high tolerance to mixing
have low dough breakdown values while the weak flours have high dough breakdown values.
The high molecular weigh subunits of glutenin were the major contributors to dough
breakdown (Lagudah et al, 1988; FuUington et al, 1987). Wheat flour supplemented with
chickpea flour (0-25%)) became weaker. Its dough breakdown value increased from 24 to 60
BU. Similar results were obtained with wheat flour fortified with faba bean (Finney et al,
1980), winged bean (Okezie and Dobo, 1980) and navy bean flour (Sathe etal, 1981).
b. Protein Substitution
Supplementation with acetylated and succinylated proteins made the fortified dough much
weaker (98 and 141 BU at 4% level of substitution, respectively). At the same level of
substitution, succinylated proteins weakened the fortified dough more than acetylated
proteins. As the level of acetylation and succinylation increased, the modified proteins had
more pronounced weakening effect on the dough's strength (40 and 98 BU at 6 and 49% of
acetylation and 69 and 141 BU at 16 and 141%) of succinylation).
198
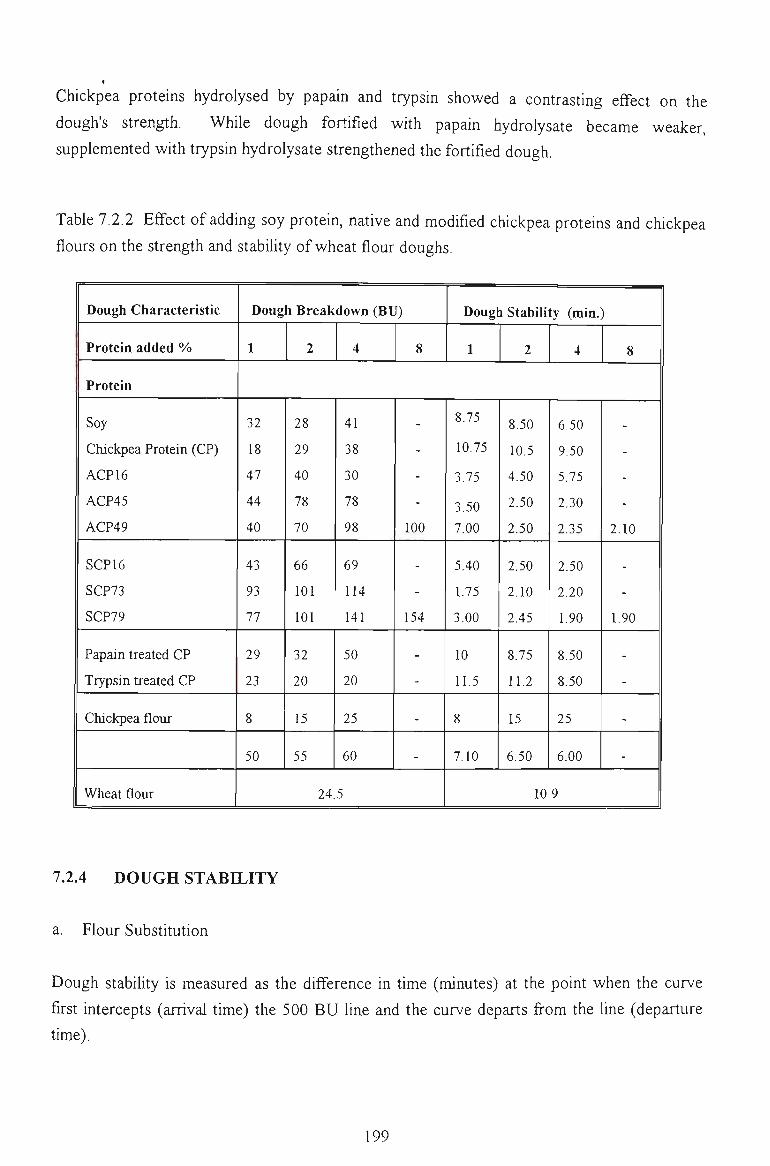
Chickpea proteins hydrolysed by papain and trypsin showed a contrasting effect on the
dough's strength. While dough fortified with papain hydrolysate became weaker,
supplemented wUh trypsin hydrolysate strengthened the fortified dough.
Table 7.2.2 Effect of adding soy protein, native and modified chickpea proteins and chickpea
flours on the strength and stability of wheat flour doughs.
Dough Characteristic
Protein added %
Protein
Soy
Chickpea Protein (CP)
ACP 16
ACP45
ACP49
SCP16
SCP73
SCP79
Papain treated CP
Trypsin treated CP
Chickpea flour
Wheat flour
Dough Breakdown (BU)
1 2 4 8
Dough Stability (min.
1 2 4
)
8
32
18
47
44
40
43
93
77
29
23
8
50
28
29
40
78
70
66
101
101
32
20
15
55
41
38
30
78
98
69
114
141
50
20
25
60
-
-
-
-
100
-
-
154
-
-
-
-
24.5
8.75
10.75
3.75
3.50
7.00
5.40
1.75
3.00
10
11.5
8
7.10
8.50
10.5
4.50
2.50
2.50
2.50
2.10
2.45
8.75
11.2
15
6.50
6.50
9.50
5.75
2.30
2.35
2.50
2.20
1.90
8.50
8.50
25
6.00
«
-
-
-
2.10
-
-
1.90
-
-
.
-
10.9
7.2.4 DOUGH STABILITY
a. Flour Substitution
Dough stability is measured as the difference in time (minutes) at the point when the curve
first intercepts (arrival time) the 500 BU line and the curve departs from the Une (departure
time).
199
b. Protein Substitution
WUh the exception of the unmodified chickpea protein, supplementation wUh eUher flours or
modified proteins reduced the dough stability of all fortified wheat flours. Substitution at a
4% level of chickpea protein showed less effect on dough stability (9.5 minutes) than soy
protein (6.5 minutes) when compared with wheat flour (10.9 minutes). As the level of flour
and protein substitution increased, dough stability progressively reduced. Fortified dough
became very unstable by adding acetylated and succinylated chickpea proteins (2.35 and 1.90
minutes, respectively). The destabUising effect increased with increasing levels of protein
acetylation (3.75 to 2.35 minutes) and protein succinylation (2.50 to 1.90 minutes).
Interestingly, adding papain hydrolysed chickpea protein weakened the dough strength
(dough breakdown increased from 24.5 to 50 BU) and reduced the dough stability (from
10.90 to 8.5 minutes). While fortifiying with trypsin hydrolysed chickpea made the dough
less stable (reduced to 8.5 minutes) its strength was increased (dough breakdown decreased
from 24.5 to 20 BU).
Using a similar standard applied for wheat flour classification and based on measured
farinograph parameters, the effects of protein fortification on wheat flour can be summarised
as foUows:
1. Supplementation of wheat flour with native, slightly acetylated and enzymatically treated
chickpea proteins and soy proteins at a 4%o level had some influences on its farinograph
parameters but the fortified wheat flours still can be classified as medium flours.
2. Fortification with chickpea flour, extensively acetylated and succinylated chickpea proteins
strongly influenced all farinograh parameters of the wheat flour and the fortified wheat flour
could be considered as a weak flour.
7.3 EXTENSIGRAPH STUDY
The effects of flour and protein supplementation on the rheological properties of fortified
doughs have been reflected in many farinograph measurements. However, the changes in
structural parameters of the fortified doughs could only be Ulustrated clearly by typical
extensigraph measurements. Some representative proteins were selected and examined by
using the extensigraph. The effects of supplementation with native and some highly modified
chickpea proteins at three levels are given in Table 7.3.1. Data on soy protein and wheat flour
were also included, as reference.
200
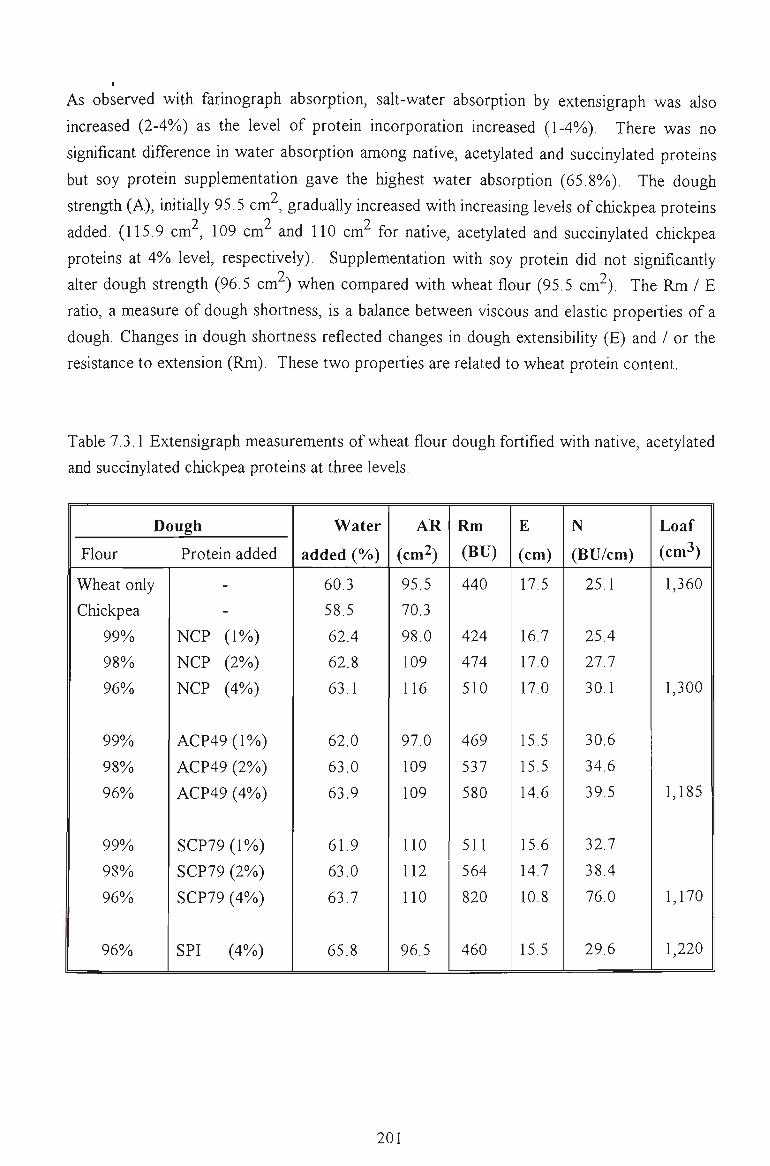
As observed wUh farinograph absorption, salt-water absorption by extensigraph was also
increased (2-4%)) as the level of protein incorporation increased (1-4%). There was no
significant difference in water absorption among native, acetylated and succinylated protems
but soy protein supplementation gave the highest water absorption (65.8%)). The dough
strength (A), initially 95.5 cm , gradually increased wUh increasing levels of chickpea proteins 7 2 9
added. (115.9 cm , 109 cm and 110 cm for native, acetylated and succmylated chickpea proteins at 4%) level, respectively). Supplementation with soy protein did not significantly
2 9
alter dough strength (96.5 cm ) when compared with wheat flour (95.5 cm ). The Rm / E
ratio, a measure of dough shortness, is a balance between viscous and elastic properties of a
dough. Changes in dough shortness reflected changes in dough extensibility (E) and / or the
resistance to extension (Rm). These two properties are related to wheat protein content.
Table 7.3.1 Extensigraph measurements of wheat flour dough fortified with native, acetylated
and succinylated chickpea proteins at three levels.
Dough
Flour
Wheat only
Chickpea
99%
98%
96%
99%
98%
96%
99%
98%
96%
96%
Protein added
-
-
NCP (1%)
NCP (2%)
NCP (4%)
ACP49 (1%)
ACP49 (2%)
ACP49 (4%)
SCP79 (1%)
SCP79 (2%)
SCP79 (4%)
SPI (4%)
Water
added (%)
60.3
58.5
62.4
62.8
63.1
62.0
63.0
63.9
61.9
63.0
63.7
65.8
AR
(cm2)
95.5
70.3
98.0
109
116
97.0
109
109
110
112
110
96.5
Rm
(BU)
440
424
474
510
469
537
580
511
564
820
460
E
(cm)
17.5
16.7
17.0
17.0
15.5
15.5
14.6
15.6
14.7
10.8
15.5
N
(BU/cm)
25.1
25.4
27.7
30.1
30.6
34.6
39.5
32.7
38.4
76.0
29.6
Loaf
(cm-')
1,360
1,300
1,185
1,170
1,220
201
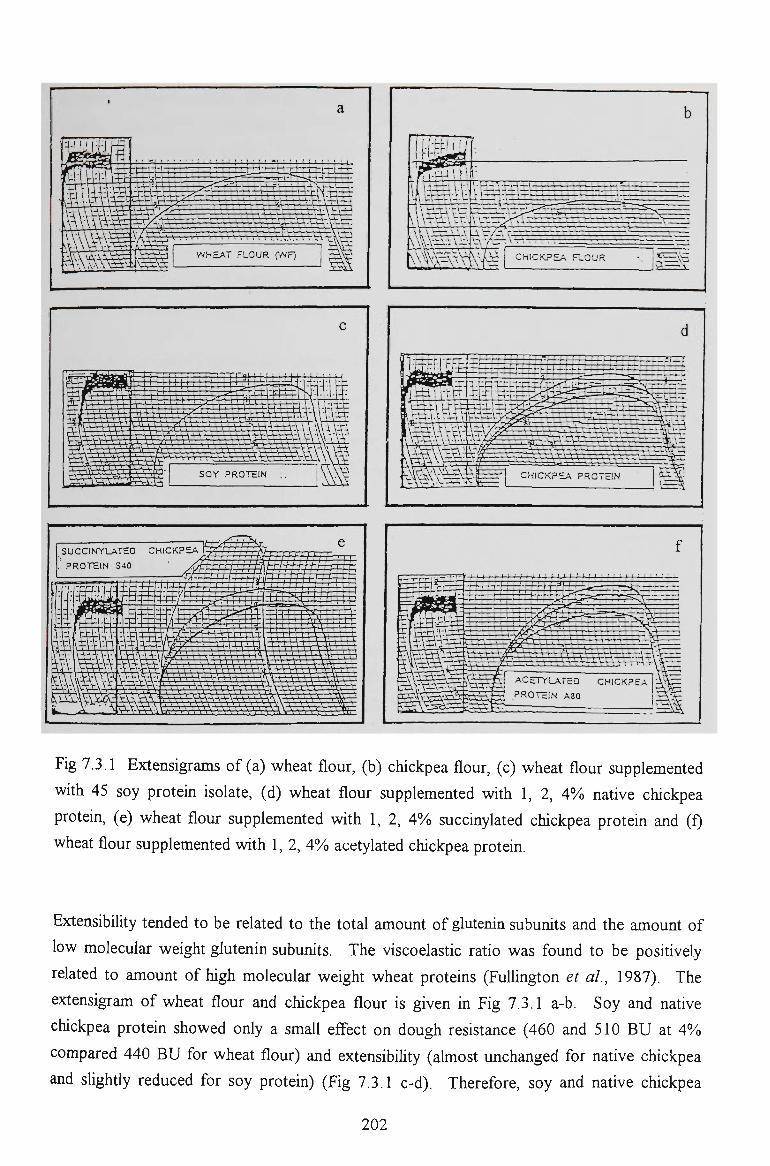
r i T ^ ' s ! ; i I i I M I i I I • ' }
SUCCIMYLATED CHICKPSA fpfj l j , ^T-A7 ; i : > i i ; i , •
,= ROTEIN S40 / ^ : i ! ' •^-rAiH-i-A-H-hl-h
^a_'£^Sp3irr- i-rt^tf ' , ^ I U - I I I • I I I I t I LI I ! ' I I • I : : ' :
^
Fig 7.3.1 Extensigrams of (a) wheat flour, (b) chickpea flour, (c) wheat flour supplemented
with 45 soy protein isolate, (d) wheat flour supplemented with 1, 2, 4%) native chickpea
protein, (e) wheat flour supplemented with 1, 2, 4%) succinylated chickpea protein and (f)
wheat flour supplemented with 1, 2, 4% acetylated chickpea protein.
Extensibility tended to be related to the total amount of glutenin subunits and the amount of
low molecular weight glutenin subunits. The viscoelastic ratio was found to be positively
related to amount of high molecular weight wheat proteins (FuUington et al, 1987). The
extensigram of wheat flour and chickpea flour is given in Fig 7.3.1 a-b. Soy and native
chickpea protein showed only a small effect on dough resistance (460 and 510 BU at 4%
compared 440 BU for wheat flour) and extensibility (almost unchanged for native chickpea
and slightly reduced for soy protein) (Fig 7.3.1 c-d). Therefore, soy and native chickpea
202
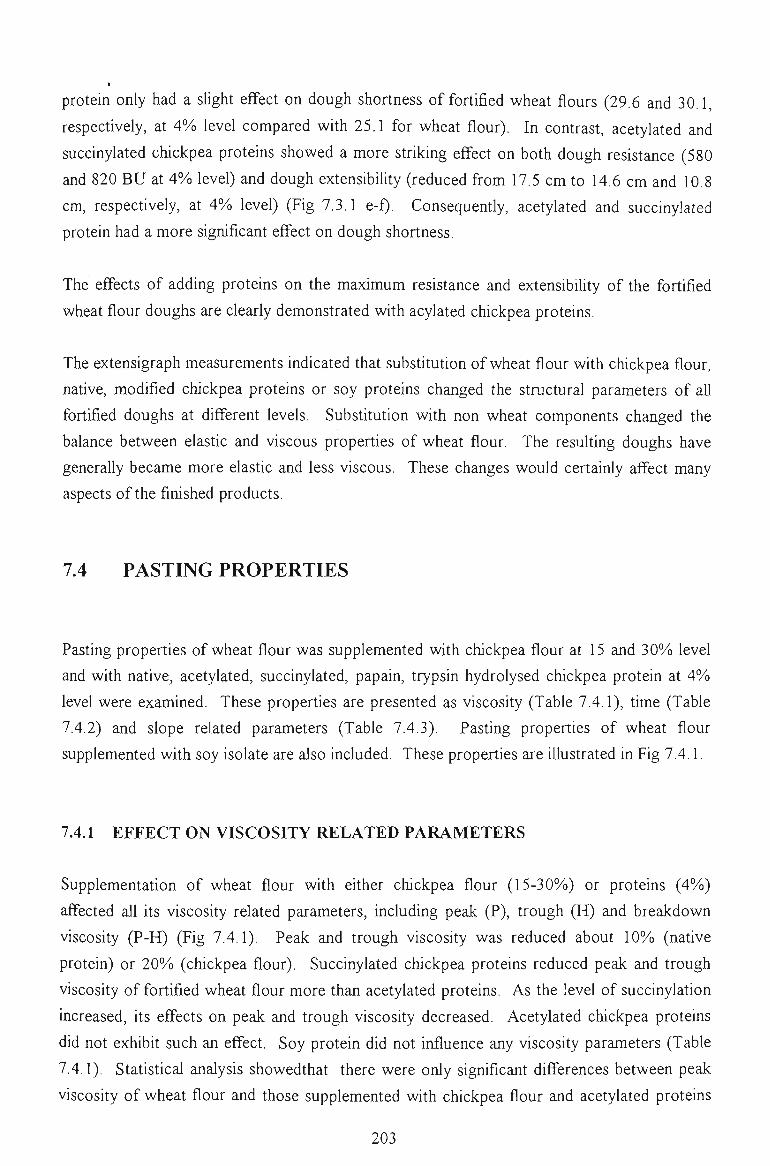
I
protein only had a slight effect on dough shortness of fortified wheat flours (29.6 and 30.1,
respectively, at 4%) level compared with 25.1 for wheat flour). In contrast, acetylated and
succinylated chickpea proteins showed a more striking effect on both dough resistance (580
and 820 BU at 4% level) and dough extensibility (reduced from 17.5 cm to 14.6 cm and 10.8
cm, respectively, at 4% level) (Fig 7.3.1 e-f). Consequently, acetylated and succinylated
protein had a more significant effect on dough shortness.
The effects of adding proteins on the maximum resistance and extensibility of the fortified
wheat flour doughs are clearly demonstrated with acylated chickpea proteins.
The extensigraph measurements indicated that substitution of wheat flour with chickpea flour,
native, modified chickpea proteins or soy proteins changed the structural parameters of aU
fortified doughs at different levels. Substitution with non wheat components changed the
balance between elastic and viscous properties of wheat flour. The resulting doughs have
generally became more elastic and less viscous. These changes would certainly affect many
aspects of the finished products.
7.4 PASTING PROPERTIES
Pasting properties of wheat flour was supplemented with chickpea flour at 15 and 30%) level
and with native, acetylated, succinylated, papain, trypsin hydrolysed chickpea protein at 4%o
level were examined. These properties are presented as viscosity (Table 7.4.1), time (Table
7.4.2) and slope related parameters (Table 7.4.3). Pasting properties of wheat flour
supplemented with soy isolate are also included. These properties are illustrated in Fig 7.4.1.
7.4.1 EFFECT ON VISCOSITY RELATED PARAMETERS
Supplementation of wheat flour with either chickpea flour (15-30%)) or proteins (4%o)
affected all its viscosity related parameters, including peak (P), trough (H) and breakdown
viscosity (P-H) (Fig 7.4.1). Peak and trough viscosity was reduced about 10%) (native
protein) or 20%) (chickpea flour). Succinylated chickpea proteins reduced peak and trough
viscosity of fortified wheat flour more than acetylated proteins. As the level of succinylation
increased, its effects on peak and trough viscosity decreased. Acetylated chickpea proteins
did not exhibU such an effect. Soy protein did not influence any viscosity parameters (Table
7.4.1). Statistical analysis showedthat there were oiUy significant differences between peak
viscosity of wheat flour and those supplemented with chickpea flour and acetylated proteins
203
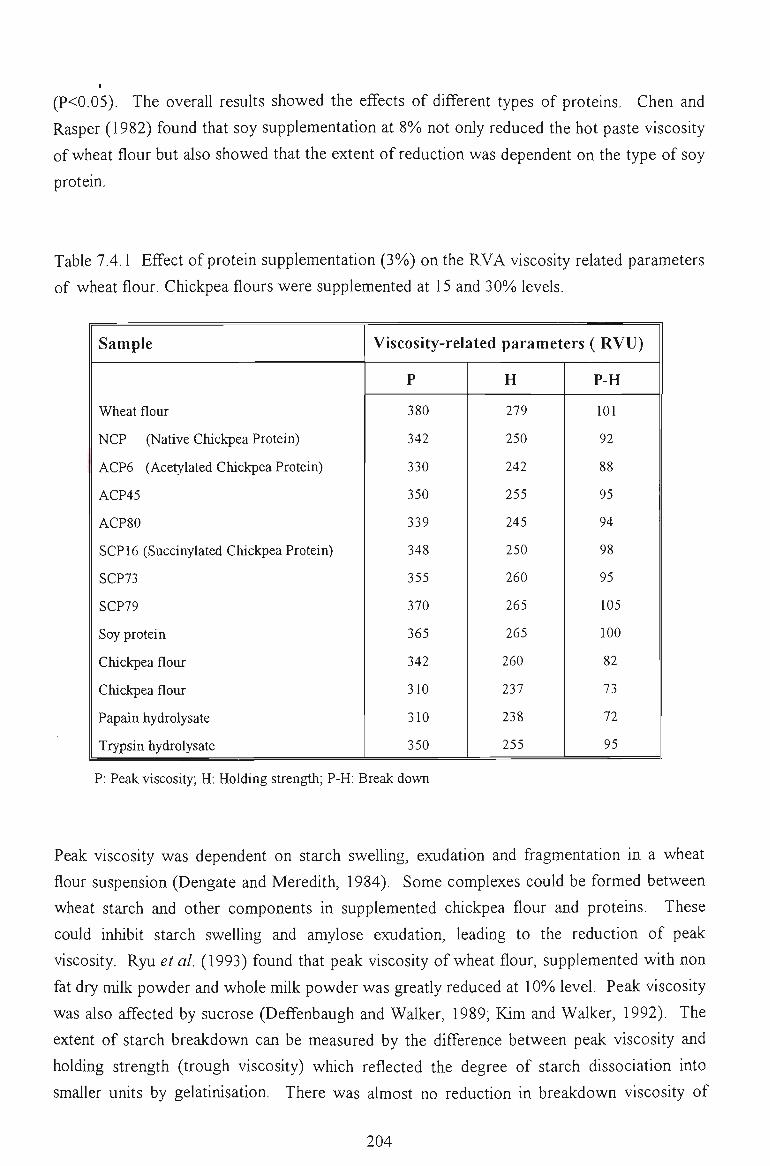
(P<0.05). The overall results showed the effects of different types of proteins. Chen and
Rasper (1982) found that soy supplementation at 8%) not only reduced the hot paste viscosity
of wheat flour but also showed that the extent of reduction was dependent on the type of soy
protein.
Table 7.4.1 Effect of protein supplementation (3%)) on the RVA viscosity related parameters
of wheat flour. Chickpea flours were supplemented at 15 and 30%) levels.
Sample
Wheat flour
NCP (Native Chickpea Protein)
ACP6 (Acetylated Chickpea Protein)
ACP45
ACP80
SCP 16 (Succinylated Chickpea Protein)
SCP73
SCP79
Soy protein
Chickpea flour
Chickpea flour
Papain hydrolysate
Trypsin hydrolysate
Viscosity-related parameters ( RVU)
P
380
342
330
350
339
348
355
370
365
342
310
310
350
H
279
250
242
255
245
250
260
265
265
260
237
238
255
P-H
101
92
88
95
94
98
95
105
100
82
73
72
95
P: Peak viscosity; H: Holding strength; P-H: Break down
Peak viscosity was dependent on starch swelling, exudation and fragmentation in a wheat
flour suspension (Dengate and Meredith, 1984). Some complexes could be formed between
wheat starch and other components in supplemented chickpea flour and proteins. These
could irUubit starch swelling and amylose exudation, leading to the reduction of peak
viscosity. Ryu et al. (1993) found that peak viscosity of wheat flour, supplemented with non
fat dry milk powder and whole milk powder was greatly reduced at 10%) level. Peak viscosity
was also affected by sucrose (Deffenbaugh and Walker, 1989; Kim and Walker, 1992). The
extent of starch breakdown can be measured by the difference between peak viscosity and
holding strength (trough viscosity) which reflected the degree of starch dissociation into
smaller unUs by gelatinisation. There was almost no reduction in breakdown viscosity of
204
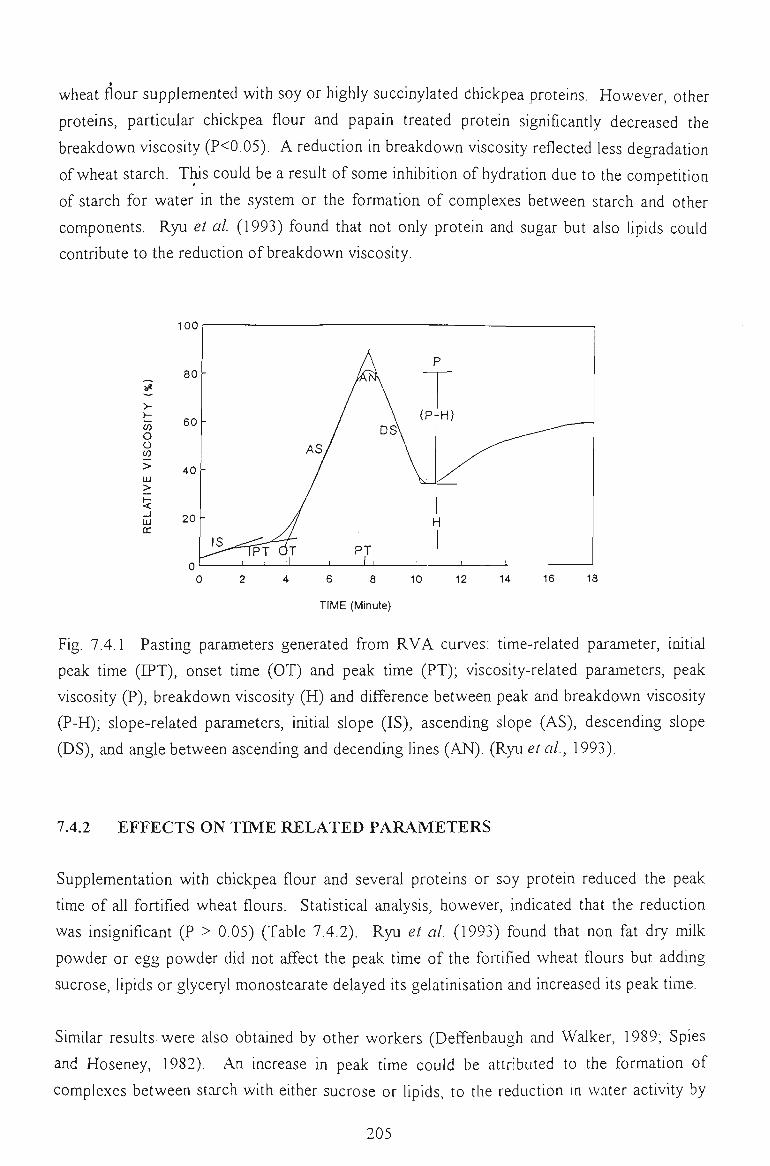
wheat flour supplemented with soy or highly succinylated Chickpea proteins. However, other
proteins, particular chickpea flour and papain treated protein significantly decreased the
breakdown viscosity (P<0.05). A reduction in breakdown viscosity reflected less degradation
of wheat starch. This could be a resuU of some inhibition of hydration due to the competUion
of starch for water in the system or the formation of complexes between starch and other
components. Ryu et al. (1993) found that not only protein and sugar but also lipids could
contribute to the reduction of breakdown viscosity.
> •
H W O o CO
> LU > _ l lU CC
100
80
60
40
20
-
-
-
I S ^ " T P T
1 1
A S /
3T ,1 1
Ds\
PT 1 ,
P
(P-H)
1-\
• 1 , 1 6 8 10
TIME (Minute)
12 14 16 18
Fig. 7.4.1 Pasting parameters generated from RVA curves: time-related parameter, initial
peak time (DPT), onset time (OT) and peak time (PT); viscosity-related parameters, peak
viscosity (P), breakdown viscosity (H) and difference between peak and breakdown viscosity
(P-H); slope-related parameters, initial slope (IS), ascending slope (AS), descending slope
(DS), and angle between ascending and decending lines (AN). (Ryu et al, 1993).
7.4.2 EFFECTS ON TIME RELATED PARAMETERS
Supplementation with chickpea flour and several proteins or soy protein reduced the peak
time of all fortified wheat flours. Statistical analysis, however, indicated that the reduction
was insignificant (P > 0.05) (Table 7.4.2). Ryu et al. (1993) found that non fat dry milk
powder or egg powder did not affect the peak time of the fortified wheat flours but adding
sucrose, lipids or glyceryl monostearate delayed its gelatinisation and increased Us peak time.
Similar resuUs were also obtained by other workers (Deffenbaugh and Walker, 1989; Spies
and Hoseney, 1982). An increase in peak time could be attributed to the formation of
complexes between starch with eUher sucrose or lipids, to the reduction in water activUy by
205
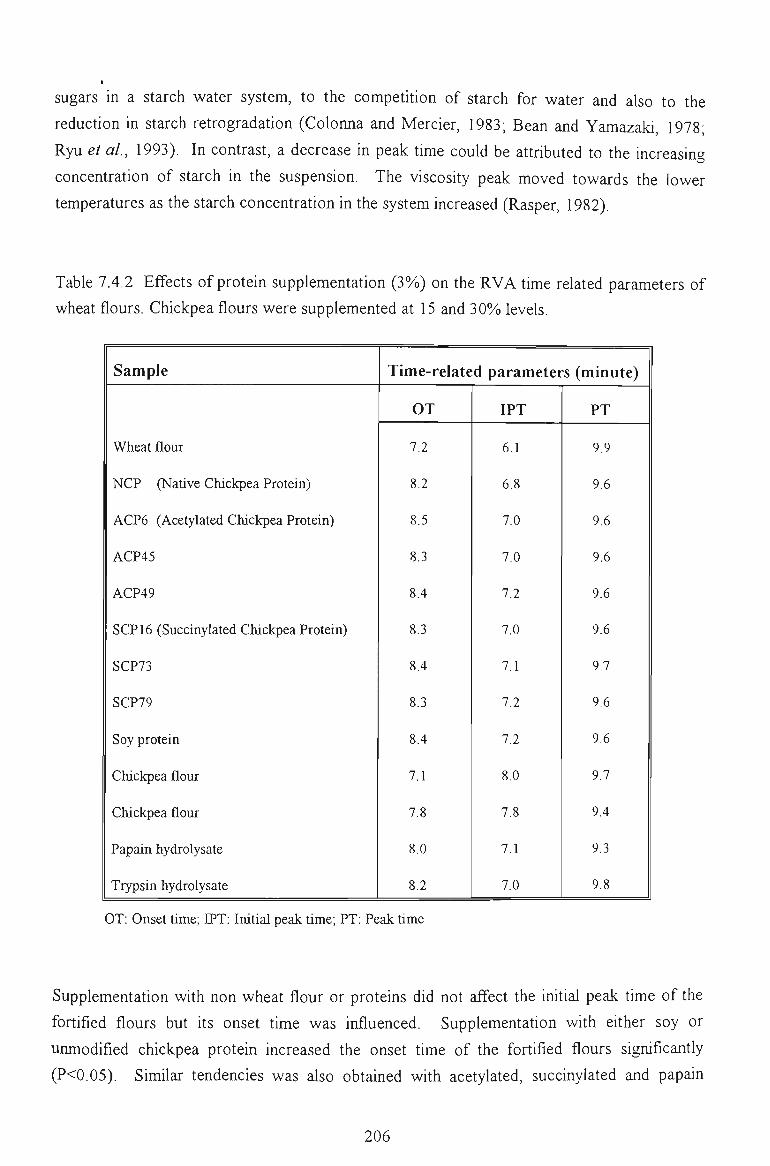
sugars in a starch water system, to the competUion of starch for water and also to the
reduction in starch retrogradation (Colonna and Mercier, 1983; Bean and Yamazaki, 1978;
Ryu et al, 1993). In contrast, a decrease in peak time could be attributed to the increasing
concentration of starch in the suspension. The viscosity peak moved towards the lower
temperatures as the starch concentration in the system increased (Rasper, 1982).
Table 7.4.2 Effects of protein supplementation (3%)) on the RVA time related parameters of
wheat flours. Chickpea flours were supplemented at 15 and 30%) levels.
Sample
Wheat flour
NCP (Native Chickpea Protein)
ACP6 (Acetylated Chickpea Protein)
ACP45
ACP49
SCP 16 (Succinylated Chickpea Protein)
SCP73
SCP79
Soy protein
Chickpea flour
Chickpea flour
Papain hydrolysate
Trypsin hydrolysate
Time-related parameters (minute)
OT
7.2
8.2
8.5
8.3
8.4
8.3
8.4
8.3
8.4
7.1
7.8
8.0
8.2
IPT
6.1
6.8
7.0
7.0
7.2
7.0
7.1
7.2
7.2
8.0
7,8
7,1
7.0
PT
9.9
9.6
9.6
9.6
9.6
9.6
9.7
9.6
9.6
9.7
9.4
9.3
9.8
OT: Onset time; DPT: Initial peak time; PT: Peak time
Supplementation with non wheat flour or proteins did not affect the initial peak time of the
fortified flours but Us onset time was influenced. Supplementation with eUher soy or
unmodified chickpea protein increased the onset time of the fortified flours significantly
(P<0.05). Similar tendencies was also obtained with acetylated, succinylated and papain
206
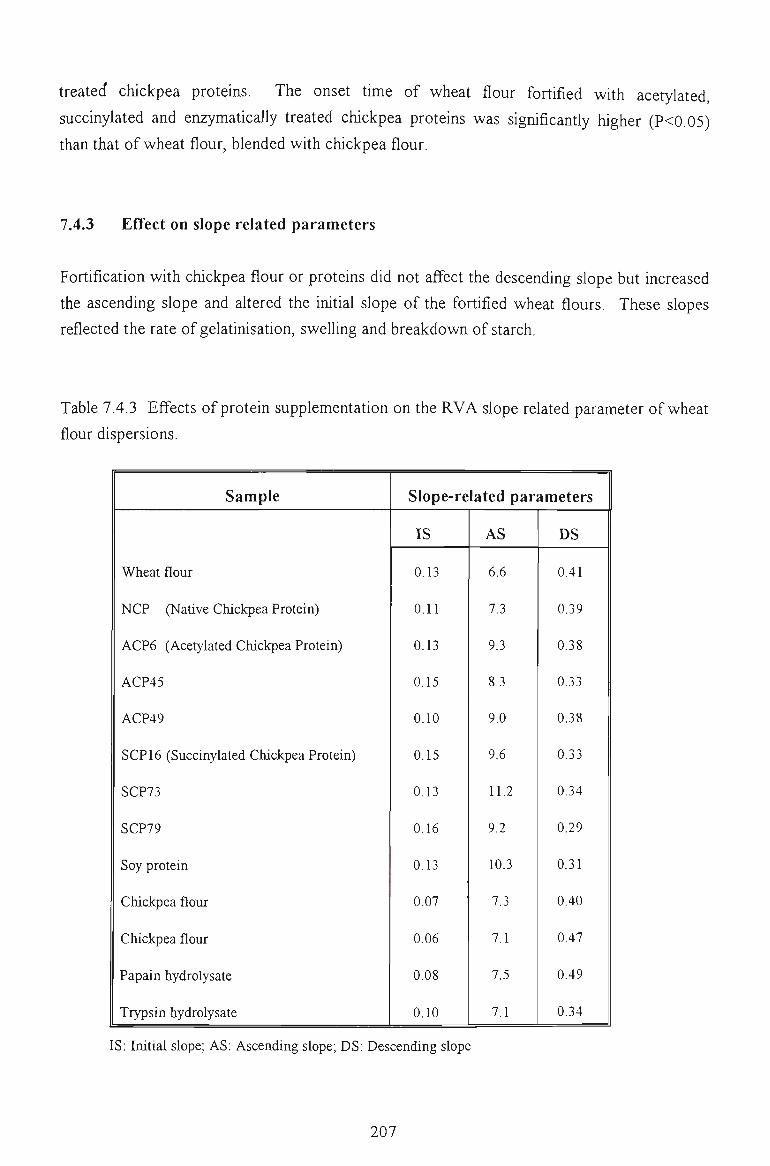
treated chickpea proteins. The onset time of wheat flour fortified with acetylated,
succinylated and enzymatically treated chickpea proteins was sigiuficantly higher (P<0.05)
than that of wheat flour, blended with chickpea flour.
7.4.3 Effect on slope related parameters
Fortification with chickpea flour or proteins did not affect the descending slope but increased
the ascending slope and altered the irutial slope of the fortified wheat flours. These slopes
reflected the rate of gelatiiusation, swelling and breakdown of starch.
Table 7.4.3 Effects of protein supplementation on the RVA slope related parameter of wheat
flour dispersions.
Sample
Wheat flour
NCP (Native Chickpea Protein)
ACP6 (Acetylated Chickpea Protein)
ACP45
ACP49
SCP 16 (Succinylated Chickpea Protein)
SCP73
SCP79
Soy protein
Chickpea flour
Chickpea flour
Papain hydrolysate
Trypsin hydrolysate
Slope-related parameters
IS
0.13
0.11
0.13
0.15
0.10
0.15
0.13
0.16
0.13
0.07
0.06
0.08
0.10
AS
6.6
7.3
9.3
8.3
9.0
9.6
11.2
9.2
10.3
7.3
7.1
7.5
7.1
DS
0.41
0.39
0.38
0.33
0.38
0.33
0.34
0.29
0.31
0.40
0.47
0.49
0.34
IS: Initial slope; AS: Ascending slope; DS: Descending slope
207
I
Adding chickpea flours (15-30%o) sigiuficantly decreased (P<0.05) the initial slope of the
fortified flours. The initial slope of chickpea flour fortified wheat was significantly (P<0.05)
lower than that of wheat flour fortified wUh acetylated, succinylated chickpea and soybean
proteins. Statistical analysis showed that adding chickpea flours, hydrolysates or native
proteins did not significantly affect the ascending slope of the fortified flours. However
acetylated, succinylated chickpea and soy protein significantly (P<0.01) increased the
ascending slope of fortified wheat flours.
7.5 FACTORS AFFECTING THE PEAK VISCOSITY
Information gained from either Brabender viscoamylograph or Rapid visco analyser is useflil
for practical appUcations in the cereal industry to assess the quality of wheat flours (Meredith,
1970; Patterson and Crandall, 1967; Bason et al, 1993) and also for more basic research
applications (Deffenbaugh and Walker, 1989).
Information on the peak, viscosity is particularly important since several correlations have
been established between the maximum viscosity and flour's baking quality as well as the
characteristics of finished products. For example. Brown and Harrel (1944) showed a strong
relationship between the amylograph peak viscosity and the baking quality of rye flours. The
effects of peak viscosity on the quality of bread texture (Yasunaga et al, 1968), pasta (Shuey
and GiUes, 1964) and Japanese noodles (Bean et al, 1974) have been investigated. Recently,
Panozzo and McCormick (1993) showed that peak viscosity, measured by the RVA, was
highly correlated wUh sensory eating quality of Japanese and Korean style white salted
noodles.
Peak viscosity increased when starch formed complexes with hydrocoUoids such as guar,
xanthan, locust bean gums (Bahnassey and Breene, 1994), or with sugars (Ryu et al, 1993;
Deffenbaugh and Walker, 1990). The effects of adding protein on the amylo viscosity have
not been adequately investigated. In an earUer investigation. Anker and Geddes (1944) found
that peak viscosity increased in the presence of gluten. Consequently, more experiments were
conducted in this investigation to elucidate the effects of adding non wheat proteins, either as
flour or concentrates, on the peak viscosity of the fortified wheat flours.
As presented in Table 7.4.1, supplementing wheat flour with chickpea proteins at a 3%) level
reduced the peak viscosity of all fortified flours. Similarly, Chen and Rasper (1982) found
that the hot paste peak viscosity of wheat flour was reduced when supplemented wUh 8% soy
proteins. The peak viscosity is the highest viscosity yielded by the starch during the
208
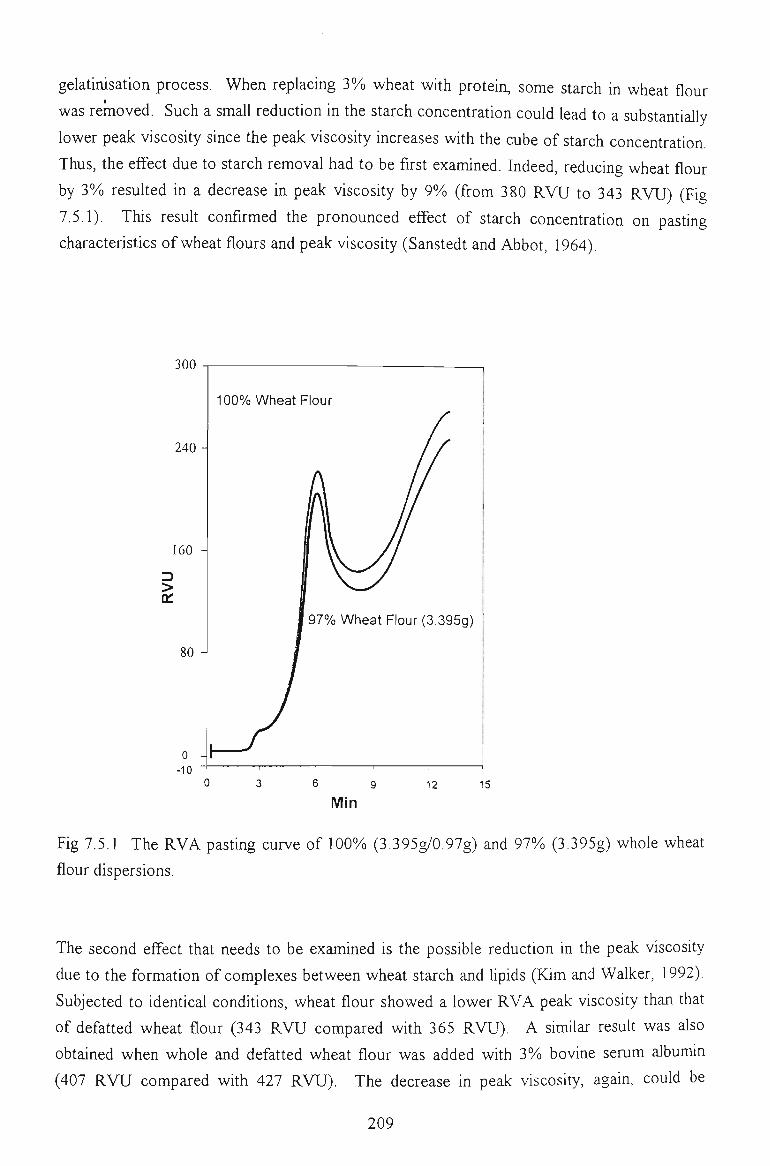
gelatinisation process. When replacing 3% wheat wUh protein, some starch in wheat flour
was removed. Such a small reduction in the starch concentration could lead to a substantially
lower peak viscosity since the peak viscosity increases with the cube of starch concentration
Thus, the effect due to starch removal had to be first examined. Indeed, reducmg wheat flour
by 3% resuUed in a decrease in peak viscosity by 9%) (from 380 RVU to 343 RVU) (Fig
7.5.1). This resuU confirmed the pronounced effect of starch concentration on pasting
characteristics of wheat flours and peak viscosity (Sanstedt and Abbot, 1964).
300
240-
160 -
> OL
80 -
0 -10
100% Wheat Flour
97% Wheat Flour (3.395g)
15
Min
Fig 7.5.1 The RVA pasting curve of 100% (3.395g/0.97g) and 97% (3.395g) whole wheat
flour dispersions.
The second effect that needs to be examined is the possible reduction in the peak viscosity
due to the formation of complexes between wheat starch and lipids (Kim and Walker, 1992).
Subjected to identical conditions, wheat flour showed a lower RVA peak viscosity than that
of defatted wheat flour (343 RVU compared with 365 RVU). A similar resuU was also
obtained when whole and defatted wheat flour was added with 3% bovine serum albumin
(407 RVU compared with 427 RVU). The decrease in peak viscosity, again, could be
209
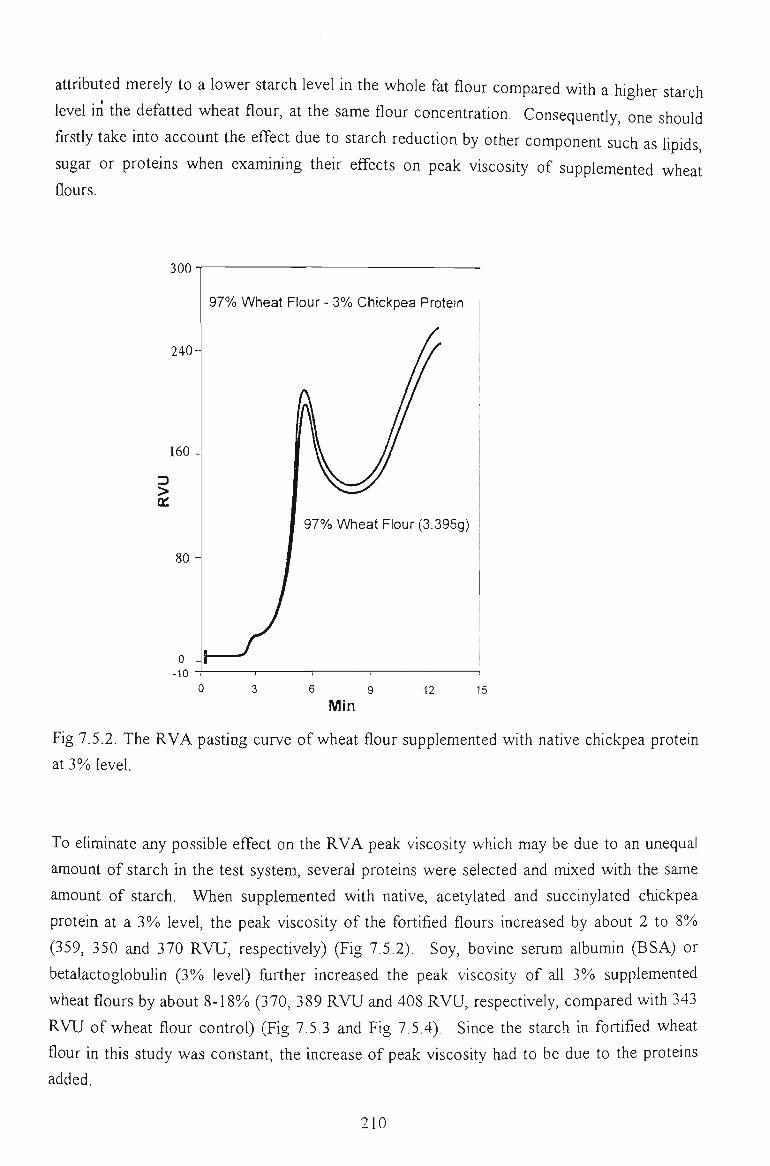
attributed merely to a lower starch level in the whole fat flour compared with a higher starch
level iri the defatted wheat flour, at the same flour concentration. Consequentiy, one should
firstly take into account the effect due to starch reduction by other component such as lipids
sugar or proteins when examining their effects on peak viscosity of supplemented wheat
flours.
300
240-
160
>
80-
0 -10 -+
97% Wheat Flour - 3% Chickpea Protein
97% Wheat Flour (3.395g)
6 9
Min 12 15
Fig 7.5.2. The RVA pasting curve of wheat flour supplemented wUh native chickpea protein
at 3% level.
To eUminate any possible effect on the RVA peak viscosity which may be due to an unequal
amount of starch in the test system, several proteins were selected and mixed with the same
amount of starch. When supplemented with native, acetylated and succinylated chickpea
protein at a 3%) level, the peak viscosity of the fortified flours increased by about 2 to 8%
(359, 350 and 370 RVU, respectively) (Fig 7.5.2). Soy, bovine serum albumin (BSA) or
betalactoglobuUn (3%o level) fiirther increased the peak viscosity of all 3%) supplemented
wheat flours by about 8-18% (370, 389 RVU and 408 RVU, respectively, compared with 343
RVU of wheat flour control) (Fig 7.5.3 and Fig 7.5.4). Since the starch in fortified wheat
flour in this study was constant, the increase of peak viscosity had to be due to the proteins
added.
210
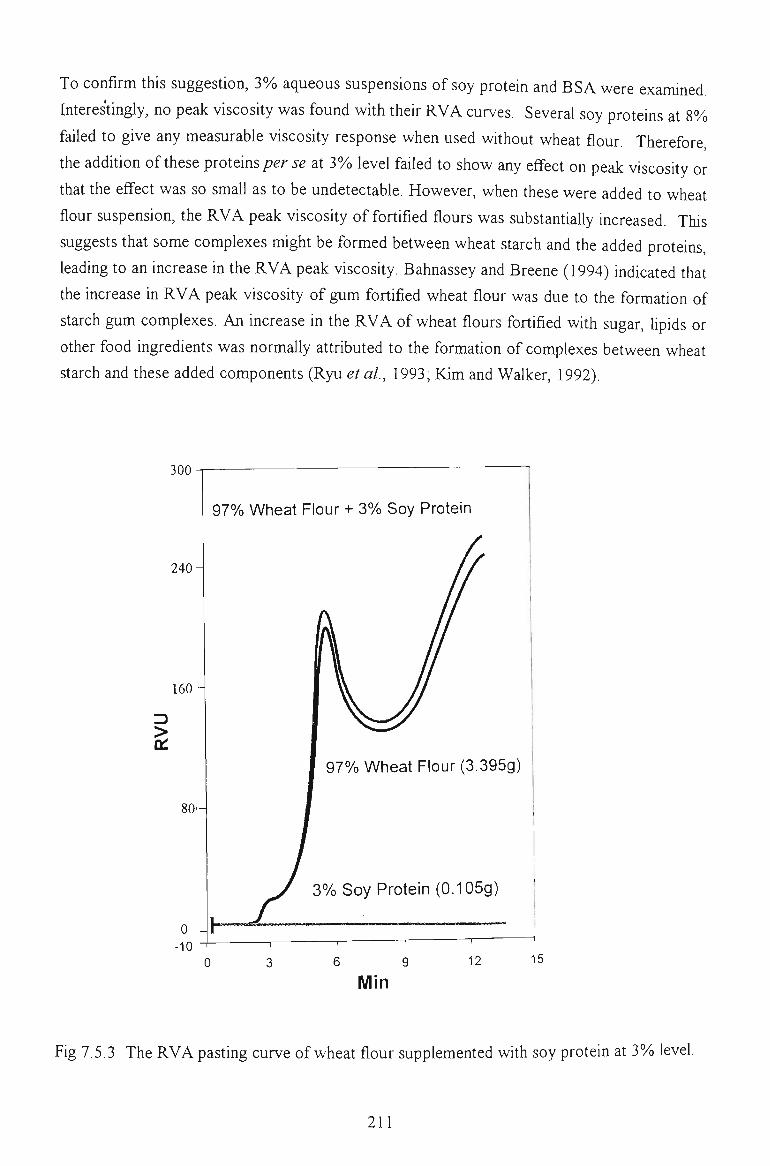
To confirm this suggestion, 3%) aqueous suspensions of soy protein and BSA were examined
Interestingly, no peak viscosity was found wUh their RVA curves. Several soy proteins at 8%
failed to give any measurable viscosity response when used without wheat flour. Therefore
the addition of these proteins per se at 3%) level faUed to show any effect on peak viscosity or
that the effect was so small as to be undetectable. However, when these were added to wheat
flour suspension, the RVA peak viscosity of fortified flours was substantially increased. This
suggests that some complexes might be formed between wheat starch and the added proteins,
leading to an increase in the RVA peak viscosity. Bahnassey and Breene (1994) indicated that
the increase in RVA peak viscosity of gum fortified wheat flour was due to the formation of
starch gum complexes. An increase in the RVA of wheat flours fortified with sugar, lipids or
other food ingredients was normally attributed to the formation of complexes between wheat
starch and these added components (Ryu et al, 1993; Kim and Walker, 1992).
300
240
97% Wheat Flour + 3% Soy Protein
160-
>
a:
80'-
-10 -+-
97% Wheat Flour (3.395g)
3% Soy Protein (0.105g)
3 6 9 12
Min 15
Fig 7.5.3 The RVA pasting curve of wheat flour supplemented with soy protein at 3% level.
211
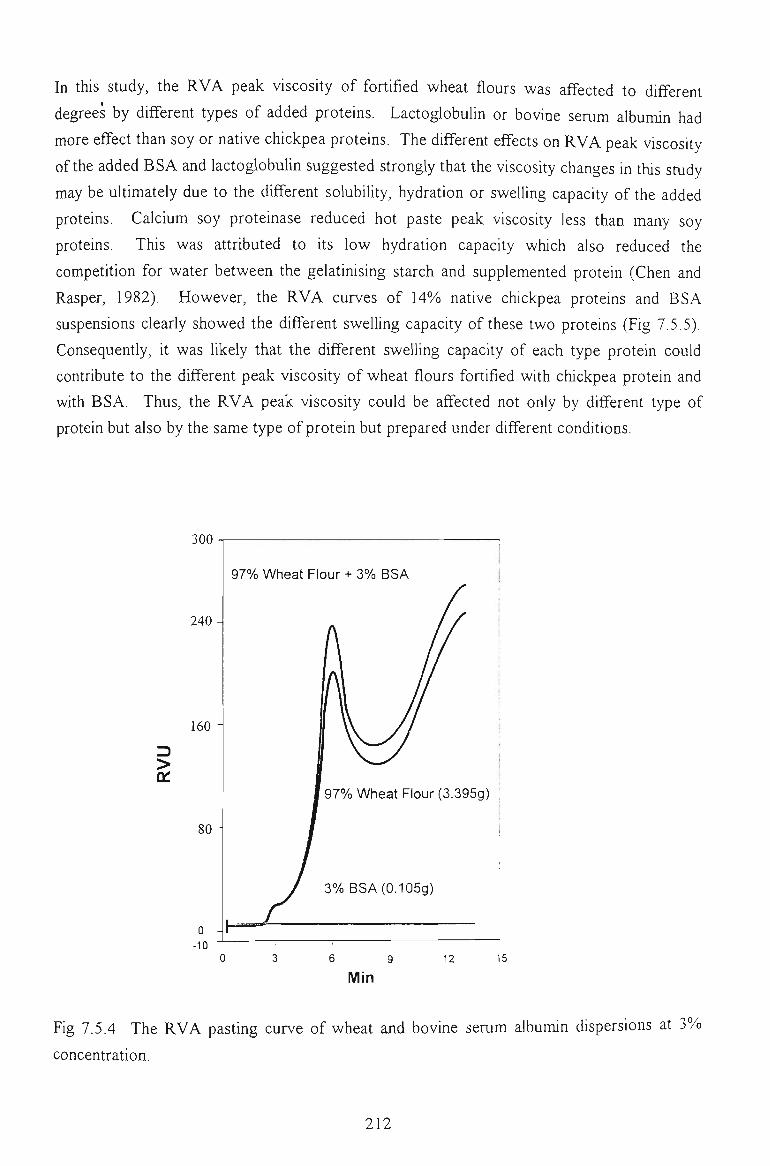
In this study, the RVA peak viscosity of fortified wheat flours was affected to different
degrees by different types of added proteins. LactoglobuUn or bovine serum albumin had
more effect than soy or native chickpea proteins. The different effects on RVA peak viscosity
of the added BSA and lactoglobuUn suggested strongly that the viscosity changes in this study
may be ultimately due to the different solubiUty, hydration or swelling capacity of the added
proteins. Calcium soy proteinase reduced hot paste peak viscosity less than many soy
proteins. This was attributed to its low hydration capacity which also reduced the
competition for water between the gelatinising starch and supplemented protein (Chen and
Rasper, 1982). However, the RVA curves of 14%) native chickpea proteins and BSA
suspensions clearly showed the different swelUng capacity of these two proteins (Fig 7.5.5).
Consequently, it was likely that the different swelUng capacity of each type protein could
contribute to the different peak viscosity of wheat flours fortified wUh chickpea protein and
with BSA. Thus, the RVA peak viscosity could be affected not only by different type of
protein but also by the same type of protein but prepared under different conditions.
300
240
160 -
>
a:
80
0 4 -10
97% Wheat Flour + 3% BSA
97% Wheat Flour (3.395g)
3%BSA(0.105g)
6 9
Min 12 15
Fig 7.5.4 The RVA pasting curve of wheat and bovine serum albumin dispersions at 3%
concentration.
212
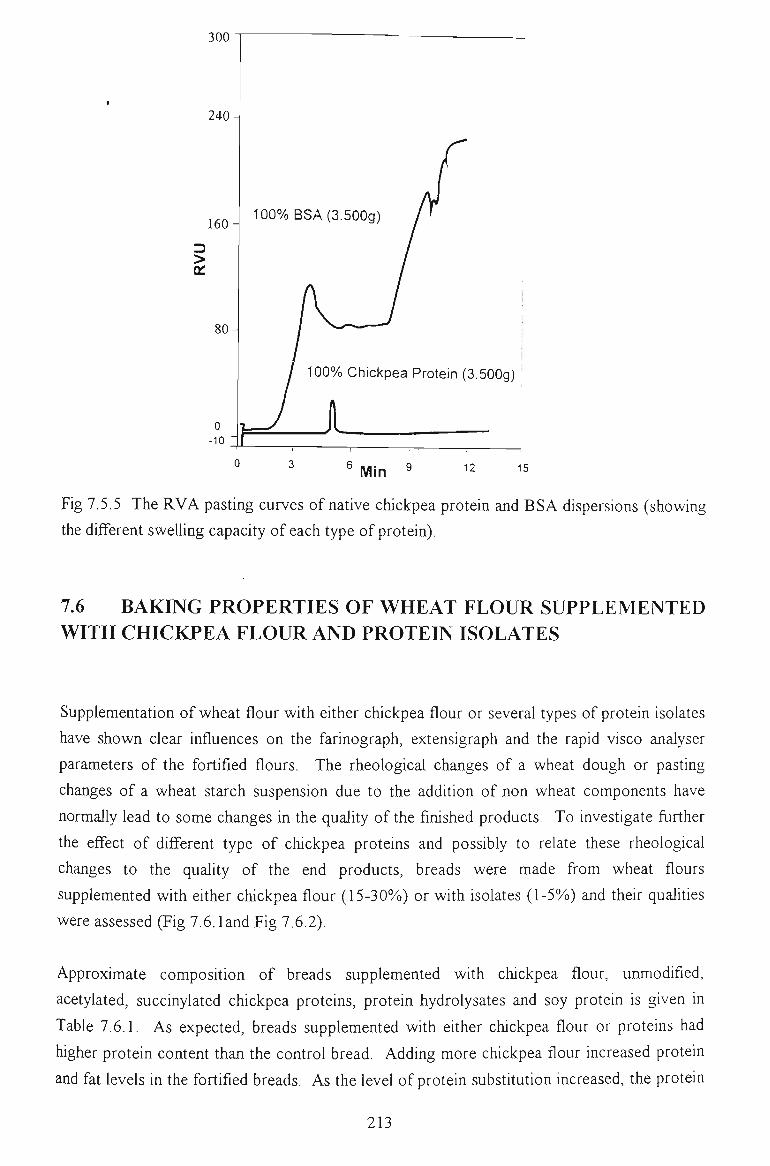
300
240-
160
3 > DC
80
100%) BSA(3.500g)
0 -10
100% Chickpea Protein (3.500g)
J Min 12 15
Fig 7.5.5 The RVA pasting curves of native chickpea protein and BSA dispersions (showing
the different swelling capacity of each type of protein).
7.6 BAKING PROPERTIES OF WHEAT FLOUR SUPPLEMENTED WITH CHICKPEA FLOUR AND PROTEIN ISOLATES
Supplementation of wheat flour with either chickpea flour or several types of protein isolates
have shown clear influences on the farinograph, extensigraph and the rapid visco analyser
parameters of the fortified flours. The rheological changes of a wheat dough or pasting
changes of a wheat starch suspension due to the addition of non wheat components have
normally lead to some changes in the quality of the fiiushed products. To investigate fiirther
the effect of different type of chickpea proteins and possibly to relate these rheological
changes to the quality of the end products, breads were made from wheat flours
supplemented with either chickpea flour (15-30%)) or with isolates (1-5%) and their qualUies
were assessed (Fig 7.6. land Fig 7.6.2).
Approximate composition of breads supplemented with chickpea flour, unmodified,
acetylated, succinylated chickpea proteins, protein hydrolysates and soy protein is given in
Table 7.6.1. As expected, breads supplemented with either chickpea flour or proteins had
higher protein content than the control bread. Adding more chickpea flour increased protein
and fat levels in the fortified breads. As the level of protein substUution increased, the protein
213
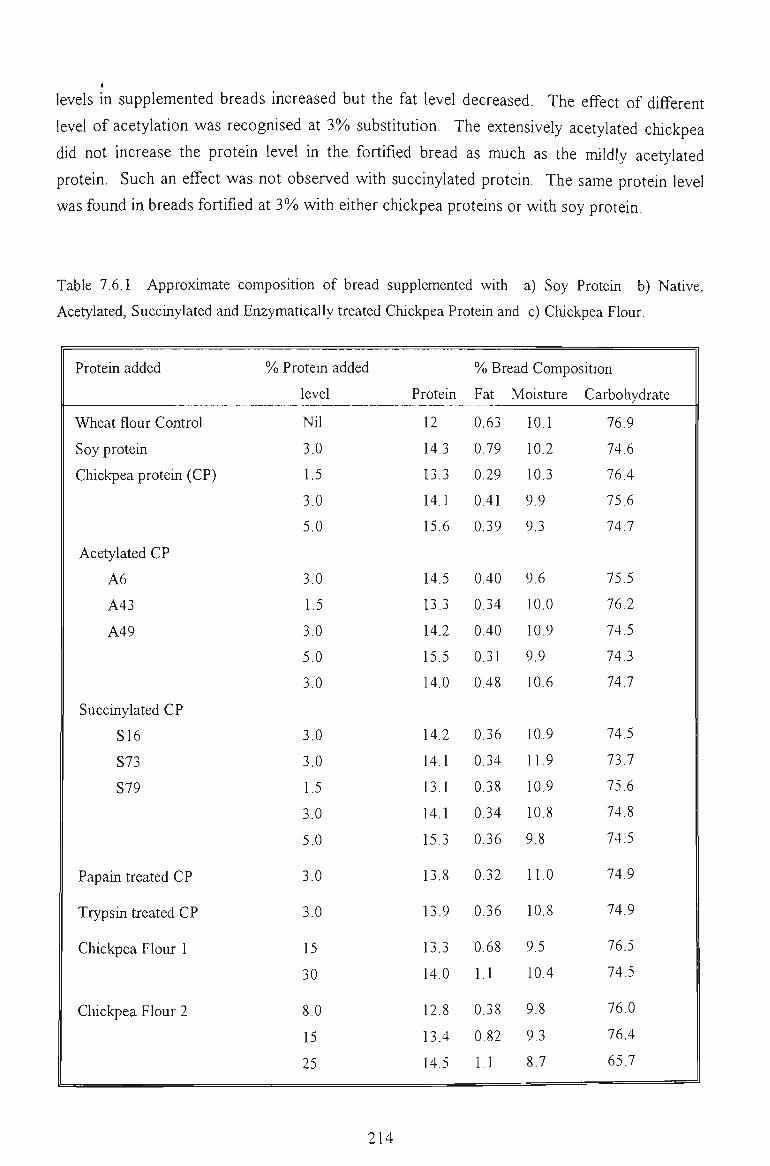
levels in supplemented breads increased but the fat level decreased. The effect of different
level of acetylation was recognised at 3% substitution. The extensively acetylated chickpea
did not increase the protein level in the fortified bread as much as the mildly acetylated
protein. Such an effect was not observed with succinylated protein. The same protein level
was found in breads fortified at 3%o with either chickpea proteins or with soy protein.
Table 7.6.1 Approximate composition of bread supplemented with a) Soy Protein b) Native,
Acetylated, Succinylated and Enzymatically treated Chickpea Protein and c) Chickpea Flour.
Protein added
Wheat flour Control
Soy protein
Chickpea protein (CP)
Acetylated CP
A6
A43
A49
Succinylated CP
S16
S73
S79
Papain treated CP
Trypsin treated CP
Chickpea Flour 1
Cluckpea Flour 2
% Protein added
level
Nil
3.0
1.5
3.0
5.0
3.0
1.5
3.0
5.0
3.0
3.0
3.0
1.5
3.0
5.0
3.0
3.0
15
30
8.0
15
25
Protein
12
14.3
13.3
14.1
15.6
14.5
13.3
14.2
15.5
14.0
14.2
14.1
13,1
14.1
15.3
13.8
13.9
13.3
14.0
12.8
13.4
14.5
% Bread Composition
Fat
0.63
0.79
0.29
0.41
0.39
0.40
0.34
0.40
0.31
0,48
0.36
0.34
0.38
0.34
0.36
0.32
0.36
0.68
1.1
0.38
082
1.1
Moisture
10.1
10.2
10.3
9.9
9.3
9.6
10.0
10.9
9.9
10.6
10.9
11.9
10.9
10.8
9.8
11.0
10.8
9.5
10.4
9.8
9,3
8.7
Carbohydrate
76.9
74.6
76.4
75.6
74.7
75.5
76,2
74,5
74,3
74,7
74,5
73.7
75.6
74.8
74.5
74.9
74.9
76.5
74.5
76.0
76.4
65.7
214
The incorporation of non wheat components at high levels in bread doughs can negatively
affect appearance, loaf volume and some qualities of the fortified breads. Loaf volume,
colour, strength and texture of crust and crumb of breads fortified with chickpea flour and
proteins were subjectively evaluated and also objectively measured (Table 7.6.2).
All breads made with fortified wheat flours had lower loaf volume than bread made with only
wheat flour. As the level of protein supplementation increased (1.5 to 5%), the loaf volume
of the corresponding fortified breads gradually decreased. Also, the loaf volume of breads
fortified at a given level gradually decreased as the level of acetylation (16 to 49%)) or
succinylation (19 to 79%) increased. Adding 3% native chickpea protein or protein
hydrolysed by trypsin or papain only reduced the loaf volume about 4%).
Depending on the level of acetylation and succinylation, at 3% substitution, loaf volume of
breads fortified with acylated proteins was reduced about 8 to 14% while at 3%)
supplementation, the loaf volume of soy fortified bread was reduced up to 12%o. The adverse
effect of chickpea flour on loaf volume of fortified breads was more pronounced. The loaf
volume was reduced by 12, 31 and 33%o at 8, 25 and 30%) substitution, respectively.
Reduction in loaf volume of breads fortified with non wheat flours or proteins has been
reported with soybean (Mathews et al, 1970), broad bean (Hussein et al, 1974), faba bean
(Finney et al, 1980), navy beans (D'Appolonia, 1977), Great Northern bean (Sathe et al,
1981) and lupin (Ballester et al, 1984). In a very few cases, an increase in loaf volume of
bread fortified with grain legume was observed. Sathe et al. (1981) found that adding 5% of
Great Northern bean protein to wheat flour increased the loaf volume about 8%). Adding the
same protein (5%)), but prepared by a different procedure, did not improve the loaf volume.
A reduction in loaf volume was normally attributed to a reduction in wheat gluten, by dilution
with the fortifying agent. As mentioned previously, the gluten is consists by monomeric
(gliadin) and by polymeric protein units (glutenin) which contribute to the viscous and elastic
properties of wheat dough. Due to the gluten, dough can stretch and rise as it holds the small
CO2 bubbles during the fermentation process and retains Us characteristic sponge texture
during the baking. With the intioduction of non wheat flour or proteins, the glutenous matrix
was reduced or modified, thus the formed dough lost its capacity to trap carbon dioxide
bubbles, leading to a hard and granular product (Schofield and Booth, 1983; Wrigley and
Bietz, 1988). The more gluten replaced by non wheat protein, the greater the loaf volume
reduction.
Reduction in loaf volume of the fortified breads was normally attributed to the loss of some
gluten in wheat flour. The volume differences found in this work, when supplemented at the
215
same concentration with different types of proteins found in this Uivestigation, suggested
other factors could also influence the volume of fortified breads. An aspect which needs
examination is the change in the ratio of maximum resistance to the extensibility (Rm/E). At
4% supplementation with either native chickpea or soy protein, the Rm/E ratio of the fortified
flours increased to a similar level (30.1 and 29.6 BU/cm, respectively). As the level of
acetylated and succinylated protein supplementation increased (1%) to 4%), a striking increase
in the Rm/E ratio of fortified wheat flour was observed. While Rm/E of whole wheat flour
was only 25.1 BU/cm, adding only 1%) of acetylated chickpea protein (ACP49) increased the
ratio of the fortified flour to 30.6 BU/cm. When the level of substituted acetylated protein
increased to 4%, the ratio increased to 39.5 BU/cm. Replacing wheat flour with 4%o
succinylated protein (SCP79) strikingly increased the ratio of the fortified flour to 76 BU/cm.
Adding non wheat proteins changed the balance of viscous and elastic portion of wheat flour.
Consequently, loaf volume of breads fortified with either acetylated or succinylated protein
was gradually reduced with an accompanying increase in Rm/E ratio.
The change in the viscoelastic ratio of fortified flours also influenced some physical qualities
of their corresponding breads. Compared with the wheat bread, crust and crumb of aU
fortified breads were harder. The assessment was based on the force (Newton) required to
press a whole slice (crust) or the centre of a sUce of bread (crumb) to a final depth of 4mm. It
is difficult to define precisely which properties (elastic or viscous) had a more pronounced
effect on the hardness of the fortified breads. Wheat flours fortified with 4% acetylated and
succinylated chickpea proteins had similar dough strength (extensigraph area: 109 and 110
cm , respectively) but different elastic (Rm) and viscous (E) properties. Dough fortified with
succinylated chickpea protein was more elastic and less viscous than that fortified with
acetylated protein. The extensibility of the former was reduced from 17.5 to 10.8 cm while
Us maximum resistance increased from 440 BU to 820 BU. Crust and crumb of the dough
fortified with succinylated chickpea protein was softer than that of the bread fortified with
acetylated proteins. Therefore, besides the viscoelastic ratio, the solubility or water
absorption capacity of the supplemented protein may have some influence on the hardness of
fortified bread.
Replacing wheat flour with soy or chickpea proteins influenced the fortified breads in terms of
loaf volume and textures. The influence depends on the type of protein used and the level of
supplementation. Native chickpea protein or enzymatic hydrolysates showed a very mild
effect on the quality of their fortified breads and compared favourably with soy protein as a
source of protein enrichment for bakery products. The different changes in farinograph,
extensigraph and the RVA measurements of wheat flours supplemented with acetylated and
succinylated proteins, together with their fimctional effects on bread quality, provided a useful
means of investigating the rheological properties of wheat flour dough.
216
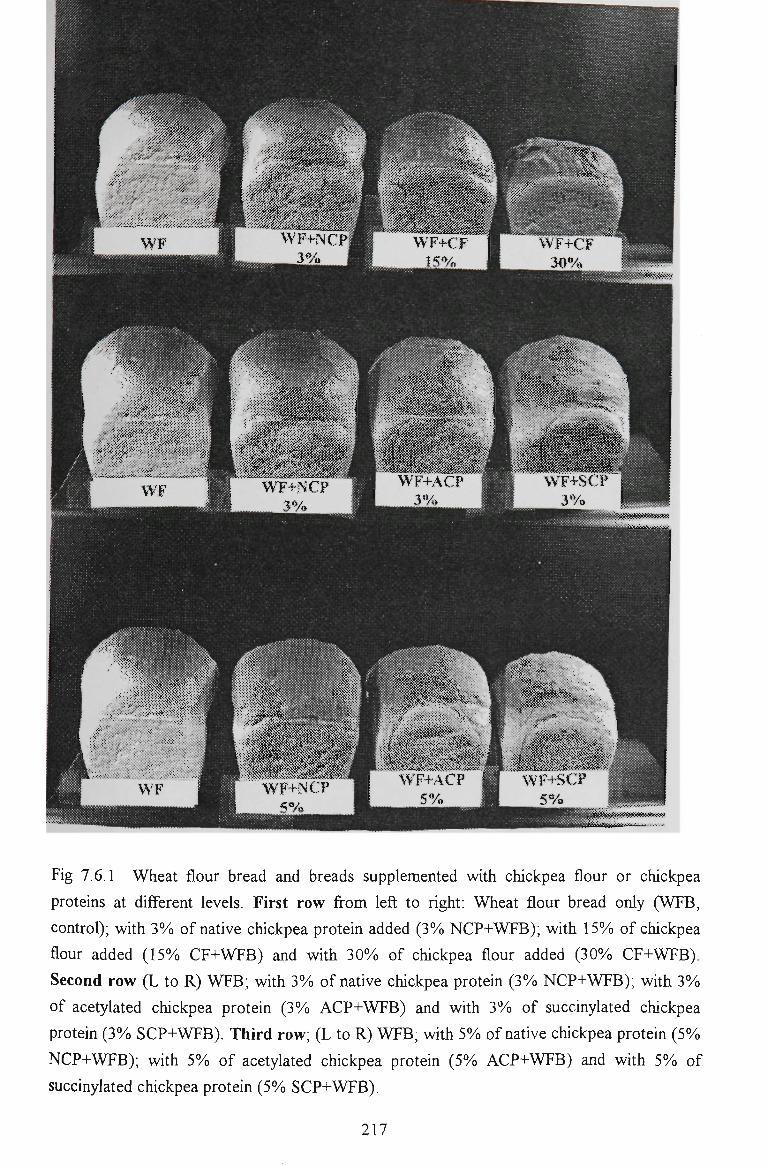
Fig 7.6.1 Wheat flour bread and breads supplemented with chickpea flour or chickpea
proteins at different levels. First row from left to right: Wheat flour bread only (WFB,
control); wUh 3%) of native chickpea protein added (3% NCP+WFB); with 15% of chickpea
flour added (15% CF+WFB) and with 30% of chickpea flour added (30% CF+WFB).
Second row (L to R) WFB; with 3% of native chickpea protein (3% NCP+WFB); wUh 3%
of acetylated chickpea protein (3%o ACP+WFB) and wUh 3%) of succinylated chickpea
protein (3%o SCP+WFB). Third row; (L to R) WFB, with 5% of native chickpea protein (5%
NCP+WFB); with 5% of acetylated chickpea protein (5% ACP+WFB) and with 5% of
succinylated chickpea protein (5% SCP+WFB).
217
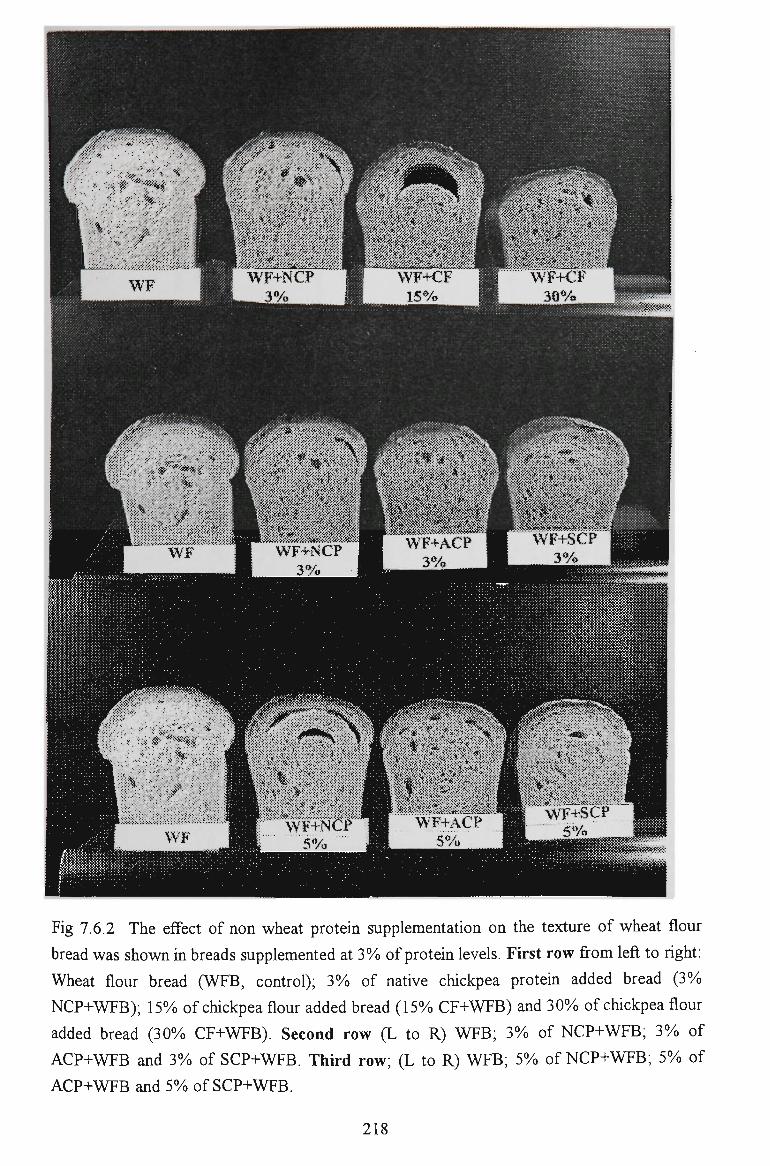
Fig 7.6.2 The effect of non wheat protein supplementation on the texture of wheat flour
bread was shown in breads supplemented at 3%> of protein levels. First row from left to right:
Wheat flour bread (WFB, control); 3% of native chickpea protein added bread (3%
NCP+WFB); 15% of chickpea flour added bread (15% CF+WFB) and 30% of chickpea flour
added bread (30% CF+WFB). Second row (L to R) WFB; 3% of NCP+WFB; 3% of
ACP+WFB and 3% of SCP+WFB. Third row; (L to R) WFB; 5% of NCP+WFB; 5% of
ACP+WFB and 5% of SCP+WFB.
218
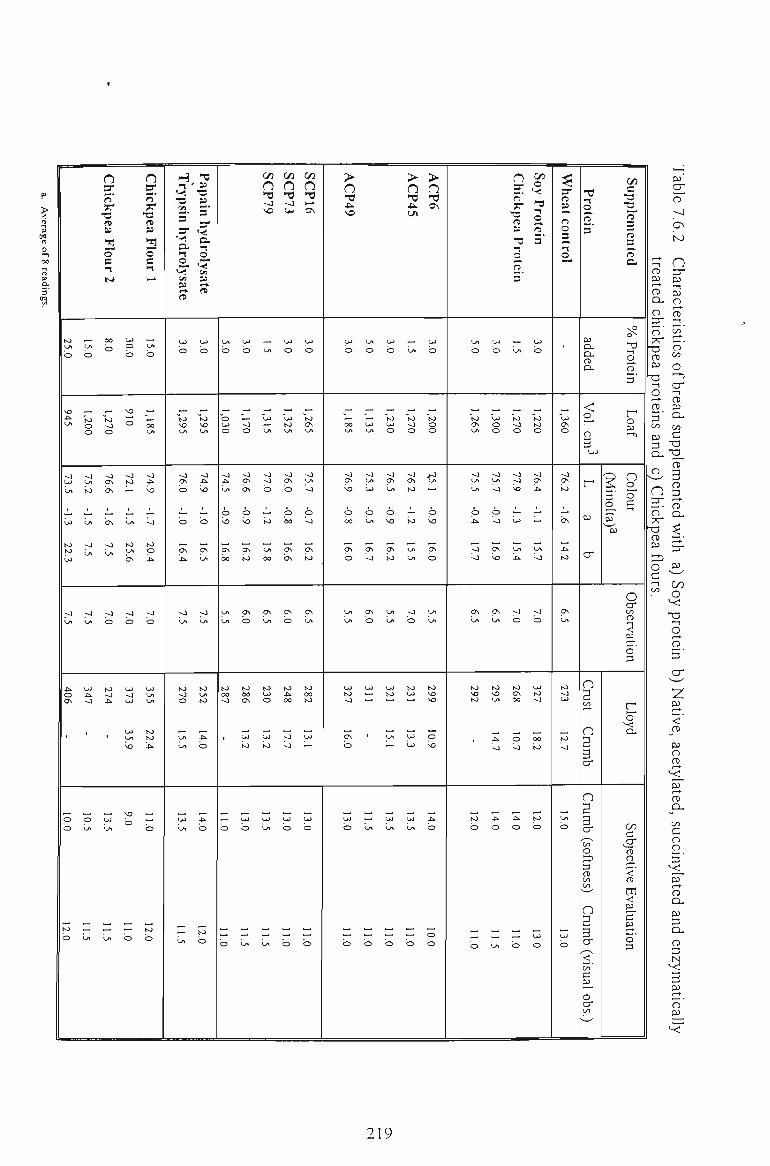
f
erage
0
•- 00
n
» Cu
sSu]
(O L/1
b
Uy
^ OJ
l/>
>L U
to
UJ
<i Ut
4: O OS
1
o b
S)
b
••-lo^
— b
V) o o
^ u» to
^ Ln
7,5
;-j tyi
UJ
. •J
^
o Lrt
Lrt
o hickp
n
3 o* 3 •1 N>
00
b
V) ^ o
^ OS
cr>
^ bs
7.5
>j
b
to M *.
'
UJ
lyl
Ol
30.0
O
-4 fO i—t
1 ^
LA
to t-A
e\
-J b
UJ --J U)
OJ t-A
o
9.0
b
n hickp ea
F
o 3 H^
15.0
00 UI
^ J^
vo
^ ^
to p :;>.
^ b
UJ Ul u»
SJ to 4:-.
b
to b
H *0 ^ - B5
13 M 2. s I hyd
"1 oly
V3
w ^ rtl
UJ
b
SJ vo Ul
^ CT\
b
^ b
ov ji.
-J
u>
SJ ~J o
^ Ul Ul
UJ
Ul
.— Ul
hyd
•^ o "7 u !-*•
fB
u> b
to vo Ul
-J .b vo
^ b
ov Ul
;-J Ul
to Ul lO
-4 b
*. b
12,0
Ul
b
o UJ o
^ ^ Ul
o vo
CT\
00
Ul Ul
to 00
^
1
b
„ 1.0
U)
b
^ o
o cv bv
b vo
CT\
to
ov b
to 00 CA
„ UJ
io
UJ
b
_
1.5
1 SCP79
— LA
UJ
>—• Ly»
-J
^ b
<l^ io
Ol
bo
OS LA
to U) O
^ UJ
io
UJ
LA
_
1.5
1 SCP73
UJ
b
UJ to Ul
^ ov b
p bo
ov bv
Ov b
to .c 00
.-. o '~~1
UJ
b
_ 1.0
SC
P16
UJ
b
to ov Ul
o Ul
'~J
o -4
Ov
io
ov Ul
to 00 IO
_ UJ
^
UJ
b
„ 1.0
> CP
49
UJ
b
00 Ul
~J Ov
vo
p bo
ov b
Ul Ul
UJ
to ^
» ov b
UJ
b
„ 1.0
LA
b
UJ LA
-J LA UJ
o LA
a\ '<i
a\ b
UJ •—•
H —
'
LA
„ 1.0
UJ
b
to UJ o
^ ON
LA
O 'O
OS
io
LA LA
UJ to
'—'
^ LA
—
UJ
LA
„ 1.0
> CP
45 —' Ul
to ~J o
^ Ov to
- (O
Ul Ui
<1
b
to UJ
^
» UJ UJ
UJ Ul
_ b
> CP6
UJ
b
to o o
jO Ul
^
b vo
ov b
Ul Ul
to vo VO
^ o vo
.t
b
_ 0.0 Ul
b
to ov Ul
•~J Ul Ul
b ii.
^ ^
ov Ul
to vo SJ
1
to
b
1,0
UJ
b
UJ o o
• ^
Ul •~J
b •o
Ov VO
OV 'Vl
to vo Ul
.c ^
i>.
b
1.5
Q
-3
^ lei
3
— Ul
to ^ o
~J -J
vo
^ UJ
Ul
:«>.
;-0
b
to ov 00
^ o '
*. b
1,0
Soy Pro itcin
UJ
b
to to o
^ ov •,tv
^ --
Ul
-0
^ b
UJ
to ^
_ 00 to
to
b
3,0
Wheat 1 cont
"1
o
UJ Ov o
^ ov io
• bv
.u io
ov Ul
(O
^ UJ
to -J
Ul
b
3,0
Protein
adde
a.
<
o 3 LO
r
(U
a*
Crast
o a 3 cy
o ramb
Crt
o :=s a a> 00 Crt
n
quia
i
<i w 3 W 1 — •
o a" on
Supple m
en
n s.
Prot cin L
oaf
^ § 3 2 o S 1—1 •"!
S' ~~M
o o* serva
o 3
r oyd
J-a> Cl
<' n
^ £L cu ion
H
ft)
C^
n
a. o _ < - > •
o' ^ ' o
ca o •O ^ -t o -
Cl . ^
3 /-v ^
- • (D O G .
o ^ c ^-'^ ^ o
><:
O r-f.
2. 5' 'Z <'
JTD
P O n)
P r-t-
CO
on c o o 5'
"^ p m o-p 3 D-a
3 p o' p
219
CHAPTER 8
SUMMARY OF RESULTS AND CONCLUSIONS
SUMMARY OF RESULTS AND CONCLUSIONS
The potential applications of chickpea proteins {Cicer arietinum L. cv Kaniva) as food
ingredients have been investigated and reported in thj ee major parts.
The first part was to identify different extraction conditions and their effects on the extraction
yield and characteristics of the resulting proteins. The second part was to define the
functional properties of these isolated proteins and relevant factors affecting their behaviour.
The third part was to investigate the effects of chemical and to some extent enzymatic
modifications on the functional properties of the modified proteins, particularly their flow and
rheological properties in wheat flour dough systems.
Chickpea protein extractabilities were substantially similar to those of other grain legumes
and oil seeds, being basically pH dependent. More proteins were extracted at alkahne pHs
(>8) or at acidic pHs (<3) and the extracted proteins could be precipitated at about pH 4.
Several factors affecting the extraction yield were investigated. Since the extraction involved
is normally multifactorial, the combined effect of two or more factors was examined. The
result of forty eight combinations were analysed with a fractional analysis of variance. For
the main effects investigated, extraction pH and particle size of the grits were the most
statistically significant factors. The highest yield was obtained at pH>9 or pH<3. When the
particle size was reduced from 26 to 52 mesh, yield could be increased up to 50%o, firom 37%
to 73%). There was no significant advantage in increasing the extraction time to more than 45
minutes in a single extraction process or extracting the protein at low (15°C) or high (35°C)
temperature. Salt solution did not improve the extraction yield compared to the use of
aqueous solutions.
To confirm the concepts developed in the laboratory, several pilot scale extractions (500 kg)
were conducted with commercial equipment and many aspects of the isolated proteins were
further investigated.
Extraction at different conditions would not only give different extraction yields but also
different type of proteins. Gel filtration patterns, electrophoretic and densitometric analysis,
and enzymatic in vitro digestion studies indicated that water extracted proteins (CPI-2) are
characteristically more similar to those extracted at alkaline pH (CPI-3) than proteins
extracted at acidic pH (CPI-1).
221
Another result of the present study suggested that the relative amount of albumin and
globulin in chickpea depend on extraction conditions. Their extractable yields varied with
extraction medium and also with different variety. Depending on the procedure employed,
albumin could be a major protein fraction. This result casts doubt on the perception that the
albumin fraction of chickpea only accounted for a minor proportion of the total proteins.
Fractionation with K2SO4 solutions produced highly purified albumins. The structural
differences of Kabuli and Desi chickpea albumins and globulins could be identified by their
corresponding distinct electrophoretic patterns as the albumins were comprised of subunits
with high molecular weight and globulin comprised of subunits with low molecular weight.
The level of essential amino acids in albumin is always found to be higher than that of
globulin. Regardless of the structural similarity found among globulins prepared under
different conditions, the effect of processing conditions on some of their functionality could
be detected by their in vitro digestibility.
The second part was to examine the functional properties of the extracted proteins. Chickpea
proteins extracted at pH 2, pH 7 and pH 9 exhibited different functional properties. Like soy
protein, CPI-3 showed a characteristic shaped V nitrogen soluble index at the isoelectric
point region (pH 4.4-4.8), while those of CPI-1 and CPI-2 were broader. CPI-3, CPI-2 were
more soluble than CPI-1, over a range of pH 2-10. At certain pHs they were more soluble
than soy protein isolate (SPI).
CPI-3 and CPI-2 also absorbed more oil and water than CPI-1. Emulsion capacity (EC) of
three chickpea protein isolates increased with increasing protein concentration and showed a
good relationship between their solubility and EC. Their pH/EC curves resembled those of
their pH/solubility.
Thermal effect on EC of CPI-3 and CPI-2 was greater than that of CPI-1, indicating that
CPI-3 and CPI-2 were more sensitive to heat treatment than CPI-1. Depend on the
concentration, salt could decrease or increase the EC of CPI-1, CPI-3 and SPI. The salt
effect was less with ES of CPI-2. All emulsions were stable at pH 9 and EC of CPI-3 was
more stable than that of SPI at pH 9. With salt addition, all chickpea protein isolates were
less stable than soy protein isolate. Foaming capacity (FC) of all chickpea protein isolates,
particularly, CPI-3 was higher than that of soy protein isolate. The difference in these
fiinctional properties reflected the difference in their composition and structures .
Solubility is an important functional property of all food proteins. To examine the protein
solubility, the Kjeldahl procedure is widely used to determine the nitrogen in extracts of the
protein but this chemical procedure is still a time consuming and rather laborious assay.
Infrared spectroscopy provided a quick, non-destructive and easy to perform alternative
222
procedure. When protein contents in an aqueous solution are measured there is a significant
difference between the values obtained by the Milkoscan, an infrared spectrometer and the
Kjeldahl procedure at certain pHs. The Milkoscan, however, could still provide a rapid
approach to obtain the solubility of different grain legume proteins over pH 7 - pH 9, a most
practical range in food applications. A correction factor derived from each grain family needs
to be introduced to compensate the Milkoscan readings at low and high pHs (pH<3 and
pH>9). The different response of the three chickpea protein isolates toward infi-ared
measurement reflected their different amino acid composition and also conformation, due to
the effects of different extraction conditions.
The third part was to investigate the effect of protein modifications on their functional and
rheological properties. To investigate the effects of modification on their functional
properties, chickpea proteins were acylated by succinic and acetic anhydride and also partly
hydrolysed by papain and trypsin. For acylation, the levels of modification varied with the
type of reagent, its concentration and also with different types of proteins involved in the
system. The lysines were slightly reduced but the proportion of essential amino acids of
acylated proteins was unchanged and still met the required level for children and adults.
Acylation did not alter significantly the gel filtration profile of the modified proteins but the
SDS-PAGE patterns showed their electrophoretic mobility was retarded. Densitometric
scanning of SDS-PAGE confirmed that some structural changes occurred in chickpea
proteins due to protein aggregations. Acetylation improved the in vitro digestibility of the
modified proteins by papain, pepsin and chymotrypsin while succinylation only improved the
protein hydrolysate produced by pepsin digestion.
Acetylafion improved solubility of chickpea proteins at high alkaline pHs and also their water
and oil absorption capacities. The emulsion capacity of acetylated chickpea proteins was
higher than that of the native protein but these emulsions were less stable than those of
unmodified chickpea proteins. Compared with the unmodified proteins, succinylated proteins
were more soluble at pHs above its pi and less soluble at pHs below its pl (pH 4.8). Dilute
salt solutions (0.2M NaCl) depressed the solubility of all succinylated proteins and shifted its
pi to pH 4.0. Succinylation greatly increased their water and oil absorption compared with
unmodified and acetylated proteins. Similarly, succinylation per se also greatly improved
their emulsifying capacities and stabilities. The extent of succinylation showed very moderate
influence on these properties.
Flow properties and the relevant factors affecting the behaviours of aqueous unmodified,
acetylated and succinylated chickpea protein dispersions were investigated. These flow
characteristics were considerably influenced by a number of factors but they exhibited some
common features.
223
At low protein concentrations (<4% by weight), chickpea protein dispersions possessed
Nev^onian flow behaviour. At high concentrations (>8%)), non-Newtonian flow behaviour
became more pronounced with increasing concentration. The non Newtonian behaviour as
one moved from unmodified to acetylated and succinylated proteins.
The effect of salt addition on the flow behaviour varied with salt concentration, type of
proteins and also with different levels of acylation. The Newtonian flow behaviour of
unmodified chickpea protein dispersions remained intact only in a dilute salt solution (0.2M
NaCl). The flow behaviour index of the unmodified protein decreased with salt
concentrations up to 1 M then increased. Those of succinylated proteins increased
proportionally with increasing salt concentrations. The effect of salt addition on the flow
behaviour index of acetylated proteins varied greatly with the level of acetylation. The
remarkable effect of salt addition, even at a very low concentration (0.2M) on the consistency
coefficient (m), Casson yield stress and apparent viscosities of the acylated proteins reflected
the structural changes due to the chemical modification.
The effect of dissolving pHs reflected a correlation between protein solubilities and the
apparent viscosities. Thermal effects on the flow properties of the protein dispersions varied
with different types of proteins and the levels of acylation. For unmodified proteins, the
effects of thermal treatments were demonstrated at 55°C. For acetylated proteins, the flow
index of each protein dispersion was affected differently by a similar thermal treatment.
Apparent viscosities of unmodified protein dispersions increased but those of all acetylated
protein dispersions decreased with increasing temperature. The apparent viscosities of
succinylated proteins increased at 55°C. A correlation equation to illustrate the effect of
temperature on the apparent viscosities and degrees of succinylation was suggested .
Chemical modifications by acetylation and succinylation greatly influenced many aspects of
the flow properties of the modified chickpea proteins. The effects varied with the type of
acylating reagents and the levels of acylation.
Wheat flour doughs supplemented with chickpea proteins were to examine the behaviour of
chickpea proteins as food ingredients in a food system . This also allowed an evaluation of
the effects of chemical and enzymatic modifications on the protein's functional and rheological
properties. The different changes in farinograph, extensigraph and the RVA measurements of
wheat flours, supplemented with acetylated and succinylated proteins, together with their
effects on bread quality, provided a useful means to investigate the rheological properties of
wheat flour dough. Replacing wheat flour with soy or chickpea proteins influenced the
fortified breads in terms of loaf volume and textures. The influence depends on the type of
protein used and the level of supplementation. Native chickpea protein or enzymatic
224
hydrolysates showed a very mild effect on the quality of their fortified breads and can be
compared favourably with soy protein as a source of protein enrichment for bakery products.
225
CHAPTER 9
EXPERIMENTAL METHOD
EXPERIMENTAL METHOD
9.1 WATER ABSORPTION AND PROTEIN EXTRACTION PROCEDURE - LABORATORY SCALE
9.1.1 MATERL^L AND METHODS OF ANALYSIS
9.1.1.1 Material
a. Seed
Seven chickpea {Cicer arietinum) and three field pea {Pisum sativum) cultivars were studied
for water absorption characteristics. All chickpeas, consisting of three Desi (small grain)
cultivars (Tyson, Dooen and Amethyst), three Kabuli (large grain) cultivars (Kaniva,
Macareena and Garnet) and a cultivar intermediate between Desi and Kabuli (Semsen) were
grown in Kaniva, Victoria, Australia. Three cultivars of field pea (Dun, Dundale and
Progretta) were grown in Dooen, Victoria. The chemical composition and seed size of these
varieties are given in Table 3.1.1 (p.42 ).
b. Defatted flour
For protein extraction, the seed of the popular Kaniva was selected for investigation.
Certified seeds of chickpea {Cicer. aritenium. cv Kaniva) grown in 1990 were ground in a
laboratory mill (3303). The chickpea flour was classified to pass through a 26 mesh (600pm)
and 52 mesh (300^m) screen and be retained on a 100 mesh (150nm) screen, which enables
them to be collected separately. Chickpea flours with two different particle sizes (150-300pm
and 300-600|_im) were defatted by extractions with hexane (flour, solvent :1, 10[w/v] twice)
and then air dried (24 hr) at room temperature (25°). The defatted flours were stored in a
cool room (4°C) while awaiting further extraction. The defatted flour contains less than 1%
fat.
9.1.1.2 Method of Analysis
The protein content was determined in duplicates of 0.2g of (<300|Lim and 300-600pm)
chickpea flour and defatted chickpea flours, measured by LECO (FP-228, U.S.A), and
227
calculated as % N x 6.25. Analysis in dupUcates of fat (Soxhlet extraction), ash and moisture
were carried out in the chickpea meal, following the standard method (AGAC 1960).
Carbohydrates were calculated by difference. The size of each seed variety was determined by
the number of seeds counted from 50 g of dried seed sample.
9.1.2 WATER ABSORPTION
9.1.2.1 Water absorption assay
For water absorption, seeds (10 g) of each cultivar were randomly chosen and placed in an
incubator for 30 min at 5, 15, 25 and 42°C before soaking in distilled water (75 mL) which
was preadjiisted to the soaking temperature. Preliminary experiments showed that some
cultivars of chickpea disintegrated after prolonged soaking at 42°C. Those cultivars were then
soaked at 25°C only. Also, field peas did not absorb notable amounts of water at 5°C and so
were studied at 15, 25 and 42°C.
Weight gains were measured after 2, 6, 12, 18 and 24 hour soaking by weighing soaked beans
after centrifijging at 1,500 g for 10 min. Initial moisture was determined by heating 5 g of
each freshly ground flour in a forced circulation drying oven at 105°C to constant weight (2
hours). All measurements were performed in duplicate.
9.1.2.2 Measurement of water absorption by the Peleg equation
The predicted water absorption was calculated using the following equation proposed by
Peleg:
M(t) = Mo +t / [Ki+K2t] [3.1]
where M(t) is the moisture content at time t.
Mo is the initial moisture content,
Ki, K2 are constants
and Meq = Mo + l/K2 [3-2]
where Meq is the equilibrium moisture content as t -> 00
Equation [1] can also be transformed to the linear relationship:
t/[M(t) - Mo] = Ki + Kat [3.3]
where 1/Ki is the initial rate of absorption.
The unit of Ki is hr/%) weight and that of K2 is the reciprocal of % weight.
228
A constant K3 was developed to describe the temperature effect on water absorption rate by
plotting Ki against temperature as illustrated in the following equation.
K,= K3T + K4 [3,4]
Using equation [3.4], a straight line with K4 as the ordinate intercept and K3 as the gradient
was obtained. The unit of K3 is hr/%) weight.
The fit of equation [3.3] to experimental data on water absorption of seven chickpea cultivars
was shown in Fig 3.1.1 (p.43). Peleg's constants Ki and K3, derived from the linear fit and
initial absorption rate (l/Ki) of these chickpea cultivars are tabulated in Table 3.1.2 (p.44).
Peleg's constant K2 and calculated equilibrium moisture content (Meq) are presented in Table
3.1.3 (p.45). Fig 3.1.2 showed the experimental and predicted water absorption
characteristics of two chickpea cultivars, Dooen and Macareena (p.46).
The effect of temperature on the Peleg's constant Ki of two types of chickpeas- Kabuli type
and Desi type was calculated by using equation [3.4]. The result is presented in Fig 3,1.3
(p.48). A correlation between the seed size of chickpeas and constant K3 was established (Fig
3.1.4) (p.48).
9.1.3 PROTEIN EXTRACTION
9.1.3.1 Protein Extractability Profile
Defatted chickpea flour (2g) of two different particle sizes was suspended in 50 ml of distilled
water (4%) suspension) in a 100 ml beaker under continuous agitation by a magnetic stirrer.
A series of pH extractions were carried out between pH 2-12 for one hour at constant
temperature (25°C). The extraction pHs were adjusted with O.IM and IM solution of NaOH
or HCI. The pH was continuously monitored to the second decimal place using a JENCO
EEL microcomputer pH-Vision 6071. The protein dispersions were then centrifiiged (20
minutes, 20°C, 7000 g) in a centrifiige (lEC centra-4R, England). The resulting supematants
were filtered under vacuum in a filter flask through a filter funnel (with a sintered disc of
grade 1). The filtrate samples were refrigerated at 4°C.
Processing of results was carried out for averages and standard deviations. The protein
content was measured by LECO and calculated as %oN x 6.25 and all samples were assayed in
229
duplicate. The result is given in Fig 3,2.1 as protein extraction curves against extraction pH
(p.50).
9.1.3.2 Factors affecting protein extraction yield
Factors that influence the protein extractability, such as extraction pH, particle size,
temperature, duration of extraction and solvents were investigated. The combined factors of
these parameters were examined with factorial design (2^ x 3) as shown in Table 3.2.1 (p.54).
A typical extraction is presented as follows.
Defatted flour (20g) with different particle sizes was suspended in 140 ml of extraction
medium (meal:solvent = 1:7) at different pHs. The suspension was stirred for 30, 45 and 90
minutes at 15°C, 35°C and 55°C. The pH adjustment, centrifiigation and filtration were
conducted as in Expt. 9.1.2.1. A total of 48 extractions according to the design were
conducted.
9.1.3.2.1 Effect of grit particle size and extraction pH
Chickpea seeds as described in 9.1.1.1 were ground in a laboratory mill to grits having the
following mesh numbers: 14, 26 and 52. The sieved grit samples were collected on the
corresponding mesh screens and used to extract the proteins at pH 2, pH 7 and pH 9
according to Expt. 1.1.2.2. The protein concentration was determined in duplicates of 0.2g
as described above. The results are given in Fig 3.2.2 a-c (p.52).
9.1.3.2.2 Effect of Temperature
The effect of temperature on the protein extractability was examined at three different
temperatures 15°C, 35°C and 55°C. The protein extraction was conducted at a constant
temperature for one hour in a water bath. Protein in the filtrate samples was determined
according to Expt. 9.1.2.1. Grits with three particle sizes (14, 26 and 52 mesh) were used to
exttact the proteins at 15°C and 35°C but only two grits (26 and 52 mesh) were exttacted at
50°C. The results are illustrated in Fig 3.2.3 a-b (p.53).
9.1.3.2.3 Effects of Extraction Time
The effect of the extraction time was examined by extracting the protein at two different sets
of extraction duration. Grits with a particle size of 52 mesh were extracted over 30, 45 and
90 minutes at pH 2, pH 7 and pH 9 over a range of temperatures 15°C and 35°C. Grits of a
particle size of 26 mesh. The results are shown in Fig 3.2.4 a-d (p.54).
230
9.1.3.2.4 Effects of Extraction Medium
The effects of the extraction medium on the extraction yield of proteins were investigated by
extracting the protein with O.IM NaCl solutions under different conditions. Grits of two
particle sizes (26 and 52 mesh) were used to extract the proteins according to the methods of
Expt. 9.1.2.1 at three pHs (pH 2, pH 7 and pH 9) and two temperatures (15°C and 35°C).
The results are shown in Fig 3.2.5 a-b (p.55).
A total of 48 extractions, based on the major factors which could affect the extraction yield
were conducted and the results are tabulated in Table 3.2.2 (p.58).
9.2 PROTEIN ISOLATION
Based on the results gained from the study on the protein extractability of chickpea grits as
described previously, a procedure for the isolation of these proteins was developed. This
procedure is mainly aimed at producing different types of proteins which would be used for
further investigation of the effects of processing conditions on the characteristics and
functional properties of these proteins. Only limited efforts were devoted to improving or
optimising the extraction or isolation yield.
9.2.1 ISOLATION OF CHICKPEA PROTEINS EXTRACTED AT ACIDIC,
NEUTRAL AND ALKALINE pH
The isolation of chickpea protein in laboratory scale experiments consisted of four main steps,
involving protein extraction, precipitation, purification and drying. Raw materials used for
protein isolation were supplied according to details given in Expt. 9.1.1.1, Sample for
analysis were taken during the protein isolation according to recommended procedures in
Expt.9.1.3.1. Description of the main steps involved in protein isolation is now presented as
follows:
9.2.1.1 Extraction
Chickpea defatted meal (1 kg) was extracted with tap water (5:1 = water:soUd) under
constant stirring by a stirrer. Protein extractions were carried out at alkaline (pH 9), neutral
(pH 7) or acidic (pH 2) conditions using double extraction steps at the same pHs. The protein
extraction pH was conducted at a constant pH for one hour at room temperature (25°C) by
231
using I N and 3N of NaOH and HCI. The resulted slurry was centrifiiged (3,500 g, 20 min.,
15°C) by using 750 ml centrifuge bottles of a cool spin LP-784 (MES) centrifuge to yield a
residue and a supernatant. The residue was then extracted further with water (1:1.5 =
solid:water [w/v]) for 30 minutes and separated as previously described. The combined
supernatant was vacuum filtered to form a soluble protein fraction or filtrate sample.
9.2.1.2 Precipitation
The supernatant contained the soluble protein from the extraction step at alkaline (pH 9), acid
(pH 2) or neutral (pH 7) conditions. The extract was adjusted to the isoelectric point (pH
4.6-5) with 3M NaOH or HCI, kept for 30 min to yield a curd or precipitate after centrifliging
(9,500^, 20 min., 4°C).
9.2.1.3 Purification
The protein curd from the protein precipitation step was subjected to three washings (10:1=
water:solid) using distilled water, pH adjusted to the protein isoelectric point (pH 4.6-4.8)
with subsequent centrifliging (9,000 g, 20 min., 15°C) to yield finally the purified protein
curd.
9.2.1.4 Drying
The protein curd from the protein purification step was freeze dried (Freezer Drier DynaVac,
Model FD-5, Australia) to yield the protein isolate which was ground in a coffee grinder and
kept for further tests.
The final yields of proteins extracted at pH 2 (CPI-1), pH 7 (CPI-2) and pH 9 (CPI-3) were
66.8, 54.8 and 73.7 %, respectively (Table 3.2 1). The purity of these proteins was over 91%
These three protein isolates were further characterised.
9.2.2 ALBUMIN AND GLOBULIN EXTRACTION
9.2.2.1 Material
Defatted chickpea flours from the seeds of three varieties (Dooen, Kaniva and Garnet) were
prepared as described in 9.1.1.1. These seeds were collected from Horsham, Victoria in
1992. The three following methods were employed to extract and fractionate chickpea
proteins into albumin and globuhn fractions.
232
The fractionation of chickpea proteins to albumin and globuhn fractions was also extended to
four more varieties (Tyson, Amethyst, Semsen and Macareena) of two major chickpea
groups.
9.2.2.2 Albumin and Globulin Fractionation
Method 1
This procedure was suggested by Bhatty (1982) and used in this investigation with some
minor modifications. The slurries were extracted twice and the extraction duration was
longer than 45 minutes. Defatted flour (150-600|im) (5g) was stirred for 1 hour at 5°C in a
5% K2SO4 buffer of pH 7.1 (100 ml). The resulting slurry was centrifiiged at 12,000 g, 20
min. and the supernatant was collected. The residue was extracted again with 80 ml of the
same solution for 20 min. at 5°C and centrifiiged as above. The combined supematants were
dialysed at 4°C for 48 hours against three changes of deionised water, then centrifiiged at
13,000 g for 20 min. to give a supernatant fraction (albumin) and a precipitated fraction
(globulin). These dialysed fractions were freeze dried and the resulted proteins were used to
further characterise each corresponding protein.
Method 2
Singh et al (1980) used this procedure to extract chickpea and other grain legume albumins.
Like Method 1, the extraction was conducted twice and longer than 45 minutes. Defatted
flour (150-600 |im) (5g) was extracted at 5°C with K2HPO4 buffer, adjusted at pH 7.1 and
containing 0.5M NaCl (100 ml). The residue was extracted with a further 80 ml buffer for 20
minutes. The following steps for separation and purification of albumin and globulin were
carried out as Method 1.
Method 3
Defatted flour (150-600|^m) was extracted twice with distilled water (100 ml and, then, with
80 ml). All the steps were followed Method 1.
The experiments were initially conducted at a small scale (5-lOg of defatted flours) then, were
also conducted at a larger scale (lOOg of defatted flours). The overall results were tabulated
in Table 3.4.1 (p.70).
233
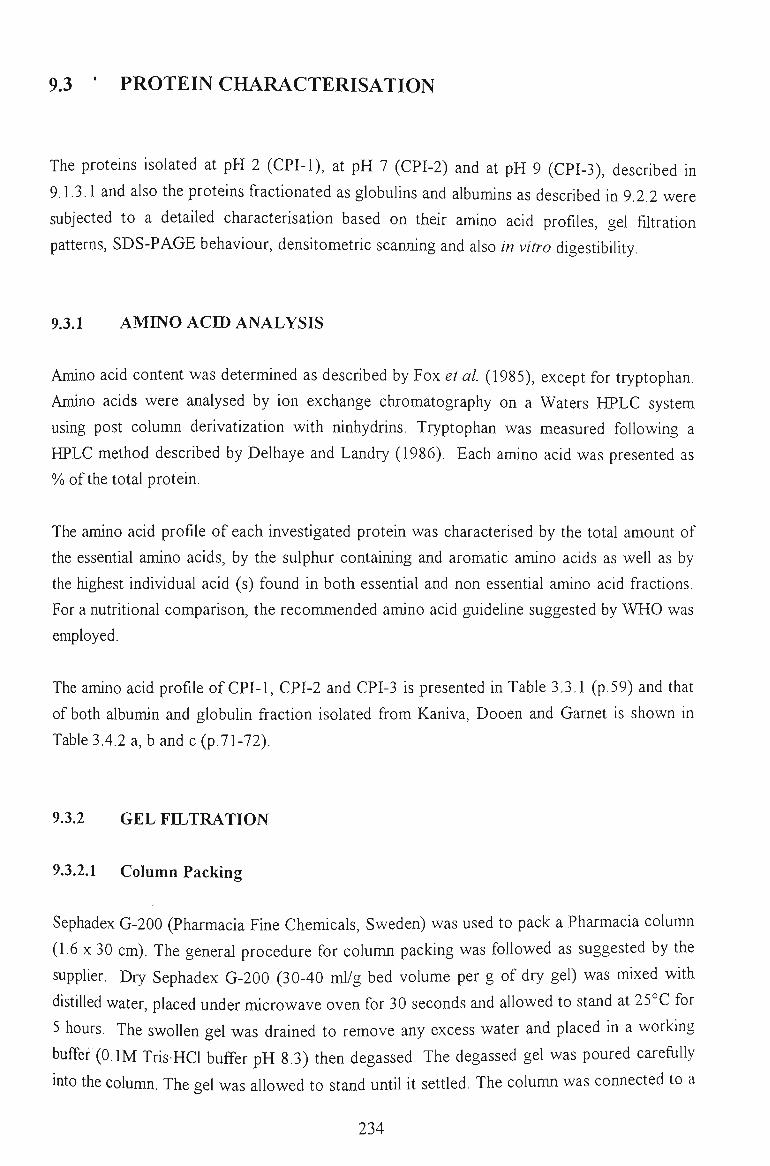
9.3 • PROTEIN CHARACTERISATION
The proteins isolated at pH 2 (CPI-1), at pH 7 (CPI-2) and at pH 9 (CPI-3), described in
9.1.3.1 and also the proteins fractionated as globulins and albumins as described in 9.2.2 were
subjected to a detailed characterisation based on their amino acid profiles, gel filtration
patterns, SDS-PAGE behaviour, densitometric scanning and also in vitro digestibility.
9.3.1 AMINO ACH) ANALYSIS
Amino acid content was determined as described by Fox et al (1985), except for tryptophan.
Amino acids were analysed by ion exchange chromatography on a Waters HPLC system
using post column derivatization with ninhydrins. Tryptophan was measured following a
HPLC method described by Delhaye and Landry (1986). Each amino acid was presented as
% of the total protein.
The amino acid profile of each investigated protein was characterised by the total amount of
the essential amino acids, by the sulphur containing and aromatic amino acids as well as by
the highest individual acid (s) found in both essential and non essential amino acid fractions.
For a nutritional comparison, the recommended amino acid guidehne suggested by WHO was
employed.
The amino acid profile of CPI-1, CPI-2 and CPI-3 is presented in Table 3.3.1 (p.59) and that
of both albumin and globuhn fraction isolated from Kaniva, Dooen and Garnet is shown in
Table 3.4.2 a, band c(p.71-72).
9.3.2 GEL FILTRATION
9.3.2.1 Column Packing
Sephadex G-200 (Pharmacia Fine Chemicals, Sweden) was used to pack a Pharmacia column
(1.6 X 30 cm). The general procedure for column packing was followed as suggested by the
supplier. Dry Sephadex G-200 (30-40 ml/g bed volume per g of dry gel) was mixed with
distilled water, placed under microwave oven for 30 seconds and allowed to stand at 25°C for
5 hours. The swollen gel was drained to remove any excess water and placed in a working
buffer (O.IM TrisHCl buffer pH 8.3) then degassed. The degassed gel was poured carefiiUy
into the column. The gel was allowed to stand until it settied. The column was connected to a
234
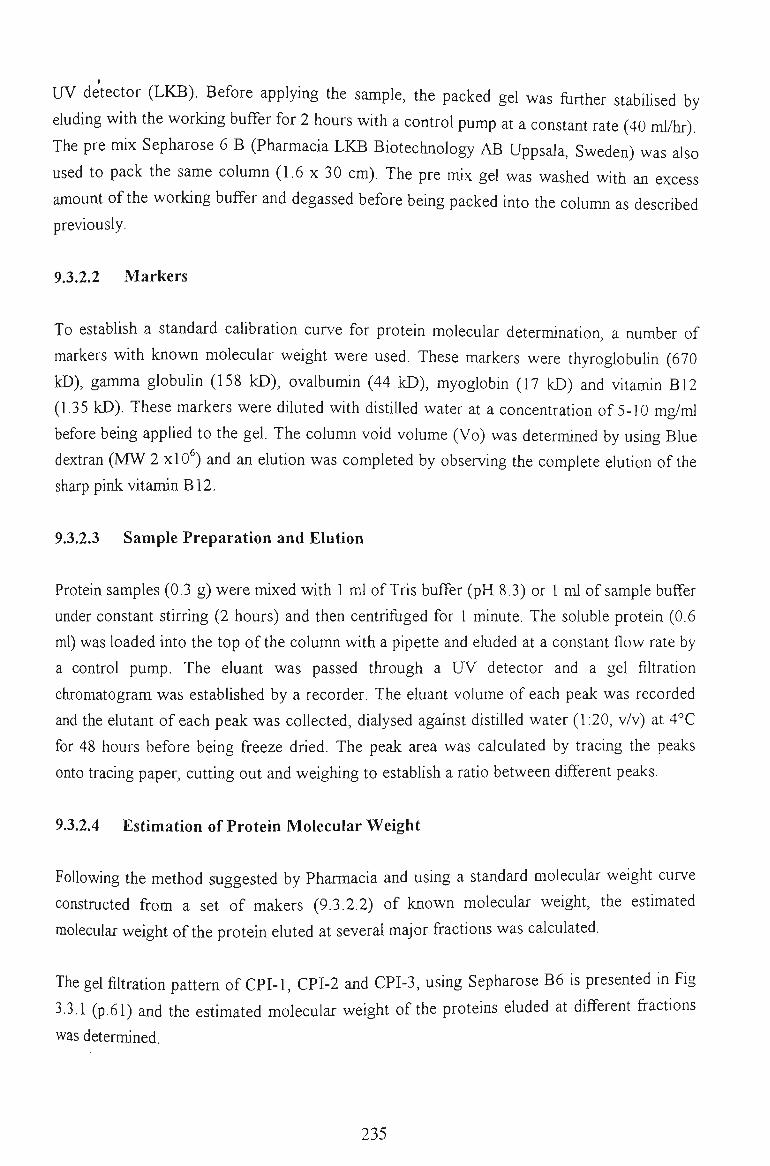
UV detector (LKB). Before applying the sample, the packed gel was fiirther stabilised by
eluding with the working buffer for 2 hours with a control pump at a constant rate (40 ml/hr).
The pre mix Sepharose 6 B (Pharmacia LKB Biotechnology AB Uppsala, Sweden) was also
used to pack the same column (1.6 x 30 cm). The pre mix gel was washed with an excess
amount of the working buffer and degassed before being packed into the column as described
previously.
9.3.2.2 Markers
To establish a standard calibration curve for protein molecular determination, a number of
markers with known molecular weight were used. These markers were thyroglobulin (670
kD), gamma globulin (158 kD), ovalbumin (44 kD), myoglobin (17 kD) and vitamin B12
(1,35 kD). These markers were diluted with distilled water at a concentration of 5-10 mg/ml
before being appUed to the gel. The column void volume (Vo) was determined by using Blue
dextran (MW 2 xlO^) and an elution was completed by observing the complete elution of the
sharp pink vitamin B12.
9.3.2.3 Sample Preparation and Elution
Protein samples (0.3 g) were mixed with 1 ml of Tris buffer (pH 8,3) or 1 ml of sample buffer
under constant stirring (2 hours) and then centrifiiged for 1 minute. The soluble protein (0.6
ml) was loaded into the top of the column with a pipette and eluded at a constant flow rate by
a control pump. The eluant was passed through a UV detector and a gel filtration
chromatogram was established by a recorder. The eluant volume of each peak was recorded
and the elutant of each peak was collected, dialysed against distilled water (1:20, v/v) at 4°C
for 48 hours before being freeze dried. The peak area was calculated by tracing the peaks
onto tracing paper, cutting out and weighing to establish a ratio between different peaks.
9.3.2.4 Estimation of Protein Molecular Weight
Following the method suggested by Pharmacia and using a standard molecular weight curve
constructed from a set of makers (9.3.2.2) of known molecular weight, the estimated
molecular weight of the protein eluted at several major fractions was calculated.
The gel filtration pattern of CPI-1, CPI-2 and CPI-3, using Sepharose B6 is presented in Fig
3.3.1 (p.61) and the estimated molecular weight of the proteins eluded at different fractions
was determined.
235
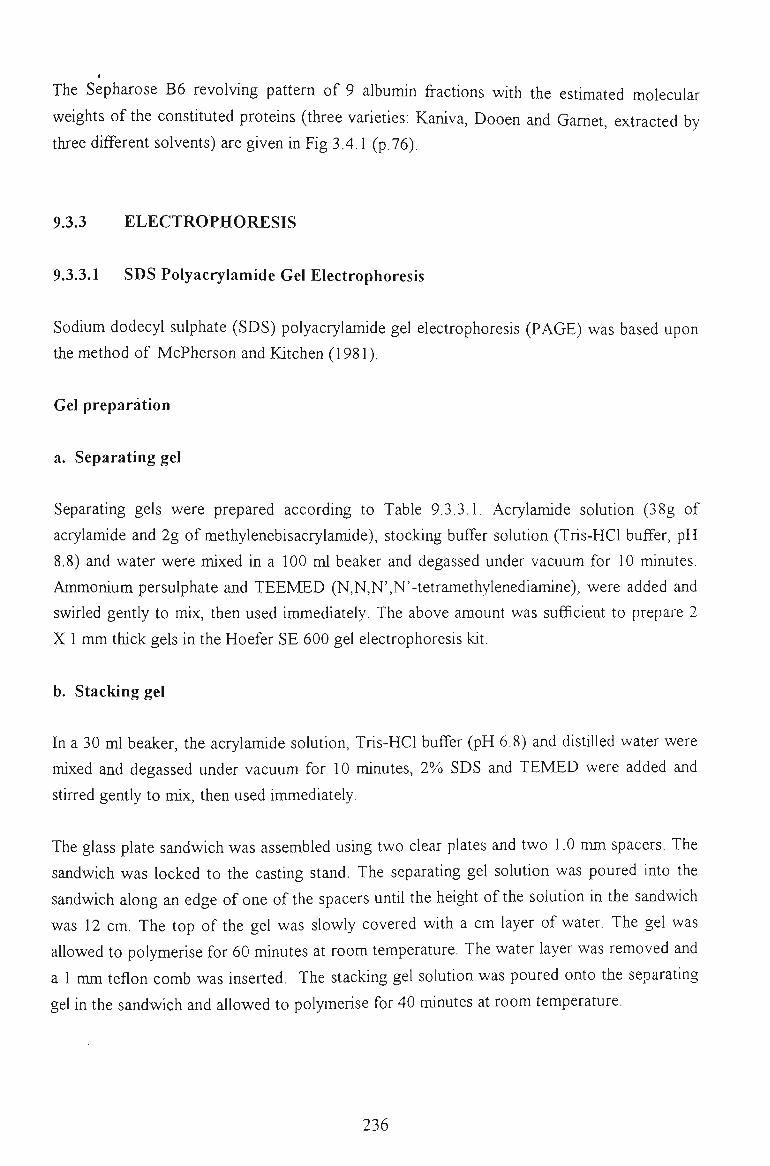
The Sepharose B6 revolving pattern of 9 albumin fractions with the estimated molecular
weights of the constituted proteins (three varieties: Kaniva, Dooen and Garnet, extracted by
three different solvents) are given in Fig 3.4.1 (p.76).
9.3.3 ELECTROPHORESIS
9.3.3.1 SDS Polyacrylamide Gel Electrophoresis
Sodium dodecyl sulphate (SDS) polyacrylamide gel electrophoresis (PAGE) was based upon
the method of McPherson and Kitchen (1981).
Gel preparation
a. Separating gel
Separating gels were prepared according to Table 9.3.3.1. Acrylamide solution (38g of
acrylamide and 2g of methylenebisacrylamide), stocking buffer solution (Tris-HCl buffer, pH
8.8) and water were mixed in a 100 ml beaker and degassed under vacuum for 10 minutes.
Ammonium persulphate and TEEMED (N,N,N',N'-tetramethylenediamine), were added and
swirled gently to mix, then used immediately. The above amount was sufficient to prepare 2
X 1 mm thick gels in the Hoefer SE 600 gel electrophoresis kit.
b. Stacking gel
In a 30 ml beaker, the acrylamide solution, Tris-HCl buffer (pH 6,8) and distilled water were
mixed and degassed under vacuum for 10 minutes, 2%) SDS and TEMED were added and
stirred gently to mix, then used immediately.
The glass plate sandwich was assembled using two clear plates and two 1.0 mm spacers. The
sandwich was locked to the casting stand. The separating gel solution was poured into the
sandwich along an edge of one of the spacers until the height of the solution in the sandwich
was 12 cm. The top of the gel was slowly covered with a cm layer of water. The gel was
allowed to polymerise for 60 minutes at room temperattire. The water layer was removed and
a 1 mm teflon comb was inserted. The stacking gel solution was poured onto the separating
gel in the sandwich and allowed to polymerise for 40 minutes at room temperature.
236
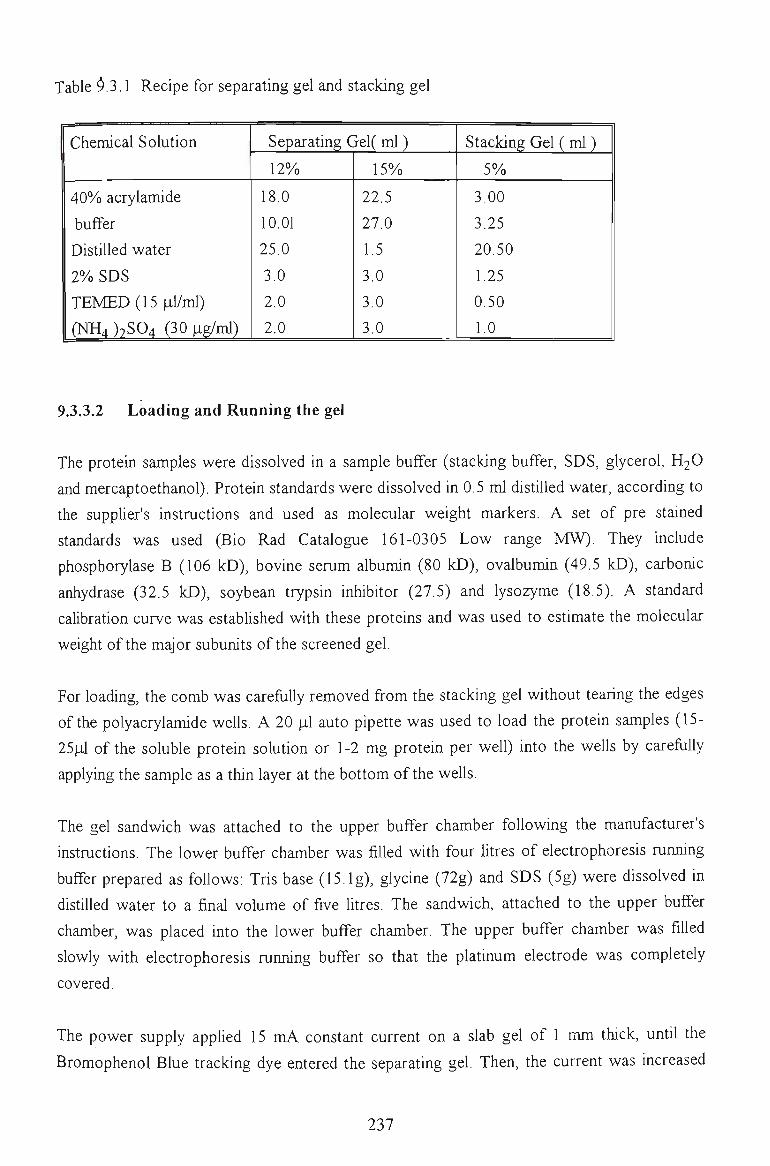
Table ^.3.1 Recipe for separating gel and stacking gel
Chemical Solution
40%) acrylamide
buffer
Distilled water
2% SDS
TEMED (15 |il/ml)
(NH4 )9S04 (30 |ig/ml)
Separating Gel( ml)
12%
18.0
10.01
25.0
3.0
2.0
2.0
15%
22.5
27.0
1.5
3.0
3.0
3.0
Stacking Gel (ml)
5%
3.00
3.25
20.50
1.25
0.50
1.0
9.3.3.2 Loading and Running the gel
The protein samples were dissolved in a sample buffer (stacking buffer, SDS, glycerol, H2O
and mercaptoethanol). Protein standards were dissolved in 0.5 ml distilled water, according to
the suppher's instructions and used as molecular weight markers. A set of pre stained
standards was used (Bio Rad Catalogue 161-0305 Low range MW). They include
phosphorylase B (106 kD), bovine serum albumin (80 kD), ovalbumin (49.5 kD), carbonic
anhydrase (32.5 kD), soybean trypsin inhibitor (27.5) and lysozyme (18.5). A standard
calibration curve was estabhshed with these proteins and was used to estimate the molecular
weight of the major subunits of the screened gel.
For loading, the comb was carefully removed from the stacking gel without tearing the edges
of the polyacrylamide wells. A 20 [il auto pipette was used to load the protein samples (15-
25pl of the soluble protein solution or 1-2 mg protein per well) into the wells by carefiiUy
applying the sample as a thin layer at the bottom of the wells.
The gel sandwich was attached to the upper buffer chamber following the manufacturer's
instructions. The lower buffer chamber was filled with four litres of electrophoresis running
buffer prepared as follows: Tris base (15.Ig), glycine (72g) and SDS (5g) were dissolved in
distilled water to a final volume of five litres. The sandwich, attached to the upper buffer
chamber, was placed into the lower buffer chamber. The upper buffer chamber was filled
slowly with electrophoresis running buffer so that the platinum electrode was completely
covered.
The power supply applied 15 mA constant current on a slab gel of 1 mm thick, until the
Bromophenol Blue tracking dye entered the separating gel. Then, the current was increased
237
to 25-55 mA. Once the blue dye reached 0.5 cm above the bottom of the separating gel, the
power was shut down. The gels were removed and stained for 45 minutes in a dye solution
(0.3g BriUiant blue; 150 ml methanol; 50 ml ethanol; water to 500 ml). Destaining was carried
out overnight in the destaining buffer (62.5 ml methanol, 125 ml ethanol, water to IL). After
destaining, the gel was photographed and a densitometric measurement of the stained gel was
made at 650 nm using a Shimadzu CS-910 TLC scanner (Shimatsu Seisakuso Ltd, Japan).
The SDS-PAGE pattern of CPI-1, CPI-2 and CPI-3 is given in Fig. 3.2.2 (p.62) and that of 9
albumin and globulin fractions isolated from 3 varieties (Kaniva, Dooen and Garnet) with 3
different solvents) is illustrated in Fig 3.4.2 (p.77).
9.3.4 DENSITOMETRIC SCANNING
After destaining, the gel was photographed and densitometric measurement of the stained gel
was made at 650 nm using a Shimadzu CS-910 TLC scanner (Shimatsu Seisakuso Ltd,
Japan). A standard curve for estimation of protein's molecular weight was established with
six markers (9.3.3.2). The molecular weight of the major subunits were estimated by using
the standard curve.
The densitometric scanning profile of CPI-1, CPI-2 and CPI-3 is given in Fig 3.2.3 (p.53)
together with the estimated molecular weight of each major subunit. Also the major subunits
of 9 albumins and 9 globulins, described in 3.3.5 are given in Fig 3.4.3 (p.78).
9.3.5 IN VITRO DIGESTIBILITY
The in vitro digestibility of chickpea protein was measured by using the method of Tran and
Ishii (1975) with some modifications. The hydrolysis of the proteins was conducted at a
smaller scale and only the amount of small proteins and large peptides soluble in TCA
solutions was determined.
9.3.5.1 Enzymes
Four proteolytic enzymes were employed to examine the in vitro digestibility of proteins.
Papain (EC 3.4.22.2), porcine pepsin (EC 3.4.23.1), trypsin (EC 3,4,21,4) and chymotrypsin
(EC 3.4.21.1) were purchased from Sigma.
9.3.5.2 In vitro digestion Assay
238
Protein samples were dissolved in a sample buffer (0.05M Tris-HCl) to form a 2% protem
solution and the enzymes were dissolved in distilled water. The pH of the samples was
adjusted to maximise the reactivity of each enzyme. The optimal pH for pepsin treatment was
2 and other enzymes was 7.5. Protein solution (0.5 ml) was mixed with enzyme solution in
each Eppendorf centrifuge tube at a concentration of 2%) (Protein:enzyme = 98:2). The
protein enzyme mixture was incubated at 37°C for various periods of incubation (1-24 hrs).
At scheduled times the digestion was terminated by adding 0.4M trichloroacetic acid (TCA)
(1 ml) to the digested mixture and centrifuged for 5 minutes at 15,000 g. Part of the
supernatant (0.7 ml) was mixed with 20% (v/v) aqueous FoUn Ciocalteau reagent (0.7 ml),
0.4M Na2C03 (2.3 ml) and held for 15 minutes. A control protein-enzyme solution was
subjected to the same treatment and the absorbance of the control and mixture was measured
at 650 nm with a Hitachi UV spectroscope.
9.3.5.3 In vitro digestibility
The in vitro digestibility of each protein was presented by the relative activity (RA) of each
enzyme employed by measuring the amount of small proteins or large peptides soluble in
TCA solutions after the digestion of each enzyme. The relative activity was calculated as
follows:
RA (%) = [ODt-ODi/ODi] X 100
Where ODt is absorband measured at t time
ODi is absorband measured at initial time
The in vitro digestibility of CPI-1, CPI-2 and CPI-3 by papain, pepsin and trypsin is presented
in Fig 3.3.6. Similarly, the in vitro digestibility of 9 albumins and 9 globulins by papain,
pepsin, trypsin and chymotrypsin is presented in Fig 3.4.4 a-d and in Fig. 3.4.5 a-d,
respectively (p.80-81).
9.3.5.4 Gel filtration profiles of chickpea protein hydrolysates by papain and trypsin
Three protein isolates (CPI-1, CPI-2 and CPI-3) were hydrolysed with papain and trypsin as
described in 9.3.5.2. After 30 minutes, 3, 6 and 24 hours of digestion, the reaction was
terminated and the resulting hydrolysates of these proteins by papain and by trypsin were
subjected to Sepharose B6 filtration as described in 9.3.2.
The Sepharose B6 resolving pattern of the hydrolysates of these proteins by trypsin is given in
Fig. 3.3.4 (p.65) and that by papain was given in Fig. 3.3.5 (p.66). The gradual break down of
239
I
each protein over a period of digestion was reflected by the formation of several peaks of
smaller molecular weight proteins. The estimated molecular weight of proteins in each major
peak was calculated.
9.3.6 PROTEIN EXTRACTION AT PILOT PLANT SCALE
Based on the information gained from previous chapter, chickpea and field pea protem
isolation was conducted at a pilot scale level by using the most suitable extraction parameters
found with laboratory experiments. The processing equipment used in the wet process is
available in Australia. The aims of the experiments at a pilot scale level were:
a. To investigate the technical aspects of the wet process at conditions closer to an industrial
operation.
b. To obtain sufficient material for further studies, particularly on the functional properties of
the extracted proteins under industrial conditions.
9.3.6.1 Materials
500 kg of Kabuli-type chickpeas Kaniva were obtained from a grain merchant and milled to
flour. Particle size analysis was done on a Malvern Instruments SB.OD laser particle analyser.
Approximate 90%) of the chickpea flour were smaller than 374 micron.
9.3.6.2 Processing Equipment
Centrifijges Westfalia Decanter Model SD 230
Westfaha desludging Clarifier SA-1 and SA-12
Vats 4 X 300L mixing vats fitted with mechanical agitators
Pasteuriser Spiraflow shell-and -tube, monotube
Ancillary Pumps, pipes, high-speed Silverson Mixer
Ultrafiltration DDS pilot plant fitted with diafihration facility
Module Type 37, 6.6m , membrane was polysulfone GR 61PP with a
molecular weight cut-off of 20 000
240
Spray llryer NIRO Production Minor
9.3.6.3 Extraction Process
40 kg of the flours were mixed with 200 L of fihered water in a 300L vat, with vigorous
agitation. The pH was adjusted to either pH 7 or 9 and the mixture agitated for 50 mins. The
mixture was pumped through the decanter centrifuge where the protein solution and starch-
fibre solids were separated. The residue of starch-fibre was washed with water at the
extraction pH and re-separated to recover more of the protein. The two liquid streams were
combined and called the "protein extract".
9.3.6.4 Concentration
Concentration of the protein, then, followed one of two processes: (a) Iso-electric
precipitation and (b) Ultra-filtration.
a. Isoelectric precipitation
At pH 4.5-4.6, proteins isolated from chickpeas are largely insoluble. The process therefore is
to adjust the pH of the protein extract with hydrochloric acid to cause the proteins to be
precipitated, followed by centrifugal separation to remove the soluble material (largely soluble
carbohydrate), leaving a concentrated protein sludge. Separation was done in a desludging
clarifier where the insoluble protein (sludge) is collected in the centrifuge bowl until the bowl
is filled, then discharged (desludged). The liquid stream is continuously removed. The protein
can be purified by washing the sludge in acid water and then re-separated.
The insoluble protein was then adjusted to pH 7 to make it soluble, pasteurised by heating to
73-75°C, cooled to 5°C and spray-dried. Four batches of chickpea proteins were prepared
with this process.
b. Ultrafiltration
In this process, the mixture of soluble protein, carbohydrate and minerals is passed into a
selective membrane which has pores only large enough for dissolved salts and sugars to pass
through, leaving the larger protein molecules inside the membrane. The filtrate passing
through is called the permeate.
The protein extract was adjusted to pH 7. When necessary, it was warmed to 50°C and
recirculated in a 6 m membrane until the solids content (estimated from a refractometer) rose
241
from 4%) to 12.5-13%). The protein concentrate was pasteurised by heating to 73-75°C,
cooled and spray dried as described above. This process was successfully apphed for field pea
extract but it was not suitable for chickpea protein, perhaps due to the high fat content and
high foaming character of the chickpea extract.
9.3.6.5 Spray Drying
The two critical parameters in spray drying are the temperature of the hot inlet air (Inlet
Temperature) and the temperature of the outiet air (Outiet Temperature). The fed solid was
about 12%. Initially, an inlet temperature of 200°C and outiet temperature of 100°C were
selected. The resulting protein powder had an overheated odour and dark appearance. When
the spray drying was conducted with a 180°C Inlet and 80°C outlet the obtained protein
powder hada better odour and lighter appearance.
9.3.6.6 Process control
Solids in the supernatant from each centrifuging step was monitored by centrifuging (10,500
g, 3 min) a 10 ml sample in a calibrated test tube on a laboratory centrifuge. The volume of
"sludge" in the bottom of the tube was recorded. From the Decanter this was typically 1-2%
at optimum feed rate and < 0.5%) from the Clarifier. The test was used to decide on the
appropriate feed rate. Samples from each stage were taken and analysed for total soUds
(drying oven method) and protein (ER Transmission for liquids, Leco Nitrogen analyser for
sohds).
a. Separation of soluble protein
Separation of the starch and fibre solids from the soluble protein was achieved eflSciently in
the Decanter. The moisture content of this residue was typically 63%). In the liquid stream
from the Decanter, a typical sludge content was 1%) which could be reduced by slowing the
feed rate. After clarification in the desludger the sludge content of the liquid stream was
typically 0.2%), so the crude protein extract before isoelectric precipitation contamed less than
0.1% entrained solids.
Separation of the precipitated protein from the liquid stream in the desludger was rather
tedious. While flow rates of 200 L/hr were used, the configuration of the centrifiige required
much of the liquid stream to be re-circulated into the feed so the process was still very slow
and laborious. Desludging every 4 mins. required skill in operating the desludge valve to
obtain a solids content over 10%). The solids content of this sludge were typically 9% and
were considered too low for efficient spray drying. The hquid entrained in this sludge was not
242
just water but included other soluble components. Washmg with acidified water was done to
purify the material.
Pasteurisation of the concentrate was found essential when microbiological analyses of
preliminary batches found serious contamination, likely to have come from residual material
in the decanter.
b. Ultrafiltration
The solid content in the extracts was rather low (10%) which was not ideal for spray drying.
Ultrafiltration appeared to be a suitable mean to concentrate it for a more economic fed solid
content when the spray drying, approach was considered. For milk powder, a feed solid
content was- normally expected at the level of 40%) or higher for an economic spray drying
process. The ultrafiltration process proved to be very successful with field pea extracts but
unfortunately difficulties were experienced with chickpea extracts. The possible reasons were
the high foaming capacity of chickpea protein and also the fat level.
The protein isolation procedures on pilot plant scale experiments were carried out as an
extension of bench scale experiments previously described in Expt. 1.3.1 which were basically
followed and adapted to the needs of the pilot plant experiments. When transferring the
knowledge obtained with bench scale experiments to pilot scale production , several
difficulties were experienced. For a commercial production, further work needs to be done in
order to identify the maximum conditions to concentrate the protein level in the extract before
being spray dried. Also difficulties experienced with uhrafihration suggested that defatting of
the raw material was a critical step and defoaming of chickpea protein extract was also an
important aspect for an effective concentration.
The protein isolates obtained from the pilot scale production were further purified and were
used to study the effects of modification on the functional properties, the flow properties as
well as the rheological properties of chickpea proteins.
9.4 FUNCTIONAL PROPERTIES OF PROTEINS ISOLATED AT ACIDIC, NEUTRAL AND ALKALINE pH
Chickpea flour protein extracts (CFPE 1, CFPE 2, CFPE 3 extracted at pH 2, pH 7 and pH 9,
respectively) and chickpea protein isolates (CPI-1, CPI-2, CPI-3 extracted at pH 2, pH 7 and
pH 9, respectively), prepared by the method described in 9.1.3 and 9.2.1 were used to study
243
the functional properties of chickpea proteins isolated under different conditions. A
commercial soy product (Supro 500E) produced in USA with 87.4%) protehi content was
used as reference sample.
9.4.1 SOLUBILITY
The procedure was based upon the method of Anon (1985). Ig of protein sample was
dissolved in 50 ml of water over the range of pH 2 - pH 10 by stirring for one hour at room
temperature (25°C). The slurries were centrifuged at 3040 rpm for 20 minutes, fihered with a
filter paper (Whatman #541) under vacuum. The resulting supernatant was kept in a cool
room (4°C) for the testing.
Solubility is calculated as the ratio of soluble protein to total protein. Total protein content in
the chickpea seed was measured using a modified Kjeldahl procedure (Tecator apphcation
Note 750416-RA for cow milk proteins). Each sample (5g) was added to a digestion tube
containing Missouri catalyst (CUSO4/K2SO4 : 1/35) and concentrated sulphuric acid (20 ml).
The digest tube was heated in a heating block at 400°C until the digestion solution was clear.
The ammonia formed by adding 40%) NaOH to the cooled digest was removed by steam
distillation into 4%o boric acid and quantitated against standard sulphuric acid. Protein was
calculated as %N x 6.25 and all samples were assayed duphcate. Recovery was checked using
tryptophan (AJAX, 98%).
The solubility of chickpea proteins isolated at pH 2, pH 7 and pH 9 (Sample CPI-1, CPI-2
and CPI3) and that of the reference soy protein isolate (SPI) is given in Fig 4.1.1 (p. 86).
9.4.2 OIL ABSORPTION
Assay on oil absorption was based on the method of Sosulski and McCurdy (1987) and Lin et
al (1974). Vegetable bland oil (5 ml) was added to the sample (0.5g) in a 10 ml graduated
centrifuged tube. The mixture was allowed to standard for 30 minutes at 25°C. Every 10
minutes it was mixed with a wire or stirring rod for 1 minute and then centrifuged at 3,000
rpm for 15 minutes. Free oil was decanted and the percentage of absorbed oil was determined
by volume difference.
The oil absorption capacity of chickpea proteins isolated at pH 2, pH 7 and pH 9 (Sample
CPI-1, CPI-2 and CPI-3) and that of the reference soy protein isolate (SPI) is given in Fig
4.1.2 (p.87).
244
9.4.3 WATER ABSORPTION
Water absorption was determined by the method of Sosulski (1962) with some minor
modifications. The protein dispersions were separated at a lower centrifliging force and
shorter time (3000 rpm/10 minutes) since at the reported centrifuging conditions (5000
rpm/30 min) no difference in water absorption was observed (Sathe et al, 1982). Distilled
water (5 ml) was added to the sample (0.5g) in a 10 ml graduated centrifuge tube and mixed
with a glass stirring rod. The mixture was allowed to stand for 30 minutes after each of three
mixings and then centrifuged. The amount of water released was measured. The water
absorption per gram of sample was measured as follows:
WA = water absorption (g) / total sample used (g)
The water absorption capacity of chickpea proteins isolated at pH 2, pH 7 and pH 9 (Sample
CPI-1, CPI-2 and CPI-3) and that of the reference soy protein isolate (SPI) is given in Fig
4.1.2 (p.87).
9.4.4 EMULSIFYING CAPACITY (EC)
Emulsion capacity was measured by the method of Webb et al (1970), modified by Satteriee
et al (1973) based on electrical conductivity. EC was expressed as the maximum volume of
oil (gr) that could be emulsified by a protein without phase inversion or collapse of the
emulsion. The EC was recorded when the electrical conductivity suddenly decreased as the
result of the emulsion breaking because the system was beyond maximum emulsified capacity
of the oil.
Effect of protein concentration was measured with aqueous suspensions prepared at pH 9
with four concentration levels (0.025, 0.05, 0.075 and 0.125%). Effect of pH was measured
with 0.05% aqueous suspensions at pH 5, pH 7 and pH 9. Effect of salt concenttation was
measured with 0.05% aqueous dispersions prepared at pH 9 with 0.125M, 0.25M, 0.5M and
IM NaCl. Effect of temperature was examined with 0.05% aqueous dispersions prepared at
pH 9 and measured at 15, 45 and 75°C. All suspensions (300 ml) were prepared by stirring
the protein isolate with solvents for 3 hours at 25°C. A portion of the suspensions (100 ml)
was placed in the water bath for thermal equilibrium (30 min) before testing. The dispersion
was then homogenised at high speed (Ultra-Turrax PT, 20,000 rpm) for 30 sec. The
vegetable oil was then added at a rate of 1 ml/sec into the stirred mixture. EC was recorded
by the increase in electrical resistance at the inversion point. The total volume of added oil
was recorded and calculated as EC.
245
EC = ml oil /100 ml sample solution
All suspensions were thermally equilibrated at 15°C, except the ones used for the effect of
temperature.
The effect of protein concentration on the emulsifying capacity of chickpea proteins CPI-1,
CPI-2 and CPI-3 and that of the reference soy protein isolate (SPI) is presented in Fig 4.1.3
(p.87).
The effect of solubihsing pH on the emulsifying capacity of chickpea proteins CPI-1, CPI-2
and CPI-3 and that of the reference soy protein isolate (SPI) is illustrated in Fig 4.1.4 (p.88).
The effect of solubihsing temperature on the emulsifying capacity of chickpea proteins CPI-1,
CPI-2 and CPI-3 and that of the reference soy protein isolate (SPI) is given in Fig 4.1.5
(p.89).
The effect of solubilising salt on the emulsifying capacity of chickpea proteins CPI-1, CPI-2
and CPI-3 and that of the reference soy protein isolate (SPI) is given in Fig 4.1.6 (p.90).
9.4.5 EMULSION STABILITY (ES)
Emulsion stability (ES) was measured by the Method of Acton and Saffle (1970) with some
minor modifications. The emulsified suspension as described above was transferred to 250 or
500 ml measuring cylinders and the volume of water released at 0, 30, 60, 180 minutes and 1,
2 and 3 days was recorded. ES was calculated as follow
ES = Vi-Vt/VixlOO%
The effect of protein concentration on the emulsifying stability within 3 hours of chickpea
proteins CPI-1, CPI-2 and CPI-3 and that of the reference soy protein isolate (SPI) was given
in Fig 4.1.7 a-d (p.91).
The effect of protein concentration on the emulsifying stability in 3 days of chickpea proteins
CPI-1, CPI-2 and CPI-3 and that of the reference soy protein isolate (SPI) is given in Fig
4.1.7 e-f (p.92).
246
•
The effect of solubihsing pH on the emulsifying stability of chickpea proteins CPI-1, CPI-2
and CPI-3 and that of the reference soy protein isolate (SPI) in 3 hours and 3 days is given in
Fig 4.1.8 a-d and 4.1.8 e-f (p.93).
The effect of solubihsing sah on the emulsifying stability of chickpea proteins CPI-1, CPI-2
and CPI-3 and that of the reference soy protein isolate (SPI) in 3 hours and 3 days is given in
Fig 4.1.9 a-d and 4.1.9 e-f (p.94).
9.4.6 FOAMING PROPERTIES
Foaming properties were determined by the method of Mohanty et al. (1988). A 3%) aqueous
protein dispersion (100 ml) at pH 7 was prepared by stirring the sample vigorously with a
magnetic stirrer for 30 minutes followed by mixing with a Bamix at setting 4 for 10 seconds.
The sample was then transferred to a Kenwood mixing bowl, whipped with a wire whisk at
setting 2 for 30 seconds and on maximum speed for 5 minutes. The whipped material was
immediately transferred into a graduate 100 ml measuring cylinder. Foam expansion (FE) was
calculated as follows:
FE (%) - (Vo - Vi) X 100 / Vo
where Vo is the total volume (Foam volume + Liquid volume = FV+LV)
Vi is the initial volume of solution
FV is the foam volume at t time
The effect of protein concentration (1-5%) on the foam expansion of chickpea proteins (CPI-
1, CPI-2 and CPI-3) and that of the reference soy protein isolate (SPI) is given in Fig 4.1.10
(p.96).
Fig 4.1.11 (p.96) shows that the foam expansion vs pH curve of chickpea protein CPI-3
resembles its solubility vs pH curve while the foam expansion of soy protein isolate decreased
gradually with increasing pHs (2-9).
9.4.7 SOLUBILITY OF CHICKPEA PROTEINS MEASURED BY INFRARED
SPECTROSCOPY
The solubility of chickpea proteins extracted from chickpea flours and also of chickpea
protein isolates were measured by an infrared spectrometer. The obtained resuUs were
247
compared with those obtained from the conventional Kjeldahl method. The solubihty of soy
protein and field pea proteins were also examined by both methods.
9.4.7.1 Measured proteins
a. Chickpea protein extracts
Chickpea (C. arietinum cv Kaniva) grown at Horsham, Victoria, was dehulled, defatted and
the resulting flours (100 g) were suspended in deionised water (500 ml), readjusted to pH 2,
7 or 9 with IM NaOH or HCI and stirred for 1 hour at 20°C. The extraction pH was
maintained during the extraction time by adding NaOH or HCI solutions. The suspension was
centrifiiged at 4500g for 20 minutes and filtered through Whatman paper #541. Portions of
the fihered -extracts were diluted 2-fold and 4-fold for comparative measurements. The
protein contents were measured by both the Kjeldahl procedure and infrared spectroscopy.
b. Chickpea protein isolates
The filtered extracts from Fig. 4.2.3 (p. 101) at pH 2, pH 7 or pH 9 were precipitated at pH
4.2 with 2M NaOH or 2M HCI and centrifiiged at 8,000 g for 20 minutes at 25°C to give an
acid precipitated curd with approximately 43%) protein. The curds were re-extracted in a 5%
suspension for 1 hour at 20°C, centrifuged at 3,500 g for 25 minutes and fihered through
Whatman #541 filter paper. The filtered supematants were precipitated with 2M HCI at pH
4.2 and centrifuged at 8,000 g for 25 minutes. The precipitated curds were washed three
times with pH 4.2 water and freeze dried to give protein isolates containing 90-97%) protein.
c. Field pea protein isolate
Defatted field pea flour {P. Sativum cv Bonzer) from seeds grown at Horsham Victoria, was
extracted at pH 9 as described above. The protein content of field pea isolate was 89%).
d. Soybean protein isolate
A commercial soy protein isolate (SP-500) was used.
9.4.7.2 Protein assay
a. Kjeldahl procedure
248
The nitrogen content of protein extracts was measured using a Tecator Kjehec system
(Tecator application Note 750416-RA for cow milk proteins) as described in 9.4.1.
b. Infrared measurement
The protein extracts (30 ml) were measured in triplicate with the Milkoscan Model 104, (Foss
Electric, Hillerod, Denmark). This instrument was calibrated with cow milk samples, having a
range of protein contents from 2-4%). The milk samples were assayed by the Kjeldahl
procedure, corrected to measure true protein only and protein calculated by N x 6.38. The
Milkoscan 104 calibration for protein measurement was based on the infrared radiation
absorbed at 6.5 mm by the nitrogen hydrogen bond within the peptide skeleton of the protein
molecules (Van de Voort, 1980). Consequently the instrument measured only protein
mtrogen. Each sample took approximately 1 minute to analyse.
9.4.7.3 Comparison of Milkoscan and Kjeldahl methods
a. Correlation between the two methods
Initial comparison of the two methods was achieved by using chickpea flour proteui extracts
at three different pHs (CFPE 1, CFPE 2 and CFPE 3) and diluting to three different
concentrations, each of which was assayed by both methods. The correlation between the two
methods for protein estimation by linear aggression analysis are presented in Fig 4.2.1 (p.99),
The calculated slopes indicated that the resuhs obtained with the Milkoscan method agreed
with those of the Kjeldahl method for extracts at pH 7 and pH 9 (n=1.011 and 0.982) but not
for pH 2 extract (n=0.745).
b. Solubility curve by the two methods
Suspensions of chickpea isolates (CPI-1, CPI-2 and CPI-3), field pea isolate (FPI) and soy
protein isolate (SPI) (2%) were prepared over the range of pH 2-10. The fihered extracts
were divided into two portions and the soluble protein content assayed by both methods. The
solubility curve of chickpea proteins (CPI-1, CPI-2 and CPI-3) as a fiinction of extraction pH,
measured by the two methods are given in Fig 4.2.2 (p. 100).
c. Comparison of Milkoscan readings and Kjeldahl values
A ratio between the resuhs obtained at each pH by the two methods was calculated (Table
4.2.1) (p. 102). The resuhs indicated that the Milkoscan readings at the pHs at which the
measured proteins (CPI-1, CPI-2 and CPI-3, also field pea and spy protein) were likely to
249
have a net negative or positive charge were lower than the Kjeldahl values. A ratio of 0.8
found with proteins measured at acidic pHs (<4) while at high alkalme pHs (>8), a ratio of
approximate 1 was estabhshed regardless of the processes used.
d. Accuracy of the two methods
To evaluate the accuracy of the Milkoscan at low levels of protein content similar to those in
the legume extracts, a commercial skim milk was diluted to several low concentrations
(expected Kjeldahl values = 0.046-0.310%,) and assayed by the two methods. The resuhs are
given in Table 4.2.3 (p. 103).
e. Factor affecting the Milkoscan readings
Simple amides were used to evaluate the pH effect on the infrared reading of the N-H bond in
peptides. A series of l%o N-methyl and N-ethyl acetamide aqueous solutions were adjusted to
pH 2 - pH 10 by adding O.IM NaOH or O.IM HCI. The concentration of acetamide in the
solution was kept constant by adjusting with deionised water to a constant volume. These
solutions (n = 6) were measured by the Milkoscan under the same conditions as with the
protein solutions (Table 4.2.2) (p. 102).
f. SDS-PAGE profile of the measured proteins
The SDS-PAGE profile of the measured proteins (CPI-1, CPI-2 and CPI-3, FPI and SPI) was
obtained by the method described in 9.3.3.1.
9.5 MODIFICATION OF CHICKPEA PROTEIN ISOLATES
9.5.1 CHARACTERISATION OF ACYLATED CHICKPEA PROTEINS
9.5.1.1 Acylation
a. Succinylation
Chickpea protein concentrates (CPC-2 and CPC-3) and isolates (CPI-2 and CPI-3),
extracted at pH 7 and pH 9 at a pilot scale level were selected. These protein concentrates
and isolates were succinylated with succinic anhydride at four levels by the method of Alford
250
et al '(1984) in order to estabhsh the effects of acylation reagents (type and concentrations)
on the extent of protein modification.
To a 5% aqueous protein dispersion, adjusted to pH 8.5 with 2M NaOH, sohd succinic
anhydride at a level of 4, 10, 20 or 40 g per 100 g of total protein in the dispersion was
added gradually with continual magnetic stirring at 25°C. The reaction was completed when
the pH of reaction mixture was constant. The succinylated protein was precipitated at pH 4
with IM HCI, neutralised and dialysed at 4°C over 48 hours prior to freeze drying.
The extent of succinylation was measured by reactions of the epsilon amino acid groups of
lysine and N-terminal amino groups of proteins with 2,4,6-trinitrobenzensulfonic acid
(TNBS) (Concon, 1975). The ratio of free lysine in the succinylated proteins to that of
native protein is the degree of succinylation (%>).
Four succinylated chickpea proteins , prepared from CPI-3 were used in this study. They
were SCP 16, SCP 72, SCP 73 and SCP 79 with 16, 72, 73 and 79% succinylated level,
respectively.
b. Acetylation
Similarly, the chickpea protein concentrates (CPC-2 and CPC-3) and isolates (CPI-2 and
CPI-3) were acetylated with acetic anhydride at five levels (4, 10, 20, 40, 80 ml / lOOg) by
the same method of succinylation as of the method by Alford et al (1984). The extent of
succinylation was measured by the same method as above (Concon, 1975).
Four acetylated chickpea proteins, prepared from the chickpea protein CPI-3 were used in
this study. They were ACP 6, ACP 26, ACP 45, ACP 47 and ACP 49 with 6, 26, 45, 47 and
49% acetylated level, respectively.
The extent of acylation of the chickpea protein concentrates and isolates (CPC-2 and CPC-3;
CPI-2 and CPI-3) by acetic and succinic anhydride at various concentrations was illustrated in
Fig 5.1.1 a-b (p. 109).
9.5.1.2 Amino acid composition of acylated chickpea proteins
The amino acid composition of unmodified (CPI-3 or NCP), acetylated (ACP 6, ACP 26,
ACP 45, ACP 47 and ACP 49) and succinylated chickpea proteins (SCP 16, SCP 72, SCP 73
and SCP 79) was measured by the method described in 9.3.1. The resuhs are tabulated in
251
Table 5.1.1. and were compared with the reference proteins as recommended by WHO
(p. 111).
The ratio between the essential amino acids and the total amino acids, the amount of sulfur
containing and aromatic amino acids were also calculated.
9.5.1.3 Gel filtration
Unmodified (CPI), acetylated ((ACP 6, ACP 26, ACP 45, ACP 47 and ACP 49) and
succinylated chickpea proteins (SCP 16, SCP 72, SCP 73 and SCP 79)) were subjected to
Sepharose 6B gel filtration by the procedure described in 9.3.2.
The gel filtration pattern of all investigated proteins was similar with three major fractions.
For the unmodified protein, the estimated molecular weight of the major protein fractions was
912, 52.5 and 20.9 kD respectively. For the acetylated proteins (ACP 6 and ACP 45) the
estimated molecular weight of the major protein fractions was 923, 58.9 and 22.9 kD,
respectively.
9.5.1.4 SDS-PAGE profile
SDS-PAGE analysis of the umnodified (CPI), acetylated (ACP 6, ACP 26, ACP 45, ACP 47
and ACP 49) and succinylated chickpea proteins (SCP 16, SCP 72, SCP 73 and SCP 79) was
performed as described in 9.3.3. The SDS-PAGE pattern of these proteins is given in Fig
5.1.2 (p.ll3).
Three major subunits (Rf = 0.21, 0.33 and 0.83) was found with CPI. The succinylated
chickpea proteins (SCP 16, SCP 72, SCP 73 and SCP 79) showed a similar SDS-PAGE
pattern but a new distinct band was found at 0.32 Rf. As the degree of succinylation
increased, the number and also the intensity of several bands in the range of 0.34 to 0.83 Rf
decreased and completely disappeared at 79%) succinylation.
The SDS-PAGE pattern of CPI and acetylated chickpea proteins ((ACP 6, ACP 26, ACP 45,
ACP 47 and ACP 49) was outstandingly similar. As the degree of acetylation increased, a
major band at Rf 0.32 and Rf 0.83 gradually disappeared and several bands at Rf 0.91 were
formed (p. 113).
9.5.1.5 Densitometric scanning profile
252
The densitometric profile of the unmodified (CPI), acetylated (ACP 6, ACP 26, ACP 45,
ACP 47 and ACP 49) and succinylated chickpea proteins (SCP 16, SCP 72, SCP 73 and SCP
79) was obtained by the method described in 9.3.5. The pattern of these proteins is given in
Fig 5.1.3 (p.ll5).
The densitometric profile showed that the unmodified proteins consisted of seven subunits
(15.8, 21.9, 24.5, 36.3, 41.7, 44.7 and 52.5 kD). Of these, those of 15.8, 44.7 and 52.5 kD
were the major subunits.
Succinylation changed the densitometric patterns of the modified proteins with the
disappearance of some subunits with low molecular weights (15.8-24.5 icD) and the
formation of a new subunit having higher molecular weights (61-63.1 kD). As the degree of
succinylation increased more subunits with low molecular weights disappeared.
Five subunits were found with acetylated chickpea protein (ACP 6) having estimated
molecular weight of 16.2, 26.3, 39.8, 45.7, 46.8 and 53.7 kD. As the level of acetylation
increased, an increase in retarded mobility of acetylated proteins was observed. The subunit
having MW of about 53 kD at 6%) acetylation increased to 61.7 kD at 49%o acetylation.
9.5.1.6 In vitro digestibility
Unmodified (CPI), acetylated (ACP 6, ACP 45, ACP 47 and ACP 49) and succinylated
chickpea proteins (SCP 16, SCP 72, SCP 73 and SCP 79) were hydrolysed by papain, pepsin,
trypsin and chymotrypsin by the procedure described in 9.3.5. The in vitro digestibility of
each protein was presented as the relative activity (RA) (%)) of each enzyme.
The in vitro digestibility of acetylated chickpea proteins (ACP 6, ACP 45, ACP 47 and ACP
49) is presented in Fig 5.1.4 a-d (p. 118) and that of succinylated chickpea proteins (SCP 16,
SCP 72, SCP 73 and SCP 79) is in Fig 5.1.5 a-d (p.l 19).
9.5.2 FUNCTIONAL PROPERTIES OF ACETYLATED AND SUCCINYLATED
CHICKPEA PROTEINS
9.5.2.1 Solubility
The procedure described in 9.4.1 was used to examine the solubility of the unmodified and
acylated chickpea proteins in water and in salt solutions (NaCl and CaCl2 at 0.25M and
0.75M concentrations)
253
1
The solubility of the unmodified (CPI) and acetylated (ACP 6 and ACP 49) m water is given
in Fig 5.2.1 (p. 122), in 0.25M and 0.75M NaCl solutions in Fig 5.2.2 a-b (p. 123) and m
0.25M and 0.75M CaCl2 solutions in Fig 5.2.3 a-b (p. 123).
The solubility of the unmodified (CPI) and succinylated (SCP 16 and SCP 79) in water is
given in Fig 5.3.1, (p,139) in 0.25M and 0.75MNaCl solutions in Fig 5.3.2 a-b (p. 140) and in
0.25M and 0.75M CaCb solutions in Fig 5.3.3 a-b (p. 140).
9.5.2.2 Water absorption capacity
Water absorption capacity of the unmodified and acylated chickpea proteins was examined by
the procedure described in 9.4.2.
Water absorption of acetylated chickpea proteins (ACP 6, ACP 45 and ACP 49) and the
unmodified chickpea protein is presented in Fig 5.2.4 (p. 125) and that of succinylated
chickpea proteins (SCP 16, SCP 72 and SCP 79) in Fig 5.3.4 (p. 141).
9.5.2.3 Oil absorption capacity
Oil absorption capacity of the unmodified and acylated chickpea proteins was examined by
the procedure described in 9.4.3.
Oil absorption of acetylated chickpea proteins (ACP 6, ACP 45 and ACP 49) and the
unmodified chickpea protein was presented in Fig 5.2.5 (p. 126) and that of succinylated
chickpea proteins (SCP 16, SCP 72 and SCP 79) in Fig 5.3.5 (p. 142).
9.5.2.4. Emulsifying Capacity (EC)
Emulsion capacity of the unmodified and acylated chickpea proteins was examined by the
procedure described in 9.4.4, by the method of Webb et al (1970) and modified by Satteriee
etal{\913).
The effect of protein concentration on the emulsifying capacity of the unmodified chickpea
proteins NCP, acetylated (ACP 6, ACP 26, ACP 45, ACP 47 and ACP 49) and succinylated
chickpea proteins (SCP 16, SCP 72, SCP 73 and SCP 79) is given in Fig 5.2.6 (p. 127) and
Fig.5.3.6(p.l43).
The effect of solubilising pH on the emulsifying capacity of the unmodified chickpea proteins
NCP, acetylated (ACP 6 and ACP 49) and succinylated chickpea proteins (SCP 16 and SCP
254
79) is given in Fig 5.2.7 and Fig 5.3.7 (p. 128, 143). The pH effect on the solubihty of some of
these proteins is given in Fig 5.2.8 (p 128).
The effect of solubilising salt on the emulsifying capacity of the unmodified chickpea proteins
NCP, acetylated (ACP 6 and ACP 49) and succinylated chickpea proteins (SCP 16 and SCP
79) is given in Fig 5.2.9 andFig.5.3.9 (p.129, 144).
9.5.2.5 Emulsion stability
The effect of protein concentration on the emulsifying stability within 3 hours of the
unmodified chickpea proteins NCP, acetylated (ACP 6 and ACP 49) and succinylated
chickpea proteins (SCP 16 and SCP 79) is given in Fig 5.2.11a (p.131) and Fig 5.3.10a
(p. 146).
The effect of protein concentration on the emulsifying stability in 4 days of the unmodified
chickpea proteins NCP, acetylated (ACP 6 and ACP 49) and succinylated chickpea proteins
(SCP 16 and SCP 79) within 3 hours is given in Fig 5.2.1 lb and Fig 5.3.10 b (pl23-147).
The effect of solubilising pH on the emulsifying stability of the unmodified chickpea proteins
NCP, acetylated (ACP 6 and ACP 49) and succinylated chickpea proteins (SCP 16 and SCP
79) within 3 hours was given in Fig 5.2.12a (p.133) and 5.3.11a (p.148) and after 4 days is
given in Fig 5.2.12b (p. 134) and Fig 5.3.11b (p. 149).
The effect of solubilising salt on the emulsifying stability of the unmodified chickpea proteins
NCP, acetylated (ACP 6 and ACP 49) and succinylated chickpea proteins (SCP 16 and SCP
79) within 3 hours is given in Fig 5.2.13a (p. 135) and Fig 5.3.12 a (p. 150) and after 4 days is
given in Fig 5.2.13b (p. 136) and Fig 5.3.12b (p. 151).
9.6 FLOW PROPERTIES
9.6.1 FLOW PROPERTIES OF UNMODIFIED CHICKPEA PROTEIN (NCP)
9.6.1,1 Solution Preparation
Aqueous protein dispersions were prepared by mixing the protein in an ultra mixer (Tarrux)
at 20,000 rpm for 5 minutes. Each dispersion was adjusted to pH 7 with IM NaOH. To
255
examine the effect of salt, protein dispersions were prepared with 0.25M, 0.5M, IM, 2M
NaCl solutions
9.6.1.2 Viscosity Measurements
Viscosity determinations were carried out by using a Rheometer (Rheomat 30 Viscometer,
Germany). Depending on the nature of these samples, several standard cups (stainless steel)
and spindles were used. A double-gap measuring system (cup and spindle) MS-O was suitable
for extremely low viscosity thin solutions while the MS-A, B, C systems were suitable for
thick dispersions (temperature 0-80°C). Rheomat 30 Viscometer equipped with a viscosity
range of 1-17 x 10^ (Pas), shear rate range of 12 x 10" - 36 x 10^ (sec^l), shear stress range
of 0.6-200 X 10^ (Pa) and 30 different speeds (30 steps subdivided in geometrical progression
within a range of 350-0.048 min"l (rpm). The range of the millivoh meter for torque
measurements are 0-0.49 cNm, 0-0.98 cNm, 0-1.96 cNm and 0-4.9 cNm. Measuring ranges
can be changed during measurements. Viscosities were determined using the full range of
speeds, the speeds being increased and decreased successively to detect any hysteresis. The
viscosity readings are presented as follows.
9.6.1.3 Presentation of Data
The Rheomet 30 Viscometer measures the torque to revolve a measuring system, rotating at
a constant definite speed. By the use of the torque , its reading is converted into shear rate,
shear stress and viscosity '(y-, a- and rj- values tables).
The foUowing power law equation was used to express flow properties of chickpea protein
dispersion
6 = mYn [6.1.1]
or log6 = nlogy + logm [6 12]
where 6 is the shear stress, y is the shear rate (sec'l), n is the flow index and m is the
consistency coefficient in the power law relation.
The Casson equation was used to calculate the yield values of the protein dispersions
256
The yield stress value {Oy = ko ) was obtained by extrapolating the rheogram of a' ^ versus y
'' to zero shear rate.
The apparent viscosity was calculated by the following equation
Ti = mY"-l [6.1.4]
9.6.1.4 Parameters Affecting Flow Properties
9.6.1.4.1 Protein Concentration
The protein'(NCP) solutions were made to 2, 4, 6, 8, 12 and 20%o (w/v) concentrations in
distilled water adjusted to pH 7 by addition of IN NaOH. Each protein dispersion was mixed
by magnet stirrer for 1 hour and an ultra mixer (Tarrux, 20,000 rpm) for 5 minutes. After
being placed in the rheometer, each sample was allowed to rest at a give temperature (25°C)
for 30 minutes to thermal equilibrate before 4 readings were recorded at each shear rate. The
shear rate / shear stress characteristics of each protein dispersion was measured. This was a
typical measurement used to establish a flow curve for all dispersions in this investigation.
A flow curve was established by plotting shear rates against shear stresses. Flow curves of
the unmodified chickpea protein (NCP) dispersions at 2-20%) concentration is given in Fig
6.1.1 (p. 158). Shear stress as a function of shear rate on a logarithmic scale for chickpea
protein dispersions at different concentrations (2-20%)) was calculated and presented in Fig
6.1.2 (p. 158). Effect of shear rate on the apparent viscosities of chickpea protein dispersions
at different concentrations was given in Fig 6.1.3 (p. 159). Shear rate had no effect on the
apparent viscosities of dilute protein dispersions (<4%)). Also, the consistency index m , an
index of viscosities is also illustrated as a fiinction of protein concentration on a
semilogarithmic scale (Fig 6.1.4) (p. 160). The effect of protein concentration on the Casson
yield stress of the native protein NPI is presented in Fig 6.1.5. This demonstrates the capacity
of this equation [6.1.3] to calculate the yield stress of the chickpea protein dispersions
(p. 160).
The effect of protein concentration on the power law constants (n, m), Casson yield stress and
apparent viscosities of chickpea protein dispersions are tabulated in Table 6.1.1 (p.l 60).
9.6.1.4.2 Temperature
257
The protein samples (NCP), ACP 6, ACP 45, ACP 49, SCP 16, SCP 73, SCP 79) were made
to 8%) (w/v) protein concentration in distilled water adjusted to pH 7 by addition of IN
NaOH. Protein dispersions were, then, incubated in 15°C, 25°C, 35°C and 55°C water bath
for 30 minutes. The effect of the dissolving temperature on the power law constants (n, m),
Casson yield stress and apparent viscosities of chickpea protein dispersions are tabulated in
Table 6.1.2 (p. 161). At 55°C, heat treatment increased the apparent viscosities of the 8%
chickpea protein dispersion (Fig 6.1.6) (p. 162).
9.6.1.4.3 Ionic Strength
Chickpea protein samples (NCP, SCP 16, SCP 73, SCP 79) were made to 8% (w/v) protein
concentration in 0.2M, 0.5M, IM and 2M NaCl solutions, adjusted to PH 7 by addition of IN
NaOH. The- effect of salt concentration on the power law constants (n, m), Casson yield
stress and apparent viscosities of chickpea protein dispersions are tabulated in Table 6.1.3
(p. 163). Flow curves of the chickpea NCP in NaCl solutions with different concentrations
are given in Fig 6.1.7 (p. 163).
9.6.1.4.4 pH
The protein (NCP) were made to 8%) (w/v) protein dispersions in distilled water adjusted to
pH 2, pH 5, pH 7 and pH 9 by addition of IN NaOH or HCI solutions. The effect of
dissolving pH on the power law constants (n, m), Casson yield stress and apparent viscosities
of the chickpea protein dispersions are tabulated in Table 6.1.4 (p. 164). Flow curves of the
chickpea NCP dispersions with different pHs are given in Fig 6.1.8 (p. 165). The solubility and
apparent viscosity of the NCP dispersions at pH 2, pH 5, pH 7 and pH 9 are given in Fig
6.1.9 (p.l65).
9.6.1.4.5 Effect of protein denaturing agents
8% protein dispersions (NCP) were made with 6M urea and 1% SDS solutions and the flow
curves were estabhshed as in 9.6.1.4.2. The effect of protein denaturing reagents on the
power law constants (n, m), Casson yield stress and apparent viscosities of these chickpea
protein dispersions are tabulated in Table 6.1.5 (p. 166).
9.6.2 FLOW PROPERTIES OF ACETYLATED CHICKPEA PROTEINS
Three acetylated chickpea proteins (ACP 6, ACP 45, ACP 49) were selected to investigate
the effects of concentration, temperature and salt concentrations on the flow behaviour of
258
these proteins. The effects of different degrees of acetylation on power law constants, Casson
yield stress and apparent viscosities were also considered.
9.6.2.1 Protein Concentration
The protein dispersions (ACP 6) were made to 1, 4, 6, 8, 12 and 20% (w/v) concentrations in
distilled water adjusted to pH 7 by addition of IN NaOH.
The flow curve and flow behaviour of these protein dispersion (Fig 6.2.1) (p. 169) were
estabhshed and characterised as in 9.6.1.4.1. Shear stress as a fiinction of shear rate for these
acetylated chickpea protein dispersions at different concentrations (1-20%)) was presented.
The effect of concentration on the flow properties of acetylated proteins was greater than that
of the unmodified proteins.
The effect of shear rate on the apparent viscosities of acetylated chickpea protein dispersions
at different concentrations is given in Fig 6.2.2 (p. 171) by comparison the m values of 8%
acetylated with that of the unmodified protein dispersions.
The effect of protein concentration on the power law constants (n, m), Casson yield stress
and apparent viscosities of the ACP 6 chickpea protein dispersions are tabulated in Table
6.2.1. To examine the effect of acetylation at different levels, 8%) dispersions of the ACP 45
and ACP 49 were also examined as in 9.6.1.4.1. and the results are illustrated in Table 6.2.1
(p. 170).
9.6.2.2 Temperature
The protein samples ACP 6 were made to 8%) (w/v) protein concentration in distilled water
adjusted to pH 7 by addition of IN NaOH, then, incubated in 15°C, 25°C, 35°C and 55°C
water bath for 30 minutes.
The effect of heat treatment on the power law constants (n, m), apparent viscosities and
Cassion yield stress of chickpea protein dispersions are given in Fig 6.2.3 a-d (p. 172). To
demonstrate the effect of acetylation at different degrees, each of these flow behaviour
parameters were plotted against the degree of acetylation.
9.6.2.3 Salt concentration
Chickpea protein dispersions ACP 16 were made to 8%) (w/v) protein concentration in 0.2M,
0.5M, IM and 2M NaCl solutions and adjusted to pH 7 by addition of IN NaOH. The
259
I
effects of the salt concentrations on the other two proteins (ACP 45, ACP 49) were only
examined at 0.2M, IM and 2M concentrations and were compared with that of the NCP The
effect of sah concentration on the power law constants (n, m), Casson yield stress and
apparent viscosities of chickpea protein dispersions are tabulated in Table 6.2.2 (p. 174).
Flow curves of the chickpea NCP in NaCl solutions with different concentrations are given in
Fig 6.1.7 (p. 163).
9.6.3 FLOW PROPERTIES OF SUCCINYLATED CHICKPEA PROTEINS
Three succinylated chickpea proteins (SCP 16, SCP 73, SCP 79) were selected to investigate
the effects of concentration, temperature, salt concentrations, different degrees of acetylation
on the flow'behaviour of these proteins with their power law constants, Casson yield stress
and apparent viscosities.
9.6.3.1 Protein Concentration
The SCP 16 protein dispersions were made to 1, 4, 8, 12 and 20%) (w/v) concentrations in
distilled water adjusted to pH 7 by addition of IN NaOH.
The flow curve (Fig 6.3.1) (p. 178) and flow behaviour of these protein dispersions (Table
6.3.1) (p. 177) were estabhshed and characterised as in 9.6.1.4.1. Shear stress as a function of
shear rate for these acetylated chickpea protein dispersions at different concentrations (1-
20%) was presented.
The effect of protein concentration on the apparent viscosities of acetylated chickpea protein
dispersions at different concentrations is given in Fig 6.3.2 (p. 179) by comparison the m
values of the succinylated protein SCP 16 and that of acetylated and unmodified protein ACP
6 and NCP, respectively, on a semi logarithmic scale.
The effect of protein concentration on the power law constants (n, m), Casson yield stress
and apparent viscosities of the SCP 16 chickpea protein dispersions are tabulated in Table
6.3.1 (p. 177). To examine the effect of acetylation at different levels, 8% dispersions of the
SCP 73 and SCP 79 were also examined as in 9.6.1.4.1 and the results are also illustrated in
Table 6.3.1.
9.6.3.2 Salt concentration
260
Chickpea protein (SCP 16, SCP 73, SCP 79) were made to 8% (w/v) protein dispersions in
0.2M, 0.5M, IM and M NaCl solutions, adjusted to pH 7 by addition of IN NaOH. The
effects of salt concentrations on the other two proteins (SCP 73, SCP 79) were only
examined at 0.2M, IM and 2M concentrations and were compared with that of the NCP.
The effect of sah concentration on the power law constants (n, m), Casson yield stress and
apparent viscosities of these chickpea protein dispersions are tabulated in Table 6.3.2 (p. 181).
The effect of sah concentrations on the apparent viscosity (AV) at 81.4 sec"' was modelled by
Hnear regression of AV and the logarithm of AV (log AV) on the salt concentration (SC) and
degree of succinylation (DS) and their logarithms. The best fitting regression equation [6.3.1]
is presented in page 181.
9.6.3.3 Temperature
The protein SCP 16 dispersions were made to a 8%o (w/v) protein concentration in distilled
water adjusted to pH 7 by addition of IN NaOH, then, incubated in 15°C, 25°C, 35°C and 55
°C water bath for 30 minutes.
The effect of heat treatment on the power law constants (n, m), apparent viscosities and
Casson yield stress of chickpea protein dispersions are given in Table 6.3.3 (p. 183). To
demonstrate the effect of acetylation at different degrees, each of these flow behaviour
parameters were plotted against the degree of acetylation. The effect of temperature on the
apparent viscosity (AV) at 81.4 sec'' was modelled by hnear regression of AV and the
logarithm of AV (log AV) on the temperature (T) and degree of succinylation (DS) and their
logarithms. The best fitting regression equation [6.3.2] is presented in page 182. The apparent
viscosities of the succinylated proteins at a certain temperature can be predicted by the
equation [6.3.3] presented in page 183.
9.7 RHEOLOGICAL CHARACTERISTICS OF WHEAT DOUGHS SUPPLEMENTED WITH NATIVE AND MODIFIED CHICKPEA PROTEINS
The rheological characteristics of wheat flour doughs supplemented with non wheat proteins
were investigated by examining the effects of supplementation with non wheat proteins on the
farinograph, extensigraph and pasting characteristics of wheat flour doughs. The effects
caused by the non wheat proteins on the baking characteristics were also investigated.
261
9.7.1 RHEOLOGICAL CHARACTERISTICS
9.7.1.1 Supplemented non wheat proteins
The following non wheat protein samples were used in this study.
a. Flour Commercial wheat flour was purchased locally. Chickpea flour was prepared from
the Kaniva variety seed. The seed was cleaned and ground to pass a 100 micron sieve.
b. Chickpea proteins Unmodified, acetylated and succinylated chickpea proteins (NCP,
ACP 6, ACP 45, ACP 49, SCP 16, SCP 73, SCP 79) and partially hydrolysed chickpea
proteins by papain and by trypsin.
c. Hydrolysed chickpea proteins The unmodified chickpea protein (NCP) was hydrolysed
with papain and trypsin for 2 h as described in 9.3.5.
d. Soy protein Commercial soy protein (SP E-500).
9.7.1.2 Rheological determination
a. Farinograph study
Farinograms (RACI 1988) were determined, using 50g of wheat flour or wheat flours
supplemented with chickpea flours or other non wheat proteins. Water absorption {%>, the
amount of water added to sample and calculate the amount necessary to bring the centre of
the peak to the 500 BU line), dough development tune (min, time taken from the addition of
the water to the peak time centred on the 500 BU line, measured to the nearest 0.25 minute),
stability time (min) and dough breakdown (BU, difference between centre of the curve at the
peak and the centre of the curve 10 minutes after the peak) were recorded. Chickpea flours
were supplemented at 8, 15 and 30%) while other soy and chickpea proteins were added at 1,
2, 4 and 8%. The resuhs are tabulated in Table 7.2.1 (p. 195) and 7.2.2 (p. 199).
b. Extensograph study
Extensograms (RACI 1988) were produced by using 300g of wheat flour and chickpea flour
as a control. Soy was supplemented at a 4%o level and chickpea proteins were supplemented
at a 1%, 2% and 4% level. Extensigraph measurements of fortified wheat flour doughs
included water absorption (%), extensibility (E, cm), maximum resistance to stretching (Rm,
cm), Viscoelastic ratio (Rm/E, BU/cm), dough strength (A, cm^). The resuhs are presented
262
in Table 7.3.1 (p.201) and the extensograms of wheat, chickpea flour, wheat supplemented
with unmodified, acetylated and succinylated chickpea proteins at three levels are given m Fig
7.3.1 (p.202).
c. Pasting characteristics
Pasting properties of wheat flour and wheat flour supplemented with non wheat proteins were
measured by the Rapid Visco Analyser (RVA) (Newport Scientific Pty, Ltd, NSW,
Australia). Samples were tested in the RVA in duplicate using the STD 1 profile by adding
the total sample weight of 3.500 g as is, to 25 ml distilled water. Chickpea flour was replaced
at 15 and 30%) level but all proteins were supplemented at only the 3%o level. The pastmg
characteristics were recorded over 18 minutes, initial equilibration at 50°C for 2 minutes,
heating 2 minutes to maximum of 95°C, holding 6 minutes at 95°C and cooling 8 minutes to
minimum of 50°C.
As illustrated in Fig 7.4.1 (p.205), the RVA curves were analysed by ten pasting parameters
related to time (initial peak time, EPT; onset time, OT; and peak time, PT) to viscosity (peak
viscosity, PV; breakdown viscosity, H; difference between peak and breakdown viscosity, P-
H) and to slope (ascending slope, AS and descending slope, DS) (Ryu et al, 1993).
The results are tabulated in Table 7.4.1, Table 7.4.2 and Table 7.4.3 (p.204, 206, 207).
7.1.2.3 Factors affecting the RVA peak viscosity
Factors may affect the RVA peak viscosity were investigated using the procedure described
in 9.7.1.2 c.
a. Starch concentration A comparison was made between 100% wheat flour (3.500 g) and
97% wheat flour (3.395 g) alone. The resuh is given in Fig.7.5.1 (p.209),
b. Wheat flour lipids A comparison was made between wheat flour and wheat flour
/chickpea protein blends. The result is given in Fig.7.5.2 (p.210).
c. Protein supplementation A comparison was made between wheat flour alone and with
3% (0.105 g) soy protein supplemented flours. The resuhs are given in Fig. 7.5.3 (p.211).
d. Type of protein A comparison was made between wheat flour and those supplemented
with bovine serum albumin. The results are given in Fig 7.5.4 (p.212).
263
9.7.2 BAKING PROPERTIES OF WHEAT FLOUR SUPPLEMENTED WITH CHICKPEA PROTEINS
9.7.2.1 Wheat flour-Non wheat protein blends
All blends were prepared by replacing dry solids of commercially miUed bread wheat flour
with non wheat proteins at different levels. Chickpea flours were supplemented at 8, 15, 25,
30% levels. Soy protein, ACP 6, ACP 49, SCP 16, SCP 73, papain and trypsin treated
chickpea proteins at a 3% level while NCP, ACP 45, SCP 79 at 1.5, 3 and 5% levels.
9.7.2.2 Baking test
The baking test (Panozzo et al 1990) was carried out using the wheat flour-non wheat protein
blends. Briefly, the blend was mixed with yeast, salt, malt, improver solution and water
(determined by baking water absorption) for 30 min, then returned to the prover for 105 min
before the first punch. The punched dough remained in the prover for 50 minutes before the
second punch and was panned after 25 minutes. The panned dough was returned to the
prover for 55 minutes before baking for 35 minutes.
9.7.2.3 Baking performance
Baking performance was evaluated by loaf volumes, colour, strength of crust and crumb.
a. Composition of baked products
The approximate composition of breads supplemented with chickpea and soy proteins is given
in Table 7.6.1 (p.214). Protein, fat, moisture and carbohydrates (%) were measured as
described in 9.1.1.2.
b. Colour measurement and observation
Colour of the breads was measured by a Minoha Chromameter (CR 200, Japan) using the L
(lightness), a* (colour hue) and b* (saturation) values. A white standard tUe (L: 97.86, a*: -
0.43 and b*: +2.06) provided with the instrument was used to calibrate the chromameter.
Observation was also made with high score for the darker bread 10 hours after baking (Table
7.6.2) (p.219).
c. Crumb softness and crumb texture
264
Crumb softness and texture were subjected to a subjective evaluation with a maximum of 20
points. A high score was given to a harder crumb texture (pressing on the bread surface). For
an objective measurement, textural quality of the breads was measured by a Lloyd instrument
(1000 R Model) using bread crust (whole shoe, 12 mm thickness) and crumb (the same bread
slice without crust). A 5 kN load cell and an OTMS (Ottawa Texture Measuring System)
type forward extrusion test cell was used. The test ceU was screwed onto the load cell and
was driven downward to the bread slice at a speed of 100 mm/ min through a travel distance
of 6 mm. The average extrusion force was read from the force deformation curve plotted by
the computer which was connected to the Lloyd instrument's sensor panel.
d. Loaf volume
Loaf volumes were measured by rapeseed replacement between 30-90 minutes after baking.
These characteristics of breads supplemented with non wheat proteins (soy and chickpea) are
illustrated in Table 7.6.2 (p.219) and the photo of these breads are given in Fig 7.6.1 and Fig
7.6.2 (p.217,p.218).
265
REFERENCES
Australia Bureau of Agricultural and Resource Economics, Crop report. Project 31.005, 80
19, Oct. 1993
Abdel-Aal-El, S.M., Youssef, M.M., Abdel-Shehata, A. and El-Mahdy, A.R. (1986)
Chemical and functional properties of some legume powders, Food Chem., 20: 153-156
Abdel-Hamid, N.A., Osman, M.O. and El-Farra, A.A. (1986) Effect of addition of broad
bean flower in rheological properties of dough and baking quality of Balady bread, Egypt. J,
Food Sci., 14: 429-434
Aboagye, Y. and Stanley, D.W. (1985) Texturisation of peanut proteins by surface film
formation. 1. Influence of parameters on film forming properties. Can. Inst. Food Sci.
Technol. J., 18: 12-20
Abo-Bakr, T.M., Shekib, L.A., Iraqism, E.L, and Mohamed, M.S. (1986) Upgrading and
utilization of by-products of slaughterhouses. I. Fresh and canned sausage incorporating
legume extenders in their meat emulsions, Alexandria Sci. Exchange, 7: 319-329
Achor, I.M., Richardson, T. and Draper, N.R. (1981) Effect of treating Candida utilis with
acid or alkali, to remove nucleic acids, on the quality of the protein, J. Agric. Food Chem.,
29: 27-33
Acton, J.C. and Saffle, R.L. (1970) Stability of oil water emulsions. I. Effect of surface
tension, level of oil, viscosity and type of meat protein, J. Food Sci., 35: 852-855
Alford, E.S., Pirfyapan, V., DiU, C.W., Young, C.R., Richter, R.L. and Landmann, W.A.
(1984) Effect of succinylation on the proteolysis of food proteins, J. Food Sci., 49: 614-616
Ananatharaman, K. and Carpenter, K.J. (1969) Effects of heat processing on nutritional
value of ground nut products. I. Protein quality of groundnut cotyledons for heat, J. Sci.
Food Agric, 20: 703-708
Andrews, A.T. (1988) Protein analysis by electrophoresis, in Developments in Food
Proteins 6, Hudson, B.J.F. (Ed), Elsevier Appl. Sci., 219-258
a
Andrews, J.L., Hay, R.L., Skerritt, J.H. and Sutton, K.P.H. (1994) HPLC and
immunoassay-based glutenin subunit analysis: screening for dough properties in wheats
grown under different environmental conditions, J. Cereal Sci., 20: 203-215
Anker, CA. and Geddes, W.F. (1944) Gelatinisation studies upon wheat and other starches
with the amylograph. Cereal Chem., 21: 335-360
Aoki, H., Taneyama, O. and Inami, M. (1980) Emulsifying properties of soy protein,
characteristics of 7S and 1 IS proteins, J. Food Sci., 45: 534-538, 546
Aquilera, J.M. and Trier, A. (1978) The revival of the lupin. Food Technol., 32: 70-76
Aral, S., Yamashita, M. and Fujimaki, M. (1975) Plastein reaction and its application.
Cereal Foods World, 20: 107-112
Arce, C.B., Pilosof, A.M.R. and Bartholomai, G.B. (1991) Sodium dodecyl sulfate and
sulfite improve some functional properties of soy protein concentrates, J. Food Sci., 56:
113-115
Arntfield, S.D., Ismond, M.A.H. and Murray, E.D. (1985) The fate of antkiutritional factors
during the preparation of a faba bean protein isolate using a miceUization technique, Can.
Inst. Food Sci. Technol. L, 18: 137-143
Ayamard, C, Cuq, J.L. and Cheftel, J.C. (1978) Formation of lysino-alanine and lanthionine
in various proteins, heated at neutral or alkaline pH, Food Chem., 3:1-5
Ayres, J.L. and Davenport, B.L. (1977) Peanut protein: A versatile food ingredient, J. Am.
Oil. Chem. Soc, 54: 109A-111A
Bahnassey, Y.A. and Breene, W.M. (1994) Rapid visco analyser (RVA) pasting profiles of
wheat, com, waxy com, tapioca and amaranth starches {A. hypochondriacus and A.
cruentus) in the presence of konjac flour, gellan, guar, xanthan and locust bean gums.
Starch, 46: 134-141
Ballester, D., Rodrigo, R., Nakouzi, J., Chichester, CO., Yanez, E. and Monckeberg, F.
(1970) Rapeseed meal III-A simple method for detoxification, J. Sci. Food Agric, 21: 143-
144
267
Ballester, D., Zacarias, I., Garcia, E. and Yanez, E. (1984) Baking studies and nutritional
value of bread supplemented with full fat lupin flour (L albus Multolupa), J. Food Sci., 49:
14-16
Bansal, K.K., Dhindsa, K.S. and Batra, V.I.P. (1988) Trypsin inhibitor and hemagglutinin
activities chickpea {Cicer arietinum L.): effect of heat and germmation, J. Food Sci.
Technol., 25: 46-48
Barbano, D.M., Clark, J.L., Dunham, C.E. and Fleming, R.J. (1990) Kjeldahl method for
determination of total nitrogen content of milk: CoUaborative study, J. Assoc. Off. Anal.
Chem., 73: 849-859
Barber, K.J.' and Warthesen, J.J. (1982) Some functional properties of acylated wheat
gluten, J. Agric. Food Chem., 30: 930-934
Barman, B.G., Hansen, J.R. and Mossey, A.R. (1977) Modification of the physical
properties of soy protein isolate by acetylation, J. Agric. Food Chem., 25: 638-641
Bason, M.L., Ronalds, J.A., Wrigley, C.W. and Hubbard, L.J. (1993) Testing for sprout
damage in malting barley using the rapid visco analyser. Cereal Chem., 70: 269-272
Batistuti, J.P., Barros, R.M.C. and Areas, J.A.G. (1991) Optimization of extmsion cooking
process for chickpea {Cicer arietinum, L.) defatted flour by response surface methodology,
I Food Sci. 56: 1695-1698
Bau, H.M., Candy, P., Gay, M. and Debry, G. (1979) Evaluation de I'mfluence des
traitements technologiques sur les produits a base de fevrole. Can. Inst. Food Sci. Technol.
I , 12: 194-199
Bean, M.M., Keagy, P.M., FuUington, J.G., Jones, F.T. and Mechan, D.K. (1974) Dried
Japanese noodles. Properties of laboratory prepared noodle doughs from sound and damaged
wheat flours. Cereal Chem., 51: 416-427
Bean, M.M. and Yamazaki, W.T. (1978) Wheat starch gelatmisation in sugar solutions. 1.
Sucrose: microscopy and viscosity effects. Cereal Chem., 55: 936-944
Begrat A. (1981) Protein quality of faffa, the Ethiopian infant formula as affected by pulse
substitution, J. Food Biochem., 5: 233-238
268
Behnke, U., Schultz, M., Rufloff, H. and Schmandke, H. (1982) Changes in the fianctional
properties of Vicia faba protein isolates by partial enzymic hydrolysis, Nahmng, 26: 313-
321
Bencini, M.C. (1986) Functional properties of dmm dried chickpea (C. arietinum) flours, J.
Food Sci., 51: 1518-1521,1526
Berardi, L.C., Martinez, W.H. and Fernandez, C.J. (1969) Cottonseed protein isolates: two
step extraction procedure. Food Technol, 23: 1305-1312
Berot, S., Gueguen, J. and Berthaud, C. (1987) Ultrafiltration of faba bean {Vicia faba L.)
fraction extracts process parameters and functional properties of the isolates, Lebensm.
Wiss. Technol., 20: 143-150
Berry K.E. (1989) Preparation of soy protein concentrate products and their application in
food systems, in Vegetable protein utilisation in human foods and in animal feedstuffs,
Applewhite, T.H. (Ed), Am. OU Chem. Soc, Champaign, Illinois, USA, 62-65
Betschart, A.A. and Saunders, R.M. (1978) Safflower protein isolates, influence of recovery
conditions upon composition, yield and protein quality, J. Food Sci., 43: 964-968
Betschart, A.A. (1979) Development of safflower protein, J. Am. OU Chem. Soc, 56: 454-
457
Betschart, A.A. (1975) Factors influencing the extractability of safflower protein
{Carthamus tinctorius L), J. Food Sci., 40:1010-1013
Betschart, A.A., Fong R.Y. and Hanamoto, M.M. (1979) Safflower protein isolates:
fianctional properties in simple systems and breads, J. Food Sci., 37: 1097-1103
Beuchat, L.R. (1977) Functional and electrophoretic characteristics of succinylated peanut
flour proteins, J. Agric. Food Chem., 25: 258-261
Beuchat, L.R. (1977) Modification of cookie-baking properties of peanut flour by
enzymatic and chemical hydrolysis. Cereal Chem., 54: 405-414
Bhatty, R.S. (1982) Albumin proteins of eight edible grain legume species: electrophoresis
patterns and amino acid composition, J. Agric. Food Chem., 30: 620-622
269
Bhatty,' R.S. (1988) In vitro hydrolysis of pea, faba bean and lentil meals and isolated
protein fractions by pepsin and trypsin. Can. Inst. Food Sci. Technol. J., 21: 66-71
Bhatty, R.S. (1974) Chemical composition of some faba bean cultivars. Can. J. Plant Sci.,
54: 413-421
Biggs, D.A. (1979) Infrared estimation of fat, protein and lactose in mUk: evaluation of
Multispec instmment, J. Assoc. Off. Anal. Chem., 62: 1202-1207
Birk, Y., Smirnoff, P. and Ramachandran, J. (1986) Photoreactive, active derivatives of
trypsin- and chymotrypsin- inhibitors from soybeans and chickpeas, in Nutritional and
toxicological significance of enzyme inhibitors in foods, Friedman, M. (Ed), NY, USA,
Plenum Press, California, USA, 469-481
Bistrian, B.R., Blackbum, G.I., HaUowell, E. and Heddell, R. (1974) Protein status of
general surgical patients, J. Am. Med. Assoc, 230: 858-860
Blagrove, R.J. and GiUespie, J.M. (1978) Comparative studies on the proteins from seeds of
lupins angustifolius L, Aus. J. Plant Physiol., 5: 651-663
Blagrove, R.J. and Grillespie, J.M. (1975) Isolation, purification and characterisation of the
seed globulins of Lupins angustifolius, Aus. J. Plant Physiol, 2: 13-27
Bock, H. (1968) Method for processing oU mill residues to recover highly purified protein,
US Patent, 3, 402, 165 -, —, . -—,
Bradstreet, R.B. (1965) The Kjeldahl method for organic nitrogen. New York: Academic
press
Britten, M. and Lavoie, L. (1992) Foaming properties of proteins as affected by
concentrations, J. Food Sci, 57:1219-1222,1241
Brown, R.O. and Harrel, C.G. (1944) The use of amylograph in the cereal laboratory.
Cereal Chem., 21: 360-369
Browner, J.B. and Mclntyre, A. (1992) Genetic resources in chickpea workshop
proceeding, Aus. Inst. Agric Sci, 139-150
270
Brueclmer, J., Mieth, G. and Muschiolik, G. (1986) Functional properties of plant fractions
in selected foods, Nahmng, 30: 428-429
Bmeckner, J., Mieth, G., Dabrowski, K., Gwiazda, S. and Ruthowski, A. (1982) Fractional
properties of sunflower protein isolates in a meat model system, Nahmng, 26: 457-463
Buffet, H.G. (1994) Global development of soy - based products. Inform, 5:1156-1158
Campbell, N.F., Shih, F.F. and Marshall, W.E. (1992) Enzymatic phosphorylation of soy
protein isolate for improved functional properties, J. Agric. Food Chem., 40: 403-406
Campos, J.E. and El-Dash, A.A. (1978) Effect of addition of fiaU fat sweet lupine flour on
rheological properties of dough and baking quality of bread, Cereal Chem., 55: 619-627
CaneUa, M., Castriotta, G. and Bemardi, A. (1979) Functional and physicochemical
properties of succinylated and acetylated sunflower protein, Lebensm. Wiss. Technol, 12:
95-101
Carbonaro, M., Vecchini, P. and Carnovale, E. (1993) Protein solubility of raw and
cooked beans {Phaseolus Vulgaris). Role of the basic residues, J. Agric. Food Chem., 41:
1169-1175
Casero, P., Duranti, M. and Cerietti, P. (1983) Heterogeneity of submit composition in lupin
globulins. Comparison of proteins from a single seed and from a number of seeds, J. Sci.
Food Agric, 34: 1113-1116
Cater, CM., Rhee, K.C., Hagenmaier, R.D. and Mattil, K.F. (1974) Aqueous extraction -
an altemative oilseed milling process, J. Am. OU Chem. Soc, 51: 137-141
Catsimpoolas, N.and Myer, E.W. (1970) Gelation phenomena of soybean globulins. Protein-
protein interactions. Cereal Chem., 48: 559-570
Cerletti, P. (1983) Lupin seed proteins, m Developments in food proteins (II), Hudson,
B.J.F. (Ed), Applied Sci Publisher, UK 133-171
Cerietti, P., Fumagalh, A. and Venturin, D. (1978) Protein composition of seeds of Lupinus
albus, J. Food Sci, 43: 1409-1411
271
Chango, A., ViUaume, C, Bau, H.M., Nicolas, J.P. and Mejean, L. (1993) Debittering of
Lupin {L. Luteus L.) protein by calcium alginate and nutritional evaluation, J. Sci. Food
Agric, 63: 195-200
Chavan, J.K. and Hejgaard, J. (1981) Detection and partial characterisation of subtihsin
inhibitors in legume seeds by isoelectric focusing, J. Sci. Food Agric, 32: 857-862
Chavan, J.K. and Kadam, S.S. (1989) Nutritional improvment of cereals by sprouting, CRC
Crit. Rev. Food Sci. Nutt., 28: 401-437
Chavan, J.K. and Kadam, S.S. (1993) Nutritional enrichment of bakery products by
supplementation with non-wheat flours, CRC Crit. Rev. Food Sci. Nutr, 33: 189-226
Chavan, J.K., Kadam, S.S. and Salunkhe, D.K. (1986) Biochemistry and technology of
chickpea {Cicer arietinum L.) seeds, CRC Crit. Rev. Food Sci. Nutr., 25: 107-158
Cheftel, J.C. (1977) Chemical and nutritional modifications of food proteins due to
processing and storage, in Food protein, Whitaker, J.R. and Tannenbaum, S.R. (Eds), AVI.
Publishing Co., USA 401-445
Chen, L., Richardson, T. and Amundson, C. (1975) Some functional properties of
succinylated fish protein concentrate, J. Milk Food Technol, 38: 89-93
Chen, S.S. and Rasper, V.F. (1982) Functionality of soy proteins in wheat flour / soy isolate
doughs. II Rheological properties and bread making potential. Can. Inst. Food Sci. Technol.
J., 15:211-220
Cheryan, M. (1980) Phytic acid interactions in food systems, CRC Crit. Rev. Food Sci.
Nutr, 13:297-335
Childs, E.A. and Forte, J.F. (1976) Enzymatic and ultrasonic techniques for solubilisation of
protein from heat-treated cottonseed products, J. Food Sci, 41: 652-655
Childs, E.A. and Park, K.K. (1976) Functional properties of glandless cottonseed flour, J.
Food Sci, 41: 713-714
Cho, Y.S. and Thompson, L.U. (1984) Precipitation behaviour of extracted nitrogen, phytic
acid and minerals in rapeseed flour modified by acylating agents, J. Food Sci, 49: 765-767
272
Choi, y.D., Kim, J.G. and Cho, S.H. (1992) Effects of succinylation on functional properties
of aspergUlus fumigatus ceU proteins, J. Korean Soc. Food Nutr., 21: 573-579
Choi, Y.R., Lusas, E.W. and Rhee, K.E. (1983) Molecular stmcture and functionalities of
protein isolates prepared from defatted cottonseed flour succincylated at various levels, J.
Food Sci, 48: 1275-1278
Choi, Y.R., Lusas, E.W. and Rhee, K.E. (1981) Succinylation of cotton seed flour: effect on
the functional properties of protein isolates prepared by modified flour, J. Food Sci, 46: 954-
955
Choi, Y.R. and Rhee, K.C. (1984) Preparation of soft-textured high protein curds from
peanut, glandless cottonseed, sunflower seed and soybean flour, (FPRDC Annual Report)
263-273
Chompreeda, P., Resurreccion, A.V.A., Hung, Y.C. and Beuchat, L.R. (1987) Quality
evaluation of peanut-supplemented Chinese type noodles, J. Food Sci, 52: 1740-1741
Christensen, R.P. (1948) Efficient use of food resources in the US, Tech. BuU U.S. Dept.
Agric, 963
Colonna, P. and Mercier, C. (1983) Marcromolecular modification of manioc starch
components by extmsion cooking with or without lipids. Carbohydrate Polymers, 3: 87-108
Concon, J.M. (1975) Rapid method for the determination of lysine in cereal grains without
hydrolysis. Anal. Biochem., 66: 460-480
Conkerton, E.J. and Ory, R.L. (1976) Peanut proteins as food supplements. A
compositional study of selected Virginia and Spanish peanuts, J. Am. OU Chem. Soc, 53:
754-756
Crenwelge, D.D., Dill, C.W., Tybor, P.T. and Landmann, W.A. (1974) A comparison of the
emulsification capacities of some protein concentrates, J. Food Sci. 39: 175-177
Crosbie, G.B. (1991) The relationship between starch sweUing properties, paste viscosity
and boiled noodle quality in wheat flours, J. Cereal Sci, 13: 145-150
273
Damodaran, S. (1994) Stmcture-Function Relationship of Food Protems, m Protein
Functionality in Food Systems, Hettiarachchy, N.S. and Ziegler, G.R. (Eds), EFT, Marcel
Dekker, NY, USA, 1-38
D'Appolonia, BL. (1977) Rheological and bakmg studies of legume wheat flour blends.
Cereal Chem., 54: 53-63
D'Appolonia, B.L. (1978) Use of untreated and roasted navy beans in bread malcing.
Cereal Chem., 55: 898-907
D'Appolonia, B.L. and MacArthur, L.A. (1974) Effect of ingredients on con tinuous bread
cmmb pasting characteristics. Cereal Chem., 51: 195-203
Deffenbaugh, L.B. and Walker, C.E. (1989) Use of rapid visco analyser to measure starch
pasting properties I. Effect of sugars. Starch, 41: 461-467
Deffenbaugh, L.B. and Walker, C.E. (1989) Comparison of starch pasting properties in the
Brabender Viscoamylograph and the Rapid Visco Analyser, Cereal Chem., 66: 493-499
Deffenbaugh, L.B. and Walker, C.E. (1990) Use of the RVA to measure starch pasting
properties. Effect of emulsifiers and sugar emulsifier interactions. Starch, 42: 89-95
Delhaye, S. and Landry, J. (1986) HPLC and ultraviolet spectrometry for quantitation of
tryptophan in barytic hydrolysates. Anal. Chem., 159: 175-178
Dench, J.E. (1982) Extraction of nitrogeous material from winged bean {Psophocarpus
Tetragonolobus L. DC.) flours and the preparation and properties, J. Sci. Food Agric, 33:
173-184
Dengate, H.N. and Meredith, P. (1984) Inherent variation in wheat starch pasting due to
cultivar. Starch, 36: 238-240
Deshpande, S.S. and Cheryan, M. (1984) Preparation and antinutritional characteristics of
dry bean {Phaseolus vulgaris L.) protein concentrates, Qual. Plant. Plant Foods Hum. Nutr.,
34: 185-196
Deshpande, S.S., Raugekar, P.D., Sathe, S.K. and Salunkhe, D.K. (1983) Functional
properties of wheat bran composite flours, J. Food Sci, 48: 1659-1662
274
Devani, M.B., Shishoo C.J., Shah, S. and Suhagia, B.N. (1989) Spectrophotometric method
for micro determination of nitrogen in Kjeldahl digest, J. Assoc. Off. Anal. Chem., 72: 953-
956
Dexter, J.E. and Matsuo, R.R. (1977) Influence of protein content on some dumm wheat
quality parameters. Can. J. Plant Sci, 57: 717-727
Dodok, L., Modhir, A.A., Hozova B., Halasova, G. and Polacek, I. (1993) Importance and
UtiUsation of chickpea in cereal technology. Acta Aliment., 22: 119-129
Duke, J.A. (1981) Handbook of legumes of world economic importance. New York, USA
Plenum Press
Eapen, K.E., Tape, N.W. and Sims, R.P.A. (1969) New process for the production of better
quality rapeseed oU and meals II. Detoxification and dehuUing of rapeseeds feasibUity study,
I Am. OU Chem. Soc, 46: 52-55
Egana, J.L, Hauy, R., Cassork, X., Barrera, G. and Yanez, E. (1992) Sweet lupin protein
quality in young men, J. Nutr., 122: 2341-2347
Eisele, T.A. and Brekke, C.J. (1981) Chemical modification and fianctional properties of
acetylatedbeefheart myofibrillar proteins, J. Food Sci, 46: 1095-1102
El-Aswad, M.B., Gorna, M.A., Afifi S.A. and Ahmed N.H. (1980) Chemical and
organoleptic evaluation of hamburger and canned-type product containing lean meat mixed
with soybean and chickpea, J. Agric. Res., 3:183-209
Eliasson, A.C. (1990) Rheological properties of cereal proteins in Dough rheology and
baked product texture, Faridi, H. and Faubion, J. (Eds), Van Nostrand Reinhold, 67-110
El-Nockrasky, A.S., Mukherjee, K.D. and Mangold, H.K. (1977) Rapeseed protein isolates
by countercurrent extraction and isoelectric precipitation, J. Agric. Food Chem., 25: 193-200
El-Tinay, A.H., Chandrasekhar, H. and Ramanatham, G. (1980) Protein and gossypol
extractability from cottonseed flour, J. Sci Food Agric, 31: 38-42
El-Tinay, A.H., Nour, A.M., Abdel-Karim, S.H. and Mahgob, S.O. (1988) Aqueous protein
and gossypol extraction from glandseed cottonseed flour: factors atffecting protein
extraction, Food Chem., 29: 57-63
275
Engels; C , Hendrickx, M. and Tobback, P. (1987) Limited multilayer desorption of brown,
parboiled rice. Int. J. Food Sci. Technol, 22: 219-223
Estevez, A.M., Fifiierola, R.F., Vasquez, D.M., Castillo, V.E., Yanez, E. (1987)
Supplementation of wheat flour with chickpea {Cicer arietinum) flour. II. Chemical
composition and biological quality of breads made with blends of the flours. Arch. Latinoam. Nutr, 37: 515-524
Esuoso, K. O. and Bamiro, F.O. (1995) Studies on the baking properties of non-wheat
flours I. Breadfmit {Artocarpus artilis). Int. J. Food Sci. Nutr., 46: 267-273
Evans, M.T.A. and Irons, L. (1970) N-succinylated egg yolk proteins GP-1, 951, 247
Fan, T.Y. and Sosulski, F.W. (1974) Dispensability and isolation of proteins from legume
flours. Can. Inst. Food Sci. Technol, 7: 256-259
FAO (1973) Food and Agriculture Organiztion, Energy and protein requirements. Technical
Report Series, N522, FAO/WHO, Geneva, Swisstzeland, Production Yearbook
FAO (1985) Food and Agriculture Organiztion Production YearBook, Rome, Italy
FAO (1987) Food and Agriculture Organiztion The world pulse economy Commodity
review and outlook. Economic and Social Development Series, 43: 111-115
FAO (1990) Food and Agriculture Organiztion Production Yearbook, Rome, Italy
Faubion, J.M. and Hoseney, R.C. (1990) The viscoelastic properties of wheat flour doughs,
in Dough rheology and baked product texture, Faridi, H. and Faubion, J. (Eds), Van
Nostrand Reinhold, 29-67
Ferdinandez, M.L. and Berry, J.W. (1989) Rheological properties of flour and sensory
characteristics of bread made from germinated chickpea. Int. J. Food Sci. Technol, 24: 103-
110
Fermandez, L.T. and Berry, J.W. (1987) Characteristics of a chocolate beverage from
germinated chickpeas, J. Food Sci, 52: 726-728
276
Figuerola, R.F., Estevez, A.A. and CastiUo, V.E. (1987) Supplementation of wheat flour
with chickpea {Cicer arietinum) flour. I. Preparation of flours and then- breakmakmg
properties. Arch. Latinoam. Nutr., 37: 378-387
Finney, P.L., Morad, M.M. and Hubbard, J.D. (1980) Germinated and ungerminated faba
bean in conventional U.S. breads made with and without sugar and in Egyptian balady breads.
Cereal Chem., 57: 267-270
Flora, F.A., Pilosof, A.M.R. and Bartholomai, G.B. (1990) Physicochemical properties of
soybean proteins related to flow, viscoelastic, mechanical and water-holding characteristic of
gels, J. Food Sci, 55: 133-136
Fleming, S.E. and Sosulski, F.W. (1977) Bread making properties of four concentrated plant
proteins. Cereal Chem., 54: 1124-1140
Flink, J. and Christiansen, I. (1973) The production of a protein isolate from Vicica faba,
Lebensm. Wiss. Technol, 6: 102-106
Franzen, K.L. and KinseUa, J.E. (1976) Functional properties of succinylated and acetylated
leaf protein, J. Agric Food Chem., 24: 914-919
Franzen, K.L. and Kinsella, J.E. (1976) Functional properties of succinylated and acetylated
soy protein, J. Agric. Food Chem., 24: 788-795
Fosdick, L.E. and Pike, R.K. (1982) Polarographic determination of Kjeldahl nitrogen, J.
Assoc Off.. Anal. Chem., 65: 178-180
Fox, M., Rayner, C, and Wu, P. (1985) Amino acid composition of Australian foods. Food
Technol Aus., 40: 320-323
FuUington, J.G., MiskeUy, D.M., Wrigley, C.W. and Kasarda, D.D. (1987) Quality related
endosperm proteins in sulfiar deficient and normal wheat grain, J. Cereal Sic, 5: 233-245
Gandhi, A.P. and Bourne, M.C. (1991) Effect of pre-soaking on the rate of thermal
softening of soybeans. Int. J. Food Sci. Technol, 26: 1117-1322
Gandhi, S.K., Schultz, J.R., Boughey, F.W, and Forsythe, R.H. (1968) Chemical
modification of egg white with potassium persulphate. Food Technol, 22: 1018-1022
277
Ganesll-Kumar, K. and Venkataraman, L.V. (1980) Chickpea seed protems: isolation and
characterization of 10.3S protein, J. Agric Food Chem., 28: 524-529
Gardener, H.K.Jr., Hron, R.J.Sr. and Vix, H.L.E. (1976) Removal of pigment glands
(Gossypol) from cottonseed. Cereal Chem., 53:549-560
Giec, A., Stasinska, B., Lampart-Szczapa, E. and Skupin, J. (1989) Effect of
phosphorylation and succinylation of yeast protein on its enzymatic digestibility and functional
properties, Acta Aliment Polonica, 15:63-66
Glicksman, M. (1969) Gum technology in the food industry. Gen. Foods Corp, Product
Development Lab., Tarrytown, New York, USA 30-35
Gillberg, L. (1978) Influence of electrolytes on the solubility of rapeseed protein isolates, J.
Food Sci, 43: 1219-1223, 1228
Gillberg, L. and Toernell, B. (1976) Preparation of rapeseed protein isolates. Dissolution
and precipitation behavior of rapeseed proteins. J. Food Sci, 41: 1063-1069
Goulden, J.D.S. (1964) Analysis of milk by infrared absorption, J. Dairy Res., 31: 273-278
Grant, D.R., Summer, A.K. and Johnson, J. (1976) An investigation of pea seed albumins.
Can. Inst. Food Sci. Technol. J., 9: 84-91
Gray, M.S. and Cherry, J.P (1981) Treatment of cottonseed meals followed by extraction
with certain solvents to remove gossypol, USA Patent 4, 279, 811
Groninger, H.S.Jr. (1973) Preparation and properties of succinylated fish myofibrillar
protein, J. Agric. Food Chem., 21: 978-981
Gueguen, J. (1980) Solubility of faba bean {Vicia faba L.) and pea {Pisum sativum L.).
Lebensm. Wiss. Technol, 13: 156-163
Gueguen, J. (1991) Pea and faba bean proteins, in Developments in Food Proteins, Hudson,
B.J.F. (Ed), Elsevier Applied Science, London, UK 35-78
Guzman-Juarez, M. (1983) Yeast protein in developments, in Food Proteins II, Hudson,
B.J.F: (Ed), Applied Science Publisher NY. 263-291
278
Gwiaz5a, S., Dabrowski, K.J., Klepacka, M. and Rutkowski, A. (1989) Preparation and
fianctional properties of acetylated rapeseed proteins. Acta Aliment., 18: 353-360
Hach, CC, Bowden, B.K., Kopelove, A.B. and Brayton, S.V. (1987) More powerful
peroxide Kjeldahl Digestion Method, J. Assoc Off. Anal. Chem., 70: 783-787
Hamada, J. S. (1992) Modification of food proteins by enzymatic methods, in Biochemistry
of Food Proteins, Hudson, B.J.F. (Ed), Elsevier Applied Science, London, 249-270
Hamm, R. (1975) Water holding capacity of meat, in Meat Proceeding of the Twenty-first
Easter School in Agricultural Science, University of Nottingham, UK 321-338
Hanumantha Rao, K., Chandrasekhara, H.N. and Ramanatham, G. (1987) Preparation and
nutritive value of protein isolate from cottonseed flour, J. Food Sci. Technol, India, 24: 190-
192
Hanumantha Rao, K. and Subramanian, N. (1970) Essential amino acid composUion of
commonly used Indian pulses by paper chromatography, J. Food Sci. Technol, 7: 31-34
Harper, A.E. (1977) Human amino acid and nitrogen requirements as the basis for
evaluation of nutritional quality of proteins, in Food Proteins, Whitaker, J.R. and
Tannenbaum, S.R. (Eds), AVI Connecticut, USA, 365-386
Harper, A.E., Williams, H.H., Hegsted, D.M., Arroyave, G., Holt, L.E. Jr., McLaughlan,
J.M., Graham, G.G., and Phipard, E.F. (1974) Nitrogen and amino acid requirements, in
Improvement of protein nutriture. Harper, A.E. and Hogsted, D.M. (Eds), NAS, NRC
Washington D.C., USA, 22-63
Hasegawa, K., Fujino, Y. and Konami, S. (1981) Succinylation and maleylation of sesame
seed protein, J. Agric. Chem. Soc. Japan, 55: 239-245
Haumann, B.F. (1984) Soymilk feature, I Am.OU Chem. Soc, 61:1784-1786,1788
Hayakawa, I. and Nomura, D. (1977) Preparation of single cell protein (SCP) for food and
improving of its spinnability, Agric. Biol. Chem., 41: 117-124
Hayes, R.E, Hannay, C.P., Wadsworth, J.I. and Spadaro, J.J. (1986) Acceptability and
tolerance of a corn-glandless cottonseed blended food by Haitian children, ACS. Symp. Ser,,
312: 138-149
279
Hendrickx, M., Engels, C. and Tobback, P. (1987) Three dimensional TLM models for
water difflision in white rice, J. Food Eng., 6: 187-192
Hensley, D.W., Lawhon, J.T., Cater, CM. and Mattil, K.F. (1977) A study of factors
affecting membrane performance during processing of cottonseed protein extracts by
ultrafiltration, J. Food Sci, 42: 812-820
Hermansson, A.M. (1975) Functional properties of proteins for foods-flow properties. J.
Texture Stud., 5:425-439
Hermansson, A.M. (1973) Determination of functional properties of protein foods, in
Protein in Human Nutrition, Porter, J.W.G. and Rolls, B.A. (Eds), Academic Press, London
407-420
Hermansson, A.M. and Akesson, C. (1975) Functional properties of added proteins
correlated with properties of meat systems. 1. Effect of concentration and temperature on
water-binding properties of model meat systems, J. Food Sci, 40: 595-602
Hermansson, A.M. and Akesson, C. (1975) Functional properties of added proteins
correlated with properties of meat systems. 2. Effect of sah on water-binding properties of
model meat systems, J. Food Sci, 40: 603-610
Hermansson, A.M., Olsson, D. and Holmberg, B. (1974) Functional properties of proteins
for foods-modification studies on rapeseed protein concentrate, Lebensm. Wiss, Technol, 7:
176-181
Hill, L.P. and Patterson, M.G. (1989) Handling, shipping and store of oilseeds and meals to
meet worid market quality requirements, in Proceedings of world congress on vegetable
protein utilization in human foods and animal feedstuffs. Am. Oil Chem. Soc, 31-36
Honesty, R. C. and Rogers, D. E. (1990) The formation and properties of wheat flour
doughs, CRC Food Sci and Nutr., 29: 73-93
Howell, N.K. and Lawrie, R.A. (1987) Functional aspects of blood plasma protein V.
Viscosity, Int. J. Food Sci. Technol, 22: 145-151
Hsu, K.H. (1983) A diflaasion model with a concentration dependent diffusion coefficient for
describing water movement in legumes during soaking, J. Food Sci, 48: 618-645
280
Huang, F. and Rha, C.K. (1971) Rheological properties of smgle ceU protein concentrate:
Dope formation and its flow behaviour, J. Food Sci, 13: 1131-1134
Huang, F. and Rha, C.K. (1978) Formation of the single ceU protein filament with
hydrocoUoids, J. Food Sci, 43: 180-186
Huda, A.K.S. and Virmani, S.M. (1984) Agroclimatic environment of chickpea and piggeonpea,
m Adaptation of chickpea and pigeonpea to abiotic stresses, ICRISAT, 15-32
Hudson, B.J.F. (1979) The nutritional quality of lupinseed, Qual. Plant, 29: 245-251
Hulse, J.H. (1976) International Workshop on grain legumes, ICRISAT
Hulse, J.H. (1991) Keynote address: Nature, composition and utiUzation of grain legumes,
in uses of tropical grain legumes. Proceeding of a consultants meeting, 27-30, March, 1989,
ICRISAT Center, India, 11-30
Hung, V.T., Hudson, P.D., Amenta, V.C, Kyle, W.S.A. and Yu, S.T.R., (1987) Content
and distribution of manganese in lupin seed grown in Victoria and in lupin flour, spray-dried
powder and protein isolate prepared from the seeds, J. Sci. Food Agric, 41: 131-139
Hung, V.T., Hudson, P.D., Amenta, V.C, Kyle, W.S.A. and Yu, S.T.R., (1988) Mineral
composition and distribution in lupin seeds and in flour, spray dried powder and protein
isolate produced from the seeds, J. Sci. Food Agric, 45: 145-154
Hung, T.V., Kyle, W.S.A. and Yu, S.T.R. (1986) Incorporation of Lupin in soybean curd
production, ASEAN Food I , 2:37
Hung, T.V., Kyle, W.S.A. and Yu, S.T.R. (1988) Rapid estimation of protein in soy
beverage by Infrared spectroscopy, ASEAN Food!, 4:65-55
Hung, T.V., Liu, L.H., Black, R.G. and TrewheUa, M.A. (1993) Water absorption in
chickpea (C. arietinum) and field pea {P. sativum) cuUivars using the Peleg model, J. Food
Sci, 58: 848-852
Hung, T.V. and Nithianandan, N. (1993) Preparation and evaluation of noodles
supplemented with chickpea and lupin flours, ASEAN Food J., 8: 26-31
281
Hussein, L., Gabrial, G.N. and Morcos, S.R. (1974) Nutritional value of mixtures of baladi
bread and broad beans, J. Sci. Food Agric, 25: 1433-1440
Ibrahiem, N.A., Fahmy, A.H., Khairy, M., Morsi, S. and Hassas, S.A. (1986) The
production of protein isolates from some cereals and legumes, Egypt. J. Food Sci, 14: 421-
428
Ihekoronye, A.I. (1987) Nutritional quality of acid-precipitated protein concentrate from the
Nigerian 'red skin' groundnut {ArachisHypogaeaL), J. Sci. Food Agric, 38: 49-55
Ishino, K. and Okamoto, S. (1975) Molecular interaction in alkali denatured soybean
proteins, Cereal Chem., 52: 9-21
Ismond, M.A.H., Murray E.D. and Arntfield, S.D. (1986) The role of non-covalent forces in
miceUe formation by vicilin from Vicia faba. The effect of pH, Food Chem., 20: 305-308
Ituen, E.U.U., Mittal, J.P. and Adeoti, J.S. (1985) Water absorption in cereal grains and Us
effects on their mpture stress, J. Food Proc Eng., 8: 147-158
Jadhav, S.J., Reddy, N.R. and Desphande, S.S. (1989) Polyphenols, in Handbook of World
Food Legumes: Nutrition, Chemistry, Processing Technology and Utilisation, Salumkhe,
D.K. and Kadam, S.S. (Eds), CRC Press, 144-162
Jaffe, W.G. (1980) Hemagglutimins, in Toxic constituents of plant foodstuffs, Liener, I.E.
(Ed), Appl. Sci, NY, USA, 73-91
Jambunathan, R. and Singh, U. (1981) Studies on Desi and Kabuh chickpea {Cicer
arietinum L.) cultivars. 3. Mineral and trace element composition, J. Agric. Food Chem,, 29:
1091-1093
Jaya, T.V. and Venkataraman, L.V. (1979) Effect of germination on the supplementary value of
chickpea and greengram protein to those of rice and wheat, Nutr. Int. Report, 19: 777-783
Johnson, E.A. and Brekke, CJ. (1983) Functional properties of acylated protein isolates, J,
Food Sci, 48: 722-725
Johnson, D.W. and Kikuchi, S. (1989) Processing for Producing Soy Protein Isolates, in
Proceedings of world congress on vegetable protein utilization in human foods and animal
feedstuffs, Applewhite, T.H. (Ed), Am. OU Chem. Soc, Illinois, USA, 66-77
282
Jones, L.J. and Tung, M.A. (1983) Functional properties of modified oilseed protein
concentrates and isolates. Can. Inst. Food Sci. Technol. J., 16: 57-62
KabimUah, M., Ahmed, R. and Faraque, 0. (1976) Studies on the preparation of protein
rich infant / children food using cereals and legumes, Bangladeh J. Sci. Ind. Res., 11: 14-20
KabimUah, M. and WiUs, R.B.H. (1982) Functional properties of acetylated and
succinylated sunflower protein isolate, J. Food Technol, 17: 235-249
Kakade, M.L. (1974) Biochemical basis for the differences in plant protein utUisation, J.
Agric. Food Chem., 22: 547-566
Karayiannis,-N.I. and MacGregor, J.T. (1976) Lysinoalanine content and biological effects
of alkah treated proteins, Am, Chem. Soc, Abstr. 172, AGFD 41
Kato, A. and Nakai, S. (1980) Hydrophobicity determined by a florescence probe method
and Us correlation with surface properties of proteins, Biochem. Biphys. Acta, 624, 13-18
KhalU, J.K. and Chughtai, M.I.D. (1984) Nutritional evaluation of wheat and maize breads
supplemented with a mixture of peanut-chickpea flour, Qual. Plant. Plant Foods Hum. Nutr.,
34: 285-296
Khan, M.A., Jacobsen, I. and Eggum, B.O. (1979) Nutritive value of some improved
varieties of legumes, J. Sci. Food Agric, 30: 395-400
Khan, M.N., Lawhon, J.T., Rooney, l.W. and Cater, CM. (1976) Bread baking properties
of cottonseed protein concentrates prepared from solvent-extracted glandless cottonseed
flour, Cereal Chem., 53: 388-396
Khan, M.N. and Rooney, L.M. (1977) Baking properties of oUseed flours-evaluation with a
short time dough system, Bakers Dig., 51: 43-44
Kim, C.S. and Walker, C.E. (1992) Changes in starch pasting properties due to sugars and
emulsifiers as determined by viscosity measurement, J. Food Sci, 57: 1009-1013
Kim, K.S. and Rhee, J.S. (1989) Effects of acetylation on physicochemical properties of 1 IS
soy protein, J. Food Biochem., 13: 187-199
283
Kim, K.S. and Rhee, J.S. (1989) Effect of acetylation on conformation of glycinin, Korean
J. Food Sci. Technol, 21: 714-720
Kim, K.S. and Rhee, J.S. (1990) Effect of acetylation of emulsifying properties of glycinin,
J. Agric. Food Chem., 38: 669-674
Kim, S.H. and KinseUa, J.E. (1985) Surface activity of food proteins: relationships between
surface pressure development, viscoelasticity of interfacial films and foam stabUity of bovine
semm albumin, J. Food Sci, 50:1526-1530
Kim, S.H. and Kinsella, J.E. (1987) Surface active properties of proteins: Effects of
progressive succinylation on film properties and foam stability of glycinin, J. Food Sci, 52:
1341-1352 ••
King, J., Aguirre, C. and Pablo, S. (1985) Functional properties of lupin protein isolates, J.
Food Sci, 50: 82-87
King, R.D. and Ashton, S.J. (1985) Effect of seed coat thickness and blanding on the water
absorption by soybeans, J. Food Technol, 20:505-509
KinseUa, J.E. (1976) Functional properties of proteins in foods: a survey, Crit. Rev. Food
Sci Nutr, 7:219-280
Kinsella, J.E. (1982) Relationships between stmcture and fianctional properties, in Food
Proteins, Fox, M. and London, J.J. (Eds), Appl. Sci, Essex, UK
KinseUa, J.E. (1984) Milk proteins: physicochemical and functional properties, CRC Crit.
Rev. in Food Sci. Nutr, 21: 197-262
KinseUa, J.E. and Shetty, K.J. (1979) Chemical midification for improving fiinctional
properties of plant and yeast proteins, in Functionality and Protein Structure, Pour-El, A.
(Ed), ACS Symposium Series, 92: 37
Klein, B.P. and Raidh, M.A. (1986) Use of field pea flours as protein supplements in foods,
AOCS Symposium Serie, 312:19-31
Kon, S. (1979) Effect of soaking temperature on cooking and nutritional quality of beans, J.
Food Sci, 44: 1329-1340
284
Kodagoda, L.P., Nakais, S. and Powrie, W.D. (1973) Some fiinctional properties of
rapeseed protein isolates and concentrates. Can. Inst. Food Sci. Technol. J., 6: 266-269
Konstance, R. and Strange, E. (1991) Solubility and viscous properties of casein and
caseinates, J. Food Sci, 56: 556-559
Kozlowska, H.J., Nowak, H. and Nowak, J. (1983) Characterisation of myrosinase in Polish
varieties of rapeseed, J. Sci. Food Agric, 34:1171-1178
Krause, W., Ludwig, E. and Schneider, H. (1984) In vitro digestibility of original and
modified protein isolate from field beans, Nahmng, 28: 889-894
Kumar, J., Gowda, C.L.L., Saxena, N.P., Sethi, S.C, Singh, U. and Sahrawat, K.L. (1983)
Effect of saUnity on protem content and seed size of chickpea (C arietinum L), Curr. Sci, 52:
82-83
Lagudah, E.S., O'Brien, L. and Halloran, L.M. (1988) Influence of gliadin composition and
high molecular weight subunits of glutenin on dough properties in an F3 population of a bread
wheat cross, J. Cereal Sci, 7: 33-42
Lahl, W.J. and Braun, S.D. (1994) Enzymatic production of protein hydrolysates for food
use. Food Technol, 10: 68-95
Lareo, L. and Bressani, F. (1982) Possible utiUsation of the water hyacinth in nutrition and
industry. Food Nutr. Bull, 4: 60-64
Lawhon, J.T. (1983) Method for processing protein from non binding oilseed by
ultrafiltration and solubiUzation, US Pat. 4, 420,425
Lawhon, J.T., Glass, R.W., Maniak, L.J. and Lusas, E.W. (1982) White-coloured protein
isolates from sunflower, processes and products. Food Technol, 36: 76-87
Lawhon, J.T., Lin, S.H.C., Cater, CM. and Mattil, K.F. (1975) Fractionation and recovery
of cottonseed whey constituents by ultrafiltration and reverse osmosis. Cereal Chem., 52: 34-
43
Lawhon, J.T., Lin S.H.C., Rooney, l.W., Cater, CM. and Mattil, K.F. (1974) Utilization of
cottonseed whey protein concentrates produced by ultrafiltation, J. Food Sci, 39: 183-187
285
Lawhon, J.T. and Lusas, E.W. (1984) New techniques in membrane processing of oUseeds,
Food Technol, 38: 97-106
Lawhon, J.T., Manak, L.T., Rhee, K.S. and Lusas, E.W. (1981) Combining aqueous
extraction and membrane isolation techniques to recover protein and oU from soybeans, J.
Food Sci, 46: 912-916
Lawhon, J.T., Rooney, L.W., Cater, CM. and Mattil, K.F. (1972) Evaluation of a protem
concentrate produced from glandless cottonseed flour by a wet extraction process, J. Food
Sci, 37:778-782
Lawrence, R.A. and Jelen, P. (1982) Formation of lysino-alanine in alkaline extracts of
chicken protein, J. Food Protec, 45:923-924
Lee, C.H. and Rha, C.K. (1979) Accelerated sedimentation test for the determination of
dispersion stability of protein isolates, J. Food Sci, 44: 419-424
Lefebvre, J. and Sherman, P. (1977) Rheological properties of aqueous sunflower protein
dispersions, J. Texture Stud., 8: 449-462
Liener, I.E. (1976) Legume toxins in relation to protein digestibility, J. Food Sci, 41: 1076-
1082
Liener, I.E. (1979) Significance for humans of biologically active factors in soybeans and
other food legumes, J. Am. OU Chem. Soc, 56: 121-129
Lin, M.J.Y. and Humbert, E.S. (1974) Certain functional properties of sunflower meal
products, J. Food Sci, 39: 368-370
Lindsay, G.W., Saunders, R.M. and Kohler, G.O. (1977) Protein concentrates from wheat
shorts, rice bran and soy flour by extraction with cheese wheys, J. Food Sci, 42: 1365-1369
Lipinski, E.S. and Lichfield, IH. (1974) Single ceU protein in perspective. Food Technol,
28: (5) 16-24, 40
Liu, L.H., Hung, T.V., Black, R. and TrewheUa, M.A. (1994) A study on solubility of grain
legume proteins by infrared spectroscopy, ASEAN Food J., 9:24-30
286
Liu, L'.H. and Hung, T.V. (1996) Flow properties of chickpea protems dispersions
(Submitted)
Liu, L.H. and Hung, T.V. (1996) Effects of succinylation on the flow properties of chickpea
protein dispersions (Submitted)
Livingstone, A.S., Feng, J.J. and Malleshi, N.G. (1993) Development and nutritional quality
evaluation of weaning foods based on malted, popped and roller dried wheat and chickpea.
Int. J. Food Sci. Technol, 28: 35-43
Loomis, W.D. and Battail, J. (1966) Plant phenolic compounds and the isolation of plant
enzymes, Photochem., 5: 423-428
Lopez de Ogara, M.C, Delgado de Layno, M., Pilosof, A.M. and Macchi, R.A. (1992)
Functional properties of soy protein isolates as affected by heat treatment during isoelectric
precipitation, J. Am. OU Chem. Soc, 69: 184-187
Lorimer, N.L., Zabik, M.E., Harte, J.B., Stachiw, N.C. and Uebersax, M.A. (1991) Navy
bean flour fractions in composite flour: effect of bean grade on rheology parameters and
microstmcture of wheat dough. Cereal Chem., 68: 636-641
Lucas, E.W. (1985) Seed storage proteins, in New Protein Foods, Altschul, A,A. and
WUcke, H.E. (Eds), Academic Press Inc., New York, 394-418
Lusas, E.W. and Jividen, G.M. (1987) Glandless cottonseed: A review of the first 25 years
of processing and utilising research, J. Am. Oil Chem. Soc, 64: 839-854
Lusas, E.W. and Jividen, G.M. (1987) Characteristics and uses of glandless cottonseed food
protein ingredients, J. Am. OU Chem. Soc, 64: 973-986
Ludwig, I. and Ludwig, E. (1985) Emulsifying behaviour of enzymically modified faba
bean protein isolate, Nahmng, 29: 949-955
Luz-Fermandez, M. and Berry, J.W. (1987) Characteristics of a chocolate beverage from
germinated chickpeas, J. Food Sci, 52: 726-728
Lyon, C.K., Kohler, G.O. and Hanamoto, M.M. (1982) Lipid-protein complexes from
safflower expeUer cake, J. Am. OU Chem. Soc, 59: 119-122
287
Ma, C.Y. (1993) Flow properties of oat protein dispersions, I Texture Stud., 24: 311-323
Ma, C. Y. (1984) Functional properites of acetylated oat protein, J. Food Sci, 49: 1128-
1131
Ma, C.Y. and Wood, D.F. (1987) Functional properties of oat proteins modified by
acylation, trypsin hydrolysis or linoleate treatment, J. Am. Oil Chem. Soc, 64: 1726-1731
Madsen, R.F. and Buchjberg, E. (1987) Production of improved isolate derived from seeds
of grain legume, Eur. Patent Application, EP 02238946A2
Manrique, J. and Thomas, M.A. (1976) The effect of lupin protein isolation procedures on
the emulsifying and water binding capacity of a meat protein system, J. Food Technol, 11:
409-422
Markley, M.C. and BaUey, C.H. (1938) The coUoidal behaviour of flour dough II, A study
of the effects of varying the flour water ratio. Cereal Chem., 15: 317-319
Martinez, W.H., Berardi, L.C. and Goldbalatt, L.A. (1969) Cottonseed protein products-
composition and functionality. Am. Chem. Soc, Abstr. 158, AGFD 2
Martinez, W.H. and Hopkins, D.T. (1974) Cottonseed protein products: variation in protein
quality with product and process. Am. Chem. Soc, Abstr. 168, AGFD 3
Matheis, G. and Whitetaker, J.R. (1984) Chemical phosphorylation of food proteins: an
overview and a prospectus, J. Agric. Food Chem., 32: 699-705
Mathew, S.P. and Pellett, P.L. (1986) Protein quality of homemade weaning food mixtures
I. Biological evaluation and quality. Ecology Food Nutr., 19: 31-40
Matsuo, R.R., Bradley, J.W. and Irvine, G.N. (1972) Effect of protein content on the
cooking quality of spaghetti. Cereal Chem., 49:707-711
Matthews, R.H., Sharpe, E.J. and Clark, W.M. (1970) The use of some oilseed flours in
bread, Cereal Chem., 47: 181-189
McElwain, M.P., Richardson, R. and Amundson, C.H. (1975) Some functional properties of
succinylated single cell protein concentrate, J. Milk Food Technol, 38: 521-526
288
McLean, A. (1941) Extraction ofprotein from peanuts, US Pat. 2: 230, 624
McPherson, A.V. and Kitchen, B.V. (1981) The proteins and lipids of the equeous phase of
butter, Aus. J. Dairy Technol, 36: 17-20
McWatters, K.H. (1982) Peanut and cowpea meals as a replacement for wheat flour in cake-
type dough nuts, Peanut Sci, 9: 46-50
McWatters, K.H., Cherry, J.P. and Holmes, M.R. (1976) Influence of suspension medium
and pH on functional and protein properties of defatted peanut meal, J. Agric. Food Chem.,
24:517-523
McWatters, K.H. and Holmes, M.R. (1979) SaU concentration, pH, and flour concentration
effects on nitrogen solubUity and emulsifying properties of peanut flour, J. Food Sci, 44:
765-781
Megen Van, W.H. (1974) Solubility behaviour of soybean globulins as a function of pH and
ionic strength, J. Agric. Food Chem., 22: 126-129
Mendoza-Martinez, A.M., Muscholik, G. and Sherman, P. (1988) Influence of acetylated
faba bean protein isolate on the rheological behaviour of oil/water emulsions, Nahmng, 32:
205-207
Meredith, P. (1970) Effect of amylases and metals on the pasting properties of wheat flour
determined by the amylograph and by Hagberg's, falling number method. Cereal Chem., 47:
483-491
Messinger, J.K., Rapnow, J.H., Zeece, M.G. and Anderson, R.L. (1987) Effect of partial
proteolysis and succinylation on fianctionality of com germ protein isolate, J. Food Sci, 52:
1620-1624
Mieth, G., Schwenke, K.D., Raab, B. and Bmckner, J. (1983) Review article rapeseed:
Constituents and protein products. Part I. Composition and properties of proteins and
glucosinolates, Nahmng, 27: 675-697
MiraviUe, R.J. (1972) The plant geneticist's contribution toward changing the lipid and
amino acid composition of cottonseed, J. Am. OU Chem. Soc, 49: 24-26
289
Mita, T. and Matsumoto, H. (1980) Flow properties of aqueous gluten and gluten methyl
ester dispersions. Cereal Chem., 58: 57-61
Mohamed, S., Johan, Z. and Bakar, J. (1989) Chickpea, mungbean, cowpea and peanuts as
substitutes for soybean curds. Int. J. Food Sci. Technol, 24: 385-394
Mohanty, B., MulvihiU, D.M. and Fox, P.F. (1988) Emulsifying and foaming properties of
acidic caseins and sodium caseinate. Food Chem., 28: 17-30
Morcos, S.R., Said, A.K., Gabrial, G.N. and Hady, N.A.E. (1983) Supplementary and
weaning foods for the Egyptian child, Nahmng, 27:295-304
Morr, CV. (1979) Conformation and fimctionality of milk proteins, in Functionally and
Protein Structure, Pour-El, A. (Ed), A.CS - Symposium Series, 92, Washington, DC, 65-79
Morr, CV. (1990) Whey protein fianctionality: current status and the need for improved
quality and fianctionality. In 'Proceedings of the dairy products technical conference', 69-71
Murray, D.R. and Roxburgh, CM. (1984) Amino acid composition of the seed albumins
from chickpea, J. Sci. Food Agric, 39: 893-896
Muschiolik, G. (1989) Faba bean protein as a functional component in food emulsions,
Assoc. Food Sci. and Technol, 234-241
Muschiolik, G., Maune, R., Schmandke, H., Schroedter, R., Petres, J,, Karpati, G,,
Kozlowska, H. and Robowsky, K.D. (1982) Processing of legume proteins for food use,
German, Democratic Rep. Pat. PD 155 133
Narayana, K. and Narasinga Rao, M.S. (1984) Effect of acetylation and succinylation on the
functional properties of winged bean {Psophocarpus tetragonolobus) flour, J. Food Sci, 49:
547-550
Nakai, S., Ho, L., Tung, M.A. and Quinn, J.R. (1980) Solubilization of rapeseed, soy,
sunflower protein isolates by surfactant and proteinase treatments. Can. Inst. Food Sci.
Technol I , 13: 14-22
Nakai, S. and Lichan, E. (1989) Effect of heating on protein functionality in Protein Quality
and Effects of Processing, PhiUips, R.D. and Finley, J.W. (Eds), Marcel-Dekker Inc, NY.
114-125
290
•
Nakai, S. and Powrie, W.D. (1981) Modification of proteins for functional and nutritional
improvements, in Cereals: A Renewable Resource, Pomeranz, Y. and Munck, A. (Eds), Am.
Assoc. Cereal Chem., St Paul, MN
Nene, Y.L. (1987) Overview of pulses research at ICR, SAT in adaptation of chickpea and
pigeon pea to Abiotic Stresses proceeding, ICRISAT, India, 7-12
NUecka, E., Raab, B. and Schwenke, K.D. (1986) Chemical modification of proteins. XII
Effect on succinylation of some physicochemical and functional properties of albumin fraction
from rapeseed {Brassica napus L.), Nahmng, 30: 975-985
Okezie, B.O. and Dobo, S.B. (1980) Rheological characteristics of winged bean composite
flours. Baker Digest., 54:35-41
OUku, J. and Rham, C.K. (1978) Gelatinisation of starch and wheat flour starch, Food
Chem., 3:293-317
Olsen, H.S. and Anderson, J.H.I. (1978) The estimation of vicine and convicine in fababeans
{Vicia Faba L.) and isolated faba bean products, J. Sci Agric, 29: 323-331
Olsen, H.S. and Adler-Nissen, J. (1979) Industrial production and application of a soluble
enzymatic hydrolyzate of soya protein, Process Biochem., 14:6-11
Oomah, B.D. and Bushuk, W. (1983) Characterisation of lupin proteins, J. Food Sci, 48:
38-41
Oram, P.A. (1992) Current status and future trends in supply and demand of cool season
food legumes, 2nd International Food legume research conference, Cairo
Padhye, V.W. and Salunkhe, D.K. (1979) Biochemical studies on black gram {Phaseolus
mungo L.) seeds: amino acid composition and subunit constitution of fractions of the
proteins, J. Food Sci, 44: 606-610
Palter, R., Lundin, R.E. and Haddom, W.F. (1972) A cathartic lignan glucoside isolated
from carthanius tinctorious, Phytochem., 11:2871-2874
Panozzo, J.F. and McCormick, K.M. (1993) The rapid viscoanalyser as a method of testing
for noodle quality in a wheat breeding programme, J. Cereal Sci, 17: 25-32
291
I
Panozzo, J.F., 0 ' Brien, L., MacRitchie, F. and Bekes, F. (1990) Baking quality of
Australian wheat cultivars varying in their free lipid composition, J. Cereal Sci, 11: 51-57
Paredes Lopez, O. and Ordorica Falomir, C. (1986) Production of safflower protein isolates:
composition, yield and protein quality, J. Food Sci. Agric, 37: 1097-1103
Paredes Lopez, O., Ordorica Falomir, C. and Olivares Vazquez, M.R. (1991) Chickpea
protein isolates: physicochemical, functional and nutritional characterization, J. Food Sci,
56: 726-729
Patel, K.M. and Johnson, J.A. (1975) Horsebean protein supplements in breadmakmg. II
Effect on physical dough properties, baking quality and amino acid composition. Cereal
Chem., 52: 791-800
Patterson, B.E. and Crandall, L.G. (1967) Amylograph vs falUng number values compared.
Cereal Sci. Today, 12: 332-339
Paulson, A.T. and Tung, M.A. (1987) Solubility, hydrophobicity and net charge of
succinylated canola protein isolate, J. Food Sci, 52: 1557-1569
Paulson, A.T. and Tung, M.A. (1988) Rheology and microstmcture of succinylated canola
protein isolate, J. Food Sci, 53: 821-825
Pavlova, L.A., Damshkaln, L.G. and Vainerman, E.S. (1991) Effect of acetylation on
rheological properties offish protein isolates during heating, Nahmng, 35: 53-59
Pearson, A.M., Spooner, M.E., Hegarty, G.R., Bratztez, L.J. and Merkel, R.A. (1965)
Emulsion capacity and stability of soy sodium caseinate, potassium caseinate and non fat dry
milk. Food Technol, 19: 1841-1849
Pearson, D. and Pertz, G.A. (1976) Technical note: Rapid method for the estimation of
protein in maize, Technol, 11:423-425
Peleg, M. (1988) An empirical model for the description of moisture sorption curves, J.
Food Sci, 53: 1216-1219
Petterson, D.S. and MacKintosh, J.B. (1994) The chemical composition and nutritive value
of Australian grain legumes. Grains Research and Development Corporation (GRDC)
Canberra, 18-19
292
PhiUips, L.G. and KinseUa, J.E. (1990) Effects of succinylation on B-lactoglobulin foammg
properties, J. Food Sci, 55: 1735-1739
Pimentel, D. and Pimentel, M. (1977) Food protein production: land energy and economics, m
Food Proteins, Whitaker, J. and Tannenbaum, S.R. (Eds), AVI, Connectient, USA, 542-553
Pimentel, D., Terhune, E.G., Dyson Hudson, R., Rochereau, S., Sanis, R., Smith, E.,
Dennan, D., Reifschneider, D. and Shepard, M. (1976) Environmental effects of land
degradation on food and energy resources, Sci, 194: 149-155
Plock, J. and Kessler, H.G. (1992) Whey protein preparations use as additives in sour milk
products, Lebensm. Milchwirtsch., 113:928-932
Pokharkar, S.M. and Suresh, P. (1991) Studies on the protein of mango kernel flour, J.
Fmits Vegetables nuts, 45: 17-21
PoUio, M.L., Resnik, S.L. and Chirife, J. (1987) Water sorption isotherms of soybean
varieties grown in Argentina, Int. J. Food Sci. Technol, 22: 335-338
Pompei, C. and Lucisano, M. (1976) Lupin {Lupinus Albus L) as a source ofprotein for
human nutrition. II Production of isolates by acid coagulation and by ultrafiltration
diafiltration, Lebensm. Wiss. Technol, 9: 338-344
Pomeranz, Y., Shogren, M.D., Bolte, L.C. and Finney, K.F. (1976) Functional properties of
dark hard and yellow hard red winter wheat. Baker Digest., 50: 35-40
Pomeranz, Y. (1988) Composition and functionality of wheat flour components, in Wheat:
chemistry and technology II., Pomeranz, Y. (Ed), 219-370
Pour El, A. (1981) Protein fianctionality: classification, definition and methodology. Am.
Chem. Soc. Symp. Ser, 147: 1-19
Pradipasena, P. and Rha, C. (1977) Pseodo plastic and rheopectic properties of a globular
protein (beta-lacto globulin) solution, J. Texture Stud., 8: 311-325
Prakash, V. and Narasinga Rao, M.S. (1986) Physical chemical properties of oU seed
proteins, CRC Crit. Rev. Biochem., 20: 265-363
293
Prave, P., Rymon Lipinski, G.W.V. and Sambeth, W. (1980) Nutrition, an interdisciplinary survey, Interdisciphnary Sci. Rev., 5; 6-23
Preston, K.R.and Hoseney, R.C. (1991) AppUcations of the extensigraph, in The
extensigraph handbook. Rasper, V.F. and Preston, K.R. (Eds), AACC, Minnesota, USA,
13-18
Pulkki, L.H. (1938) Particle size in relation to flour characteristics and starch cell of wheat. Cereal Chem., 15:749-765
Pushpamma, P. and Geervani, P. (1987) UtUization of chickpea, in The Chickpea, Saxena,
M.C. and Singh, K.B. (Eds), WalUngton, Oxon, U.K. CAB International, 357-381
RACI (1988) Cereal Chemistry Division, Official Testing Methods, Royal Australian
Chemical Institute, Melbourne Australia
Rahma, E.H. and Narasinga Rao, M.S. (1983) Effect of acetylation and succinylation of
cottonseed flour on Us fianctional properties, J. Agric. Food Chem., 31: 352-355
Ramanatham, G., Ran, L.H. and Urs, L.N. (1978) Emulsification properties of groundnut
protein, J. Food Sci, 43: 1270-1273
Ranhotra, G.S., Loave, R.J. and Lebmann, T.A. (1974) Breadmaking chartacteristics of
wheat flour fortified with various commercial soy protein products. Cereal Chem., 51: 629-
634
Rao, M.A. (1977) Rheology of liquid foods. A review, J, Texture Stud,, 8: 135-168
Rasper, V. (1982) Theoretical aspects of amylographology, in The amylograph handbook,
Shuey, W.C. and Tipples, K.H. (Eds), AACC, Minnesota, USA, 1-6
Reddy, N.R., Pierson, M.D., Sathe, S.K. and Salunkhe, D.K. (1982) Legume-based
fermented foods: their preparation and nutritional quality, CRC Crl Rev. Food Sci. Nutr.,
17: 335-370
Rha, C.K. (1978) Rheology of fluid foods. Food Technol, 77-82
294
Rhee, k.C. (1989) Determining and modifying protein functionality in Proceedings of the
worid congress on vegetable protein utilisation, in Human foods and animal feedstuffs,
Applewhite, T.H. (Ed), Am. OU Chem. Soc, U.S.A. 323-333
Rhee, K.C, Cater, CM. and Mattil, K.F. (1973) Aqueous process for pUot plant scale
production for peanut protein concentrate, J. Food Sci, 38: 126-128
Rhee, K.C, Cater, CM. and Mattil, K.F. (1972) Simultaneous recovery ofprotein and oU
from raw peanuts in an aqueous system, J. Food Sci, 37: 90-93
Rhee, K.C, Choi Y.R., Vega, M. and Ponce, J. (1986) Preparation of low free gossypol
and high avaUable lysine cottonseed / soybean blends, J. Food Sci, 51: 1242-1244
Richert, S.H. (1979) Physical chemical properties of whey protein foams, J. Agric. Food
Chem., 27: 665-68
Ring, S .G. (1985) Some studies on starch gelation. Starch, 37: 80-83
Robertson, N. H., Dixon, A., Nowers, J.H. and Brink, D.P.S. (1981) The influence of
lipolysis, pH and homogenisation on infra-red readings for fat, protein and lactose, S. Afr. J.
Dairy Technol, 13:3-7
Romana, G.L.D., Graham, G.G., Morales, E., Masea, E. and MacLean, Jr.W.C. (1983)
Protein quality and oil igestibility of lupinus mutabilis: metabolic studies in children, J. Nutr.,
113:773-778
Romero, J. and Ryan, D.S. (1978) Susceptibility of the major storage protein of the bean
{Phaseolus vulgari L), to in vitro enzymatic hydrolysis, J. Agric. Food Chem., 26: 784-788
Rossi, M., Germondari, I. and Casini, P. (1984) Comparison of chickpea cultivars: chemical
composition, nutritional evaluation and oligosaccharide content, J. Agric. Food Chem., 32:
811-814
Rossouw, J.E. (1989) Kwashiorkor in North America, J. Am. Clin. Nutr, 49:588-592
Rupela, OP. and Kumar Rao, J.V.D.K. (1984) Abiotic sti-ess and nitrogen fixation, ICRISAT,
India, 123-134
295
Ryu, (j.H., Neumann, P.E. and Walker, C.E. (1993) Pasting of wheat extmdates containmg
conventional baking ingredients, J. Food Sci, 58: 567-573
Sabir, M.A., Sosulski, F.W. and Kernan, J.A. (1974) PhenoUc constituents in sunflower
flour, J. Agric. Food Chem., 22: 572-574
Saini, H.S. and Knights, E.J. (1984) Chemical constitution of starch and oHgosaccharide
components of Desi and Kabuh chickpea (C. arietinum) seed types, J. Agric. Food Chem., 32:
940-44
Sanstedt, R.M. and Abbot, R. C. (1964) A comparison of methods for studying the course
of starch gelatinisation. Cereal SclToday, 9-13
Sathe, S.K., Destpande, S.S. and Salumkhe, D.K. (1982) Functional properties of lupin
seed {L Mutabilis) proteins and protein concentrates, J. Food Sci, 47: 491-497
Sathe, S.K., Deshpande, S.S. and Salunkhe, D.K. (1982) Functional properties of winged
bean {Psophocarpus tetragonolobus L. DC) proteins, J. Food Sci, 47: 503-509
Sathe, S.K., Iyer, V.I. and Salumkhe, D.K. (1981) Functional properties of the great
Northern Bean {Phaseolus Vulgaris L.) Proteins. Amino acid composition, in vitro
digestibility and application to cookies, J. Food Sci, 47: 8-15
Sathe, S.K., Ponte, J.G.Jr, Rangnekar, P. D. and Salunkhe, D.K. (1981) Effects of addition
of Great Northern bean flour and protein concentrates on rheological properties of dough
and baking quality of bread, Cereal Chem., 58: 97-100
Sato, Y. and Nakamura, R. (1977) Functional properties of acetylated and succinylated egg
white, Agric Biol Chem., 41:2163-2168
Sattlerlee, L.D., Zachariah, N.Y. and Levin, E. (1973) Utilization of beef and pork skin
hydrolysate as a binder or extender in sausage emulsions, J. Food Sci, 38: 268-270
Scanpellino, R.J., Danielczik, E. and Teitelbaum, CL. (1983) Method for producing
products enhanced with synthetic coffee grinder gas flavor, US Pat. 4378380
Schachtel, A.P. (1981) Effects of preparative processes on the composUion and fimctional
properties ofprotein preparation from Candida utilis, J. Food Sci. 46:377-382
296
I
Schlingmann, M., Faust, U. and Scharf, U. (1984) Bacterial proteins, in Developments in
Food Proteins (3), Hudson, B.J.F. (Ed), Elsevier Apphed Sci, UK, 139-173
Schmandke, H., Bikow, T.M., Belavtseva, E.M., Radsclmko, L.G., Maune, R., Schultz, M.,
Yagrinberg, V. and Tolstoguzov, V.B. (1981) Emulsifying behaviour of enzymically
modified faba bean protein isolate, Nahmng, 25:263-269
Schmidt, G. and Schmandke, H. (1987) On the viscosity behaviour of field bean protein
isolates in dependence on their degree of acetylation, Nahmng, 31: 809-815
Schmidt, G., Schmandke, H. and Schottel, R. (1986) Viscosity behaviour of vicia faba
protein isolates and their acetylated derivatives. Acta Alimentaria, 15: 175-186
Schneider, C, Schultz, M. and Schmandke, H. (1985) Preparation of broad bean {Vicia
faba L. minor) products. I. Broad bean protein isolates from seed flour and their acetylation
in the neutal pH range, Nahmng, 29: 786-791
Schneider, C. and Schmidt, G. (1990) Some viscosity characteristics of faba bean protein
isolates within a pH range relevent for foods, Nahmng, 34: 735-745
Schofield, J.D. and Booth, M.R. (1983) Wheat proteins and their technological significant,
in Development in Food Proteins, Hudson B.J.F, (Ed), Barking Essex Appl. Sci, UK, 1-65
Schroeder, H.E., Gibson, A.H. and Oram, R.N. (1988) Seed protein characterisation and
nitrogen fixation rates in the chickpea mutant hyprosola and Us parent, J. Sci. Food Agric,
44:31-41
Schut, J. (1976) Meat emulsions, in Food Emulsions, Friberg, S. (Ed), Marcel Dekker,
New York, 385-458
Schwenke, K.D., Anders, K., Junker, B., Schneider, C.H. (1991) Chemical and gel
electrophoretic characterization of acetylated faba bean protein isolates, Nahmng, 35: 759-
766
Schwenke, K.D., Kim, Y.H., Kroll, J., Lange, E and Mieth, G. (1991) Modification of low
molecular weight basic albumin fraction from rapeseed {Brassica napus L.) by acetylation. II
Selected functional properties, Nahmng, 35:293-301
297
Schwenke, K.D., Linow, K.J. and Zirwer, D. (1986) Modification of the ohgomenc
stmcture of US globulin from sunflower {Helianthus annuus L.) and rapeseed (Brassica
napus L.) by succinylation, Nahmng, 30: 263-270
Schwenke, K.D., Mothes, R., Raab, B., Rawel, H. and Gueguen, J. (1993) Selected
physico-chemical properties of succinylated legumin from pea {Pisum satinum L),
Nahmng, 37:519-527
Schwenke, K.D., Prahl, L., Danilenko, A.N., Grinberg, V.J. and Tolstoguzov, V.B. (1990)
Continuous conformational change in succinylated faba bean protein isolates, Nahmng, 34:
399-401
SchwerUce, K.D., Prahl, L., Rauschal, E., Gwiazda, S., Dabrowski, K. and Rutkowski, A.
(1981) Functional properties of plant proteins. II Selected physico-chemical properties of
native and denatured isolates from faba beans, soy beans and sunflower seed, Nahmng, 25:
59-69
Schwenke, K.D., Prahl, L., Raab, B., Robowski K.D., Dabrowsky, K., Kocon, J. and
Rutkowski, A. (1983) Functional properties of plant proteins. Ill Influence of denaturing
processing conditions on the properties of protein isolates from faba-beans, Nahmng, 27:
79-93
Schwenke, K.D. and Rauschal, E.J. (1983) Functional properties of plant proteins. VI Some
functional properties of succincylated protein isolates from sunflower seed {Helianthus
annuusL), Nahmng, 27: 1015-1024
Schwenke, K.D. and Rauschal, E.J. (1980) Effect of succinylation on the physical chemical
properties of some food proteins, Nahmng, 24: 593-595
Schwenke, K.D., Rauschal, E., Linow, K.J. and Paehtz, W. (1981) Chemical modification
of proteins. VII. Effect of succinylation on some physico-chemical and functional properties
of casein, Nahmng, 25: 201-212
Schwenke, K.D., Zirwer, D., Cast, K., Goemitz, E., Linow, K.J. and Gueguen, J. (1990)
Changes of the oligomeric stmcture of legumin from pea {Pisum sativum L.) after
succinylation, Eur. J. Biochem., 194: 621-627
Sefa-Dedeh, S. and Stanley, D. W. (1979) The relationship of microstmcture of cowpeas to
water absorption and dehuUing properties. Cereal Chem., 56: 379-86
298
Sefa-Dedeh, S., Stanley, D.W. and Voisey, P.W. (1978) Effects of soaking time and
cooking conditions on texture and microstmcture of cowpeas {Vigna unguiculata), J. Food
Sci, 43: 1832-1838
Sharma, S., Kumar, R. and Malik, CP. (1986) Salt stress mduced changes in protein degradation
and proteolytic activity in germinating chickpea (C. arietinum L.) seeds. Legume Res., 9: 91-96
Sheen, S.J. (1991) Effects of succinylation on molecular and functional properties of soluble
tobacco leaf proteins, J. Agric. Food .Chem., 39: 1070-1074
Shibasaki, K., ICimura, Y. and Okubo, K. (1969) Food chemical studies on soybean
proteins. VI The viscotic behaviour of urea denatured protein, Nippon Shokuhin Kogyo
gakkaishi, 16: 298-303
Shiraishi, H., Okuda, K., Sato, Y,, Yamaoka, N. and Tuzimura, K. (1973) Taste of prohne-
containing peptides, Agric. Bio. Chem., 37: 2427-2428
Shuey, W.C. and Gilles, K.A. (1964) Evaluation of dumm wheat and dumm products I
Studies on semolina and macaroni with the amylograph. Cereal Chem., 41:32-38
Shyama Sundar, R. and Rajagopal Rao, D. (1978) Functional properties of native and
acylated peanut proteins prepared by different methods, Lebensm. Wiss. Technol, 11: 188-
191
Shyama Sundar, R. and Rajagopal Rao, D. (1982) Acetylated arachins fianctional
properties, Lebensm. Wiss. Technol, 15: 102-104
Silaula, S.M., Lorimer, N.L., Zabik, M.E. and Uebersax, M.A. (1989) Rheological and
sensory characteristics of bread flour and whole wheat flour dough and breads containing dry
roasted air classified pinto and navy bean high protein fractions. Cereal Chem., 66: 486-490
Simmons, R.G., Green, J.R., Payne, C.A., Wan, P.J. and Lucas, E.W. (1980) Cottonseed
and soy protein ingredients in soft-serve frozen desserts, J. Food Sci, 45: 1505-1508
Simpson, A.D.F. (1983) Utihsation of Vica Faba L., in The Faba bean (Vica. Faba L),
Hebblethwaite, P.D. (Ed), Butterworths, London, 535-552
Singh, B.P.N, and Kulshrestha, S.P. (1987) Kinetics of water sorption by soybean and
pigeon pea grains, J. Food Sci, 52: 1538-1541
299
Singh, "K.B., Bejiga, G., Malhotra, R.S. (1993) Environment Genotype Interactions for
protein content in chickpea, J. Sci. Food Agric, 63: 87-90
Singh, K.B., Williams, P.C. and Nakkoul, H. (1990) Influence of growing season, location and
planting time on some quahty parameters of Kabuh chickpea, J. Sci. Food Agric, 53: 429-441xx
Singh, K.D., Raju, S.M. and Jambunatham, R. (1981) Studies on Desi and Kabuki chickpea
(C. arietinum L.) cultivars. II Seed protein fraction and amino acid composition, J. Food
Sci. Technol, India, 18: 86-88
Singh, K.D., Rao, A.S., Singh, R. and Jambunathan, R. (1988) Amino acid composition of
storage proteins of a promising chickpea {Cicer arietinum L.) cultivar, J. Sci. Food Agric,
43:373-379:
Singh, N., Chauhan, G.S. and Bain, G.S. (1989) Effect of soy flour supplementation on the
quality of cooked noodles, Int. J. Food Sci. Technol, 24: 111-114
Singh, P.N. and Ram, H. (1990) Effect of phosphorous and sulphur apphcation on protem and
amino acid contents in chickpea, Indian J. Pulses Res., 3: 36-39
Singh, R.P. (1990) Status of chickpea in the world, ICN, June, 10-15
Singh, U. (1984) Dietary fibre and Us constituents in desi and kabuU chickpea (C. arietinum L.)
cultivars, Nutr. Report hit., 29: 419-426
Singh, U., Kummar, J. and Gowda, C.L.L. (1983) The protein content of chickpea (C
arietinum L.) grown at different locations, Qual. Plant Foods Hum. Nutr., 32: 179-184
Singh, U. and Jambunathan, R. (1981) Studies on Desi and KabuU chickpea {C. arietinum
L.) cultivars: levels of protease inhibUors, levels of polyphenoUc compounds and in vitro
digestibility, J. Food Sci, 46: 1364-1367
Singh, U. and Jambunathan, R. (1982) Distribution of seed protein factions and amino
acids in different anatomical parts of chickpea {Cicer arietinum L.) and pigeon pea {Cajamis
cajan L), Qual Plant Foods Hum. Nutt., 31: 347-354
Singh, U., Jambunathan, R. and Gurtu, S. (1981) Seed protein fractions and amino acid
composition of some wUd species of pigeon pea, J. Food Sci. and Technol, 18: 83-85
300
Singh, "U., Raju, S.M. and Jambunathan, R. (1981) Studies on Desi and Kabuh chickpea (C.
arietinum L.) cultivars. II Seed protein fractions and amino acid composition, J. Food Sci.
and Technol, 18: 86-88
Singh, U., Rao, A.S., Singh, R. and Jambunathan, R. (1988) Amino acid composition of
storage proteins of a promising chickpea {Cicer arietinum L.) cuUivar, J. Sci. Food Agric,
43:373-379
Sjaunta, L.O. and Schaar, J. (1984) Determination of casein in milk by infrared
spectrophotometry, Milchwissenschaft, 39: 288-289
Smith, A.K. and Circle, S.J. (1972) Soybeans: chemistry and technology. I. Proteins.
Connecticut; USA
Smith, A.K. and Nash, A.M. (1961) Water absorption of soybeans, J. Am. OU Chem. Soc,
38: 120-123
Sopade, P.A. and Obekpa, J.A. (1990) Modelling water absorption in soybean, cowpea and
peanuts at three temperatures using Peleg's equation, J. Food Sci, 55: 1084-87
Sosulski, F.W. (1962) The centrifuge method for determining flour adsorption in hard
spring wheats. Cereal Chem., 39: 344-350
Sosulski, F. W. (1979) Food uses of sunflower protein, J. Am. OU Chem. Soc, 56: 438-
442
Sosulski, F.W. (1983) Rapeseed protem for food use, in Developments in Food Proteins 2,
Hudson, B.J.F (Ed), AppUed Sci. PubUcation NY, 109-132
Sosulski, F.W. and Bakal, A. (1969) Isolated proteins from rapeseed, flax and sunflower
meals. Can. Inst. Food Sci. Technol. J., 2: 28-32
Sosulski, F.W., Chakraborty, P. and Humbert, E.S. (1978) Legume based imitation and
blended milk products, Can. Inst. Food Sci. Technol J., 11: 117-123
Sosulski, F.W. and Fleming, S.E. (1977) Chemical, functional, nutritional properties of
sunflower protein products, J. Am. OU Chem. Soc, 54: 100A-104A
301
Sosulslci, F.W. and Gadam, H.M. (1988) Variations in Hpid composition among chickpea
cultivars, J. Am. OU Chem. Soc, 65: 369-372
Sosulski, F.W., Humbert, E.S., Lin, M.J.Y. and Card, J.W. (1976) Functional properties of
rapeseed flours, concentrates and isolates, J. Food Sci, 41: 1349-1352
Sosulski, F.W. and Mahmoud, R.M. (1979) Effects ofprotein supplements on carbonyl
compounds and flavour in bread. Cereal Chem., 56; 533-536
Sosulski, F.W. and McCurdy, A.R. (1987) Functionality of flours, protein fractions and
isolates from field pea and faba bean, J. Food. Sci, 52: 1010-1014
Sosulski, F.W., Sabir, M.A. and Fleming, S.E. (1973) Continuous diffusion of chlorogenic
acid from sunflower kernels, J. Food Sci, 38: 468-470
Sosulski, F.W., Soliman, F.S. and Bhatty, R.S. (1972) Diffusion extraction of
glucosinolates from rapeseed. Can. Inst. Food Sci. Tech. J., 5: 101-104
Sotelo, M., Arenas, M.L. and Hermandez, M. (1987) UtUization of chickpeas {Cicer
arietinum L.) in non dairy infant formulars. I. Chemical composition and nutritive quality of
chickpeas and comparision with commercial infant formulas. Arch. Latinoam. Nutr., 37:
551-558
Sotelo, M., Hermandez, M., Larracilla, J., Arenas, M.L. and Palapa, E. (1987) Utilization
of chickpeas {Cicer arietinum L.) in non dairy infant formulars. II. Nitrogen balance in
children with intolerance to lactose, fed with a formula based on chickpea and a commercial
soybean. Arch. Latinoam. Nutr. 37: 468-479
Spies, R.D. and Hoseney, R.C. (1982) Effect of sugars gelatinisation. Cereal Chem., 59:
128-131
Spies, R. (1990) Apphcation of Rheology in the Bread Industry, in Dough Rheology and
Baked Product Texture, Faridi, H. and Faubion, J.M. (Eds), Van Nostrand Reinhold Book,
NY, USA, 343-362
Strange, E.D., Holsinger, V.H. and Kleyn, D.H. (1993) Chemical properties of thiolated
and succinylated caseins, J. Agric. Food Chem., 41: 30-36
302
1
Sumner, A.K., Nielsen, M.A. and Youngs, C.G. (1981) Production and evaluation of pea
protein isolate, J. Food Sci, 46: 364-372
Sumner, A.K., Whalley, L.L., Blankenagel, G. and Youngs, C.G. (1979) Stability studies on
pea flour, protein concentrate and starch. Can. Inst. Food Sci. Technol. J., 12: 51-55
Summerfield, R.J., Roberts, E.H. and Hadley, P. (1987) Photothermal effects on flowermg
in chickpea and other grain legumes, in Adaptation of chickpea and pigeon pea to abiotic
stresses, ICRISAT, India, 35-48
Sung, H.Y., Chen, H.J., Liu, T.Y. and Su, J.C. (1983) Improvement of the fianctionality of
soy protein by introduction of new thiol groups through a papain-catalyzed acetylation, J.
Food Sci, 48:708-711
Terrell, R.N., Swasdee, R.L., Wan, P.J. and Lusas, E.W. (1981) Cottonseed protein in
Frankfurts: Effect on pH, cured Ccolour and sensory and physical properties, J. Food Sci,
461: 845-849
Thompson, L.U. and Cho, Y.S. (1984) Effect of acylation upon extracabihty of nitrogen,
phytic acid and minerals in rapeseed flour and protein concentrates, J. Food Sci, 49: 771-
776
Thompson, L.U. and Reyes, E.S. (1980) Modification of heat coagulated whey protein
concentrates by succinylation, J. Dairy Sci, 63:715-721
Toft, G. and Openshaw, D.W. (1986) Process for the preparation of a snack food half
product, UK Pat. GB & 2, 166, 63 8 A
Tsutsui, T., Matsumoto, S. and Obara, T. (1980) Effect of acetylation on emulsifying
properties of egg yolk protein components, J. Japanese Soc. Food Sci. Technol, 27: 448-
452
Tu, M.C. (1978) The biochemical and nutritional properties of buffalo gourd seed protein
{Cucurbita foetidissima). Diss. Abs. Int. B, 39, 152
Tung, M.A. (1978) Rheology of protein dispersions, J. Texture Stud., 9: 3-31
Tung, M.A., Watson, E.L. and Richards, J.F. (1971) Rheology of egg albumen Trans,
ASAE, 14: 17-19
303
•
Turgeon, S.L., Gauthier, S.F. and Paquin, P. (1992) Emulsion properties of whey peptide
fractiona as a function of pH and ionic strength, J. Food Sci, 57: 601-604, 634
Tuse, D. (1984) Single ceU protem:current status and future prospects, CRC Cri. Rev. Food Sci
Nutr, 19:273-325
Tzeng, Y.M., Diosady, L.L. and Rubin, L.J. (1990) Production of canola protem materials by
alkalme extraction, precipUation and membrane processmg, J. Food Sci., 55: 1147-1156
Uebersax, M.A. and Ruengsakulrach, S. (1989) UtUization of dry field beans, peas and
lentils, in Proceedings of the World Congress on vegetable protein utilization in human food
and animal feedstuffs, Singapore, Oct. 1988, AOCS, Illinois, USA, 117-123
Ulloa, J.A., Valencia, M.E. and Garcia, Z.H. (1988) Protein concentrate from chickpea:
nutritive value of a protein concentrate from chickpea {Cicer arietinum) obtained by
ultrafiltration and its potential use in an infant formula, J. Food Sci, 53: 1396-1398
Urbanski, G.E., Wei, L.S., Nelson, AI. and Steinberg, M.P. (1982) Effect of solutes on
rheology of soy flour and its components, J. Food Sci, 47: 792-796
Uvin, P. (1994) The state of world hunger, Nutr Rev. 52: 151-161
Valencia, M.E., Troncoso, R. and Higuera, I. (1988) Linear programming formulation and
biological evaluation of chickpea-based infant foods. Cereal Chem., 65: 101-104
Valle, F.R., Escobedo, M., Ramos, P., Santiago-de, S., Becker, R., Bourges, H., Rhee, K.C,
Choi, Y.R., Vega, M. and Ponce, J. (1985) Evaluation of extmsion cooked cottonseed /
soybean blends of different proportions, J. Food Process. Preserv., 9:35-41
Valle, F.R., Escobedo, M., Ramos P., Santiago-de, S., Becker, R., Bourges, H., Rhee, K.C.,
Choi, Y.R., Vega, M., and Ponce, J. (1986) Preparationof low free gossypol and high avaUable
lysine cottonseed / soybean blends, J. Food Sci, 51: 1242-1244
Vananuvat, P. and KmseUa, J.E. (1975) Extraction of Protein, low in nucleic acid, from
saccharomyces fragiUs groAvn contmuously on cmde lactose, J. Agric. Food Chem., 23: 216-221
Vananuvat, P. and KmseUa, J.E. (1975) Some functional properties of protem isolates from
yeast, saccharomyces fragiUs, J. Agric. Food Chem., 23: 613-616
304
Van de Voort, F.R., Mills, B.L., Paquette, G.A. and Gmnfeld, E. (1986) QuantUative
aqueous ammonium ion analysis by transmission infrared spectroscopy, J. Assoc. Off. Anal.
Chem., 69: 924-928
Van de Voort, F.R. (1980) Evaluation of milkoscan 104 infrared milk analyser, J. Assoc.
Off. Anal. Chem., 63: 973-980
Van Etten, C.H., Daxenbichler, M.E. and Wolff, LA. (1969) Natural glucosinates
thioglucosides in foods and feeds, J. Agric Food Chem., 17: 483-491
Verma, M.M., Ledward, D.A. and Lawrie, R.A. (1984) UtUization of chickpea flour in
sausages, Meat Sci, 11: 109-121
Verma, M.M., Ledward, D.A. and Lawrie, R.A. (1984) Lipid oxidUion and metonyoglobin
formation in sausages containing chickpea flour. Meat Sci., 11: 171-189
Verma, M.M., Neale, R.J. and Ledward, D.A. (1985) Nutritional evaluation of sausages
containing chickpea flour (C. arietinum). Meat Sci,, 15:31-35
Vose, J,R., Basterrachea, M.J., Gorin, P.A,J., Finlayson, A.J. and Youngs, C.G. (1976) Ar
classification of fieldpeas and horsebean flours: Chemical studies of protein of starch and
protein fractions. Cereal Chem., 53: 928-936
Voutsinas, LP., Cheung, E. and Nakai, S. (1983) Relationships of hydrophobicity to
emulsifying properties of heat denatured proteins, J. Food Sci., 48: 26-32
Walker, C.E., Ross, AS., Wrigley, CM. and McMaster, G.J. (1988) Accelerated starch
paste characterisation wUh the rapid visco analyser. Cereal Foods Worid, 33: 491-493
Wagner, J.R. and Anon, M.C, (1990) Influence of denaturation, hydrophobicity and
sulfhydryl content on solubility and water absorption capacUy of soy protein isolates, J,
Food Sci,, 55: 765-770
Wasik, R,J. and Bushuk, W. (1975) Relation between molecular weight distribution of
endosperm protein and spaghetti-making quality of wheats, Cereal Chem., 52: 322-328
Waslien, CL, Calloway, D.H., Margen, S. and Costa, F. (1970) Uric acid levels in men fed
algae and yeast as protein sources, J. Food Sci, 35: 294-298
305
Wassimi, N.N., Hosfield, G.L. and Uebersax, M.A. (1988) Combining abihty of tannin
content and protein charateristics of raw and cooked dry beans. Crop Sci, 28: 452-458
Webb, N.B., Ivey, F.J., Craig, H.B., Jones, V.A. and Monroe, R.J. (1970) The
measurement of emulsifying capacity by electrical resistance, J. Food Sci, 35: 501-504
Weber, K. and Osborn, M.J. (1969) The reUability of molecular weight detemiinations of
sodium dodeycyl sulphate-polyacrylamide gel electrophoresis, J. Biol. Chem., 244: 4406-
4412
WiUiams, P.C. and Singh, U. (1987) The chickpea-nutritional quality and the evaluation of
quality in breeding programmes in The Chickpea, WaUingford, Oxon, UK. CAB
International, 329-356
Wills, R.B.H., KabimUah, M. and Heyhoe, T.C. (1984) Enrichment of biscuUs with
sunflower protein, Lebensm. Wiss. Technol, 17: 205-208
Wong, R.B.K. and Lelievre, J. (1982) Rheological characteristics of wheat starch pastes
measured under steady shear conditions, J. Appl. Polymer Sci, 27: 1433-1440
Wrigley, C.W. and Bietz, J.A. (1988) Proteins and amino acids, in Wheat Chemistry and
Technolog, Pomeranz, Y. (Ed), AACC Monograph series, Minnsota, USA, 159-275
Yamauchi, F., Ono, H., Kamata, Y. and Shibasaki, K. (1979) Acetylation of amino groups
and Us effect on the stmcture of soybean glycinin, Agric. Biol. Chem., 43: 1309-1315
Yanagi, S.O. (1983) Properties of winged bean {Psophocarpus tetragonolobus) proteins an
comparison with soy bean {glycine max) and commom bean {Phaseolus vulgari) proteins,
Agric. Biol. Chem., 47: 2273-2280
Yasunaga, T., Bushuk, W. and Irvine, G.N. (1968) Gelatinisation of starch during bread
baking. Cereal Chem., 45:269-279
Yoo, J.S.H. and Hsueh, AM. (1985) Amino acids fortification of defatted glandless
cottonseed flour, fortification of lysine, methionine, isolonine, Nutr, Rep. Int., 31: 157-163
Yoo, J.S.H. and Hsueh, A.M. (1985) Amino acids fortification of defatted glandless
cottonseed flour, lysine fortification, Nutr. Rep. Int., 31: 147-155
306
Yoon, J.O. (1980) Studies on the preparation of food proteins from castor bean protein,
Korean J. Food Sci. Technol, 12: 263-271
Yousseff, S.A.M., Salem, A. and Abdel-Rahman, A.H.Y. (1976) Supplementation of bread
with soybean and chickpea flours, I Food Technol, 11: 599-605
Youssef, M.M. and Bushuk, W. (1986) Breadmaking properties of composUe flours of
wheat and faba bean protein preparations. Cereal Chem., 63: 357-361
Yu, R.S.T., Kyle, W.S.A, Hung, T.V. and Zeckler, R. (1993) A study on the use of lupins
for bean sprout production, ASEAN Food J., 8:99-104
Zhu, H. and'Damodaran, S. (1994) Heat induced conformational changes in whey protein
isolate and its relation to foaming properties, J. Agric. Food Chem., 42: 846-855
Zimmermann, R. and Mieth, G. (1986) Selected modification of plant proteins and their
functionality regarding wheat dough rheology, Nahmng, 30:439-331
Zimmermann, R., Mieth, G. and Bmeckner, J. (1984) Addition of protein to dough,
German Democratic Rep. Pat. DD 216 611
307
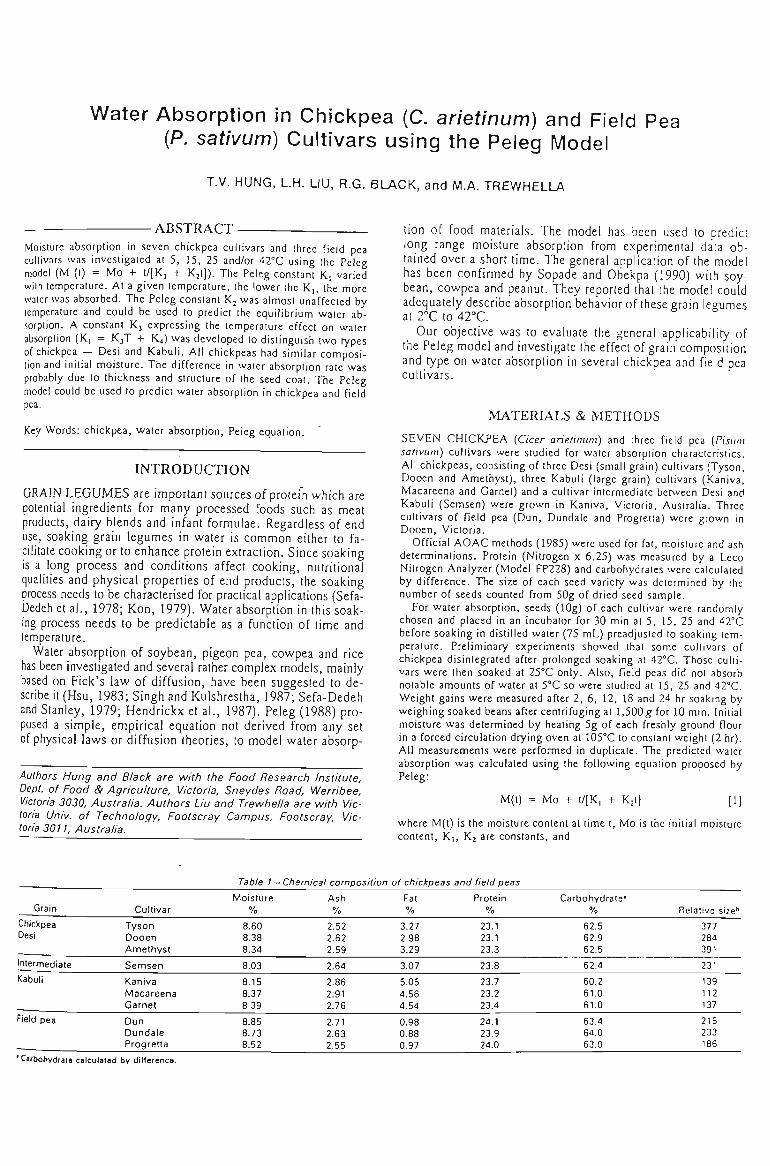
Water Absorption in Chickpea (C. arietinum) and Field Pea (P. sativum) Cultivars using the Peleg Model
T.V. HUNG, LH. LIU, R.G. BLACK, and M.A. TREWHELLA
ABSTRACT Moisture absorption in seven chickpea cultivars and three field pea cullivnrs was investigated at 5, 15, 25 and/or 42''C using the Peleg model (M (t) = Mo + t/[K, + Kjt]). The Peleg constant K, varied with temperature. At a given temperature, the lower the K,, the more water was absorbed. The Peleg constant Kj was almost unaffected by Icmperaturc and could be used to predict the equilibrium water ab-.sorption. A constant Kj expressing the temperature effect on water absorption (K, = KjT + ICi) was developed to distinguish two types of chickpea — Desi and Kabuli. Ail chickpeas had similar composition and initial moisture. The difference in water absorption rate was probably due to thickness and structure of the seed coat. The Peleg model could be used to predict water absorption in chickpea and field pea.
Key Words: chickpea, water absorption, Peleg equation.
INTRODUCTION
GRAIN LEGUMES are important sources ofprotein which are potential ingredients for many processed foods such as meat products, dairy blends and infant formulae. Regardless of end use, soaking grain legumes in water is common either to facilitate cooking or to enhance protein extraction. Since soaking is a long process and conditions affect cooking, nutritional qualities and physical properties of end products, the soaking process needs to be characterised for practical applications (Sefa-Dedeh et al., 1978; Kon, 1979). Water absorption in this soaking process needs to be predictable as a function of time and temperature.
Water absorption of soybean, pigeon pea, cowpea and rice has been investigated and several rather complex models, mainly based on Pick's law of diffusion, have been suggested to describe it (Hsu, 1983; Singh and Kulshrestha, 1987; Sefa-Dedeh and Stanley, 1979; Hendrickx et al., 1987). Peleg (1988) proposed a simple, empirical equation not derived from any set of physical laws or diffusion theories, to model water absorp-
Authors Hung and Black are with the Food Research Institute, Dept. of Food & Agriculture, Victoria, Sneydes Road, Werribee, Victoria 3030, Australia. Authors Liu and Trewhella are with Victoria Univ. of Technology, Footscray Campus, Footscray, Victoria 3011, Australia.
tion of food materials. The model has been used to predict long range moisture absorption from experimental data obtained over a short time. The general application of the model has been confirmed by Sopade and Obekpa (1990) with soybean, cowpea and peanut. They reported that the model could adequately describe absorption behavior of these grain legumes at 2°C to 4 2 ^ .
Our objective was to evaluate the general applicabiliry of the Peleg model and investigate the effect of grain composition and type on water absorption in several chickpea and field pea cultivars.
MATERIALS & METHODS
SEVEN CHICKPEA {Cicer arielinum) and three field pea [Pisum Sativum) cultivars were studied for water absorption characteristics. All chickpeas, consisting of three Desi (small grain) cultivars (Tyson, Dooen and Amethyst), three Kabuli (large grain) cultivars (Kaniva, Macareena and Garnet) and a cultivar intermediate between Desi and Kabuli (Semsen) were grown in Kaniva, Victoria, Australia. Three cultivars of field pea (Dun, Dundale and Progretta) were grown in Dooen, Victoria.
Official AOAC methods (1985) were used for fat, moisture and ash determinations. Protein (Nitrogen x 6.25) was measured by a Leco Nitrogen Analyzer (Model FP228) and carbohydrates were calculated by difference. The size of each seed variety was determined by the number of seeds counted from 50g of dried seed sample.
For water absorption, seeds (lOg) of each cultivar were randomly chosen and placed in an incubator for 30 min at 5, 15, 25 and 42°C before soaking in distilled water (75 mL) preadjusted to soaking temperature. Preliminary experiments showed that some cultivars of chickpea disintegrated after prolonged soaking at 42°C. Those cultivars were then soaked at 25°C only. Also, field peas did not absorb notable amounts of water at 5°C so were studied at 15, 25 and 42°C. Weight gains were measured after 2, 6, 12, 18 and 24 hr soaking by weighing soaked beans after centrifuging at l,500g for 10 min. Initial moisture was determined by heating 5g of each freshly ground flour in a forced circulation drying oven at 1G5°C lo constant weight (2 hr). All measurements were performed in duplicate. The predicted water absorption was calculated using the following equation proposed by Peleg:
M(t) = Mo + t/[K, + K2I] [1] where M(t) is the moisture content at time t. Mo is the initial moisture content, Ki, K2 are constants, and
Grain
Chiclcpea Desi
Intermediate
Kabuli
Field pea
Cultivar
Tyson Dooen Amethyst
Semsen
Kaniva Macareena Garnet
Dun Dundale Progretta
Table 1-
Moisture %
8.60 8.38 8.34
8.03
8.15 8.37 8.39
8.85 8.73 8.52
- Chemical composition of cfiickpeas
Ash %
2.52 2.62 2.59
2.64
2.86 2.91 2.76
2.71 2.63 2.55
Fat %
3.27 2.98 3.29
3.07
5.05 4.56 4.54
0.98 0.88 0.97
and field peas
Protein %
23.1 23.1 23.3
23.8
23.7 23.2 23.4
24.1 23.9 24.0
Carbohydrate* %
62.5 62.9 62.5
62.4
60.2 61.0 61.0
63.4 64.0 63.0
Relative size""
377 284 391
231
139 112 137
215 233 186
' Carbohydrate calculated by difference.
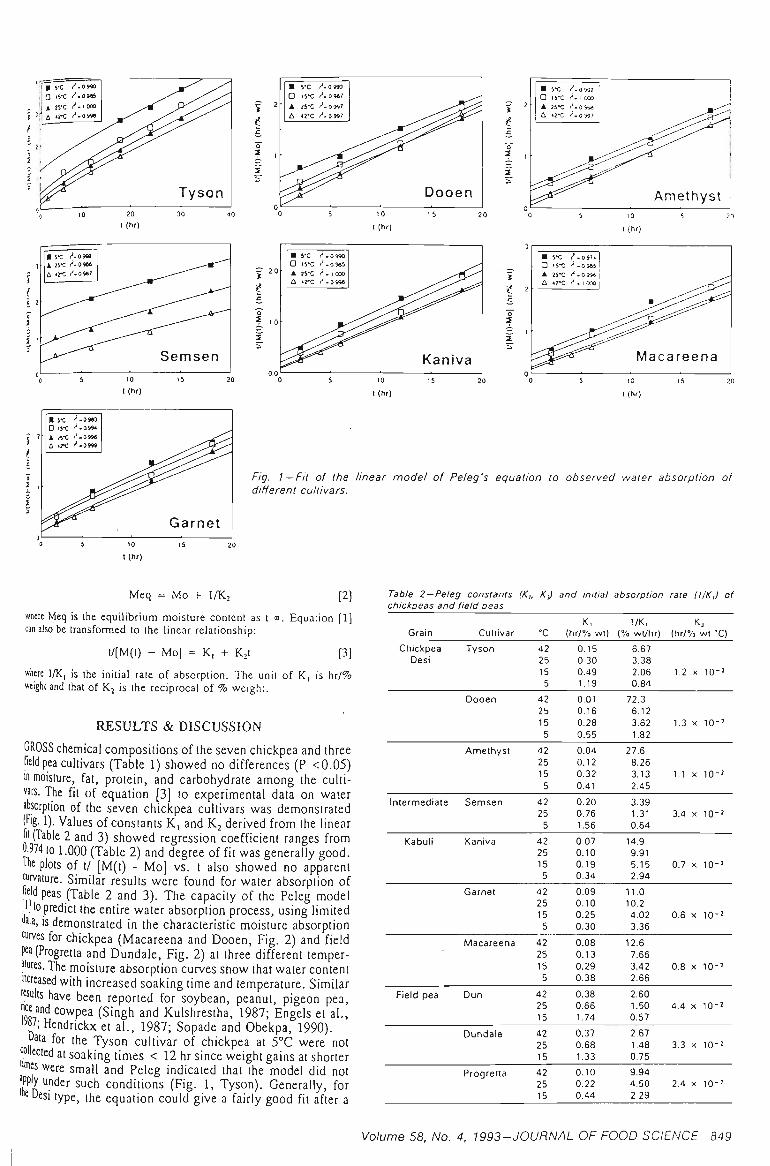
• is-c I'-oati 4 25-0 I'.IOOO
A ,rC r '.OSM
/^is Tyson 20
l (hr )
f
i 2S-C (".o.sae A <rc f.avn
Semsen 10
l ( h r )
• s-c I'.o.sm 0 IS'C r^-0.»4
• A 25*C f ' - o w e i 4rC r' . 0 9M
Garnet
• 5'C f ^ -0»3 a IS'C r^-OM?
• A 25'C f ' -0 997 A 42'C f^-0 997
Dooen 10
l (hr )
• 5'C i^-0 990 a 15'C f^-oges • 25'C <^- 1 000 A 42-C i^-0 99«
Kaniva 10
l (h r )
2 •
M 5'C 1^-0 974 D IS'C f ^ -0 985 • 25'C / ^ -0 9 « A 42^; 1 - I 000
Macareena
10
l (hr)
Fig. 1 — Fit ol the linear model of Peleg's equation to observed water absorption of different cultivars.
t (hr)
Meq = Mo + 1/Kj [2]
where Meq is the equilibrium moisture content as t :». Equation [1] can also be transformed to the linear relationship:
Table 2-Peleg constants (K,, KJ chickpeas and field peas
and initial absorption rate (UK,) of
t/[M(t) - Mo] = K, + K,t [3]
where 1/K, is the initial rate of absorption. The unit of Ki is hr/% weight and that of Kj is the reciprocal of % weight.
RESULTS & DISCUSSION
GROSS chemical compositions of the seven chickpea and three field pea cultivars (Table 1) showed no differences (P <0.05) in moisture, fat, protein, and carbohydrate among the cultivars. The fit of equation [3] to experimental data on water absorption of the seven chickpea cultivars was demonstrated (F'g. 1). Values of constants K, and K2 derived from the linear fit (Table 2 and 3) showed regression coefficient ranges from 0-574 to 1.000 (Table 2) and degree of fit was generally good. iiie plots of t/ [M(t) - Mo] vs. t also showed no apparent curvature. Similar results were found for water absorption of field peas (Table 2 and 3). The capacity of the Peleg model I'l to predict the entire water absorption process, using limited "3la> is demonstrated in the characteristic moisture absorption curves for chickpea (Macareena and Dooen, Fig. 2) and field pea (Progretta and Dundale, Fig. 2) at three different temper-lures. The moisture absorption curves show that water content
increased with increased soaking time and temperature. Similar fesulls have been reported for soybean, peanut, pigeon pea, nee and cowpea (Singh and Kulshrestha, 1987; Engels et al., '« ' ; Hendrickx et al., 1987; Sopade and Obekpa, 1990).
•j ata for the Tyson cultivar of chickpea at 5°C were not 'illected at soaking times < 12 hr since weight gains at shorter '""« were small and Peleg indicated that the model did not W under such conditions (Fig. 1, Tyson). Generally, for ' Desi tjrpe, the equation could give a fairly good fit after a
Grain
Chickpea Desi
Intermediate
Kabuli
'
Field pea
Cultivar
Tyson
Dooen
Amethyst
Semsen
Kaniva
Garnet
Macareena
Dun
Dundale
Progretta
"C
42 25 15 5
42 25 15 5
42 25 15 5
42 25
5
42 25 15 5
42 25 15 5
42 25 15 5
42 25 15
42 25 15
42 25 15
K, (tir/Vo w i )
0.15 0.30 0.49 1.19
0.01 0.16 0.28 0.55
0.04 0.12 0.32 0.41
0.20 0.76 1.56
0.07 0.10 0.19 0.34
0.09 0.10 0.25 0.30
0.08 0.13 0.29 0.38
0.38 0.66 1.74
0.37 0.68 1.33
0.10 0.22 0.44
1/K, 1% wVhr)
6.67 3.38 2.06 0.84
72.3 6.12 3.62 1.82
27.6 8.26 3.13 2.45
3.39 1.31 0.64
14.9 9.91 5.15 2.94
11.0 10.2 4.02 3.36
12.6 7.66 3.42 2.66
2.60 1.50 0.57
2.67 1.48 0.75
9.94 4.50 2.29
K j
(hr/% wt "O
1.2 X 10⁻²
1.3 X 10⁻²
1.1 X 10⁻²
3.4 X 10⁻²
0.7 X 10⁻²
0.6 X 10⁻²
0.8 X 10⁻²
4.4 X 10⁻²
3.3 X 10⁻²
2.4 X 10⁻²
Volume 58. No. 4, 1993-JOURNAL OF FOOD SCIENCE-849
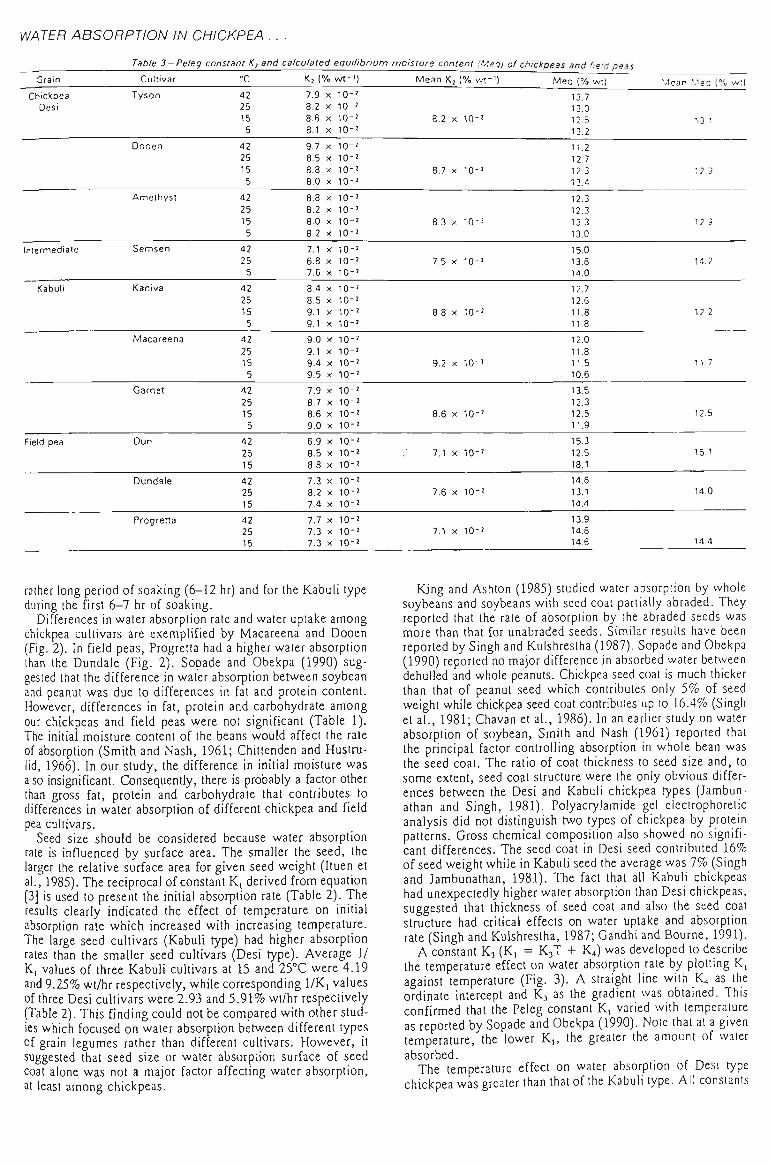
VMTER ABSORPTION IN CHICKPEA . . .
Table 3 —Peleg constant Kj and calculated equi
Grain Cultivar
Chickpea Desi
Tyson
Dooen
Kj (% wt-
42 25 15 5
7.9 X 10-8.2 X 10-8.6 X 10-8.1 X 10-
42 25 15 5
9.7 8.5
10-10-
8.8 X 10-8.0 X 10-
'brium moisture content (Meij) of chickpeas and field peas
Mean K, (% w t - ' ) Meq (% wt)
8.2 X 10-
3.7 X 10⁻²
13.7 13.0 12.5 13.2
11.2 12.7 12.3 13.4
Mean Mea {% wt)
13-1
12.9
Intermediate
Kabuli
Field pea
Amethyst
Semsen
Kaniva
Macareena
Garnet
Dun
Dundale
Progretta
42 25 15 5
42 25
5
42
25 15 5
42 25 15
5
42 25 15 5
42 25 15
42 25 15
42 25 15
8.8 8.2 8.0 8.2
7.1 6.8 7.6
8.4 8.5 9.1 9.1
9.0 9.1 9.4 9.5
7.9 8.7 8.6 9.0
6.9 8.5 8.8
7.3 8.2 7.4
7.7 7.3 7.3
X
X
X
X
X
X
X
X
X
X
X
X
X
X
X
X
X
X
X
X
X
X
X
X
X
X
X
X
10-10-10-10-
10-10-10-
10-10-10-10-
10-10-10-10-
10-10-10-10-
10-10-10-
10-10-10-
10-10-10-
8.3 X 10⁻²
7.5 X 10⁻²
2 8.8 X 10⁻²
' 9,2 X 10⁻²
2 8.6 X 10 -2
2 , 7.1 X 10 -2
2 7.6 X 10⁻²
2 7.1 X 10⁻²
12.3 12.3 13.3 13.0
15.0 13.6 14.0
12.7 12.6 11.8 11.8
12.0 11.8 11.5 10.6
13.5 12.3 12.5 11.9
15.3 12.5 18.1
14.6 13.1 14.4
13.9 14.6 14.6
12.9
14.2
12.2
11.7
12.5
15.1
14.0
14.4
rather long period of soaking (6-12 hr) and for the Kabuli type during the first 6-7 hr of soaking.
Differences in water absorption rate and water uptake among chickpea cultivars are exemplified by Macareena and Dooen (Fig. 2). In field peas, Progretta had a higher water absorption than the Dundale (Fig. 2). Sopade and Obekpa (1990) suggested that the difference in water absorption between soybean and peanut was due to differences in fat and protein content. However, differences in fat, protein and carbohydrate among our chickpeas and field peas were not significant (Table 1). The initial moisture content of the beans would affect the rate of absorption (Smith and Nash, 1961; Chittenden and Hustru-lid, 1966). In our study, the difference in initial moisture was also insignificant. Consequently, there is probably a factor other than gross fat, protein and carbohydrate that contributes to differences in water absorption of different chickpea and field pea cultivars.
Seed size should be considered because water absorption rate is influenced by surface area. The smaller the seed, the larger the relative surface area for given seed weight (Ituen et al., 1985). The reciprocal of constant Ki derived from equation [3] is used to present the initial absorption rate (Table 2). The results clearly indicated the effect of temperature on initial absorption rate which increased with increasing temperature. The large seed cultivars (Kabuli type) had higher absorption rates than the smaller seed cultivars (Desi type). Average 1/ K, values of three Kabuli cultivars at 15 and 25''C were 4.19 and 9.25% wt/hr respectively, while corresponding 1/K, values of three Desi cultivars were 2.93 and 5.91% wt/hr respectively (Table 2). This finding could not be compared with other studies which focused on water absorption between different types of grain legumes rather than different cultivars. However, it suggested that seed size or water absorption surface of seed coat alone was not a major factor affecting water absorption, at least among chickpeas.
King and Ashton (1985) studied water absorption by whole soybeans and soybeans with seed coat partially abraded. They reported that the rate of absorption by the abraded seeds was more than that for unabraded seeds. Similar results have been reported by Singh and Kulshrestha (1987). Sopade and Obekpa (1990) reported no major difference in absorbed water between dehulled and whole peanuts. Chickpea seed coat is much thicker than that of peanut seed which contributes only 5% of seed weight while chickpea seed coat contributes up to 16.4% (Singh et al., 1981; Chavan et al., 1986). In an earlier study on water absorption of soybean. Smith and Nash (1961) reported that the principal factor controlling absorption in whole bean was the seed coat. The ratio of coat thickness to seed size and, to some extent, seed coat structure were the only obvious differences between the Desi and Kabuli chickpea types (Jambunathan and Singh, 1981). Polyacrylamide gel electrophoretic analysis did not distinguish two types of chickpea by protein patterns. Gross chemical composition also showed no significant differences. The seed coat in Desi seed contributed 16% of seed weight while in Kabuli seed the average was 7% (Singh and Jambunathan, 1981). The fact that all Kabuli chickpeas had unexpectedly higher water absorption than Desi chickpeas, suggested that thickness of seed coat and also the seed coat structure had critical effects on water uptake and absorption rate (Singh and Kulshrestha, 1987; Gandhi and Bourne, 1991).
A constant K, (K, = KjT -f- K4) was developed to describe the temperature effect on water absorption rate by plotting Ki against temperature (Fig. 3). A straight line with K, as the ordinate intercept and K3 as the gradient was obtained. This confirmed that the Peleg constant K, varied with temperature as reported by Sopade and Obekpa (1990). Note that at a given temperature, the lower K„ the greater the amount of water absorbed.
The temperature effect on water absorption of Desi type chickpea was greater than that of the Kabuli type. All constants
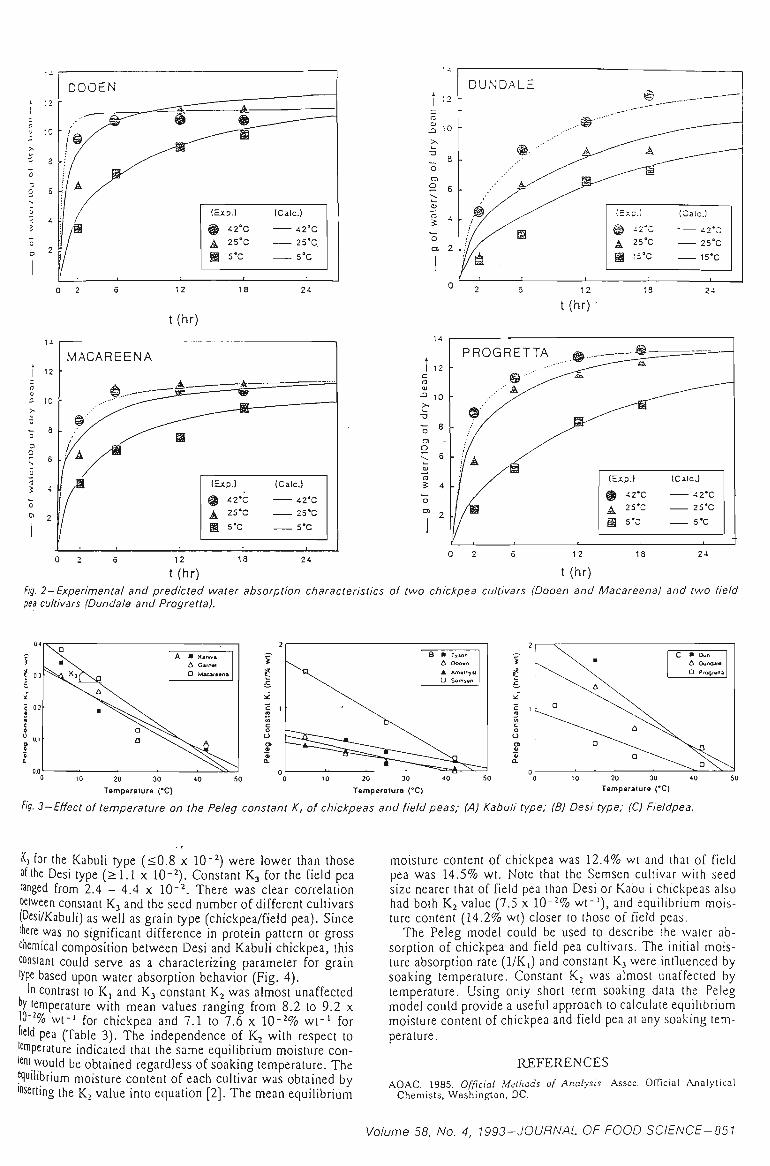
t(hr)
I 12
MACAREENA
(Eip.)
@ 42'C A 25'C M 5'C
(CalcJ
42'C 25'C
S'C
12 13 24-
10
•;; 8
S 4
PROGRETTA
(Exp.)
% <z'z A 25-C g S'C
(CilcJ
42'C 25'C 5'C
12
t (hr) t (hr) f/j. 2-Experimental and predicted water absorption characteristics of two chickpea cultivars (Dooen and Macareena) and two field pea cultivars (Dundale and Progretta).
' ^ x .
B • Tyion A Ooo«n A Amathyst a S«ms»n
20 30 Temperature ("C)
50 20 30 Temperature ("C)
\ . • C • Oun A Ounoai* Q Pfogtwia
~ ~~~-. ' - ' x ^ 0 10 20 30 40
Temperature {°C)
% 3-Effect of temperature on the Peleg constant K, of chickpeas and field peas; (A) Kabuli type; (B) Desi type; (C) Fieldpea.
Kj for the Kabuli type (<0.8 x 10"^) were lower than those of the Desi type (>1.1 x 10-^). Constant K3 for the field pea ranged from 2.4 - 4.4 x 10"^. There was clear correlation iietween constant K3 and the seed number of different cultivars (Desi/Kabuli) as well as grain type (chickpea/field pea). Since 'liere was no significant difference in protein pattern or gross chemical composition between Desi and Kabuli chickpea, this constant could serve as a characterizing parameter for grain type based upon water absorption behavior (Fig. 4).
In contrast to K, and K3 constant Kj was almost unaffected °y temperature with mean values ranging from 8.2 to 9.2 x 0-2% wt-' for chickpea and 7.1 to 7.6 x 10"^% wt" ' for
iield pea (Table 3). The independence of K2 with respect to 'stiperature indicated that the same equilibrium moisture con-N would be obtained regardless of soaking temperature. The ftliiilibrium moisture content of each cultivar was obtained by inserting the K, value into equation [2]. The mean equilibrium
moisture content of chickpea was 12.4% wt and that of field pea was 14.5% wt. Note that the Semsen cultivar with seed size nearer that of field pea than Desi or Kabuli chickpeas also had both K2 value (7.5 x 10-^% wt"'), and equilibrium moisture content (14.2% wt) closer to those of field peas.
The Peleg model could be used to describe the water absorption of chickpea and field pea cultivars. The initial moisture absorption rate (l/Kj) and constant K3 were influenced by soaking temperature. Constant Kj was almost unaffected by temperature. Using only short term soaking data the Peleg model could provide a useful approach to calculate equilibrium moisture content of chickpea and field pea at any soaking temperature.
REFERENCES
AOAC. 1985. Official .Methods of Analysis. Assoc. OfTicial Analytical Cheniists, Washington, DC.
Volume 58, No. 4, 1993-JOURNAL OF FOOD SCIENCE-851
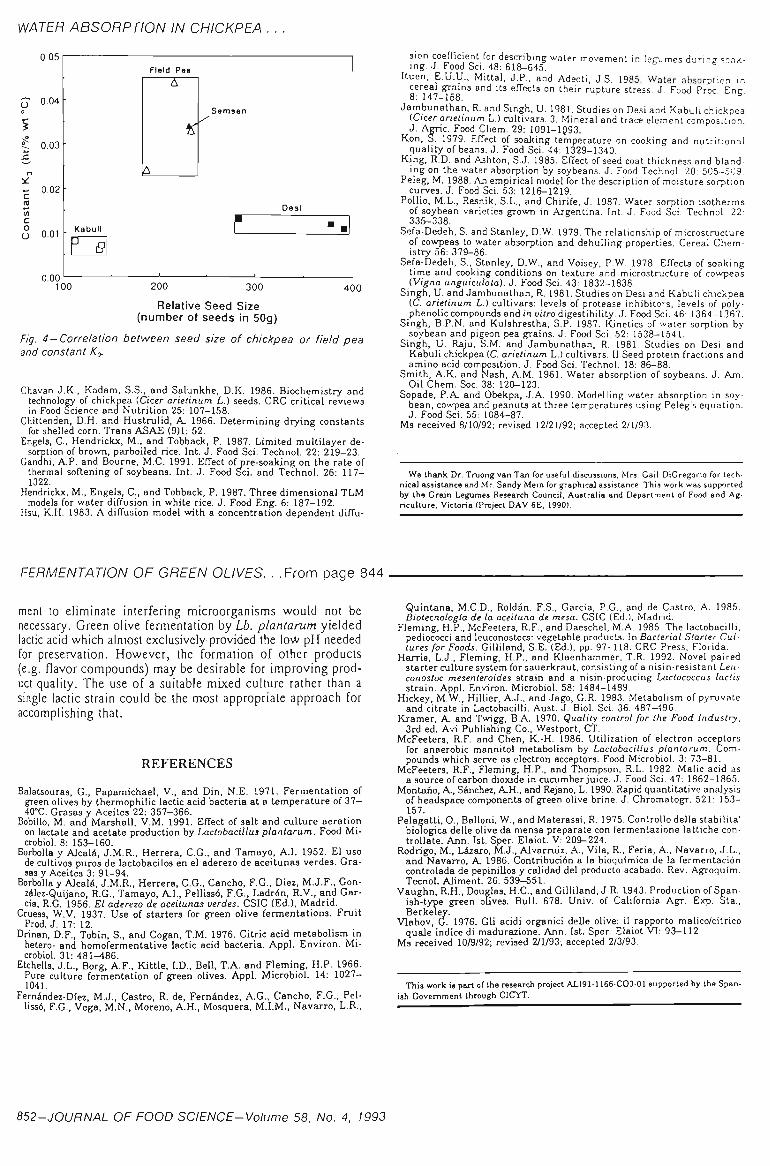
WATER ABSORPTION IN CHICKPEA .
0.05
0.04 •
0.03
- 0.02 c
c O 0.01
0.00
-
-
. Kabuli
^ 9
Field Pes
A
Semsen
A
r Desi
• •
100 200 300 400
Relative Seed Size (number of seeds in 50g)
Fig. 4-Correlation between seed size of chickpea or field pea and constant Kj.
Cliavan J.K., Kadam, S.S., and Salunkhe, D.K. 1986. Biochemistry and technology of chickpea {Cicer arietinum L.) seeds. CRC critical reviews in Food Science and Nutrition 25: 107-158.
Chittenden, D.H. and Hustnilid, A 1966, Determining drying constants for shelled corn. Trans ASAE (9)1: 52.
Engels, C, Hendrickx, M., and Tobback, P. 1987. Limited multilayer desorption of brown, parboiled rice. Int. J. Food Sci. Technol. 22: 219-23.
Gandhi, A.P. and Bourne, M.C. 1991. Effect of pre-soaking on the rate of thermal softening of soybeans. Int. J. Food Sci. and Technol. 26: 117-1322.
Hendrickx, M., Engels, C , and Tobback, P. 1987. Three dimensional TLM models for water diffusion in white rice. J. Food Eng. 6: 187-192.
Hsu, K.H. 1983. A diffusion model with a concentration dependent diffu
sion coefficient for describing water movement in legumes during sook-jng. J. Food Sci. 48: eiS-e-lS.
Ituen, E.U.U., Mittal, J.P., and Adeoti, J.S. 1985. Water absorption in cereal grams and its effects on their rupture stress. J. Food Proc Enc 8: 147-158.
Jambunathan, R. and Singh, U. 1981. Studies on Desi and Kabuli chickpea (Cicer arietinum L.) cultivars. 3. Mineral and trace element composition. J. Agric. Food Chem. 29: 1091-1093.
Kon, S. 1979. Effect of soaking temperature on cooking and nutritional quality of beans. J. Food Sci. 44: 1329-1340.
King, R.D. and Ashton, S.J. 1985. Effect of seed coat thickness and blanding on the water absorption by soybeans. J. Food Technol. 20: 505-509.
Peleg, M. 1988. An empirical model for the description of moisture sorption curves. J. Food Sci. 53: 1216-1219.
PoUio, M.L., Resnik, S.L., and Chirife, J. 1987. Water sorption isotherms of soybean varieties grown in Argentina. Int. J. Food Sci. Technol. 22: 33&-338.
Sefa-Dedeh, S. and Stanley, D.W. 1979. The relationship of microstructure of cowpeas to water absorption and dehuUing properties. Cereal Chemistry 56: 379-86.
Sefa-Dedeh, S., Stanley, D.W., and Voisey, P.W. 1978. Effects of soaking time and cooking conditions on texture and microstructure of cowpeas {Vigna unguiculata). J. Food Sci. 43: 1832-1838.
Singh, U. and Jambunathan, R. 1981. Studies on Desi and Kabuli chickpea (C. arietinum L.) cultivars: levels of protease inhibitors, levels of polyphenolic compounds and in ui'/ro digestibility. J. Food Sci. 46: 1364-1367.
Singh, B.P.N, and Kulshrestha, S.P. 1987. Kinetics of water sorption by soybean and pigeon pea grains. J. Food Sci. 52: 1538-1541.
Singh, U. Raju, S.M. and Jambunathan, R. 1981. Studies on Desi and Kabuli chickpea (C. arietinum L.) cultivars. II Seed protein fractions and amino acid composition. J. Food Sci. Technol. 18: 86-88.
Smith, A.K. and Nash, A.M. 1961. Water absorption of soybeans. J. Am. Oil Chem. Soc. 38: 120-123.
Sopade, P.A and Ot>ekpa, J.A. 1990. Modelling water absorption in soybean, cowpea and peanuts at three temperatures using Peleg's equation. J. Food Sci. 55: 1084-87.
Ms received 8/10/92; revised 12/21/92; accepted 2/1/93.
We thank Dr. Truong van Tan for useful discussions, Mrs. Gail DiCregorio for technical assistance and Mr. Sandy Mein for graphical assistance. This work was supported by the Grain Legumes Research Council, AustraUa and Department of Food and Agriculture. Victoria (Project DAV 6E, 1990).
FERMENTATION OF GREEN OLIVES. . .From page 844
ment to eliminate interfering microorganisms would not be necessary. Green olive fermentation by Lb. plantarum yielded lactic acid which almost exclusively provided the low pH needed for preservation. However, the formation of other products (e.g. flavor compounds) may be desirable for improving product quality. The use of a suitable mixed culture rather than a single lactic strain could be the most appropriate approach for accomplishing that.
REFERENCES
Balatsouras, G., Papamichael, V., and Din, N.E. 1971. Fermentation of green olives by thermophilic lactic acid bacteria at a temperature of 37 -40°C. Grasas y Aceites 22: 357-366.
Bobillo, M. and Marshall, V.M. 1991. Effect of salt and culture aeration on lactate and acetate production by Lactobacillus plantarum. Food Microbiol. 8: 153-160.
Borbolla y AlcaW, J.M.R., Herrera, C.G., and Tamayo, A.I. 1952. EI uso de cultivos puros de lactobacilos en el aderezo de aceitunas verdes. Grasas V Aceites 3* 91^94
Borbolla y Alcalfi, J.M.R., Herrera, C.G., Cancho, F.G., Diez, M.J.F., Gon-zAlez-Quijano, R.G., Tamayo, AI. . Pelli3s6, F.G., Ladr6n, RV., and Garcia, R.G. 1956. El aderezo de aceitunas verdes. CSIC (Ed.), Madrid.
Cniess, W.V. 1937. Use of starters for green olive fermentations. Fruit Prod. J. 17: 12.
Drinan, D.F., Tobin, S., and Cogan, T.M. 1976. Citric acid metalpolism in hetero- and homofermentative lactic acid bacteria. Appl. Environ. Microbiol. 31: 481-486.
Etchells, J.L., Borg, A.F., Kittle, I.D., Bell, T.A. and Fleming, H.P. 1966. Pure culture fermentation of green olives. Appl. Microbiol. 14: 1027-1041.
Fern4ndez-Dfez, M.J., Castro, R. de, Fernandez, A.G., Cancho, F.G., Pel-lissfi, F.G., Vega, M.N., Moreno, A.H., Mosquera, M.I.M., Navarro, L.R.,
Quintana, M.C.D., Roldan. F.S., Garcia, P.G., and de Castro, A. 1985. Biotecnologla de la aceituna de mesa. CSIC (Ed.), Madrid.
Fleming, H.P., McFeeters, R.F., and Daeschel, M.A. 1985. The lactobacilli, pediococci and leuconostocs: vegetable products. In Bacterial Starter Cultures for Foods. Gilliland, S.E. (Ed.), pp. 97-118. CRC Press, Florida.
Harris, L.J., Fleming, H.P., and Klaenhammer, TR. 1992. Novel paired starter culture system for sauerkraut, consisting of a nisin-resistant Leu-conostoc mesenteroides strain and a nisin-producing Lactococcus lactis strain. Appl. Environ. Microbiol. 58: 1484-1489.
Hickey, M.W., Hillier, A.J., and Jago, G.R. 1983. Metabolism of pyruvate and citrate in Lactobacilli. Aust. J. Biol. Sci. 36: 487-496.
Kramer, A. and Twigg, B.A. 1970. Quality control for the Food Industry, 3rd ed. Avi Publishing Co., Westport, CT.
McFeeters, R.F. and Chen, K.-H. 1986. Utilization of electron acceptors for anaerobic mannitol metabolism by Lactobacillus plantarum. Compounds which serve as electron acceptors. Food Microbiol. 3; 73-81.
McFeeters, R.F., Fleming, H.P., and Thompson, R.L. 1982. Malic acid as a source of carbon dioxide in cucumber juice. J. Food Sci. 47: 1862-1865.
Montailo, A, Sanchez, AH., and Rejano, L. 1990, Rapid quantitative analysis of headspace components of green olive brine. J. Chromatogr. 521: 153-157.
Pelagatti, O., Balloni, W., and Materassi, R. 1975. ControUo delta stabilita' biologica delle olive da mensa preparate con fermentazione lattiche con-trollate. Ann. 1st. Sper. Elaiot. V: 209-224.
Rodrigo, M., LAzaro, M.J., Alvarruiz, A., Vila, R., Feria, A., Navarro, J.L., and Navarro, A. 1986. Contribuci6n a la bioqufmica de la fermentacion controlada de pepinillos y calidad del producto acabado. Rev, Agroqufm. Tecnol. Aliment. 26: 539-651.
Vaughn, R.H., Douglas, H.C., and Gilliland, J.R. 1943. Production of Spanish-type green ouves. Bull. 678. Univ. of California Agr. Exp. Sta., Berkeley.
Vlahov, G. 1976. Gli acidi organici delle olive: il rapporto malico/citrico quale indice di madurazione. Ann. 1st. Sper. Elaiot Vl: 93-112.
Ms received 10/9/92; revised 2/1/93; accepted 2/3/93.
This work is part of the research project ALI91-U66-CO3-01 supported by the Spanish Government through CICYT.
852-JOURNAL OF FOOD SCIENCE-Volume 58. No. 4, 1993
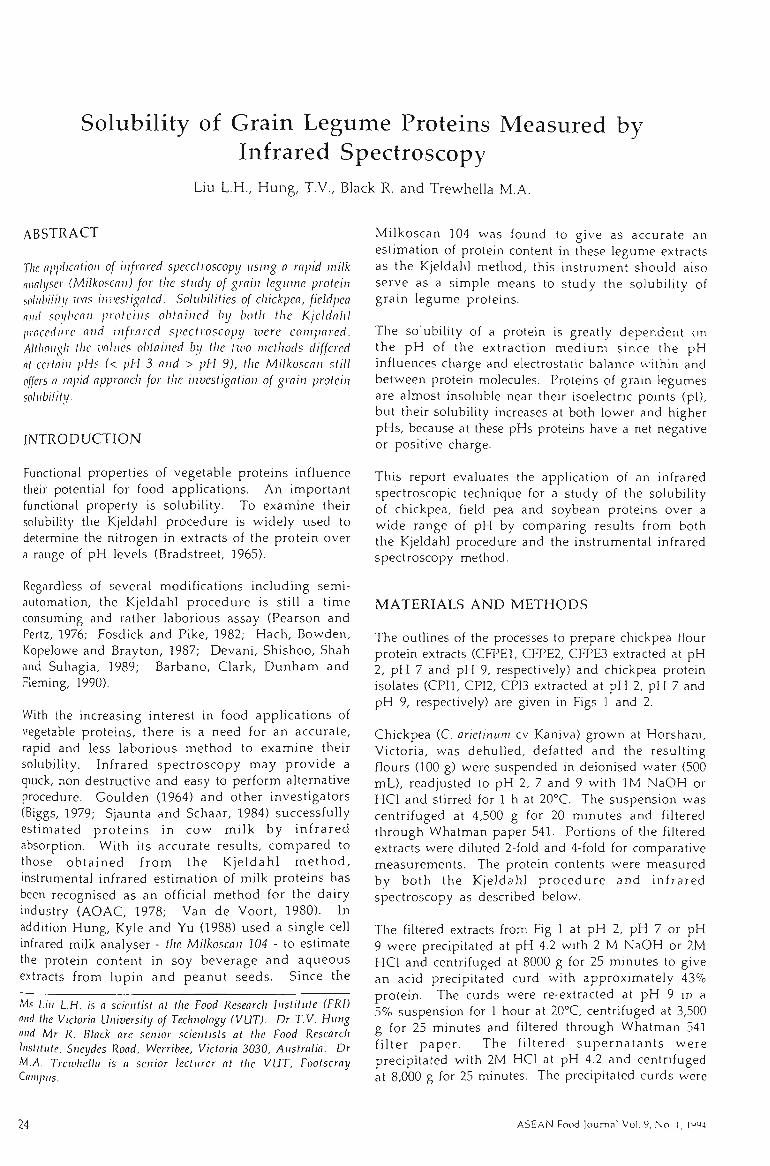
Solubility of Grain Legume Proteins Measured by Infrared Spectroscopy
Liu L.H., Hung, T.V., Black R. and Trewhella M.A.
ABSTRACT
The nppUcntiou of infrared speedroscopy using a rapid milk nimh/scr (Milkoscan) for the study of grain legume protein salubilily was investigated. Solubilities of chickpea, fieldpea niul soybean proteins obtained by both the Kjeldalil procedure and infrared spectroscopy were compared. Mllwugh the values obtained by the two methods differed nl certain pHs (< pH 3 and > pH 9), the Milkoscan still offers n rapid approach for the investigation of grain protein sohibility.
INTRODUCTION
Functional properties of vegetable proteins influence their potential for food applications. An important functional property is solubility. To examine their solubility the Kjeldahl procedure is v^ridely used to determine the nitrogen in extracts of the protein over a range of pH levels (Bradstreet, 1965).
Regardless of several modifications including semi-automation, the Kjeldahl procedure is still a time consuming and rather laborious assay (Pearson and Pertz, 1976; Fosdick and Pike, 1982; Hach, Bowden, Kopelowe and Brayton, 1987; Devani, Shishoo, Shah and Suhagia, 1989; Barbano, Clark, Dunham and Fleming, 1990).
With the increasing interest in food applications of vegetable proteins, there is a need for an accurate, rapid and less laborious method to examine their solubility. Infrared spectroscopy may provide a quick, non destructive and easy to perform alternative procedure. Goulden (1964) and other investigators (Biggs, 1979; Sjaunta and Schaar, 1984) successfully estimated p ro te ins in cow milk by infrared absorption. With its accurate results, compared to those obtained from the Kjeldahl m e t h o d , instrumental infrared estimation of milk proteins has been recognised as an official method for the dairy industry (AOAC, 1978; Van de Voort, 1980). In addition Hung, Kyle and Yu (1988) used a single cell infrared milk analyser - the Milkoscan 104 - to estimate the protein content in soy beverage and aqueous extracts from lupin and peanut seeds. Since the
Ms Liu L.H. is a scientist at the Food Research Institute (FRI) mid the Victoria University of Technology (VUT). Dr T.V. Hung ind Mr R. Black are senior scientists al the Food Research Institute, Sneydes Road, Werribee, Victoria 3030, Australia. Dr M.A. Trewhella is a senior lecturer at the VUT, Footscray Cnnipus.
Milkoscan 104 was found to give as accurate an estimation of protein content in these legume extracts as the Kjeldahl method, this instrument should also serve as a simple means to study the solubility of grain legume proteins.
The solubility of a protein is greatly dependent on the pH of the extraction medium since the pH influences charge and electrostatic balance within and between protein molecules. Proteins of grain legumes are almost insoluble near their isoelectric points (pi), but their solubility increases at both lower and higher pHs, because at these pHs proteins have a net negative or positive charge.
This report evaluates the application of an infrared spectroscopic technique for a study of the solubility of chickpea, field pea and soybean proteins over a wide range of pH by comparing results from both the Kjeldahl procedure and the instrumental infrared spectroscopy method.
MATERIALS A N D METHODS
The outlines of the processes to prepare chickpea flour protein extracts (CFPEl, CFPE2, CFPE3 extracted at pH 2, pH 7 and pH 9, respectively) and chickpea protein isolates (CPU, CPI2, CP13 extracted at pH 2, pH 7 and pH 9, respectively) are given in Figs 1 and 2.
Chickpea (C. arietinum cv Kaniva) grown at Horsham, Victoria, was dehulled, defatted and the resulting flours (100 g) were suspended in deionised water (500 mL), readjusted to pH 2, 7 and 9 with IM NaOH or HCI and stirred for 1 h at 20°C. The suspension was centrifuged at 4,500 g for 20 minutes and filtered through Whatman paper 541. Portions of the filtered extracts were diluted 2-fold and 4-fold for comparative measurements. The protein contents were measured by both the Kjeldahl p rocedure and infrared spectroscopy as described below.
The filtered extracts from Fig 1 at pH 2, pH 7 or pH 9 were precipitated at pH 4.2 with 2 M NaOH or 2M HCI and centrifuged at 8000 g for 25 minutes to give an acid precipitated curd with approximately 43% protein. The curds were re-extracted at pH 9 in a 5% suspension for 1 hour at 20°C, centrifuged at 3,500 g for 25 minutes and filtered through Whatman 541 filter paper . The filtered s u p e m a t a n t s were precipitated with 2M HCI at pH 4.2 and centrifuged at 8,000 g for 25 minutes. The precipitated curds were
24 ASEAN FcxKi JoumnI Vol. 9, No. ],\'^^A
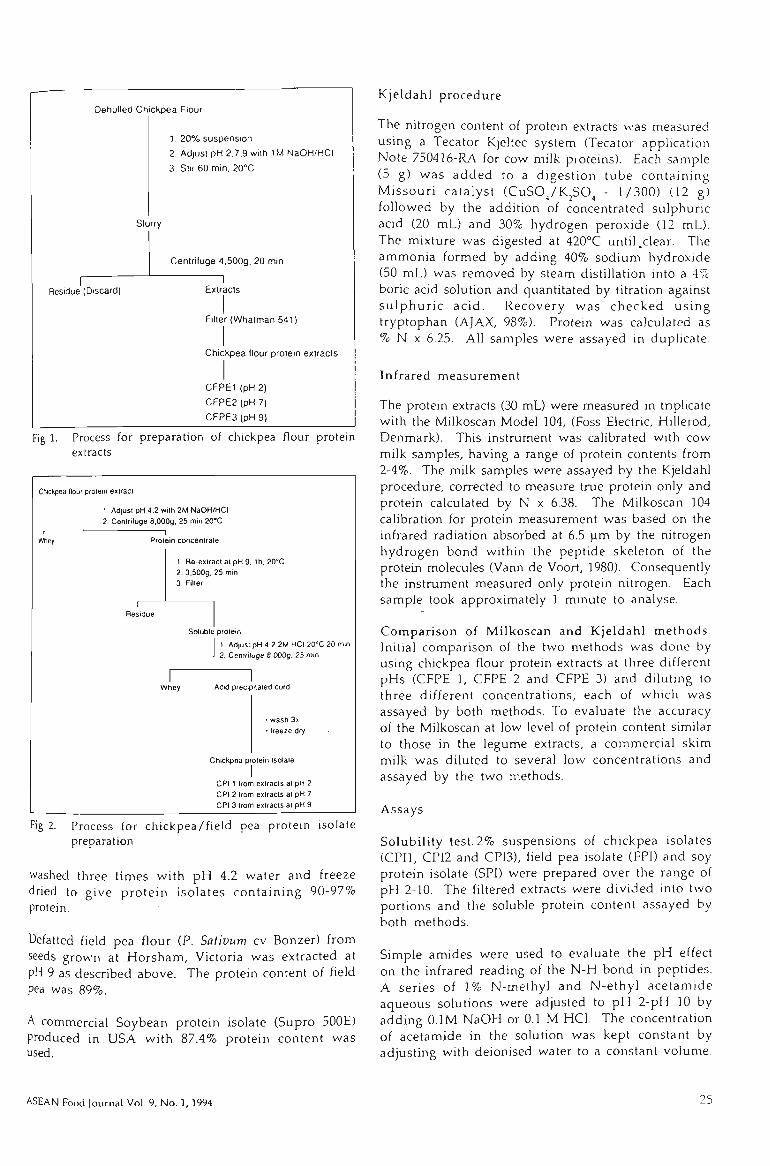
Dehulled Chickpea Flour
1. 20% suspension
2. Adjust pH 2,7,9 with 1M NaOH/HCI
3. Stif 60 min, 20°C
Slurry
Centrifuge 4,500g, 20 min
Residue (Discard) 1
Extracts
I Filter (Whatman 541)
Chickpea flour protein extracts
CFPEl (pH 2)
CFPE2 (pH 7)
CFPE3 (pH 9)
Fig 1. Process for preparation of chickpea flour protein extracts
Chiclcpea flour protein extract
1. Adjust pH 1.2 with 2M NaOH/HCI 2. Cenlriluge B.OOOg. 25 min 20°C
Wliey Protein concentrate
1. Re-extracl al pH 9, th. 20°C 2. 3,500g, 25 min 3. Filler
Soluble protein
I 1. Adjusl pH 4.2 2M HCI 20°C 20 min 2. Cenlriluge B.OOOg. 25 min
Whey Acid precipitated curd
• wash 3x • freeze dry
Chickpea protein Isolaie
I CPI t from extracts al pH 2 CPI 2 Irom extracts at pH 7 CPI 3 Irom extracts al pH 9
Fig 2. Process for chickpea/field pea protein isolate preparation
washed three times with pH 4.2 water and freeze dried to give protein isolates containing 90-97% protein.
Defatted field pea flour (P. Sativum cv Bonzer) from seeds grown at Horsham, Victoria was extracted at pH 9 as described above. The protein content of field pea was 89%.
A commercial Soybean protein isolate (Supro 500E) produced in USA with 87.4% protein content was used.
Kjeldahl procedure
The nitrogen content of protein extracts was measured using a Tecator Kjeltec system (Tecator application Note 750416-RA for cow milk proteins). Each sample (5 g) was added to a digestion tube containing Missouri catalyst (CuSOyK^SO^ - 1/300) (12 g) followed by the addition of concentrated sulphuric acid (20 mL) and 30% hydrogen peroxide (12 mL). The mixture was digested at 420°C until.clear. The ammonia formed by adding 40% sodium hydroxide (50 mL) was removed by steam distillation into a 4% boric acid solution and quantitated by titration against su lphur i c acid. Recovery was checked using tryptophan (AJAX, 98%). Protein was calculated as % N x 6.25. All samples were assayed in duplicate.
Infrared measurement
The protein extracts (30 mL) were measured in triplicate with the Milkoscan Model 104, (Foss Electric, Hillerod, Denmark). This instrument was calibrated with cow milk samples, having a range of protein contents from 2-4%. The milk samples were assayed by the Kjeldahl procedure, corrected to measure true protein only and protein calculated by N x 6.38. The Milkoscan 104 calibration for protein measurement was based on the infrared radiation absorbed at 6.5 ^m by the nitrogen hydrogen bond within the peptide skeleton of the protein molecules (Vann de Voort, 1980). Consequently the instrument measured only protein nitrogen. Each sample took approximately 1 minute to analyse.
Comparison of Milkoscan and Kjeldahl methods. Initial comparison of the two methods was done by using chickpea flour protein extracts at three different pHs (CFPE 1, CFPE 2 and CFPE 3) and diluting to three different concentrations, each of which was assayed by both methods. To evaluate the accuracy of the Milkoscan at low level of protein content similar to those in the legume extracts, a commercial skim milk was diluted to several low concentrations and assayed by the two methods.
Assays
Solubility test. 2% suspensions of chickpea isolates (CPU, CPI2 and CP13), field pea isolate (FPI) and soy protein isolate (SPI) were prepared over the range of pH 2-10. The filtered extracts were divided into two portions and the soluble protein content assayed by both methods.
Simple amides were used to evaluate the pH effect on the infrared reading of the N-H bond in peptides. A series o( 1% N-methyl and N-ethyl acetamide aqueous solutions were adjusted to pH 2-pH 10 by adding O.IM NaOH or 0.1 M HCI. The concentration of acetamide in the solution was kept constant by adjusting with deionised water to a constant volume.
ASEAN Food Journal Vol. 9, No. 1, 1994 25
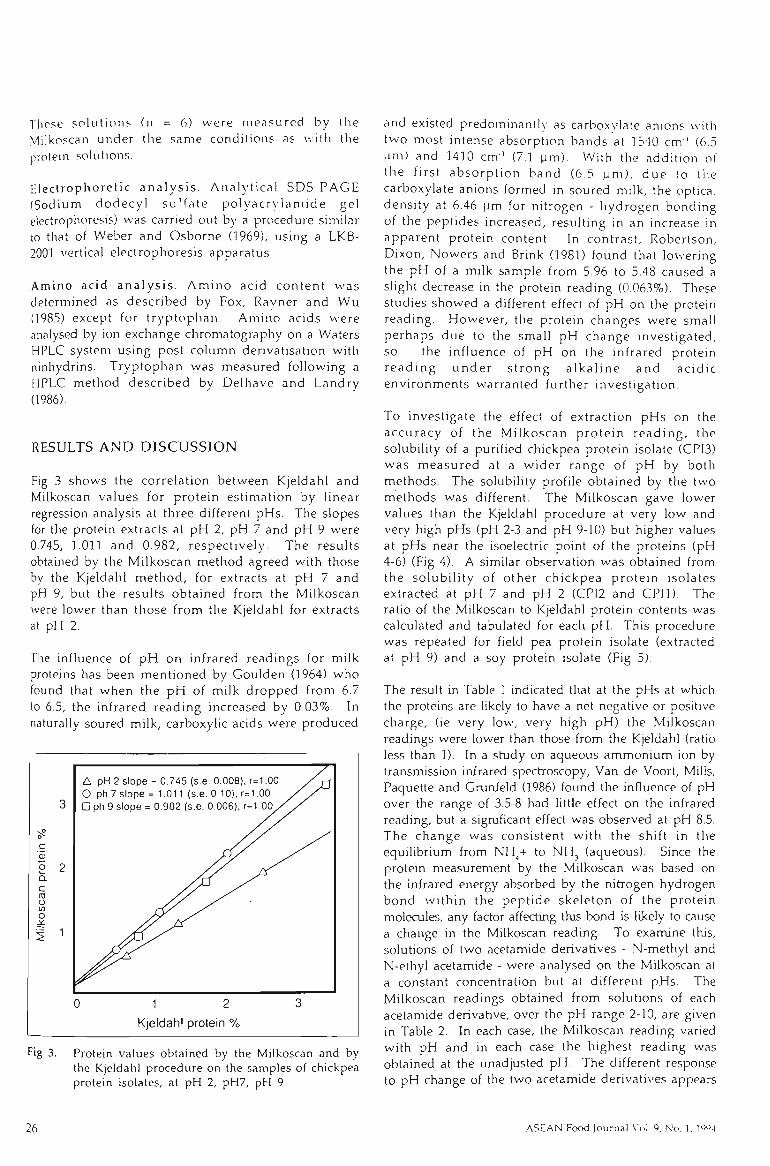
These solutions (n = 6) were measured by the Milkoscan under the same conditions as with the protein solutions.
Electrophoretic ana ly s i s . Analytical SDS-PAGE (Sodium dodecyl sulfate po lyacry lamide gel electrophoresis) was carried out by a procedure similar to that of Weber and Osborne (1969), using a LKB-2001 vertical electrophoresis apparatus.
Amino acid ana lys i s . Amino acid content was determined as described by Fox, Rayner and Wu (1985) except for tryptophan. Amino acids were analysed by ion exchange chromatography on a Waters HPLC system using post column derivatisation with ninhydrins. Tryptophan was measured following a HPLC method described by Delhave and Landry (1986).
RESULTS A N D DISCUSSION
Fig 3 shows the correlation between Kjeldahl and Milkoscan values for protein estimation by linear regression analysis at three different pHs. The slopes for the protein extracts at pH 2, pH 7 and pH 9 were 0.745, 1.011 and 0.982, respectively. The results obtained by the Milkoscan method agreed with those by the Kjeldahl method, for extracts at pH 7 and pH 9, but the results obtained from the Milkoscan were lower than those from the Kjeldahl for extracts at pH 2.
The influence of pH on infrared readings for milk proteins has been mentioned by Goulden (1964) who found that when the pH of milk dropped from 6.7 to 6.5, the infrared reading increased by 0.03%. In naturally soured milk, carboxylic acids were produced
c o a c to o o
1 2 Kjeldahl protein %
Fig 3. Protein values obtained by the Milkoscan and by the Kjeldahl procedure on the samples of chickpea protein isolates, at pH 2, pH7, pH 9.
and existed predoininantly as carboxylate anions with two most intense absorption bands at 1540 c m ' (6.5 Mm) and 1410 cm ' (7.1 pm). With the addition of the first absorpt ion band (6.5 pm) , due to the carboxylate anions formed in soured milk, the optical density at 6.46 pm for nitrogen - hydrogen bonding of the peptides increased, resulting in an increase in apparent protein content. In contrast, Robertson, Dixon, Nowers and Brink (1981) found that lowering the pH of a milk sample from 5.96 to 5.48 caused a slight decrease in the protein reading (0.063%). These studies showed a different effect of pH on the protein reading. However, the protein changes were small perhaps due to the small pH change investigated, so the influence of pH on the infrared protein r ead ing u n d e r s t rong a lkal ine and acidic environments warranted further investigation.
To investigate the effect of extraction pHs on the accuracy of the Milkoscan protein reading, the solubility of a purified chickpea protein isolate (CP13) was measured at a wider range of pH by both methods. The solubility profile obtained by the two methods was different. The Milkoscan gave lower values than the Kjeldahl procedure at very low and very high pHs (pH 2-3 and pH 9-10) but higher values at pHs near the isoelectric point of the proteins (pH 4-6) (Fig 4). A similar observation was obtained from the solubility of other chickpea protein isolates extracted at pH 7 and pH 2 (CP12 and CPU). The ratio of the Milkoscan to Kjeldahl protein contents was calculated and tabulated for each pH. This procedure was repeated for field pea protein isolate (extracted at pH 9) and a soy protein isolate (Fig 5).
The result in Table 1 indicated that at the pHs at which the proteins are likely to have a net negative or positive charge, (ie very low, very high pH) the Milkoscan readings were lower than those from the Kjeldahl (ratio less than 1). In a study on aqueous ammonium ion by transmission infrared spectroscopy. Van de Voort, Mills, Paquette and Grunfeld (1986) found the influence of pH over the range of 3.5-8 had little effect on the infrared reading, but a significant effect was observed at pH 8.5. The change was consistent with the shift in the equilibrium from NH -i- to NH^ (aqueous). Since the protein measurement by the Milkoscan was based on the infrared energy absorbed by the nitrogen hydrogen bond within the peptide skeleton of the protein molecules, any factor affecting this bond is likely to cause a change in the Milkoscan reading. To examine this, solutions of two acetamide derivadves - N-methyl and N-ethyl acetamide - were analysed on the Milkoscan at a constant concentration but at different pHs. The Milkoscan readings obtained from solutions of each acetamide derivative, over the pH range 2-10, are given in Table 2. In each case, the Milkoscan reading varied with pH and in each case the highest reading was obtained at the unadjusted pH. The different response to pH change of the two acetamide derivatives appears
26 ASEAN Food Journal Vol. 9, No. 1.1'^^A
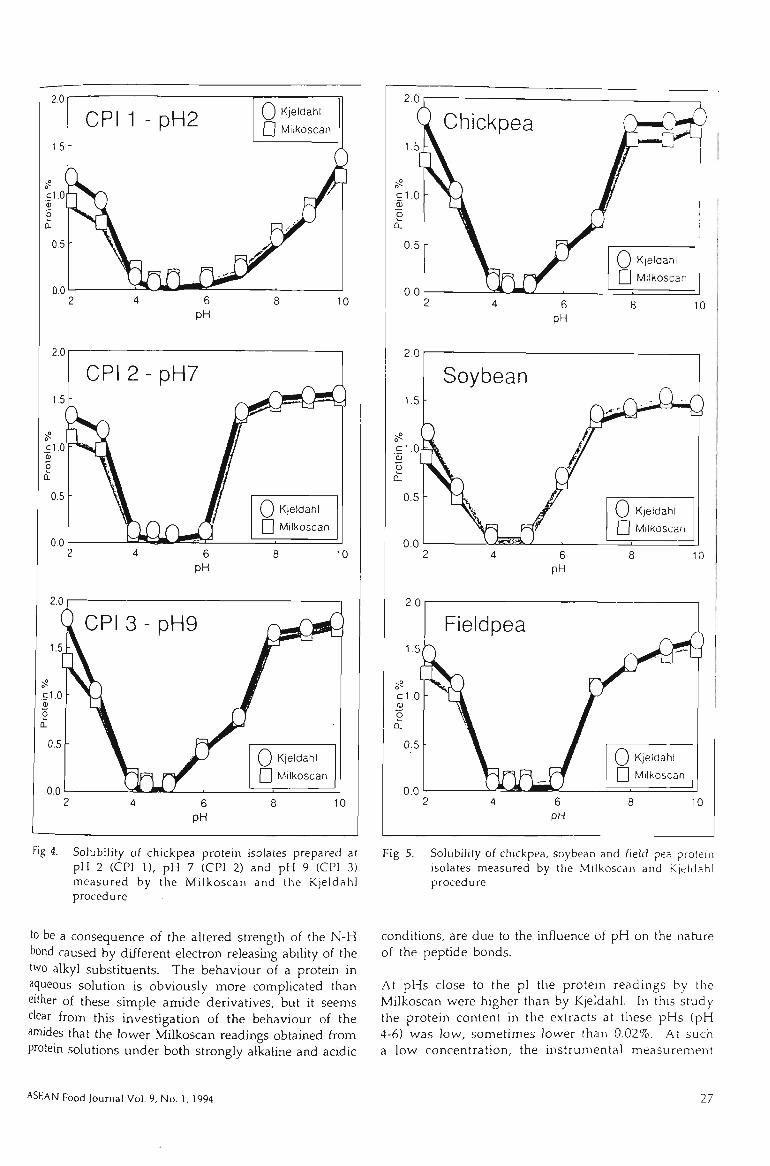
2,0
CPI 1 -pH2 Q KjeltJahl
l l Milkoscan
2.0
CPI2-pH7
Q Kjeldahl Q t ilkoscan
Fig 4. Solubility of chickpea protein isolates prepared at pH 2 (CPI 1), pH 7 (CPI 2) and pH 9 (CPI 3) measured by the Milkoscan and the Kjeldahl procedure
Fig 5. Solubility of chickpea, soybean and field pea protein isolates measured by the Milkoscan and Kjeldahl procedure
to be a consequence of the altered strength of the N-H bond caused by different electron releasing ability of the two alkyl substituents. The behaviour of a protein in aqueous solution is obviously more complicated than either of these simple amide derivatives, but it seems clear from this investigation of the behaviour of the amides that the lower Milkoscan readings obtained from protein solutions under both strongly alkaline and acidic
conditions, are due to the influence of pH on the nature of the peptide bonds.
At pHs close to the pl the protein readings by the Milkoscan were higher than by Kjeldahl. In this study the protein content in the extracts at these pHs (pH 4-6) was low, sometimes lower than 0.02%. At such a low concentration, the instrumental measurement
ASEAN Food Journal Vol. 9, No. 1, 1994 27
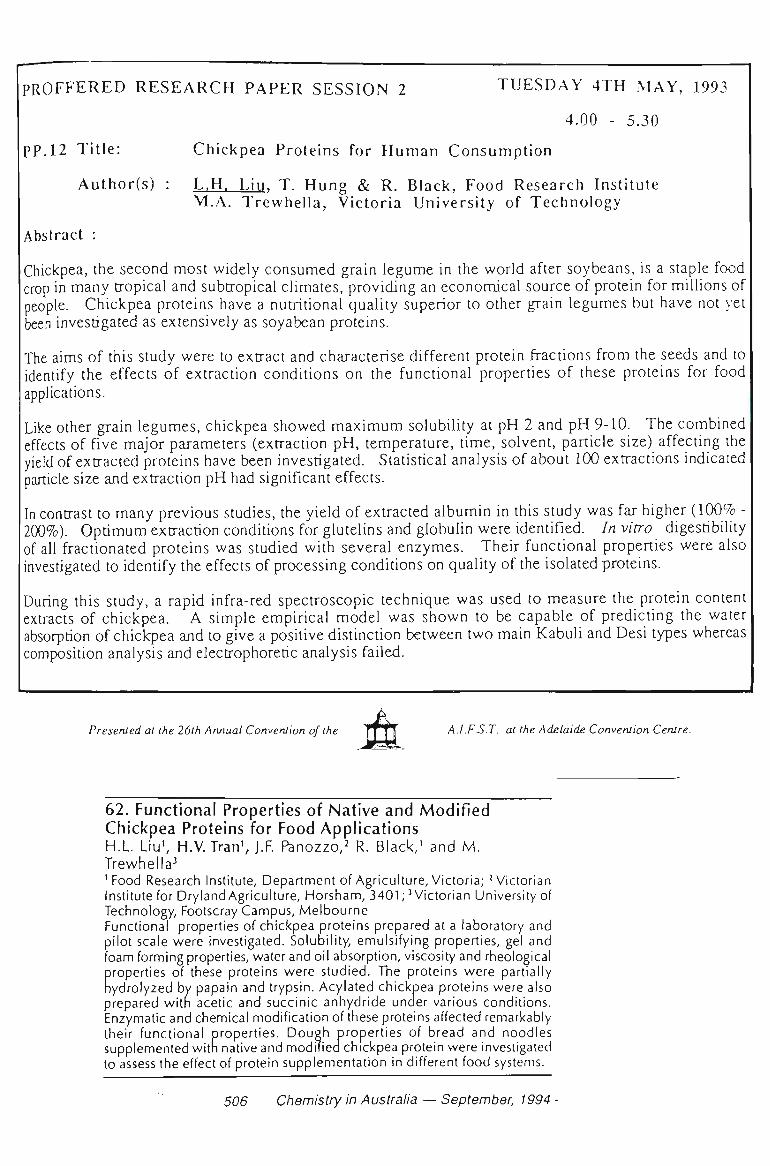
PROFFERED RESEARCH PAPER SESSION 2 TUESDAY 4TH MAY, 1993
4.00 - 5.30
pp.12 Title: Chickpea Proteins for Human Consumption
Author(s) : L.H. Lin. T. Hung & R. Black, Food Research Institute M.A. Trewhella, Victoria University of Technology
Abstract :
Chickpea, the second most widely consumed grain legume in the world after soybeans, is a staple food crop in many tropical and subtropical climates, providing an economical source of protein for millions of people. Chickpea proteins have a nutritional quality superior to other grain legumes but have not yet been investigated as extensively as soyabean proteins.
The aims of this study were to extract and characterise different protein fractions from the seeds and to identify the effects of extraction conditions on the functional properties of these proteins for food applications.
Like other grain legumes, chickpea showed maximum solubility at pH 2 and pH 9-10. The combined effects of five major parameters (extraction pH, temperature, time, solvent, particle size) affecting the yield of extracted proteins have been investigated. Statistical analysis of about 100 extractions indicated particle size and extraction pH had significant effects.
In contrast to many previous studies, the yield of extracted albumin in this study was far higher (100% -200%). Optimum extraction conditions for glutelins and globulin were identified. In vitro digestibility of all fractionated proteins was studied with several enzymes. Their functional properties were also investigated to identify the effects of processing conditions on quality of the isolated proteins.
During this study, a rapid infra-red spectroscopic technique was used to measure the protein content extracts of chickpea. A simple empirical model was shown to be capable of predicting the water absorption of chickpea and to give a positive distinction between two main Kabuli and Desi types whereas composition analysis and electrophoretic analysis failed.
Presented at the 26ih Annual Converuion of ihe n T T A.I.F.S.T. at the Adelaide Conveniion Centre.
62. Functional Properties of Native and Modified Chickpea Proteins for Food Applications H.L. Liu', H.V.Iran'J.F. f^nozzo,^ R. Black,' and M. Trewhella^ ' Food Research Institute, Department of Agriculture, Victoria; 'Victorian Institute for DrylandAgricuIture, Horsham, 3401;'Victorian University of Technology, Footscray Campus, Melbourne Functional properties of chickpea proteins prepared at a laboratory and pilot scale were investigated. Solubility, emulsifying properties, gel and foam forming properties, water and oil absorption, viscosity and rheological properties of these proteins were studied. The proteins were partially nydrolyzed by papain and trypsin. Acylated chickpea proteins were also prepared witn acetic and succinic anhydride under various conditions. Enzymatic and chemical modification of these proteins affected remarkably their functional properties. Dough properties of bread and noodles supplemented witn native and modified chickpea protein were investigated to assess the effect of protein supplementation in different food systems.
506 Chemistry in Australia — September, 1994