chicago board of trade interest rate products market development 2003 taipei interest rate futures...
TRANSCRIPT

Chicago Board of TradeInterest Rate Products Market Development
2003 Taipei Interest Rate Futures Conference
November 20 - 21, 2003

CBOT Interest Rate Product Line
• Family of Curves in the Interest Rate Complex– Treasury– Credit Curves
• LIBOR (A to AA)• Agencies (AAA)
– Tax Exempt (AAA)– Federal Funds

Major Trends
• Late 1970s ~ 1989– Inflation Peaks and then Declines– The Era of Deficit Spending
• 1990 ~ 2000– From Record Deficits to Record Surplus– Series of Market Crises:
Asia/Russia/LTCM• 2000 ~
– The LIBOR Era– The Electronic Trading Era

Major Factors Affecting Growth
• Growing Debt Level and Supply of Treasury Securities. Growth in cash market trading
• Benefits of Futures:– Markets are Open and Transparent– Standardized Products– One Centralized Marketplace
• Electronic Trading– Speed of Execution– Global Distribution– Cost Efficiencies

Historical Timeline of the CBOT Interest Rate Product Line
• 1975 – GNMA Futures (Government National Mortgage Association)
• 1977 – U.S. Treasury Bond Futures. • 1979 – “Saturday Night Special” FED
changes policy to target the money supply.
• 1982 – Options on U.S. T-Bond futures; 10-Year U.S. Treasury Note futures.
• 1983 – US budget deficit hits record $200 bn.

Historical Timeline of the CBOT Interest Rate Product Line
• 1984 - Options on 10-year T-notes• 1985 – Municipal Bond futures • 1986 - Oil collapses to $10. 30 year T-
Bond yield drops to 7.11 %. “Street” caught in a giant squeeze in cash 9 ¼ T- Bonds of 2016 – basis explodes to 350/32nds.
• 1987 - Open Outcry “Evening Session”
• 1987 - October 19 stock market crash – Dow falls 22 % - huge bond market rally.

Historical Timeline of the CBOT Interest Rate Product Line
• 1988 - 5-Year Treasury Note futures; 30 Day Federal Funds
futures. • 1990 – Options on 5-Year T-Note
futures; 2-Year Treasury Note futures
• 1991 - Two year Treasury Auction bidding scandal.
• 1992 - Budget Deficit hits $290 billion. Options on 2-Year T-Note
futures.

Historical Timeline of the CBOT Interest Rate Product Line
• 1994 - Project A Afternoon Session• 1995 - Project A Night Session• 1997 - Asian currency crisis. • 1998 - Russia debt default. Long Term
Capital Management collapse. Credit spreads widen, treasury cross hedges lose some effectiveness.
• 1998 - Start of 4 years of budget surpluses.
• 2000 – 10-Year & 5-Year Agency Debt futures & options.
• 2000 - a/c/e platform replaces Project A.

Historical Timeline of the CBOT Interest Rate Product Line
• 2000 - Record budget surplus of $236 bn. FASB 133 – Hedge Accounting.
• 2001 - Treasury ends of 30-year bond. • 2001 – 10-Year & 5-Year Interest Rate
Swap futures and options. • 2001 - Electronic trading in treasury
futures at 25 % of total. • 2002 - Electronic trading in treasury
futures at 50% of total. • 2003 - Electronic trading in treasury
futures surpasses 75% of total volume.
• 2003 - Begin e-cbot Liffe Connect platform.
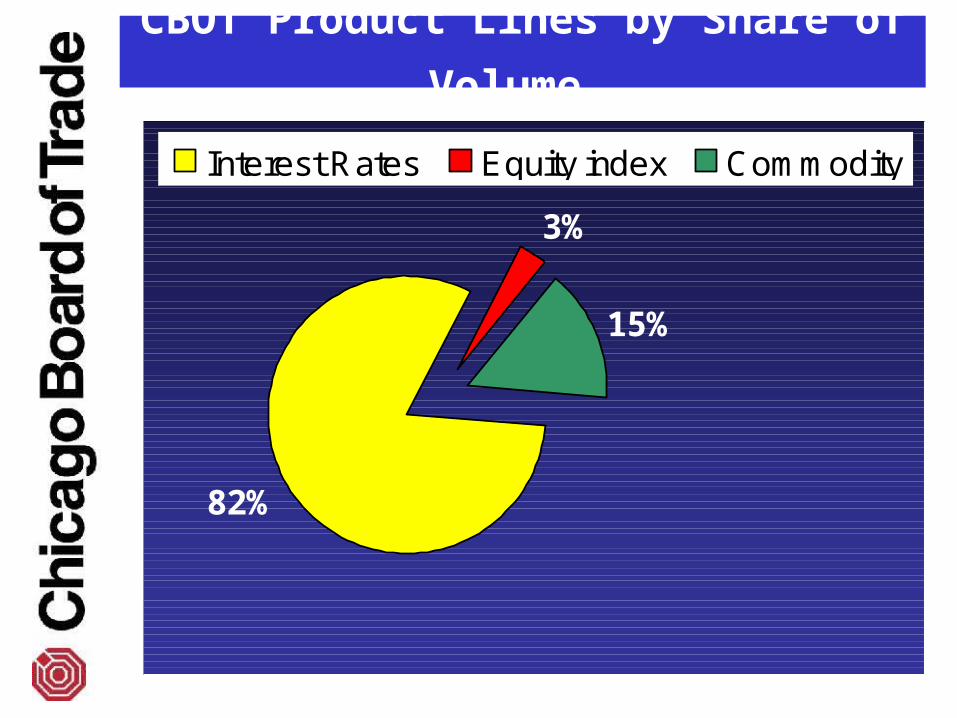
CBOT Product Lines by Share of Volume
82%
3%
15%
Interest Rates Equity index Commodity

Growth of U.S. Debt US Treasury Debt - US$ Billions
0
1,000
2,000
3,000
4,000
5,000
6,000
7,000
8,000
Mar
-92
Sep
-92
Mar
-93
Sep
-93
Mar
-94
Sep
-94
Mar
-95
Sep
-95
Mar
-96
Sep
-96
Mar
-97
Sep
-97
Mar
-98
Sep
-98
Mar
-99
Sep
-99
Mar
-00
Sep
-00
Mar
-01
Sep
-01
Mar
-02
Sep
-02
Mar
-03
Total Treasury Debt
FED & US Govt Held
Foreign Held

Growth of U.S. Debt
0%
10%
20%
30%
40%
50%
60%
70%
80%
90%
100%
Ma
r-9
2
Se
p-9
2
Ma
r-9
3
Se
p-9
3
Ma
r-9
4
Se
p-9
4
Ma
r-9
5
Se
p-9
5
Ma
r-9
6
Se
p-9
6
Ma
r-9
7
Se
p-9
7
Ma
r-9
8
Se
p-9
8
Ma
r-9
9
Se
p-9
9
Ma
r-0
0
Se
p-0
0
Ma
r-0
1
Se
p-0
1
Ma
r-0
2
Se
p-0
2
Ma
r-0
3
Se
p-0
3
Ma
r-0
4
Foreign Held as Percent of Total Privately Held
US FED & Govt Held as a Percent of Total Debt

CBOT Treasury Futures Average Daily Volume - Contracts
0
250,000
500,000
750,000
1,000,000
1,250,000
1,500,000
Jan-
80
Jan-
82
Jan-
84
Jan-
86
Jan-
88
Jan-
90
Jan-
92
Jan-
94
Jan-
96
Jan-
98
Jan-
00
Jan-
02
Jan-
04
2yr
5yr
10yr
30yr

CBOT Treasury Options Average Daily Volume - Contracts
0
100,000
200,000
300,000
400,000
500,000
Jan-
80
Jan-
81
Jan-
82
Jan-
83
Jan-
84
Jan-
85
Jan-
86
Jan-
87
Jan-
88
Jan-
89
Jan-
90
Jan-
91
Jan-
92
Jan-
93
Jan-
94
Jan-
95
Jan-
96
Jan-
97
Jan-
98
Jan-
99
Jan-
00
Jan-
01
Jan-
02
Jan-
03
Jan-
04
5yr
10yr
30yr

CBOT Treasury Futures vs. Cash
$Dollar Volume Comparisons Average Daily $volume June ~ Sept 2003In US$ Millions source: NY Fed , CBOT
0
20,000
40,000
60,000
80,000
100,000
120,000
140,000
160,000
2y 5y 10y 30y
Futures Cash

CBOT Treasury Futures Electronic Platform Share of Volume
0%
10%
20%
30%
40%
50%
60%
70%
80%
90%
100%
1998 1999 2000 2001 2002 2003

CBOT Credit & LIBOR Futures Average Daily Volume
0
2,000
4,000
6,000
8,000
10,000
12,000
14,000
16,000
18,000
20,000
Oct
-88
Oct
-89
Oct
-90
Oct
-91
Oct
-92
Oct
-93
Oct
-94
Oct
-95
Oct
-96
Oct
-97
Oct
-98
Oct
-99
Oct
-00
Oct
-01
Oct
-02
Oct
-03
10 Yr Muni
10 Yr Agency
10 Yr Swap

CBOT 30 Day Federal Funds Futures & Options - Average Daily Volume
0
20,000
40,000
60,000
80,000
100,000
120,000
Oc
t-8
8
Oc
t-8
9
Oc
t-9
0
Oc
t-9
1
Oc
t-9
2
Oc
t-9
3
Oc
t-9
4
Oc
t-9
5
Oc
t-9
6
Oc
t-9
7
Oc
t-9
8
Oc
t-9
9
Oc
t-0
0
Oc
t-0
1
Oc
t-0
2
Oc
t-0
3
Fed Funds Options
Fed Funds Futures

• pension funds• bankers• cash managers• governments• insurance
companies• mortgage bankers• thrifts• underwriters
• bond dealers• corporate treasurers• hedge fund
managers• investment bankers• mutual fund mangers• portfolio mangers• trust fund managers• arbitrage firms
Market Participants
CME/CBOT Common Clearing Link
• The Common Clearing Link (CCL) agreement was signed in April 2003 by the CBOT and the CME.
• The CCL will follow the same timetable as the switch to the new e-CBOT Powered by Liffe Connect®. When a product begins trading on the new e-CBOT platform, it will also begin clearing through the new CCL.
• The CCL will clear approximately 85 % of all U.S. futures and futures options.

CME/CBOT Common Clearing Link
• The CCL will allow for portfolio margining and significant reductions in performance bonds (margins) for certain qualified spreads. Total amount estimated to be reduced for the entire industry exceeds $1 billion.
• Example 1 – – Long 40 CME Eurodollar futures and Short
15 CBOT 10 Year T-Note futures. – Before risk offset, margins for this spread
are $45,500. – After CCL begins, the risk offset will reduce
margins to $11,375 for the spread.

• State of the art electronic platform. – Host + Gateway + Network
• Over 110 Firms in 181 locations are participating in the migration to the new e-CBOT platform.
• Increased built-in functionality – – 32 option spread strategies – 6 futures strategies.
• Multiple trade matching algorithms: Price-Time and Pro-Rata.
e-CBOT Powered by LIFFE CONNECT®
e-CBOT Powered by LIFFE CONNECT®
• Timetable for transition– November 24, 2003
• Interest Rate Swap products• Federal Funds products• Municipal bond products• Dow Equity Index products
– January 2, 2004• Treasury complex products• Agency complex products• Agricultural complex products