chhattisgarh – profile northern hills zone chhattisgarh plains zone bastar plateau zone falls...
TRANSCRIPT


Chhattisgarh – Profile
Northern Hills Zone
Chhattisgarh Plains Zone
Bastar Plateau Zone
Falls under eastern plateau and Hills Zone sub-divided into three
agro climatic zones.
Geog. area 137.90 lakh ha.
(4.15 % of the country)
Net sown area 47.70 lakh ha.
(35 % of its geog. area)
57 % soil is medium to light.
Forest cover 63.55 lakh ha.
(46 % of its geog. area)
Average rainfall 1325 mm.
Agro Climatic Zones
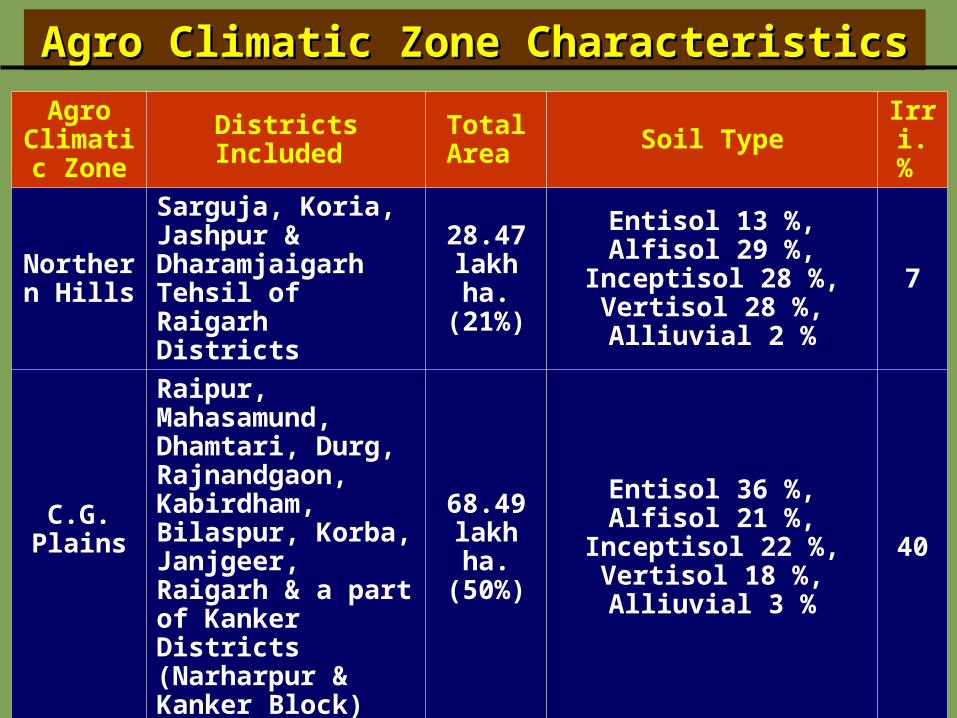
Agro Climatic Zone Characteristics Agro Climatic Zone Characteristics
Agro Climatic
ZoneDistricts Included Total
Area Soil Type Irri. %
Northern Hills
Sarguja, Koria, Jashpur & Dharamjaigarh Tehsil of Raigarh Districts
28.47 lakh ha. (21%)
Entisol 13 %, Alfisol 29 %, Inceptisol 28 %, Vertisol
28 %, Alliuvial 2 %7
C.G. Plains
Raipur, Mahasamund, Dhamtari, Durg, Rajnandgaon, Kabirdham, Bilaspur, Korba, Janjgeer, Raigarh & a part of Kanker Districts (Narharpur & Kanker Block)
68.49 lakh ha. (50%)
Entisol 36 %, Alfisol 21 %, Inceptisol 22 %, Vertisol
18 %, Alliuvial 3 %40
Bastar Plateau
Jagdalpur, Dantewada and the remaining part of Kanker Districts
39.06 lakh ha. (29%)
Entisol 26 %, Alfisol 25 %, Inceptisol 34 %, Vertisol
10 %, Alliuvial 5 %5

Farm families: 32.55 lakh (33% ST, 12 % SC).
54% Marginal Farmers own 15% land
22% Small Farmers own 19% land.
24% Others own 66% land.
Average land holding: 1.6 ha
Rice is a major kharif crop which occupies 75% of the total kharif
cropped area (47.80 lakh ha.). Other cereals 2%, Pulses 9%,
Oilseeds 7% & Other crops 7%.
Area under Rabi crops 16.14 Lakh ha. which constitutes
only 34 % of the net sown area.
Net irrigated area 12.82 lakh ha (27 %)
Cropping intensity 134 %.
76% Small / Marginal
Farmers own 34% land
Chhattisgarh - An Overview

Source wise Irrigation Source wise Irrigation
Canals 8.87 70 %
Tanks 0.52 4 %
Tube-wells 2.24 17 %
Wells 0.35 3 %
Other Sources 0.84 6 %
Total 12.82 100 %
Net Irrigated Area - 27 %
Northern Hills Zone
Chhattisgarh Plains Zone
Bastar Plateau Zone
Agro Climatic Zones(Area in Lakh ha.)

State vis-à-vis National Average
Particulars Unit National
2006-07
State
2008-09
Crop Intensity % 135 134
Irrigation % 42 27
Double Cropped Area Lakh ha. 467.80 (33%) 16.20 (34%)
Fertilizer Consumption
(Kharif)kg/ha 113.26 75
Tractor per 1000 ha. Nos. 18 9
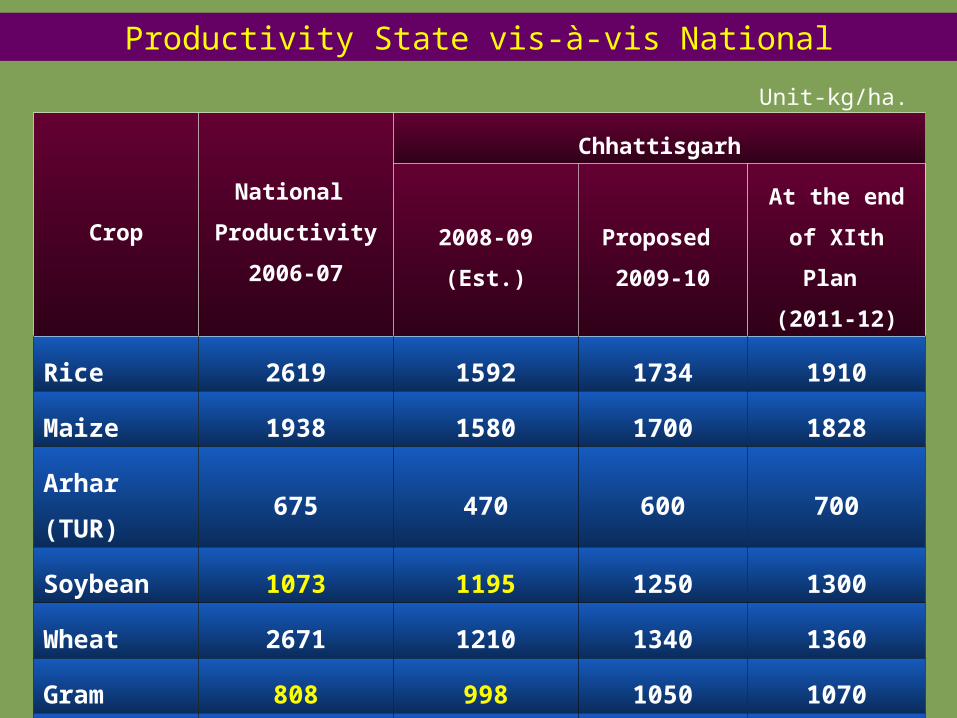
Crop
National
Productivity
2006-07
Chhattisgarh
2008-09 (Est.)Proposed
2009-10
At the end of
XIth Plan
(2011-12)
Rice 2619 1592 1734 1910
Maize 1938 1580 1700 1828
Arhar (TUR) 675 470 600 700
Soybean 1073 1195 1250 1300
Wheat 2671 1210 1340 1360
Gram 808 998 1050 1070
Mustard 1117 500 550 600
Productivity State vis-à-vis National
Unit-kg/ha.

Contd…
Particulars National
2006-07
State
2007-08 2008-09
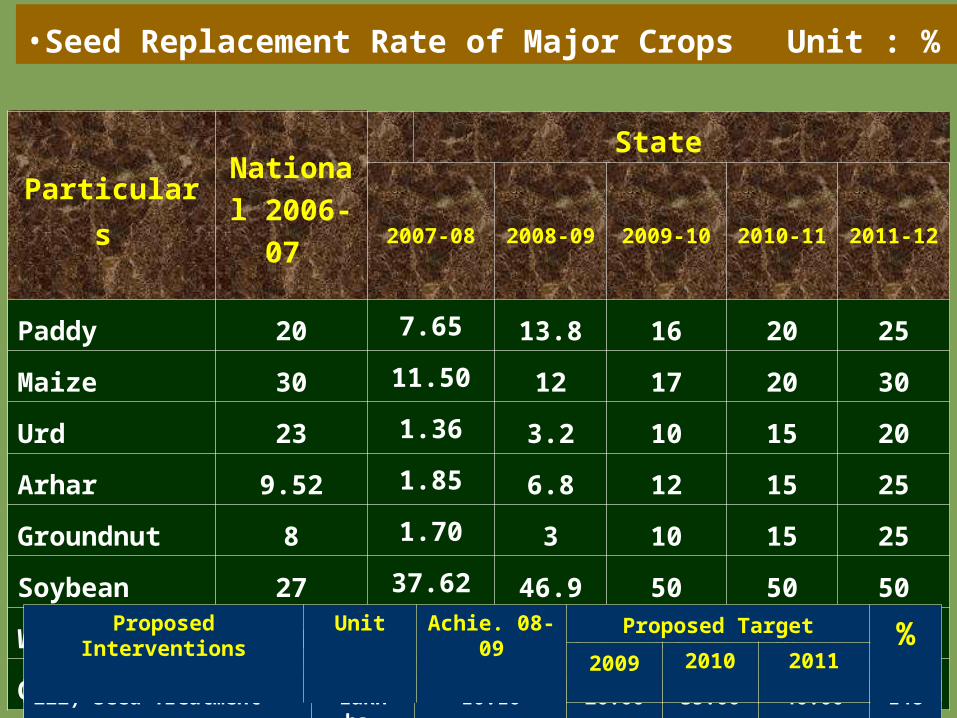
Paddy 20 7.65 13.80
Maize 30 11.50 12.00
Urd 23 1.36 3.20
Arhar 9.52 1.85 6.80
Groundnut 8 1.70 3.00
Soybean 27 37.62 46.90
Wheat 14 9.50 22.50
Gram 11 7.00 11.00
Seed Replacement Rate of Major
Crops Unit : %

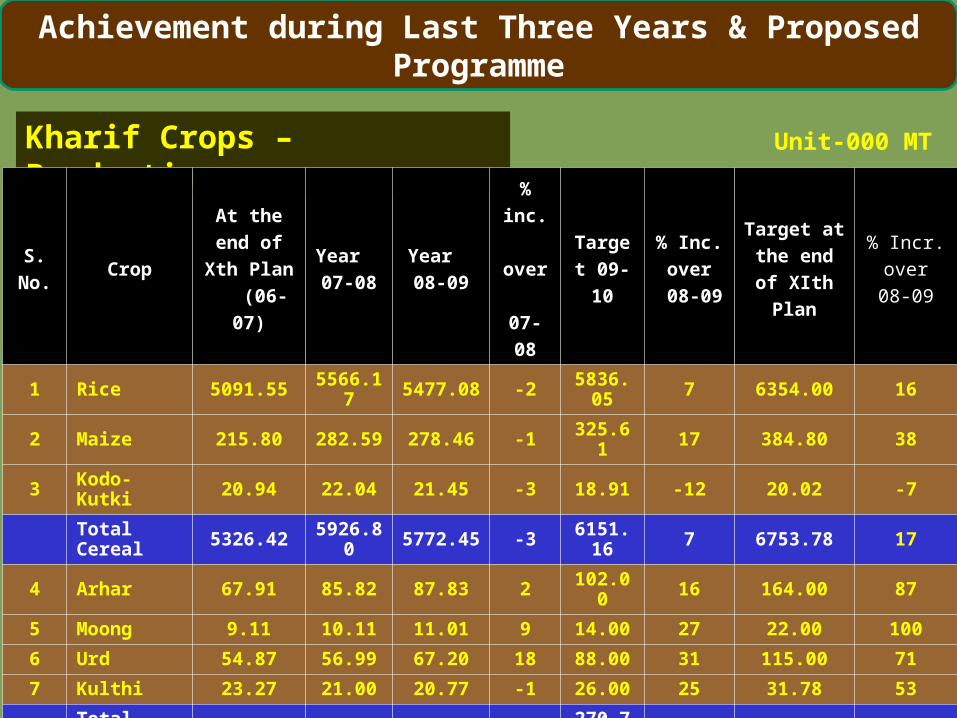
Achievement during Last Three Years & Proposed Programme
Kharif Crops – Area Coverage Unit-000 Ha.
S.
No.Crop
At the end
of Xth Plan
(06-07)
Year
07-08
Year
08-09
% inc.
over
07-08
Target
09-10
% Inc.
over
08-09
Target at
the end of
XIth Plan
% Incr.
over 08-09
1 Rice 3573.02 3568.06 3610.47 1 3537.00 -2 3530.00 -2
2 Maize 173.89 178.97 174.04 -3 189.20 9 208.00 20
3 Kodo-kutki 101.66 84.13 71.50 -15 56.80 -21 52.00 -27
Total Cr. 3848.57 3831.16 3856.01 1 3783.00 -2 3790.00 -2
4 Arhar 163.63 164.72 154.09 -6 170.00 10 205.00 33
5 Moong 31.42 34.39 34.95 2 40.00 14 50.00 43
6 Urd 173.64 180.93 191.99 6 220.00 15 250.00 30
7 Kulthi 62.71 64.02 55.82 -13 65.00 16 70.00 25
Total Pl. 431.40 444.06 436.85 -2 495.00 13 575.00 32
8 Groundnut 55.82 61.89 62.98 2 65.00 3 110.00 75
9 Til 48.08 48.85 52.82 8 55.00 4 83.00 57
10 Soybean 101.93 112.68 120.96 7 125.00 3 150.00 24
11 Ramtil 103.27 106.21 90.67 -15 97.00 7 134.00 48
Total Oil 310.30 332.06 328.53 -1 344.00 5 480.00 46
G. Total 4544.27 4769.22 4781.07 0 4784.00 0 4845.00 1
Kharif Crops – Production Unit-000 MT
S.
No.Crop
At the end
of Xth Plan
(06-07)
Year
07-08
Year
08-09
% inc.
over
07-08
Target
09-10
% Inc.
over
08-09
Target at
the end of
XIth Plan
% Incr.
over 08-09
1 Rice 5091.55 5566.17 5477.08 -2 5836.05 7 6354.00 16
2 Maize 215.80 282.59 278.46 -1 325.61 17 384.80 38
3 Kodo-Kutki 20.94 22.04 21.45 -3 18.91 -12 20.02 -7
Total Cereal 5326.42 5926.80 5772.45 -3 6151.16 7 6753.78 17
4 Arhar 67.91 85.82 87.83 2 102.00 16 164.00 87
5 Moong 9.11 10.11 11.01 9 14.00 27 22.00 100
6 Urd 54.87 56.99 67.20 18 88.00 31 115.00 71
7 Kulthi 23.27 21.00 20.77 -1 26.00 25 31.78 53
Total Pulses 155.30 174.07 186.97 7 270.77 45 345.00 85
8 Groundnut 63.80 76.87 85.02 11 87.75 7 154.00 81
9 Til 15.05 14.95 17.96 20 19.80 10 34.86 94
10 Soybean 103.97 135.67 144.55 7 156.25 8 198.60 37
11 Ramtil 27.26 19.01 20.22 6 24.25 20 54.00 167
Total Oilseed 201.70 248.38 268.74 8 316.14 18 474.24 76
G.Total 5682.50 6471.83 6229.73 -4 6735.87 8 7466.15 20
Achievement during Last Three Years & Proposed Programme

Kharif Crops – Productivity Unit-kg/ha.
S.
No.Crop
At the end of
Xth Plan
(06-07)
Year
07-08
Year
08-09
% inc.
over
07-08
Target
09-10
% Inc.
over
08-09
Target at
the end of
XIth Plan
% Incr.
over
08-09
1 Rice 1425 1560 1517 -3 1650 9 1800 19
2 Maize 1241 1579 1600 1 1721 8 1850 16
3 Kodo-Kutki 206 262 300 15 333 11 385 28
Total Cereal 1384 1547 1497 -3 1626 9 1782 19
4 Arhar 415 521 570 9 600 5 700 23
5 Moong 290 294 315 7 350 11 400 27
6 Urd 316 315 350 11 400 14 460 31
7 Kulthi 371 328 372 13 400 8 454 22
Total Pulses 360 392 428 9 547 28 600 40
8 Groundnut 1143 1242 1350 9 1350 4 1400 4
9 Til 313 306 340 11 360 6 400 18
10 Soybean 1020 1204 1195 -1 1250 5 1300 9
11 Ramtil 264 179 223 25 250 12 300 35
Total Oilseed 650 748 818 9 919 12 988 21
G.Total 1188 1357 1303 -4 1408 8 1541 18
Achievement during Last Three Years & Proposed Programme

Rabi Crops – Area Coverage Unit-000 Ha.
S.
No.Crop
At the end of
Xth Plan
(06-07)
Year
07-08
Year
08-09
% inc.
over
07-08
Target
09-10
% Inc.
over
08-09
Target at
the end of
XIth Plan
% incr.
over 08-
09
1 Wheat 149.25 163.35 165.12 1 170 3 180 9
2 Maize 18.48 21.81 19.39 -11 20 3 35 81
3
Paddy
(Rice) 166.25 162.27 170.23 5 170 0 185 9
Total Cereal 333.98 347.43 354.74 2 360.00 1 400.00 13
4 Gram 274.66 304.81 297.57 -2 310 4 360 21
5 Pea 26.40 46.47 42.76 -8 50 17 80 87
6 Lentil 24.41 26.18 21.82 -17 30 37 55 152
7 Moong 17.25 15.6 20.36 31 25 23 45 121
8 Urd 14.80 21.1 10.87 -48 20 84 35 222
9 Kulthi 32.13 34.34 26.2 -24 37 41 50 91
10 Lathyrus 449.64 481.49 389.43 -19 480 23 480 23
Total Pulses 864.10 935.59 813.70 -13 952.00 17 1110.00 36
Achievement during Last Three Years & Proposed Programme

Contd…
Rabi Crops – Area Coverage Unit-000 Ha.
S.
No.Crop
At the end
of Xth Plan
(06-07)
Year
07-08
Year
08-09
% inc.
over
07-08
Target
09-10
% Inc.
over
08-09
Target at
the end of
XIth Plan
% Incr.
over
08-09
11 Mustard 142.65 152.04 147.97 -3 160 8 210 42
12 Linseed 105.00 112.52 90.94 -19 115 26 120 32
13 Safflower 7.71 9.97 6.84 -31 10 46 15 119
14 Til 2.44 2.85 1.52 -47 5 229 10 558
15 Groundnut 6.84 14.66 15.8 8 16 1 25 58
Total Oilseed 294.11 324.86 285.51 -12 326.00 14 400.00 40
16 Sugarcane 21.90 23.61 14.51 -39 35 141 50 245
17 Vegetables 133.61 151.74 146.23 -4 150 3 200 37
Grand Total 1647.70
1783.2
3
1614.6
9 -9 1823.00 13 2160.00 34
Note:- 33 Tehsils of 8 districts were drought affected during 08-09. Adversely affected area and production.

Rabi Crops – Production Unit-000 MT
Achievement during Last Three Years & Proposed Programme
S.
No.Crop
At the
end of
Xth Plan
(06-07)
Year
07-08
Year
08-09
% inc.
over
07-08
Target
09-10
% Inc.
over
08-09
Target at
the end of
XIth Plan
% Incr.
over 08-09
1 Wheat 157.91
180.9
9
199.8
0 10 227.80 14 244.80 23
2 Maize 25.17 25.65 27.15 6 30.00 11 59.50 119
3 Paddy (Rice) 420.78
486.8
1
544.7
4 12 595.00 9 740.00 36
Total Cereal 603.86
693.4
5
771.6
8 11 852.80 11 1044.30 35
4 Gram 229.07
266.4
0
296.9
7 11 325.50 10 385.20 30
5 Pea 9.35 16.73 15.39 -8 25.00 62 48.00 212
6 Lentil 7.88 8.72 7.20 -17 12.75 77 27.50 282
7 Moong 3.98 3.68 4.80 31 8.13 69 20.25 322
8 Urd 3.77 5.49 2.72 -50 7.00 158 14.00 415
9 Kulthi 9.64 10.34 7.86 -24 13.88 77 22.50 186
10 Lathyrus 236.06
277.8
2
200.5
6 -28 288.00 44 312.00 56
Total Pulses 499.76
589.1
7
535.5
1 -9 680.25 27 829.45 55

Rabi Crops – Production Unit-000 MT
Contd…
S.
No.Crop
At the
end of
Xth Plan
(06-07)
Year
07-08
Year
08-09
% inc.
over
07-08
Target
09-10
% Inc. over
08-09
Target at
the end
of XIth
Plan
% Incr.
over 08-
09
11 Mustard 67.90 61.12 73.99 21 88.00 19 126.00 70
12 Linseed 26.88 45.01 33.01 -27 48.88 48 60.00 82
13 Safflower 1.73 2.34 1.57 -33 2.50 59 4.50 187
14 Til 0.86 1.01 0.59 -41 2.00 237 4.40 646
15 Groundnut 7.59 16.35 17.70 8 18.40 4 31.25 77
Total Oilseed 104.97 125.83 126.86 1 159.78 26 226.15 78
G. Total 1208.58
1408.4
5
1434.0
4 2 1692.83 18 2099.90 46

Rabi Crops – Productivity Unit-kg/ha.
S.
No.Crop
At the end
of Xth Plan
(06-07)
Year
07-08
Year
08-09
% inc.
over
07-08
Target
09-10
% Inc.
over
08-09
Target at
the end of
XIth Plan
% Incr.
over 08-09
1 Wheat 1058 1108 1210 9 1340 11 1360 12
2 Maize 1362 1176 1400 19 1500 7 1700 21
3
Paddy
(Rice) 2531 3000 3200 7 3500 9 4000 25
4 Gram 834 874 998 14 1050 5 1070 7
5 Pea 354 360 360 - 500 39 600 67
6 Lentil 323 333 330 -1 425 28 500 52
7 Moong 231 236 236 - 325 37 450 91
8 Urd 255 260 250 -4 350 40 400 60
9 Kulthi 300 301 300 - 375 25 450 50
10 Lathyrus 525 577 515 -11 600 17 650 26
Achievement during Last Three Years & Proposed Programme

Contd…
Rabi Crops – Productivity Unit-kg/ha.
S.
No.Crop
At the end
of Xth Plan
(06-07)
Year
07-08
Year
08-09
% inc.
over
07-08
Target
09-10
% Inc.
over
08-09
Target at
the end of
XIth Plan
% Incr.
over 08-09
11 Mustard 476 402 500 24 550 10 600 20
12 Linseed 256 400 363 -9 425 17 500 38
13 Safflower 225 235 230 -2 250 8 300 30
14 Sunflower 415 377 500 32 550 10 700 40
15 Til 352 354 390 10 400 3 440 13
16 Groundnut 1110 1115 1120 0 1150 3 1250 12

(a) Higher average rainfall (1325 mm. per annum)
(b) Varied soil types suitable for various crops.
(c) Adequate electricity.
(d) Availability of labour force.
(e) Rich in biodiversity.
(f) Availability of natural resources perennial river
and nalas.
SWOT ANALYSIS
1. STRENGTHS

(a) Dominance of SC / ST / Small and marginal
economically weaker families.
(b) Fragmented land holding.
(c) Erratic rainfall.
(d) Low irrigation (27 %).
(e) Light soils having low fertility and water holding
capacity.
(f) Broad cast method of sowing.
(g) Low adoption of farm mechanization.
2. WEAKNESS
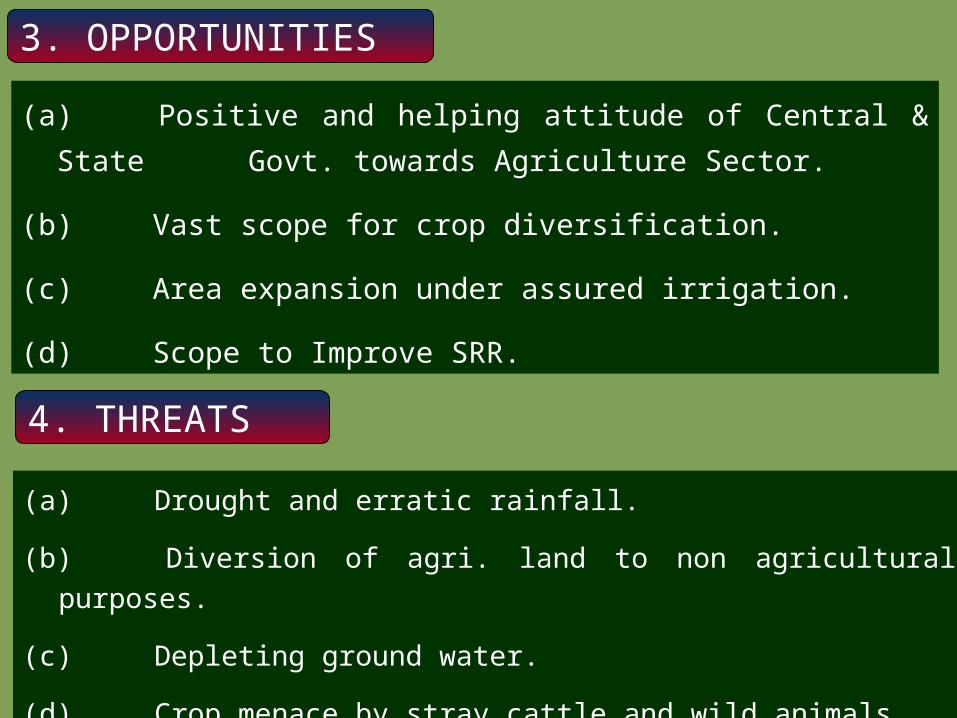
(a) Positive and helping attitude of Central & State
Govt. towards Agriculture Sector.
(b) Vast scope for crop diversification.
(c) Area expansion under assured irrigation.
(d) Scope to Improve SRR.
3. OPPORTUNITIES
(a) Drought and erratic rainfall.
(b) Diversion of agri. land to non agricultural purposes.
(c) Depleting ground water.
(d) Crop menace by stray cattle and wild animals.
4. THREATS

Not much scope for horizontal expansion durirng kharif.
However, Thrust on utilization of land.
Emphasis on diversion of upland rice with suitable pulses & oilseeds.
Utilization of rice bunds for growing Arhar & Sesamum (Til).
Intercropping of Arhar, Moong, Urd with traditionally grown minor millets (kodo-kutki)
Additional area under assured irrigation 2,34,400 ha.
Road Map for Balance Period - StrategiesArea : Additional target Kh. 0.64 + R 5.68 = 6.50 lac ha. (9.5 %)

Production : Additional target Kh. 12.36 + R 2.94 = 15.30 lac MT. (25 %)
• Quality Seed Production & Distribution
ParticularsBase year01-02
At the end of
Xth Plan 06-07
% Inc.
Year 07-08
Year 08-09
% inc.
year 07-
08
Target for
09-10
% Inc. over 08-09
Target at the end of XIth Plan
Area under Seed Production (Ha.)
Kharif 2448 9161 274 13114 22,504 72 30,000 33 40,000
Rabi 13 2542 19554 5346 6,891 29 10,000 45 15,000
Total 2461 11703 376 18460 29,395 59 40,000 36 55,000
Production of Foundation + Certified Seeds
Kharif 27633 115079 316 151310 261110 73 350000 34 4,50,000
Rabi 170 9120 5365 27895 55000 97 75000 36 1,35,000
Total 27803 124199 347 179205 316110 76 425000 34 5,85,000
Distribution of Foundation + Certified Seeds
Kharif 53749 109897 104 148605 255445 72 350000 37 5,00,000
Rabi 12376 18146 47 38696 64000 65 100000 56 1,50,000
Total 66125 128043 94 187301 319445 71 450000 41 6,50,000
Unit-in Qtls.
Particulars National
2006-07
State
2007-08 2008-09 2009-10 2010-11 2011-12
Paddy 20 7.65 13.8 16 20 25
Maize 30 11.50 12 17 20 30
Urd 23 1.36 3.2 10 15 20
Arhar 9.52 1.85 6.8 12 15 25
Groundnut 8 1.70 3 10 15 25
Soybean 27 37.62 46.9 50 50 50
Wheat 14 9.50 22.5 25 30 35
Gram 11 7.00 11 20 25 30
•Seed Replacement Rate of Major Crops Unit : %
iii) Seed Treatment Lakh ha. 16.10 26.00 35.00 40.00 148
Proposed Interventions Unit Achie. 08-09 Proposed Target %2009 2010 2011

•Seed Availability - Kharif 2009
Unit-in Qtls.
S.
No.Crop
Distri-bution.
2008
Demand
2009
Availability till dateExpected Additional
Availability Total Avail.
(Actual + Expected)
% Avail.
against targetSSC Pvt. Total SSC
Pvt.Total
1 Paddy 199474 286654 256872 35266 292138 12680 10000 22680 314818 109
2 Maize 3039 5000 554 1913 2467 - 2587 2587 5054 101
Total Cr. 202615 291859 257848 37179 295027 12680 12592 25272 320299 109
4 Arhar 2118 3500 2251 817 3068 - 437 437 3505 100
5 Urd 943 2000 911 199 1110 640 281 921 2031 101
6 Moong 640 1500 655 146 801 352 384 736 1537 102
Total Pl. 3701 7200 3817 1162 4979 1192 1102 2294 7273 101
7 Soybean 45392 46823 47662 11490 59152 - - - 59152 126
8 G.Nut 1547 2500 863 107 970 154 1389 1543 2513 100
Total Ol. 47456 50206 49079 11695 60774 254 1534 1788 62562 124
9
Others (Sunhemp & Dhencha)
1672 735 750 - 750 - - - 750 102
G.Total 255445 350000 311494 50036 361530 14126 15228 29354 390884 111

•Allocation of Seed Minikit During Kharif 2009
S.No.
CropDistribution
2008Demand
Kharif 09
Allocation Received from GOI
Minikit Received
1 Paddy 51000 45000 45000 18000
2 Maize 15000 16000 5000 -
Total Cereal 66000 61000 50000 18000
3 Arhar 10000 15000 11000 -
4 Moong 7000 13000 5500 -
5 Urd 250 15000 12000 -
Total Pulses 17250 43000 28500 -
6 Soybean 22795 175000 24675 -
7 Groundnut 4900 23000 6750 -
8 Til 3200 12500 3500 -
9 Castor 2850 7500 3750 -
10 Sunflower 2000 5000 2500 -
Total Oilseed 35745 223000 41175 -
Grand Total 118995 327000 119675 18000
Unit- in Nos.

Proposed Interventions Unit 2008 Proposed Target % over
082009 2010 2011
i) Emphasis on balanced
use of fertilizer
Av. Consumption
per ha.
K-75
R-65
K-88
R-66
K-89
R-69
K-90
R-70
K-20
R- 7.5Year
Area Lakh ha.
N P K TotalNutrients Consump-
tion (kg./ha.)
Comp. Ratio
2001 46.36 165.18 64.92 16.93 237.54 51 11:4:1
2006 47.44 218.03 86.68 35.84 340.55 71 6.6:2.6:1
% Increase - 131 34 112 43 72
2007 47.69 216.82 91.57 42.56 350.96 74 5:2:1
2008 47.81 212.56 100.55 47.23 360.34 75 4.4:2:1
% over 07 - -2 10 11 3 1
2009 Proposed 47.84 250.14 121.50 53.37 425.01 88 4.7:2.3:1
% over 08 - 18 20 13 18 89
2010 Proposed 48.31 246.00 123.00 61.50 430.50 89 4:2:1
2011 Proposed 48.45 250.00 125.00 62.50 437.50 90 4:2:1
NUTRIENT CONSUMPTIONNUTRIENT CONSUMPTION Unit-000' MT

Fertilizer Availability & Distribution Kharif 2009
ParticularsParticulars Urea Urea DAP/ DAP/ MAPMAP
NPKNPK MOPMOP SSPSSP TSPTSPOthers Others
(AS/CN)(AS/CN)TotalTotal
Distribution Distribution Kharif 2008Kharif 2008
381.50381.50 126.90126.90 81.0081.00 62.9062.90 87.5087.50 6.066.06 10.0010.00 755.86755.86
Target Kharif Target Kharif 20092009
450.00450.00 140.00140.00 113.00113.00 65.0065.00 130.00130.00 10.0010.00 4.004.00 912.00912.00
Balance on Balance on 01.04.0901.04.09
72.2072.20 51.5551.55 11.5011.50 16.0016.00 30.3030.30 2.302.30 4.404.40 188.50188.50
New Arrival New Arrival from 01.04.08 from 01.04.08 to 23.05.09to 23.05.09
72.0072.00 39.5039.50 16.4016.40 17.8017.80 26.4026.40 00 00 172.11172.11
Total Total Availability Availability
144.30144.30 91.0091.00 27.9027.90 33.9033.90 56.7056.70 2.402.40 4.404.40 360.60360.60
% Avai. % Avai. against targetagainst target
3232 6565 2525 5252 4343 2424 110110 4040
Req. for JuneReq. for June 144.50144.50 42.7042.70 32.9032.90 18.0018.00 37.5037.50 5.005.00 00 280.60280.60
Unit-000'MT
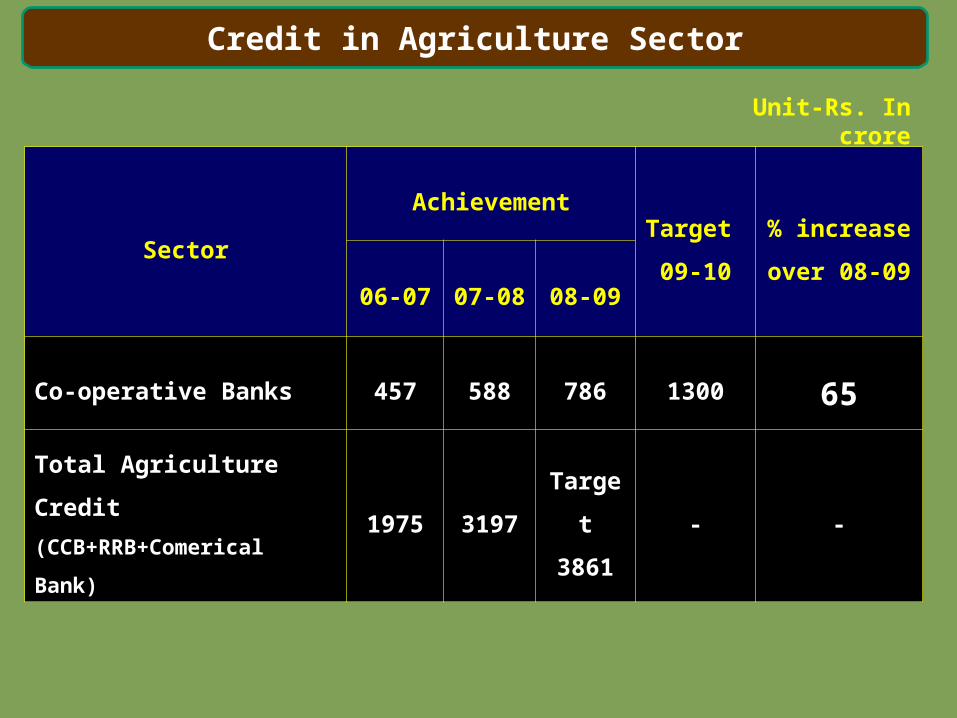
Credit in Agriculture Sector
Sector
AchievementTarget
09-10
% increase
over 08-09 06-07 07-08 08-09
Co-operative Banks 457 588 786 1300 65
Total Agriculture Credit
(CCB+RRB+Comerical Bank)1975 3197
Target
3861- -
Unit-Rs. In crore

Assured Irrigation
Proposed Interventions
Unit Achie.
08-09Proposed Target
2009 2010 2011 increase irrigated
area
% over 08
Area expansion under irrigation
i) Drilling of tube wells
No. 7770 15000 15000 15000 1,08,000 479
ii) Digging of New Wells
No. 1095 900 1000 1000 1200 165
iii) Shallow Tube Wells
installation of
No. 425 1575 2000 2000 2200 1212
a) Irrigation pumps No. 11794 10000 10000 10000 15000 154
b) Sprinkler Sets No. 16758 20000 20000 20000 1,08,000 258

Proposed
Interventions
Unit 2008 Proposed Target % over
082009 2010 2011
1. Distribution of Soil
health cards
Lakh Nos.
0.48 1.00 1.25 1.50 212
2. Soil Treatment
i) By Lime Ha. 1155 52500 60000 60000 -
ii) By Zipsum Ha. 27663 28000 30000 30000 218
3. Promotion of
i) Green Manuring 000' Ha. 1.10 2.00 2.50 3.00 173
ii) Organic Manure Lakh
Ton
20.68 25.00 30.00 35.00 69
Soil Health

Proposed
Interventions
Unit 2008 Proposed Target % over
082009 2010 2011
4. Bio-fertilizer Lakh
Packet
K- 6.40
R-4.67
7.50
5.00
9.00
5.50
10.00
6.00
K- 56
R - 28
5. Increase in area
under :
i) Line sowing
Lakh ha.
2.56 2.80 3.30 3.50 37
ii) Transplantation with special emphasis on SRI (lakh ha.) for Rice
Lakh ha.
8.10 8.50 8.75 9.00 11
6. Kisan Credit Card Nos. 1,87,794 300000 300000 300000 379
Soil Health

S.
No.Year Kharif Rabi Total
1 2006-07 370 180 550
2 2007-08 380 190 570
3 % increase over 06-07 3% 6% 4%
4 2008-09 395 170 565
5 % increase over 07-08 4% -6% -1%
6 2009-10
Emphasis on IPM and FFS,
need based pesticide application.7 2010-11
8 2011-12
Unit-MT (Tech.Grade)
Consumption of PesticidesConsumption of Pesticides

PROMOTIONS OF FARM MACHANIZATION
Particular Year 06-07 (Achi.)
Year 07-08 (Ach.)
Year 08-09 (Ach.)
Year 09-10 (Target)
Year 10-11 (Target)
At the end of XIth plan
(2011-12)
% over 08-09
Tractor (Dept. Scheme)
131 160 179 200 225 250
Others 7669 7340 8544 8500 8550 8600
Total 7800 7500 8723 8700 8775 8850 1.4
Power Tiller (Dept. Scheme)
30 299 505 600 625 650 28
Power Driven Implements (Dept. Scheme)
653 1633 1610 2000 2125 2275 41
Live demonstration of Agri. Machines
759 2632 2168 2500 2500 2500 15
Unit- No.

Agriculture Infrastructure DevelopmentS. No
Name of Structure Nos YearAmount (Rs. Lac)
Remarks
1 Fertilizer Testing Lab at Raipur 1 2007-08 90Under
Construction
2Establishment of Agriculture Implement Testing Unit at Raipur
1 2007-08 65Under
Construction
3Establishment of New Farmers Training Centre at Durg
1 2007-08 35Under
Construction
4Block Level Multipurpose Farmers Service Centre
36 2008-0955
eachUnder process
5Establishment of New Seed Testing Lab
3 2008-09130
eachUnder process
6Seed Grading Machine /Shed/ Seed Godown at Govt.Farm.
6 2007-0855
EachCompleted
7 State Pesticide Testing Lab. 1 2007-08 45 Completed
8Hostel for State Agriculture Training Academy (SATA)
1 2008-09 175Under
Construction
9 Input Godown at PACS 200 2008-09 6.5 each Under process
Existing – STL - 4, FTL - 1, PTL - 1, SATA - 1, FTC - 3, Govt.Farm-17

EXTENSION ACTIVITIES
ComponentAchievement
2008-09
Programme for
2009-10
Agricultural Exhibition 5 34
Field days 28 300
Trainings 1535 638
Demonstrations 6991 2904
Exposure Visits 67 311
Farm Schools 434 394
Mobilization of Farmer
Groups - 450

Crop loan @3 % per annum through co-operative banks . Additional Bonus @Rs. 220/- per quintal for paddy. Bonus @Rs. 25/- per quintal to sugarcane growers.
Farm Mechanization : VAT exempted on Agriculture Implements. 25 % additional subsidy for agricultural implements.
Irrigation : Assistance up to Rs. 50,000/- per pump for inerzization. Additional 30 % subsidy for SC / ST and 10 % for others under
MIP.
Seed : Budget provision of 10.52 crores to promote production
and distribution of quality seed.
Other : “Khalihan Agni Durghatna Rahat Yojna”- assistance up to
Rs. 10,000
Special Initiatives taken by Chhattisgarh Govt.

National Resource Management watershed development
(1) NWDPRA :- 10th Plan period up to 2006-07
1 No. of selected watersheds 185
2 Treatable Area 130697.00 ha.
3 Financial Target 5797.40 lakh
4 Treated Area up to 2006-07 117120.00 ha.
5 Financial Achievement 5639.11 lakh
6 No. of Saturated watersheds 177
IMPACT Base Year2001-02
Year 2006-07 % Increase
1 Additional area brought under cultivation 79028 ha. 88414 ha.
12
2 Increase in Double Cropped Area 12062 ha. 18493 ha.
53
3 Increase in Cropping intensity 109 % 127 % -
4 Increase in irrigated area
Kharif 10639 ha. 18740 ha.
17
Rabi 3387 ha. 8926 ha. 163
5 Average increase in ground water table 7.83 m. 6.85 m. 14

National Resource Management watershed development
1 No. of selected watershed 184
2 Treatable Area 133100.00 ha
3 Financial Target 15126.10 lakh
4 Progress during 2007-08
Physical 10081.00 ha.
Financial 604.12 lakh
5 Progress during 2008-09
Physical 8177.33 ha.
Financial 989.40 lakh
11th Plan period up to 2006-07
River Valley Project/Flood prone River
Particulars Physical Financial
Progress during 2006-07 11080.00 ha. 602.96 Lakh
Progress during 2007-08 10118.48 ha 602.666 Lakh
Progress during 2008-09 1811.54 ha. 92.40 Lakh

Issues for consideration
Under ISOPOM GOI released Rs. 887.77 lakhs
as against the approved work plan of Rs.
2120.91 lakh (Rs. 1575.68 lakh Central Share
+ Rs. 545.23 lakh State Share) during year
2008- 09. Rs. 244 Lakh (Central Share) is
required for pending payments.
Unit Cost fixed by GOI under MIS should be
revised according to the prevailing market
rate.

ThanksThanks . .
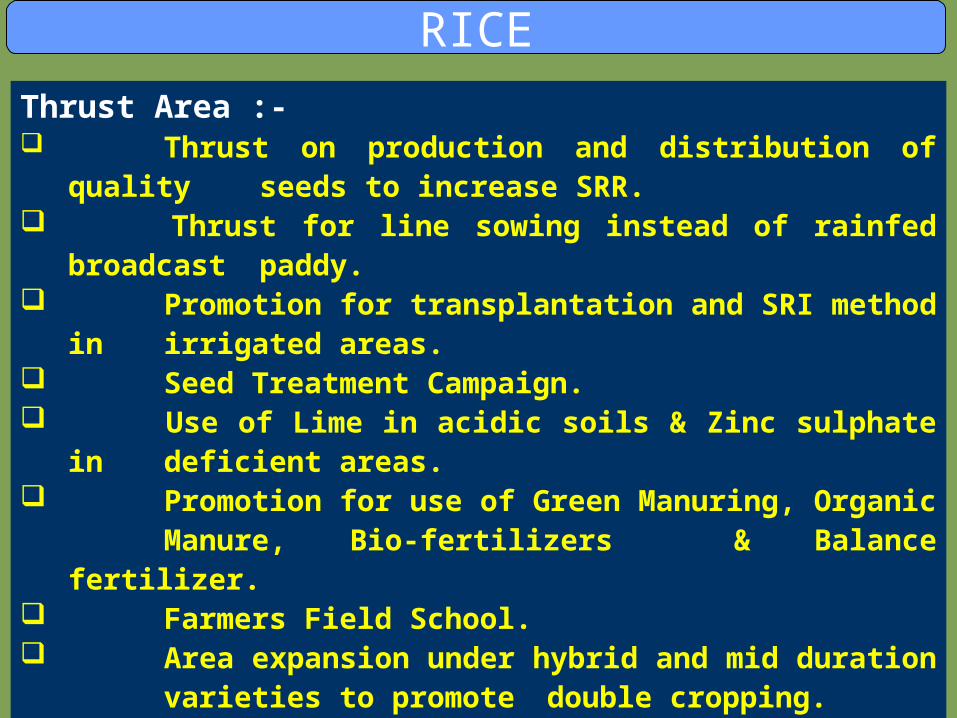
RICE
Thrust Area :- Thrust on production and distribution of
quality seeds to increase SRR. Thrust for line sowing instead of rainfed
broadcast paddy. Promotion for transplantation and SRI method
in irrigated areas. Seed Treatment Campaign. Use of Lime in acidic soils & Zinc sulphate in
deficient areas. Promotion for use of Green Manuring, Organic
Manure, Bio-fertilizers & Balance fertilizer. Farmers Field School. Area expansion under hybrid and mid duration
varieties to promote double cropping.

Rice - Area, Production & Productivity
YearYear Area (000'ha)Area (000'ha) Production (000'mt)Production (000'mt) Productivity (kg/ha.)Productivity (kg/ha.)
KharifKharif RabiRabi TotalTotal KharifKharif RabiRabi TotalTotal KharifKharif RabiRabi AverageAverage
2006-07 3573.02 166.25 3739.27 5091.55 420.78 5512.33 1425 2531 1474
2007-08 3568.06 162.27 3730.33 5566.17 486.81 6052.98 1560 3000 1623
2008-09 3610.47 170.23 3780.70 5477.08 544.74 6021.82 1517 3100 1592
2009-10 3537.00 170.00 3707.00 5836.05 595.00 6431.05 1650 3300 1734
2011-12 3530.00 185.00 3715.00 6354.00 740.00 7094.00 1800 4000 1910
% Incr. over 06-07
-1 11 -1 24 75 28 26 58 29

MAIZE
Thrust Area :- Promotion for use of Hybrid and H.Y. varieties. Summer maize in place of summer paddy. Thrust on use of balance fertilizer, micro-nutrients. Line sowing and inter culture operation.
YearYear Area (000'ha)Area (000'ha) Production (000'mt)Production (000'mt) Productivity Productivity (kg/ha.)(kg/ha.)
Kh.Kh. Rb.Rb. TotalTotal Kh.Kh. Rb.Rb. TotalTotal Kh.Kh. Rb.Rb. TotalTotal
2006-07 173.89 18.48 156.37 215.80 25.17 240.97 1241 1362 1541
2007-08 178.97 21.81 200.78 282.59 25.65 308.24 1176 1579 1555
2008-09 174.04 19.39 193.43 278.46 27.15 305.61 1400 1600 1580
2009-10 189.20 20.00 209.20 325.61 30.00 355.61 1500 1721 1700
2011-12 208.00 35.00 243.00 384.80 59.50 444.30 1700 1850 1828
% Incr. over
06-07
19 89 55 78 136 84 24 49 18
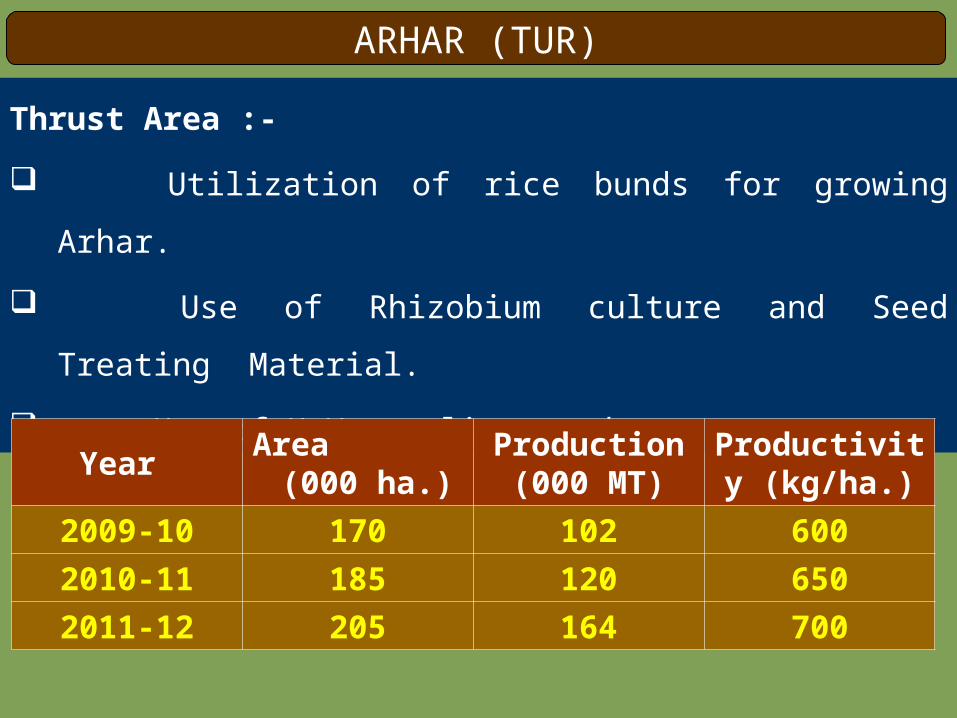
ARHAR (TUR)
Thrust Area :-
Utilization of rice bunds for growing Arhar.
Use of Rhizobium culture and Seed Treating
Material.
Use of H.Y. quality seed.
Year Area (000 ha.)
Production (000 MT)
Productivity (kg/ha.)
2009-10 170 102 600
2010-11 185 120 650
2011-12 205 164 700

Moong, Urd Use of yellow mosaic resistant HYV.
Seed treatment and use of Rhizobium culture.
Seed treatment and use of bio-fertilizer.
Promotion of NPK as basal dose.
YearYear Area (000'ha)Area (000'ha) Production (000'mt)Production (000'mt) Productivity (kg/ha.)Productivity (kg/ha.)
Kh.Kh. Rb.Rb. TotalTotal Kh.Kh. Rb.Rb. TotalTotal Kh.Kh. Rb.Rb. TotalTotal
2006-07 205.06 32.05 237.11 63.98 7.75 71.73 312 242 302
2007-08 215.32 36.70 252.02 67.10 9.17 69.27 312 250 302
2008-09 226.94 31.23 258.17 78.21 7.52 85.73 344 240 332
2009-10 260.00 45.00 305.00 102.00 15.13 117.13 392 336 384
2011-12 300.00 80.00 380.00 137.00 34.25 171.25 456 428 450
% Incr.
over 06-07
46 149 60 114 341 138 46 76 49

SOYBEAN
Thrust Area :-
Use of quality seed and Rhizobium culture, seed
treatment.
Timely sowing and need based plant protection.
Proper drainage and timely weed control .
Year Area (000 ha.)
Production (000 MT)
Productivity (kg/ha.)
2009-10 125 156 1250
2010-11 142 181 1275
2011-12 150 199 1300

Wheat
Encouraging timely sowing of wheat.
Adoption of the high temperature tolerant wheat verities.
Balanced use of fertilizer and soil amelioration (Gypsum).
Year Area (000 ha.)
Production (000 MT)
Productivity (kg/ha.)
2009-10 170 228 1340
2010-11 175 236 1350
2011-12 180 245 1360

Gram
Early sowing in Kharif fallow sloppy fields.
Emphasis on multi resistance high yielding varities.
More emphasis on use of trichoderma verdi, balance use of
fertilizer, micro nutrient & bio-fertilizer.
Emphasis on IPM practices, Farmers Field School, Farmer
Training.
Year Area (000 ha.)
Production (000 MT)
Productivity (kg/ha.)
2009-10 310 325 1050
2010-11 330 350 1060
2011-12 360 385 1070
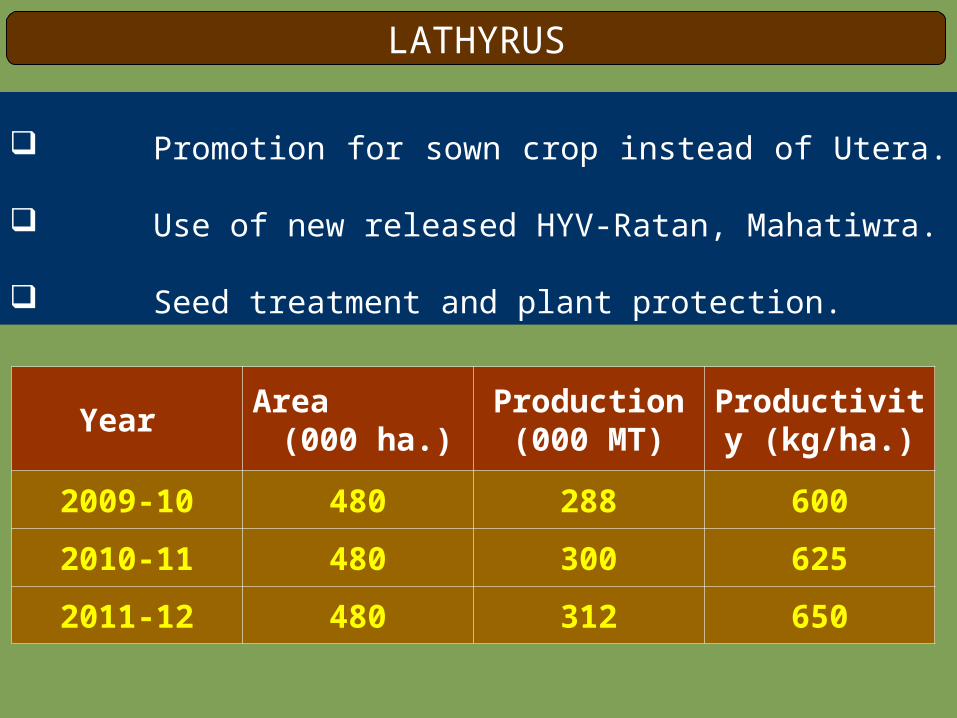
LATHYRUS
Promotion for sown crop instead of Utera.
Use of new released HYV-Ratan, Mahatiwra.
Seed treatment and plant protection.
Year Area (000 ha.)
Production (000 MT)
Productivity (kg/ha.)
2009-10 480 288 600
2010-11 480 300 625
2011-12 480 312 650

LINSEED
Timely sowing of multiple resistance high
yielding verities.
Use of sprinkler irrigation before flowering for
higher productivity.
Use of gypsum as a source of sulpher for higher
oil percentage.
Year Area (000 ha.)
Production (000 MT)
Productivity (kg/ha.)
2009-10 115 49 425
2010-11 118 53 450
2011-12 120 60 500

C.G. STATE ARICULTURAL MARKETING BOARD
Establishment of Board 23 Dec. 2000
Notified Agriculture Produce Marketing Samiti(Yards)
A Grade 12B Grade 17C Grade 30D Grade 14
----73
No. of Sub - Yards 108
Existing storage capacity - 2008-09 - 97400 M.Ton Targeted capacity up to 2011-12 - 298100 M.Ton

Paddy ('000 MT) 5434 5836 7 6760 16
Total Cereals 5648 6061 7 6940 15
Gram 30 31 3 47 52
Total Pulses 67 51 -24 66 29
Soybean 74 87 18 82 -6
Total Oilseeds 78 90 15 86 -4
Others 141 169 20 133 -21
Total produce 5934 6371 7 7225 13
Particulars10th Plan 2006-
072007-08
% over previous year
Achieve. 2008-09
% over 2007-08
2 4 6 7 9 10
MANDI ARRIVAL

Status of Implementation of Schemes of the Dept. of Agriculture Year 2008-09
Unit-Rs. In crore
Scheme Sanction by GOI
Fund
Released Utilization %
GOI State Total GOI State Total
Macro-
Manage. 2170.00 241.11 2411.00 2287.35 254.15 2541.50 2372.46 93
ISOPOM 1575.68 545.23 2120.91 887.77 315.92 1203.69 1198.27 99
ATMA 770.88 85.65 857.00 549.00 61.00 610.00 600.05 98
RKVY 14737.54 0.00 14737.54 12155.31 0.00 12155.318204.31
67
NFSM (RICE) 3151.60 0.00 3151.60 3151.60 0.00 3151.60 1966.45 62
NFSM (PULSE)
4842.46 0.00 4842.46 4842.46 0.00 4842.46 3368.07 70

Status of Implementation of Schemes of the Dept. of Agriculture Year 2008-09
Unit-Rs. In crore
Scheme Sanction by GOI (Rs. Crore) Fund Released
GOI State GOI
RKVY
Dept. 07-08 08-09 Total - 07-08 08-09 Total
Agri. 2904.87 4312.85 7217.72 - 0.00 5285.61 5285.61
Horti 1043.00 2368.86 3411.86 - 0.00 3024.36 3024.36
Mandi 795.00 1126.00 1921.00 - 0.00 1824.35 1824.35
Seed Co- 410.00 1776.96 2186.96 - 0.00 2020.99 2020.99
Fisheries 390.00 1242.00 1632.00 - 0.00 1409.56 1409.56
Veterinaries 1195.46 2783.43 3978.89 - 0.00 3305.71 3305.71
Total 6738.33 13610.10 20348.43 0.00 0.00 16870.58 16870.58

Status of Implementation of Schemes of the Dept. of Agriculture Year 2008-09
Unit-Rs. In crore
Scheme
Utilization
%GOI
Dept. 07-08 08-09 Total
RKVY
Agri. 0.00 2984.61 2984.61 56
Horti 0.00 2074.36 2074.36 69
Mandi 0.00 1724.35 1724.35 95
Seed Co. 0.00 1420.99 1420.99 70
Fisheries 0.00 809.56 809.56 57
Veterinaries 0.00 2105.71 2105.71 64
Total 0.00 11119.58 11119.58 66
Note:- * Rs. 23.01 crore released on 31.03.09 by GOI.

Different Activities under “ATMA” (2006-07 to 2008-09)
S. No.
Activities
YEAR
2006-07 2007-08 2008-09
Target Achiev. TargetAchiev
.Target Achiev.
1 Training of Farmers 182 182 173 194 25400
2 Organizing demonstrations 712 712 2638 1473 1914
3 Exposure visits of farmers 20 20 87 35 9100
4Mobilization of Farmers Groups-FIG/WIF/Fos/ COs/FCs -
125 125 60 41 250
5Rewards/ incentives to best organized groups
0 0 8 3 25
6 Farmer Awards 0 0 21 8 135
7District level exhibition/ kisan melas/ fruit/ vegetable shows
9 9 10 5 10
8 Farmer- Scientist Interaction 10 7 10 6 10
9Organization Field Days and Kisan Goshties to strengthen R-E-F linkages
56 56 60 26 116
10 Farm School 0 0 0 0 22
Total 1114 1111 3067 1791 36982 Note:- Due to model code of conduct for Assembly & Parliament Election and late release of fund (Feb. & March, 09) activities could not under taken during 08-09
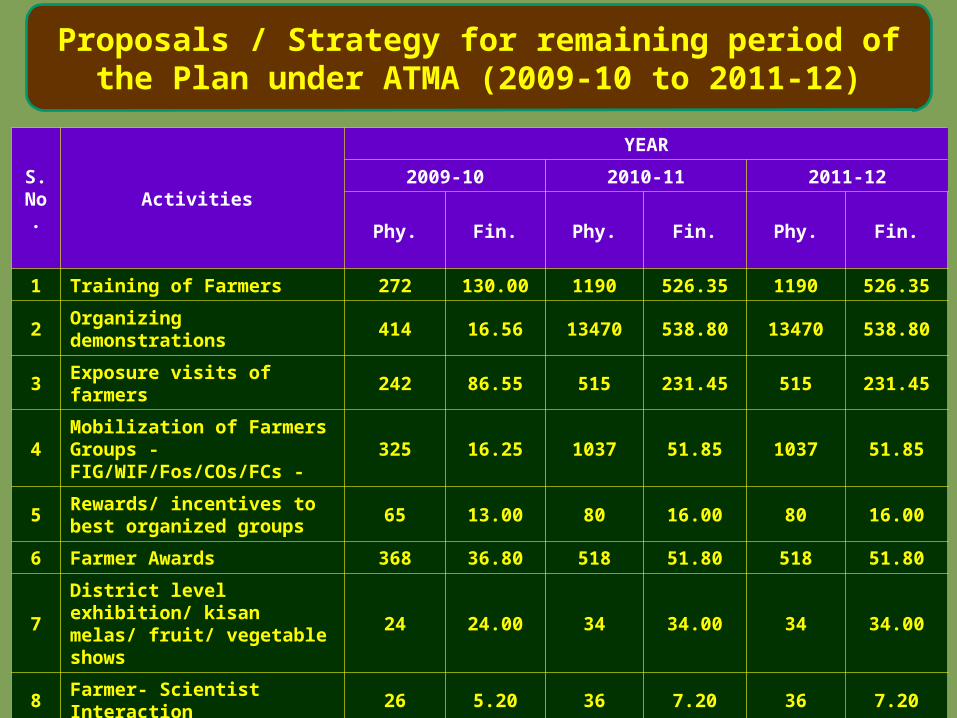
Proposals / Strategy for remaining period of the Plan under ATMA (2009-10 to 2011-12)
S. No.
Activities
YEAR
2009-10 2010-11 2011-12
Phy. Fin. Phy. Fin. Phy. Fin.
1 Training of Farmers 272 130.00 1190 526.35 1190 526.35
2 Organizing demonstrations 414 16.56 13470 538.80 13470 538.80
3 Exposure visits of farmers 242 86.55 515 231.45 515 231.45
4Mobilization of Farmers Groups - FIG/WIF/Fos/COs/FCs -
325 16.25 1037 51.85 1037 51.85
5Rewards/ incentives to best organized groups
65 13.00 80 16.00 80 16.00
6 Farmer Awards 368 36.80 518 51.80 518 51.80
7District level exhibition/ kisan melas/ fruit/ vegetable shows
24 24.00 34 34.00 34 34.00
8 Farmer- Scientist Interaction 26 5.20 36 7.20 36 7.20
9Organization Field Days and Kisan Goshties to strengthen
R-E-F linkages 184 44.10 292 43.80 292 43.80
10 Farm School 167 85.17 129 65.80 129 65.80
Total 457.63 1567.05 1567.05
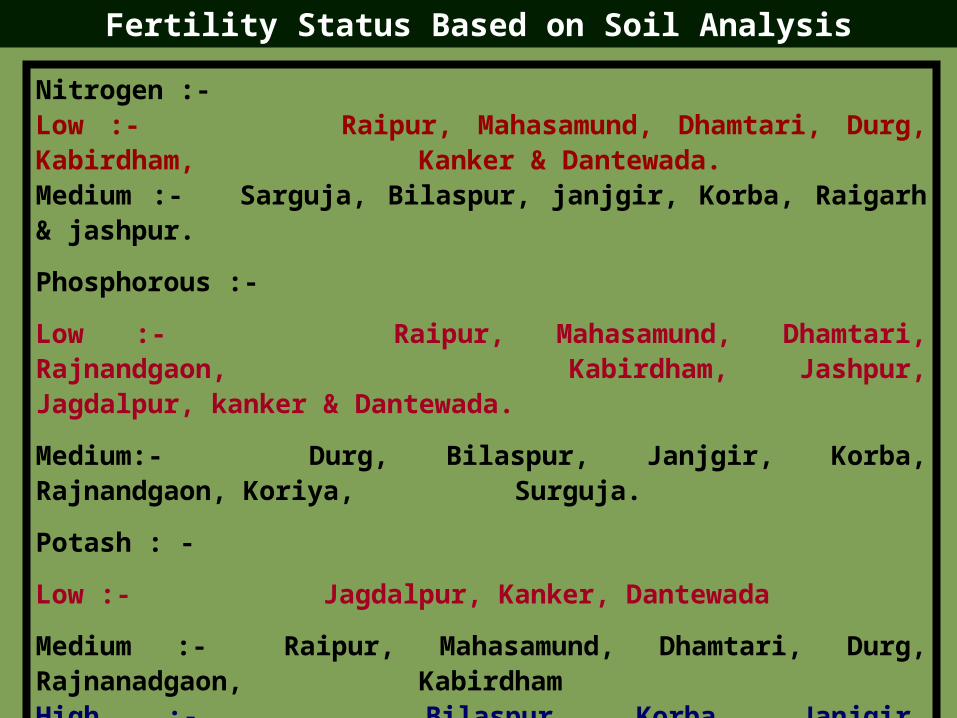
Fertility Status Based on Soil Analysis
Nitrogen :-Low :- Raipur, Mahasamund, Dhamtari, Durg, Kabirdham,
Kanker & Dantewada.Medium :- Sarguja, Bilaspur, janjgir, Korba, Raigarh & jashpur.
Phosphorous :-
Low :- Raipur, Mahasamund, Dhamtari, Rajnandgaon, Kabirdham, Jashpur, Jagdalpur, kanker & Dantewada.
Medium:- Durg, Bilaspur, Janjgir, Korba, Rajnandgaon, Koriya, Surguja.
Potash : -
Low :- Jagdalpur, Kanker, Dantewada
Medium :- Raipur, Mahasamund, Dhamtari, Durg, Rajnanadgaon, KabirdhamHigh :- Bilaspur, Korba, Janjgir, Rajnandgaon, Jashpur,
Koriya, Surguja

Zinc :- More than 50% of soil in Raipur, Rajnandgaon, Janjgir,
Dhamtari, Kabirdham & Korba are deficit in zinc.
Other Micro Nutrients:-
More then 35% soil samples from surguja districts showed
deficiency of copper, ferrous & manganease.
29% Soil samples from Durg, 10% from Raipur, 14% from
korba & 12% from Rajnandgaon showed deficiency of Ferrous
(Iron)
pH:- 64% samples from Raigarh , 27-35% samples from
Bastar Division & 15% samples from Raipur,
Mahasamund, Surguja, Dhamtari showed an acidic
trend.
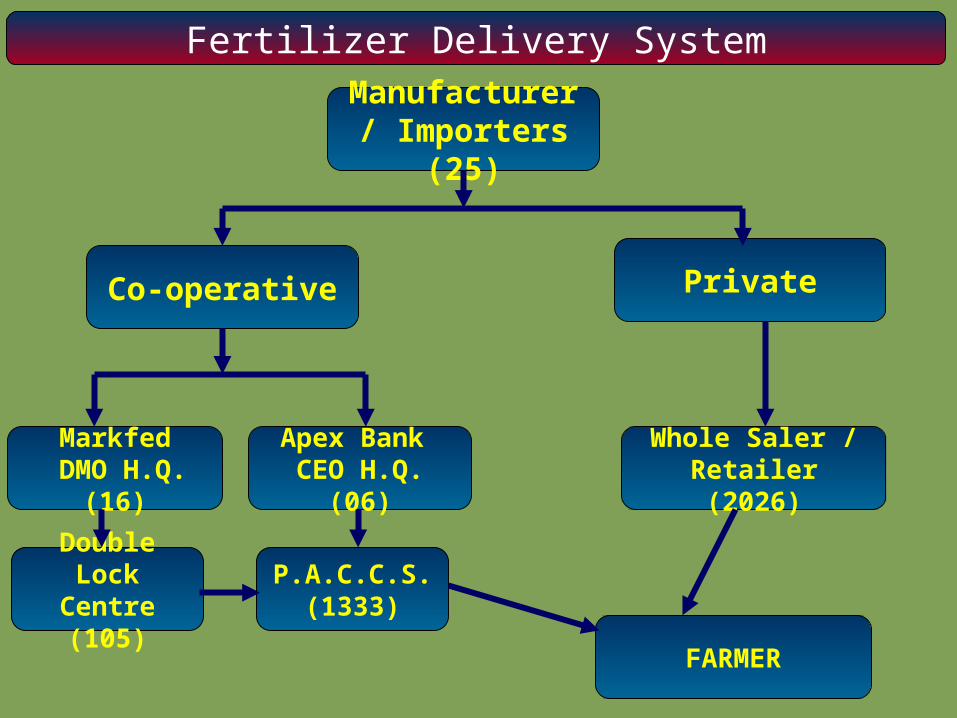
Fertilizer Delivery System
Manufacturer / Importers (25)
Co-operative Private
Markfed DMO H.Q. (16)
Apex Bank CEO H.Q. (06)
Double Lock Centre (105)
P.A.C.C.S. (1333)
Whole Saler / Retailer (2026)
FARMER

FACILITIES AT SEED FARMSFACILITIES AT SEED FARMS :
S.
No.Particular Unit
Govt. + S.S.C. Farm
Ava.
06-07
Avg.
07-08
Ava.
08-09
Dmd.
09-10
Dmd.
10-11
Dmd.
11-12
1Seed Grading
Machine Nos. 19 - 6 2 5 5
2 Seed Godown Nos. 11 - 6 10 13 14
3 Threshing Floor Nos. 27 - 0 0 10 17
4 Tube well Nos. 51 17 40 20 10 15
5 Tractor Nos. 27 6 7 9 4 5
6 Reaper Nos. 0 - 23 4 2 2
7 Fencing RMD 0 - 7898 19582 25000 35000

IRRIGATION SOURCESIRRIGATION SOURCES
Year Tube-
well
Shallow
Tube-
well
Minor
Irrigation
Tank
Shakam-
bhari
MIS (Ha.)
Sprinkler Drip
Pum Well
2007-08 Achi.
8835 - 239 9892 1101 26733 36
2008-09 Achi.
7770 425 207 11794 1095 16758 19
2009-10 Target
15000 1575 300 10000 900 20000 -
2010-11 Target
15000 2000 320 10000 1000 20000 -
2011-12 Target
15000 2000 340 10000 1000 20000 -
Unit : Nos.

Chhattisgarh comprises of 3 Agro climatic zones -
(i) Chhattisgarh Plans (CP)
(ii) Bastar Plateau (BP)
(iii) Northen Hilly Region (NHR) of Chhattisgarh .
On the basis of Rainfall, Soil type, depth of soil &
slope ACE's may be further divided into 19 (CP) 7
(BP) 14 (NHR) & Agro ecological zones respectively.
SOIL SITUATION IN STATE

No.Local Name
of Soil
Scientific
classificationSoil Texture
Area
(%)
1 Bhata Entisol Sandy loam 20
2 Matasi Entisol + Inceptysol Loamy sand 27
3 Dorsa Entisol + InceptysolSandy Clayey
loan28
4 Kanhar Inceptysol + EntisolClayey Loan,
clay22
5 Kachhar Alluvial sol Loamy clayey 3
Soils of the state are categorized under 5 Broad
classes. Local names, their scientific classification and
area coverage are:-
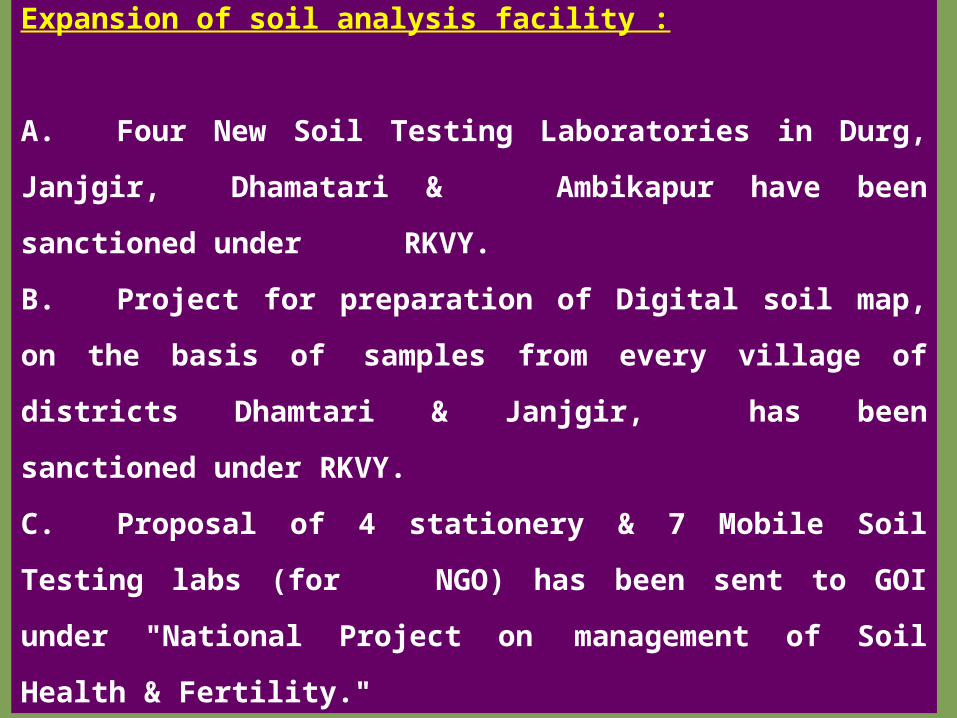
Expansion of soil analysis facility :
A. Four New Soil Testing Laboratories in Durg, Janjgir,
Dhamatari & Ambikapur have been sanctioned under RKVY.
B. Project for preparation of Digital soil map, on the basis of
samples from every village of districts Dhamtari & Janjgir,
has been sanctioned under RKVY.
C. Proposal of 4 stationery & 7 Mobile Soil Testing labs (for
NGO) has been sent to GOI under "National Project on
management of Soil Health & Fertility."

HUMAN RESOURCE FOR EXTENSION
Post of RAEO as on 2000-01 : 2421
Post of RAEO’s increased from : 2421 to 3758 (increase 1337)
Post filled up as on dt. : 2478
Krishak-Sangi-Krishak Bahini – New programme to be launched to assure active participation of innovative / progressive farmers/Women
Temporary substitution of vacant RAEO post 750 Sangi-Bahini in 750 clusters will be entrusted extension works on honorarium basis.
Approx 5 lakh farmers of 7000 villages will be enlightened during Kharif Campaign (Krishak Pakhwada) – 21st May to 7 June 2009.

Development of Ideal Market Yards 05 markets viz : Dhamtari, Kurud, Kawardha, Rajnandgaon, Durg & Mungeli are under taken as pilot projects, with total financial outlay of Rs. 38.99 crore under scheme "Development/Strengthening of Agricultural Marketing Infrastructure, Grading and Standardization" of G.O.I. These are in final stages.
Development of Fruit and Vegetable Market Yards 06 markets viz Raipur, Bilaspur, Raigarh, Durg, Rajnandgaon & Pakhanjur are under taken in first phase with total financial outlay of Rs. 64.28 crore are under scheme "Development/ Strengthening of Agricultural Marketing Infrastructure, Grading and Standardization" of G.O.I., out of which 3 markets are in final stages.
Development and improvement of infrastructures in 30 Hatt Bazars and 14 sub market yards of Tribal districts of Chhattisgarh are under taken with total financial outlay of Rs. 210.00 lacs and 483.00 lacs respectively under R.K.V.Y.
Cont. ..
ON GOING MAJOR PROJECTS OF MARKETING IN THE STATE

For improvement of quality of agri produce – 25 Grading Machine are been established in identified market yards with R.K.V.Y. and own resources of State Marketing Board.
Expansion of Storage Capacity :- To enhance the existing storage capacity of 97400 m.ton in market yards to the capacity of 298100 m.ton at the end of 2011-12, in phases. The construction of 13 Godowns in 2008-09 with total financial outlay of Rs. 390.00 Lacs are under construction by R.K.V.Y. and our own resources.
The old traditional tripod type weigh bridges existing in A.P.M.C’s are been replaced by the Electronic weighing machines in phases.
ON GOING MAJOR PROJECTS OF MARKETING IN THE STATE

PROPOSED IMPROVEMENT IN MARKEING
Improvement of information facilities by providing Electronic Display Boards in market yards linked with all important markets of India for depicting the prevailing market rates.
The establishment of various electronic marketing system in market yards itself as an alternative to the farmers and traders.
Establishment of Cold Storage and packing facilities in fruit and vegetable markets through private entrepreneurs.
Cont….

PROPOSED IMPROVEMENT IN MARKEING
Establishment and development of Modern Hatt Bazar in tribal area.
Establishment and development of Separate whole sale fish and live spot markets in selected area.
Establishment of professionally managed Agri business development facility for horticulture produces.
To improve the facilities in procurement centers of primary co-operation societies
To establish an export oriented special market for forest produces.

ARRIVALS OF AGRICULTURAL PRODUCE IN 2008-09 (in M.Ton)
S. No
Name/ Type of Produce
Ravi
(April 08 – Sep. 08)
Kharif
(Oct 08 – March 09)
Total
1 Paddy 14,97,091.60 52,63,703.90 67,60,795.50
2 Soyabean 4,568.60 77,804.40 82,373.00
3 Other Oil Seeds
1,649.70 1,998.20 3,647.90
4 Pulses 41,468.70 24,135.00 65,603.70
5 Other Produce
1,28,234.50 1,84,594.90 3,12,829.40
Total 16,73,013.10 55,52,236.40 72,25,249.50

Information of Meeting on Dated : 27.05.2009 at New Delhi (In reference to letter of GOI no.3-6/2009-RKVY dated : 17.04.09)
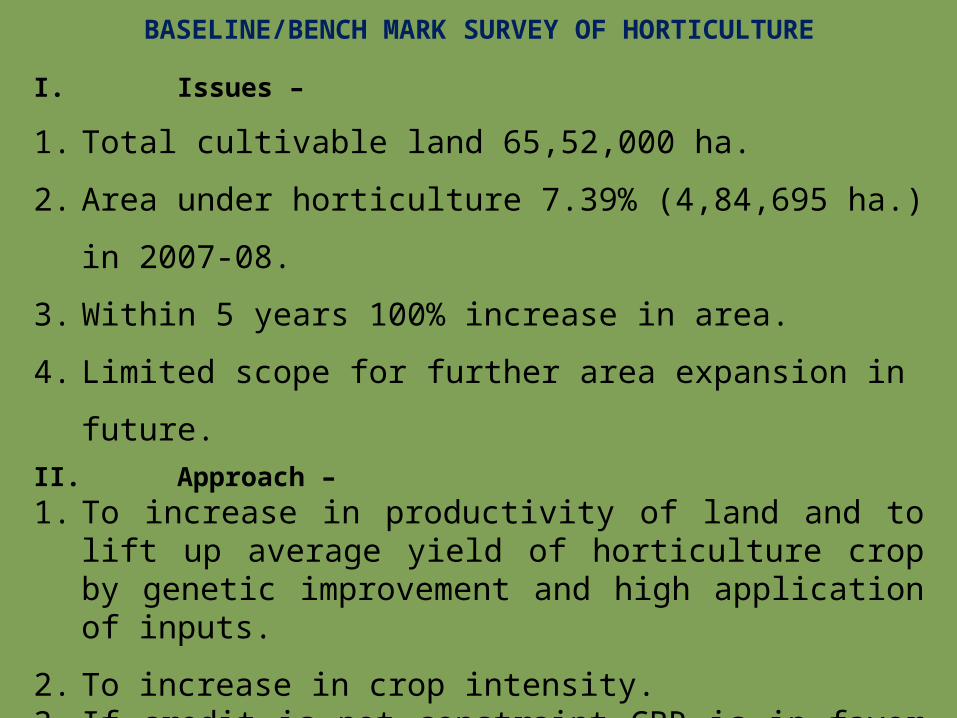
I. Issues –
1. Total cultivable land 65,52,000 ha.
2. Area under horticulture 7.39% (4,84,695 ha.) in 2007-08.
3. Within 5 years 100% increase in area.
4. Limited scope for further area expansion in future.
II. Approach –
1. To increase in productivity of land and to lift up average yield of horticulture crop by genetic improvement and high application of inputs.
2. To increase in crop intensity.3. If credit is not constraint CBR is in favor of crop diversification
towards vegetables and fruits. If markets are brought closer to farm gate and post-harvest losses are minimized then CBR of horticulture is become more than CBR of cereals.
4. Production diversification and supply chain efficiency are key issues to reap the maximum benefits.
III. Status
BASELINE/BENCH MARK SURVEY OF HORTICULTURE

BASE LINE/BENCH MARK SURVEY OF HORTICULTURAL CROPS
• Data of 2008-09 is not available, survey is in progress.• Diversification in the cropping pattern away from food grains towards horticulture and more towards
vegetables and fruits.• Due to huge domestic demand (because absence of pulses in food bowl), in-spite of being one of the
largest producer of vegetable, does not have much of marketable volume. Besides this there are supply constraints and huge post-harvest losses, which leads to lower actual available produce.
• Chili, Cabbage, Kundru (Coccinia indica), Banana & Papaya are major crops of export to outside of state.
Sl. No. Crops
2005-062006-07
2007-08 %age increased
Area Production Area Production Area Production Area Production
(in Ha.) (Tn.) (in Ha.) (Tn.) (in Ha.) (Tn.) (in Ha.) (Tn.)
1. 2. 3. 4. 5. 6. 7. 8. 9. 10.
1 Fruits 75401.09 643171.29 99696.20 680928.05124664.00 932025.91
65.33 44.91(25.72%) (22.10%)
2 Vegetables 195617.10 2431520.60 236105.00 2339800.55292562.00 2924605.50
49.56 20.28(60.36%) (69.34%)
3 Spices 29054.60 168226.10 40556.90 198728.8153614.25 288738.44
84.53 71.64(11.06%) (6.85%)
4Medicinal & Arometics
2086.00 11890.20 10274.62 58565.3311500.00 65550.00
451.29 451.29(2.37%) (1.55%)
5 Flowers 1551.00 3302.30 2030.50 4304.662355.40 6912.52
51.86 109.32(0.49%) (0.16%)
Total - 303709.79 3258110.47 388663.22 3282327.40 484695.65 4217832.37 --- ---

CHANGE IN AREA & PRODUCTION TRENDS OF HORTICULTURE CROPS

AREA & PRODUCTION SHARE IN TOTAL FRUITS / VEGETABLES
22%
Potato
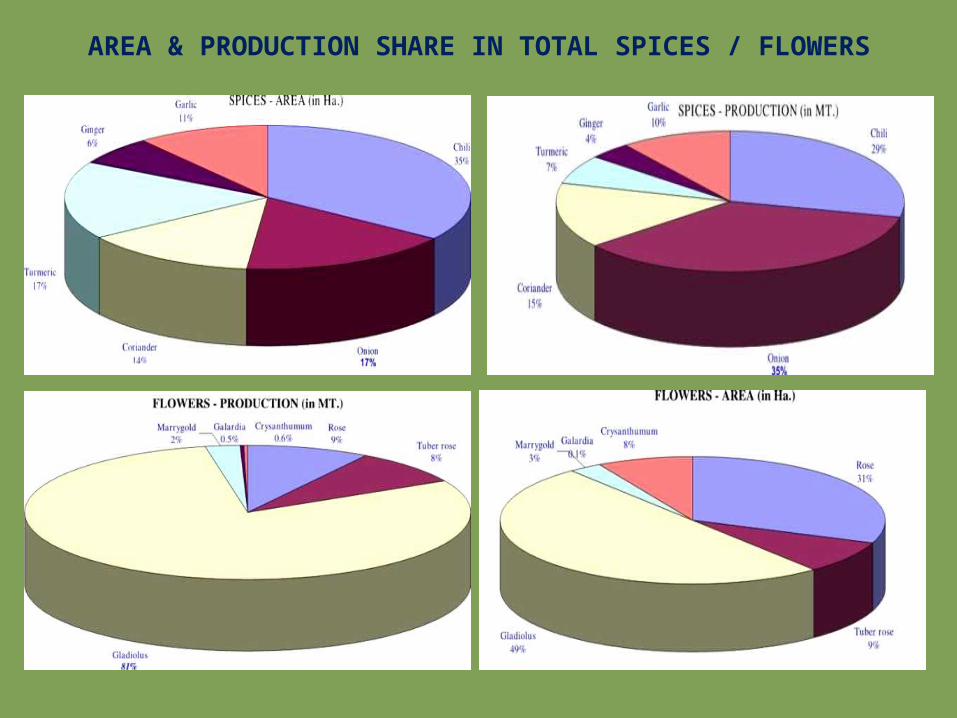
AREA & PRODUCTION SHARE IN TOTAL SPICES / FLOWERS

YIELD GAP AND POTENTIAL OF DIFFERENT HORTICULTURE CROPS
Sl. No. Name of Crops Present ProductivityYield potential of State
(S.A.U recommendation ) Yield Gap National Average
1. 2. 3. 4. 5. 6.A. FRUITS -1. Mango 3.27 8 4.73 6.32. Litchi 0.53 6 5.47 63. Lime 6.01 8 1.99 94. Custard apple 2.97 4 1.03 5. Banana 26.52 60 33.48 35.96. Papaya 18.37 70 51.63 33.47. Guava 7.04 16 8.96 11.18. Cashew 0.42 2 1.58 0.8B. Spices -1. Chili (Green) 6.01 17.5 11.49 1.62. Onion 15.58 20 4.42 15.13. Coriander 2.84 3 0.16 0.64. Turmeric 7.11 25 17.89 4.65. Ginger 7.83 20 12.17 3.56. Garlic 4.49 7.5 3.01 4.8C. Vegetables -1. Potato 11.17 25 13.83 19.32. Tomato 10.72 15 4.28 17.93. Lady finger 8.8 10 1.2 10.34. Cauliflower 15.17 20 4.83 18.15. Cabbage 15.72 25 9.28 22.26. Brinjal 14.66 20 5.34 177. Bottle guard 16.4 25 8.6 8. Bitter guard 9.81 15 5.19 9. Musk melon 8.83 17.5 8.67
10. Water melon 10.47 25 14.53 11. Pumpkin 11.16 20 8.84 D. Aromatics -1. Leman grass 13.34 2. Patchouli 2.89 3. Palmarosa 1.77 4. Vitrever 14.59 5. E. Citridora 5.71 6. Aloevera 9.49
(IN MT. / HA.)

ROAD MAP FOR IMPLEMENTATION OF NHM (2009-10 TO 2011-12)(FIN. TAR – RS. IN LAKHS)
Sl. No. Activity Unit2009-10 2010-11 2011-12 Total
Phy. Tar Fin. Tar Phy. Tar Fin. Tar Phy. Tar Fin. Tar Phy. Tar Fin. Tar1. 2. 3. 4. 5. 6. 7. 8. 9. 10. 11.
1. Establishment of Model Nurseries (public sector) Nos. 18 324.00 15 270.00 10 180.00 43 774.00
2. Spices production - Ha. 6720 756.00 9000 1012.50 8000 900.00 23720 2668.503. Establishment of New Gardens -
a. Perennial Fruit Crops Ha. 4980 540.77 6500 731.25 5500 618.75 16980 1890.77b. Non-Perennial Crops Ha. 2230 334.50 3000 450.00 2500 375.00 7730 1159.50
4. Flower Crops - a. Cut Flower Ha. 550 192.50 750 262.50 650 227.50 1950 682.50b. Bulbulous Flower Ha. 1200 540.00 1600 720.00 1400 630.00 4200 1890.00c. Loose Flower Ha. 500 60.00 700 84.00 600 72.00 1800 216.00
5. Aromatic Plants Ha. 2100 236.25 3000 337.50 2500 281.25 7600 855.006. Plantation Crop - Cashew Ha. 5000 281.25 6000 337.50 5500 309.37 16500 928.12
7. Rejuvenation of Old Orchards Ha. 250 37.50 400 60.00 300 45.00 950 142.508. Creation of Water Resources (Bore-wells) Nos. 500 350.00 600 420.00 700 490.00 1800 1260.009. Protected Cultivation -
a. Green house Nos. 2 6.50 10 32.50 5 16.25 17 55.25b. Mulching Ha. 3000 210.00 4000 280.00 3500 245.00 10500 735.00c. Shade net Nos. 10000 350.00 12000 420.00 11000 385.00 33000 1155.00d. Plastic Tunnels Ha. 1000 50.00 2000 100.00 1500 75.00 4500 225.00
10. Promotion of IPM Ha. 5500 55.00 7500 75.00 6500 65.00 19500 195.0011. Organic Farming -
a. Adaption of Organic Farming Ha. 650 65.00 1000 100.00 800 80.00 2450 245.00b. Vermi compost units i. Pucca tanka Nos. 250 75.00 400 120.00 300 90.00 950 285.00ii. Portable HDPE bags Ha. 2600 780.00 3500 1050.00 3000 900.00 9100 2730.00
12. HRD Activities -Training at all levels Nos. 16000 345.00 25000 400.00 20000 350.00 61000 1095.0013. Post Harvest management -
a. Establishment of Oil extraction units Nos. 6 7.50 15 18.75 20 25.00 41 51.25b. Aloevera gel ex. Plant Nos. 11 27.50 15 37.50 20 50.00 46 115.00c. Cold Storage Nos. 14 700.00 16 800.00 18 900.00 48 2400.00d. Leaf root collection centre Nos. 11 27.50 13 32.50 15 37.50 39 97.50e. Cashew low cast processing unit Nos. 20 2.50 25 3.12 30 3.75 75 9.37f. Pack house Nos. 60 37.50 70 43.75 80 50.00 210 131.25
14. Rural market Nos. 17 63.75 20 75.00 25 93.75 62 232.5015. Whole- sale market Nos. 3 799.75 4 1080.00 5 1350.00 12 3229.75
Total - 63192 7255.27 87153 9353.37 74478 8845.12 224823 25453.76

PROCESSING AND VALUE ADDITION
Sl. No. Unit established No. of unit Name of district Capacity
1. Tomato Grading Machine 02 Jashpur & Durg 500 Kg./Hr.
2. Potato Grading Machine 02Sarguja & Raipur (State Vegetable Seed
Production Farm, Bana)500 Kg./Hr.
3. Fruit & Vegetable Grading Plant 01 Raipur 500 Kg./Hr.
4. Banana Grading & Waxing Plant 01 Raipur 400-500 Kg./Hr.
5. Cashew-nut Processing Machine 04 Bastar (03), Raigarh (01) 2.5 Tn./Day
6.Lemon Grass & E.citridora Distillation
Plant12
Durg (03), Raipur (02), Raigarh (02), Bastar (02), Sarguja (02), Korba (01)
1.5 Ton. per batch
7. Aloevera Juice/Gel Extraction Unit 03 Dhamtari (02), Kanker (01) 200 Kg./Hr.
8.Tomato grading cum juice/puree
processing plant02 Janjgir-Champa 500 Kg./Hr.
UNITS ESTABLISHED IN THE STATE -

PROCESSING AND VALUE ADDITION
POSSIBILITIES OF PROCESSING UNITS TO BE ESTABLISHED IN CHHATTISGARH -
Sl. No. Name of the crop Location Area of the crop (Ha.)
Production (MT.)
Proposed unit
1. Cashew nutJagdalpur 7386 4000
Cashew processing unit.Raigarh 7070 3345
Total - 14456 7345 -----
2. BananaRaipur 1500 82500
Banana fiber extraction unit.Durg 1043 76139
Total - 2543 158639 -----
3. PapayaRaipur 1480 66600 Papain extraction unit & Gem
processing unit.Durg 869 52140
Total - 2349 118740 -----
4. TomatoDurg 6208 93120 Tomato pulp & puree processing
unit.Jashpur 3350 67000
Total - 9558 160120 -----
5. Ginger Raigarh 959 19180 Ginger paste processing unit.
6. ChiliJagdalpur 1120 5600
Chili powder processing unit.Rajnandgaon 1055 5275
Total - 2175 10875 -----

ACTIVITY WISE COMPARISON OF PRE-NHM & POST-NHM PERIOD
Sl. No. Name of the Activity Unit Pre-NHM Period Post-NHM Period
1. Area of orchards -
a. PerennialHa.
40197.09 108670
B. Non Perennial 6050.14 15995
2. Establishment of Nurseries No. 111 119
3. Green Houses No. - 25
4. Shade net House No. - 251
5. Mist Chambers & Hardening Yards No. - 11
6. Spices Production Ha. 28399 53614
7. Flower Cultivation Ha. 1508 2356
8. Plantation Crop- Cashew Ha. 4268 7167
9. Protected Cultivation - Distribution of Shade net No. - 12125
10. Promotion of INM / IPM Ha. - 40000
11. Organic Farming Ha. - 8350
12. Vermi Compost Units -
a. Pucca Tanka No. - 784
b. Portable HDPE Vermi beds Ha. - 500013. Post Harvest Management -
a. Establishment of distillation units No. - 12
b. Tomato Grading machine No. - 2
c. Potato Grading machine No. - 2
d. Fruit & Vegetable Grading Plant No. - 1e. Banana Grading & Waxing Plant No. - 1
f. Cashew nut Processing Plant No. - 4
g. Alovera gel / Juice Extraction unit No. - 3h. Tomato Grading Cum Juice / Puree Processing Plant No. - 2

IMPACT OF NHM – FOCUSED AREA 2005 TO 2008
(EXPENDITURE IN LAKHS)Sl. No. Activity Unit Phy.
Increase Expenditure Output
(Production in MT)Impact Remark
1. 2. 3. 4. 5. 6. 7. 8.1. Establishment of New Gardens -
1- Fellow land brought under cultivation2- Employment Generation 3- Support to ecosystem through plantation
Crop is under gestation
period
A. Perennial crops - a. Mango Ha. 15150 1704.37 -b. Litchi Ha. 2680 301.50 -c. Lime Ha. 3250 365.62 -d. Aonla Ha. 1000 63.75 -
e. Custerd Apple Ha. 1000 112.50 -
f. Cashew Ha. 11200 630.00 -
B. Annual Crops -
Banana Ha. 1196 179.40 317171- Annual income of the grower is increased.2- Banana is exported to the other states from
Chhattisgarh
2. Spices crops -
1- Farmers fetched good prices from spices production & now inclined to grow these crops in larger area at their own cost.
2- Chili is exported to the adjoining states from Chhattisgarh.
Chili Ha. 20150 2266.87 120900Onion Ha. 500 56.25 7500Coriander Ha. 400 45.00 1136Turmeric Ha. 2300 258.75 16353
Ginger Ha. 3800 427.50 29754
3.
Community Bore-wells Nos. 1869 1308.30 -
1- 4500 Ha. (Approx.) Area is brought under irrigated area through bore-wells.
2- Productivity of crops increased due to assured irrigation.
4.Organic Farming Ha. 8350 835.00 -
Farmers are motivated to use traditional old techniques for production of crops.
5. Vermi-compost units - Use of vermi-compost is improving soil health and increasing production.
a. Pucca Tanka Nos. 784 235.20 11760
b. Portable HDPE unit Ha. 5000 1500.00 750006.
Establishment of Model Nurseries.
Nos. 39 702.00 -
1- Plant production capacity of departmental Nurseries is increased.
2- 78 lakhs plant will be produced annually from 39 Nurseries.

Animal Husbandry Sector
2009-10
DirectorateAnimal Husbandry Department
Raipur (Government of Chhattisgarh)

Livestock Development & Breeding Policy of GoCG
• On the initiative of GoCG Animal Husbandry Department, Swiss Development Corporation funded a 3 year program to formulate the Policy
• The Program has 4 Components
• Livestock Sector Situation Analysis
• Capacity Building of Officers involved in policy formulation
• Policy Formulation
• Perspective Livestock Dev. Plan
• Policy Approved by GoCG - September 2008

Animal Census Figures
0
2000
4000
6000
8000
10000
12000
14000
16000
1997 2003 2008
Census Year
Popul
ation in
Thous
ands
Total Cattle
Total Buffalo
Goat
Pig
Poultry
Livestock species
Population (’000)
199716th
Census
200317th
Census
200818th
Census
Total Cattle
8785 8882 9459
Total Buffalo
1942 1596 1599
Goat 2154 2336 2761
Sheep 196 121 140
Pig 456 553 412
Poultry 6771 8181 14207
Reasons for increase in animal population –
• Mass immunization in backyard poultry, small ruminants and cattle.
• Organization of Vety. Health/Infertility camps and extension activities.
• Intensive rural health care service delivery

Growth Pattern of Livestock Produce in the State
0
2000
4000
6000
8000
10000
12000
14000
16000
2006-07 2007-08 2008-09 2009-10P rojection
Milk
Egg
Meat
2006-07
2007-08
2008-09
2009-10 Projectio
n
Milk 8490 8660 9080 9600
Egg 8967 9182 9738 10400
Meat 11918 13966 10476 14100Milk – In Hundred Metric TonsEgg – In LakhsMeat – In Thousand Kgs
Source: Statistical Cell – AHD
GoCG
Annual production of Major Livestock Produce
2006-07 2007-08 2008-09 2009-10 Projection
Nutritional Standard
Milk in gm/day 112 114 119 125 240-260
Egg in No. 43 44 47 51 120-180
Meat in Kg 0.57 0.64 0.72 0.80 12-15
Annual Per Capita Availability
