cherat packaging (cppl) - topline
TRANSCRIPT
Pakistan Equity | Paper & Board
REP‐057
Pakistan Equity | Paper & Board Report completed on November 28, 2017Prices as of November 27, 2017
Cherat Packaging (CPPL)Cherat Packaging (CPPL)Pakistan’s Largest Cement Bag Supplier
Adnan Sami Sheikh ACadnan sheikh@topline com pk Best Local Brokerage House
Best Local Brokerage House 2015 & 2016
[email protected]: +9221‐35303330, Ext: 152Topline Securities, Pakistan
Best Local Brokerage HouseBrokers Poll 2011, 2012, 2013, 2014 & 2016
www.jamapunji.pk
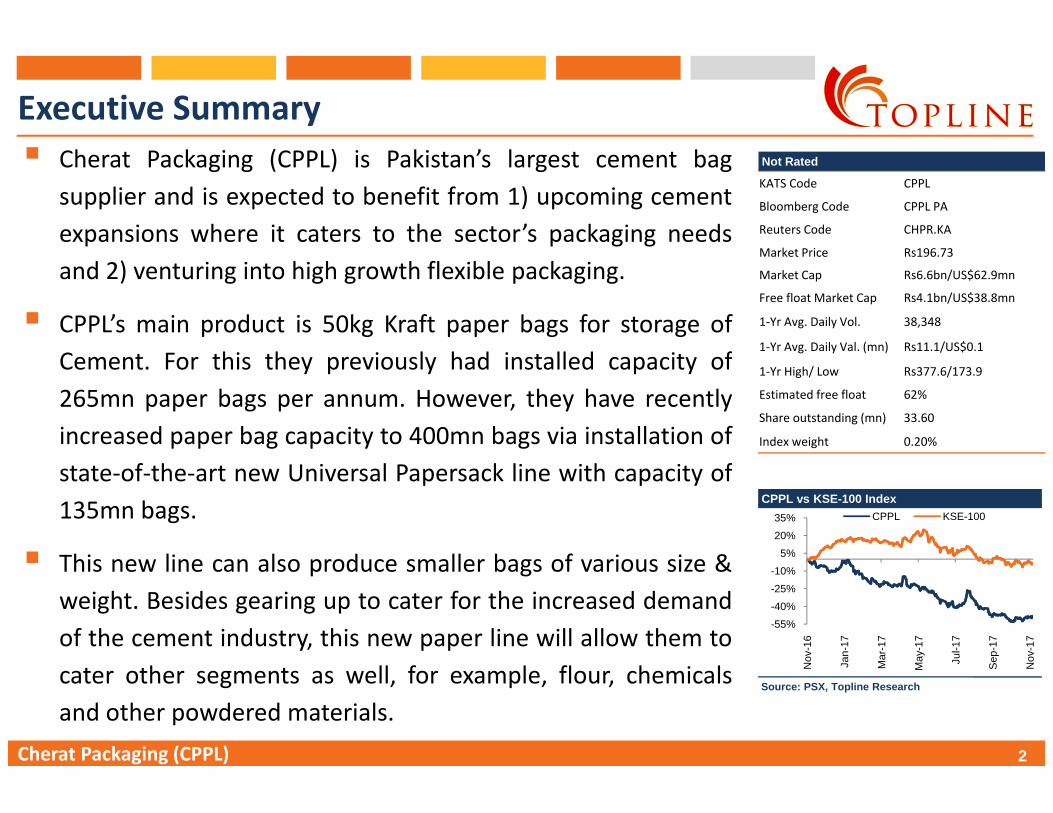
Executive SummaryCh k i (C ) i ki ’ l bCherat Packaging (CPPL) is Pakistan’s largest cement bagsupplier and is expected to benefit from 1) upcoming cementexpansions where it caters to the sector’s packaging needs
KATS Code CPPL
Bloomberg Code CPPL PA
Reuters Code CHPR.KA
Market Price Rs196 73
Not Rated
and 2) venturing into high growth flexible packaging.
CPPL’s main product is 50kg Kraft paper bags for storage ofC t F thi th i l h d i t ll d it f
Market Price Rs196.73
Market Cap Rs6.6bn/US$62.9mn
Free float Market Cap Rs4.1bn/US$38.8mn
1‐Yr Avg. Daily Vol. 38,348
1‐Yr Avg. Daily Val. (mn) Rs11.1/US$0.1Cement. For this they previously had installed capacity of265mn paper bags per annum. However, they have recentlyincreased paper bag capacity to 400mn bags via installation of
1‐Yr High/ Low Rs377.6/173.9
Estimated free float 62%
Share outstanding (mn) 33.60
Index weight 0.20%
state‐of‐the‐art new Universal Papersack line with capacity of135mn bags.
This new line can also produce smaller bags of various size &
CPPL vs KSE-100 Index
5%
20%
35% CPPL KSE-100
This new line can also produce smaller bags of various size &weight. Besides gearing up to cater for the increased demandof the cement industry, this new paper line will allow them to
-55%
-40%
-25%
-10%
Nov
-16
an-1
7
Mar
-17
May
-17
Jul-1
7
ep-1
7
Nov
-17
2Cherat Packaging (CPPL)
cater other segments as well, for example, flour, chemicalsand other powdered materials.
Source: PSX, Topline Research
N J M M J S N

Executive SummaryC l d l l ( ) b b i f b C hCPPL also produces Polypropylene (PP) bags, a substitute for paper bags. CPPL hascapacity to produce 195mn PP bags. PP bags can be made in various sizes of10kg, 25kg, 40kg, etc and besides cement bags (mainly export quality) they can be usedfor sugar, fertilizer, etc. Over 95% of bags produced by Cherat Packaging are used forcement.
F th CPPL h d id d t t k t h d t f i it lf i t l k iFurther, CPPL has decided to take a step ahead, transforming itself into a real packagingmagnate by entering the flexible packaging business, which will target the consumersector. For this CPPL recently issued right shares, raising ~Rs500mn to partially financethe Rs1.7bn flexible packaging venture.
CPPL: Key NumbersFY13A FY14A FY15A FY16A FY17A
EPS 3 5 7 5 19 4 27 3 20 9EPS 3.5 7.5 19.4 27.3 20.9Earnings Growth 66% 112% 159% 41% ‐24%PE at Rs196.73 55.8 26.3 10.1 7.2 9.4Dividend Yield 1% 2% 4% 5% 5%ROE 10% 19% 36% 33% 19%
3Cherat Packaging (CPPL)
PBV 4.5 3.9 2.5 1.8 1.4Source: Company Accounts, Topline Research
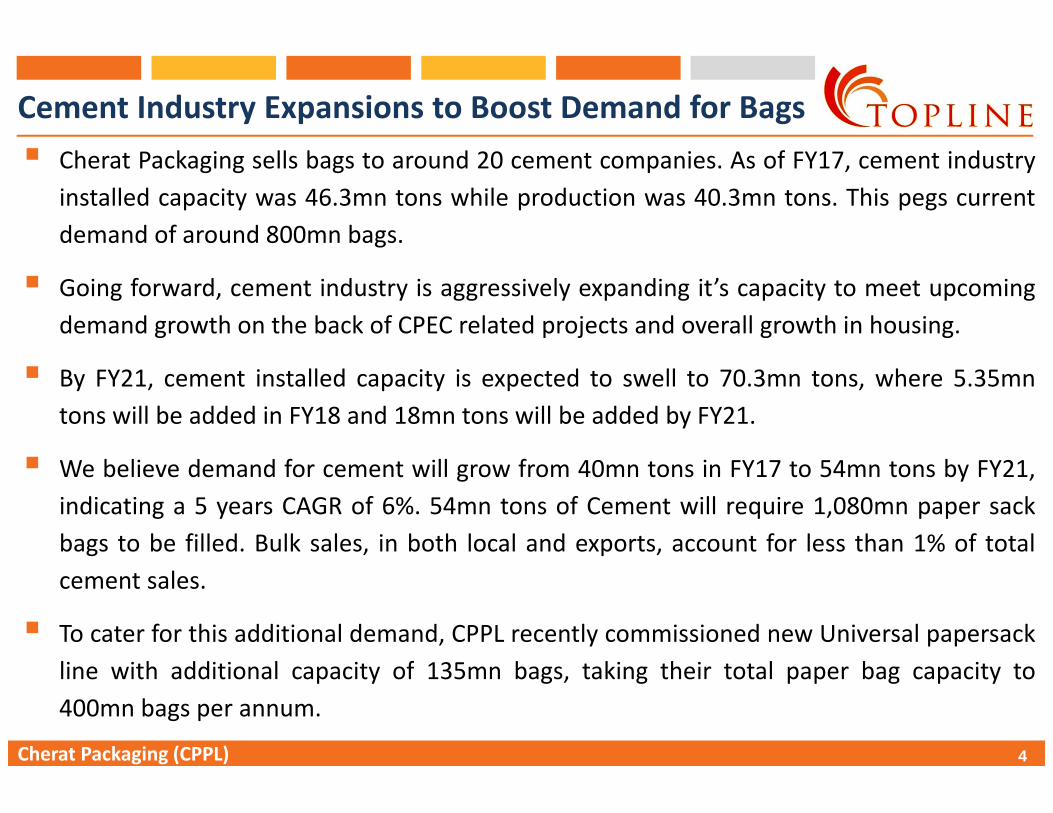
Cement Industry Expansions to Boost Demand for Bagsh k ll b d f dCherat Packaging sells bags to around 20 cement companies. As of FY17, cement industry
installed capacity was 46.3mn tons while production was 40.3mn tons. This pegs currentdemand of around 800mn bags.
Going forward, cement industry is aggressively expanding it’s capacity to meet upcomingdemand growth on the back of CPEC related projects and overall growth in housing.
By FY21, cement installed capacity is expected to swell to 70.3mn tons, where 5.35mntons will be added in FY18 and 18mn tons will be added by FY21.
We believe demand for cement will grow from 40mn tons in FY17 to 54mn tons by FY21,indicating a 5 years CAGR of 6%. 54mn tons of Cement will require 1,080mn paper sackbags to be filled. Bulk sales, in both local and exports, account for less than 1% of totalcement sales.
To cater for this additional demand, CPPL recently commissioned new Universal papersackli i h ddi i l i f 135 b ki h i l b i
4Cherat Packaging (CPPL)
line with additional capacity of 135mn bags, taking their total paper bag capacity to400mn bags per annum.
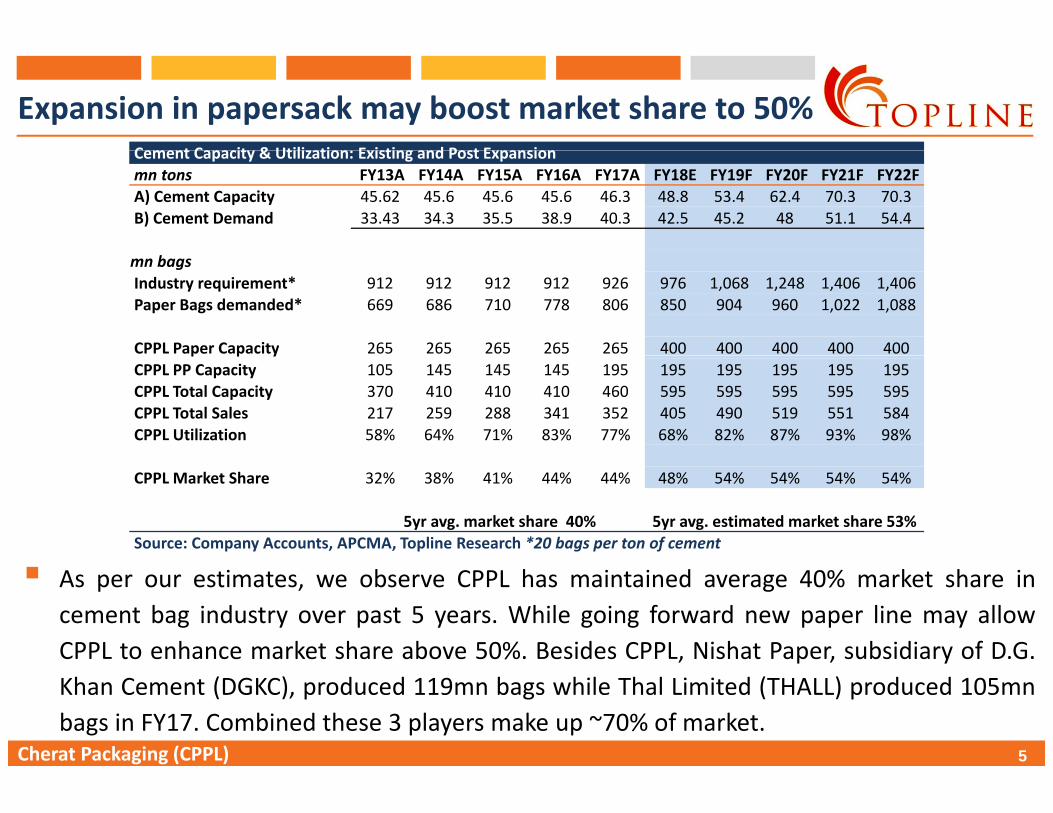
Expansion in papersack may boost market share to 50%Cement Capacity & Utili ation Existing and Post ExpansionCement Capacity & Utilization: Existing and Post Expansionmn tons FY13A FY14A FY15A FY16A FY17A FY18E FY19F FY20F FY21F FY22F A) Cement Capacity 45.62 45.6 45.6 45.6 46.3 48.8 53.4 62.4 70.3 70.3B) Cement Demand 33.43 34.3 35.5 38.9 40.3 42.5 45.2 48 51.1 54.4
mn bags Industry requirement* 912 912 912 912 926 976 1,068 1,248 1,406 1,406Paper Bags demanded* 669 686 710 778 806 850 904 960 1,022 1,088
CPPL Paper Capacity 265 265 265 265 265 400 400 400 400 400p p yCPPL PP Capacity 105 145 145 145 195 195 195 195 195 195CPPL Total Capacity 370 410 410 410 460 595 595 595 595 595CPPL Total Sales 217 259 288 341 352 405 490 519 551 584CPPL Utilization 58% 64% 71% 83% 77% 68% 82% 87% 93% 98%
CPPL Market Share 32% 38% 41% 44% 44% 48% 54% 54% 54% 54%
5yr avg. market share 40% 5yr avg. estimated market share 53%Source: Company Accounts, APCMA, Topline Research *20 bags per ton of cement
As per our estimates, we observe CPPL has maintained average 40% market share incement bag industry over past 5 years. While going forward new paper line may allowCPPL to enhance market share above 50%. Besides CPPL, Nishat Paper, subsidiary of D.G.
5Cherat Packaging (CPPL)
p yKhan Cement (DGKC), produced 119mn bags while Thal Limited (THALL) produced 105mnbags in FY17. Combined these 3 players make up ~70% of market.

Paper Bags are Produced From Imported Kraft Paper ReelsA paper sack is packaging material made of paper with high quality and weight, usuallyKraft Paper. Paper sack is normally used for transporting powder materials such ascement, flour, animal feed, chemicals etc. A paper sack can be made from several layersp p yof Kraft paper depending on toughness required.
Kraft Paper reels are folded, glued & cut by a series of rollers to produce paper bags.Since there is no reliable quality producer of Kraft Paper in Pakistan, Cherat Packaginghas to import Kraft paper reels (raw material used in paper sack bags) primarily fromleading European packaging supplier Mondi Groupleading European packaging supplier Mondi Group.
6Cherat Packaging (CPPL)
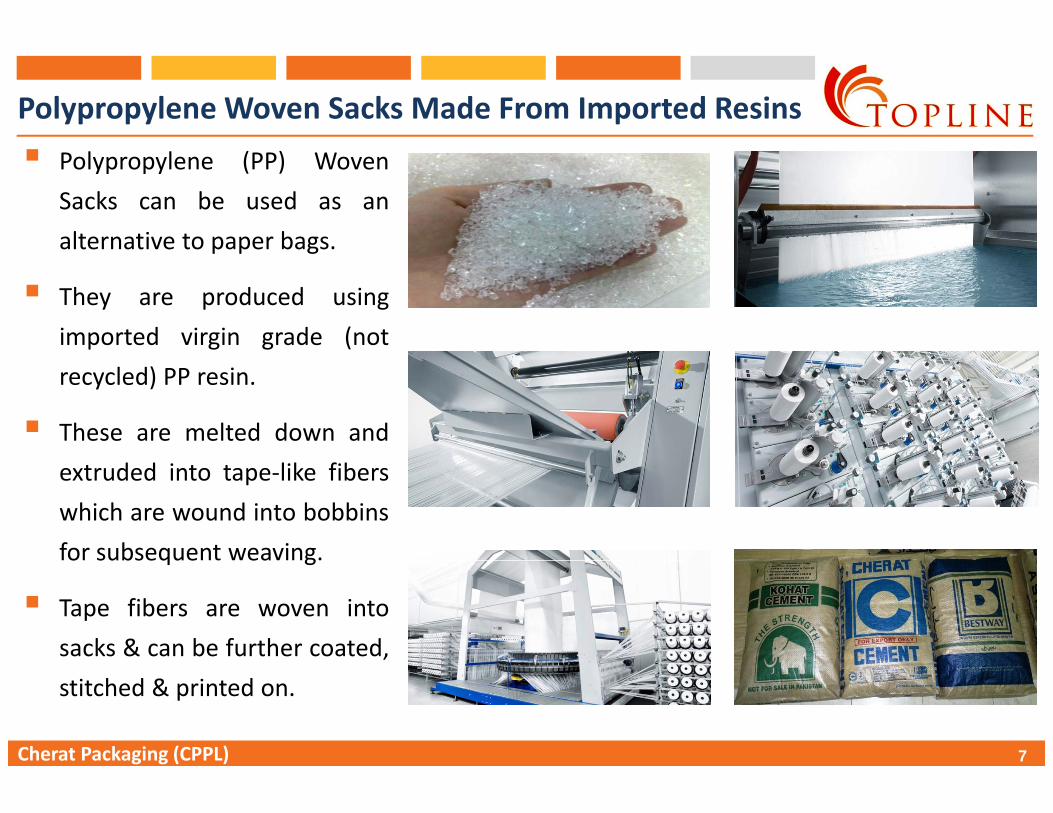
Polypropylene Woven Sacks Made From Imported ResinsPolypropylene (PP) WovenSacks can be used as analternative to paper bags.p p g
They are produced usingimported virgin grade (notrecycled) PP resin.
These are melted down andextruded into tape‐like fiberswhich are wound into bobbinsfor subsequent weaving.o subseque ea g
Tape fibers are woven intosacks & can be further coated,
7Cherat Packaging (CPPL)
stitched & printed on.

Advantages of PP bags vs. Paper bagsPlastics are the material of choice because of inherent advantages of functionalperformance and cost benefits. Relative merits with respect to functional requirementfor bulk packaging using these three prime packaging materials are summarized below.p g g g p p g g
Functional Requirement for Bulk Packaging Parameter Kraft Paper PP Woven SacksSeepage Low Low
l llMoisture Prevention Nil ExcellentContamination / Infestation Nil Low to ModerateOrganoleptic deterioration Moderate MinimumAesthetics Good GoodAvailability Limited Abundant and EasyAvailability Limited Abundant and EasyCost High LowSeam Strength Strong LowOperational Convenience Good GoodStack Stability Good GoodDrop Test Performance Poor Very GoodMicrobial attack High NilAir borne pollution None NoneBiodegradability Yes NoEnergy Recovery Low High
8Cherat Packaging (CPPL)
Energy Recovery Low HighReusability Nil GoodSource: Topline Securities, China Woven Bag

Targeting Consumers with Flexible Packaging Ventureh hi h h C d id d k h d & fTo target the high growth consumer sector, CPPL decided to take a step ahead & transform
itself into a real packaging magnate by entering the flexible packaging business. CPPLrecently offered right shares to raise ~Rs500mn to partially finance this Rs1.7bn venture.The remainder will be funded via debt and internal sources. Competition in flexiblepackaging may stem from Packages Limited (PKGS) & Roshan Packages (RPL).
A d t Ri id k i ( l ti b ttl / t i t ) Fl ibl k i iAs opposed to Rigid packaging (plastic bottles/containers etc), Flexible packaging isdefined as any package or any part of a package whose shape can be readily changed.Flexible packages such as bags & pouches are used for consumer & institutional productsand in industrial applications, to protect, market, and distribute a vast array of products.
Consumer flexible packaging in Asia is growing at an average rate of 6.6% per annum.According to Flexible Packaging Association Pakistan (FLEXPAC) there are 100’s of smallAccording to Flexible Packaging Association Pakistan (FLEXPAC) there are 100 s of smallunorganized converters but flexible packaging market in Pakistan revolves around 130organized converters. Output is estimated at 1.3mn tons per year. While our channel
9Cherat Packaging (CPPL)
checks indicate that flexible packaging has been growing at 1.0‐1.5 times GDP in Pakistan.

Financial PerformanceCPPL’s revenues have grown at 5 year (FY13‐17) CAGR of 12% from Rs4.1bn in FY13 toRs6.4bn in FY17. Revenues growth has primarily stemmed from higher sales volumeswhere bags sold have increased 13% per annum.g p
Increase in volumetric sales was due to capacity expansion & stable growth in cementdispatches, where CPPL production capacity increased from 370mn bags in FY13 to 460mnbags in FY17 & cement dispatches have grown by 5% per annum over past 5 years.
Gross Profits on the other hand have growth at 5 year CAGR of 30% from Rs436mn in FY13to Rs1.3bn in FY17, this is due to increase in gross margin from 11% in FY13 to 19% inFY17. Margins have increased due to decline in commodity & energy prices.
P fi bili h i d f R 175 i FY13 R 972 i FY17 i di iPre‐tax profitability has increased from Rs175mn in FY13 to Rs972mn in FY17, indicatinggrowth of 53% per annum. This can be attributed to financial charges decreasing by overhalf, from Rs157mn in FY13 to Rs64mn in FY17 due to low interest rates & better cashflow.
10Cherat Packaging (CPPL)
After tax profitability has grown at 56% per annum from Rs119mn in FY13 to Rs702mn inFY17. Incase the currency devalues, we opine CPPL will pass on the impact to customers.

Cherat Packaging (CPPL) – Financial SnapshotIncome Statement Key MetricsIncome Statement Key Metrics Rsmn FY13A FY14A FY15A FY16A FY17A FY13A FY14A FY15A FY16A FY17ANet sales 4,129 5,356 6,224 6,889 6,444 Capacity (mn.bags) 370 410 410 410 460Gross profit 437 607 1,307 1,582 1,256 Utilization (%) 58% 64% 71% 83% 77%Distribution expense 32 37 41 48 62 Avg Prices (Rs/bag) 19 20.7 21.6 20.2 18.3Ad i 55 58 73 85 117 S l V l ( b ) 217 259 288 341 352Admin expense 55 58 73 85 117 Sales Vol. (mn.bag) 217 259 288 341 352Other expenses 22 22 68 98 61 Vol. Growth (%) 27% 19% 11% 19% 3%Other income 4 5 7 29 21Operating profit 332 495 1,133 1,380 1,037 Key RatiosFinance cost 157 226 210 72 64 FY13A FY14A FY15A FY16A FY17AProfit before tax 175 269 923 1,308 973 DuPont Analysis:Tax 57 17 271 390 271 Tax Burden 0.68 0.94 0.71 0.7 0.72Profit after tax 119 251 651 918 702 Interest Burden 0.53 0.54 0.81 0.95 0.94EPS (Rs) 3.5 7.5 19.4 27.3 20.9 EBIT Margin 8% 9% 18% 20% 16%Source: Company Accounts, Topline Research Total Asset Turnover 1.16 1.45 1.61 1.6 1.26p y , p
Financial Leverage 2.94 2.84 2.16 1.56 1.4ROE 10% 19% 36% 33% 19%
Balance Sheet Others:Rsmn FY13A FY14A FY15A FY16A FY17A Gross Margin 11% 11% 21% 23% 19%Non‐Current Assets 1 426 1 511 1 766 2 175 2 703 Net Margin 3% 5% 10% 13% 11%Non‐Current Assets 1,426 1,511 1,766 2,175 2,703 Net Margin 3% 5% 10% 13% 11%Current Assets 2,135 2,295 2,176 2,510 2,863 Pretax margin 4% 5% 15% 19% 15%Total Assets 3,561 3,807 3,942 4,685 5,566 Effective Tax Rate 32% 6% 29% 30% 28%
Return on Assets 3% 7% 17% 21% 14%Equity 1,212 1,385 2,199 3,316 4,017 Debt to Equity 1.46 1.5 0.97 0.32 0.17N C t Li biliti 460 780 817 441 774 I t t C 2 12 2 19 5 39 19 07 16 17
11Cherat Packaging (CPPL)
Non‐Current Liabilities 460 780 817 441 774 Interest Coverage 2.12 2.19 5.39 19.07 16.17Current Liabilities 1,890 1,641 927 927 775 Current Ratio 1.13 1.25 1.74 2.53 3.16Total Equity & Liabilities 3,561 3,807 3,942 4,685 5,566 Quick Ratio 0.51 0.61 0.96 1.32 1.49Source: Company Accounts, Topline Research Source: Company Accounts, Topline Research
The research analyst(s), denoted by an “AC” on the cover of this report, primarily involved in the preparation of this report, certifies that (1) the views expressed in this report accurately reflect his/her
Analyst Certification and DisclosuresThe research analyst(s), denoted by an AC on the cover of this report, primarily involved in the preparation of this report, certifies that (1) the views expressed in this report accurately reflect his/herpersonal views about all of the subject companies/securities/sectors and (2) no part of his/her compensation was, is or will be directly or indirectly related to the specific recommendations or viewsexpressed in this report.Furthermore, it is stated that the research analyst or its close relative have neither served as a director/officer in the past 3 years nor received any compensation from the subject company in the past 12months.Additionally, as per regulation 8(2)(i) of the Research Analyst Regulations, 2015, we currently do not have a financial interest in the securities of the subject company aggregating more than 1% of thevalue of the company.
Rating SystemTopline Securities employs three tier ratings system to rate a stock, as mentioned below, which is based upon the level of expected return for a specific stock. The rating is based on the following withtime horizon of 12‐months.Rating Expected Total ReturnBuy Stock will outperform the average total return of stocks in universe Neutral Stock will perform in line with the average total return of stocks in universeSell Stock will underperform the average total return of stocks in universeFor sector rating, Topline Securities employs three tier ratings system, depending upon the sector’s proposed weight in the portfolio as compared to sector’s weight in KSE‐100 Index:Rating Sector’s Proposed Weight in PortfolioOver Weight > Weight in KSE‐100 IndexMarket Weight = Weight in KSE‐100 IndexUnder Weight < Weight in KSE‐100 IndexRatings are updated daily to account for the latest developments in the economy/sector/company, changes in stock prices and changes in analyst’s assumptions or a combination of any of these factors.
Valuation MethodologyTo arrive at our 12‐months Target Price, Topline Securities uses different valuation methods which include: 1). Present value methodology, 2). Multiplier methodology, and 3). Asset‐based methodology.
Research Dissemination PolicyTopline Securities endeavors to make all reasonable efforts to disseminate research to all eligible clients in a timely manner through either physical or electronic distribution such as email, fax mail etc.Nevertheless, all clients may not receive the material at the same time.
Di l iDisclaimerThis report has been prepared by Topline Securities and is provided for information purposes only. Under no circumstances this is to be used or considered as an offer to sell or solicitation of any offer tobuy. While reasonable care has been taken to ensure that the information contained therein is not untrue or misleading at the time of publication, we make no representation as to its accuracy orcompleteness and it should not be relied upon as such. From time to time, Topline Securities and/or any of its officers or directors may, as permitted by applicable laws, have a position, or otherwise beinterested in any transaction, in any securities directly or indirectly subject of this report. This report is provided only for the information of professional advisers who are expected to make their owninvestment decisions without undue reliance on this report. Investments in capital markets are subject to market risk and Topline Securities accepts no responsibility whatsoever for any direct or indirectconsequential loss arising from any use of this report or its contents In particular the report takes no account of the investment objectives financial situation and particular needs of investors who
12
consequential loss arising from any use of this report or its contents. In particular, the report takes no account of the investment objectives, financial situation and particular needs of investors, whoshould seek further professional advice or rely upon their own judgment and acumen before making any investment. The views expressed in this report are those of Topline Research Department and donot necessarily reflect those of Topline or its directors. Topline as a firm may have business relationships, including investment‐banking relationships, with the companies referred to in this report.All rights reserved by Topline Securities. This report or any portion hereof may not be reproduced, distributed or published by any person for any purpose whatsoever. Nor can it be sent to a third party without prior consent of Topline Securities. Action could be taken for unauthorized reproduction, distribution or publication.
Cherat Packaging (CPPL)