chemotaxonomic classification of fossil leaves from the ...directory.umm.ac.id/data...
TRANSCRIPT

Chemotaxonomic classi®cation of fossil leaves fromthe Miocene Clarkia lake deposit, Idaho, USA based on
n-alkyl lipid distributions and principal component analyses
Matthew J. Lockheart, Pim F. van Bergen 1, Richard P. Evershed *
Organic Geochemistry Unit, School of Chemistry, University of Bristol, Cantock's Close, Bristol BS8 1TS, UK
Received 18 December 1999; accepted 12 July 2000
(returned to author for revision 14 March 2000)
Abstract
Fossil leaves which show excellent preservation of lipids and other organic compounds are preserved in abundance at
the Miocene Clarkia lake deposit in northwestern Idaho, USA. Eighty three fossils from nine genera which are com-monly found at the site, namely Quercus, Platanus, Magnolia, Pseudofagus, Fagus, Cocculus, Taxodium, Metasequoiaand Sequoia were investigated to assess whether their chemical compositions can be used in chemotaxonomic compar-isons. Chromatographically separated n-alkane and n-alkanol sub-fractions were examined by GC and GC/MS to
establish whether characteristic distributions were evident between fossils and distinct from the enclosing sediment.Chemotaxonomic comparisons were performed between the individual fossil specimens and six sediments using the n-alkane and n-alkanol pro®les and principal component analysis (PCA). Characteristic distributions were observed for
certain genera, e.g. Platanus and Quercus, which were reproducible between multiple specimens of the same genus.Concentrations of the lipids in fossils were markedly greater than in the six sediments in all of the fossils except theconifers examined. These ®ndings demonstrate that n-alkyl lipid distributions from fossil leaves have chemotaxonomic
utility, with potential for comparisons with modern taxa. # 2000 Elsevier Science Ltd. All rights reserved.
Keywords: Plant fossil chemotaxonomy; Clarkia lake deposit; PCA; Molecular preservation; n-Alkyl lipid distributions; Palaeo-
environmental change
1. Introduction
The chemical compositions of the epicuticular waxes
from modern leaves have been used to examine chemo-taxonomic relationships between di�erent taxa. In par-ticular, the distribution pro®les of n-alkyl lipids derived
from these waxes have been used in comparative studiesof modern plant species (Eglinton et al., 1962; Dysonand Herbin, 1968; Osborne et al., 1989; Ma�ei, 1994;
Mimura et al., 1998). Alkyl lipid classes such as n-alkanes, n-alkanols and fatty acids are hydrophobic innature. Consequently they are expected to remain in
close association with a buried leaf macrofossil ratherthan migrating into the enclosing material, assuming thatthe conditions within a sediment favour lipid preserva-
tion, e.g. anoxia. Since these compounds are the mostabundant components of epicuticular waxes of higherplants we anticipate that they will still be detectable
above the sedimentary background even if some degra-dation has occurred during senescence, prior to deposi-tion, or during burial.The abundance of well preserved fossil leaves in the
Miocene (17±20 Ma) lake sediments at Clarkia, Idaho,provides the opportunity to perform chemical analyseson many individual fossil specimens. Initial studies of
0146-6380/00/$ - see front matter # 2000 Elsevier Science Ltd. All rights reserved.
PI I : S0146-6380(00 )00107-8
Organic Geochemistry 31 (2000) 1223±1246
www.elsevier.nl/locate/orggeochem
* Corresponding author. Tel.: +44-117-954-6395; fax: +44-
117-929-3746.1 Present address: Organic Geochemistry Group, Faculty of
Earth Sciences, Utrecht University, P.O. Box 80021, 3508 TA
Utrecht, The Netherlands
E-mail address: [email protected] (R.P. Evershed).

the Clarkia site investigated and characterised the lipidcomposition of the sediment at site P-33, as well asanalysing a number of fossil leaves from the locality(Logan, 1992; Logan and Eglinton, 1994; Logan et al.,
1995). These studies detected biomarkers of plant, bac-terial and algal origins. Inputs from bacterial sourcesincluded three isomers (�17(21), �13(18), �21) of the bac-
terial lipid diploptene (hop-22(29)-ene), C27±C32 hopanes(mainly 17b, 21b con®guration), 3b-methylhopenes andhopanoid acids. b-amyrin, phytosterols and a suite of
des-A and aromatic triterpenoids, resulting from thedegradation of higher plant triterpenols, were also detec-ted. Algal inputs were re¯ected in the presence of 24-
ethyl sterenes, sterols and series of diols (a,o;a,o-1;1,3).Dino¯agellate inputs were represented by abundantdinosterol and dinostanol. All of the above compoundswere either not su�ciently characteristic of a particular
organism or too degraded/transformed to present theopportunity to be used in chemotaxonomy, with theexception of 3b-methylhopenes which are recognised as
biomarkers for methanogenic bacteria (Summons andJahnke, 1992). However, the most dominant compoundsdetected in the Clarkia sediments and higher plant fossils
were homologous series of n-alkanes, n-alkanols andfatty acids. Their hydrophobic nature and associationwith identi®able fossil specimens makes them suitable
candidates for chemotaxonomic analyses where dis-tributional di�erences between genera could be compared.Fossil specimens in the study by Logan and co-workers(1995) were analysed as total lipid extracts, and while
overall di�erences between fossil genera were apparentit was di�cult to discern the subtle di�erences in dis-tributions of n-alkyl lipids. Two subsequent studies of
Clarkia fossil leaves achieved further separation of thetotal lipid extracts into chromatographic subfractions(Huang et al., 1995, 1996). On the basis of these
encouraging early results, this comprehensive study wasundertaken of fossil leaves and sediments from theClarkia P-33 site where a number of specimens of eachgenus were examined. The aims were to establish whether
characteristic distributions of n-alkyl lipids were pre-served between a number of di�erent fossil taxa. Thisresearch extends our use of plant and animal macro-
fossil and subfossil specimens as a means of deriving newinformation on taphonomic and diagenetic processes.
2. Samples and site description
2.1. Sampling of fossils
Fossils were collected during two visits to the Clarkialocality (September 1994 and April 1996). Several sites
have been excavated in the region, although most of thefossils examined in this study originate from therenowned P-33 site where the best preservation is evident
(descriptions of the local geology are provided in Smileyand Rember, 1979). Large blocks of fossil-bearing sedi-ment were cut from the deposit mainly at stratigraphiclevel 2b (Fig. 1) approximately 2.5 m from the base of
the 7.6 m sedimentary sequence. The P-33 sediments areestimated to be between 15.3 and 22 million years oldbased on K/Ar dating of the Priests Rapids basalts
which intrude into the deposit, however, comparisons ofthe taxa preserved at Clarkia with similar Miocene sitesin the region have narrowed the age range of the deposit
to between 17 and 20 million years (Smiley and Rember,1985a,b). Several fossils were sampled from Unit 5higher up (ca. 6.5 m from the base) in the sedimentary
sequence from the same site. A few specimens were alsocollected for comparative purposes from site P-35 atOviatt Creek, a younger Miocene deposit (�12.8 Ma)located 32 km south of the Clarkia basin. Sediment
blocks were either split at the site to obtain fossils, orreturned to the University of Idaho, Moscow, USA orUniversity of Bristol, UK for processing.
2.2. Sampling of sediments
Samples of fossil-bearing sediments were also takenintact from the Clarkia P-33 site for chemical compar-isons with the fossils. Sediment was sampled from ®ve
horizons (Fig. 1) of the exposure at the P-33 site, 2b, 2d,4 (ash), and from below, 5a, and above, 5c, a thin layerof ash in Unit 5. A block of sediment from the geologi-cally younger P-35 Oviatt Creek site was also removed for
analysis. Fossils of nine abundant genera were analysedin this study. They are listed in Table 1, and comprised sixangiosperm (dicotyledons) and three gymnosperm (con-
ifers) genera.
2.3. Identi®cation of fossils
The majority of the Clarkia plant fossils are compar-able to other fossil ¯oras in the Columbia Plateauregion of the Paci®c Northwest, in particular the Mas-
call and Latah ¯oras, although some taxa resemble spe-cies represented in older Oligocene ¯oras (Smiley andRember, 1985a and references therein). Some genera
discovered at the site have not previously been identi®edat other sites, in particular, one new taxon Pseudofagusidahoensis has been classi®ed as a novel extinct genus
and species unique to Clarkia (Smiley and Huggins,1981). In addition to P. idahoensis, two other taxa at thesite have been identi®ed to the `species' level in this
paper, i.e. Magnolia latahensis and Platanus dissecta,these classi®cations have been assigned based on speciespresent in the ¯ora of deposits of similar age in thePaci®c Northwest region (J. Smiley, personal commu-
nication). Other taxa examined have only been identi-®ed to the genus level and may represent more than oneclosely related species. Themajority ofQuercus specimens
1224 M.J. Lockheart et al. / Organic Geochemistry 31 (2000) 1223±1246

were identi®ed as belonging to the red subgenus ery-throbalanus (Metcalf and Chalk, 1950; Phillips, 1978).
This subclassi®cation was performed by examination ofthe leaf margins for characteristic features, speci®callyaristae (Q. Leng, personal communication). Thereappeared to be at least two closely related red oak spe-
cies represented in the assemblages at both sites P-33and P-35. In addition, two of the oak specimens were ofa completely di�erent species, these were thought to be
swamp-dwelling evergreen or ``live'' oaks (which aresometimes classi®ed as belonging to the white leucoba-
lanus subgenus). Modern red oaks and the majority ofmodern white oaks are deciduous trees.
2.4. Description of fossils
A total of 83 fossils and six sediments were examinedin the course of this study. The majority of fossils were
Fig. 1. Stratigraphic pro®le of the Clarkia P-33 deposit. The majority of fossil leaves were sampled from within the 2b sediments.
Adapted with permission from Smiley and Rember 1985b.
Table 1
Fossil species examined from the Clarkia fossil sites
Genus and species Common name Family Number of samples analysed
Angiosperms
Quercus sp. Oak Fagaceae 17 red, 2 evergreen
Platanus dissecta Plane Platanaceae 12
Pseudofagus idahoensis n/a (extinct) Fagaceae 19
Fagus sp. Beech Fagaceae 2
Cocculus sp. Cocculus Menispermaceae 5
Magnolia latahensis Magnolia Magnoliaceae 16
Gymnosperms
Taxodium sp. Bald or swamp cypress Taxodiaceae 6
Metasequoia sp. Dawn redwood Taxodiaceae 1
Sequoia sp. Redwood Taxodiaceae 2
M.J. Lockheart et al. / Organic Geochemistry 31 (2000) 1223±1246 1225

black in colour although several were orange or green/brown. The upper leaf surfaces of some of the fossilsstill had a waxy appearance (e.g. Magnolia specimens)and several showed evidence of morphological damage
(e.g. by insect mining or fungi). Descriptions of theappearance and condition of fossils are presented inTable 2.
3. Experimental
3.1. Sample preparation
Sediment blocks were split along bedding planes toreveal fossils. Fossil leaves were sampled if theyappeared to be one of the nine genera listed in Table1, of a reasonable size and in good morphological
condition, or unusual in some respect. After selection,leaves were identi®ed, logged and photographed.Removal of specimens from the enclosing sediments
was achieved by clean careful lifting and scrapingusing a scalpel. The fossil fragments were brushedonto a piece of aluminium foil and transferred to a
vial. This process was found to be the most e�ective inminimising the amount of sediment removed alongwith the fossil as in many cases the fossil remains were
structurally distinct from the sediment. However, anumber of the fossil Cocculus and Pseudofagusspecimens were more intimately associated with thesediment so were more likely to exhibit lipid distri-
butions containing an appreciable sedimentary compo-nent. In order to prevent degradation or evaporativelosses of lipids within the fossil material, solvent
(dichloromethane [DCM]/methanol, 2:1 v/v) wasadded to the vial in su�cient quantity (ca. 100±300 ml)to cover the sample. Fossil samples were stored at
ÿ20�C.
3.2. Extraction of samples
Aliquots (typically 50 ml) of a mixture comprising ®vestandards were added to fossils prior to extraction (cf.Lockheart et al., 1997). The solvent covering the sam-
ples was removed under nitrogen. Fossil specimens wereextracted by sonication in DCM/methanol (2:1 v/v; 5 x1 ml) for 15 min per extraction, and the supernatant was
transferred into a vial to obtain a total lipid extract. Theextraction solvent was evaporated under nitrogen andthen redissolved in a small volume of DCM/isopropanol
(2:1 v/v, ca. 1 ml).Sediment samples were prepared for extraction by
freeze-drying as described by Huang et al. (1996). Whenthe sediment blocks were cut into pieces any fragments
containing leaf macrofossils were removed. Total lipidextracts were isolated from homogenised sedimentsamples (ca. 60 g) by re¯uxing for 24 h with ca. 200 ml
DCM/methanol, 2:1 (v/v), in defatted cellulose thimblesusing a Soxhlet apparatus. Copper turnings (2±3 g) wereadded to the solvent reservoir in order to desulphurisethe total lipid extract. An aliquot of each sediment total
lipid extract (ca. 1/10 by volume) was taken for furtherseparation.
3.3. Chromatographic separation
Chromatographic separation of sediment extracts was
performed as described in previous studies (Huang et al.,1995, 1996). Chromatography of fossil extracts followeda similar procedure but was scaled down to allow for the
small size of samples. Brie¯y, the total lipid extracts offossils and sediments were separated into `acid' and`neutral' subfractions using aminopropyl solid phaseextraction cartridges (Bond Elut, Varian). Silica gel
`¯ash' column chromatography was employed to furtherseparate the `neutral' fraction. In the case of fossils asmall ¯ash column was utilised, i.e. a glass column with
capacity ca. 3 ml and internal diameter 5 mm which waspacked with silica gel (0.4 g; Fluka 60, 0.035±0.070 mmparticle size, 220±440 mesh). The following solvents
were passed through the column to yield ®ve fractions:(i) hexane (3.1 ml) (ii) hexane/DCM (9:1 v/v, 1.5 ml),(iii) DCM (2.0 ml), (iv) DCM/methanol (1:1 v/v, 3.1
ml), and (v) methanol (2.3 ml). Elemental sulphur waspresent in some fossil samples and eluted in the hexanefractions. This was removed by the addition of a fewcopper turnings.
3.4. Derivatisation of alcohol fractions
Alcohols were converted to trimethylsilyl ethers priorto gas chromatographic analysis using an excess of N,O-bis(trimethylsilyl)tri¯uoroacetamide containing 1% tri-
methylchlorosilane (BSTFA+1% TMCS, Sigma Che-mical Co.). Samples were heated with the reagent incapped vials at 60�C for 1 h. Excess reagent wasremoved under a stream of nitrogen.
3.5. Gas chromatography (GC)
The hydrocarbon and derivatised alcohol fractionsdissolved in dichloromethane (100 ml) were analysedusing a Hewlett Packard 5890 Series II GC ®tted with
an on-column injector port and ¯ame ionisation detec-tor. Each sample was injected (1 ml) onto a CP-SIL 5CBcapillary column (Chrompack; 50 m�0.32 mm, 0.12 mm®lm thickness) with hydrogen as carrier gas at a headpressure of 10 psi. The GC oven was temperature pro-grammed as follows: isothermal at 40�C for 1 min, thenrising to 200�C at 10�C minÿ1, and ®nally to 300�C at
3�C minÿ1, with an isothermal period of 15 min. Datawas acquired and processed on a PC using Chemstationsoftware (Hewlett Packard).
1226 M.J. Lockheart et al. / Organic Geochemistry 31 (2000) 1223±1246

Table 2
Description of fossils from the Clarkia (P33) and Oviatt Creek (P35) sites
Sample code Site and horizon Colour Description
Quercus (evergreen)
FL12 P33 2b Brown/black Small toothed ``live oak''
FL23 P33 2b Black Small size, small toothed ``live oak''
Quercus (red)
FL34 P35 Black/brown Thick, lobed
FL35 P35 Black Large toothed
FL36 P35 Black/red Large toothed, half oxidised, same species as FL35
FQR3 P33 2b Black/brown
FQR6 P33 2b Black/brown Similar to FQR3
FQR9 P33 2b Red/brown Same species but larger than FQR3 and 6
FQR15 P33 2b Black Thick residue
FQR16 P33 2b Black Easily lifted from sediment
FQR17 P33 2b Brown/black
FQR22 P33 2b Black Fragment, similar to FMR17
FQR23 P33 2b Black Fragment
FQR24 P33 2b Brown/black Thick similar to FQR3, 6, 9
FQR25 P33 2b Black/brown Thick
FQR28 P33 2b Brown/black
FQR29 P33 2b Black
FQR30 P33 2b Black
FQR37 P33 2b Black/brown
Platanus dissecta
FX10 P33 2b Brown/black Medium sized specimen
FX11 P33 2b Black Complete and large fossil
FP26 P33 2b Brown/ black Fragment showed good venation and detail at margins
FP56 P33 2b Black/brown Very large
FP57 P33 2b Black Evidence of fungus/insect holes?
FPR12 P33 2b Black Large, half oxidised, thick
FPR13 P33 2b Black Very large
FPR14 P33 2b Black Small leaf but formed a thick layer on the sediment
FPR26 P33 2b Black Thick fossil di�cult to remove from sediment below
FPR27 P33 2b Black Large
FQR35 P33 2b Brown/black Initially misidenti®ed as a di�erent genus (Quercus sp.)
FPR38 P33 2b Black Medium sized
Pseudofagus idahoensis
FX9 P33 2b Red Large, good condition
PF46 P33 2b Red/brown Large, good condition
PF52 P33 2b Red/brown Large, good condition
PF53 P33 2b Brown Very large
PF4 P33 2b Black
PF7 P33 2b Black Large, immature?
PF9 P33 2b Dark brown Small leaf
PF19 P33 2b Black
PF20 P33 2b Black Good venation
PF27 P33 2b Brown Obscured partially by a legume leaf (not sampled)
PF51 P33 2b Red/brown Medium size with good venation
PF59 P33 2b Red Good condition.
PFR5 P33 2b Brown/black Large
PFR10 P33 2b Black/brown Thick layer on sediment
PFR11 P33 2b Red/orange Large, very well preserved
PFR21 P33 2b Black Large
PFR31 P33 2b Red/brown Very large and broad
PFR33 P33 2b Brown/black
PFR36 P33 2b Brown/black Well preserved, base of leaf brown
(Table continued on next page)
M.J. Lockheart et al. / Organic Geochemistry 31 (2000) 1223±1246 1227

3.6. Gas chromatography±mass spectrometry (GC/MS)
Compound identi®cation was carried out by GC/MS
using a Carlo Erba 5160 Mega series GC coupled to aFinnigan 4500 quadrupole mass spectrometer operatingin positive electron ionisation mode (70 eV), scanningfrom m/z 50 to 600, with a cycle time of 1 s. Column
type and oven conditions were identical to those used inGC analyses, except that helium was used as the GC/MS carrier gas.
3.7. Treatment of data
The large amount and complexity of the fossil data
set provided the opportunity to perform principal com-ponent analysis (PCA) on the relative abundance dis-tributions of n-alkanes and n-alkanols. The data wasprocessed using Systat for Windows v. 5.02 (Systat
Inc.). A description of the principles and application ofthis technique to organic geochemical data can be foundin Ficken (1994) and Stankiewicz et al. (1997).
Table 2 (continued)
Sample code Site and horizon Colour Description
Fagus sp.
FFR19 P33 2b Brown/orange Good venation
FFR20 P33 2b Brown/black
Cocculus sp.
FC25 P33 2b Brown/black
FC31 P33 2b Black Bedded in a clay layer
FC37 P35 Black Remains dried out cf. other specimens
FC45 P33 2b Black Thick, ®ne detail well preserved
FC58 P33 2b Red/brown Complete leaf
Magnolia latahensis
FX3 P33 2b Red
FX4 P33 2b Green/brown
FX6 P33 2b Brown Excellent condition
FM1 P35 Black Very thick, possibly Persea sp.
FM11 P33 2b Black
FM42 P33 2b Red/brown Veins light in colour
FM50 P33 2b Green Very good condition
FM54 P33 2b Red/brown Approx. half size of FM50 mottled appearance
FM55 P33 2b Red/orange Curled up from the sediment after sunlight exposure
FM64 P35 Black Mouldy white appearance, insect holes?
FMR1 P33 2b Red/brown Nearly complete
FMR2 P33 2b Red/brown Thinner compression than FMR1 with good morphology
FMR4 P33 2b Red/black Excellent preservation, red colour on white clay
FMR7 P33 2b Brown/black Very good condition, complete fossil with red ends
FMR8 P33 2b Black Thinner than FMR7 with good morphology
FMR32 P33 2b Black Half leaf fragment
Taxodium sp.
FT3 P33 2b Black 2 shoots combined
FT61 P33 2b Brown/black 1 long shoot
FT62 P33 2b Black Part of shoot
FT63a P35 Red brown 1 shoot
FT63b P35 Black/brown 2 shoots with thick stems
FT76 P33 5c Brown/black 1 shoot, poor condition, pyrite encrusted
Metasequoia sp.
FT77 P33 5c Black 1 shoot, excellent structural preservation
Sequoia sp.
FT80 P35 Black 1 shoot
FT81 P35 Brown/red 1 shoot
Dryophyllum sp.
FQR18 P33 2b Black Toothed margins, initially identi®ed as
di�erent Quercus sp.
1228 M.J. Lockheart et al. / Organic Geochemistry 31 (2000) 1223±1246

4. Results
In the following sections reference is made to indivi-dual fossil specimens by unique codes (e.g. FMR1).
Descriptions of the fossils these codes correspond to arepresented in Table 2.
4.1. Aliphatic lipid composition of Clarkia fossil leavesand sediments
4.1.1. n-Alkanes in fossilsThe hexane fractions contained the hydrocarbon
components of the fossils and were, without exception,
dominated by a series of n-alkanes with chain lengthsranging between C21 and C35 (Figs. 2 and 3). For mostsamples a high odd/even predominance of n-alkanechain lengths was evident. Figs. 2 and 3 depict, by fossil
type, histograms of the mean concentrations for eachchain length of n-alkane where the mean value is indi-cated by the wide bar height and standard deviations are
shown by the I-bars; the numbers of specimens of eachfossil genus analysed (n) are also given. For genera
where samples were examined from both P-33 and P-35sites a mean histogram for each site is presented (i.e.Cocculus, Magnolia, Quercus and Taxodium). Distribu-tions for specimens of red and evergreen Quercus are
presented separately in Fig. 2.Table 3 details some typical features of the fossil n-
alkane distributions as well as giving ranges within each
species of: (i) carbon preference index, CPI; (ii) averagechain length, ACL, and (iii) total n-alkane concentra-tion. In most cases the individual fossil specimens of a
particular species/genus displayed a similar n-alkanepro®le to the calculated mean distribution pattern ofthat genus. Individual histograms and tabulated n-
alkane concentrations for each specimen are reported inAppendices 5 and 6 of Lockheart (1997).
4.1.2. Sedimentary n-alkanes
The concentrations of n-alkanes in sediments fromthe di�erent stratigraphic horizons at sites P-33 and P-35 are depicted as histograms in Fig. 4. The sedimentary
n-alkane distributions were remarkably consistentbetween the ®ve P-33 samples analysed; C29 dominated
Fig. 2. Mean distributions of n-alkanes from four fossil genera. (a) P-33 red oaks comprised at least two similar species (inset histo-
gram depicts pro®le of living Q. marilandica for comparison), (b) P-35 red oaks were also of two species which resembled P-33 speci-
mens. (c) Evergreen oaks from P-33 showed di�erent morphology from the red oaks. (e) Pseudofagus idahoensis is a genus and species
unique to Clarkia. The inset is of living Fagus grandifolia which morphologically resembles this extinct species. Wide bars are mean
concentrations with standard deviations indicated by I-bars (n=number of fossils analysed).
M.J. Lockheart et al. / Organic Geochemistry 31 (2000) 1223±1246 1229

distributions, with CPI ranging between 3.5 and 5.0(Table 3). Concentrations of n-alkanes in the ®ve clay,fossil bearing, layers from the two sites were lower than
in most of the fossils analysed, especially the red oakfossils from P-33 and P-35 (Fig. 2 cf. 4; Table 3). The n-alkane pro®le of Oviatt Creek sediment (P-35) resem-bled the Clarkia sediments except that C31 was the
dominant component and the concentrations of n-alkanes were approximately half those measured inClarkia sediments.
4.1.3. n-Alkanols in fossilsAliphatic compounds also tended to dominate the
alcohol fractions from fossils. n-Alkanol homologuesbetween 22 and 34 carbons in length were the majorconstituents with a strong even/odd predominance in all
cases. Histograms, and a summary of the prominentfeatures of the fossil n-alkanol distributions are shownin Figs. 5 and 6 and Table 4, respectively. The n-alkanolconcentrations were often greater than the n-alkanes in
the same fossil specimen, with the exception of red oakfossils where n-alkanes showed exceptionally high con-centrations in some cases (Tables 3 and 4).
4.1.4. Sedimentary n-alkanolsSediment n-alkanol pro®les (Fig. 4) showed marked
di�erences between di�erent horizons of the deposit.
This was in contrast with the n-alkanes which showed aconsistent distribution pattern between all layers. The n-alkanols in the Unit 4 ash layer were present atapproximately one seventieth of the concentration of
those in the clay layers. The sediments from horizon 2bof the P-33 deposit (the level at which most of the fossilsanalysed were uncovered) possessed a broad distribu-
tion with C30 n-alkanol in the greatest concentration.Oviatt Creek sediment (P-35) closely resembled the P-332b sample in n-alkanol composition but concentrations
were approximately half those detected in the Clarkia P-33 sample.
4.2. Chemosystematic analyses of n-alkyl lipids
Figs. 2±6 show that it is possible to distinguishbetween related genera in some cases on the basis of
their n-alkyl lipid distributions. The main features ofthese distributions are summarised in Tables 3 and 4,but in order to fully appreciate the extent of variation
Fig. 3. Mean distributions of n-alkanes in fossil Cocculus (a-b), Magnolia (c-d) and three genera of the coniferous family Taxodiaceae
(e-h) collected from sites P-33 and P-35. The inset histogram in (g) shows the n-alkane distribution of modern Metasequoia glyptos-
troboides; note that concentrations of n-alkanes in this species are lower than most of the sediments in Fig. 4. Wide bars are mean
concentrations with standard deviations indicated by I-bars (n=number of fossils analysed).
1230 M.J. Lockheart et al. / Organic Geochemistry 31 (2000) 1223±1246

Table 3
Characteristics of leaf n-alkane distributions in Clarkia leaf fossils and sediments
Fossil genus/species Site/horizon and
number of
specimens
Mean carbon
preference index
(CPI)a
Average
chain length
(ACL)b
Total n-alkane
concentration mg/gdwmean �C21±C35
Features of n-alkane distribution (e.g. relative abundances and
type of distribution, `narrow'=2 or 3 dominant components, `broad'=
most of C21±C33 components are abundant)
Quercus sp. P-33 2b Narrow, unimodal, C29 max. with C31 moderate in many cases
evergreen oak (2) 4.1�0.7 29.5�0.3 270 (25±50% C29 concentration). Chain lengths >C29 usually more abundant
red oak (14) 4.9�2.0 29.1�0.2 710 than those <C29. Evergreen oaks gave di�erent distribution (i.e.
P-35 FL12 and FL23). Red oaks from P33 and P35 had very similar
red oak (3) 9.4�4.7 28.9�< 1400 distributions.
Platanus dissecta P-33 2b (12) 7.3�3.3 29.6�0.7 250 Broad, bimodal, maxima at C25 or C27 and C31 or C33 in most samples.
A few showed narrower distributions with C29±C33 dominant.
Pseudofagus idahoensis P-33 2b (19) 3.3�1.0 28.1�0.3 150 Broad, unimodal, C29 max., with C27 always high, chain lengths
<C29 more dominant than those >C29.
Fagus sp. P-33 2b (2) 3.0�0.2 28.0�0.2 160 Broad, unimodal, similar to Pseudofagus idahoensis with less C31
and more C25.
Cocculus sp. P-33 2b (4) 3.9�0.6 28.8�0.1 74 Narrow, unimodal, C29 max with C27 and C31 in similar abundances
P-35(1) 3.0 28.9 54 (ca. 25±33% of C29).
Magnolia P-33 2b (14) 2.7�0.9 28.3�0.4 260 Medium-broad, unimodal, C29 max. with C30>C31 sometimes.
latahensis P-35(2) 2.8�0.7 28.8�0.2 140 Weaker samples showed relatively high C27 and C25 homologues.
CPI lower than most other species.
Taxodium sp. P-33 2b (3) 5c (1) 2.1�0.4 28.5�0.4 78 Broad, quite variable, sometimes bimodal. C29 high in most samples
P-35 (2) 2.2�0.3 29.4�0.1 54 but C25 sometimes major.
Metasequoia sp. P-33 5c (1) 2.1 29.2 62 Broad, C29 max., with C31 and C25 also high.
Sequoia sp. P-35 (2) 2.3�0.1 29.5�0.2 49 Broad, chain lengths between C25 and C31 abundant. C25
dominant in FT80.
Sediments P-33 2b, 2d,
4 ash, 5a, 5c
P33 3.5 to 5.0
P-35 5.3
28.2 to 29.4 P-33 samples
60 to 74 1.8 (4 ash)
37 (P-35)
Sediments show broad distributions between C21 and C35; Cmax is C29 for
P-33 samples and C31 for P-35. Ash layer is low in concentration
a CPI calculated from n-alkane concentrations according to (2�odd C21±C35)/(�even C20±C34+�even C22±C36)b ACL calculated according to (�ci�i)/�ci where ci is the concentration of the n-alkane containing i carbons (chain lengths i=21 to 35).
CPI, ACL and total n-alkanes are mean values over all the samples examined with �1 s.d. indicated; < denotes an s.d. of less than 0.05.
M.J.Lockheart
etal./
Organic
Geochem
istry31(2000)1223±1246
1231

within and between genera it is preferable to examine
the individual distributions. Space constraints precludethe presentation of histograms for every sample [but seeAppendices 5 and 6 of Lockheart (1987)]. A more robust
means of exploring the relationships between the di�er-ent samples is to apply principal component analysis(PCA) to the data set.
4.2.1. Principal component analyses of n-alkane and n-alkanol distributionsPCA was used to compare the relative abundance
distributions of n-alkanes and n-alkanols for the fossilsand sediments. The concentrations of n-alkyl lipidhomologues obtained from 83 fossil and 6 sediment
samples were subjected to two separate PCA analysesusing:
(i) n-alkanes using relative abundances of C21±C35 n-alkane homologues (15 variables)
(ii) n-alkanols using relative abundances of C22±C32
even chain lengthn-alkanol homologues (6 variables).
Data were pre-treated by normalising to the mostabundant compound in each distribution in order to
eliminate possible bias toward genera possessing high
concentrations of lipid, e.g. Quercus. The odd chainlength n-alkanols were not included in the analysis sincethey were minor components, with higher associated
quanti®cation errors. Only the ®rst three principalcomponent axes (PC1, PC2 and PC3) were determinedin the two analyses since these accounted for more than75% of the total variance within the respective data sets.
4.2.2. PCA of n-alkanesThe ®rst three principal component axes accounted
for 75.3% of the variance in the n-alkane data set, i.e.PC1 46.2%, PC2 17.9%, PC3 11.2%. Fig. 7(a±c) depictsthe loadings for PC1, 2 and 3, respectively, and cross-
plots of PC1 vs PC2 and PC1 vs PC3 component scoresfor the set of samples are presented in Fig. 7d and e. Theloadings plot for PC1 (Fig. 7a) shows that this com-
ponent re¯ects the abundance of C29 n-alkane vs otherhomologues. Quercus and Cocculus samples had themost negative scores of the sample set (Fig. 7d and e; yaxis) as a result of their n-alkane distributions being
dominated by the C29 compound (Figs. 2 and 3).Platanus fossils also showed negative scores due to themoderate abundance of the C29 homologue in their
Fig. 4. Distributions of n-alkanes and n-alkanols in sediments at ®ve di�erent horizons of site P-33. Distribution pro®les for sediment
from the younger P-35 Oviatt Creek site is also shown (cross hatched). The majority of leaf fossils analysed were sampled from the 2b
horizon.
1232 M.J. Lockheart et al. / Organic Geochemistry 31 (2000) 1223±1246

distributions. The loadings plot for PC2 (Fig. 7b) showsa mid chain length (C26±C30; positive scores) vs odd
long chain (C31, C33, C35; negative scores) componentrelationship. The majority of Platanus fossils scoredhighly against this component axis (Fig. 7d; x axis), asthey were the only fossils of the nine genera analysed
that displayed a mid and long-chain length bimodaldistribution of n-alkanes with a high CPI (Fig. 2). Theloadings plot for PC3 (Fig. 7c) shows a component
relationship of C21, C22, C34 and C35 n-alkanes versusmost other chain lengths. The conifers Taxodium,Metasequoia and Sequoia were separated from other
genera against this component (Fig. 7e; x axis) as theydisplayed very broad distributions of n-alkanes, withrelatively greater abundances of short and long chain
length compounds compared with the other generaexamined (Fig. 3).The crossplots of scores against two component axes
(Fig. 7d and e) revealed groupings for Quercus, Platanus
and Cocculus. Quercus specimens formed a tight groupon the PC1 vs PC2 plot but with ®ve of the nineteensamples analysed scattered elsewhere on the plot, speci-
®cally, evergreen oaks FL12 and FL23 and three P-33red oaks FQR9, 22 and 23 (Table 2). The similarity in
the distributions of Cocculus and Quercus can be seen.Platanus samples were well separated from the othergenera by PC2, and the three samples of this genus thatshowed unusual distributions, FPR14, 26 and 38 plotted
in di�erent regions from the majority (Fig. 7d, FPR14and FPR38 are depicted in histograms `E' and `H',respectively in Fig. 8). Magnolia and Pseudofagus speci-
mens were, on the whole, not very well separatedagainst any component axis due to the moderate varia-tion in the distributions of examples of these two gen-
era. However, there was a group of six Magnolia fossilsthat plotted apart from the other specimens against PC2(circled in Fig. 7d). These six examples had a subtly
di�erent n-alkane distribution from the other Magnoliaspecimens where abundances of C30>C31 (comparehistogram `A' for FM54 with `B' for FM50 in Fig. 8).The similarity of the P-33 sediments 5a, 5c and 2d is
emphasised by the close proximity in which they plot onFig. 7d. P-33 2b, P-35 and ash layer 4 plot apart fromthe others (due to subtle di�erences in their distributions;
Fig. 5. Mean distributions of n-alkanols in four Clarkia fossil genera. (a) and (b) show red oak fossils from sites P-33 and P-35 and
(c) shows evergreen oaks from P-33. (d) Platanus dissecta showed a distinct distribution with a maximum at C26 n-alkanol whereas
(e) Pseudofagus and (f) Fagus specimens maximised at C30. Wide bars are mean concentrations with standard deviations indicated by
I-bars (n=number of fossils analysed).
M.J. Lockheart et al. / Organic Geochemistry 31 (2000) 1223±1246 1233
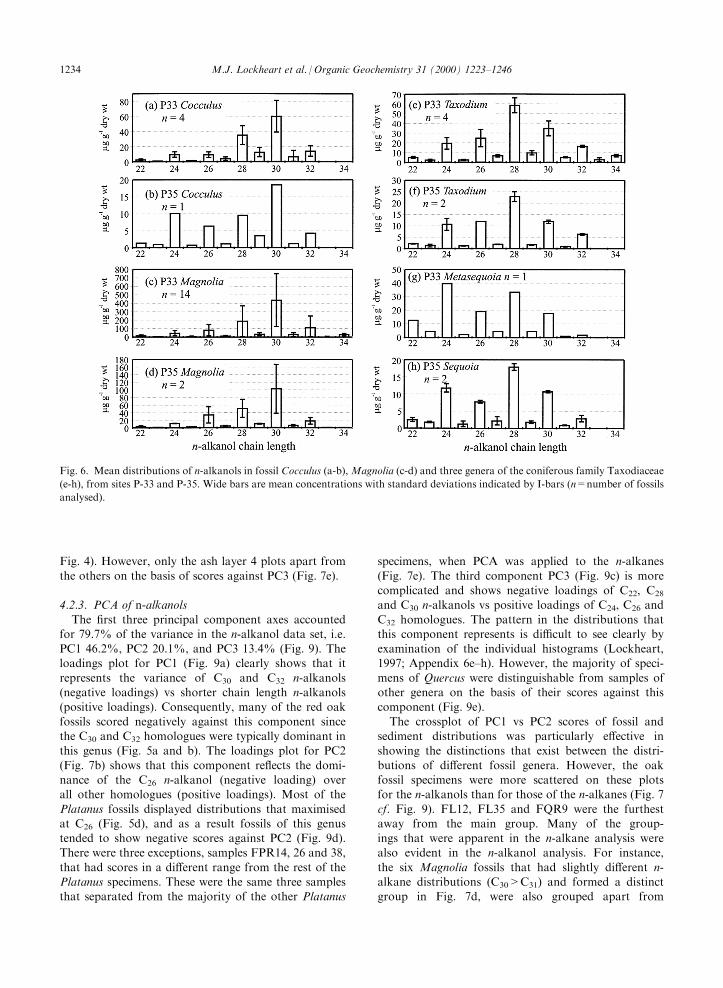
Fig. 4). However, only the ash layer 4 plots apart from
the others on the basis of scores against PC3 (Fig. 7e).
4.2.3. PCA of n-alkanols
The ®rst three principal component axes accountedfor 79.7% of the variance in the n-alkanol data set, i.e.PC1 46.2%, PC2 20.1%, and PC3 13.4% (Fig. 9). Theloadings plot for PC1 (Fig. 9a) clearly shows that it
represents the variance of C30 and C32 n-alkanols(negative loadings) vs shorter chain length n-alkanols(positive loadings). Consequently, many of the red oak
fossils scored negatively against this component sincethe C30 and C32 homologues were typically dominant inthis genus (Fig. 5a and b). The loadings plot for PC2
(Fig. 7b) shows that this component re¯ects the domi-nance of the C26 n-alkanol (negative loading) overall other homologues (positive loadings). Most of the
Platanus fossils displayed distributions that maximisedat C26 (Fig. 5d), and as a result fossils of this genustended to show negative scores against PC2 (Fig. 9d).There were three exceptions, samples FPR14, 26 and 38,
that had scores in a di�erent range from the rest of thePlatanus specimens. These were the same three samplesthat separated from the majority of the other Platanus
specimens, when PCA was applied to the n-alkanes
(Fig. 7e). The third component PC3 (Fig. 9c) is morecomplicated and shows negative loadings of C22, C28
and C30 n-alkanols vs positive loadings of C24, C26 and
C32 homologues. The pattern in the distributions thatthis component represents is di�cult to see clearly byexamination of the individual histograms (Lockheart,1997; Appendix 6e±h). However, the majority of speci-
mens of Quercus were distinguishable from samples ofother genera on the basis of their scores against thiscomponent (Fig. 9e).
The crossplot of PC1 vs PC2 scores of fossil andsediment distributions was particularly e�ective inshowing the distinctions that exist between the distri-
butions of di�erent fossil genera. However, the oakfossil specimens were more scattered on these plotsfor the n-alkanols than for those of the n-alkanes (Fig. 7
cf. Fig. 9). FL12, FL35 and FQR9 were the furthestaway from the main group. Many of the group-ings that were apparent in the n-alkane analysis werealso evident in the n-alkanol analysis. For instance,
the six Magnolia fossils that had slightly di�erent n-alkane distributions (C30>C31) and formed a distinctgroup in Fig. 7d, were also grouped apart from
Fig. 6. Mean distributions of n-alkanols in fossil Cocculus (a-b), Magnolia (c-d) and three genera of the coniferous family Taxodiaceae
(e-h), from sites P-33 and P-35. Wide bars are mean concentrations with standard deviations indicated by I-bars (n=number of fossils
analysed).
1234 M.J. Lockheart et al. / Organic Geochemistry 31 (2000) 1223±1246

Table 4
Characteristics of n-alkanol distributions in Clarkia leaf fossils and sediments
Fossil genus/species Site/horizon and
number of specimens
Mean carbon
preference index
(CPIa)
Average chain
length (ACL)bTotal n-alkanol
concentration
mg/gdw mean �C22±C34
Features of n-alkanol distribution (e.g. relative abundances and
type of distribution, `narrow'=2 or 3 dominant components,
`broad'=most of C22 to C30 components are abundant)
Quercus sp. P33 2b Narrow, unimodal distributions in general. P33 red oaks had
C30 or C32 max., often both were abundant. Chain lengths
<C30 were present at ca. 10% abundance of Cmax and
components >C32 were minor. P35 red oaks FL34, FL36 and
P33 evergreen oak FL23 were very similar with C30 max. and
other homologues <50% C30. FL12 resembled P33 red oaks.
evergreen oak (2) 8.2�2.0 29.1�0.1 900
red oak (14) 9.4�2.1 30.3�0.4 1000
P35
red oak (3) 10.4�4.3 28.4�0.3 320
Platanus dissecta P33 2b (12) 16.0�7 27.0�1.1 590 Broad, unimodal, nine fossils showed distributions with C26
(or C24) max. with declining concentrations of longer
homologues. Three fossils showed di�erent distribution (as was
true for their n-alkanes also), i.e. FPR14 and FPR26 were
bimodal, C30 max., with abundant C28, FPR26 had C30 max.
Pseudofagus idahoensis P33 2b (19) 6.8�2.2 28.2�0.5 260 Broad, bimodal, C30 max., with C24 often higher in
concentration than C26, chain lengths <C30 much more
dominant than those >C30.
Fagus sp. P33 2b (2) 5.8�2.1 28.9�0.1 270 Broad, unimodal, similar to Pseudofagus idahoensis with more
C30.
Cocculus sp. P33 2b (4) 6.7�1.8 28.6�0.4 150 Narrow-medium, unimodal, C30 max. with C28 ca. 50±75%
abundance of C30). C26 and C24 featured, often with C24 slightly
>C26. P-35 specimen (FC37) similar to P-33 samples but
showed C24>C28.
P35 (1) 6.8 27.5 57
Magnolia latahensis P33 2b (14) 12.3�5.4 28.6�1.0 880 Two distinct unimodal distributions: (a) stronger samples ± C30
max. with C28 and C26 at 25±50% Cmax and other homologues
minor, (b) weaker samples ± C30 max. with C28 and C32 other
major homologues variable. The two P-35 samples resembled P-33
samples, i.e. FM64 type (a), FM1 type (b).
P35 (2) 10.1�4.7 28.7�< 240
Taxodium sp. P33 2b (3) 5c (1) 6.1�1.3 28.2�0.2 190 Broad, unimodal. generally symmetrical about max. of C28.
Two samples showed C24 slightly >C26.P35 (2) 10.1�1.7 27.5�0.2 72
Metasequoia sp. P33 5c (1) 7.7 26.2 140 Broad, bimodal, C24 max. with C28 also high.
Sequoia sp. P35 (2) 7.6�2.0 27.1�0.1 60 Broad, like Metasequoia sp. but C28>C24.
Sediments P-33 2b, 2d, 4 ash 4.8 (2d) 26.4 to 29.1 P-33: 100 to 140 Broad distributions between C22 and C34; concentrations are more
5a, 5c to 8.3 (5a) 1.4 (4 ash) 50 (P-35) variable. C30 is max. for all except 4 ash
a CPI was calculated from n-alkanol concentrations according to (2�even C22±C34)/(�odd C21±C33+�odd C23±C35).b ACL was calculated according to (�ci�i)/�ci where ci is the concentration of the n-alkanol containing i carbons (chain lengths i=22±34).
CPI, ACL and total n-alkanols are mean values over all the samples examined with �1 s.d. indicated; < denotes an s.d. of less than 0.05.
M.J.Lockheart
etal./
Organic
Geochem
istry31(2000)1223±1246
1235

Fig. 7. Plots of (d) PC1 vs PC2, and (e) PC1 vs PC3, for scores from PCA of relative abundance distributions of n-alkanes. Quercus
fossils formed a tight grouping against all three components. Evergreen oaks FL12 and FL23, and red oaks FQR9, 22 and 23 plotted
apart from this main group. Platanus fossils andMagnolia specimens with C30>C31 n-alkane (circled) were well separated according to
PC2. Component loadings for PC1, 2 and 3 are depicted as histograms above the scores plots (a)±(c). Specimens A±Q are described in the
text and depicted in Fig. 8. N.B. The ellipse around these six samples is for clarity only, and does not have any statistical signi®cance.
1236 M.J. Lockheart et al. / Organic Geochemistry 31 (2000) 1223±1246

the other Magnolia specimens by PC3 for the n-alkanolanalysis (circled on Fig. 9e). The sediment samples dis-played a greater degree of variation in the n-alkanolanalysis than in the n-alkane analysis. In particular,
the sediment from the 5a layer did not plot closely tothe 5c and 2d samples as was seen in the n-alkaneanalysis.
5. Discussion
5.1. Overview of chemotaxonomy using fossil andmodern leaf lipid compositions
The lipid pro®les depicted in Figs. 2±6 show that plantn-alkanes and n-alkanols are preserved in individual
Fig. 8. n-Alkane distributions for selected specimens (labelled on Fig. 7) x axis=chain length, y axis=mg g dry wtÿ1 alkane. Speci-mens were selected to represent a range of di�erent genera, sites, lipid concentrations and physical conditions. Note that: (1) lipid
preservation is independent of morphological condition (B cf. C); (2) specimens from sites P-35 and P-33 can show similar distribu-
tions (L cf. M; C cf. B); (3) Fagaceae genera can show similar (O cf. P) or very di�erent (M cf. P) distributions; (4) red oaks were
distinct from evergreen oaks (M cf. K); (5) in one case genera of di�erent families showed similar distributions, e.g. N cf. M- Cocculus
sp. cf. Quercus sp. (red).
M.J. Lockheart et al. / Organic Geochemistry 31 (2000) 1223±1246 1237

Fig. 9. Plots of (d) PC1 vs PC2 and (e) PC1 vs PC3, for scores from PCA of relative abundance distributions of n-alkanols. Platanus
fossils were clearly separated from other fossil genera by their PC2 scores. Conifer specimens were partially separated from the main
group, against PC2 and showed trends within the grouping, i.e. specimens of the same genus and site plotted close to one another.
Quercus fossils were more dispersed, and there were some similarities with the trends observed in the PCA scores plots for n-alkanes.
Magnolia fossils also showed similar groupings as in Fig. 7. Component loadings for PC1, 2 and 3 are depicted as histograms above
the scores plots (a±c). *N.B. The loop around these six samples is for clarity only, and does not have any statistical signi®cance.
1238 M.J. Lockheart et al. / Organic Geochemistry 31 (2000) 1223±1246

specimens of di�erent fossil genera after ca. 17±20 mil-lion years of burial. Distinctive distribution patternswere observed between some genera and, in certaincases, signi®cantly higher concentrations than the
enclosing sediment, were also apparent although othersshowed a degree of mixing with sedimentary lipids. As aresult, the potential exists for exploiting these lipid dis-
tributions for chemotaxonomic purposes and palaeoen-vironmental reconstruction.The possibility of using the distributions of long chain
n-alkyl lipids of epicuticular waxes (for reviews see Tul-loch, 1976; Baker, 1982; Walton, 1990) as a chemosys-tematic tool to distinguish between di�erent modern
plant genera was ®rst explored by Eglinton (1962) intheir investigation of the Sempervivoideae. These earlyattempts have been repeated in many subsequent inves-tigations (e.g. Dyson and Herbin, 1968; Osborne et al.,
1989; Ma�ei, 1994; Mimura et al., 1998; Skorupa et al.,1998). Several of these studies have shown that di�erentspecies of the same genus can show similar n-alkyl lipid
distributions and that it is sometimes possible to distin-guish between taxa of di�erent genera belonging to thesame family (especially if they di�er morphologically).
However, Herbin and Robins (1969) noted that the dis-tribution patterns of leaf lipids are not always adequateto di�erentiate between taxa even at the genus level,
especially when examining closely related genera of thesame family. Their observation will also apply to thefossils examined from Clarkia, i.e. not all of the fossilgenera will be expected to be chemically distinct in lipid
composition.This study examined a range of genera thus permitting
comparisons to be made between members of the same
family and between taxa which are not closely related.For instance, two fossil genera of the family Fagaceaewhich share a similar morphology have been examined,
i.e. Fagus and Pseudofagus (Smiley and Huggins, 1981)as well as a member of the Fagaceae family which doesnot share similar morphological characteristics, i.e.Quercus sp. Also analysed were specimens of Taxodium
sp., Metasequoia sp. and Sequoia sp.; three coniferousgenera of the family Taxodiaceae, which showed mor-phological similarity.
The possibility of diagenetic alteration of the originalleaf lipids in the sediments might be expected to com-plicate the chemosystematic study of fossils. The fact
that lipid concentrations were higher in most fossilsthan the enclosing sediments and that several generashowed very distinctive distribution patterns (especially
Quercus and Platanus) is compelling evidence that che-mosystematic analyses are possible for certain taxa fromthis locality. However, in specimens where n-alkyl lipidlevels were low in the leaf, contributions of sedimentary
lipids may obscure the plant signal.The results of this study provide the opportunity to
make chemosystematic comparisons of fossils using
distributions, concentrations and principal componentanalyses on a number of levels, such as between: (i) fos-sils of di�erent genera; (ii) specimens of the same genus;(iii) subdivisions of a single genus, e.g. red oaks cf. ever-
green oak fossils; and (iv) several genera belonging to thesame family, e.g. Taxodiaceae and Fagaceae families.
5.2. Comparisons between Clarkia sediments and fossils
5.2.1. n-alkyl lipid distribution patterns
Many of the nine fossil genera examined in this studyshowed distinct distributions of n-alkyl lipids from theenclosing sediments (Fig. 4) and other genera (fossil n-
alkanes Figs. 2 and 3, fossil n-alkanols Figs. 5 and 6). Insome cases the distributions were very distinctive, e.g.the bimodal n-alkane distribution of Platanus (Fig. 2d)or n-alkane and n-alkanol distributions of red Quercus
specimens (Figs 2a and b and 5a and b). Pseudofagusfossils shared clear similarities with the lipid distributionof the 2b sediment from which they originated. This
could arise from the lipids in the original leaf beingobscured by sedimentary components. However, sincethe mean (n=19) total n-alkane concentrations in Pseu-
dofagus were found to be approximately double (150 mg/g) that of the most concentrated sediment (range 60±74mg/g; Table 3) this resemblance to the sediment appears
coincidental. In fact, a number of living Asian Fagusspecies (F. grandifolia, F. japonica, F. orientalis) whichresemble Pseudofagus idahoensis display an analogouspattern of n-alkanes to the fossil species (see inset Fig.
2e for distribution of modern F. grandifolia; Lockheart,1997).A sedimentary lipid contribution will always be evi-
dent in any fossil although this will be negligible in themost lipid-rich specimens. The background of n-alka-nols contributed to fossils from the sediments will vary
according to where the fossil was sampled in the strati-graphic column. In contrast to the n-alkanes, the dis-tribution of n-alkanols was shown to vary throughoutthe deposit (Fig. 4) probably as a result of input or
productivity changes in the lake through time.
5.2.2. Comparisons between genera on the basis of
n-alkyl lipid concentrationThe concentrations of n-alkyl lipids in the fossils were
in most cases higher than those detected in the sedi-
ments (with the exception of the coniferous generaTaxodium, Metasequoia and Sequoia). However, it is notunexpected that the concentrations of lipids in sedi-
ments expressed in mg/g dry weight are lower than thefossils since the organic carbon content of the sedimentmatrix is lower due to inorganic diluents. It would havebeen preferable to express lipid concentration relative
to total organic carbon, however, the paucity of fossiltissue precludes this measurement being undertakenroutinely.
M.J. Lockheart et al. / Organic Geochemistry 31 (2000) 1223±1246 1239

In situations where di�erent fossil genera sharedsimilar distribution patterns of lipids, e.g. n-alkanes ofQuercus (red oaks; Fig. 2a and b) and Cocculus (Fig. 3a)the concentrations were sometimes su�ciently di�erent
to distinguish between the two genera. For instance, theconcentrations of n-alkanes were considerably higher inQuercus than Cocculus fossils (mean total n-alkane con-
centrations for P-33 specimens, 710 and 74 m/gdw,respectively; Table 3) despite their similar distributions.However, these two genera were readily separable on
the basis of their n-alkanol distributions (and n-alkanolconcentrations), i.e. red Quercus sp. were dominated byC30 and C32 whereas Cocculus showed a unimodal trend
which maximised at C30 (Fig. 5a and b cf. Fig. 6a). Incertain cases, e.g. Taxodiaceae genera, the n-alkanolhomologues were present in signi®cantly higher con-centration than the n-alkanes; the latter may have been
present at lower concentrations on the original leaf.Most of the other genera examined in this study
showed similar ranges of concentrations and, hence, for
these taxa concentration would not be a useful para-meter for comparisons (Tables 3 and 4).With the exception of a few of the Quercus fossils the
concentrations of n-alkanols were higher than the n-alkanes from the same specimen. n-Alkanols also tend tobe higher in concentration than n-alkanes in modern
leaves although this is dependent on species (GuÈ lz et al.,1989; Rieley et al., 1991; GuÈ lz and MuÈ ller, 1992). It islikely that some of the n-alkanols present in the fossilsderive from the hydrolysis of wax esters that were origin-
ally present in the epicuticular waxes (Rieley et al., 1991).The fact that these compounds were not detected whenthe DCM fraction from several of the fossils was analysed
by high temperature-GC reinforces this assertion (Lock-heart and Evershed, unpublished results). n-Alkanols willalso have been contributed from algal remains and debris
from other lacustrine organisms in the encroachingsediments (Meyers and Ishiwatari, 1993). However, forthe majority of fossils, i.e. those from the 2b horizon, theconcentrations of the n-alkanols were appreciably higher
than those of the enclosing sediments (total n-alkanols:2b sediment 120m/gdw, fossils 140 to 1000mg/gdw Table4). Hence, the contributions from exogenous sources
have minimal impact on the preserved lipid pro®les.
5.2.3. Principal component analyses
PCA treatment of the relative abundance distribu-tions of n-alkyl lipids from the fossils emphasised thedi�erences between genera, and individual specimens.
The technique was most e�ective when applied to spe-cimens of Quercus and Platanus due to their character-istic distribution patterns. However, the technique wasnot universally successful in separating some genera of
di�erent families, for instance Magnolia (Magnoliaceae)and Pseudofagus (Fagaceae) showed a certain degree ofsimilarity in their distributions and accordingly are
intermingled on the PCA scores plots (especially n-alkanes; Fig. 7d and e). The Taxodiaceae family mem-bers displayed a wide range of scores on the n-alkaneplots, probably due to the low levels of lipid originally
present in leaves of these specimens (based on con-centrations in modern M. glyptostroboides, see inset inFig. 3g) and the correspondingly greater in¯uence of
sedimentary lipids. Although di�erences in epicuticularcomposition between members of the same family can-not be discounted (Borges de Castillo et al., 1967), when
PCA was applied to the n-alkanol distributions of theseconiferous taxa the specimens tended to group accord-ing to genus and site (Fig. 9d and e).
The similarity between the distributions of the sedi-mentary n-alkanes is borne out by the proximity inwhich they cluster on the scores plots (Fig. 7d and e).Conversely, the lack of uniformity in the n-alkanol dis-
tributions through the stratigraphic column can be seenby greater scattering of data points on the scores plotsin Fig. 9. The changes in concentrations of the shorter
chain length n-alkanols (C24 and C26; Walton, 1990)relative to their longer chain counterparts (C28 andabove; Collister et al., 1994) through the deposit may
re¯ect variations in the size and types of communities ofcontributing organisms within the lake and the vegeta-tion catchment area due to the changing environment.
Further di�erences in lipid distributions may result fromcompounds contributed by nearby plants but for whichfossil remains are rarely preserved as a consequence oftaphonomic bias, e.g. grasses and ferns.
5.3. Comparisons between specimens of the same genus:distributions
The variability in concentration was sometimes quitelarge between specimens of the same genus for Quercus
sp., Magnolia latahensis and Pseudofagus idahoensis, ascan be seen in the large standard deviations indicated byI-bars on Figs. 2±6. However, the distribution patternswere, in most cases, consistent between examples of
these fossil species (Appendices 5 and 6, Lockheart,1997). Hence, the large standard deviations that wereapparent in the mean histograms for some of the species
mainly re¯ect changes in overall concentration of lipids(a�ecting all homologues in proportion) rather thanvariability of the distribution patterns themselves (PCA
provides a better measure of this as it was performed onrelative abundances).In a few cases where concentrations of lipids in the
fossils were low the characteristic distribution patternswere lost; this was often accompanied by a reduced CPI,e.g. FM1 Magnolia, FPR14 Platanus and PF51 Pseudo-fagus (labelled D, E and Q, respectively, in Fig. 8).
Furthermore, these `weak' samples tended to show pro-minent even carbon number n-alkanes at short and longchain lengths. Interestingly, several other fossil specimens
1240 M.J. Lockheart et al. / Organic Geochemistry 31 (2000) 1223±1246
showed considerable deviation from the typical dis-tribution despite exhibiting high lipid concentration.For example, two of the Platanus samples analysed(FPR38 and FPR26) showed quite di�erent distri-
butions from most with C29/C31 dominant rather thanthe more usual C31/C33. This can be seen by comparingPlatanus histograms F (FPR13) and G (FQR35) with H
(FPR38) in Fig. 8. The n-alkanol distributions of theFPR38 and FPR26 specimens were also found to bedistinct from the other taxa examined which suggests
that they might in fact be specimens of a di�erent genus(and family?) altogether which resembles Platanus inappearance.
In those specimens where deviations from the meandistribution were signi®cant, the identi®cation of thefossil in question was veri®ed using photographs, orremnants of the fossils. In this way, two of the `oak' fos-
sils were found to have been misclassi®ed, i.e. one `oak'was found to be a fragment of a large Platanus dissectaleaf (FQR35 labelled G in Fig. 8), while the identity of a
second fossil (FQR17) was revised to a Dryophyllum sp.fossil (Q. Leng, personal communication).
5.3.1. Comparisons between specimens of the samegenus:PCAAs mentioned above, certain fossils for which the
absolute concentration of lipids were low possessed dis-tributions which deviated from the mean distributions(as depicted in Figs. 2±6). Such specimens were alsoseparated from other specimens of the same type by
PCA in Figs. 7 and 9, e.g. FM1, FPR14 and PF51,.Histograms of these are depicted in Fig. 8 (labelled D,E, and Q) alongside specimens of the same genus which
exhibited higher lipid concentrations and more typicaldistributions (D cf. A±C; E cf. F, G; and Q cf. P ).
5.3.2. Distributional variations between MagnoliaspecimensThe 14 specimens of Magnolia that were collected
from the P-33 site showed two subtly di�erent n-alkane
distribution patterns (Fig. 8 histogram A cf. B and C),yet morphologically the fossils seemed to represent asingle species. Six of the specimens from the P-33 site
(FX4, FX6, FM42, FM54, FMR4, FMR32) showed anunusual feature in that the C30 n-alkane was higher inconcentration than the n-C31 homologue (Fig. 8 histo-
gram A; Lockheart, 1997, Appendix 6c). The n-alkanoldistributions for this group of six fossils also showedslight di�erences from the other Magnolia samples
(Lockheart, 1997; Appendix 6g). As a consequence, thesespecimens formed distinct groups on the PCA scoresplots for the n-alkane and n-alkanol analyses, respec-tively (circled in Figs. 7d and 9e). The other eight Mag-
nolia fossils had the more usual odd predominance overthe whole n-alkane distribution (e.g. Fig. 8 histograms Band C). The cause of these di�erences is uncertain but
they may re¯ect: (i) local variations in the conditions forpreservation within the sediment; (ii) the presence ofmore than one species of Magnolia in the fossil assem-blage; (iii) phenotypic diversity between trees of the same
species which may lead to small variations in the dis-tribution of the original leaf waxes, or (iv) the canopyposition from which the leaf originated. Sun and shade
leaves from the same tree can show quite di�erent n-alkane distributions and concentrations, e.g. in Quercuspyrenaica and Quercus robur (Lockheart, 1997).
5.4. Distinctions between subdivisions of the genusQuercus
The majority of oak fossils were remarkably con-sistent in composition of n-alkyl lipids, especially the n-alkanes. The Clarkia P-33 samples were dominated by
one or more species that have a�nities with moderndeciduous red oak species (subgenus erythrobalanus),such as aristate margins. These species are associated
with ¯oodplain-slope type vegetation (Smiley andRember, 1985a). Two examples of `evergreen' fossil oakspecies were identi®ed (FL12 and FL23) which are
usually associated with swamp-type vegetation (Smileyand Rember, 1985a and b) and these, as expected, dis-played di�erent n-alkane distributions compared with
the more common deciduous red oaks. The n-alkanoldistributions of these two specimens also di�ered fromthe P-33 red oaks but, coincidentally, resembled thedistributions from three samples of a potentially di�er-
ent species of red oak from the younger P-35 site (FL34,FL35, FL36). It is noteworthy that the red oak lipidpro®les are quite di�erent from some living species of
white oak (subgenus leucobalanus) (e.g. Quercus robur,Prasad and GuÈ lz, 1990, Rieley et al., 1991). Further-more, several living species of red oak have been shown
to have very similar distributions to the Clarkia fossils.The distribution of modern Q. marilandica is inset inFig. 2a and is similar to that of the fossils (along with Q.rubra and Q. negra; Lockheart, 1997). A detailed analy-
sis of a large number of living examples of the Fagaceaefamily has been performed and this data will be com-pared with Clarkia fossils in a forthcoming paper.
5.5. Comparisons between several genera of the samefamily
5.5.1. Taxodiaceae familyThe nine fossil samples representing three di�erent
genera of this family provided further opportunity toexamine the chemotaxonomic relationships betweenrelated taxa. Slight morphological di�erences in theform of the stems and leaves exist between the three
genera facilitating their identi®cation in the fossilassemblage at Clarkia (see Fig. 10 for photographs).The n-alkane concentrations in all three of these genera
M.J. Lockheart et al. / Organic Geochemistry 31 (2000) 1223±1246 1241

were low (Table 3 and Appendix 5a, Lockheart 1997;Cmax between 8.8 and 21m/gdw) and in the same range assedimentary n-alkanes. While C29 or C31 n-alkanesformed the dominant homologues in the conifer speci-
mens the C22, C24 and C34 n-alkanes were also promi-nent in their distribution pro®les. The fossil bearingsediments had concentrations of the dominant n-alkane
(either n-C29 or n-C31) of 17 mg/gdw (C29, P-33 2b), 22mg/gdw (C29, P-33 5c) and 11 m/gdw (C31, P-35). Hence,lipids derived from the enclosing sediments may make a
signi®cant contribution to the fossil distributions, in thisinstance. The low concentrations of n-alkanes in thefossil Taxodiaceae were consistent with the levels detec-
ted in leaves of a modern Metasequoia glyptostroboides(dawn redwood) sampled from Westonbirt Arboretum,Gloucestershire, UK (n-alkane distribution depicted ininset of Fig. 3g). This modern species had a broad dis-
tribution that maximised at C25. Closer examination ofthe fossil distribution for the sole Metasequoia fossilFT77 from P-33 horizon 5c (Fig. 3g) reveals that it may
indeed show a distribution similar to modern M. glyp-tostroboides (Fig. 3g inset) overlaid with the P33-5csedimentary pro®le (Fig. 4). It is possible that the other
two related genera (Taxodium and Sequoia) will sharesimilar distributions to the modernMetasequoia although
other members of the Taxodiaceae (Cryptomeria andCunninghamia) have been reported with di�ering dis-tributions (Borges de Castillo et al., 1967). Hence, thelipid distributions of fossils of these two taxa may also
take the form of a composite of a leaf lipid pro®le(maximising at C25 n-alkane) above a sedimentarybackground (maximising at C29 or C31). The specimens
of Taxodiaceae were well separated from other generaaccording to PC3 which re¯ected the prominent longand short chain homologues (Fig. 7c and e). Variation
in the extent of contributions from exogenous (sedi-ment-derived) n-alkanes may account for the lack ofclear trends in PCA scores between Taxodiaceae speci-
mens (e.g. Fig. 7e).Approximately 40% of all the fossil remains identi®ed
in the upper 5a and 5c layers of the Clarkia P-33 sedi-ments were Taxodium with ca. 5% Metasequoia and
Sequoia leaves (Smiley and Rember, 1985a), the lipidpro®le of these layers is similar to that of the less con-ifer-rich Unit 2 sediment (Fig. 4). A Taxodium rich
deposit in the Weisselster Basin, Germany also showeda distribution pattern of n-alkanes which was dominatedby C29 (maximum) and C31 n-alkane (Otto et al., 1994).
In contrast, the n-alkanols in the Taxodiaceae fossilswere present at higher concentration than in the enclosing
Fig. 10. Examples of genera of the family Taxodiaceae commonly found in Clarkia (P-33) and Oviatt Creek (P-35) sediments: (a)
Taxodium (like modern swamp cypress of SE USA), (b) Metasequoia (relative of modern dawn redwood of China), and (c) Sequoia
(resembles modern coast redwood of Oregon). Subtle di�erences in the morphology of the branchlets enable their taxonomic identi-
®cation. Taxodium and Metasequoia di�er in that Taxodium has a more acute angle between leaves and the shoot, and the leaves are
slightly o�set rather than paired, as is the case for Metasequoia. Sequoia leaves are arranged in two o�set rows along a more robust
shoot. Photographs are enlarged to emphasise detail. Photographs are reproduced with permission from the Clarkia guidebook and
roadlog (Smiley and Rember, 1979).
1242 M.J. Lockheart et al. / Organic Geochemistry 31 (2000) 1223±1246

sediments. As a result, the distributions were more con-sistent and showed clear di�erences from the sediments.The plot of PC1 vs PC2 scores from PCA of n-alkanolsemphasises the subtle di�erences between the samples of
di�erent genera and from di�erent sites (Fig. 9d). The n-alkanol distributions of the three Taxodium fossils fromP-33 2b sediments (FT3, 61 and 62) resembled those of
the two fossils from site P-35 (FT63a, b) although theyshowed lower carbon preference indices (Lockheart,1997, Appendices 5b and 6h). The distribution of n-
alkanols extracted from the single example of Taxodiumfrom the P-33 5c strata (FT76) was more similar to theTaxodium specimens from P-35 than the three from P-
33 2b. Metasequoia (FT77) and Sequoia (FT80 and 81)were distinguishable from the six Taxodium fossils onthe basis of the prominence of the C24 n-alkanol (Fig. 6gand h).
5.5.2. Fagaceae familyThe three members of this family examined provide
the opportunity to compare the lipid pro®les betweentwo genera that are morphologically similar, i.e. Fagusand Pseudofagus, and one that is not, i.e. Quercus. Fossil
Fagus leaves were generally very similar to Pseudofagusalthough they possessed fewer secondary veins and theleaves were smaller in size (the fruit of Pseudofagus also
di�ers quite markedly from modern Fagus sp., Smileyand Huggins, 1981). The n-alkyl lipid pro®les of thesetwo genera were very similar to each other and alsoextant F. grandifolia, japonica and orientalis which
closely resemble both fossil genera. Quercus specimensare not only di�erent in appearance but also in lipidcomposition to the fossil Fagus and Pseudofagus speci-
mens. This di�erence is also apparent between livingexamples of these genera (compare inset histograms inFig. 2a and e).
The clear analogies between fossils and living mem-bers of the Fagaceae will have great value in assessingthe prevailing climatic in Miocene Clarkia. This may beachieved by considering the climatic preferences of
extant species that have the closest chemical and mor-phological a�nities with the fossils.
5.6. Preservation of lipids
5.6.1. Preservation inferred from distributions and
concentration of lipidsMost of the fossil specimens of the same genus
resembled one another in the distribution of n-alkyl
lipids. The fact that the concentration of lipid in mostfossils was higher than in the enclosing sedimentsprovides further evidence that the lipids endogenous tothe leaf remained intimately associated with the macro-
fossil throughout the period of burial.It is not unreasonable to assume that the low con-
centrations and atypical distributions in a few of the fos-
sils (discussed earlier) arise from unfavourable pre or postdepositional conditions. The rapid burial of the Clarkiafossils under mud/silt introduced to the lake during heavyregional rainstorms has been suggested as a contributory
factor to the excellent state of preservation of many of thefossils (Smiley and Rember, 1985b). This proposed rapidincorporation into the sediments coupled with anoxic
conditions would also favour the preservation of organicmaterials such as lipids because of the limited activity offungi and bacteria. However, if a leaf remained uncov-
ered at the surface of the sediments for an extendedperiod of time, greater opportunity for degradationwould arise, since many of the soluble components
including phytotoxic tannins would leach out into waterwithin a few hours (Spicer, 1991). It is possible that theburial of the specimens which showed poor chemicalpreservation was delayed in some way, resulting in more
extensive pre and post depositional degradation.
5.6.2. Preservation in relation to morphological
appearanceThree specimens mentioned previously (Magnolia
FM1, Platanus FPR14 and Pseudofagus PF51) that
showed low concentrations of lipid exhibited no mor-phological indications to suggest that a greater degree ofdegradation of lipids had occurred (e.g. colour, evidence
of fungal infestation or insect damage). Furthermore,when the sample set was considered as a whole, theredid not appear to be an obvious correlation between thephysical appearance of the various fossils and the qua-
litative or quantitative survival of lipids.Pre-depositional damage to leaves, deduced from the
physical appearance of fossils, was apparently of little
consequence as far as the preservation of lipids wasconcerned. For instance, one Magnolia fossil (FM64,Fig. 8 histogram C) was morphologically quite di�erent
from other specimens, it appeared to be in poor physicalcondition; it was light grey in colour and covered indarker speckles, perhaps evidence of fungal infestation(see Williams, 1985 for description of epiphytic fungi on
Clarkia fossils). Yet, this fossil displayed a similar n-alkane distribution to the most exceptional fossil sam-pled, a green Magnolia fossil (FM50, Fig. 8 histogram
B). Likewise, one of the Platanus fossils (FP57) dis-played typical distributions and concentrations of n-alkyl lipids despite being in poor physical condition with
numerous holes, presumably the result of pre-deposi-tional insect mining.
6. Conclusions
Lipid pro®les of individual fossil leaves and sediments
from two Miocene lake deposits in northern Idaho,Clarkia P-33 and Oviatt Creek P-35, were studied toassess the chemotaxonomic potential of n-alkyl lipids
M.J. Lockheart et al. / Organic Geochemistry 31 (2000) 1223±1246 1243
from intact macrofossils. The following conclusions canbe drawn from the results.
1. It was clear from comparisons of distributions
and concentrations of n-alkyl lipids between gen-era that lipids associated with the epicuticularwaxes of the leaf were preserved and in most cases
distinct above a weaker background signal ofsedimentary n-alkyl lipids. These distribution pat-terns often di�ered between genera belonging to
the same or di�erent families. Principal compo-nent analyses of the relative abundance distribu-tions of n-alkane and n-alkanol homologues
emphasised these distinctions between genera andalso revealed subtle variations within examples ofa single fossil genera (e.g. Magnolia). In certaincases, di�erences in n-alkyl lipid distributions
were su�cient to distinguish between fossil genera(e.g. n-alkanes: Platanus, n-alkanols: Quercus).
2. A few samples showed atypical distribution pat-
terns, these were usually characterised by reducedconcentrations of alkyl lipids which showed anincreased sedimentary signal and lower carbon
preference indices, these specimens were suggestedto have been degraded. The extent of post-depositional lipid preservation appeared to be
unrelated to the gross morphological appearanceof the leaf. Furthermore, pre-depositional damageto leaves through fungal infestation or insectmining was not re¯ected in the distributions or
concentrations of preserved n-alkyl lipids.3. Subtle di�erences in distributions were evident
between specimens of Magnolia. Speci®cally, six
of the fourteen P-33 samples showed an unusualfeature in that the C30 n-alkane was higher inconcentration than the C31 homologue. The cause
of this di�erence remains unresolved but possibi-lities proposed included: (i) di�erences in theextent of lipid preservation, (ii) more than a singlespecies being represented in the assemblage, (iii)
phenotypic variation between trees that con-tributed leaves to the sediments, and (iv) di�erencesin lipid compositions due to local environmental
conditions, e.g. the intensity of sunlight that a leafreceived in the canopy.
4. Three genera of the family Taxodiaceae; Sequoia,
Metasequoia and Taxodium, were examined andshowed low concentrations of n-alkanes and dis-tributions that appeared similar to the n-alkane
distributions of the embedding sediment. How-ever, in some cases a weak distribution maximis-ing at n-C25 derived from endogenous leaf waxcomponents (which resembled that of a modern
Metasequoia glyptostroboides) was detectableabove the underlying sedimentary n-alkane pattern(which maximised at n-C29 or n-C31). n-Alkanol
concentrations were higher in specimens of thesethree genera and closer similarities in distributionpatterns were evident between specimens thanwere observed in the n-alkanes. Specimens of the
same genus or originating from the same sitegrouped together upon PCA treatment of the n-alkanol distribution data.
5. Di�erences in the distributions and concentrationsof n-alkyl lipids between specimens from twosubdivisions of the Quercus genus were also seen.
Deciduous red oak fossil specimens showed verydistinct n-alkane lipid pro®les compared with thetwo examples of evergreen oak fossils. The fossil
red oak pro®les also resembled those of the n-alkanes extracted from the epicuticular waxes ofseveral living red oak species.
The results from this study demonstrate that incertain cases it is possible to use the distributions ofsimple lipid classes preserved in plant macrofossils to
perform chemotaxonomic comparisons between generapreserved in the fossil record. Furthermore, the poten-tial exists to use these characteristic distribution pro®les
of fossil lipids in comparisons with epicuticular waxes ofmodern ¯ora in order to establish taxonomic relation-ships. Results from studies of this nature will be pre-
sented in a future paper.
Acknowledgements
The fossils examined in this paper were sampled andidenti®ed with the assistance of the late Professor Jack
Smiley and his wife Peg. Drs Hong Yang and Qin Lengare gratefully thanked for assistance in ®eld work. Pro-fessor Geo�rey Eglinton is thanked for his valued input
in the early stages of this project. The NERC arethanked for a PhD studentship (GT 4/93/5/G) awardedto MJL. We are grateful to Jim Carter and Andy Gled-hill for invaluable technical assistance in GC/MS ana-
lyses. Dr Bill Rember at U. Idaho, Professor DavidBilderback at U. Montana-Missoula, and the AmericanAssociation for the Advancement of Science are
thanked for permission to reproduce photographs and®gures in the manuscript. Drs G. Logan and A. Otto arethanked for their thorough review of this manuscript.
Associate EditorÐB.R.T. Simoneit
References
Baker, E.A., 1982. Chemistry and morphology of plant epicu-
ticular waxes. In: Cutler, D.F., Alvin, K.L., Price, C.E.
(Eds.), The Plant Cuticle. Linn. Soc. Symp. Ser. 10. Aca-
demic Press, London, pp. 139±165.
1244 M.J. Lockheart et al. / Organic Geochemistry 31 (2000) 1223±1246

Borges de Castillo, J., Brooks, C.J.W., Cambie, R., Eglinton,
G., Hamilton, R.J., Pellitt, P., 1967. The taxonomic dis-
tribution of some hydrocarbons in gymnosperms. Phy-
tochemistry 6, 391±398.
Collister, J.W., Rieley, G., Stern, B., Eglinton, G., Fry, B.,
1994. Compound speci®c 13C analyses of leaf lipids from
plants with di�ering carbon dioxide metabolisms. Organic
Geochemistry 21, 619±627.
Dyson, W.G., Herbin, G.A., 1968. Studies on plant cuticular
waxes Ð IV Leaf wax alkanes as a taxonomic discriminant
for cypresses grown in Kenya. Phytochemistry 7, 1339±1344.
Eglinton, G., Gonzalez, A.G., Hamilton, R.J., Raphael, R.A.,
1962. Hydrocarbon constituents of the wax coatings of plant
leaves: a taxonomic survey. Phytochemistry 1, 89±102.
Ficken, K.J. Lipid and Sulphur Geochemistry of Recent Sedi-
ments from Oxic and Anoxic Environments. PhD thesis,
University of Newcastle, UK.
GuÈ lz, P.-G., MuÈ ller, E., Prasad, R.B.N., 1989. Organ-speci®c
composition of epicuticular waxes of beech (Fagus sylvatica
L) leaves and seeds. Zeitschrift Naturforschung 44, 731±734.
GuÈ lz, P.-G., MuÈ ller, E., 1992. Seasonal variation in the com-
position of epicuticular waxes of Quercus robur leaves.
Zeitschrift Naturforschung 47, 800±806.
Herbin, G.A., Robins, P.A., 1969. Patterns of variation and
development in leaf wax alkanes. Phytochemistry 8, 1985±
1998.
Huang, Y., Lockheart, M.J., Collister, J.W., Eglinton, G.,
1995. Molecular and isotopic biogeochemistry of the Mio-
cene Clarkia Formation: hydrocarbons and alcohols.
Organic Geochemistry 23, 785±801.
Huang, Y., Lockheart, M.J., Logan, G.A., Eglinton, G., 1996.
Isotope and molecular evidence for the diverse origins
of carboxylic acids in leaf fossils and sediments from
the Miocene Lake Clarkia deposit, Idaho, USA. Organic
Geochemistry 24, 289±299.
Lockheart, M.J., 1997. Isotope Compositions and Distribu-
tions of Individual Compounds as Indicators for Environ-
mental Conditions: Comparisons Between Contemporary
and Clarkia Fossil Leaves. PhD Dissertation, University of
Bristol, UK. 308 pp.
Lockheart, M.J., van Bergen, P.F., Evershed, R.P., 1997.
Variations in the stable carbon isotope compositions of
individual lipids from the leaves of modern angiosperms:
implications for the study of higher land plant-derived
sedimentary organic matter. Organic Geochemistry 26, 137±
153.
Logan, G.A., 1992. Biogeochemistry of the Miocene lacustrine
deposit, Clarkia, northern Idaho, USA. PhD. Dissertation,
University of Bristol, UK.
Logan, G.A., Eglinton, G., 1994. Biogeochemistry of the Mio-
cene lacustrine deposit, at Clarkia, northern Idaho, USA.
Organic Geochemistry 21, 857±870.
Logan, G.A., Smiley, C.J., Eglinton, G., 1995. Preservation of
fossil leaf waxes in association with their source tissues,
Clarkia, northern Idaho, USA. Geochimica et Cosmochi-
mica Acta 59, 751±763.
Ma�ei, M., 1994. Discriminant analysis of leaf wax alkanes in
the Lamiaceae and four other plant families. Biochemical
Systematics and Ecology 22, 711±728.
Metcalf, C.R., Chalk, L., 1950. Anatomy of the Dicotyledons.
Vol. 2. Oxford University Press, London. 1500 p.
Meyers, P.A., Ishiwatari, R., 1993. Lacustrine organic geo-
chemistry Ð an overview of the indicators of organic matter
sources and diagenesis in lake sediments. Organic Geochem-
istry 20, 867±900.
Mimura, M.R.M., Salatino, M.L.F., Salatino, A., Baumgratz,
J.F.A., 1998. Alkanes from foliar epicuticular waxes of
Huberia species: Taxonomic implications. Biochemical Sys-
tematics and Ecology 26, 581±588.
Osborne, R., Salatino, M.L.F., Salatino, A., 1989. Alkanes of
foliar epicuticular waxes of the genus Encephalartos. Phy-
tochemistry 28, 3027±3030.
Otto, A., Walther, H., PuÈ ttmann, W., 1994. Molecular compo-
sition of a leaf- and root-bearing Oligocene oxbow lake clay
in the Weisselster Basin, Germany. Organic Geochemistry
22, 275±286.
Phillips, R., 1978. Trees in Britain, Europe and North America,
2nd Edition, Pan Books, London (244 pp.).
Prasad, R.B.N., GuÈ lz, P.G., 1990. Epicuticular waxes from the
leaves of Quercus robur. Phytochemistry 29, 2101±2103.
Rieley, G., Collier, R.J., Jones, D.M., Eglinton, G., 1991. The
biogeochemistry of Ellesmere lake, UK. 1. Source correlation
of leaf wax inputs to the sedimentary lipid record. Organic
Geochemistry 17, 901±912.
Skorupa, L.A., Salatino, M.L.F., Salatino, A., 1998. Hydro-
carbons of leaf epicuticular waxes of Pilocarpus (Rutaceae):-
Taxonomic meaning. Biochemical Systematics and Ecology
26, 655±662.
Smiley, C.J., Huggins, L.M., 1981. Pseudofagus idahoensis, n.
gen. et. sp. (Fagaceae) from the Miocene Clarkia ¯ora of
Idaho. American Journal of Botany 68, 741±761.
Smiley, C.J., Rember, W.C., 1979. Guidebook and Road Log
to the St. Maries River (Clarkia) Fossil Area of Northern
Idaho. Idaho Bureau of Mines and Geology, Moscow, ID
(27 p.).
Smiley, C.J., Rember, W.C., 1985a. Composition of the
Miocene Clarkia ¯ora. In: Smiley, C.J. (Ed.), Late Cenozoic
History of the Paci®c Northwest. American Association
for the Advancement of Science, San Francisco, CA, pp. 95±
112.
Smiley, C.J., Rember, W.C., 1985b. Physical setting of the
Miocene Clarkia fossil beds, northern Idaho. Late Cenozoic
History of the Paci®c Northwest. In: Smiley, C.J. (Ed.),
American Association for the Advancement of Science, San
Francisco, CA, pp. 11±36.
Spicer, R.A., 1991. Plant taphonomic processes. In: Allison,
P.A., Briggs, D.E.G. (Eds.), Taphonomy: Releasing the Data
Locked in the Fossil Record. Plenum Press, New York, pp.
71±113.
Stankiewicz, B.A., Mastalerz, M., Kruge, M.A., van Bergen,
P.F., Sadowska, A.A., 1997. Comparative study of modern
and fossil cone scales of conifers: a geochemical approach.
New Phytologist 135, 375±393.
Summons R.E., Jahnke, L.L., 1992. Hopenes and hopanes
methylated in ring-A: correlation of the hopanoids from
extant methylotrophic bacteria with their fossil analogues.
In: Moldowan, J.M., Albrecht, P. and Philp R.P. (Eds.),
Biological Markers in Sediments and Petroleum. Prentice-
Hall, pp. 182±200.
Tulloch, A.P., 1976. Chemistry of waxes of higher plants. In:
Kolattukudy, P.E. (Ed.), Chemistry and Biochemistry of
Natural Waxes. Elsevier, 30, pp. 235±287.
M.J. Lockheart et al. / Organic Geochemistry 31 (2000) 1223±1246 1245

Walton, T.J., 1990. Waxes, cutin and suberin. In: Har-
wood, J.L. and Bowyer, J.R. (Eds.), Methods in Plant
Biochemistry, Vol. 4. Academic Press Limited, pp. 105±
158.
Williams, J.L., 1985. Miocene epiphyllous fungi from north-
ern Idaho. In: Smiley, C.J. (Ed.), Late Cenozoic History of
the Paci®c Northwest. American Association for the
Advancement of Science, San Francisco, CA, pp. 139±142.
1246 M.J. Lockheart et al. / Organic Geochemistry 31 (2000) 1223±1246