chemistry research journalchemrj.org/download/vol-2-iss-6-2017/chemrj-2017-02-… · ·...
TRANSCRIPT

Chemistry Research Journal, 2017, 2(6):114-130
Chemistry Research Journal
114
Available online www.chemrj.org
Research Article
ISSN: 2455-8990
CODEN(USA): CRJHA5
Evaluation of Remediation Potentials of Selected Organic Wastes on Physicochemical
Parameters in Crude Oil Contaminated Soils
Tubonimi J.K. Ideriah1*, Solomon A. Braide
2, Akuro E. Gobo
3, Chukwunonyelum H.
Otegbulu3
1Institute of Pollution Studies, Rivers State University Port Harcourt, Nigeria
2Information Technology Centre, Rivers State University Port Harcourt, Nigeria
3Institute of Geosciences and Space Technology, Rivers State University Port Harcourt, Nigeria
Abstract The effectiveness of Poultry Waste, Food Waste Compost and Spent Mushroom Substrate in remediation
of crude oil polluted soils at Erema in Ogba/Egbema Ndoni Local government Area of Rivers state was assessed.
The contaminated soils were treated with these organic wastes for 56 days and each slot was sampled at 0-30cm and
30-50cm depths at two weeks intervals. The physicochemical parameters measured were Total Petroleum
Hydrocarbon, pH, Total Nitrogen, Available Phosphorus, Total Organic Carbon, Moisture Content, Soil Texture, in
soil. Standard methods recommended in APHA and HACH were used for the analysis. The results showed that after
56 days of treatments application, the reduction in hydrocarbon contents of the treated soils were 96.3% Poultry
Waste, 88.6% Food Waste Compost, 86.4% Spent Mushroom Substrate and 30.2% Control soil. The results of
Total Nitrogen showed trends of 0.04%, 0.09%, 0.11%, 0.17% and 0.15% in poultry waste treated soil, 0.05%,
0.09%, 0.1%, 0.11% and 0.07% in food waste compost treated soil and 0.03%, 0.06%, 0.07%, 0.09% and 0.1% in
Spent Mushroom Substrate treated soil. Similar trends were observed in other parameters. ANOVA on the levels of
pH, TOC and THC between the treatments and moisture content, physicochemical parameters and TN between the
days and depths showed significant difference (p < 0.05). It was concluded that significant hydrocarbon reduction
was achieved using the selected organic wastes and Spent Mushroom Substrate has the capacity to release sufficient
Nitrogen and Phosphorus for soil amendment. Furthermore, where readily available any of the treatment options
could be used for remediation purpose with poultry waste as the preferred option. Extended application of nutrient
and maintenance of the amended soil was recommended.
Keywords Remediation, Potentials, Organic Wastes, Physicochemical, Crude Oil, Contaminated Soils
Introduction
Petroleum exploration has adverse effects on our natural resources particularly on vegetation and wildlife. Although
petroleum resources sustain the Nigerian economy, oil exploration industrial activities in the sector has been known
to be associated with substantial environmental degradation and social crisis. Thereby posing a potential treat to
sustainable development in the Niger Delta, where the bulk of the petroleum resources are found.
Most of the negative environmental consequences of oil spillage are localized and more intense in the area of
primary activities. Some of the effects have trans-boundary implication. For example, oil spillage results in

Ideriah TJK et al Chemistry Research Journal, 2017, 2(6): 114-130
Chemistry Research Journal
115
destruction of farmland, fishery and aquatic resources, mangrove ecosystem as well as release excess of carbon (iv)
oxide which has been known to be a factor with the problem of global warming [1]. Hence, oil spillage has long
term consequences for both ecological and climatic balances if not properly remediated. The natural recovery of
crude oil from polluted soils is slow. Community which may be affected as a result of sabotage spill is denied of
their agricultural lands. All these environmental consequences result in the need to develop a more rapid and potent
process of remediating crude oil contaminated soil in the environment.
Bioremediation of crude oil polluted soil in Nigeria and the world at large has received the attention of several
researchers in the past [1-7].
Considerable crude oil bioremediation potential has been reported for a variety of terrestrial and marine tropical
rainforest environment. Temperature and moisture content affects the rate of biodegradation as well as the physical
nature and chemical composition of hydrocarbons [7].
According to [8], the effects of oil exploration and production activities impact negatively on the environment,
especially on the land. Oil spills have degraded most agricultural lands and have turned hitherto productive areas
into wastelands. With increasing soil infertility due to the destruction of soil micro-organisms, and dwindling
agricultural productivity, farmers have been forced to abandon their land, to seek non-existent alternative means of
livelihood.
Similarly, [9] highlighted that crude oil hamper proper soil aeration as oil films on the solid surface acts as a
physical barrier between air and the soil. In fact, oil pollution affects the physiochemical properties of the soil, such
as temperature, structure, nutrient status and pH. Oil spillage also causes the release of liquid hydrocarbons and
other toxic chemical substances into farmlands and surroundings which hamper agricultural output and productivity
[2]. [10] observed that in Nigeria about 62.8% of the oil spill incidents occurred on farm lands.
[11] demonstrated that proper remediation can be achieved using vegetable waste from farmland by continuous
tilling and addition of these organic wastes. However, the comparison of the rate at which bioremediation can be
achieved in a crude oil polluted soil using poultry waste, food waste compost and spent mushroom substrate (SMS)
has not been evaluated. Thus this study aims to evaluate the efficiency of organic wastes from poultry, food and
mushroom in bioremediation of crude oil contaminated soil.
Figure 1: Map of Rivers State showing the Study Area
Study Area
A farm land located at Erema community in Ogba/Egbema/Ndoni local Government Area, Rivers state Nigeria was
used for the project work. The geographical coordinate of the area is 5o13′08.0″ N and 6
o42′14.7″ E. [12].

Ideriah TJK et al Chemistry Research Journal, 2017, 2(6): 114-130
Chemistry Research Journal
116
The community is in a tropical rainforest zone. Noticeable around the area are farmlands cultivated by surrounding
dwellers. The study area is clearly dominated by rainforest vegetation, with thick green shrubs. Temperature in the
area is generally in the range of 23-32oC and the relative humidity remain high all year with a minimum of 60% and
an average of more than 90 %. [12].
The area experiences high rainfall most of the year (259.4mm). The lowest mean monthly value occur in January
(27.5 mm) and December (32.6mm). The highest mean monthly rainfall value occurs in July (361.2mm), August
(327.0mm) and September (367.0mm). The volume of rainfall provides great amount of surface runoffs, rivulets and
occasional streams which may carry substances like crude oil to nearby lands and rivers [12].
The geological formation and coastal plain is characterised by sand and clay deposit. The top soil is usually sandy
loam [12].
Poultry Waste (PW)
Poultry Waste Compost used for treatment was sampled from a poultry farm along Omagwa road in Rivers state.
Poultry brooded in the farm are majorly old layers species. The poultry waste was collected from a 32 x 12 feet
battery cage and contains 120 birds. The waste contains poultry droppings and sawdust in a ratio of 3:1. Poultry
dropping used for the study was two days old prior to site visit.
Spent Mushroom Substrate (SMS):
SMS used for the project were collected from mushroom plant located at Rivers State University campus. SMS
contains mixture of rice straws, wheat straw, corn cobs, coca shell waste, cotton straw, cotton seed bulb, sawdust,
logs of wood, rice bran, paper, crushed bagasse and molasses from sugar industry, water hyacinths etc
Composting of these SMS was achieved using the raw bagging system mushroom used for this purpose was one
months old from the time it was bagged.
Food Waste Compost (FWC)
Food Waste Composts were collected from a compost plant located in Ogba local government area. Already sorted
Food wastes received at the compost plant are further sorted to ensure proper segregation. The food wastes are
blended with egg shell for odour control and plant materials such as grasses etc.
Site Preparation
A small portion of the spill site in the study area was demarcated and used for the study. Oil spill, which occurred in
January, was categorised as minor spill [13] resulting from sabotage. Spill cleanup exercise and site preparation in
the study area was initiated to remove free phased oil. During the period of site preparation, there was no rainfall in
the area; hence no hydrocarbon loss due to surface runoff.
Vegetations in the study area were cleared with the help of local youths to give room for cleanup exercise. Surface
litters were removed and free phase oil recovered using sorbent pads and digging of trench holes for oil recovery
after cleanup.
Site Treatment
The spill site was partitioned and area allocated for the experiment was mapped out from other spill site using tapes
and pegs. The area was wetted uniformly to soften the soil and allow the water penetrate the soil matrix. Preliminary
tilling of the soils (0-30cm) in the demarcated area were done a day after watering using hand shovel and hoe to
ensure proper mixing of the soil and breaking of lumps. The soil was thoroughly homogenised to ascertain uniform
distribution of hydrocarbon contaminant in the area.
Secondary tilling and homogenization of the soil was carried out two days after the initial tilling. The lumps were
broken into fine particles with a shovel. The reason is to increase the surface area for treatment.
This was then followed by surface application of treatment and immediate formation of ridges (10feet) for each
treatment option. This was aimed at ensuring thorough mixing of treatment applied and retained availability of
treatment in each ridge.
Experimental Design
The experiment was carried out in a small portion of the spill site demarcated using tapes and pegs with area of
about 12x10inches mapped out for the experiment. A ridge was formed for each treatment option as follows.
Ideriah TJK et al Chemistry Research Journal, 2017, 2(6): 114-130
Chemistry Research Journal
117
Ridge A- treatment with 50kg poultry droppings,
Ridge B- treatment with 50kg food compost,
Ridge C- treatment with 50kg spent mushroom substrate
Ridge D- control with no treatment applied (tilling and watering were only applied).
Sampling Plan
Soil samples from ridges in the study area were collected after homogenising the surface soil (0-30cm), covering the
depth of penetration of the contaminant, in order to determine the initial concentration of contaminants in the soil
before treatment application. After application of treatment materials, samples were taken at 0-30cm and 30-50cm
depths from each ridge into foil packs and transported to the laboratory for analysis. This sampling protocol was
repeated for ten weeks i.e. 1, 14, 28, 42 and 58. Thus samples were collected from each ridge five times giving a
total of forty samples.
Analytical Methods
Selected samples were analysed for soil nutrient physicochemical parameters [14], petrochemical hydrocarbon and
microbial assay as follows:
Particle Size Analysis
Particle size analysis is used to determine the percentage of sand, silt and clay particles in the soil. The principle
used is based on the fact that particle suspended in water settles differently depending on the amount of surface per
unit volume. The rate at which they settle can be calculated using Stoke‟s law. In the bouyoucous or hydrometer
method, the amount of particle in suspension was determined by using hydrometer to measure the density of the
suspension at the appropriate settling times. Samples used for this analysis are firstly air dried at room temperature
for 3 days. The air dried or oven dried sample is ground to pass through 2mm sieved and 400g of each soil was used.
The analysis is dependent on temperature and settling time.
pH
To determine the soil pH, 20g of the air dried sample was weighed and 20mls of distilled water or decolorized water
added to it (1:1 soil/water ratio). The mixture was shaken properly with a mechanical shaker and allowed to stand
for 30mins. A glass electrode pH meter (HACH) was inserted into the partly settled suspension and the pH
measured.
Total Organic Carbon (TOC)
The Walkey-Black procedure used expresses active or decomposed organic matter in the soil. The carbon in plant
residues and humus is oxidized but the carbon as graphite and charcoal do not.
The soil sample (1g) was grounded to pass through a 0.5mm sieve. 10ml of potassium dichromate (K2Cr2O7)
solution was pipetted in the conical flask containing the soil sample and swirled gently to disperse the soil. Then
20ml of conc.H2SO4 was pipetted into the flask, swirled and then allowed to stand on a sheet of asbestos for about
30mins. Then 100ml of distilled water was added. Phenanthroline indicator was added and then titrated with ferrous
sulphate. The titre value was used to calculate the %TOC content of the soil.
% TOC = (meq K2Cr2O7 – meq FeSO4) x 0.003x100x F/wt of dry soil
Correction factor F =1.33.
Moisture Content
Moisture content of the soil samples was determined using the oven drying method. A wet weight of 20g of the soil
weighed into an evaporating dish and then placed in the oven (Uniscope Model) set at 105oC. The sample was
weighed after every one hour until constant weight was achieved.
% moisture content = (initial weight – final weight) x 100
Extraction of Anions (Nitrate and Phosphate)
Morgan‟s reagent was used in the extraction of anions from soil. Weigh 20g of soil sample into a container and
extract with 100ml of Morgan‟s reagent. Morgan‟s reagent was prepared using 100g of sodium acetate (NaOAc) in
500ml of water and 30ml of 99.58% acetic acid and made up to 1litre. This was then filtered and the filtrate used for
nitrate and phosphate analysis.

Ideriah TJK et al Chemistry Research Journal, 2017, 2(6): 114-130
Chemistry Research Journal
118
A Total Nitrogen Analysis
Brucine method was used for Total Nitrogen analysis. The method involves the use of 10ml aliquot of the soil
extract. This extract was transferred into 25ml volumetric flask. Then, 2 ml of Brucine reagent was added and
followed 10ml of H2SO4. The solution was mixed for about 30 seconds and allowed to stand for 3-5 minutes in cold
water and made up to mark. The absorbance was read at a wavelength of 470nm with HACH spectrophotometer
(DR 2500). Blank samples were used to zero the equipment before sample measurement. The intensity of amber
colour determines the concentration of Total Nitrogen in the sample.
B Available Phosphorous Analysis
The ascorbic acid Molybdate Blue method was used for the analysis. The method makes use of 12g Ammonium
Molybdate in 250ml of distilled water. Also 0.2908g of Antimony Potassium Tartrate was added with 1000ml of
H2SO4 and made up to 2liter mark (reagent A). Also 1.056g of the ascorbic acid was added to 200ml of reagent A
and mixed (reagent B). Then mix thoroughly 5ml of the extract, 40ml of distilled water and 8ml of reagent B. The
mixture was allowed to stand for 2mins and absorbance was read at 882nm in the HACH (DR 2500)
spectrophotometer.
Total Hydrocarbon Content (THC)
Hydrocarbon was extracted from 10g of the dried soil sample using 10ml of 1, 1, 2, trichlorotrifluoroethane. The
drying was achieved using activated (1600C for 24hrs) anhydrous Sodium Sulphate. Another 5ml of 1, 1, 2,
Trichlorotrifluoroethane was also added to ensure proper extraction. The extract was cleaned up using column
packed with silica gel and anhydrous Na2SO4. The total hydrocarbon content was measured using infrared
spectrophotometer.
Heavy Metal Analysis
A Digestion for Heavy Metal Analysis
Dried soil of 1g was put into a 250ml conical flask and 100ml distilled water was added. Hydrochloric acid
(HCl) and Nitric acid (HNO3) were added in the ratio of 10:1. The mixture was heated in a heating mantle in a
fume chamber at a low temperature (400C) until a concentrate of at least 15ml was achieved. The extract was
allowed to cool and then made up to 100ml.
B Analysis
Analyses for alkaline and alkaline earth metals were carried out in 100mls of the extract using Atomic
Absorption spectrophotometer. Appropriate wavelengths and lamps were selected before analysis and analysed
against known standards.
Samples for wet Chemistry analyses were refrigerated and immediately analyzed for Nitrate and Phosphate contents.
Standard laboratory quality control procedures were adhered to for wet Chemical analysis of the soil samples. These
include reagent blanks, use of fresh standards and replicate analysis for confidence limit and cleaning of glassware
and other containers. The same procedure was used for soil containers for hydrocarbon determination.
Approximately 0.1kg of each sample was taken at each sample depth. The soil samples were packed in aluminium
foil for hydrocarbon, nutrient and microbial contents and properly labelled for identification purpose.
Results and Discussion
Results
The results of levels of physicochemical and heavy metals in the unpolluted soil and treatments applied are
presented in Tables 1 and 2 respectively. Table 3 shows mean levels of physicochemical parameters in the treated
soils respectively while Table 4 shows the percentage loss of THC in the crude oil contaminated soils amended with
organic wastes. The correlation matrices between parameters and treatments applied are shown in Table 5.
Table 1: Mean levels of Parameters of Unpolluted Soils in the Area Parameters/
Sample ID
Physico–Chemical properties Soil Texture (%) Heavy Metal (Mg/kg) pH MC
(%w/w)
TN
(%)
TOC,
(%)
C/N
Ratio
P
(%)
THC
(mg/kg)
Sand Clay Silt Fe
(mg/kg)
Mn
(mg/kg)
Pb
(mg/kg)
Ni
(mg/kg)
Zn
(mg/kg)
BS A 5.84 11 0.06 0.8 13.3 0.05 3.65 52 20 22 1297 21.5 1.87 0.45 1.4 BS B 5.82 11 0.06 0.83 13.8 0.05 3.40 54 20 21 1256 22.3 1.86 0.49 2.3
Ideriah TJK et al Chemistry Research Journal, 2017, 2(6): 114-130
Chemistry Research Journal
119
BS C 5.82 11 0.05 0.82 16.4 0.05 3.80 52 21 20 1294 24.2 1.87 0.41 2.7
BS D 5.83 11 0.07 0.85 12.1 0.04 3.20 52 20 21 1263 21.2 1.86 0.4 2.3
SD(±) 0.01 0 0.01 0.02 1.81 0.01 0.27 1 0.5 0.82 21.02 1.35 0.01 0.04 0.55
BS= Baseline Soil
Table 2: Physiochemical Parameters of Treatments used for Soil Amendment Treatment
Type
pH TOC
(%)
MC
(%)
TN
(%)
P
(mg/kg)
K
(mg/kg)
Ca
(mg/kg)
As
(mg/kg)
Ba
(mg/kg)
Cd
(mg/kg)
Co
(mg/kg)
Hg
(mg/kg)
Pb
(mg/kg)
Ni
(mg/kg)
Zinc
(mg/kg)
FWC 8.88 3.7 33.9 22.9 142 1455 1796 <0.002 <0.001 <0.002 <0.03 <0.001 0.016 <0.02 0.026
PW 6.59 3.3 35.2 45.3 241 2378 2793 <0.002 <0.001 <0.002 <0.03 <0.001 <0.009 <0.02 <0.001
SMS 9.98 3.9 30.8 27.6 189 1135 1324 <0.002 <0.001 <0.002 <0.03 <0.001 <0.009 <0.02 <0.001
Poultry Waste or Droppings (PW), Food Waste Compost (FWC), Spent Mushroom Substrate (SMS) & Control
(CTRL)
Table 3: Mean Concentrations of Physiochemical Parameters in Contaminated and Control Soils before and after
Treatment Application Parameters Depth
(cm)
PW FWC SMS CTRL
D1 D14 D28 D42 D56 D1 D14 D28 D42 D56 D1 D14 D28 D42 D56 D1 D14 D28 D42 D56
pH (1:1) 0-30 4.92 4.74 4.53 4.47 4.42 4.75 4.92 4.82 4.72 4.85 4.80 5.42 5.51 5.49 5.70 4.84 5.30 5.47 5.70 5.60
30-50 ND 5.78 5.70 5.40 5.90 ND 5.93 5.30 5.60 5.65 ND 6.10 6.19 5.90 6.12 ND 4.87 5.91 5.51 5.60
Moisture
(%w/w)
0-30 10 12 13 13 13 12 10 11 11 11 11 11 14 14 14 10 9 10 10 10
30-50 ND 12 10 10 10 ND 11 11 9 8 ND 12 12 11 10 ND 10 10 9 9
TN (%) 0-30 0.04 0.09 0.11 0.17 0.15 0.05 0.09 0.1 0.11 0.07 0.03 0.06 0.07 0.09 0.1 0.04 0.05 0.03 0.02 0.013
30-50 ND 0.04 0.04 0.04 0.02 ND 0.03 0.03 0.03 0.01 ND 0.03 0.02 0.03 0.02 ND 0.02 0.02 0.009 0.01
TOC (%) 0-30 3.60 3.20 2.80 1.90 1.20 3.75 3.40 3.00 2.20 1.28 3.45 3.60 2.50 1.50 1.24 3.50 3.60 2.80 2.90 1.77
30-50 ND 0.91 0.82 0.42 0.24 ND 0.83 0.79 0.49 0.19 ND 0.90 0.20 0.26 0.18 ND 1.10 1.20 1.30 0.90
C/N Ratio 0-30 90 35.6 25.5 11.2 8.0 75.0 37.8 33.3 20.0 18.3 115 60.0 35.7 16.7 12.4 87.5 72.0 93.0 145 136
30-50 ND 22.6 20.5 10.5 12.0 ND 27.7 26.3 16.3 19.0 ND 30.0 10.0 8.6 9.0 ND 55.0 60.0 143 90.0
Av. P (%) 0-30 0.02 0.05 0.09 0.09 0.07 0.02 0.06 0.07 0.04 0.04 0.02 0.05 0.05 0.07 0.05 0.02 0.03 0.01 0.01 0.01
30-50 ND 0.02 0.03 0.02 0.02 ND 0.03 0.02 0.02 0.01 ND 0.04 0.03 0.03 0.01 ND 0.03 0.01 0.01 0.01
THC
(mg/kg)
0-30 2867 2267 1547 544 104 2817 2202 1621 821 321 2802 2067 1892 892 383 2880 2802 2602 2420 2010
30-50 ND 82 89 49 15 ND 157 72 58 28 ND 53 35 15 9 ND 490 311 254 234
Poultry Waste or Droppings (PW), Food Waste Compost (FWC), Spent Mushroom Substrate (SMS) & Control
(CTRL), ND = Not determined
Table 4: Percentage Loss of THC in Crude Oil Contaminated Soil Amended with Organic Wastes Time (Days)
Treatment 1 14 28 42 58 % loss after 58 days Net Loss
PW 2867 2267 1547 544 104 96.4 96.4-30.2=66.2
FWC 2817 2202 1621 821 321 88.6 88.6-30.2=58.4
SMS 2802 2067 1892 892 383 86.3 86.3-30.2=56.1
CTRL 2880 2802 2602 2420 2010 30.2
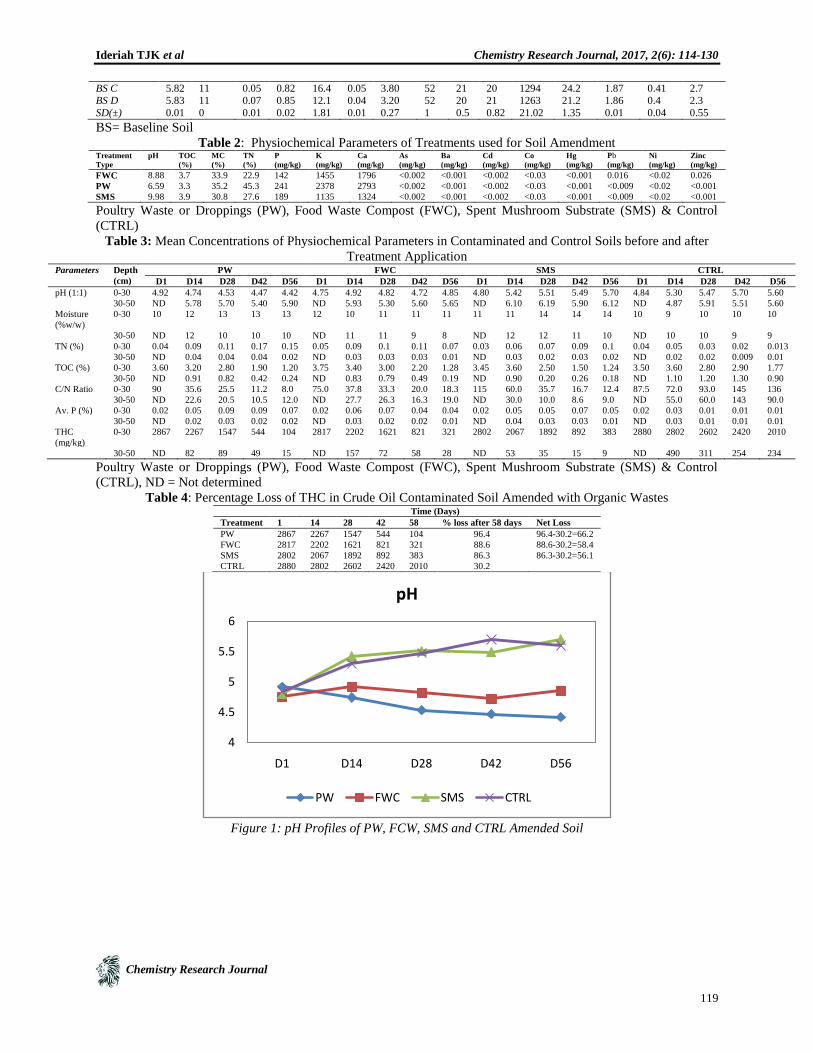
Figure 1: pH Profiles of PW, FCW, SMS and CTRL Amended Soil
4
4.5
5
5.5
6
D1 D14 D28 D42 D56
pH
PW FWC SMS CTRL

Ideriah TJK et al Chemistry Research Journal, 2017, 2(6): 114-130
Chemistry Research Journal
120
Figure 2: Total Nitrogen profiles of PW, FCW, SMS and CTRL Amended Soil
Figure 3: Available Phosphorous profiles of PW, FCW, SMS and CTRL Amended Soil
Figure 4: Moisture Content Profiles of PW, FCW, SMS and CTRL Amended Soil
0
0.05
0.1
0.15
0.2
D1 D14 D28 D42 D56
Total Nitrogen
PW FWC SMS CTRL
0
0.02
0.04
0.06
0.08
0.1
D1 D14 D28 D42 D56
Phosphorous
PW FWC SMS CTRL
6
8
10
12
14
16
1 2 3 4 5
Moisture Content
PW FWC SMS CTRL

Ideriah TJK et al Chemistry Research Journal, 2017, 2(6): 114-130
Chemistry Research Journal
121
Figure 5: TOC Profiles of PW, FCW, SMS and CTRL Amended Soil
Figure 6: C: N Profiles of PW, FCW, SMS and CTRL Amended Soil
Figure 6: THC Reduction Profiles of PW, FCW and SMS Amended Soil
0
1
2
3
4
D1 D14 D28 D42 D56
Total Organic Carbon
PW FWC SMS CTRL
0
50
100
150
200
D1 D14 D28 D42 D56
Carbon :Nitrogen
PW FWC SMS CTRL
0
1000
2000
3000
4000
D1 D14 D28 D42 D56
Total Hydrocarbon Content
PW FWC SMS CTRL

Ideriah TJK et al Chemistry Research Journal, 2017, 2(6): 114-130
Chemistry Research Journal
122
pH
pH of unpolluted soil in the area was slightly acidic and ranged from 5.82-5.84 with mean value of 5.83 as indicated
in Table 1. pH levels of treatments used for soil amendment were 8.88 (FWC), 6.88 (PW) and 9.98 (SMS) as shown
in Table 2
pH of the crude oil polluted soil tended towards acidity with values of 4.92, 4.75, 4.8 and 4.84 prior (day 1) to
amendment with PW, FWC, SMS and control respectively as shown in Table 3.
However on day 14 of nutrient application, pH of soil amended with PW and FCW reduced to 4.74 and 4.72
respectively while at 30-50cm depth, the results were 5.93 and 5.78 respectively. The result in soils treated with
SMS and control increased to 5.42 and 5.3 respectively and also increases to 6.10 and 4.87 respectively with depth.
As remediation progressed from days 28-58, the soil pH amended with PW reduced linearly from 4.53 to 4.42 as
shown in Fig 1. The pH of soil amended with FWC increased from 4.75 to 4.92 on days 1-14 but later declined on
days 28 -42 from 4.82 to 4.72 and increased to 4.85 on day 58.
The pH of soil amended with SMS increased throughout the remediation period from 4.80-5.70 with drop in pH
observed on day 42 to 5.49. pH of the control increased from days 1-42 from 4.84 to 5.7 with slight reduction
observed on day 58 to 5.6.
Soil Nutrient
Unpolluted soil in the area were characterized with low Total Nitrogen and Available Phosphorous concentrations
with value ranges of 0.05-0.07% and 0.04-0.05% respectively and mean values of 0.06% and 0.048% respectively
as shown in Table 1.
Treatments used for soil amendment contain Total Nitrogen of 22.9% (FWC), 45.3% (PW) and 18.6% (SMS) while
that of Available phosphorus were 142mg/kg (FWC), 241mg/kg (PW) and 189 (SMS) mg/kg as shown in Table 2.
Low concentration range values of 0.03-0.05% and 0.02% of Total Nitrogen and Available Phosphorous
respectively were recorded in the crude oil polluted soils prior to soil amendment as shown in Table 3.
On days 14–42 of treatment application, Total Nitrogen concentration in soil amended with PW and FWC increased
from 0.09% to 0.17% and 0.09-0.11% respectively but slightly reduced to 0.15% and 0.10% on day 58. The result
trend in Fig4.2 showed highest release of nutrient in soil amended with PW and FWC. The result in soil amended
with SMS showed a slow but steady release of nutrients from day14 to 58 with concentration range of 0.06% to 01
%.
Available phosphorus as shown in Table 3 and Fig 3 on days 14-58 in soil amended with PW (0.05%, 0.09%, 0.09%
and 0.07%) and FWC (0.06%, 0.07%, 0.04% and 0.04%) showed increase with constant results in two successive
weeks while that for soil amended with SMS (0.05%, 0.05%, 0.07% and 0.5%) had an almost constant value with an
increase in day 42.
Concentrations of Total Nitrogen and Available Phosphorus in control soil showed slight increase following site
tillage and preparation. However with no treatment applied, decline in nutrient concentration were observed as
remediation progressed.
Soil Texture and Moisture Content
Soil textures of soil in the area as presented in Table 1 were mostly fine sand. This characteristic minimizes the
water retention capability of the soil. However, Treatments used for soil amendment are characterized with moisture
content of 33.9% (FWC), 35.2% (PW) and 30.8% (SMS) as shown in Table 1.
On addition of these treatments, the water retention capacity of the soil improved as shown in Fig. 4 and presented
in Table 3. The moisture content of soil amended with PWC increase from 10-13% on days1-28 and stabilised at
13% throughout the remediation period. The moisture content of soils amended with FWC decreased from 12% to
10% on days 1-14 but increased to 11% on day 28 and stabilised throughout the remediation period. Similarly, the
moisture content in SMS was 11% on days 1-14 but increased to 14% on day 28 and remained stable throughout the
remediation period. In all, the water retention capacity down the soil profile was high in SMS. Those for the control
samples were observed to decrease from 10% to 9% on days 1-14 which later increased and stabilised at 10% from
days 28-56.

Ideriah TJK et al Chemistry Research Journal, 2017, 2(6): 114-130
Chemistry Research Journal
123
Total Organic Carbon (TOC)
TOC in treatments applied were 3.7% in FWC, 3.3% in PW and 3.9% in SMS and are presented in Table 2.
The result from days 1- 58 in soils amended with PW (3.6%, 3.2%, 2.8%, 1.9% and 1.2%), FWC (3.75%, 3.4%,
3.0%, 2.2% and 1.28%) and SMS (3.5%, 3.6%, 2.5%, 1.5% and 1.24 %) showed decline in TOC as remediation
progressed. The results trend in control soil were inconsistent as presented in Table 3.
TOC results from days 14-56 decrease down the profile (30-50cm) for soil amended with PW from 0.91 to 0.24%,
in FWC from 0.83-0.19% and SMS from 0.90-0.18% while that for control soils 1.1-0.09% showed very slow
reduction in TOC concentration. Similarly C:N ratio are as presented in Table 3.
Total Hydrocarbon Content
The characteristics of unpolluted soil in the area indicated THC range of 3.2-3.8mg/kg with mean concentration of
3.51mg/kg and are presented in Table 1.
Prior to application of treatment on the polluted site, THC concentration in the soil ranged from 2802 to 2880mg/kg.
On days 14 -58 after treatment application, THC in soil amended with PW declined steadily from 2267 to
104mg/kg, FWC, 2202 to 321mg/kg and SMS 2067- 383mg/kg while that for control declined from 2802-
2010mg/kg as shown in Fig 6 and presented in Table 3.
On day 14 after soil tillage and nutrient application, THC concentrations in profile soil amended with PW (82
mg/kg, to 15 mg/kg), FWC (157 -28mg/kg) and SMS (53-9mg/kg) showed similar decline. However downward
migrations of THC were observed to be lowest in soil amended with SMS.
The percentage reduction and net loss in THC were calculated and presented in Table 5. Chromatograms of TPH
carried out using Gas Chromatography before addition of treatment and on day58 of nutrient application.
Heavy Metal
Heavy metals in the unpolluted soil were evaluated to assess its concentrations in unpolluted soil in the area. Mean
concentrations of Iron, Manganese, Lead, Nickel and Zinc were 1277.5 mg/kg, 22.3mg/kg, 1.87mg/kg, 0.44mg/kg
and 2.18mg/kg respectively. For the treatment applied, Potassium (1455 mg/kg), Calcium (1796 mg/kg), lead
(0.016mg/kg) and Zinc (0.026 mg/kg) were detected in FWC while Barium, Cadmium, Cobalt, Mercury and Nickel
were below the equipment detection limit. In PW and SMS, Potassium (2375 and 1135mg/kg), Calcium (2793 and
1324mg/kg) respectively were detected in the samples, other parameters were below the equipment detection limit.
Discussions
Effect on pH
Soil pH of is crucial to survival of microbes since they thrive under certain pH range. Availability of nutrients is also
a function of the prevailing soil pH [15].
The soil pH was observed to decrease slightly from background soil pH range value of 5.82-5.84 to 4.75-4.92 after
the spill. However on application of treatments, pH was observed to tend towards acidity during the remediation
period for PW and FWC while that of the SMS increased slightly as shown in Fig 1. The reduction throughout the
remediation period (day1- day 58) was observed to be more with PW (4.92-4.42) than FWC (4.75, 4.92- 4.85)
amended soil.
The increased acidity is in line with the report of [16] which shows that decrease could be as a result of the nutrient
availability due to increased in microbial activity.
The observed increase in pH of SMS (4.8- 5.7) could be as a result of compost used in the preparation of the
substrate which is majorly composed of wheat straw, dried blood, horse manure and ground chalk which is alkaline,
hence increases soil pH.
The pH of control sample was observed to increase which probably suggest inactive microbial activity.
Total Nitrogen
Total Nitrogen content for the various options increased on application of treatment, however as treatment
progressed it was observed to decrease with time in soil amended with PW and FWC. A hypothesis that would
account for such behaviour is that the bacteria population was readily utilizing the available nitrogen for
hydrocarbon degradation; hence the available Nitrogen was diminishing with time. Similar observations were made

Ideriah TJK et al Chemistry Research Journal, 2017, 2(6): 114-130
Chemistry Research Journal
124
by [17]. They concluded that during biodegradation, Nitrogen may be lost to the atmosphere when Nitrate ions are
converted to gaseous forms of Nitrogen by series of widely occurring biochemical reduction reactions brought about
by denitrifying bacteria.
Among the various options used, PW tends to release more Nitrogen than others which helped facilitate the
remediation process as shown in Fig 2. The releases of Nitrogen in SMS amended soils were observed to be the
slowest. SMS, though an excellent source of humus, much of its Nitrogen content is assumed to have been used up
by the composting and growing mushrooms. The sudden increase in soil Total Nitrogen concentrations on day 14 of
soil remediation in control soil could be due to soil tillage but with no further treatment applied, decreased in soil
nutrient was observed.
Available Phosphorus
Available phosphorus (P) level improved on application of treatments but decrease as treatment progressed,
although the available phosphorus released appears to be low (see Table 3) compared to the nutrient available in the
treatment added (see Table 2). This can be attributed to the immobility of phosphorus. It may not have been
sufficiently dissolved in the soil to make it available whereas the little that was dissolved is rapidly utilized by
existing microbial population. As the remediation progressed, more deposit of available P was observed in PW
amended soil than that of FWC and SMS.
The concentrations of P increased with time till day 42 in soil amended with PW and SMS while that of FWC
amended soil was observed to deplete when compared with the CTRL (Fig. 3). This implied that organic
amendments enriched the P content of the soil, an important factor in bio stimulation. The addition of nutrients
stimulates the degradative capabilities of the indigenous microorganisms thus allowing the microorganisms to break
down the organic pollutants at a faster rate [18]. N and P are known as most important nutrients needed by
hydrocarbon utilizing bacteria to carry out effective and efficient biodegradative activities of xenobiotics in the soil
environment. Similar results were observed in hydrocarbon contaminated soils amended with poultry and pig
manure compost [19],[20].
Moisture Content
Water is necessary for microbial growth and for diffusion of nutrients and byproducts across the cell wall during the
biodegradation process [21]. It is important to maintain a moisture content that is sufficient for the microbial growth,
but does not water-log the system. Low moisture conditions can restrict the movement of bacteria. However, excess
moisture may fill the smaller pores between particles and limit oxygen transport [22].
Soil moisture contents of treatments applied were observed to drop following pollution of the soil but improved on
tilling and addition of treatment as shown in Fig. 4. The initial drop was expected because in heavily polluted soil,
water droplets adhere to the hydrophobic layer formed and this prevents melting of the inner parts of the soil
aggregates [23]. Prior to remediation, there was further drop in moisture due to soil drying and evaporation of water.
As the soil samples were remediated through the introduction of nutrients, moisture content increased. The soils
amended with SMS were observed to have more water holding capacity followed by PWC and lastly FWC. The
observation with SMS could be attributed to characteristics of the bulking agent used in producing the substrate.
That of the control was observed to decrease and remained constant as remediation progressed.
Influence of Amendments on C: N Ratio
The C: N ratio is a function of the carbon material added and any nutrient additions as well as soil composition and
hydrocarbon concentration, to a minor extent. A wide range of C: N ratios have been reported as effective in
stimulating microbial degradation during composting. [24],[25] conducted composting studies utilizing C: N ratios
of 19:1 and 20:1, respectively. Similarly, [26] cited a study where maximum organic degradation rates occurred at a
C: N ratio of 22:1 and found that degradation was hindered as the C: N ratio approached 30:1. Other sources show
that a reduction of the C: N ratio to less than 20:1 is useful [27]. Since optimal C:N ratios depend on the
hydrocarbon concentration, the nutrient assimilation efficiency of the microorganisms, the bioactivity and

Ideriah TJK et al Chemistry Research Journal, 2017, 2(6): 114-130
Chemistry Research Journal
125
distribution of microbial species affected by different nutrient conditions and the class of hydrocarbons being
degraded [28], it is difficult to assume a general C:N ratio.
Throughout the course of this research, C: N ratios ranges amongst treatment showed a steady decline in the ratio.
The PWC treatment option was observed to have the least C: N at the end of the remediation. This could be
attributed to the increased microbial activity as its population increased due to availability of organic matter and
utilization of nutrient
Total Hydrocarbon Content
After day 28, the results showed that hydrocarbon biodegradation was more in the amended soil than in the control,
with the PW amended soil indicating a higher rate than FC and SMS. However, on day 56 there was no significant
difference between the percentage hydrocarbon reduction in PW amended soil and that of the SMS while the
hydrocarbon reduction profile in the FCW amended soil and that of the SMS were similar. It is therefore evident that
the crude oil contaminated soil amended with organic wastes has greater oil biodegradability compared to un-
amended control soil in this study. The significant difference in oil biodegradation between the soil amended with
organic wastes and control soil occurred within the days 14-28, where bio stimulation resulted in significant increase
in oil biodegradation. The addition of nutrients stimulates the degradative capabilities of the indigenous
microorganisms thus allowing the microorganisms to break down the organic pollutants at a faster rate [18]. The
effectiveness of each amendment was determined by calculating the net percentage loss of crude oil in the
contaminated soil as shown in Table 5. The observed hydrocarbon reduction associated with the amended soil might
be due to differences in the nutrient contents, particularly N and P in these two organic wastes in stimulating the
indigenous microorganisms. [29] showed that addition of N and P to an oil polluted soil accelerated the
biodegradation of the petroleum in soil.
The highest net percentage oil loss was observed at day 56 in soil amended with PW which was 66.2% while the
highest net percentage oil loss recorded in FCW amended soil on day56 was 58.4% and that for SMS amended soil
was 56.1%. From the results, soil amended with PW recorded the highest net percentage oil loss compared to the
others.
The inconsistent rate of change in THC value of spent mushroom can be attributed to availability of nutrient in the
spent mushroom after mushroom production. The insignificant change in THC value observed in the control cell
was due to the existing anaerobic conditions that resulted because the control soil was not tilled at all. Therefore,
there was insufficient oxygen supply and hence anaerobic decomposition ensued resulting in organic material being
produced leading to almost constant or slight increase in THC.
In general varying levels of the soil parameters and bacterial contents were measured in the different days, depths
and treatments. The FWC treatment had appreciable level of Pb (0.016mg/kg) and Zn (0.026mg/kg). The pH of
FWC and SMS are alkaline while PW is slightly acidic. High levels of moisture, TN, Av. P., K and Ca were
measured in PW. ANOVA on the levels of the physicochemical parameters, pH, TOC, THC and Av. P between the
treatments as well as moisture content, physicochemical parameters and TN between the days and depths showed
significant difference (p < 0.05). The levels of TN between the treatments showed no significant difference (p>
0.05). These imply that all the organic wastes used in this study are effective in soil remediation.
Interrelationships in between the Parameters in the Soils
There is a likely hood to have high correlation between the concentrations of the various parameters. Correlation
matrices showing Pearson correlation coefficients between various pairs of parameters are presented in Table 5. A
positive correlation coefficient means that as the value of one variable increases, the value of the other variable also
increase or as one decreases the other decreases. A negative correlation coefficient indicates that as one variable
increases, the other variable decreases or as one variable decreases, the other increases. Further, a correlation above
0.8 is described as strong and a correlation below 0.5 is described as weak.

Ideriah TJK et al Chemistry Research Journal, 2017, 2(6): 114-130
Chemistry Research Journal
126
Table 5: Correlation Matrices in the Parameters and Treatments
pH PW FWC SMS CTRL
PW 1
-0.9889 1.0000
FWC 0.9944 -0.9722 1.0000
-0.9888 0.9998 -0.9730 1.0000
SMS 0.9731 -0.9388 0.9918 -0.9404 1.0000
-0.9866 0.9998 -0.9686 0.9995 -0.9334 1.0000
CTRL 0.9728 -0.9419 0.9902 -0.9429 0.9985 -0.9362 1.0000
-0.9913 0.9993 -0.9750 0.9987 -0.9414 0.9992 -0.9432 1
pH Depth Day1 Day14 Day 28 Day 42 Day 56
Depth 1
Day1 -0.9998 1
Day14 0.5946 -0.5928 1
Day 28 0.6768 -0.6808 0.6092 1
Day 42 0.5472 -0.5502 0.7326 0.8880 1
Day 56 0.6406 -0.6458 0.7980 0.9284 0.9454 1
TN PW FWC SMS CTRL
PW 1
-0.8785 1
FWC 0.8472 -0.9414 1
-0.8785 1 -0.9414 1
SMS 0.9799 -0.9148 0.8266 -0.9148 1
-0.8784 1 -0.9415 0.9999 -0.9147 1
CTRL 0.0795 -0.6713 0.5138 -0.6713 0.1382 -0.6715 1
-0.8786 1 -0.9416 0.9999 -0.9148 1 -0.6714 1
TN Depth Day1 Day14 Day 28 Day 42 Day 56
Depth 1.0000
Day1 #DIV/0! 1.0000
Day14 -0.8427 0.5941 1.0000
Day 28 -0.7392 0.3408 0.9637 1.0000
Day 42 -0.6720 0.1320 0.9110 0.9675 1.0000
Day 56 -0.6954 -0.2138 0.8292 0.9007 0.9619 1.0000
Av. P Depth Day1 Day14 Day 28 Day 42 Day 56
Depth 1
Day1 -1 1
Day14 -0.68973 0.68973 1
Day 28 -0.59901 0.599008 0.794528 1
Day 42 -0.59399 0.593985 0.706827 0.886347 1

Ideriah TJK et al Chemistry Research Journal, 2017, 2(6): 114-130
Chemistry Research Journal
127
Day 56 -0.69282 0.69282 0.716789 0.931101 0.954949 1
Av. P PW FWC SMS CTRL
PW 1
-0.70115 1
FWC 0.80343 -0.73236 1
-0.70135 1 -0.73238 1
SMS 0.934129 -0.77422 0.771272 -0.77423 1
-0.70118 1 -0.73218 1 -0.77407 1
CTRL 0.069338 -0.63268 0.478603 -0.63227 0.306186 -0.63223 1
-0.70158 1 -0.7325 1 -0.77439 1 -0.63208 1
Moisture PW FWC SMS CTRL
PW 1
0.867365 1
FWC -0.54233 -0.88852 1
0.851298 0.971247 -0.8548 1
SMS 0.840168 0.458831 0 0.461479 1
0.902485 0.985728 -0.83205 0.991416 0.537086 1
CTRL 0.085749 -0.42146 0.790569 -0.39318 0.612372 -0.3289 1
0.91436 0.98891 -0.82647 0.98391 0.55482 0.99711 -0.3136 1
Moisture Day1 Day14 Day 28 Day 42 Day 56
Day1 1
Day14 -0.36491 1
Day 28 0.441062 0.452832 1
Day 42 0.661376 0.342145 0.911774 1
Day 56 0.732271 0.230471 0.814078 0.975188 1
TOC Depth Day1 Day14 Day 28 Day 42 Day 56
Depth 1
Day1 -0.99897 1
Day14 -0.99412 0.990615 1
Day 28 -0.9631 0.966932 0.960496 1
Day 42 -0.85335 0.854652 0.872774 0.914497 1
Day 56 -0.87946 0.874394 0.909885 0.920218 0.975902 1
TOC PW FWC SMS CTRL
PW 1
-0.76106 1
FWC 0.99832 -0.77809 1
-0.76157 0.99999 -0.77843 1
SMS 0.97892 -0.71469 0.97140 -0.71589 1
-0.76096 0.99982 -0.77824 0.99980 -0.71254 1
CTRL 0.95049 -0.87302 0.963619 -0.873 0.922877 -0.87147 1
-0.7759 0.999646 -0.79175 0.999692 -0.73141 0.999375 -0.88108 1

Ideriah TJK et al Chemistry Research Journal, 2017, 2(6): 114-130
Chemistry Research Journal
128
THC PW FWC SMS CTRL
PW 1
0.04029 1
FWC 0.99861 0.02587 1
0.14606 0.82493 0.11982 1
SMS 0.98628 0.06327 0.98972 0.07374 1
0.19482 0.90832 0.16582 0.96446 0.15235 1
CTRL 0.95056 0.22811 0.95794 0.27723 0.95251 0.30830 1
-0.16636 0.83683 -0.19628 0.94184 -0.22699 0.92305 -0.0427 1
THC Day1 Day14 Day 28 Day 42 Day 56
Day1 1
Day14 0.97940 1
Day 28 0.94889 0.98120 1
Day 42 0.72272 0.82400 0.89700 1
Day 56 0.51214 0.64778 0.74675 0.96301 1
Conclusion and Recommendations
Conclusion
The study demonstrates that the use of organic waste is a viable option for remediation of crude oil contaminated
soil. Significant hydrocarbon reduction is achieved using poultry waste, food compost waste and spent mushroom
substrate which has the capacity to release sufficient Nitrogen and Phosphorus for soil amendment. Where readily
available any of the option could be used for remediation purpose with poultry waste as the preferred option due to
its ability for steady release of these nutrients required to achieve faster rate of remediation in a contaminated soil.
However the results indicate that nutrient release to enhance remediation of the soil was faster and steady with
poultry waste than other organic wastes thus improving C: N ratio to a level suitable for use.
Recommendations
Based on the findings of this study, the following recommendations were made:
Weather condition and atmospheric measurements during the remediation period should be evaluated in further
advanced study.
Additional application of nutrient and extended maintenance of the amended soil is recommended to enable the
determination of actual residual contaminant concentration.
References
1. World Bank, (1995): Defining an Environmental Development Strategy for the Niger Delta. Vol. I & II:
Industry and Energy Operation Division, West Central Africa.
2. Awobajo, S.A. (1981): An Analysis of Spill Incidents in Nigeria (1976-1980). In: Proc., Seminar on
Petroleum Industry and the Nigerian Environment, NNPC/FMOW and Housing PT, Warri.
3. Grey, P. (1995): The Niger Delta, Nigeria, Draft Pollution Assessment Study Submitted The World Bank.
4. Moffat, D. and Olof, L. (1995): “Perception and Reality: Assessing Priorities for Sustainable Development
in the Niger Delta”, AMIBO: Journal of Human Environmental, Vol, 24, Nos 7-8.

Ideriah TJK et al Chemistry Research Journal, 2017, 2(6): 114-130
Chemistry Research Journal
129
5. Chukwu, I.O., Brown, C .O. and Nwankwo, D.I. (1998): “The Impact of Oil Pollution on the
Hydrochemistry and Biota of the Tidal Creeks and Canals in Ondo state”. 9th International Conference on
the Petroleum and the Nigerian Environment, Abuja, November pg 538-576.
6. Eromosele, Victor E. (1998): “Costing Niger Delta„s oil spills. A joint stakeholder‟s approach” 9th
International Conference on the Petroleum Industry and the Nigerian Environment, Abuja November, 358-
368.
7. Famuyiwa, B.A, (1998): Seabed Survey Of The Impact Of Oil Based Drilling Fluid System On Offshore
Environment, 9th International Conference on the Petroleum Industry And The Nigerian Environmental,
Abuja, November, 461-489.
8. Odjuvwuedrhie E. I., Douglason G. O., and Adun, F. N. (2006), “The Effects of oil Spillage on crop field
and farm Income in Delta State, Nigeria,” Journal of Central European Agriculture Vol. 7, No. 1 (A1-A4).
9. Chindah A. C., Braide S. A. (2000): “The impact of oil Spills on the Ecology and Economy of the Niger
Delta,” Proceedings of the Workshop on Sustainable Remediation Development Technology held at the
Institute of Pollution Studies, Rivers State University of Science and Technology, Port-Harcourt.
10. Ifeadi, C.N., and Nwankwo, J. (1980): Oil Spill incidents in Nigeria Petroleum Industry, A Critical
Analysis. Napetcor. 8:11-45
11. Ebuehi, O. A. T and Abibo, I. B. (2005): Remediation of Crude Oil Contaminated Soil by Enhanced
Natural Attenuation Technique. J. Appl. Sci. Environ. Mgt. 2005 Vol. 9 (1) 103 – 106
12. DCISL (Devine Concept Integrated services), (2008): Environmental Evaluation Study of Crude Oil
Polluted Site at Ahoda Community, Chapter 3.
13. Department of Petroleum Resources (DPR) (Rev 2002): Environmental Guidelines and Standards for the
Petroleum Industry in Nigeria, Lagos, Ministry of Petroleum Resources, Lagos 1991.
14. Ideriah T. J. K.; Ikpe F. N.; Nwanjoku F. N. (2013) Distribution and Speciation of Heavy Metals in Crude
oil contaminated soils from Niger Delta, Nigeria
15. Agamuthu, P., Tan, Y.S., and Fauziah S.H. (2013): Bioremediation Of Hydrocarbon Contaminated Soil
Using Selected Organic Wastes, Procedia Environmental Sciences 18 (2013) 694 – 702.
16. Ijah, U.J.J. and Antai, S.P. (2003): The Potential Use of Chicken-Drop Microorganisms for Oil Spill
Remediation. Environmentalist; 23:89–95. doi: 10.1023/A:1022947727324.
17. Brady, N. and Weil, R. (2002): The Nature and Properties of Soils, 13th Edition. Prentice Hall Upper
Saddle River, New Jersey, 960 p
18. Ausma, S., Edwards, G.C, Fitzgerald-Hubble, C.R., Halfpenny-Mitchell, L., Gillespie, T.J, and Mortimer,
W.P. (2002); Volatile Hydrocarbon Emissions from A Diesel Fuel Contaminated Soil Bioremediation
Facility. Air Waste Manage. Assoc; 52: 769-780.
19. Lee, K., Park, J.W and Ahn, I.S. (2003): Effect of Additional Carbon Source on Naphthalene
Biodegradation by Pseudomonas Putida G7. Journal of Hazardous Materials; 105: 157–167.
20. Adesodun, J.K. and Mbagwu J.S.C. (2008): Biodegradation of Waste Lubricating Petroleum Oil in a
Tropical Alfisol as Mediated by Animal Droppings. Bio-resource Technology; 99:5659-5665.
21. Riser-Roberts, E., (1998): Remediation of Petroleum Contaminated Soil: Biological, Physical, and
Chemical Processes, Lewis Publishers, Boca Raton, FL
22. Richard, T.L., Hamelers, H.V.M., Veeken, A., Silva, T., (2002): Moisture relationships in composting
processes. Compost Science & Utilization 10 (4), 286–302.
23. Van Gestel, K., Mergaert, J., Swings, J., Coosemans, J., and Ryckeboer, J. (2003): Bioremediation of
Diesel Oil – Contaminated Soil by Composting With Biowaste. Environmental Pollution 125:361-368.
24. Zytner, R.G., Salb, A.C. and Stiver, W.H. (2006): Bioremediation Of Diesel Fuel Contaminated Soil:
comparison of individual Compounds to complex Mixtures. Soil and sediment Contamination, 15:1277-
297.
25. Beaudin, N., Caron, R.F, Legros, R., Ramsay, J., and Ramsay, B. (1999): Identification of the Key Factors
Affecting Composting Of a Weathered Hydrocarbon-Contaminated Soil. Biodegradation 10:127–133.

Ideriah TJK et al Chemistry Research Journal, 2017, 2(6): 114-130
Chemistry Research Journal
130
26. Hupe, A., Thomas, H., Ittekkot, V. and Lendt, R. (2000): Inventory of Released Inorganic Carbon from
Organic Matter Remineralisation in the Deeper Arabian Sea, J. Geophys. Res., 106(C12), 31,189 – 31,198.
27. Walecka-Hutchison, C. M., and Walworth, J. L. (2006): Assessment Of C: N Ratios And Water Potential
For Nitrogen Optimization In Diesel Bioremediation. Bioremediation Journal, 10(1-2), 25-35.
28. Ijah, U.J.J, and Safiyanu, H. (1997): Microbial Degradation of Escravos Light Crude Oil in Soil Amended
with Chicken Dropping and NPK Fertilizer, 10th
Annual Conference of Biotechnology Society of Nigeria,
2nd
-5th
April.