chemistry of so and desox processes on oxide … · or process disclosed, or represents that its...
TRANSCRIPT

BNL-76856-2006-BC
Chemistry of SO2 and DeSOx Processes on Oxide Nanoparticles
José A. Rodriguez
To be published in “Synthesis, Properties and Applications of Oxide Nanomaterials”
June 2006
Chemistry Department
Brookhaven National Laboratory P.O. Box 5000
Upton, NY 11973-5000 www.bnl.gov
Notice: This manuscript has been authored by employees of Brookhaven Science Associates, LLC under Contract No. DE-AC02-98CH10886 with the U.S. Department of Energy. The publisher by accepting the manuscript for publication acknowledges that the United States Government retains a non-exclusive, paid-up, irrevocable, world-wide license to publish or reproduce the published form of this manuscript, or allow others to do so, for United States Government purposes. This preprint is intended for publication in a journal or proceedings. Since changes may be made before publication, it may not be cited or reproduced without the author’s permission.

DISCLAIMER
This report was prepared as an account of work sponsored by an agency of the United States Government. Neither the United States Government nor any agency thereof, nor any of their employees, nor any of their contractors, subcontractors, or their employees, makes any warranty, express or implied, or assumes any legal liability or responsibility for the accuracy, completeness, or any third party’s use or the results of such use of any information, apparatus, product, or process disclosed, or represents that its use would not infringe privately owned rights. Reference herein to any specific commercial product, process, or service by trade name, trademark, manufacturer, or otherwise, does not necessarily constitute or imply its endorsement, recommendation, or favoring by the United States Government or any agency thereof or its contractors or subcontractors. The views and opinions of authors expressed herein do not necessarily state or reflect those of the United States Government or any agency thereof.

631
Chapter 20
Chemistry of SO2 and DeSOx Processes on Oxide Nanoparticles
José A. Rodriguez
Department of Chemistry Brookhaven National Laboratory
Upton, NY 11973, USA * E-mail: [email protected], FAX: 1-631-344-2246
Table of Contents 20.1 Introduction
20.2 Chemistry of SO2 on bulk oxides
20.3 Chemistry of SO2 and DeSOx process on oxide nanoparticles
20.3.1 Interaction with CaO, MgO and SrO 20.3.2 Interaction with Al2O3 and Al2O3/MgO 20.3.3 Interaction with Fe2O3, Fe2O3/CaO and
Fe2O3/SrO 20.3.4 Interaction with CeO2 and doped-ceria
20.4 Conclusions
BNL-76856-2006-BC

632
1. Introduction
The chemistry of sulfur dioxide (SO2) on oxide nanoparticles is receiving a lot of
attention due to its importance in the industrial production of sulfuric acid (1) and environmental
catalysis (2,3,4). Sulfur-containing molecules are common impurities present in coal and crude
oil. SO2 is one of the major air pollutants released to the atmosphere as a result of the
combustion of fuels in power plants, factories, houses and transportation (2). It contributes to
the generation of smog and constitutes a serious health hazard for the respiratory system (2).
After its oxidation and reaction with water in the atmosphere, it is responsible for the acid rain
that kills vegetation and corrodes buildings and monuments in modern cities (2). In addition, the
SO2 produced by the combustion of sulfur-containing fuels in automotive engines poisons the
catalysts that are used for the removal of CO and NO in exhaust catalytic converters (2CO + O2
→ 2CO2; 2CO + 2NO → 2CO2 + N2) (4,5). When SO2 is present in the catalytic converter at
high concentrations, it dissociates on the precious-metal component of the catalyst (Rh, Pd or
Pd), blocking active sites and reducing also the overall activity of the system through medium or
long-range electronic effects (6,7). At the levels of 5 to 20 ppm currently present in the typical
automotive exhaust, SO2 interacts primarily with the ceria component of the catalytic converter,
and the poisoning of this oxide is a major concern nowadays (8,9,10).
Governments are constantly tightening regulations to limit the production of SO2 and
emission of sulfur compounds into the air (3-5). Over the past 30 years several processes have
been proposed and developed for the removal of SO2 from exhaust systems, DeSOx operations,
(3-5,11). There is still not universally acceptable solution to this problem. Due to their low cost,
oxides are frequently used as sorbents or scrubbers for trapping the SO2 molecule in industrial

633
processes (11). Also, there is a general interest (3,4,11-15) in using oxides as catalysts for the
Claus reaction (SO2 + 2H2S → 2H2O + 3Sn) and the reduction of sulfur dioxide by CO (SO2
+ 2CO → 2CO2 + Sn). In these reactions, the rupture of the S-O bonds on the oxide catalyst is
one of the most difficult steps.
This chapter presents an overview of recent studies that focus on the chemistry of SO2
and DeSOx processes on oxide nanoparticles. In principle, the unique electronic and structural
properties of oxide nanostructures can lead to a high activity for the cleavage of S-O bonds. A
comparison to studies performed using single crystals like ZnO(0001), MgO(100) or CeO2(110)
allows a detailed analysis of structure sensitivity and the impact of defects and O vacancies. This
chapter is organized as follows. First, a brief general description of the behavior of SO2 on bulk
oxide systems is presented. This is followed by a more detailed description of the interaction of
SO2 with nanoparticles of CaO, MgO, SrO, Al2O3, Al2O3/MgO, Fe2O3, Fe2O3/CaO, CeO2,
Ce1-xZrxO2 and Ce1-xCaxO2-y . Approaches useful for facilitating or promoting the dissociation of
SO2 on oxide nanoparticles are discussed.
2. Chemistry of SO2 on bulk oxides
A study of the interaction of SO2 with CeO2 is interesting for two basic reasons. First,
ceria doped with copper or other metals is able to catalyze the reduction of SO2 by CO (14,15).
And second, the SO2 formed during the combustion of fuels in automotive engines can affect the
performance of the CeO2 or Ce1-xZrxO2 present in catalysts used for reducing CO and NOx
emissions (8,9,10). The species responsible for ceria deactivation is mainly attributed to cerium
sulfate, which blocks the Ce3+ sites for the redox cycle in the process of oxygen storage/release
634
(8,9,10). Reaction of SO2 with CeO2 powders and polycrystalline ceria films supported on
Pt(111) at 25 oC shows sulfate (SO4) as the main surface species as evidenced by a combination
of XANES, temperature programmed desorption (TPD), and high-resolution photoemission (16).
Photoemission studies for the adsorption of SO2 on CeO2(111) and Ce1-xZrxO2(111) point to the
formation of a SOx species on the surface that could be either SO3 or SO4 (17,18). The
identification of this species on the basis of only photoemission is not conclusive (17). To
address this issue, X-ray absorption near-edge spectroscopy (XANES) was used to study the
interaction of SO2 with CeO2(111) and Ce1-xZrxO2(111) surfaces (19). Figure 1 shows S K-edge
spectra for the adsorption of SO2 on CeO2(111) and Ce0.7Zr0.3O2(111) surfaces at room
temperature. A comparison to the corresponding peak positions for sulfates and sulfites (19).
indicates that SO4 is the main species formed on the oxide surfaces with a minor concentration of
SO3. There is no dissociation of the adsorbate.
The top layer of CeO2(111) and Ce0.7Zr0.3O2(111) contains only O atoms, see Figure 2.
The adsorption of SO2 on these O atoms would yield directly sulfite or sulfate species:
SO2,gas + Olattice → SO3,ads (1)
SO3,ads + Olattice → SO4,ads (2)
There are “holes” in the top layer of CeO2(111) and Ce0.7Zr0.3O2(111) that expose Ce and Zr
cations in the second layer, see Figure 2. These cations have all their O neighbors (eight in total)
and interact very weakly with an adsorbed SO2 molecule (17).
Figure 3 displays photoemission data for the adsorption of SO2 at 300 K on a MgO(100)
crystal, bottom panel, and a MgO(100) epitaxial film grown on a Mo(100) substrate, top panel
(20). The (100) face of MgO consist of a 50%-50% mixture of Mg and O atoms. The

635
photoemission data indicate that only the O atoms interact strongly with SO2 forming a mixture
of SO3 and SO4 species on the oxide surface (20). An identical result was observed with XANES
after exposing MgO powders to moderate pressures of SO2 (21). The metal centers of MgO
interact weakly with SO2 and are not able to dissociate the molecule (20,21). In general, bulk
powders of pure stoichiometric oxides (MgO, Al2O3, TiO2, Cr2O3, Fe2O3, NiO, CuO, ZnO, ZrO2,
V2O5, MoO3, CoMoO4 and NiMoO4) do not decompose SO2 (12,13,16-26). Well-defined
surfaces of oxides that expose metal cations with a high coordination number {MgO(100),
ZnO(0001), TiO2(110), NiO(001), V2O5(0001), Fe2O3(0001)} also do not dissociate SO2
(17,18,27-31). Thus, stoichiometric oxides can be very good as sorbents (forming SO3 or SO4
species), but in general they will not be active as catalysts for reactions that involve S-O bond
cleavage.
At a theoretical level, the bonding between SO2 and the cations of oxides has been
investigated using extended two-dimensional slabs {MgO, CaO, SrO, TiO2 (21,24,32)}. In all
the theoretical calculations, the frontier molecular orbitals of SO2 mix poorly with electronic
states located on the metal centers of the oxides. Figure 4 compares the band energies of a
common oxide (MgO) and the molecular orbital energies of SO2 (33,34). For the oxide, the
empty and occupied bands are indicated by dotted and solid lines, respectively. The lowest
unoccupied molecular orbital (LUMO) of SO2 is S-O antibonding (32,34). In typical oxides, the
occupied states of the metal centers are too stable for interacting or transferring electron density
into the LUMO of SO2 (i.e. no effective band-orbital mixing). This leads to small SO2 adsorption
energies on the cations and prevents dissociation of the molecule (21,24,32). To dissociate SO2
on an oxide surface, one needs to create occupied metal states above the valence band of the

636
oxide. This can be accomplished by the introduction of O vacancies or other structural defects on
the surface. This type of defects are frequent on oxide nanoparticles and tend to move upwards
the occupied levels or downwards the empty levels (19), see Figure 4.
The presence of O vacancies in CeO2(111) and Ce0.7Zr0.3O2(111) induces the interaction
of SO2 with the metal cations and dissociation of the molecule (17,18). The right-side panel in
Figure 5 shows S 2p photoemission results for the adsorption of SO2 on several ceria systems
(16). The left-panel displays the corresponding valence photoemission spectra for the ceria
systems before the adsorption of SO2 (16). In the case of CeO2, the valence spectrum shows no
signal in the region between 4 and 0 eV, where Ce3+ appears. The features between 8 and 4 eV
contain O 2p character (main component) and metal character (16-18). On this system, the
adsorption of SO2 mainly produces SO4 (16). O atoms can be preferentially removed from CeO2
by Ar+ sputtering (16-18). In Figure 5, the valence spectra for CeO2-x and Ce2O3+x are
characterized by a Ce3+ peak near 2 eV (16,17). Thus, the introduction of O vacancies creates
occupied metal states above the valence band of CeO2. This, phenomenon should make the oxide
active for the dissociation S-O bonds (see above). And, indeed, the S 2p data exhibit features
between 164 and 162 eV that come from the full decomposition of the SO2 molecule on CeO2-x
and Ce2O3+x. CeO2 is useful as a catalysts for the reduction of SO2 by CO only at elevated
temperatures, when CO is able to create O vacancies and associated Ce3+ sites in the oxide
(16,33,35).
MgO(001), TiO2(110), NiO(001), V2O5(0001) and Fe2O3(0001) also become active for
the decomposition of SO2 after the creation of O vacancies by ion sputtering (21,27-32).

637
Theoretical calculations show that on these defects the adsorption energy of SO2 is much larger
than on flat stoichiometric surfaces with a substantial weakening and elongation of the S-O
bonds (21,32). In principle, oxides that can be reduced by CO to form O vacancies, could be
active catalysts for the 2COgas + SO2,gas 2CO2,gas + Sads reaction. This is the case of CuO and
CeO2 (14,15,16,35). To favor the formation of O vacancies and active centers in these oxide, the
reaction is usually carried out at high temperatures with a CO/SO2 ratio in the feed ∃ 2. In the
case of ceria, doping with a second metal helps the formation of O vacancies (36,37) and
increases catalytic activity (14,15,35,38).
3. Chemistry of SO2 and DeSOx processes on oxide nanoparticles
“Size effects” have not been studied for many oxides in a systematic way (39). For a vast
number of oxide compounds, this comes out from the fact that the preparation procedures are not
able to give a size distribution approaching the delta function (39). Detailed studies have appeared
in the literature examining the interaction of SO2 with only a few types of oxide nanoparticles: CaO,
MgO, SrO, BaO, Al2O3, Al2O3/MgO, Fe2O3, Fe2O3/CaO, CeO2 and Ce1-xZrxO2. The focus has been
mainly on oxides of the alkaline-earth elements, frequently used as DeSOx scrubbers (11), and ceria
based materials, useful as DeSOx catalysts (14,15).
3.1 Interaction with CaO, MgO and SrO
Nanoparticles of CaO, MgO, and SrO usually prefer to adopt a nearly perfect or somewhat
distorted cubic shape, exposing the (100) face of a rocksalt crystal structure (40,41). Nanoparticles
exhibiting (110) and (111) faces are much less common and frequently are not stable at high
638
temperatures. For example, when Mg metal is burned in air or oxygen, the MgO smoke particles
that are formed are almost perfect cubes having (100) faces (42). Special procedures to prepare MgO
nanoparticles exhibiting (110) and (111) faces have been partially successful (43), but in general
they tend to facet to surfaces containing (100) planes (44).
An important aspect to consider when dealing with MgO nanoparticles is the possible
presence of O vacancies (45). These can have a tremendous influence on the electronic and
chemical properties of the nanoparticles. The anionic vacancies in MgO are known as F centers;
depending on the charge one can have F, F+, and F2+ centers which correspond to the removal of a
neutral O atom, of an O- or of an O2- anion, respectively (45). The F centers can be described as an
electron pair trapped in the cavity left by the missing oxygen. They can produce electronic states
localized well above the valence band of MgO (45). The F+ centers consist of a single electron
associated with the vacancy and give rise to a typical signal in EPR. Finally, F2+ centers are strongly
electron deficient and have a tendency to ionize bonded molecules.
The adsorption of SO2 on nanoparticles of MgO at 300 K mainly produces SO4 groups,
SO2(gas) + 2O(oxide) → SO4(adsorbed), with a very small amount of SO3 and without cleavage of
S-O bonds (i.e. no deposition of atomic sulfur on the Mg cations) (44). In contrast, the adsorption
of SO2 on a MgO(100) crystal under similar conditions mainly yields SO3 with SO4 as a secondary
product (see above) (44). Calculations based on the Hartree-Fock method and DFT indicate that the
formation of SO4 on MgO(100) in not spontaneous and requires a major reconstruction of the
surface with the participation of defect sites (21,24). In the calculations, the interaction of SO2 with
MgO(100) produces a SO3-like species (21,24). For SO2 on the MgO nanoparticles, the existence of
corner and edge sites in the oxide substrate facilitates the structural changes necessary for the
639
formation of SO4 (46).
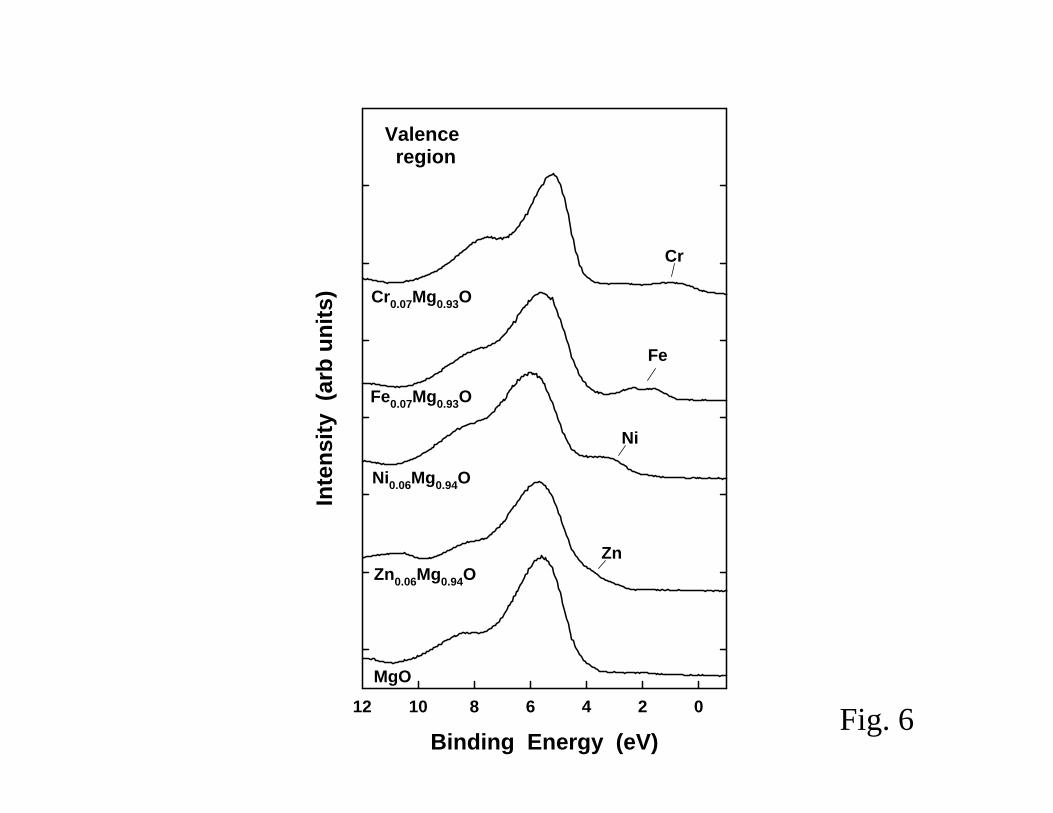
For several industrial applications MgO is doped with small amounts of a transition metal.
Such doping can induce structural transformations and be used to stabilize MgO nanoparticles that
expose (110) or (111) faces (44) The doping also can lead to perturbations in the electronic
properties of the nanoparticles by favoring the formation of O vacancies or by introducing new
occupied states above the valence band of MgO as shown in Figure 6 (47). The position of the new
occupied states depends on the nature of the dopant element. This phenomenon is particularly
important when the doping is done with metals like Fe or Cr that induce states 2-3 eV above the
MgO valence band. In general, the TMxMg1-xO systems (TM= Ni, Fe, Mn, Cr) exhibit electronic and
chemical properties different from those of pure MgO (44,47).
The doping of the MgO nanoparticles with Cr produces a system that is extremely efficient
for the destruction of SO2 (44,48). The Mg1-xCrxO2 nanoparticles are able to cleave the S-O bonds at
temperatures below 300 K, while bulk MgO and Cr2O3 only adsorb the molecule to form SO3 or SO4
species (44,48). The Cr atoms in the Mg1-xCrxO2 nanoparticles are trapped in a “+2” formal
oxidation state and have occupied electronic states that appear well above the MgO valence band
(see Figure 6). These properties facilitate interactions with the LUMO of SO2 and make the
nanoparticles more chemically active than bulk MgO or Cr2O3 (44,48).
Depending on the exact procedure followed for the preparation, nanoparticles of MgO and
CaO with polyhedral or hexagonal shapes can be prepared, but they also contain OH groups (40,49).
In these morphological shapes, the nanoparticles posses more defects than expected for the typical
cubic shape of MgO and CaO (49). Such defects could be of the Frenkel or Schottky type
(vacancies), or be manifested as unusual configurations of edges, corners, or crystal planes (40).

640
Adsorption data for SO2 and other molecules are conclusive that the polyhedral or hexagonal
nanocrystals of MgO and CaO are more reactive than cubic microcrystals of these oxides (49). This
has been mainly attributed to morphological differences, including the concentration of defects.
However, intrinsic electronic effects due purely to “smallness” (confinement) could not be ruled out
(49).
A comparison of the reactivity of CaO particles with sizes of 7.3 and 14.6 nm shows that the
smaller particles are ~ 1.5 times more efficient for the trapping of SO2 than the bigger particles (50).
This can be attributed to a larger concentration of corner and edge sites in the 7.3 nm particles; sites
which are important for the adsorption of SO2 (51). Both sizes of CaO nanoparticles are more
reactive than the bulk oxide. Furthermore, the pure nanoparticles of CaO exhibit a higher activity for
S-O bond cleavage than nanoparticles of pure MgO (44,50,51). A mixture of calcium sulfite,
calcium sulfate and calcium sulfide is observed on the CaO upon the adsorption of SO2. These
species may be formed through two different mechanisms (50)
CaO + SO2 CaSO3 (3)
CaO + SO2 ¾ CaSO4 + ¼ CaS (4)
The SO2/CaO system is complex and cation-to-cation exchanges of the SO32-↔O2-, SO4
2-↔O2- and
S2-↔O2- type may be occurring (50). One reason why the nanocrystals display such a large
efficiency for trapping SO2 is that the small size of the particles permits a shorter ion migration
distance to the core of the particle than for that of conventional calcium oxide. With the shorter ion
migration distances it is easier to react with the entire CaO particle by effectively “eating out” the
core (50).
Nanoparticles of SrO also can be used to mitigate atmospheric pollution and sequester SO2

641
(52). A particularly large efficiency was seen for nanoparticles with sizes under 10 nm. The results
of EXAFS indicate that this large efficiency is associated with a substantial degree of disorder in the
lattice structure (52).
3.2 Interaction with Al2O3 and Al2O3/MgO
Nanocrystals of Al2O3 and Al2O3/MgO were produced through a modified aerogel synthesis
(53). The resulting oxides were in the form of powders having crystallites of about 2 nm or less in
dimension. They exhibited a reactivity towards SO2 much larger than that of bulk aluminas or MgO
(53). This is thought to be due to morphological differences, whereas larger crystallites have only a
small percentage of reactive sites on the surface, smaller crystallites posses much higher surface
concentration of such sites per unit surface area.
Figure 7 shows infrared spectra collected after exposing the nanoparticles (NC) and
commercial powders (CM) to SO2 (20 Torr, room temperature) followed by a 2 hour evacuation
(53). The CM-MgO and CM-Al2O3 showed no adsorbed species. On the other hand, both NC-Al2O3
and NC-Al2O3/MgO show new peaks at 1135 and 1130 cm-1 that correspond to chemisorbed
monodentate SO2. Clearly the nanoparticles have a special chemical activity. The nanoparticles of
Al2O3/MgO were found to be the best SO2 sorbents among the examined samples (53). A significant
feature is that, by a cogellation synthesis, Al2O3 and MgO have been intermingled, which engenders
enhanced reactivity/capacity over the pure forms of nanoscale Al2O3 or MgO (53).
3.3 Interaction with Fe2O3 , Fe2O3/CaO, and Fe2O3/SrO
Nanoparticles of Fe2O3-x with sizes in the range of 2-4 nm can be used for sequestering SO2
642
and do have a moderate activity for the SO2 + 2CO → 2CO2 + Sn reaction (3,44). S K-edge spectra
taken after the adsorption of SO2 at room temperature point to the presence of S, SO2 and SO3 on the
surface of the Fe2O3-x nanoparticles (44). They are much more reactive than bulk Fe2O3 (3,44),
probably due to the presence of O vacancies and surface defects (44). Measurements of X-ray
powder diffraction show a lot of stress, caused by imperfections, in the lattice of the Fe2O3-x
nanoparticles (44).
Coating with Fe2O3 enhances the ability of CaO and SrO nanoparticles to adsorb SO2 (50,52,
54). Only small amounts of Fe2O3 are necessary in order to see this phenomenon (see Figure 8). The
supported Fe2O3 acts as a facilitator and there is a direct reaction of the calcium or strontium oxide
with SO2 The reaction does not stop at the surface, and the CaO and SrO behave as a stoichiometric
reagents (50,54). Table 1 compares the reaction efficiencies for the trapping of SO2 by calcium oxide
nanoparticles pure or coated with Fe2O3 (50). The CaO nanoparticles have sizes of 7.3 and 14.6 nm
(SP and MP particles, respectively, in our notation). The extent of the reaction is indicated by the
breakthrough number and the number of moles of SO2 that are adsorbed per mole of CaO (50). The
breakthrough number is defined as the number of 1-mL injections that are made to the reaction cell
until the first trace of excess SO2 is eluted from the bed of the adsorbent. In Table 1, it is obvious the
tremendous effect of Fe2O3 on the efficiency of the system. MP-CaO particles coated with Fe2O3 are
more active than SP-CaO particles, and when the SP-CaO particles are coated with Fe2O3 the
efficiency of the system is very close to the maximum limit (i.e. 0.94 versus 1.0). Systematic studies
indicate that the enhancement in reactivity is a kinetic phenomenon (50).
The structure of Fe2O3/SrO nanoparticles before and after exposure to SO2 was investigated
using Sr and Fe K-edge EXAFS measurements (52). In the fresh Fe2O3/SrO nanoparticles, the first

643
Sr-O peak is almost unchanged with respect to that in bulk SrO, but the second Sr-Sr peak is
dramatically decreased. This points to a disordered oxide lattice in the Fe2O3/SrO nanoparticles and
may help to enhance their reactivity towards SO2 (52). The Fe K-edge EXAFS data for the fresh
Fe2O3/SrO nanoparticles indicate that the Fe2O3 coating has a large degree of disorder and some of
the cations may be reduced to metallic iron (52). Upon interaction with SO2, the characteristic Fe-S
peak for iron sulfide was not seen. Unfortunately, it was not possible to discriminate between
disordered Fe2O3 and Fe2(SO4)3 because they have a similar first Fe-O peak (52).
3.4 Interaction with CeO2 and doped-ceria
Figure 1 compares S K-edge XANES spectra collected after dosing SO2 at 25 oC to
CeO2(111) and Ce0.7Zr0.3O2(111) surfaces and nanoparticles of CeO2, Ce0.66Zr0.33O2 and
Ce0.66Ca0.33O2-y (19). The spectra for the extended surfaces display a peak for SO4 as a dominant
feature with a minor peak for SO3. For the oxide nanoparticles, again one finds that SO4 is the
main sulfur-containing species present on the surface but, in addition, features are seen at photon
energies between 2470 and 2472 eV that denote the existence of metal-S bonds (19) as a
consequence of the full dissociation of sulfur dioxide (SO2 S + 2O) on the cerium cations. In
principle, clusters and nanoparticles of Ce1-xZrxO2 probably have metal cations at corner and
edge sites that can interact well with the SO2 molecule. On some of these special sites that are
very reactive SO2 decomposes. In addition, there may be O vacancies in the surface of the
Ce0.66Zr0.33O2 and Ce0.66Ca0.33O2-y nanoparticles that facilitate S-O bond cleavage (36). In Figure
1, the Ce0.66Ca0.33O2-y system has the largest concentration of O vacancies (36), and the highest
reactivity for the dissociation of SO2.

644
From the XRD data of the nanoparticles, one can get a strain parameter that is a
measurement of the lattice stress existing in the materials because of surface defects (differences
in local symmetry and distances with respect to the bulk) and/or the crystal imperfections (O
vacancies, other point defects, line defects and plane defects) (36,37,39). The top panel in Figure
8 shows the strain parameters for the CeO2, Ce0.66Zr0.33O2 and Ce0.66Ca0.33O2-y nanoparticles
(36,37). Pure ceria nanoparticles exhibit a larger lattice strain than bulk ceria (36). Clearly, the
introduction of an alien species like Zr or Ca leads to extra forces that increase the strain in the
lattice of the nanoparticles. The effects of Ca are more significant because Ca likes to form
oxides with a relatively low content of O and the oxidation states of Ca and Ce are different (36).
In Figure 8 a qualitative correlation can be found between the amount of S deposited on the
nanoparticles, as a consequence of the dissociation of SO2 (19), and the strain parameter of the
nanoparticles. The nanoparticles that have more lattice imperfections, Ce0.66Ca0.33O2-y, are the
more active for S-O bond cleavage.
Figure 9 shows the effect of the temperature on the sulfate (SO4) signal for the CeO2 and
Ce1-xZrxO2 systems in Figure 1 (19). As the temperature is raised SO4 decomposes. In the case of
the CeO2(111) and Ce0.7Zr0.3O2(111) surfaces, the adsorbed SO4 transforms into SO2 gas. On the
other hand, in the case of the nanoparticles, most of the decomposed SO4 yields SO2 gas, but a
fraction undergoes complete decomposition depositing S on the oxide substrate. The SO4
adsorbed on the nanoparticles is somewhat more stable than that present on the (111) surfaces.
For both types of systems, the presence of Zr seems to induce an increase in the thermal stability
of the adsorbed sulfate. The Zr cations also enhance the thermal stability of SO4 species formed
on partially reduced Ce1-xZrxO2-y(111) surfaces (17).

645
Nanoparticles of Ce1-xDxO2-y (D= Sr, Sc, La, Gd, Ni, Cu) display catalytic activity for the
reduction of SO2 with carbon monoxide (SO2 + 2CO 2CO2 + S) or methane (2SO2 + CH4
CO2 + 2H2O + 2S) (55,56). High catalytic activity was observed when ceria was doped with
copper or nickel. It is well established that copper facilitates the reduction of ceria nanoparticles
by CO (57). A redox mechanism has been proposed to explain the reduction of SO2 by CO on
the Ce1-xDxO2-y nanoparticles (55)
cat-O + CO cat-[ ] + CO2 (5)
cat-[ ] + SO2 cat-O + SO (6)
cat-[ ] + SO cat-O + S (7)
First, an oxygen vancancy is created as a surface capping oxygen is removed by CO. Then, SO2
donates one of its oxygens to the vacancy to form SO. The SO is mobile on the surface until it finds
another vacancy to donate its oxygen or a vacancy may migrate to a neighboring site to accept its
oxygen. High oxygen mobility in the catalyst will facilitate the oxygen transfer from one site to
another on the surface or from the bulk to the surface. A dopant may help in this respect. However,
surface reduction by CO is still the key step to initiate the reaction (55). Under reaction conditions,
CO and SO2 compete for the surface oxygen. Reaction with CO produces an O vacancy, equation
(5), while reaction of SO2 with the surface oxygens forms sulfite or sulfate species that are strongly
bound and hinder the redox reaction.
The Cu-Ce(La)-O nanocatalysts displayed a better performance than Ce(La)-O2 or CuO
(55). Thus, a synergistic effect was observed for the Cu-dopped ceria. Copper and cerium oxide
probably play different roles in the redox mechanism (55). Cerium oxide comprises the matrix of the
catalyst and provides the oxygen and oxygen vacancy sources, while Cu cations promote the

646
reducibility of cerium oxide and provide surface sites for CO adsorption (55,57).
4. Conclusions
On bulk stoichiometric oxides, SO2 mainly reacts with the O centers to form SO3 or SO4
species that decompose at elevated temperatures. Adsorption on the metal cations occurs below
300 K and does not lead to cleavage of the S-O bonds. In bulk oxides, the occupied cation bands
are too stable for effective bonding interactions with the LUMO of SO2. The effects of quantum
confinement on the electronic properties of oxide nanoparticles and the structural defects that
usually accompany these systems in general favor the bonding and dissociation of SO2. Thus,
nanoparticles of MgO, CaO, SrO, Al2O3, Fe2O3 and CeO2 are all more efficient for sequestering
SO2 than the corresponding bulk oxides. Structural imperfections in pure or metal-doped ceria
nanoparticles accelerate the reduction of SO2 by CO by facilitating the formation and migration
of O vacancies in the oxide surface.
Acknowledgements
The author is grateful for the financial support by the US Department of Energy
(Divisions of Chemical and Materials Science) under contract DE-AC02-98CH10086.

647
REFERENCES
1. Adlkofer, J. Handbook of Heterogeneous Catalysis; Ertl, G., Knözinger, H., and J.
Weitkamp, J. (Editors), (Wiley-VCH, New York, 1997) Volume 4, p. 1776.
2. Stern, A.C., Boubel, R.W., Turner, D.B., and Fox, D.L. Fundamentals of Air Pollution,
2nd ed. (Academic Press: Orlando, FL, 1984).
3. Piéplu, A., Saur, O., Lavalley, J.-C., Legendre, O. and Nédez, C. Catal. Rev. -Sci. Eng.
40: 409, 1998.
4. Environmental Catalysis, Armor, J.N. (Editor), ACS Symposium Series No 552
(American Chemical Society: Washington DC, 1994).
5. Shelef, M., and McCabe, R.W. Catal. Today 62:35, 2000
6. Bartholomew, C.H., Agrawal, P.K., and Katzer, J.R. Adv. Catal. 31: 135, 1982.
7. Rodriguez, J.A. and Hrbek, J. Accounts of Chemical Research, 32:719, 1999.
8. Beck, D.D., Sommers, J.W., and DiMaggio, C.L. Appl. Catal. B 11:273, 1997.
9. Beck, D.D. Catalyst Deactivation 111:21, 1997.
10. Gorte, R. private communication.
11. Slack, A.V., and Holliden, G.A. Sulfur Dioxide Removal from Waste Gases, 2nd
Edition (Noyes Data Corporation: Park Ridge, NJ 1975).
12. Centi, G., Passarini, N., Perathoner, S. and Riva, A. Ind. Eng. Chem. Research,
31:1947 , 1992.
13. Waqif, M., Saur, O., Lavalley, J.C., Perathoner, S. and Centi, G. J. Phys. Chem.
95:4051, 1991.
14. Zhu, T., Kundakovic, K., Dreher, A., Flytzani-Stephanopoulos, M. Catal. Today,

648
50:381, 1999.
15. Liu, W., Wadia, C., and Flytzani-Stephanopoulos, M. Catal. Today, 28: 391, 1996.
16. Rodriguez, J.A., Jirsak, T., Freitag, A., Hanson, J.C., Larese, J.Z., and Chaturvedi,
S. Catal. Lett. 62:113, 1999.
17. Liu, G., Rodriguez, J.A., Chang, Z., Hrbek, J., Peden, C.H.F. J. Phys. Chem B,
108:2931 (2004).
18. Overbury, S.H., Mullins, D.R., Huntley, D., Kundakovic, L.J. J. Phys. Chem. B,
103:11308 (1999).
19. Rodriguez, J.A., Wang, X., Liu, G., Hanson, J.C., Hrbek, J., Peden, C.H.F.,
Iglesias-Juez, A., Fernández-García, M. J. Molec. Catal. A: Chemical, 228:11
(2005).
20. Rodriguez, J.A., Pérez, M., Jirsak, T., González, L., and Maiti, M. Surf. Sci. 477:
L279, 2001.
21. Rodriguez, J.A., Jirsak, T., Freitag, A., Larese, J.Z. and Maiti, A. J. Phys. Chem. B,
104:7439, 2000.
22. Rodriguez, J.A., Jirsak, T., Chaturvedi, S. and Kuhn, M. Surf. Sci. 442:400, 1999.
23. Rodriguez, J.A., Jirsak, T., Chaturvedi, S. and Dvorak, J. J. Molecular Catalysis A,
167:47, 2001.
24. Schneider, W.F., J. Phys. Chem. B, 108:273, 2004.
25. Waqif, M., Saad, A.M., Bensitel, M., Bachelier, J., Saur, O., and Lavalley, J.C.
J. Chem. Soc., Faraday Trans. 88:2931, 1992.
26. Rodriguez, J.A., Hanson, J.C., Chaturvedi, S., and Brito, J.L. Studies in Surf. Sci.
649
Catal. 130:2795, 2000.
27. Warburton, D.R., Pundie, D., Muryn, C.A., Prahakaran, K., Wincott, P.L., and
Thorton, G. Surf. Sci. 269/270:305, 1992.
28. Muryn, C., Purdie, D., Hardman, P., Johnson, A.L., Prakash, N.S., Raiker, G.N.,
Thorton, G., and Law, D. Faraday Discuss. Chem. Soc. 89:77, 1990.
29. Kurtz, R.L., and Henrich, V.E. Phys. Rev. B 36:3413, 1987.
30. Zhang, Z., and Henrich, V.E. Surf. Sci. 225:47, 1990.
31. Li, X., and Henrich, V.E. Phys. Rev. B, 48:17486, 1993.
32. Rodríguez, J.A., Liu, G., Jirsak, T., Hrbek, J., Chang, Z., Dvorak, J., Maiti, A.
J. Am. Chem. Soc. 124:5242, 2002.
33. Rodriguez, J.A., Jirsak, T. and Hrbek, J. J. Phys. Chem. B, 103:1966, 1999.
34. Rodriguez, J.A., Chaturvedi, S., Kuhn, M. and Hrbek, J. J. Phys. Chem. B, 102:5511,
1998.
35. Tschope, A., Liu, W., Flytzani-Stephanopoulos, M. and Ying, J.Y. J. Catal. 157:42,
1995.
36. Rodríguez, J.A., Wang, X., Hanson, J.C., Liu, G., Iglesias-Juez, A., Fernández-García,
M., J. Chem. Phys. 119:5659, 2003.
37. Wang, X., Hanson, J.C., Liu, G. Rodriguez, J.A., Iglesias-Juez, A., Fernández-García, M.,
J. Chem. Phys. 121:5434, 2004.
38. de Carolis, S., Pascual, J.L., Petterson, L.G.M., Baudin, M., Wojcik, M.,
Hermansson, K., Palmqvist, A.E.C. and Muhammed, M. J. Phys. Chem. B, 103:7627,
1999.

650
39. Fernández-García, M., Martínez-Arias, A., Hanson, J.C., Rodríguez, J.A. Chem. Rev.
104:4063, 2004.
40. Klabunde, K.J., Stark, J., Koper, O., Mobs, C., Park, D.G., Decker, S., Jiang, Y.,
Lagadic, I., Zhang, D. J. Phys. Chem. 100: 12142, 1996.
41. Tasker, P.W. Adv. in Ceramics, 10:176, 1984.
42. Moodie, A.F., Warble, C.E. J. Crystal Growth, 10:26, 1971. 43. Mackrodt, W.C., Tasker, P.W. Chem. Britain, 21:13, 1985. 44. DeSantis, E., Ferrari, J. private communication. 45. Pacchioni, G., Pescarmona, P. Surf. Sci. 412/413: 657, 1998. 46. Pacchioni, G., Clotet, A., Ricart, J.M. Surf. Sci. 315:337, 1994. 47. Rodriguez, J.A. Catal. Today, 85: 177, 2003. 48. Rodriguez, J.A., Jirsak, T., Pérez, M., Chaturvedi, S., Kuhn, M., González, L., Maiti, A.
J. Am. Chem. Soc. 122:12362, 2000.
49. Lucas, E., Decker, S., Khaleel, A., Seitz, A., Futlz, S., Ponce, A., Li, W., Carnes, C.,
Klabunde, K.J. Chem. Eur. J. 7: 2505, 2001.
50. Decker, S., Klabunde, K.J., J. Am. Chem. Soc. 118:12465, 1996. 51. Pacchioni, G., Ricart, J.M., Illas, F. J. Am. Chem. Soc. 116: 10152, 1994. 52. Moscovici, J., Michalowicz, A., Decker, S., Lagadic, I., Latreche, K., Klabunde,
K. J. Synchrotron Rad. 6:604, 1999.
53. Carnes, C.L., Kapoor, P.N., Klabunde, K.J. Chem. Mater. 14:2922, 2002.
54. Decker, S.P., Klabunde, J.S., Khaleel, A., Klabunde, K.J. Environ. Sci. Technol.
36:762, 2002.

651
55. Liu, W., Wadia, C., Flytzani-Stephanopoulos, M. Catal. Today 28:391, 1996.
56. Flytzani-Stephanopoulos, M., Zhu, T., Li, Y. Catal. Today 62:145, 2000.
57. Wang, X., Rodriguez, J.A., Hanson, J.C., Gamarra, D., Martínez-Arias, A., Fernández-
García, M. J. Phys. Chem. B, 110:428, 2006.

652
Table 1 : Breakthrough Numbers an Reaction Efficiencies for the Trapping of SO2 by CaO and Fe2O3/CaO nanoparticles.a
Sample Breakthrough Reaction efficiencies number (mol of SO2/mol of CaO)b
MP-CaOc 11 0.36 Fe2O3/MP-CaO 23 0.55 SP-CaOd 19 0.51 Fe2O3/SP-CaO 44 0.94
a From ref (48) b Theoretical maximum would be 1.0 c MP= 14.6 nm in size d SP= 7.3 nm in size
653
Figure Captions
Fig 1 S K-edge spectra taken after dosing SO2 to CeO2(111) and Ce0.7Zr0.3O2(111) surfaces,
and nanoparticles of CeO2, Ce0.66O0.33O2 and Ce0.66Ca0.33O2-y. The samples were
exposed to 0.1 Torr of SO2, for 5 min at 25 oC (from ref. 19).
Fig 2 Top and side views of an oxygen-terminated Ce1-xZrxO2(111) surface (x < 0.4). The large
spheres represent O atoms, and the small spheres correspond to Ce or Zr atoms
in a solid solution.
Fig 3 S 2p photoemission spectra for the adsorption of SO2 on a MgO(100) single
crystal and a MgO(100) epitaxial film grown on a Mo(100) substrate (from ref. (20)).
Fig 4 Energy position for the valence and conduction bands of bulk MgO.
Empty states are shown as doted lines, while solid lines denote occupied states.
For comparison, we also include the molecular orbital energies of SO2, and the
type of energy shift that can occur for the states of a nanoparticle. Such a shift
facilitates interactions with the LUMO of SO2. The zero of energy is the vacuum
level (from refs. (33,34).
Fig 5 Right-side: Valence photoemission spectra for a series of ceria systems. Left-
side: S 2p spectra taken after dosing 5 langmuir of SO2 at 300 K to the ceria
surfaces (from ref. (19)).
Fig 6 Valence photoemission spectra for pure and doped magnesium oxide
(from refs. 39,48).
Fig 7 Infrared spectra collected after exposing nanoparticles of Al2O3 and Al2O3/MgO to
20 Torr of SO2 at room temperature followed by a two 2 hour evacuation. “NC” and

654
“CM” refer to nanocrystalline and commercial, respectively (from ref. (53)).
Fig 8 Top panel: Lattice strain for CeO2, Ce0.66Zr0.33O2 and Ce0.66Ca0.33O2-y nanoparticles
(36,37). Bottom panel: Amount of atomic sulfur deposited on CeO2, Ce0.66Zr0.33O2 and
Ce0.66Ca0.33O2-y nanoparticles as a consequence of the dissociation of SO2. The
The samples were exposed to 0.1 Torr of SO2, for 5 min at 25 oC. Then, the gas was
evacuated and S K-edge spectra were collected (from ref. 19).
Fig 9 Effect of temperature on the XANES signal for the SO4 formed on the CeO2 and
Ce1-xZrxO2 systems of Figure 1. The top panel shows the results for the (111)
surfaces, while the bottom panel contains the corresponding results for the
nanoparticles (from ref 19).

Photon Energy (eV)2470 2480 2490
Nor
mal
ized
fluo
resc
ence
yie
ld (a
rb u
nits
)
S K-edge XANESSO2 adsorption
25 oC
CeO2 7nm
CeO2(111)
SO4
SO3
Ce0.7Zr0.3O2(111)
Ce0.66Ca0.33O2-y 4nm
Ce0.66Zr0.33O2 4nm
S
Fig. 1

Ce,ZrO
Top view
Side view
Fig. 2

Binding Energy (eV)160162164166168170172
PE
Int
ensi
ty (
arb
units
)
S 2p SO2/MgO(100) 300 K, on film
0.25 L
1.0 L
2.0 L
5.0 L
SO4
SO3
Binding Energy (eV)162164166168170172
PE
Int
ensi
ty (
arb
units
)
SO4
SO3
S 2p300 K, crystal
SO2/MgO(100)
1.0 L
0.25 L
Fig. 3

Fig. 4
Ener
gy (e
V)
-15
-14
-13
-12
-11
-10
-9
-8
-7
-6
-5
-4
-3
-2
-1
0
1
8a1(HOMO)
O 2p
+
Mg 3s
1a25b1
3b1 (LUMO)
Mg 3s,3p+ O 2p
bulk MgO SO2
Nano
Nano

Binding Energy (eV)160162164166168170172
PE
Int
ensi
ty (
arb
units
)
SO2 Adsorption300 K, 5 L
S 2p
~CeO2
CeO2-x
Ce2O3+x
SO4
SO4SO3
SO3
SSO2
Binding Energy (eV)02468101214
Inte
nsity
(arb
. uni
ts)
Valence region
~ CeO2
CeO2-x
Ce2O3+x
Ce3+
Fig. 5
Binding Energy (eV)024681012
Inte
nsity
(ar
b un
its)
Valence region
Zn
Ni
Fe
Cr
MgO
Zn0.06Mg0.94O
Ni0.06Mg0.94O
Fe0.07Mg0.93O
Cr0.07Mg0.93O
Fig. 6
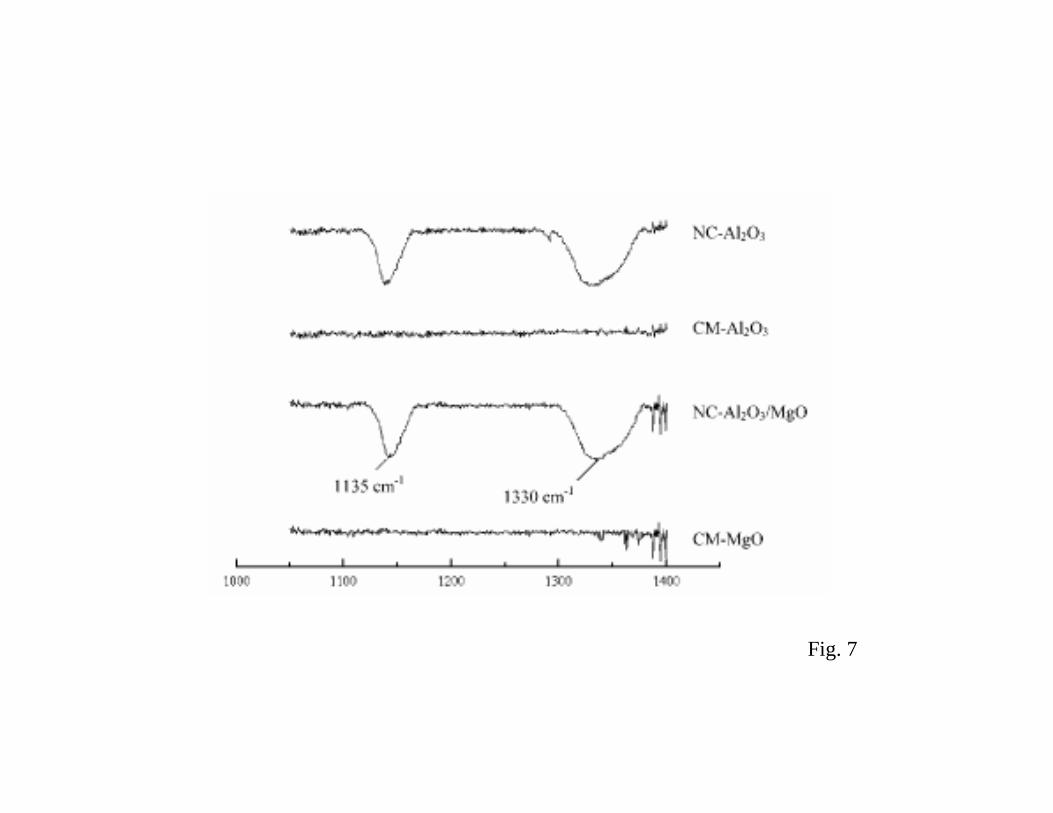
Fig. 7

Stra
in (a
rb. u
nits
)
0.0
0.5
1.0
1.5
2.0
2.5
Sulfu
r S K
-edg
e si
gnal
(arb
. uni
ts)
0.0
0.5
1.0
1.5
2.0
2.5
3.0
CeO2 Ce0.66Zr0.33O2 Ce0.66Ca0.33O2
Fig. 8

Temperature (oC)
0 100 200 300 400 500 600
XAN
ES S
O4 s
igna
l (ar
b un
its)
0.0
0.2
0.4
0.6
0.8
1.0
1.2
(111) surfaces
Ce0.7Zr0.3O2
CeO2
Temperature (oC)
0 100 200 300 400 500 600
XAN
ES S
O4 s
igna
l (ar
b un
its)
0.0
0.2
0.4
0.6
0.8
1.0
1.2nanoparticles
Ce0.66Zr0.33O2
CeO2
Fig. 9