chemistry - core · exclution chromatography with conductivity ... sub-ppb and ppt levels using...
TRANSCRIPT
Chemistry
Analytical Chemistry fields
Okayama University Year 2004
Slope comparison method (SCM) for the
determination of trace amounts of silicate
in ultrapurified water
Akhmad Sabarudin∗ Mitsuko Oshima†
Shoji Motomizu‡
∗Department of Chemistry, Faculty of Science, Okayama University†Department of Chemistry, Faculty of Science, Okayama University, [email protected]
u.ac.jp‡Department of Chemistry, Faculty of Science, Okayama University,
This paper is posted at eScholarship@OUDIR : Okayama University Digital InformationRepository.
http://escholarship.lib.okayama-u.ac.jp/analytical chemistry/31

SLOPE COMPARISON METHOD (SCM) FOR THE DETERMINATION OF TRACE
AMOUNTS OF SILICATE IN ULTRAPURIFIED WATER
Akhmad Sabarudin, Mitsuko Oshima* and Shoji Motomizu
Department of Chemistry, Faculty of Science, Okayama University, Tsushimanaka,
Okayama City 700-8530, Japan.
* Correspondence author :
E-mail : [email protected] (Mitsuko Oshima)
Tlp/Fax : (81) 86-251-7847

ABSTRACT
A sensitive analytical method for the determination of trace amounts of silicate in
ultrapurified water was developed. The method is based on the formation of an ion
associate of molybdosilicate with Malachite Green (MG) and the collection of the ion
associate on a tiny membrane filter (diameter : 5 mm, and effective filtering diameter :
1 mm). The ion associate formed on the membrane filter is dissolved together with the
membrane filter in 1 ml of methyl cellosolve (MC) and the absorbance of MC solution
is measured at 627 nm by a flow injection-spectrophotometric detection technique. In
this method, silicate in the original sample (ultrapurified water) is concentrated as the
ion associate into a small volume of MC to get high sensitivity. As sample
concentration takes place, the small amounts of silicate contained in the reagents
used also become concentrated as the ion associate into MC. The original sample
volumes are varied and evaporated to an identical volume. Therefore, the reagent
added is fixed to the same volume. The absorbance increase linearly with increase in
the original sample volume will be due only to silicate in the original samples
(ultrapurified water). The resulting slopes obtained by varying the sample volumes are
compared with the slope of the calibration graph, and thus named the slope
comparison method (SCM). The SCM facilitates a more sensitive and accurate
evaluation of silicate concentration in the samples than either common calibration
method (CCM) or standard addition method (SAM) because it compensates for the
influence of trace amounts of silicate contained in chemicals, reagent solution and
solvent used. The calibration graph was constructed from 0 to 0.25 ng ml-1 of Si and
the detection limit was 10 pg ml-1 (ppt) when 30 ml of samples was used. The
standard deviation and relative standard deviation from six measurements of the
reagent blanks were 0.0012 and 3.5%, respectively.

Keyword: Slope comparison method, ultrapurified water, ion associate,
molybdosilicate, malachite green, membrane filter.
Introduction
In various advanced fields, such as material science, environmental science and
bioscience, the improvement of sensitivity, precision and accuracy in chemical
analysis methods is one of the most important areas in their advancements. The use
of ultrapurified water is of crucial importance for cleaning and etching semiconductors
in microelectronic industries [1]. The world market for ultrapurified water (UPW) is
estimated at around US$ 2.3 billion per year [2] and is expected to grow to US$ 2.6
billion by 2006 [3]. In the semiconductor industry, a large bulk of UPW is required in
the manufacture of high-quality semiconductors [4], thereby creating a growing
demand for sensitive and accurate determination of trace and ultratrace amounts of
impurities, such as boron, phosphate and silicate [5-7]. The desired impurity level for
Si in semiconductor grade UPW is less than 1 ng ml-1 and expected to be further
lowered in the near future. Therefore, a highly sensitive analytical method for
controlling Si levels in ultrapure water, with the capability of determining 0.1 ng ml-1 Si
is required [8].
Chu and Balazs [9] developed and evaluated three different analytical methods
for the determination of silicate in UPW. These methods were based on ICP-AES,
ICP-MS, and spectrophotometry coupled with cold acid digestion. The detection limits
obtained for the ICP-AES and ICP-MS were 3 ng ml-1and 1 ng ml-1, respectively, after
ten-fold enrichments of the sample by evaporation. Samples for spectrophotometry
were concentrated at least 20-fold by evaporation before analysis; the detection limit
of the spectrophotometric method was found to be 0.25 ng ml-1. The flow analysis for
the determination of silicate in highly purified water by gel-phase spectrophotometry

has also been reported [10]; the method was based on the adsorption of the ion
associate of molybdosilicate with Malachite Green (MG) on the Sephadex LH-20 gel.
A sensitive analytical result for Si was obtained with detection limit of 0.1 ng l-1. Ion
exclution chromatography with conductivity detection [11] for the determination of
silicate was also reported. Alhough the detection limit was about 36 ng ml-1, it is not
sufficiently sensitive to be applied for UPW analysis because silicate in an eluent was
retained and eluted, and sometime big system peaks and silicate peak appeared at
the same retention time.
The formation of an ion associate between molybdosilicate and cationic dyes has
been successfully used to increase detection sensitivity for the determination of
silicate [12-16]. Motomizu et.al. [17-18] have reported a highly sensitive
spectrophotometric method for the determination of silicate as well as phosphate at
sub-ppb and ppt levels using relatively small volumes of sample solutions, an organic
solvent (methyl cellosolve : MC) for dissolution of the ion associates, and a tiny
membrane filter for collecting the ion associate of molybdosilicate with Malachite
Green. The absorbance was measured by a flow injection-spectrophotometric
detection method, which is relatively simple and shows excellent sensitivity and LOD.
However, trace- and ultra-trace amounts of silicate in ultrapurified waters cannot be
determined because “ the standard certified ultrapurified water “, “the silicate-free
water “ or “the purified water containing negligibly small amount of silicate compared
with the samples” are not currently available.
In this paper, a highly sensitive method for the determination of ultratrace
amounts of silicate in ultrapurified water is proposed. It involves improving the
previous method [17-18] and coupling the improved method with an evaporation of
ultrapurified water under flowing clean air and/or nitrogen gas. Since the calibration
strategy undertaken affects the precision and accuracy of analytical results, we

applied the slope comparison method (SCM) [19] to silicate determination in the
present study; the method was originally developed to determine trace emounts of
phosphate in ultrapurified water and has enable evaluation of silicate concentration in
ultrapurified water with higher sensitivity and accuracy than the conventional common
calibration method (CCM) and standard addition method (SAM). In the SCM, the
influence of trace amount of silicate arising from chemicals, reagent solutions and the
solvent added to samples can be fully compensated.
Experimental
Reagents
Ultrapurified water was prepared by an ELIX 3 / Milli Q Element System (Nihon
Millipore, Tokyo), and was used as a sample solution, and reagent solution
preparations. Ammonium heptamolybdate tetrahydrate purchased from Wako Pure
Chemicals (Osaka) was used to prapare a 0.52 mol l-1 of molybdate solution. A stock
solution of Si (1000 mol l-1) was a commercially available standard for AAS (Wako
Pure Chemicals, Osaka), and working solutions were prepared by accurate dilution of
the stock solution with the ultrapurified water. A concentrated sulfuric acid was
purchased from Kanto Chemical Co. Ltd (Tokyo) for preparation of a 1.7 mol l-1 sulfuric
acid solution. Malachite Green oxalate (Tokyo Kasei Kogyo, Tokyo) was used to
prepare a 3.4 x 10⁻⁴ mol l-1 Malachite Green solution in a 6.1 mol l-1 sulfuric acid. After
standing this solution for 12 h, it was filtered through a cellulose nitrate membrane
filter (pore size 0.45 μm ; diameter 25 mm) under suction to remove trace amounts of
silicate, which may be present as a contaminant in the chemicals used.
Apparatus
The filtration-preconcentration apparatus used in the present work is assembled with

a plastic syringe, a three-way valve, a filtering housing, an upper and lower filtering
supporter as shown in Fig. 1. All parts of the filtering apparatus were made of
plastics. The present apparatus was different from that used in the previous work [15]
by some modifications: the effective filtering diameter was reduced from 2 mm to 1
mm. Furthermore, a lower filtering supporter was changed from a simple pinhole type
to a pinhole with several radial grooves, which accelerated the flowing of filtrate and
resulted in better filtration efficiency. The filtration was carried out by suction with an
aspirator. A membrane filter with a diameter of 5 mm and an effective filtering
diameter of 1 mm, prepared by punching a commercially available cellulose nitrate
membrane (45 mm diameter; Advantec Toyo, Tokyo) with a steel punch (5 mm
diameter), was placed on the filtration apparatus. The diameter of membrane filter
was much smaller than those used in common filtration methods, resulting in more
effective enrichment and a lower reagent blank.
A simple flow injection system used in this work was the same as that used in the
previous work [15]. A double-plunger micropump (DMX-2000, Sanuki Kogyo) was
used for propelling a carrier of MC at a flow rate of 0.5 ml min-1. A six-way valve
(SVM-6M2, Sanuki Kogyo) connected with PTFE tubing (0.5 mm i.d.) was used for
injecting samples of 200 μl. The absorbances at 627 nm were measured with a Soma
Kogaku S-3250 spectrophotometer equipped with an 8-μl flow cell (optical path length,
10 mm) and recorded with a Ross Model 201/B-1278 recorder (Topac, Massachusetts,
USA)
PTFE beakers (100 ml) were used as evaporating vessels for ultrapurified water
samples.
Sample Preparation
Aliquots, 15-60 ml of ultrapurified water samples, were transferred into the

PTFE beakers, placed in an evaporation chamber (Sanai Kagaku, Nagoya). Then the
samples were evaporated to 5 ml or to near dryness. While the evaporation was
taking place, nitrogen gas or clean air was continuously delivered into the chamber.
The evaporation chamber used in this work was almost a closed system, with only 2
small holes for flowing air and/or nitrogen in and out as shown in our previous work
[19]. By using this system, the contamination from the experimental atmosphere can
be avoided almost completely. After the evaporation, the samples were quantitatively
transferred to the filtration apparatus. The PTFE beakers used were washed with 5 ml
of 0.003 mol l-1 H2SO4 and transferred into the filtration apparatus. Finally, the
solutions were diluted to 10 ml, prior to treatment by the procedure described in the
next section. Polymethyl pentene (PMP) beakers were also tested as evaporating
vessesl. However, the beakers were found to adsorb some silicate in water samples
and were not used any further for the present purpose.
Experimental Procedure
Water samples,15-30 ml, containing 0-0.25 ng ml-1 Si were transferred into the
filtration apparatus. A 0.25 ml of 1.7 mol l-1 H2SO4 and 0.52 mol l-1 Mo solution per 15
ml of the sample volume were then added to each sample. The mixed solutions were
allowed to stand for 25 min to allow a complete formation of the molybdosilicate, after
which, 1 ml of 3.4 x 10⁻⁴ mol l-1 MG solution per 15 ml of the water samples was added
to the each solution. The solutions were thereafter allowed to stand for 30 min to allow
a complete formation of the ion associate, and then filtered through the membrane
filter under suction. The ion associates collected on the membrane together with the
membrane filter itself were dissolved in 1 ml of methyl cellosolve (MC). The filtrates
obtained from the first filtration were re-filtered in the manner previously explained and
the ion associates were dissolved in the MC. Then, the absorbance of the MC

solutions was measured at 627 nm by flow injection technique. Re-filtering procedure
for the filtrate was aimed at ascertaining a cause of the absorbance as well as amount
of the reagent blank. In this method, the cause of reagent blank is the ion associate
formed between MG with sulfate and isopolymolybdate as well as silicate present in
the reagent solution and the solvent used.
Result and Discussion
Contamination of water, reagents and vessel with silicate
Although the highest-quality chemicals currently available were used in the
present study, it was very difficult or practically impossible to obtain the reagent blank
completely free from the silicate contamination, which may have originated from the
reagents used, as well as the solvent (ultrapurified water) and vessels. All chemicals
and reagents were dissolved in the ultrapurified water prepared by ELIX 3/Milli Q
Element System, which was also used as a sample solution. The contamination of
PTFE beakers with silicate, which were used as a vessel for evaporating samples,
was controlled to negligible levels by soaking the beakers in 1 mol l-1 nitric acid for 24
h, and washing them with the ultrapurified water. In order to reduce a contamination of
the reagents and the solvent with silicate, the Malachite Green solution in sulfuric acid
was prepared and treated as described in the reagent section. In this case, the mixed
reagent solution was filtered with cellulose nitrate membrane after standing for 12 h;
the filtrate was used for further experiments. By this scheme of treatments, the
absorbance of the reagent blank could be minimized to about 0.034 A.U. The reagent
blank values may be attributed to the ion associate of such anions as
isopolymolybdate and sulfate, as well as molybdosilicate with Malachite Green. In
addition to the complexity of the reagent blank, the reason why a conventional
calibration graph method and a standard addition method can not be applied to the

direct determination of silicate in ultrapurified water samples, is that the certified
standard silicate solution for ultrapurified waters or the silicate-free water is not
currently available anywhere in the world.
Due to the fore mentioned reasons, a procedure for enriching silicate in water
samples without the addition of any chemicals is imperative. For such reasons, it is
necessary to concentrate the ultrapurified water samples by factor of at least two folds.
By coupling the “classical concentration method by evaporation without any chemicals
under the conditions of non-contamination”, a slope comparison method (SCM) was
developed. By using the SCM proposed in this study, the influence of the silicate
present in the chemicals, the reagent solutions, and the solvent can be neglected, and
the reagent blank can be compensated.
Principle of SCM for the determination of silicate in ultrapurified water
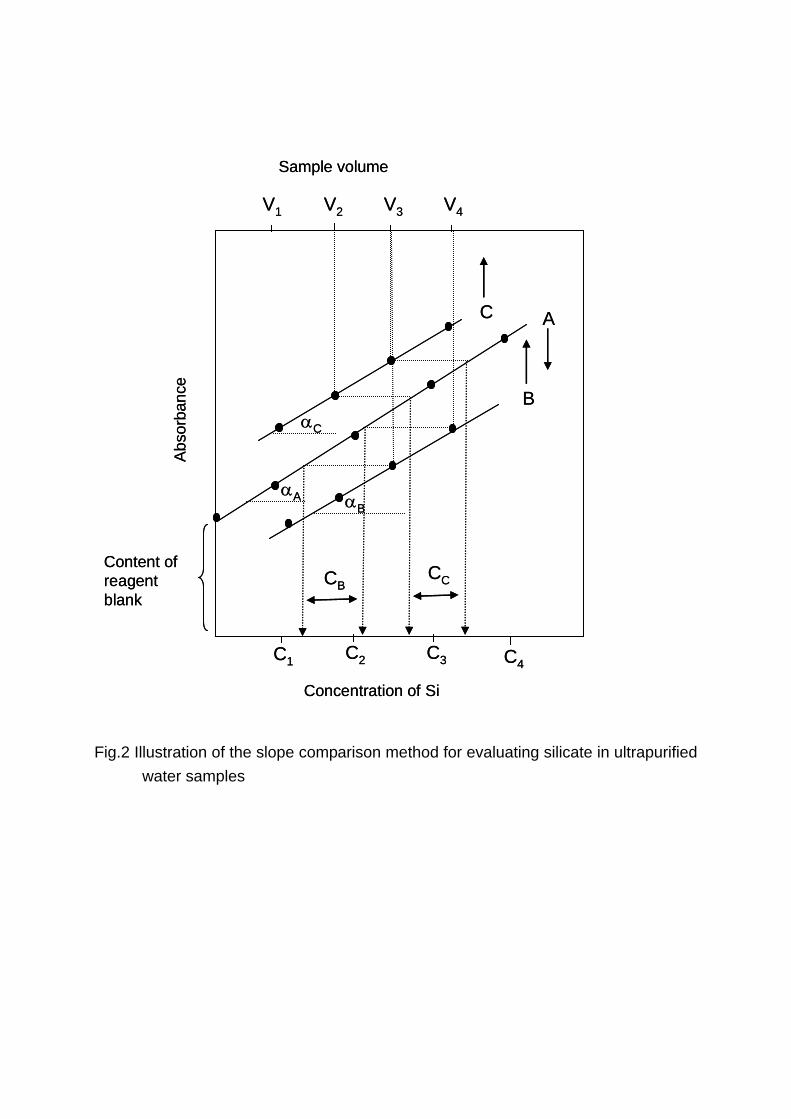
The principle of the SCM is illustrated in Fig.2. In this method, the ion associate
formed from both the silicate in the original sample (ultrapurified water) and the
silicate contained in the reagents used are concentrated into a small volume to get
sufficient sensitivity. In the SCM, the original sample volumes are varied, while the
reagent added is fixed to the constant volume. Under this condition, the increase in
absorbance with the increase in original sample volumes will only be due to the
amounts of silicate in ultrapurified water samples. The resulting slope obtained by
varying the sample volume is compared with the slope of the calibration graph, and
hence, named as the slope comparison method (SCM).
Detailed explanation of SCM is as follows: a series of the volumes of ultrapurified
water samples such as V1, V2, V3, and V4 (the number 1, 2, 3, and 4 show the increase
in sample volume in this order) are evaporated/concentrated to the identical final
volume, so that the reagents added to each sample volume are of the same amounts.

It is therefore assumed that the contamination level from the reagents is identical with
one another. If the contamination level from reagents is denoted by constant
concentration, C0, the corresponding concentrations of silicate detected in increasing
sample volume become C1+C0, C2+C0, C3+C0 and C4+C0, where C1, C2, C3 and C4
are concentrations of silicate corresponding to V1, V2, V3, and V4. A plot of absorbance
against volume yields a linear graph (see B, C in Fig.2). Let αB and αC be the
calculated slope of the line B and the line C, respectively. These slopes show
Δabsorbance per unit volume. From the calibration graph (A), the slope of αA, which
shows Δabsorbance per unit concentration, is obtained. By comparing the slope of the
calibration graph with the slope of the samples, the accurate amount of silicate as
silicon (CB and CC, mass per unit volume) in the samples can be obtained and the
effect of C0 (content of the reagent blank) can be compensated. More detail of the
principle of SCM is explained in the latest section
In our previous work [19] for the determination of ultratrace amounts of phosphorus
in ultrapurified water based on the formation of the ion associate of Malachite Green
with molybdophosphate, it was found that the reagent blank can deviate to samples
and the reagent used, and trace amounts of phosphate still remained in the mixed
reagent solution. It implies that in the determination of ultratrace and trace amounts of
phosphate as well as silicate, conventional calibration method (CCM, the absorbance
of sample is directly plotted against the concentration of analyte) and standard
addition method (SAM) can not be applied because some parts of actual amount of
silicate present in the original sample will be taken into account together with the blank
value as well as trace contamination of silicate containing in the reagents and solvent
used. More difficulties will be encountered if the concentration of silicate present in the
original sample is much lower than silicate present in the chemicals and the reagent
solutions used. Under such conditions, a prerequisite for the SAM is the elimination of

interference effects in the samples. However, it is much more difficult to eliminate than
to compensate for such effects. To overcome these difficulties, SCM can be applied.
The method incorporates two important intrinsic features, viz.; (1) the slope obtained
by varying the sample volumes is only due to the silicate in the original samples and
(2) the slope of the calibration graph is only attributed to the silicate added in the
standard solution. Thus, by comparing these slopes, the influence of the trace
amounts of silicate present in the chemicals, the reagent solutions, the solvent can be
compensated. Consequently, SCM enables the evaluation of concentration of silicate
in ultrapurified water samples more sensitively and accurately than either the
conventional calibration method (CCM) or the standard addition method (SAM). From
the foregoing reasons, SCM is more reliable in terms of accuracy and sensitivity than
the conventional SAM and CCM, especially when the method is applied to trace-and
ultratrace analysis.
Reaction conditions for the formation of ion associates
Similar optimum conditions as those used in the previous work [17] were
adopted in the present work for the concentration of MG, molybdate and sulfuric acid,
except for the acidic medium and the standing time for the formation of
molybdosilicate and ion associate.
Optimum conditions for the standing times were examined; the results are
shown in Fig. 3. The formation of molybdosilicate was studied by varying the standing
time from 5 to 40 min at room temperature. The absorbance of the reagent blank
tended to be constant after 20 min, which indicates that the heteropolyacid of
molybdosilicate exists as stable species and the formation reaction is completed. The
color development of the ion associate formed between molybdosilicate and MG was
examined in a similar manner as the formation of molybdosilicate. The absorbance of

the reagent blank decreased during the standing time of 5-20 min, and tended to a
constant value during the standing time of 20-40 min. The molybdosilicic acid
(H4SiMoO12O40) reacts stepwise with MG to form the final product of 1:4 ion
associates, where the proton of molybdosilicic acid can be replaced stepwise with MG.
During the first 20 min, some MG do not react with molybdosilicate, as they exist as
an ion associate with molybdate, which results in a higher absorbance of the reagent
blank. According to the acid-base equilibrium of MG as described in Fig. 4, MG can be
present as its main and protonated species [20]. The species represented as II is a
reactive species, which can reacts with molybdate as well as molybdosilicate to form
ion associates. The protonation and deprotonation reactions of species II is very fast,
while the hydration and dehydration reactions between the species II and III are very
slow. Such kinetics influences the rate of the ion associate formation, which is
apparently faster when species II predominates. In order to maintain low absorbance
of reagent blank, 25 min and 30 min were selected as the optimum conditions for the
formation of molybdosilicate and ion associate molybdosilicate with MG, respectively.
Effect of sample volume was examined by varying the volume from 15 to 60 ml
with various treatments, such as non-evaporation, evaporation to 5 ml and
evaporation to dryness. In this work, sulfuric acid and hydrochloric acid were
examined as acidic medium for the formation of molybdosilicate. The absorbances
increased with increasing sample volume for non-evaporation and non-dryness
evaporation method, which indicates the ion associate can be collected
completely/quantitatively on the tiny membrane filter. However, in case of the dryness
evaporation method, the absorbances tend to constant, which is caused by
undissolved silicate remaining at the bottom of vessel after the dissolution with 0.003
mol l-1 H2SO4. The absorbance of the reagent blank prepared by using hydrochloric
acid as an acidic medium were higher than those obtained by sulfuric acid as an

acidic medium, indicative of large amounts of silicate in hydrochloric acid. The
absorbances obtained by re-filtering of the filtrate (sulfuric acid as an acidic medium)
increased slightly with increase in sample volumes, and became a constant when
hydrochloric acid used as acidic medium as shown in Fig.5.
Influence of sulfate and chloride ions on the absorbance of reagent blank were
studied by varying their concentration from 0 to 0.6 mol l-1 in the absence of
molybdate in order to further clarify the above phenomena. The results showed that
the absorbances of reagent blank increased linearly with increasing concentration of
both chloride and sulfate ion which indicated that sulfate and chloride ions can form
ion associates with MG. It should be noted that sulfate ion resulted in higher blank
than chloride ion as shown in Fig. 6. Based on the result obtained by investigating the
effect of chloride, sulfate, and heteropolyacid on the absorbance of reagent blanks, it
was concluded that the absorbance of the reagent blank was not only caused by the
ion associates of the heteropolyacids of isopolymolybdate with MG, but also by the ion
associate between sulfate as well as chloride with MG. Furthermore, the adsorptivity
of the ion associate with MG is thought to follow the order: Cl- < isopolymolybdate <
SO4- < molybdosilicate.
Effect of the evaporation of sample solutions on the determination of silicate
Generally, silicates in water are present in various monomeric and polymeric
forms. However, most of the silicates at the concentration of sub-ppb levels seem to
be in the monomeric form. In the reaction with molybdate in acidic mediums, only
monomeric silicate (orthosilicate) can be determined. In this work, ultrapurified water
samples were pretreated by evaporation of original samples to non-dryness and
dryness. As shown in Table 1, the concentrations of silicate obtained by non-dryness
evaporation method were twice higher than those obtained by non-evaporation

method. These results indicate that unreactive silicate (polymeric species) can be
converted to the reactive silicate (monomeric species), which can easily reacts with
molybdate to form molybdosilicate. Results from evaporation to 3 and 5 ml are in good
agreement showing that this enrichment technique is useful for good accuracy and
reproducibility, while in the case of evaporation to dryness, silicate present at the
bottom of PTFE beaker was difficult to be completely dissolve in diluted sulfuric acid.
In addition to the advantage of the conversion of unreactive silicate to the
reactive silicate, the evaporation without addition of any chemicals was selected as
concentration method for ultrapurified water samples, because a standard reference
material of ultrapure water, which bears a certified value of silicate is not currently
available. Furthermore, at the present, obtaining chemicals, reagents, and solvents,
which are completely free from silicate is not possible. Therefore, attaining
several-folds enrichment of silicate in ultrapurified water samples without addition of
any reagent is required. This explains why the evaporation/concentration method is
necessary for the present purpose.
Effect of phosphate and arsenate on silicate determination
In addition to the reaction with silicate, molybdate is also capable of reacting with
phosphate (orthophosphate) and arsenate to form heteropolyacids. In the proposed
procedure, the effect of phosphorus existing as phosphate was examined by varying
its concentration from 0 to 0.3 ng ml-1. The results showed that positive error of 3.22 %
was found when the concentration of phosphorus was 0.124 ng ml-1. Since the
concentrations of phosphorus in ultrapurified water are in the range of 0.06-0.07 ng
ml-1 [19], the interference from phosphate can be regarded as negligible.
The effect of arsenate was similarly examined. Various concentrations of arsenate
from 0 to 1.67 ng ml-1 were added to the ultrapurified water samples to ascertain its

effect on the silicate determination. The results showed that no interference from
arsenate up to 1.33 ng ml-1, but a positive error of 6.45% was found when
concentration of arsenate was 1.67 ng ml-1. However, the effect of arsenic can be
ignored because the concentrations of arsenate in ultrapure water are lower than 0.01
ng ml-1 [7].
Calibration graph, detection limit and precision
The calibration graph as given in Fig. 7 showed a good linearity for the range of
0-0.25 ng ml-1 of standard Si solutions with the linear equation, Y = 0.2409X + 0.0338,
where Y is the absorbance of the ion associates of molybdosilicate with MG and X is
the concentration of Si (ng ml-1); the correlation coefficient was 0.998. The standard
deviation (absorbance unit) and relative standard deviation from six measurements of
the reagent blank were 0.0012 and 3.5%, respectively. The detection limit calculated
from three times of the standard deviations of the reagent blank was 10 pg ml-1 (ppt)
when 30 ml sample was used. To our best knowledge, the detection limit obtained in
the present procedure is the best of all the spectrophotometric methods reported so
far.
The absorbances obtained by the second filtration of the filtrate from the first
filtration were almost identical, which means that almost all of the silicates contained
in the standard solutions are retained on the tiny membrane filter by the first filtration.
By using the straight line and the second filtration line of the reagent blank, it can be
assumed that the total amount of the reactive (monomeric) silicate contained in water
used for the preparation of the standard solutions, the reagent solution (molybdate
solution), and acid (H2SO4) added to standard solutions to be about 0.055 ng ml-1 (55
ppt).

Determination of silicate in ultrapurified water by the slope comparison method
(SCM)
The proposed method (SCM) was applied to the determination of silicon existing as
silicate in ultrapurified water samples prepared by ELIX 3/Milli Q element and Milli
Q-Labo as shown in Fig. 8, and the results obtained were summarized in Table 1. As
given in Fig.8, straight line of A is the calibration graph, which is constructed using
standard solution of silicate in the range concentration of 0.0, 0.05, 0.10, 0.15, 0.20,
0.25, 0.30 ng ml-1. The volume of solution used for calibration curve is 40 ml.
Therefore, the mass of silicate (as silicon) are 0, 1.5, 3.0, 4.5, 6.0, 7.5 ng. The mass of
silicon is then used as the axis for calculation of silicate in the original samples. From
the straight line of samples (eg. solid line B), dotted lines from two points of
absorbance (from two different volumes; 20 and 30 ml) were extended to meet the
calibration line (solid line A), then, further extrapolated to the axis representing the
mass of silicate. The concentration of silicate in the sample obtained by difference of
mass is found to be 3.177 ng Si in 10 ml. In other word, the concentration of Si is
3.177 ng/10 ml = 0.32 ng ml-1.
Two data points of absorbance (from two different volumes) as shown in Fig.8 are
required to correct the calculation of silicate in the samples. As seen in Fig.7
(calibration graph), the phenomenon of reagent blank will affect the calculation of
original concentration of the samples, especially if the conventional calibration graph
(CCM, the absorbance of sample is directly plotted against the concentration of
analyte) or standard addition methods (SAM) were used. From the first filtration (Fig.
7), the absorbances increase with the increase in silicate concentration. The lowest
absorbance value, in the absence of silicate (0 ppb), was 0.034. The second filtration
gave the absorbance of about 0.022, showing that a difference in absorbance
between first filtration and second filtration exists (0.034-0.022 = 0.012). If such a

difference was non existent, then CCM and SAM can be applied. Based on the
experiments as shown in Fig 5, Fig.6, and the second filtration of calibration graph
(Fig7), the absorbance of 0.022 is not only due to the ion associate of sulfate with
Malachite Green (MG), but also ion associate between isopolymolybdate and MG.
The difference in absorbance of 0.012 is due to the silicate contained in the solvent
(ultrapurified water) used for solution preparation as well as silicate in the reagent
used. In this experiment, the solvent used for solution preparation is the sample itself.
From these results, it was found that reagent blank easily deviate to the samples as
well as reagent used. Therefore, if CCM and SAM are used, the concentration of
silicate in the sample will be lower than the original concentration. For example, if we
used SAM (extrapolation of the calibratrion graph), the concentration of silicate in the
sample will be found to be about 0.14 ng ml-1, and if we use CCM, the concentration of
silicate in sample will be found about 0.17 ng ml-1 (based on the absorbance of 30 ml
of sample after evaporation/concentration, and directly plotted to the calibration graph,
Fig.8, line B). Therefore, in this method at least two different data points were needed
and extended to the calibration line as shown in Fig.8. By plotting two or more
different data points of absorbance of samples, it means that we compare the slope of
varying sample volume with the slope of calibration graph. From this method, the
silicate in sample was found to be 0.32 ng ml-1 (3.18 ng/10 ml = 0.32 ng ml-1). This
result is more reliable because the slope obtained by varying volume is only due to the
silicate in the original samples, and the slope of the calibration graph is only due to the
silicate added in the standard solutions. Therefore, the effect of reagent blank, that will
cause an error in calculation, is avoided.
We can also calculate the concentration of silicate by directly comparing the slopes of
varying sample volume to the slope of calibration graph as given in Table 1. For
example in sample C ;

- Slope of varying sample volume (SV) = 2.55 x 10⁻³ A.U/ml
- Slope of calibration graph (SC) = 2.41 x 10⁻¹ A.U/ng ml-1 (volume of solutions used
for calibration graph is 30 ml)
For sample C, 1 ml of sample volume corresponds to 1.23 x 10⁻³ A.U. Therefore, 30
ml of sample volume correspond to 76.5 x 10⁻³ A.U. (the absorbance increase linearly
with increase in sample volume, Fig.5). Thus, by comparing both slopes, the
concentration of silicon in the sample C = (76.5 x 10⁻³ A.U x 1 ng ml-1)/(2.41 x 10-1 A.U)
= 0.32 ng ml-1.
The ultrapurified water samples were sampled in our laboratory. Non-dryness
evaporation method showed good results on sample pretreatment method as
indicated by good reproducibility of silicon concentrations obtained for the same
sample of ultrapurified water. The non-evaporation sample pretreatment method,
which also utilized slope comparison method, gave a lower value than those obtained
by non-dryness evaporation method. Probably, this is caused by non-conversion of
unreactive (polymeric) silicates to reactive (monomeric) silicates. However, the
dryness-evaporation method cannot be applied to this analysis due to the difficulty of
dissolving silicate in the evaporation vessel with the diluted sulfuric acid.
On the basis of the reproducibility test, the proposed method can be said to be
highly reliable and precise. Unavailability of the standard reference material for
ultrapurified water bearing certified silicate value makes it difficult to assess the
accuracy of this method. However, by comparing the various analytical methods for
the determination of silicate in ultrapurified water as shown in Table 2, it can be
concluded that the proposed method exhibits good accuracy and higher sensitivity
than any other method previously reported.

Acknowledgements
The present work was partially supported by Grant-in-Aid for Scientific Research
(B) No. 13440220 from the Japan Society for Promotion of Sciences (JSPS), Japan.
References
[1]. K. Takeda, S. Ikushima, J. Okuzaki, S. Watanabe, T. Fujimoto, T. Nakahara, Anal.
Chim. Acta, 426 (2001) 105.
[2]. T. Franken, Membrane Tech., 105 (1999) 9
[3]. http://www.mcilvainecompany.com/upw%20brochure/upwcharts/upwbrochure.htm
[4]. R. Hoelzl, L. Fabry, L. Kotz, S. Pahlke, Fresenius J. Anal. Chem, 366 (2000) 64.
[5]. Z. Li, M. Oshima, S. Motomizu, Bunseki Kagaku, (2004) in press
[6]. S. Motomizu, M. Oshima, Z. Jun, Anal. Chim. Acta, 251 (1991) 269.
[7]. A. Sabarudin, M. Oshima, N. Ishii, S. Motomizu, Talanta, 60 (2003) 122
[8]. Y. Takaku, K. Masuda, T. Takahashi, J. Anal. At. Spectrom., 9 (1994) 1385
[9]. T. Chu, M.K. Balazs, Ultrapure Water, 11 (1994) 56
[10]. K. Yoshimura, U. Hase, Analyst, 116 (1991) 835
[11]. H.B, Li, F. Chen, J. Chromatogr. A, 874 (2000) 143
[12]. S. Motomizu, M. Oshima, Y. Ojima, Anal. Sci., 5 (1989) 85
[13]. S. Motomizu, M. Ohima, T. Ikegama, Analyst, 114 (1989) 1679
[14]. S. Motomizu, M. Oshima, K. Araki, Analyst, 115 (1990) 1627
[15]. S. Motomizu, J.P. Susanto, M. Oshima, H. Mikasa, H. Hori, Anal. Sci, 11 (1995)
155
[16]. J. Saurina, S.H. Cassou, Analyst, 120 (1995) 2601.
[17]. J.P. Susanto, M. Oshima, S. Motomizu, Analyst, 120 (1995) 2605
[18]. J.P. Susanto, M. Oshima, S. Motomizu, Analyst, 120 (1995) 187
[19]. A. Sabarudin, M. Oshima, S. Motomizu, Anal. Chim. Acta, 481 (2003) 311

[20]. T. Hagiwara, S. Motomizu, Bull. Chem. Soc. Jpn, 67 (1994) 390.

Figure captions
Pinhole (1 mm i.d) with Several radial grooves
1.4 cm
Effective filtering diameter , 1 mm i.dMembrane filter (cellulose nitrate);
10
20
30
40
50
mL
1 ml Methyl cellosolve
FI system
Capped vialSuction
Plastic syringe
Three-way cock valve
Filter housing
Upper filtering supporter
Lower filteringsupporter
Pore size 1μm , 5 mm Ø
Pinhole (1 mm i.d) with Several radial grooves
1.4 cm1.4 cm
Effective filtering diameter , 1 mm i.dMembrane filter (cellulose nitrate);
10
20
30
40
50
mL
1 ml Methyl cellosolve
FI system
Capped vialSuction
Plastic syringe
Three-way cock valve
Filter housing
Upper filtering supporter
Lower filteringsupporter
Pore size 1μm , 5 mm Ø
Effective filtering diameter , 1 mm i.dMembrane filter (cellulose nitrate);
10
20
30
40
50
mL
1 ml Methyl cellosolve
FI system
Capped vialSuction
Plastic syringe
Three-way cock valve
Filter housing
Upper filtering supporter
Lower filteringsupporter
Pore size 1μm , 5 mm Ø
Fig.1 Syringe-type filtration apparatus with tiny membrane filter
AC
B
Content ofreagent blank
αA αB
αC
Abs
orba
nce
Concentration of Si
C1 C2
V1
C3 C4
V2 V3 V4
Sample volume
CBCC
AC
B
Content ofreagent blank
αA αB
αC
Abs
orba
nce
Concentration of Si
C1 C2
V1
C3 C4
V2 V3 V4
Sample volume
CBCC
Fig.2 Illustration of the slope comparison method for evaluating silicate in ultrapurified
water samples

0.01
0.02
0.03
0.04
0 10 20 30 40 50
Standing time / min
Abs
orba
nce
A
B
0.01
0.02
0.03
0.04
0 10 20 30 40 50
Standing time / min
Abs
orba
nce
A
B
Fig.3 Effect of standing time on the formation of molybdosilicate and ion associate of
molybdosilicate with MG A: Effect of standing time for the formation of molybdosilicate B: Effect of standing time for the formation of ion associate of molybdosilicate with MG

C
(CH3)2 +N
N+(CH3)2H
C
(CH3)2 +N
N(CH3)2
C
(CH3)2N N(CH3)2
OH- H+
+ H+
+ OH-
- OH-
I II III(HMG2+) (MG+) (MGOH)
(Very fast)
(Very fast)
(Very slow)
(Very slow)
(slow)+ Mo
(MG+)n(Mo)
(slow)+ Mo
(MG+)n(Mo)
-SiMo -SiMo(slow) (slow)+H4SiMo+H4SiMo
(MG)4(SiMo) + 4H+ (MG)4(SiMo) HMGOH+
+H+-H+
C
(CH3)2 +N
N+(CH3)2H
C
(CH3)2 +N
N(CH3)2
C
(CH3)2N N(CH3)2
OH- H+
+ H+
+ OH-
- OH-
I II III(HMG2+) (MG+) (MGOH)
C
(CH3)2 +N
N+(CH3)2H
C
(CH3)2 +N
N(CH3)2
C
(CH3)2N N(CH3)2
OH- H+
+ H+
+ OH-
- OH-
I II III(HMG2+) (MG+) (MGOH)
(Very fast)
(Very fast)
(Very slow)
(Very slow)
(slow)+ Mo
(MG+)n(Mo)
(slow)+ Mo
(MG+)n(Mo)
-SiMo -SiMo(slow) (slow)+H4SiMo+H4SiMo
(MG)4(SiMo) + 4H+ (MG)4(SiMo) HMGOH+
+H+-H+
Fig.4 Acid-base and ion associate equilibriums of Malachite Green in aqueous solution
H4SiMo : H4SiMo12O40 ; Mo : isopolymolybdate ion

0
0.05
0.1
0.15
0.2
0.25
0 15 30 45 60 75
A.1
B.1
CD
Sample volume / ml
Abs
orba
nce B.2
B.30
0.05
0.1
0.15
0.2
0.25
0 15 30 45 60 75
A.1
B.1
CD
Sample volume / ml
Abs
orba
nce B.2
B.3
Fig.5 Effect of sample volume and acidic medium on the absorbance of reagent blank Sample : ultrapurified water prepared by ELIX 3 / Milli Q Element System; A : HCl as acidic medium; B : H2SO4 as acidic medium; C : re-filtration of A; D : re-filtration of B; (1) non-evaporation method, each 0.25 ml of 1.7 mol l-1 H2SO4 and 0.52 mol l-1 Mo solution ,and 1 ml of 3.4 x 10⁻⁴ mol l-1 MG solution were added to per 15 ml of water samples; (2) non-dryness evaporation method, 5 ml of 0.003 mol l-1 H2SO4, each 0.17 ml of 1.7 mol l-1 H2SO4 and 0.52 mol l-1 Mo solution, and 0.67 ml of 3.4 x 10⁻⁴ mol l-1 MG were added to the 5 ml of residual evaporated sample; (3) dryness evaporation method, 5 ml of 0.003 mol l-1 H2SO4, 5 ml of ultrapurified water, each 0.17 ml of 1.7 mol l-1 H2SO4 and 0.52 mol l-1 Mo solution, and 0.67 ml of 3.4 x 10⁻⁴ mol l-1 MG were added to the dried sample.

0.01
0.02
0.03
0.04
0 0.2 0.4 0.6 0.8
Cl-
SO4-
Concentration of SO42- and Cl-1/ mol l-1
Abs
orba
nce
0.01
0.02
0.03
0.04
0 0.2 0.4 0.6 0.8
Cl-
SO4-SO4-
Concentration of SO42- and Cl-1/ mol l-1
Abs
orba
nce
Fig.6 Effect of sulfate and chloride ion on the absorbance of reagent blank Sample : ultrapurified water prepared by ELIX 3 / Milli Q Element System; sample volume : 30 ml, each 0.5 ml of 1.7 mol l-1 H2SO4 and 0.52 mol l-1 Mo solution ,and 2 ml of 3.4 x 10⁻⁴ mol l-1 MG solution were added to the samples. The effect of sulfate and chloride were examined in the absence of Molybdate solution.

Concentration of Si / ng ml-1
Abs
orba
nce
0
0.02
0.04
0.06
0.08
0.1
0 0.05 0.10 0.15 0.20 0.25 0.30
First filt
ration
Second filtration
Concentration of Si / ng ml-1
Abs
orba
nce
0
0.02
0.04
0.06
0.08
0.1
0 0.05 0.10 0.15 0.20 0.25 0.30
First filt
ration
Second filtration
Fig.7 Calibration graph of the silicate determination. Sample volume: 30 ml; sample: ultrapurified water (prepared by ELIX 3/Milli-Q Element System); second filtration means that the filtrates of the first filtration are filtered again and the absorbances of the dissolved filters are measured.

Sample volume , ml
Abs
orba
nce
Si in sample / ng
0
0.02
0.04
0.06
0.08
0.1
0 1.5 3.0 4.5 6.0 7.5 9.0
15 20 25 30 35
A
B
D
C
3.18 ng0.76 ng
Sample volume , mlA
bsor
banc
e
Si in sample / ng
0
0.02
0.04
0.06
0.08
0.1
0 1.5 3.0 4.5 6.0 7.5 9.0
15 20 25 30 35
A
B
D
C
3.18 ng0.76 ng
Fig.8 Slope comparison method for the determination of silicate in real samples (A) Calibration graph (sample volume: 30 ml); (B) evaporation to 5ml and dilution to 10 ml with 0.003 mol l-1 H2SO4; (C) non-evaporation sample; (D) evaporation to dryness and dilution to 10 ml with each 5 ml of 0.003 mol l-1 H2SO4 and ultrapurified water; sample: ultrapurified water prepared by ELIX 3/Milli-Q Element System.

Table 1 Determination of silicon as silicate in ultrapurified water samples by the slope comparison method (SCM)
Sample Sample
volume (ml)
Slope Silicon
(ng ml-1) Sample Δabs./ml
Calibration graph Δabs./ ng ml-1
A*1 15 - 60*a 1.23 x 10⁻³ 2.41 x 10⁻¹ 0.15
B*1 15 - 60*b 2.60 x 10⁻³ 2.41 x 10⁻¹ 0.33
C*1 15 - 30*b 2.55 x 10⁻³ 2.41 x 10⁻¹ 0.32
D*1 15 - 30*b 2.55 x 10⁻³ 2.41 x 10⁻¹ 0.32
E*1 15 - 30*c ~ 0 2.41 x 10⁻¹ ~ 0
F*2 15 - 30*b 7.50 x 10⁻³ 2.41 x 10⁻¹ 0.93
G*2 15 - 30*b 8.89 x 10⁻³ 2.41 x 10⁻¹ 1.10
H*2 15 - 30*b 7.80 x 10⁻³ 2.41 x 10⁻¹ 0.98
1 : Ultrapurified water prepared by ELIX 3 / Milli Q Element ; 2 : ultrapurified water
prepared by Milli Q labo ; a : samples were not evaporated; b : samples were
evaporated to 5 ml; c : samples were evaporated to dryness.
All the ultrapurified waters were sampled at Laboratory of Analytical Chemistry,
Okayama University on November, 2001.
Nitrogen gas was introduced into evaporation chamber when evaporation process
took place.

Table 2 Comparison of the various analytical methods for the determination of silicate
in ultrapurified water.
Method Sample pretreatment*a
Detection limit (ng ml-1)
Range of Si concentration found*b (ng ml-1)
Reference
ICP-AES E/C 3 0.2-0.9 9
ICP-MS E/C 1 0.2-0.9 9
Colorimetry E/C 0.25 0.2-0.9 9
HR-ICP-MS E/C - 0.5-1.0 8
Gel-phase absorptiometry
E/C 0.1-0.2 0.3-0.9 10
Flow injection- fluorophotometry
E/C 0.06 0.4-0.9 7
SCM-spectrophotometry E/C 0.01 0.3-1.1 This work
*a: C/E : evaporation/concentration
*b: The range of Si concentration in various ultrapurified water samples.