chemisorption for probing metal surface areas
TRANSCRIPT
Énergies renouvelables | Production éco-responsable | Transports innovants | Procédés éco-efficients | Ressources durables
© 2
013 -
IF
P E
nerg
ies n
ouvelle
s
Chemisorption for probing metal surface areas
Course Surface Science and Catalysis
© 2
013 -
IF
P E
nerg
ies n
ouvelle
s
Gerhard Pirngruber – Surface Science and Catalysis Course ETH
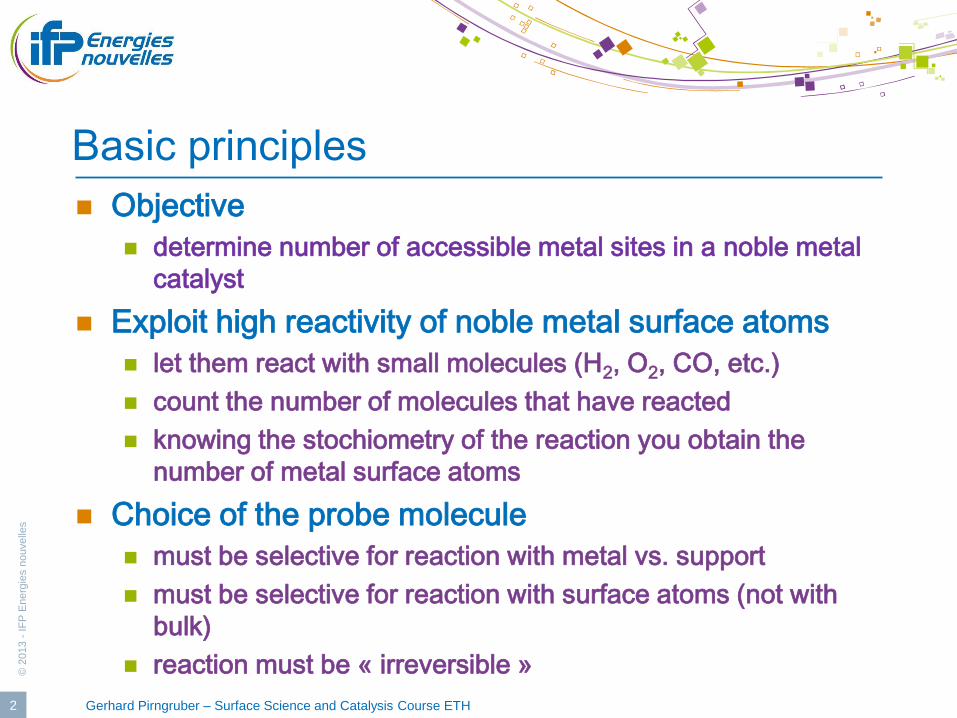
Basic principles
Objective
determine number of accessible metal sites in a noble metal
catalyst
Exploit high reactivity of noble metal surface atoms
let them react with small molecules (H2, O2, CO, etc.)
count the number of molecules that have reacted
knowing the stochiometry of the reaction you obtain the
number of metal surface atoms
Choice of the probe molecule
must be selective for reaction with metal vs. support
must be selective for reaction with surface atoms (not with
bulk)
reaction must be « irreversible »
2

© 2
013 -
IF
P E
nerg
ies n
ouvelle
s
Gerhard Pirngruber – Surface Science and Catalysis Course ETH
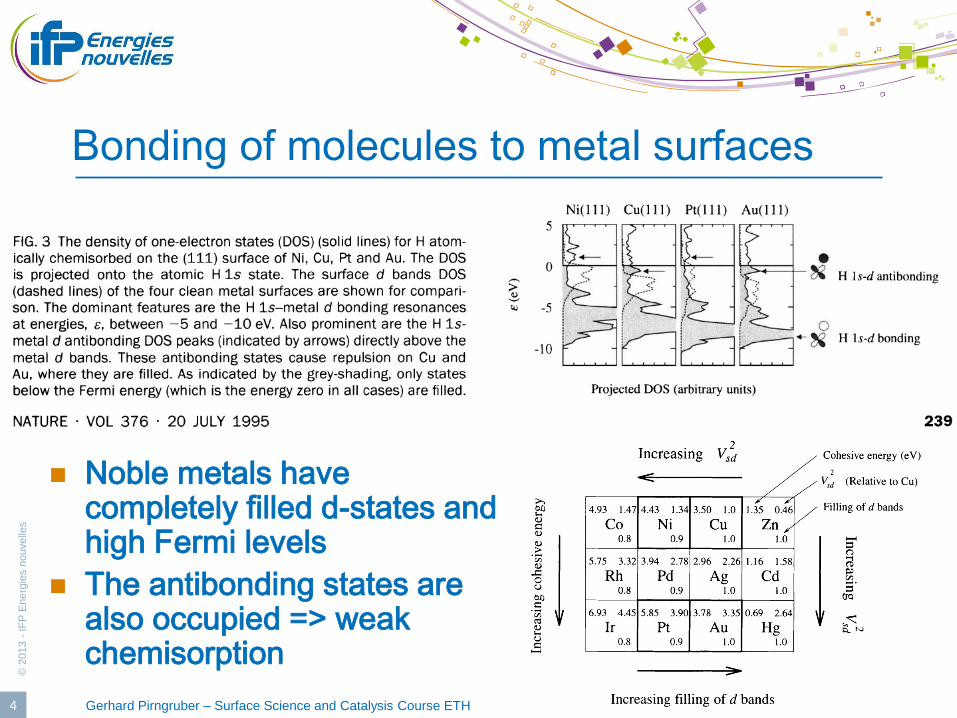
Bonding of molecules to metal surfaces
Interaction of d-band of metal with molecular orbitals of adsorbate generate bonding and antibonding states (with respect to the metal-adsorbate interaction)
If the Fermi level is high both will be filled => no net bonding.
If the Fermi level is low, the antibonding state remains empty => net bonding.
3
© 2
013 -
IF
P E
nerg
ies n
ouvelle
s
Gerhard Pirngruber – Surface Science and Catalysis Course ETH
Bonding of molecules to metal surfaces
Noble metals have completely filled d-states and high Fermi levels
The antibonding states are also occupied => weak chemisorption
4

© 2
013 -
IF
P E
nerg
ies n
ouvelle
s
Gerhard Pirngruber – Surface Science and Catalysis Course ETH
Periodic trends in strength of chemisorption
Difference between energy
of center of d-band and
Fermi level is a good
descriptor of chemisorption
energy
Explains periodic trends in
chemisorption
For noble metals the d-band
center is much lower than the
Fermi level (εd-εF is negative)
For non-noble metals the d-
band center may be above
the Fermi level
5
© 2
013 -
IF
P E
nerg
ies n
ouvelle
s
Gerhard Pirngruber – Surface Science and Catalysis Course ETH
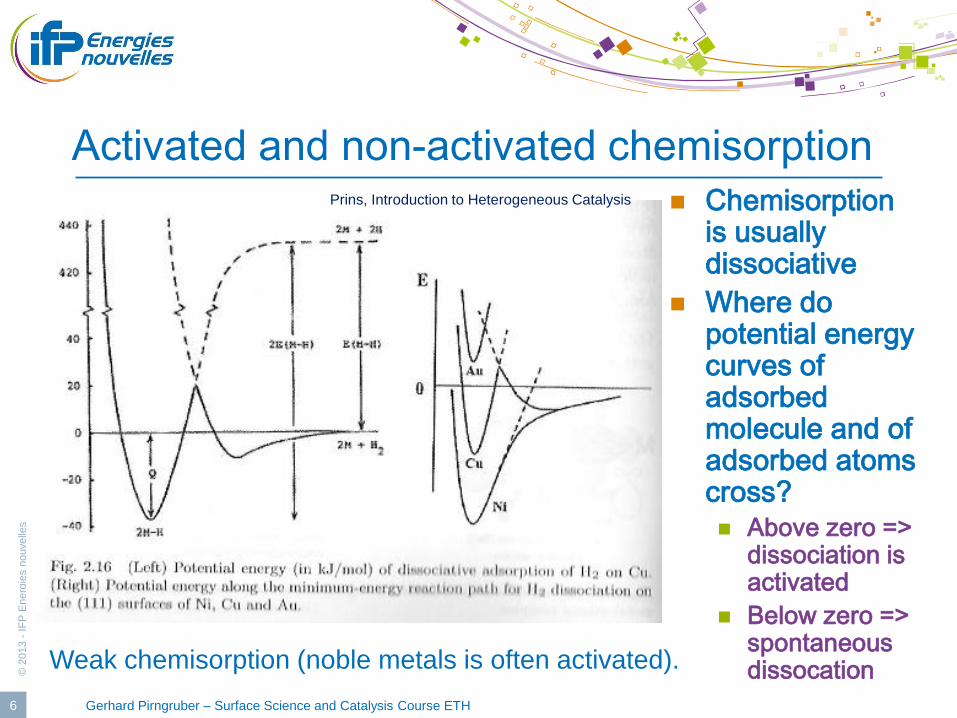
Activated and non-activated chemisorption
Chemisorption is usually dissociative
Where do potential energy curves of adsorbed molecule and of adsorbed atoms cross?
Above zero => dissociation is activated
Below zero => spontaneous dissocation
6
Prins, Introduction to Heterogeneous Catalysis
Weak chemisorption (noble metals is often activated).

© 2
013 -
IF
P E
nerg
ies n
ouvelle
s
Gerhard Pirngruber – Surface Science and Catalysis Course ETH
Determining metal dispersion
100..
100.%
TT
S
M
adsorbat
M
M
Q
Qn
Q
QD
MM
M.100
M%Q
T
Definition of dispersion : ratio between the quantity of metal sites that are
accessible on the surface QMS and the total quantity of metal sites in the
solid QMT.
* n = number of surface metal atoms that are occupied by the chemisorption of a gas molecule
ex : H2 on Pt : n = 2 because of dissociative adsorption: 1 molecule H2 dissociates to 2 H atoms adsorbed on 2 Pt atoms
* Qadsorbat e= adsorbed quantity when all surface sites are occupied (mole, mmol/g, etc)
* % M = metal content of the solid (catalyst) (determined by elemental analysis, in wt %)
* MM = molar mass of the metal (g/mol)
WITH
In the definition of dispersion, all surface atoms are considered equivalent; is not
necessarily true in terms of catalytic activity.
corner atoms are usually more active than atoms on the flat surfaces
stoichiometry of chemisorption may also change
© 2
013 -
IF
P E
nerg
ies n
ouvelle
s
Gerhard Pirngruber – Surface Science and Catalysis Course ETH
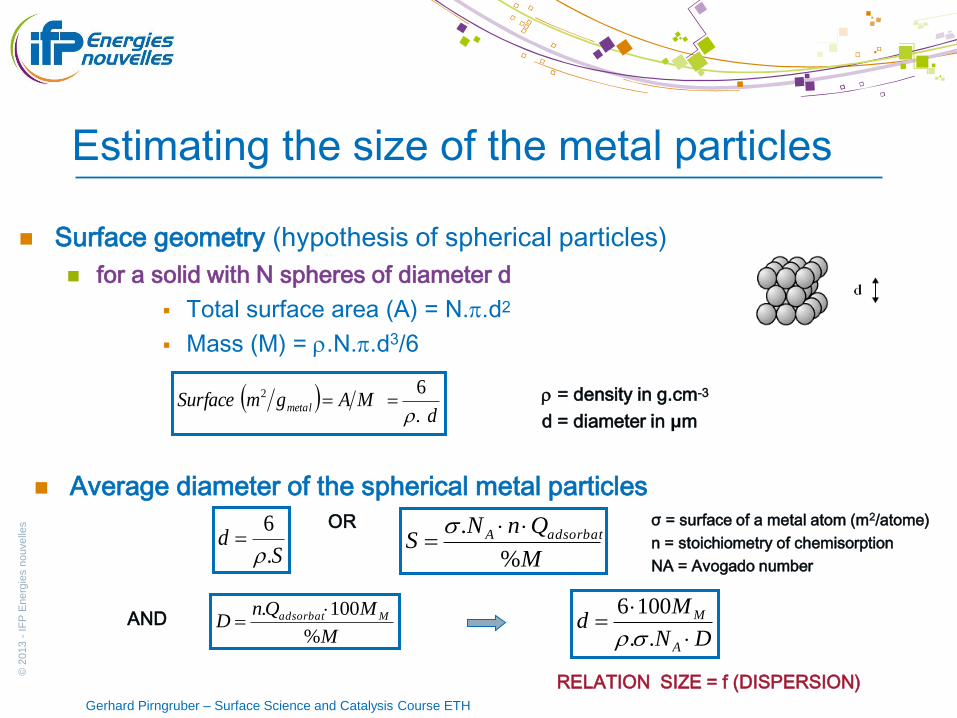
Estimating the size of the metal particles
d
MAgmSurface metal.
62
Sd
.
6
Surface geometry (hypothesis of spherical particles) for a solid with N spheres of diameter d
Total surface area (A) = N..d2
Mass (M) = .N..d3/6
= density in g.cm-3
d = diameter in μm
Average diameter of the spherical metal particles
M
QnNS adsorbatA
%
. OR
AND
M
MQnD Madsorbat
%
100.
DN
Md
A
M
..
1006
RELATION SIZE = f (DISPERSION)
σ = surface of a metal atom (m2/atome)
n = stoichiometry of chemisorption
NA = Avogado number

© 2
013 -
IF
P E
nerg
ies n
ouvelle
s
Gerhard Pirngruber – Surface Science and Catalysis Course ETH
Experimental methods (1)
Static measurement of an adsorption isotherm
same method as in physisorption
but measurment usually at room temp
Isotherms very steep
chemisorption is irreversible
sites are saturated at very
low pressure
On top of chemisorption there
may be some physisorption
on the support
extrapolate intercept at zero
isotherm, evacuation, 2nd isotherm,
calculate difference 9
V0 V1 Echantillon
vannes
P Jauge de pression
Pompe à vide Adsorbat
0
0.02
0.04
0.06
0.08
0.1
0.12
0.14
0 100 200 300 400 500 600
Pression (mbar)
H2
ad
s (
mM
ol/g
)

© 2
013 -
IF
P E
nerg
ies n
ouvelle
s
Gerhard Pirngruber – Surface Science and Catalysis Course ETH
Experimental methods (2)
Dynamic method – pulse method
send pulses of probe molecule with a carrier gas to the
catalyst
detect consumption of probe molecule with TCD
10
reponse du CO2 (cellule vide)
-2000
0
2000
4000
6000
8000
10000
12000
14000
0 2 4 6 8 10 12 14 16 18 20
temps (min)sig
nal
(µV
)
reponse du CO2 (cellule vide)
-2000
0
2000
4000
6000
8000
10000
12000
14000
0 2 4 6 8 10 12 14 16 18 20
temps (min)
sig
nal
(µV
)
reponse du CO2 (cellule vide)
-2000
0
2000
4000
6000
8000
10000
12000
14000
0 2 4 6 8 10 12 14 16 18 20
temps (min)
sig
nal
(µV
) reponse du CO2 (cellule vide)
-2000
0
2000
4000
6000
8000
10000
12000
14000
0 2 4 6 8 10 12 14 16 18 20
temps (min)
sign
al (µ
V)
reponse du CO2 (cellule vide)
-2000
0
2000
4000
6000
8000
10000
12000
14000
0 2 4 6 8 10 12 14 16 18 20
temps (min)
sig
nal
(µV
)
reponse du CO2 (cellule vide)
-2000
0
2000
4000
6000
8000
10000
12000
14000
0 2 4 6 8 10 12 14 16 18 20
temps (min)
sig
nal
(µV
)
time
TCD signal saturation
© 2
013 -
IF
P E
nerg
ies n
ouvelle
s
Gerhard Pirngruber – Surface Science and Catalysis Course ETH
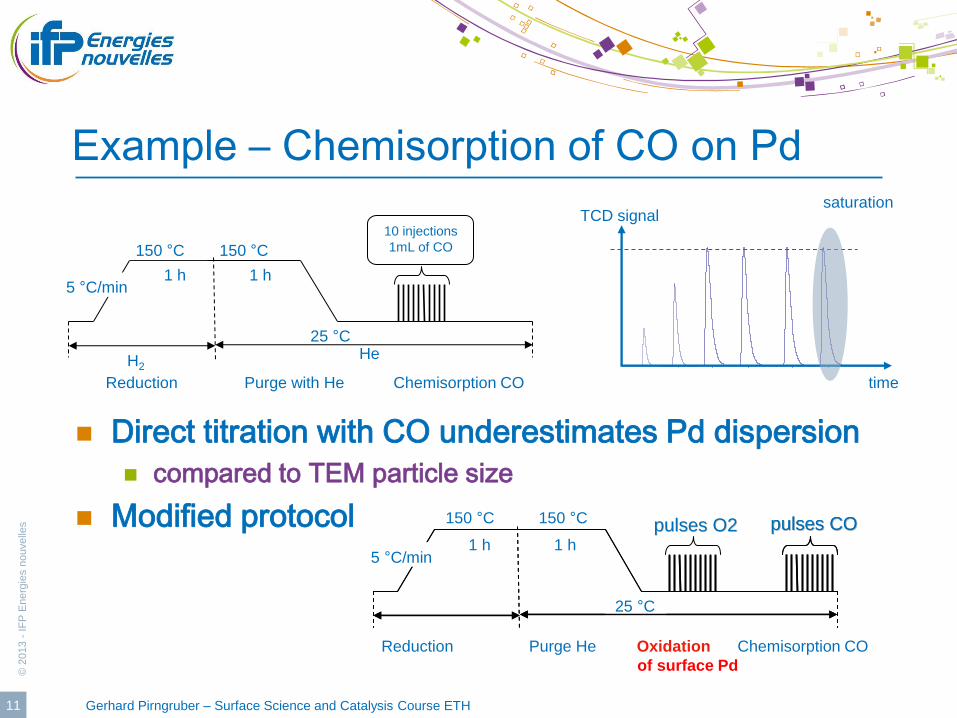
Example – Chemisorption of CO on Pd
Direct titration with CO underestimates Pd dispersion
compared to TEM particle size
Modified protocol
11
150 °C
1 h 1 h
He H2
25 °C
150 °C
5 °C/min
10 injections
1mL of CO
Reduction Purge with He Chemisorption CO
reponse du CO2 (cellule vide)
-2000
0
2000
4000
6000
8000
10000
12000
14000
0 2 4 6 8 10 12 14 16 18 20
temps (min)
sig
nal
(µV
)
reponse du CO2 (cellule vide)
-2000
0
2000
4000
6000
8000
10000
12000
14000
0 2 4 6 8 10 12 14 16 18 20
temps (min)
sig
nal
(µV
)
reponse du CO2 (cellule vide)
-2000
0
2000
4000
6000
8000
10000
12000
14000
0 2 4 6 8 10 12 14 16 18 20
temps (min)
sig
nal
(µV
) reponse du CO2 (cellule vide)
-2000
0
2000
4000
6000
8000
10000
12000
14000
0 2 4 6 8 10 12 14 16 18 20
temps (min)
sign
al (µ
V)
reponse du CO2 (cellule vide)
-2000
0
2000
4000
6000
8000
10000
12000
14000
0 2 4 6 8 10 12 14 16 18 20
temps (min)
sig
nal
(µV
)
reponse du CO2 (cellule vide)
-2000
0
2000
4000
6000
8000
10000
12000
14000
0 2 4 6 8 10 12 14 16 18 20
temps (min)
sig
nal
(µV
)
time
TCD signal saturation
1 h1 h
25 °C
150 °C
5 °C/min
pulses COpulses CO150 °C pulses O2pulses O21 h1 h
25 °C
150 °C
5 °C/min
pulses COpulses CO150 °C pulses O2pulses O2
Reduction Purge He Oxidation Chemisorption CO
of surface Pd
© 2
013 -
IF
P E
nerg
ies n
ouvelle
s
Gerhard Pirngruber – Surface Science and Catalysis Course ETH 12
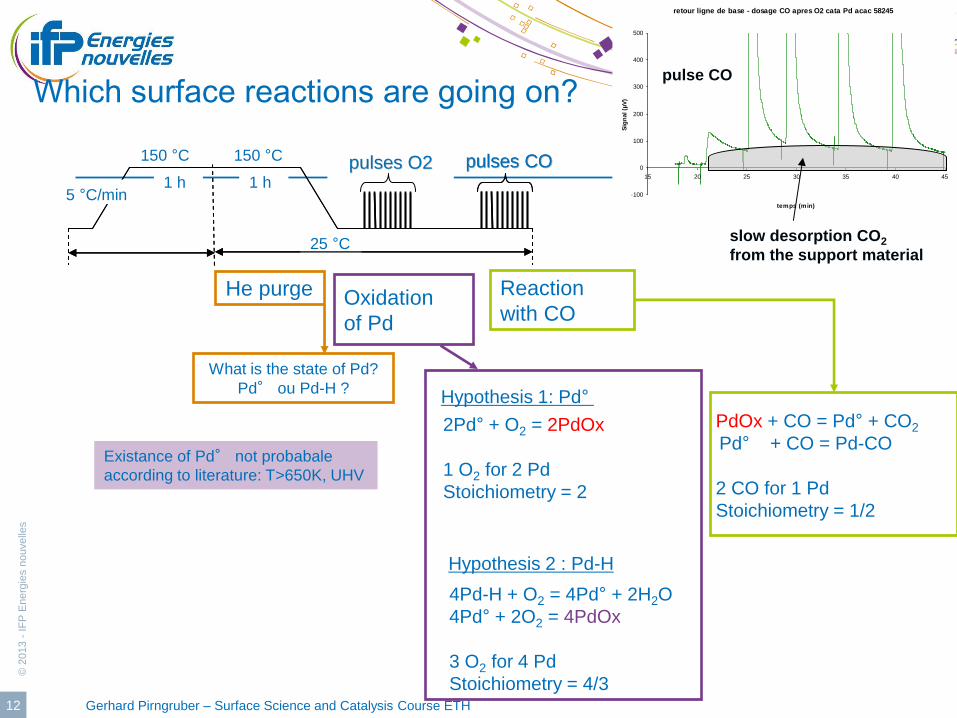
Which surface reactions are going on?
1 h1 h
25 °C
150 °C
5 °C/min
pulses COpulses CO150 °C pulses O2pulses O21 h1 h
25 °C
150 °C
5 °C/min
pulses COpulses CO150 °C pulses O2pulses O2
Hypothesis 1: Pd°
Hypothesis 2 : Pd-H
2Pd° + O2 = 2PdOx
1 O2 for 2 Pd
Stoichiometry = 2
PdOx + CO = Pd° + CO2
Pd° + CO = Pd-CO
2 CO for 1 Pd
Stoichiometry = 1/2
4Pd-H + O2 = 4Pd° + 2H2O
4Pd° + 2O2 = 4PdOx
3 O2 for 4 Pd
Stoichiometry = 4/3
What is the state of Pd?
Pd° ou Pd-H ?
He purge Oxidation
of Pd
Reaction
with CO
Existance of Pd° not probabale
according to literature: T>650K, UHV
retour ligne de base - dosage CO apres O2 cata Pd acac 58245
-100
0
100
200
300
400
500
15 20 25 30 35 40 45
temps (min)
Sig
nal (µ
V)
slow desorption CO2
from the support material
pulse CO
© 2
013 -
IF
P E
nerg
ies n
ouvelle
s
Gerhard Pirngruber – Surface Science and Catalysis Course ETH
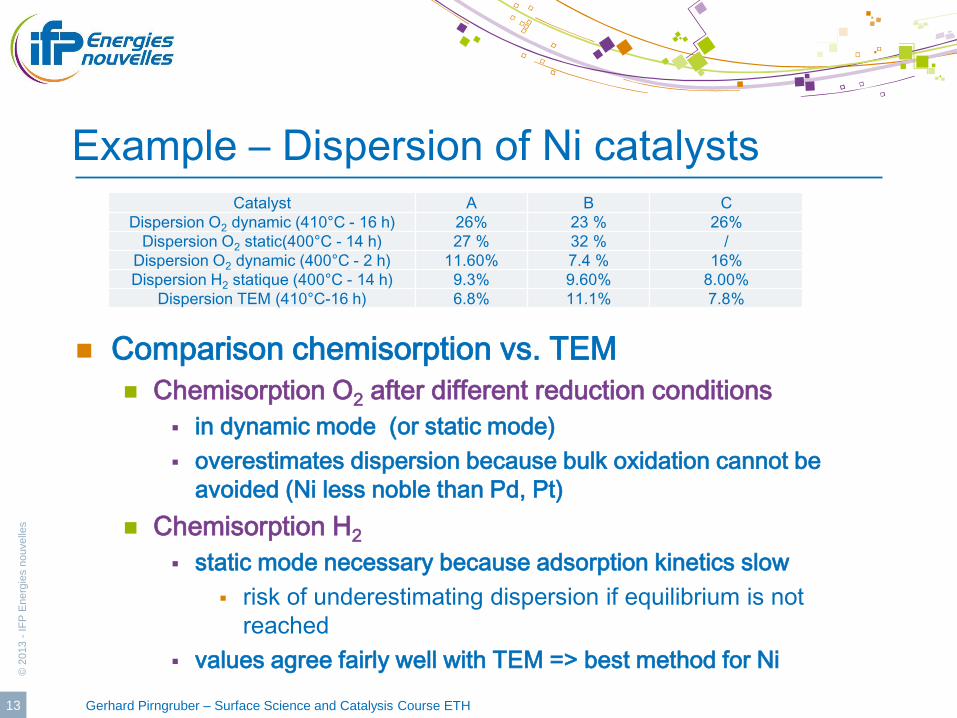
Example – Dispersion of Ni catalysts
Comparison chemisorption vs. TEM
Chemisorption O2 after different reduction conditions
in dynamic mode (or static mode)
overestimates dispersion because bulk oxidation cannot be
avoided (Ni less noble than Pd, Pt)
Chemisorption H2
static mode necessary because adsorption kinetics slow
risk of underestimating dispersion if equilibrium is not
reached
values agree fairly well with TEM => best method for Ni
13
Catalyst A B C
Dispersion O2 dynamic (410°C - 16 h) 26% 23 % 26%
Dispersion O2 static(400°C - 14 h) 27 % 32 % /
Dispersion O2 dynamic (400°C - 2 h) 11.60% 7.4 % 16%
Dispersion H2 statique (400°C - 14 h) 9.3% 9.60% 8.00%
Dispersion TEM (410°C-16 h) 6.8% 11.1% 7.8%
© 2
013 -
IF
P E
nerg
ies n
ouvelle
s
Gerhard Pirngruber – Surface Science and Catalysis Course ETH
Exercise Ni dispersion
An adsorption isotherm of H2 on a Ni catalyst is
recorded in static mode. The adsorbed amount
extrapolated to zero is 2.53 cm3 STP/g catalyst.
The Ni loading of the catalyst is 13.05wt% Ni.
What is the Ni dispersion ?
Correct answer is 10.15%.
14
© 2
013 -
IF
P E
nerg
ies n
ouvelle
s
Gerhard Pirngruber – Surface Science and Catalysis Course ETH
Example – Dispersion of Pt catalysts
Possible probe molecules : H2, CO, O2
Method used at IFPEN
Reduction in H2
Cooling in inert gas
Titration with pulses of O2
2 Pt-H + 3/2 O2 → 2 Pt-O + H2O
Other possibility
Reduction in H2
Purge in inert gas at high temperature to remove chemisorbed H
Cooling
Chemisorption of H2 (static or dynamic mode)
15
© 2
013 -
IF
P E
nerg
ies n
ouvelle
s
Gerhard Pirngruber – Surface Science and Catalysis Course ETH
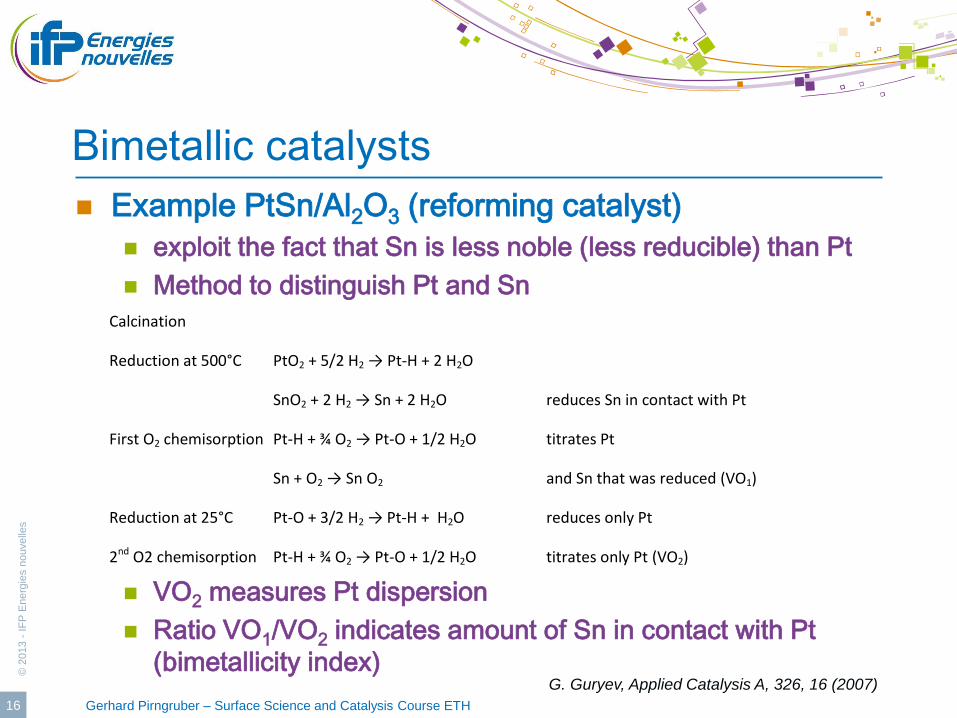
Bimetallic catalysts
Example PtSn/Al2O3 (reforming catalyst)
exploit the fact that Sn is less noble (less reducible) than Pt
Method to distinguish Pt and Sn
VO2 measures Pt dispersion
Ratio VO1/VO2 indicates amount of Sn in contact with Pt
(bimetallicity index)
16
Calcination
Reduction at 500°C PtO2 + 5/2 H2 → Pt-H + 2 H2O
SnO2 + 2 H2 → Sn + 2 H2O reduces Sn in contact with Pt
First O2 chemisorption Pt-H + ¾ O2 → Pt-O + 1/2 H2O titrates Pt
Sn + O2 → Sn O2 and Sn that was reduced (VO1)
Reduction at 25°C Pt-O + 3/2 H2 → Pt-H + H2O reduces only Pt
2nd O2 chemisorption Pt-H + ¾ O2 → Pt-O + 1/2 H2O titrates only Pt (VO2)
G. Guryev, Applied Catalysis A, 326, 16 (2007)
© 2
013 -
IF
P E
nerg
ies n
ouvelle
s
Gerhard Pirngruber – Surface Science and Catalysis Course ETH
Recommended literature
Prelazzi et al., Comparison of H2 adsorption, O2 adsorption, H2 titration and O2 titration on supported Palladium catalysts, J. Catal. 181 (1999) 73-79
discusses the problem of stoichiometry
the effect of pretreatment conditions
compares different methods of measuring chemisorption
17