chemical reactions at aqueous interfaces thesis by...
TRANSCRIPT

CHEMICAL REACTIONS AT AQUEOUS INTERFACES
Thesis by
Chad David Vecitis
In Partial Fulfillment of the Requirements
for the Degree of
Doctor of Philosophy
California Institute of Technology
Pasadena, California
2009
(Defended March 13th, 2009)

ii
© 2009
Chad David Vecitis
All Rights Reserved

iii
..:: dedicated to my family ::.. ccclskk
iv
ACKNOWLEDGEMENTS
Over the last six years as a graduate student at Caltech I have learned a great deal not
only about science and academics, but also about myself, and for this I give thanks. First
and foremost, I must thank Professor Michael Hoffmann, a model advisor and a great
friend. Professor Hoffmann allowed me the freedom to research a variety of topics in
environmental chemistry and discover my path. This freedom led to a broad knowledge
of the global environment, a variety of roles in collaborative projects, and an extensive
publication list. Professor Hoffmann gave me opportunities such as scientifically leading
a research project, teaching a graduate-level class, and giving presentations at
conferences and renowned institutions. All of these experiences, which were very nerve-
wracking at the time, have made me prepared and confident to take on a scientific career.
I have learned a great deal from Professor Hoffmann directly and by subtle or not-so-
subtle example. Professor Hoffmann has also been a great friend and was always ready
to listen and advise on personal issues. We bonded over many things such as our grand
ol’ birthplace (Wisconsin) and shared many good times, such as side adventures on
conference trips (Kegel’s Inn). It has been a great experience as well as an honor and
privilege to work in the Hoffmann Lab at Caltech.
During my time at Caltech, I have also had the honor to work with a number of
mentors. Dr. Brian Mader of 3M Company Environmental Laboratory taught me a great
deal about industrial-environmental and industrial-academic relations, the importance of
being well prepared well ahead of time, and the value of simplicity and cost efficacy in
engineering solutions. The collaboration with 3M allowed me the opportunity to lead a
scientific project, and Dr. Mader always gave me the respect and support needed to
v
succeed. We also have shared a number of good times outside the workplace, such as
Death Cab in Minneapolis and the Hookah Café in New Orleans. Dr. Agustín Colussi, a
Senior Research Associate at Caltech, has a great passion for science and taught me the
value of pre-experiment research, that even the simplest experiments can yield valuable
results, and helped me develop the poise to defend myself academically. Dr. Nathan
Dalleska of the Environmental Analytical Center at Caltech taught me about analytical
chemistry, and in particular the joys of mass spectrometry, by answering all of my
continual questions and allowing me to take apart, reconfigure and attempt to put back
together the instruments under his watch. As Dr. Dalleska’s Environmental Organic
Chemistry TA, I learned a great deal on class instruction and the difficulties of
maintaining student interest. And how could I forget the fun of hitting balls on the tennis
court and the short, but sweet, sailing career. I would also like to thank my thesis
committee of Professor Vincent McKoy, Professor Nathan Lewis, and Professor Jack
Beauchamp for taking the time to read my work, give helpful comments and suggestions
and listen to my arguments.
I owe many thanks to Jie Cheng and Professor Hyunwoong Park, with whom I have
collaborated on a number of projects. We made a great team on the fluorochemical
remediation project! And I think I still owe them a dinner. Jie and I initially worked
together on the ozone-electrospray project, which resulted in my first co-authored papers
at Caltech. I enjoyed the Chinese dinners with Jie and Li, even if my brother was scared,
and the Wii was always a fun time. Professor HP and I also collaborated on the
electrochemistry project and he showed by example the value of hard work. We had
many great discussions about science and life over morning coffee and I appreciated his

vi
sound advice. Dr. Shinichi Enami and I collaborated on the ozone-electrospray project
and he was always ready for a beer or two. I would like to thank Tammy Campbell for
allowing me to mentor her on the fluorochemical project. Tammy’s success has given
me confidence for my future academic endeavors. I worked with Fabien Paulot on flow
tube construction and he was always up for a good chemistry discussion. Dr. Yajuan
Wang collaborated on AFFF sonolysis and assembled a great dim sum. It was a pleasure
to work with Professor Eileen Spain and Keegan Nelson of Occidental College. I would
also like to thank collaborators Professor Wonyong Choi, golf enthusiast, and Dr. Oleh
Weres.
My graduate experience at Caltech was enjoyable due to all the friendly and helpful
members of the Hoffmann and Keck labs. We spent many group meetings, celebrations
at the Hoffmann house, and Friday nights at the Ath together. Dr. Timothy Lesko
enthusiastically introduced me to the labs and everyone involved. Dr. Christopher Boxe
has shared many insightful post-Caltech experiences. Dr. Marcelo Guzman had a good
attitude on life and new perspective on any situation. Dr. Su Young Ryu always had
something interesting to say and could put together an excellent Korean meal. Dr.
William Balcerski was a good conversation, if available. Jina Choi always brought a
smile to the lab. Will Ford was a dutiful GSC chair and added a dash of spice to Keck 4.
Professor Janet Hering and her lab group gave helpful comments and suggestions during
group meetings. Rich Wildman’s organization of EHS and Swiss hospitality were both
great experiences. I thank Fran Matzen, Cecilia Gamboa, Linda Scott, and Mike
Vondrus for keeping the lab and department running smoothly. And I’d like to thank
those who inspired me to undertake a scientific career, my undergraduate research

vii
advisor, Professor Howard Fairbrother, and my Science Olympiad coach, Al Stawicki,
a.k.a. The Great Pheoc.
I would also like to thank my running crew for making sure I had some fun and kept
my sanity over the years. This goes out to Dr. David Ebner, Dr. Erik Rodriguez, Dr.
Gavin Murphy, Dr. Cristal Gama, Dr. Heather Murrey, Adam Dennis, and Tammy
Campbell. We had many exciting times together and I’m sure the memories will make
great stories one day. And Erik has the pictures to make sure we remember them all! I
also had many good times with Philippe Martiny, Ryan Songco, Sky Rashby, and Will
Ford. Special thanks go out to the lovely Katherine Sirles for her persistence and
dedication, which brought us together and for going through the tail end of the journey
with me, which has been a bit more difficult than expected.
Finally, I would like to thank my family for their constant support of my academic
ventures from the beginning to the present. None of this would have been possible
without them. We have had many good times including but not limited to Caribbean
cruises, birthdays in Vegas, adventures in Mexico, and Wisconsin fun. I especially thank
my parents for all of their hard work over the years. Thank you!
viii
ABSTRACT
Interfaces or phase boundaries are a unique chemical environment relative to
individual gas, liquid, or solid phases. Interfacial reaction mechanisms and kinetics are
often at variance with homogeneous chemistry due to mass transfer, molecular
orientation, and catalytic effects. Aqueous interfaces are a common subject of
environmental science and engineering research, and three environmentally relevant
aqueous interfaces are investigated in this thesis: 1) fluorochemical sonochemistry
(bubble-water), 2) aqueous aerosol ozonation (gas-water droplet), and 3) electrolytic
hydrogen production and simultaneous organic oxidation (water-metal/semiconductor).
Direct interfacial analysis under environmentally relevant conditions is difficult, since
most surface-specific techniques require relatively ‘extreme’ conditions. Thus, the
experimental investigations here focus on the development of chemical reactors and
analytical techniques for the completion of time/concentration-dependent measurements
of reactants and their products. Kinetic modeling, estimations, and/or correlations were
used to extract information on interfacially relevant processes.
We found that interfacial chemistry was determined to be the rate-limiting step to a
subsequent series of relatively fast homogeneous reactions, for example: 1) Pyrolytic
cleavage of the ionic headgroup of perfluorooctanesulfonate (PFOS) and
perfluorooctanoate (PFOA) adsorbed to cavitating bubble-water interfaces during
sonolysis was the rate-determining step in transformation to their inorganic constituents
CO, CO2, and F-; 2) O3(g) oxidation of I-(aq) to HOI(aq) at the aerosol-gas interface is the
rate-determining step in the oxidation of Br-(aq) and Cl-
(aq) to dihalogens; 3) Electrolytic
formation of >TiOH• groups at the BiOx-TiO2/Ti anode is rate-limiting for the overall

ix
oxidation of organics by the dichloride radical, Cl2•-. We also found chemistry unique to
the interface, for example: 1) Adsorption of dilute PFOS(aq) and PFOA(aq) to acoustically
cavitating bubble interfaces was greater than equilibrium expectations due to high-
velocity bubble radial oscillations; 2) Relative O3(g) oxidation kinetics of I-(aq) and SO3
2-
/S2O32- were at variance with previously reported bulk aqueous kinetics; 3) Organics that
directly chelated with the BiOx-TiO2/Ti anode were oxidized by direct electron transfer,
resulting in immediate CO2 production but slower overall oxidation kinetics. Chemical
reactions at aqueous interfaces can be the rate-limiting step of a reaction network and
often display novel mechanisms and kinetics as compared to homogeneous chemistry.

x
TABLE OF CONTENTS
Dedication………………………………………………………………………………... iii
Acknowledgements…………………………………………………………..................... iv
Abstract…………………………………………………………………………………. viii
Table of Contents…………………………………………………………………………. x
List of Figures…………………………………………………………………………… xii
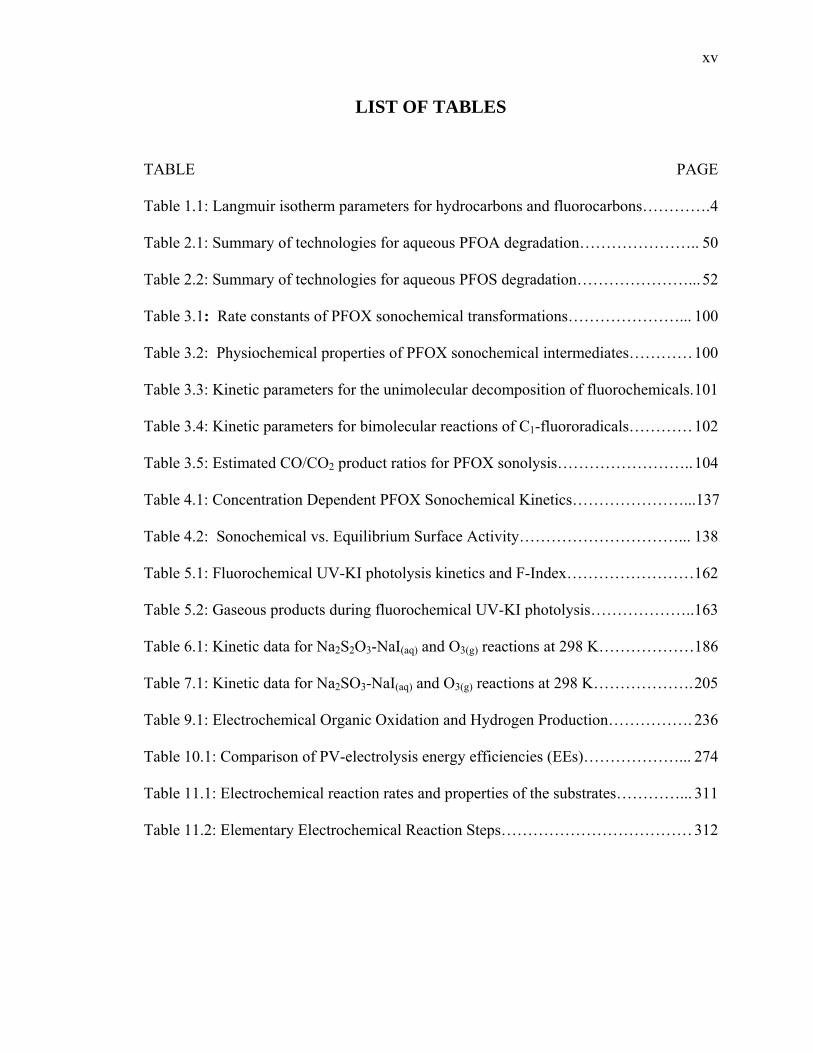
List of Tables……………………………………………………………………………..xv
List of Schemes…………………………………………………………………………. xvi
Chapter 1: Introduction and Summary………….………………………………………… 1
Chapter 2: Treatment Technologies for Aqueous Perfluorooctanesulfonate (PFOS)
and Perfluorooctanoate (PFOA)…………………………………………….. 17
Chapter 3: Sonolytic Conversion of the Aqueous Perfluorinated Surfactants,
Perfluorooctanoate (PFOA) and Perfluorooctanesulfonate (PFOS) into
Inorganic Constituents………………………………………………...…….. 73
Chapter 4: Enhancement of Perfluorooctanoate (PFOA) and Perfluorooctanesulfonate
(PFOS) Activity at Acoustic Cavitation Bubble Interfaces………………... 111
Chapter 5: Reductive Defluorination of Aqueous Perfluorinated Alkyl Surfactants:
Effects of Ionic Headgroup and Chain Length……………………………...143
Chapter 6: Mass Spectrometric Detection of Oxidation Products and Intermediates of
Aqueous Aerosol Iodide and/or Thiosulfate Reaction with Gaseous Ozone.168
Chapter 7: Mass Spectrometric Detection of Ozonation Products and Intermediates of
Aqueous Aerosol Iodide and/or Sulfite: Implications for Interfacial Kinetics
and Iodide-Mediated Sulfite Oxidation……………………………………..191
xi
Chapter 8: Iodide-Mediated Gaseous Ozone Oxidation of Aerosol Bromide and Chloride
as a Possible Source of Gaseous Marine Halogens………………………... 209
Chapter 9: Solar-Powered Electrochemical Production of Molecular Hydrogen from
Water……………………………………………………………………….. 226
Chapter 10: Electrochemical Anodic Oxidation of Organic Compounds Coupled with the
Cathodic Production of Molecular Hydrogen……………………………… 242
Chapter 11: Enhancement of Cathodic H2 Production Efficiencies by Simultaneous
Anodic Oxidation of Organics: Role of Substrate and Active Chlorine
Species……………………………………………………………………... 280
xii
LIST OF FIGURES
FIGURE PAGE
Figure 3.1: Pseudo-first order plots of PFOX sonolysis………………………………… 93
Figure 3.2: Normalized sulfur mass balance during PFOS sonolysis…………………… 93
Figure 3.3: Normalized fluorine mass balance during PFOX sonolysis………………… 94
Figure 3.4: Trace gases CH2F2 and CHF3 detected during PFOX sonolysis……..……... 95
Figure 3.5: Normalized carbon mass balance plots during PFOX sonolysis……………. 96
Figure 4.1: PFOX sonochemical degradation initial concentration dependence………. 131
Figure 4.2: Equilibrium PFOX air-water interface partitioning……………………….. 132
Figure 4.3: PFOX sonochemical degradation rate initial concentration dependence….. 133
Figure 4.4: Kinetic modeling of PFOS sonolysis concentration dependent kinetics…... 134
Figure 4.5: Kinetic modeling of PFOA sonolysis concentration dependent kinetics…...135
Figure 4.6: PFOS surface excess vs. PFOS bulk concentration………………………...136
Figure 5.1: Pseudo-first order plots of PFOX UV254 nm KI photolysis………………… 156
Figure 5.2: I3- production and pH change during PFOX UV-KI photolysis…………… 157
Figure 5.3: PFXA and PFXS (X = O, H, B) degradation during UV-KI photolysis…... 158
Figure 5.4: F- production during PFXA and PFXS (X = O, H, B) UV-KI photolysis… 159
Figure 5.5: Effects of chain length on FC UV-KI degradation rates and F-Index……... 160
Figure 5.6: Gaseous products during PFOX UV-KI photolysis………………………...161
Figure 6.1: Diagram of electrospray and overall reactor setup………………………… 179
Figure 6.2: ESI-MS of aqueous Na2S2O3 droplets and gaseous O3 reaction products…. 180
Figure 6.3: ESI-MS of aqueous Na2S2O3-NaI droplets and O3(g) reaction products…… 180
Figure 6.4: Na2S2O3-NaI(aq,drop) and O3(g) reaction products vs. [O3(g)]………………… 181
xiii
Figure 6.5: ESI-MS HSO4-/S2O6
2- signal ratio vs. [O3(g)]............................................... 182
Figure 6.6: Na2S2O3-NaI(aq,drop) and O3(g) reaction products vs. [O3(g)]............................ 182
Figure 6.7: IS2O3- ESI-MS signal intensities vs. [Na2S2O3] and [NaI]............................ 183
Figure 6.8: Normalized I- and S2O3- ESI-MS signal intensities vs. [O3(g)]……………...184
Figure 6.9: Collision induced dissociation of Na2S2O3-NaI(aq) and O3(g) products…….. 185
Figure 7.1: ESI-MS of aqueous Na2SO3 droplets and gaseous O3 reaction products….. 200
Figure 7.2: HSO3- and HSO4
- absolute and relative ESI-MS signals vs. [O3(g)]……….. 201
Figure 7.3: ESI-MS of aqueous Na2SO3-NaI droplets and O3(g) reaction products……..202
Figure 7.4: Na2SO3-NaI(aq,drop) and O3(g) reaction products vs. [O3(g)]…………………. 203
Figure 7.5: IO3- and I3
- iodide-normalized yields vs. [Na2SO3]………………………... 204
Figure 8.1: Normalized iodide concentrations [I-]/[I-]0 versus [O3(g)]………………… 217
Figure 8.2: [IO3-]/[I3
-] ratio as function of [O3(g)]……………………………………... 218
Figure 8.3: Aqueous NaBr-NaI or NaCl-NaI and O3(g) reaction products……………... 219
Figure 8.4: Aqueous NaBr-NaI or NaCl-NaI and O3(g) reaction products vs. [O3(g)]…...220
Figure 8.5: Aqueous NaBr-NaI and NaI and O3(g) reaction products vs. [O3(g)]……….. 220
Figure 9.1: Electrochemical H2 and O2 production……………………………………. 237
Figure 9.2: Outdoor field test of PV-electrochemical system (April 18th, 2007) on the roof
of W.M. Keck Laboratories at the California Institute of Technology………………… 238
Figure 9.3: Products of electrolytic degradation of 1 mM phenol……………………... 239
Figure 10.1: Time profiles of a DC-powered hydrogen and oxygen production rate….. 264
Figure 10.2: Electrochemical oxidation of phenol to CO2 and simultaneous generation of
H2 and O2………………………………………………………………………………. 265
Figure 10.3: Effects of Icell on observed electrochemistry……………………………... 266
xiv
Figure 10.4: Effects of phenol concentration on electrochemistry……………………...267
Figure 10.5: Effect of NaCl concentration on the electrochemistry…………………… 268
Figure 10.6: Time profiles of pH change during the course of electrolysis…………… 268
Figure 10.7: H2 and CO2 production during electrochemical catechol oxidation……… 269
Figure 10.8: H2 and CO2 production during PV-electrochemical catechol oxidation…..269
Figure 10.9: Solar powered electrolysis with phenol addition on a cloudy day……….. 270
Figure 10.10: Relationships between IS, PVcell and H2 energy………………………….271
Figure 10.11: Electrolysis in a sub-Pilot Scale, 20 L, Reactor………………………… 272
Figure 11.1: H2, O2 and CO2 production during phenol electrolysis…………………... 302
Figure 11.2: Effect of various substrate additions on the H2 production rate………….. 303
Figure 11.3: Effect of electrolyte, NaCl vs. Na2SO4, on electrochemical processes…... 304
Figure 11.4: pH variation during electrolysis with and without phenol………………...305
Figure 11.5: Relationships between , , 0obsk 0
OHk -2
0Cl
k • , …………………………….. 306 0HClOk
Figure 11.6: Hypochlorite production during electrolysis………………………………307
Figure 11.7: Electrochemical relationships of vs. ΔIcell and vs. ΔEE……... 308 obsk− obsk−
Figure 11.8: and Icell vs. NaCl concentration in 50 mM Na2SO4………………... 309 obsk−
Figure 11.9: Effect of applied cell current (I) on of phenol……………………... 310 obsk−
xv
LIST OF TABLES
TABLE PAGE
Table 1.1: Langmuir isotherm parameters for hydrocarbons and fluorocarbons…………. 4
Table 2.1: Summary of technologies for aqueous PFOA degradation………………….. 50
Table 2.2: Summary of technologies for aqueous PFOS degradation…………………... 52
Table 3.1: Rate constants of PFOX sonochemical transformations…………………... 100
Table 3.2: Physiochemical properties of PFOX sonochemical intermediates………… 100
Table 3.3: Kinetic parameters for the unimolecular decomposition of fluorochemicals. 101
Table 3.4: Kinetic parameters for bimolecular reactions of C1-fluororadicals………… 102
Table 3.5: Estimated CO/CO2 product ratios for PFOX sonolysis…………………….. 104
Table 4.1: Concentration Dependent PFOX Sonochemical Kinetics…………………...137
Table 4.2: Sonochemical vs. Equilibrium Surface Activity…………………………... 138
Table 5.1: Fluorochemical UV-KI photolysis kinetics and F-Index……………………162
Table 5.2: Gaseous products during fluorochemical UV-KI photolysis……………….. 163
Table 6.1: Kinetic data for Na2S2O3-NaI(aq) and O3(g) reactions at 298 K………………186
Table 7.1: Kinetic data for Na2SO3-NaI(aq) and O3(g) reactions at 298 K………………. 205
Table 9.1: Electrochemical Organic Oxidation and Hydrogen Production……………. 236
Table 10.1: Comparison of PV-electrolysis energy efficiencies (EEs)………………... 274
Table 11.1: Electrochemical reaction rates and properties of the substrates…………... 311
Table 11.2: Elementary Electrochemical Reaction Steps……………………………… 312
xvi
LIST OF SCHEMES
SCHEME PAGE
Scheme 1.1: Representation of an ozone collision with an air-water interface.......……… 3
Scheme 1.2: Representation of orientations of naphthalene at the air-water interface..….. 5
Scheme 1.3: Representation of SDS orientation at an air-water interface………………... 6
Scheme 3.1: Representation of the sonochemical PFOS transformation into its inorganic
constituents……………………………………………………………………………… 97
Scheme 3.2: Representation of sonolytic fluorointermediate decomposition…………... 98
Scheme 3.3: Representation of sonochemical C1-fluorointermediate reaction pathways. 99
Scheme 7.1: Catalytic cycle for iodide-mediated ozone oxidation of sulfite………….. 204
Scheme 8.1: Representation of iodide-mediated O3 oxidation of chloride and bromide. 221
Scheme 9.1: Schematic diagram of the electrochemical setup………………………… 239
Scheme 10.1: Composition and preparation procedure of BiOx-TiO2/Ti anode………. 273
Scheme 10.2: Proposed reaction pathway for electrochemical degradation of phenol... 273
Scheme 11.1: Representation of electrochemical reaction network…………………… 310

1
Chapter 1
Introduction and Summary
2
Introduction to Interfacial Chemistry
The general subject of this thesis is to investigate environmentally relevant reaction
mechanisms and kinetics at aqueous interfaces and to demonstrate that in many cases
heterogeneous chemistry may be just as, or more, important than homogeneous chemistry.
Chemical reaction models tend to focus on homogeneous chemistry, as the fraction of
total molecules associated with an interface is generally very small. However, there are
cases when interfacial processes should be taken into consideration, such as when mass
transfer between phases is rate-limiting and/or when reactions undergo surface catalysis.
Recent observations have shown that interfacial chemical reaction mechanisms and
kinetics are at variance with results from homogeneous systems.
Mass-transfer limitations can lead to interfacially dominated processes. The most
obvious case is that of reactions at gas-solid and liquid-solid interfaces, since diffusion
into amorphous and crystalline solids is negligible at standard temperatures and pressures.
Biphasic reactions are therefore limited to the interface between the gas or liquid and
solid. Similar mass-transfer limitations are active for gas-liquid interfaces. In particular,
the air-water interface has been the focus of many recent experimental and computational
studies. The distinct differences between gas-phase and aqueous-phase bulk properties
lead to strong chemical partitioning between phases. Thus, most chemical species will be
found predominantly either in the gas phase, such as nonpolar and large molecules, or in
the aqueous phase, such as ions and hydrogen-bond donors and/or acceptors.
Thermodynamically, the partitioning is mediated by a balance between the hydrogen
bonds lost when forming a water cavity for the solute and the added intermolecular
3
interactions between water and the solute. Some specific examples, with a focus on
aqueous aerosols, of gas-interface-water partitioning and their implications for interfacial
chemistry are given below.
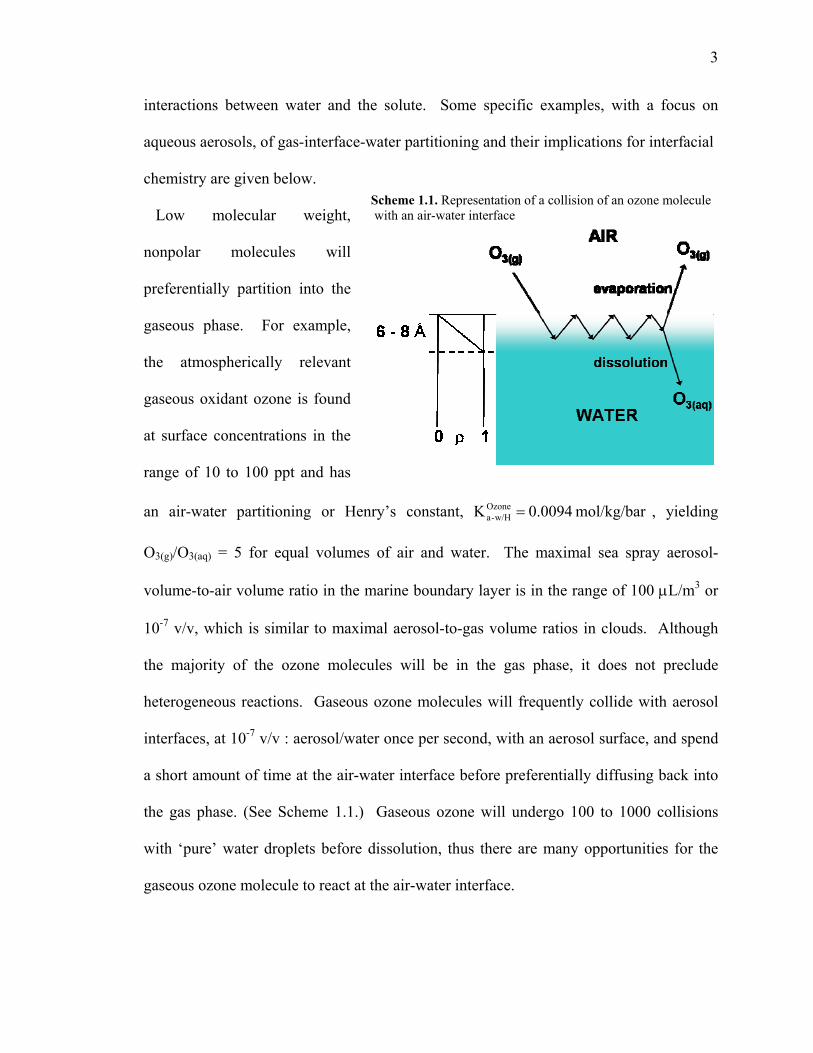
Low molecular weight,
nonpolar molecules will
preferentially partition into the
gaseous phase. For example,
the atmospherically relevant
gaseous oxidant ozone is found
at surface concentrations in the
range of 10 to 100 ppt and has
an air-water partitioning or Henry’s constant, , yielding
O
mol/kg/bar 0094.0KOzonew/H-a =
3(g)/O3(aq) = 5 for equal volumes of air and water. The maximal sea spray aerosol-
volume-to-air volume ratio in the marine boundary layer is in the range of 100 μL/m3 or
10-7 v/v, which is similar to maximal aerosol-to-gas volume ratios in clouds. Although
the majority of the ozone molecules will be in the gas phase, it does not preclude
heterogeneous reactions. Gaseous ozone molecules will frequently collide with aerosol
interfaces, at 10-7 v/v : aerosol/water once per second, with an aerosol surface, and spend
a short amount of time at the air-water interface before preferentially diffusing back into
the gas phase. (See Scheme 1.1.) Gaseous ozone will undergo 100 to 1000 collisions
with ‘pure’ water droplets before dissolution, thus there are many opportunities for the
gaseous ozone molecule to react at the air-water interface.
Scheme 1.1. Representation of a collision of an ozone molecule with an air-water interface

4
Mass-transfer effects are not only observed in transferring from air to water, but also in
transferring from water to air. Non-polar molecules that are either very high in molecular
weight or that also contain an ionic functional group will preferentially accumulate at the
air-water interface as the evaporation rate is limited by mass or hydration energy,
respectively. Assuming the interfacial layers are limited to monolayers, the surface
partitioning can be modeled with a Langmuir isotherm, eq. 1.1.
]X[K 1
]X[K)mol/m( X
eq
XeqX
MAX2X
+Γ=Γ (1.1)
XΓ is the surface concentration of x in moles/m2, is the maximum possible surface
concentration of x in moles/m
XMAXΓ
2, [X] is the bulk concentration of x, and is the bulk-
water to air-water interfacial partitioning coefficient in M
XeqK
-1. The air-water interface
partitioning effects will be relevant for bubbles and aerosols, both of which have been
examined in this thesis, where the surface-area-to-volume ratio is relatively large. Using
the aerosol example again, in Table 1.1, the aqueous aerosol radius required for more
Table 1.1. Langmuir isotherm parameters for a number of hydrocarbons and fluorocarbons Γmax (mol/m2) K (M-1) r (μm)
Acetate 8.5 x 10⁻⁶ 0.17 0.004 Hexanoate 6.3 x 10⁻⁶ 67 1.2 Decanoate 8.5 x 10⁻⁶ 2,000 43
Fulvic Acids 3.2 x 10⁻⁶ 1,200 11 Na-SDS 10 x 10-6 110 3.3 Na-SDS
(0.5 M NaCl) 3.7 x 10⁻⁶ 180,000 710
PFOS 5.0 x 10⁻⁶ 1870 28 PFHS 5.7 x 10⁻⁶ 160 2.7 PFBS 4.4 x 10⁻⁶ 40 0.53 PFOA 4.4 x 10⁻⁶ 360 4.7 PFHA 4.8 x 10⁻⁶ 76 1.0 PFBA 2.9 x 10⁻⁶ 32 0.42

5
than 99% of various organics at under surface saturation concentrations can be found at
the air-water interface vs. bulk water.
In the first half of Table 1.1, the droplet radius values for number of hydrocarbons are
listed. In all cases except acetate, at an aqueous droplet radius greater than 1 micron, the
organic will be predominantly found at the interface. As the average radius of marine
boundary layer droplets is 2 micron, most environmentally relevant marine organics (see
fulvics) will be associated with droplet interfaces. The results for sodium dodecyl sulfate
(SDS) are shown for both ‘pure’ water and typical marine ionic strengths (0.5 M). It is of
note that in the high ionic strength system, the ‘salting out’ effect increases the SDS air-
water interfacial partitioning coefficient by over three orders of magnitude. In the second
half of Table 1.1 is listed the Langmuir isotherm parameters for a series of perfluorinated
surfactants, which are the subject of a number of chapters of this thesis. It is of note that
perfluoroctanesulfonate (PFOS-, CF3(CF2)7SO3-) and perfluorooctanoate (PFOA,
CF3(CF2)6CO2-) have 8 and 7 hydrophobic tail carbons, respectively, yet both have
greater air-water-interface
partition coefficients as
compared to the hydrocarbon
SDS, which has 12 tail
carbons. PFOS has a similar
partitioning coefficient to
decanoate, which has 9 tail
carbons.
Scheme 1.2. Representation of perpendicular and parallel orientations of naphthalene at the air-water interface
6
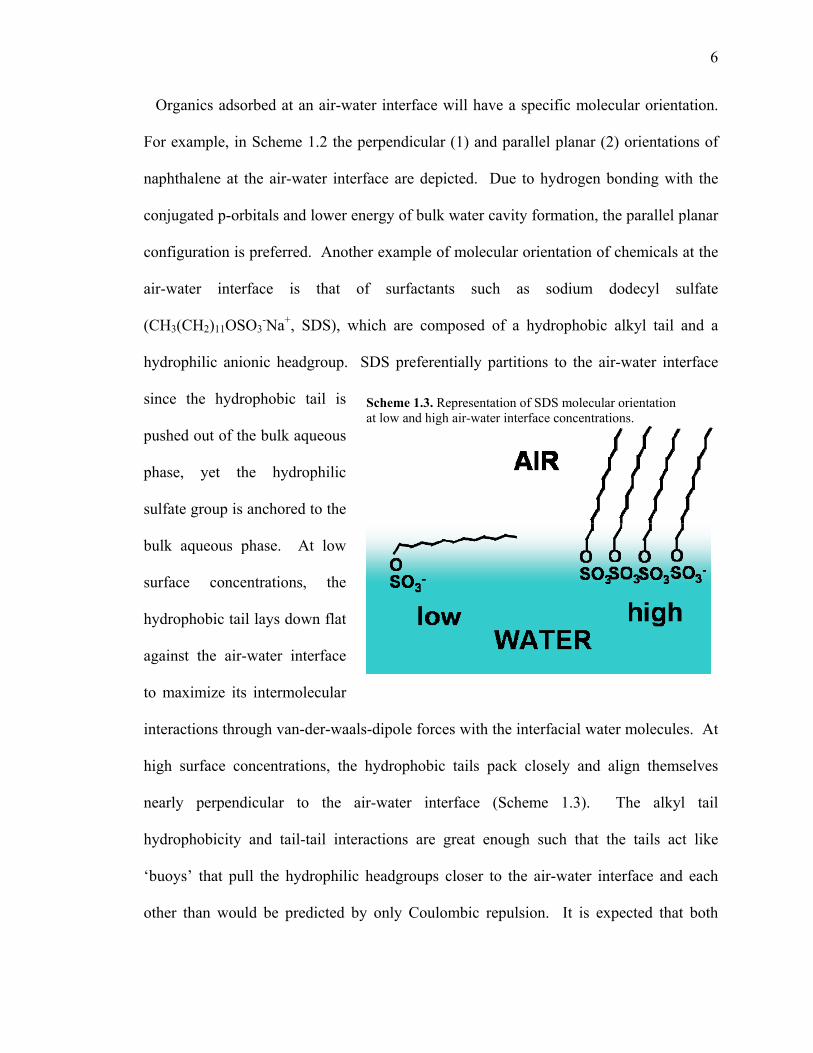
Organics adsorbed at an air-water interface will have a specific molecular orientation.
For example, in Scheme 1.2 the perpendicular (1) and parallel planar (2) orientations of
naphthalene at the air-water interface are depicted. Due to hydrogen bonding with the
conjugated p-orbitals and lower energy of bulk water cavity formation, the parallel planar
configuration is preferred. Another example of molecular orientation of chemicals at the
air-water interface is that of surfactants such as sodium dodecyl sulfate
(CH3(CH2)11OSO3-Na+, SDS), which are composed of a hydrophobic alkyl tail and a
hydrophilic anionic headgroup. SDS preferentially partitions to the air-water interface
since the hydrophobic tail is
pushed out of the bulk aqueous
phase, yet the hydrophilic
sulfate group is anchored to the
bulk aqueous phase. At low
surface concentrations, the
hydrophobic tail lays down flat
against the air-water interface
to maximize its intermolecular
interactions through van-der-waals-dipole forces with the interfacial water molecules. At
high surface concentrations, the hydrophobic tails pack closely and align themselves
nearly perpendicular to the air-water interface (Scheme 1.3). The alkyl tail
hydrophobicity and tail-tail interactions are great enough such that the tails act like
‘buoys’ that pull the hydrophilic headgroups closer to the air-water interface and each
other than would be predicted by only Coulombic repulsion. It is expected that both
Scheme 1.3. Representation of SDS molecular orientation at low and high air-water interface concentrations.

7
interfacial partitioning (mass transfer) and molecular orientation at the interface will to
some extent affect chemical mechanisms and kinetics, as compared to previously
determined bulk chemistry.
Mass transfer limitations act to limit homogeneous chemical kinetics, necessitating
chemistry at the interface between two phases. The partitioning of a particular chemical
is usually easy to experimentally measure or even calculate through simple
thermodynamic estimations. Thus, it is easy to answer the question of ‘where’ a reaction
is most likely to occur in terms of homogenously or heterogeneously. If the answer to
this question is an interface between two distinct phases, then questions follow, such as;
How do we predict the chemical mechanism and kinetics? How do we experimentally
investigate the interface of low site density as compared to the bulk phases? And so on.
Many of these questions have been answered for solid interfaces, where low instrumental
penetration depths can allow for surface specific analyses and diffusion in the bulk is
negligible. However, when dealing with the more fluid air-water interface, surface-
specific analyses become more difficult.
In this thesis, the kinetic and mechanistic relevance of interfacial aqueous chemistry to
the overall observed chemistry is evaluated for a number of environmentally relevant
systems. Reaction mechanisms and kinetics are investigated using time-dependent
reactant and product analyses of batch chemical reactions. The chemical reaction time-
dependencies are fit to kinetic models, which give insight into the plausible chemical
mechanisms. This procedure is applied to various initial reactor conditions such as
applied power, reactant speciation, reactant concentrations, etc., to make more in-depth
conclusions about the observed chemistry. In most cases, it is determined that the
8
aqueous interface chemistry dominates the overall reaction chemistry, primarily due to
mass transfer effects. In some cases, the interfacial mechanisms and kinetics are
determined to be unique as compared to previously determined homogeneous chemistry.
The detailed results of the thesis are briefly overviewed in the following section.
Thesis Overview
Chemical reactions at air-water and at water-solid interfaces were examined for three
environmentally relevant systems and are presented in the chapters in this order: 1)
sonochemical remediation of aqueous fluorochemicals, 2) gaseous ozone oxidation of
marine aerosol anions, and 3) electrochemical water-splitting for simultaneous hydrogen
production and organic oxidation. Sonochemical remediation of fluorochemicals (1)
involves the partitioning of fluorochemicals to the air-water interface of acoustically
cavitating bubbles where they are pyrolytically destroyed. The thesis examines how this
air-water interface partitioning mediates sonochemical transformation kinetics and how
the adsorption kinetics is affected by high-velocity bubble oscillations. Gaseous ozone
oxidation of marine aerosol species (2) is observed to primarily occur at the air-water
interface. The short-lived products and intermediates suggest that interfacial ozone
oxidation kinetics and mechanisms may be at variance with bulk aqueous chemistry.
Electrochemical water splitting for hydrogen production using organic waste as a
sacrificial electron donor (3) involves reactions at water-metal and water-semiconductor
interfaces. Sections of most of the subsequent chapters have been published as scientific
papers in journals such as the Journal of Physical Chemistry and Chemical Physics
Letters.
9
Remediation of aqueous fluorochemicals and in particular PFOS and PFOA is the
subject of Chapters 2 to 5. The chapters are results from a project that was funded by 3M,
who used fluorochemicals in their formulations of stain-resistant coatings. My role in
this project, was as scientific lead in determining the direction and objectives of the
project and primary contact with 3M. I was the editor of all scientific papers (Chapter 2
will be submitted to ES&T, Chapters 3 to 5 are in press, a paper first-authored by
graduate student Jie Cheng is in press, and at least eight more papers will be submitted
for peer review in the near future). I also developed and maintained the primary
analytical technique, HPLC-MS, used to analyze all fluorochemicals in question. Iwill
now briefly review the subject of each chapter.
Chapter 2 is a review of the methods reported for the remediation of aqueous PFOS and
PFOA. It is divided into removal, reductive, oxidative, and thermal methods, with the
most promising degradation methods evaluated in terms of products, reaction kinetics,
competition effects, and energy consumption. The most efficient destruction methods
(persulfate photolysis, iodide photolysis, direct photolysis, sonolysis) still require at least
10,000,000 kJ/mol to transform PFOS and PFOA into their inorganic constituents, which
is 3 to 4 orders of magnitude greater than the energy required to synthesize PFOS and
PFOA electrochemically.
Chapter 3 investigates the sonochemical transformation of PFOS and PFOA into their
mineralization products or inorganic constituents through time-dependent product
analyses and kinetic estimations. The initial rate-determining step is determined to
involve pyrolytic cleavage of the ionic headgroup at the acoustically cavitating bubble-
water interface. The neutral, fluorochemical product partitions to the transiently
10
cavitating bubble vapor where temperatures can near 4000 K. The neutral,
fluorochemical intermediate is quickly transformed into CO, CO2, and HF through a
series of pyrolytic, oxidative, and reductive pathways. HF will hydrolyze to a proton and
fluoride. PFOS and PFOA mineralization kinetics were determined to be similar to initial
PFOS and PFOA sonochemical decomposition kinetics, thus precluding the formation of
any toxic intermediates.
Chapter 4 examines the adsorption of PFOS and PFOA to acoustically cavitating
bubbles. The absolute sonochemical rate dependence on the initial PFOS/PFOA
concentration was fit to the Langmuir-Hinshelwood model using empirically determined
rate maximums. The air-water interfacial partitioning coefficient determined from the
observed sonochemical kinetics was at variance with the equilibrium partitioning
coefficient determined from surface tension measurements. This lead to the conclusion
that when the bubble interface is lightly populated with PFOS and PFOA, the adsorption
is sonochemically mediated due to high velocity radial bubble oscillations being much
faster than bulk diffusion.
Chapter 5 investigates the decomposition kinetics and products of PFOS, PFOA, and
shorter-chain fluorochemicals (C6 and C4) by aqueous electrons. Aqueous electrons are
generated by UV photolysis of iodide and are observed to react with PFOS faster than
PFOA in batch reactions. The perfluoroalkylsulfonates (PFAS) are observed to have
prominent chain-length effects, whereas the perfluoroalkylcarboxylates (PFAC) had no
such effects. The PFAS chain length affected the extent of defluorination (e.g., the
number of fluorides produced was approximately the number of tail carbons), in contrast,
all of the PFACs proceeded through 1 to 2 defluorinations. As PFAS chain-length
11
decreased, so did the initial PFAS reduction kinetics. In contrast, PFAC chain length had
no effect on reduction kinetics. Gaseous PFAS and PFAC reduction products were
consistent with extent of defluorination.
The chemistry of aqueous, aerosol anions is the subject of Chapters 6 to 9. This was
the first project I worked on in the Hoffmann Lab and the initial objective was quite
different than the now published scientific papers. Experimental kinetic isotope effects
and kinetic simulations of peroxone (ozone + hydrogen peroxide) chemistry suggested
that the primary branching pathway of O3-H2O2 reaction yielded H2O3. I developed an
electrospray-mass-spectrometry-based (ES-MS) technique to monitor the products of this
reaction on relatively short timescales, 1 to 10 ms. The ozone-ES-MS reactor can be
thought of as a gas-aerosol stopped-flow reactor. The electrospray chamber was
modified such that a Teflon ozone tube was brought into the chamber and held in place
by a Teflon piece attached to the nebulizer needle, which only minimally affected the MS
sensitivity. Although I have stated this work in a single sentence, the modification and
optimization of the ozone-ES-MS system took nearly a year and a half. At [H2O2] > 100
mM, H2O2 could be detected mass spectrometrically as a positive cluster on the form
(H2O)m(H2O2)nNa+. Initially, we believed we had detected H2O3 as a reaction product;
however, it was an artifact of the ozone generator. Although the initial project did not
come to fruition, the developed ozone-ES-MS system has now been utilized for
examination of a number of gaseous oxidant-aqueous aerosol reactions.
After a seminar in Atmospheric Chemistry II where I suggested the developed system
could be utilized for research into reactions specific to the air-water interface, graduate
student Jie Cheng and I completed the initial ozone-ES-MS experiments on the gaseous
12
ozone oxidation of aqueous iodide, which yielded some very interesting results. Since
then the ozone-ES-MS system has been used to study reactions of gaseous ozone with
sulfite, thiosulfate, iodide, ascorbic acid, tocopherol, and various combinations of these
aqueous species, as well as to study reactions of gaseous NO2 with various anions.
Results have given insight into the importance of the air-water interface to aerosol
reactions with low solubility gaseous oxidants and how the air-water interface affects
chemical mechanisms and kinetics as compared to bulk aqueous or gaseous chemistry.
There are some questions about the applicability of the results to real situations, as the
reactions take place under a large electric field (> kV/cm).
As a result of developing the ozone-ES-MS system, researching the pertinent
experiments (particularly those involving ozone and iodide), and teaching others how to
operate and maintain the system, I was co-author on four scientific papers, three of which
are included in this thesis. The first examined anion fractionation during the electrospray
of aqueous anions (Cheng J.; Vecitis, C. D.; Colussi, A. J.; Hoffmann, M. R. J. Phys.
Chem. B, 2006, 110, 25598.) and is not included in this thesis. It was observed that when
equimolar anions were electrosprayed, the relative fractionation, as determined by
relative mass spectrometric signal intensity, was correlated to anion radius or hydration
energy and followed the Hofmeister series.
The second published scientific paper, Chapter 9, investigated the iodide-mediated
gaseous ozone oxidation of bromide and chloride in aqueous aerosols. Aerosolic iodide
reacts at diffusion-controlled rates with gaseous ozone to yield triiodide, I3-, and iodate,
IO3-. Bromide and chloride are kinetically unreactive towards ozone alone; however, in
the presence of iodide, dibromoiodide (IBr2-), and dichloroiodide, (ICl2
-), are detected as

13
reaction products, respectively. This suggests that iodide can mediate the gaseous ozone
oxidation of aerosolic bromide and chloride, likely through the production of the
promiscuous hypoiodous acid, HOI, which oxidizes most species at diffusion-controlled
rates. These reactions could possibly yield gaseous species such as ICl, IBr, Br2, and Cl2.
Τhese species would be quickly photolyzed (τ1/2 ~ 1 to 2 min) in the atmosphere, yielding
halogen radicals that could contribute to catalytic ozone destruction cycles, which are of
importance to arctic ozone depletion events during polar sunrise, and general
tropospheric ozone levels.
Chapters 7 and 8 encompass reactions of aqueous aerosolic thiosulfate (S2O32-) and
sulfite (SO32-) with gaseous ozone with and without iodide. The results of both are
similar in many respects. Kinetic modeling of gaseous ozone oxidation of both S2O32-
and SO32- suggests that the reaction predominantly (> 90%) occurs at the air-water
interface. In both cases, intermediates containing I-S bonds are directly detected for the
first time, indicating that an iodine-containing intermediate, likely HOI, can quickly
oxidize both S2O32- and SO3
2-. This result is similar to that of Br- and Cl-, suggesting a
‘universal’ iodide-mediated oxidation pathway via the hypoiodous acid (HOI)
intermediate. In both cases, results from competition experiments suggest that either the
interfacial ozone reaction with S2O32- and SO3
2- is enhanced vs. the bulk reaction or that
interfacial ozone reaction with I- is reduced, with the former being more likely than the
latter since the bulk aqueous kinetics underestimate the measured product intensity from
O3(g) + I-(aer) experiments. Overall these experiments display the importance of the air-
water interface as a reaction ‘zone’ for chemistry between marine aerosols and gaseous
oxidants such as ozone.
14
The final three chapters, 9 to 11, of this thesis focus on the hybridized electrochemical
system for the production of hydrogen (H2) and simultaneous degradation of organic
pollutants. I worked on this project during my last few years at Caltech in collaboration
with Dr. Hyunwoong Park. My role in the project was to develop analytical techniques
and procedures (realtime EI-MS for monitoring gas products and HPLC-UV for analysis
of phenol and phenol derivatives), manuscript editing, and discussion of results. The
water-solid (metal-cathode, metal-oxide-anode) interface is vital, since all of the observed
electrochemistry will initiate at these interfaces. Electron transfer activation barriers
across the water-solid interface will mediate the energy required to drive observed
chemistry. Energetic losses will occur if the oxidants produced at the metal oxide surface
subsequently yield lower potential homogeneous oxidants (e.g., ≡Ti-OH· (E0 = 2.7 V)
Cl2·- (E0 = 2.0 V) ) or homogenous oxidants are quenched at the cathodic surface (e.g.,
Cl2·- + e- 2 Cl-).
Chapter 9 serves as a brief introduction to the idea of hybridizing alternative energy
production with wastewater treatment. Electrolytic hydrogen (H2) production is less
economically viable than battery storage due to energetic losses during electrolytic H2
production and its transformation back to electrical energy. By hybridizing electrolytic
H2 production with wastewater treatment, some of these losses will be negated by
cleansing the water. An electrochemical system composed of a stainless steel cathode for
H2 production and a Bi-doped TiO2 anode for oxidant production is presented. Results
show that the hybrid system has H2 production energy efficiencies (30% to 70%) that
compete with commercial electrolyzers (50% to 75%), which operate under more
extreme conditions (50 mM NaCl, 6 < pH < 11, 1 atm vs. 1 M NaOH, pH > 13, 20 atm).
15
It is shown that the system can degrade a number of common organic pollutants such as
phenols and small acids. The electrochemical system can also be driven by a
photovoltaic cell. Chapter 10 elaborates on the results of Chapter 9. The effects of
variations in electrochemical cell current, voltage, and power, and initial phenol
concentration on the H2 and O2 production rates, and current and energy efficiencies was
investigated. Time-dependent electrolysis measurements of phenol, phenol oxidation
intermediates, pH, total organic carbon (TOC), and mineralization products (CO2) were
also made. Maximum cathodic H2 production current efficiencies were near 60% without
phenol, near 70% with phenol with NaCl as background electrolyte, and reached 95%
using Na2SO4 as background electrolyte. Anodic current efficiencies ranged from 3% to
17% depending on specific conditions. The hybrid system was shown to be applicable
for the degradation of a range of organics, and it was also observed that upon addition of
organic with NaCl as an electrolyte, the cathodic current efficiency increased.
Chapter 11 further investigates the primary oxidant in the electrochemical system and
how this oxidant is involved in the observed enhancement in cathodic (H2) current
efficiencies upon addition of organics. The phenol electrolytic oxidation intermediates
all contain chlorine, with the extent of chlorine increasing with time, indicating a
chlorine-based oxidant. The degradation kinetics of a number of phenol derivatives was
determined through time-dependent measurements and were plotted against known rate
constants for a number of possible oxidants, such as ·OH, Cl2·-, Cl·, and HOCl. Only
known Cl2·- second-order rate constants correlated with the observed rate constants,
indicating it was the primary oxidant. When no organics are present, it is postulated that
Cl2·- can act as an electron shuttle and accept electrons at the cathode, thus reducing the
16
H2 production current efficiency. Thus, when organics are present and consume Cl2·-, its
effect as an electron shuttle is reduced and the H2 current efficiency subsequently
increases.
Through the various areas of study in this thesis, aqueous interfaces are shown to be
highly relevant to the chemistry observed. In many cases, the overall rate-limiting step of
a chemical reaction series involves an interfacial chemical transformation, which
subsequently leads to relatively fast homogeneous chemical kinetics in the liquid or gas
phase. Phase transfer limitations of reactive species or mass transfer of species to the
most reactive phase is the simplest explanation for interfacial rate determining steps.
However, the more difficult question to answer is how these interfacial processes differ
mechanistically and kinetically from their homogeneous analogs. Therefore, the
cumulative research compiled in this thesis indicates that chemical reactions at aqueous
interfaces are an important aspect of many environmentally relevant processes and that
much more research is required to fully understand chemical processes occurring at
aqueous interfaces.
17
Chapter 2
Treatment Technologies for Aqueous
Perfluorooctanesulfonate (PFOS) and
Perfluorooctanoate (PFOA)
18
Abstract
Fluorochemicals (FCs) are oxidatively recalcitrant and thus environmentally persistent
and resistant to most conventional treatment technologies. FCs have unique
physiochemical properties derived from fluorine being the most electronegative of
elements. Recent concern has grown over the FCs perfluorooctanesulfonate (PFOS) and
perfluorooctanoate (PFOA), as they have been detected globally in the hydrosphere,
atmosphere, and biosphere. Halting further fluorochemical release into the environment
will require improved containment during application and manufacturing processes and
remediation of the primary sources such as manufacturing waste. Removal technologies
such as reverse osmosis, nanofiltration, and activated carbon can remove FCs from water.
Incineration of the concentrated waste is required for complete fluorochemical
destruction. Recently, a number of alternative technologies for on-site FC decomposition
have been reported. The fluorochemical degradation technologies span a range of
chemical processes including direct photolysis, photocatalytic oxidation, photochemical
oxidation, photochemical reduction, thermally induced reduction, and sonochemical
pyrolysis. We review these FC degradation technologies in terms of kinetics,
mechanism, energetic cost, and applicability. The optimal PFOS/PFOA remediation
method is strongly dependent upon the initial FC concentration, background organic and
metal concentration, and available degradation time.
19
Introduction
Fluorochemicals (FCs) have a wide variety of applications such as inert, nonstick
polymers (e.g., telfon), water- and stain- proof coatings for paper and textiles (e.g.,
Scotchguard), oxidative protective coatings on metals, inert surfactants for semi-
conductor etching, aqueous film forming foams (AFFFs), and thermally stable lubricants.
The diverse FC applications are due to the unique physiochemical properties1-3 gained
upon replacing the majority of the hydrogens in an organic with fluorines. Organic poly-,
and moreso, per-, fluorination yields a more thermally stable (i.e., C2H5-H 101 kcal/mol
vs. C2F5-F 127 kcal/mol, and CF3-CF3 99 kcal/mol vs. CH3-CH3 89 kcal/mol), a more
oxidatively resistant (i.e., F + e F-, E0 = 3.6 V)4, and a weakly polarizable (i.e., αPFOS
= 3.2 Å3 vs. αSDS = 12.4 Å3)5 organic. The thermal and oxidative resistance from
fluorination makes fluorochemicals useful for extreme applications such as high-
temperature lubricants and AFFFs. The relatively low perfluorochemical polarizability
makes fluorochemicals useful for non-stick, protective coatings.
The physiochemical properties of fluorochemicals make them difficult to treat using
most conventional remediation strategies6-8. Perfluorochemicals (PFCs), organics with
all of their hydrogens replaced by fluorines, are particularily recalcitrant and
environmentally persistent. For example, atmospheric lifetimes of perfluorinated gases
have been estimated to be > 1000 years.9 Recently, concern has increased over the
environmental impact of perfluorinated surfactants such as perfluorooctanoate (PFOA)
and perfluorooctanesulfonate (PFOS), or PFOX where (X = S or A). Perfluorinated
surfactants have a perfluorinated carbon tail, which preferentially partitions out of the
aqueous phase, and an ionic headgroup, which preferentially partitions in to the aqueous
phase. Due to their biphasic or surfactant nature, they tend to accumulate at the air-water
20
interface10-13. PFOX has been observed to primarily accumulate in the hydrosphere14-34
and the biosphere22,24,35-59. PFOX is released to the environment primarily during
manufacturing and coating processes60, as well as from use of FC-based products61-65.
PFOX can be indirectly created via atmospheric66-68, aquatic69, or biologic
transformation70-74 of fluorotelomer alcohols75 and fluoroalkylsulfonamides76,77. Recent
data suggests the phasing-out of the production of PFOS and PFOA in 2000 by 3M78 and
later by DuPont has reduced their proliferation in the environment53,66,77,79. It has been
recently shown that landfill leachate from primary fluorochemical disposal sites may also
be a source of PFCs tin the environment80, which is currently treated with granular
activated carbon post-WWTP.
The very dilute (i.e., ppt or pM) hydrosphere concentrations of PFOS and PFOA make
remediation of the perfluorinated surfactants previously released to and distributed in the
environment difficult using most conventional technologies81. The onsite control of the
primary FC discharges from their primary source (i.e., concentrated manufacturing
effluents) is a more viable approach. A number of fluorochemical, specifically PFOS and
PFOA, treatment technologies have been evaluated in the literature. Granular activated
carbon has been shown to be effective at removing PFOA and PFOS at ppb levels from
relatively clean water (i.e., post-WWTP)6,82 and is utilized today. The activated carbon
must then be incinerated83 to destroy the adsorbed fluorosurfactants. A fraction of the
fluorochemicals entering the WWTP will adsorb to the sludge7,84,85 where anaerobic
digestion has a minimal effect on their concentration86. The digested sludge may
subsequently be disposed of in a landfill, allowing the adsorbed fluorochemicals to be re-
released into the environment.
21
Most conventional degradation technologies are ineffective for the in situ degradation
of aqueous PFOS and PFOA, since they are inherently recalcitrant to chemical and
microbiological treatment7,8,86–89. Advanced oxidation processes (AOPs)90, which utilize
the hydroxyl radical,—such as alkaline ozonation, peroxone (i.e., a mixture of O3 and
H2O2), or Fenton’s reagent (i.e., H2O2 and Fe2+ salts)—have been shown to be relatively
ineffective for PFOA and PFOS destruction91–93. A number of photolytic methods, such
as direct photolysis93–99, persulfate photolysis94,100–102, alkaline isopropanol photolysis99
,and photocatalysis93,103–107 have shown varying degrees of efficacy on higher
concentrations of perfluorocarboxylates. Reduction by elemental iron under near super-
critical water conditions has been shown to be possible for PFOS degradation. Ultrasonic
irradiation of aqueous solutions of PFOS and PFOA92 has been observed to degrade these
compounds. Recently it has been reported that PFOS and PFOA are completely
mineralized during this process108 and that sonolysis can be used effectively for
environmentally relevant concentrations and matrices.
We will now overview these techniques in more detail in terms of their viability to
remediate and degrade aqueous PFOS and PFOA. These techniques will be reviewed in
terms of their reaction conditions, degradation kinetics, degradation products and energy
requirements. The techniques will be initially divided into four treatment groups:
conventional, oxidative, reductive, and thermal. It is likely that the optimal treatment
technology will be highly dependent on initial PFOX concentration (i.e., high for
manufacturing waste or low for environmental distribution) and the matrix in question.
Tertiary Water Treatment
Conventional wastewater treatment techniques109, such as trickling filtration, activated
sludge, anaerobic digestion, and chlorination have been reported to have little effect on
22
PFOA and PFOS mass flows (i.e, [PFOX]WWTP,influent ≈ [PFOX]WWTP,effluent7,8,80,110,111).
Microbial communities can not metabolize PFOS and PFOA86–89. In some cases, PFOS
and PFOA concentrations were greater in the WWTP effluent as compared to the
influent7,8 which suggest microbial transformation7,8,111 of fluorosulfonamides such as
FOSE and FOSA to PFOS70–73,110and fluorotelomer alcohols to PFOA112, or the release of
residual PFOX from disposed products110. Incineration113 of sludge containing PFCs84,111
is effective for the complete destruction of fluorochemicals and fluoropolymers. Tertiary
water treatment technologies such as granular activated carbon (GAC)6, ion-exchange82,
and reverse osmosis114,115 have been shown to be effective in removing PFOS from
water. GAC6,80 is currently utilized to remove PFCs from WWTP effluent and effectively
removes > 90% of PFOS and PFOA. PFOX equilibrium adsorption to various surfaces is
lower than observed for organics of similar molecular weight116,117. The adsorption
process is observed to be kinetically slow116. Isopropanol as a co-solvent was shown to
have a deleterious effect on reverse osmosis for the removal of PFOS114. In all tertiary
treatment cases, a subsequent destruction step such as incineration is required for
complete perfluorochemical remediation.
PFOX Oxidation
Perfluorinated chemicals such as PFOS and PFOA are recalcitrant towards oxidation
due to the complete substitution of fluorine (C-F bond) for hydrogen (C-H bond).
Fluorine is the most electronegative of elements and will retain its electrons (i.e., will
resist oxidation) at all cost. Fluorine is nearly always found in the (-1) oxidation state
with the only exception being F2 where its oxidation state is (0). The fluorine atom is the
most powerful inorganic oxidant known, with a reduction potential of 3.6 V (eq. 2.1)4
23
and thus it is thermodynamically unfavorable to create the fluorine atom with any other
one-electron oxidant.
F· + e- → F- (E0 = 3.6 V) (2.1)
Perfluorination will also reduce the oxidizability of the ionic headgroup (-SO3- for PFOS
and -CO2- for PFOA) since it inductively reduces headgroup electron density. Thus
PFOX are quite resistant to oxidation as compared with their alkyl analogs.
Advanced Oxidation Processes—Oxygen-Containing Radicals
For particularily recalcitrant organics, advanced oxidation processes which utilize the
hydroxyl radical, ozone, or O-atom are a viable solution90,118–120. Hydroxyl radical can
be generated through hydrogen peroxide photolysis121, ozonation122,123, photo-
Fenton’s124, sonolysis125, and peroxone chemistry126. A hydroxyl radical normally reacts
with saturated organics through an H-atom abstraction to form water (eq. 2.2) and will
react with unsaturated organics primarily via an addition reaction. The hydroxyl radical
reacts with most aliphatic and aromatic organics at near diffusion-controlled rates127. At
environmentally relevant pHs, PFOS and PFOA contain no hydrogens to abstract, thus
the hydroxyl radical must act through a direct electron transfer to form the less
thermodynamically favored hydroxyl ion (eq. 2.3).
HO· + e- → H2O (E0 = 2.7 V) (2.2)
HO· + e- → HO- (E0 = 1.9 V) (2.3)
Thus the perfluorination or substitution of all of the organic hydrogens for fluorines in
PFOS and PFOA renders these compounds inert to advanced oxidation techniques91. The
addition of H2O2 is detrimental to the photolytic degradation of PFOA by competitively
adsorbing photons93. An upper limit for the second-order rate of HO⋅ + PFOA has been
estimated to be kHO⋅ + PFOA ≤ 105 M-1 s-1; multiple orders of magnitude slower than the

24
reaction of hydroxyl radical with most hydrocarbons127. The futility of conventional
advanced oxidation for the degradation of PFOS and PFOA is noted in the use of
perfluorinated compounds to enhance advanced oxidation of other organics. PFOS is
used as an additive to increase aqueous solubility of PAHs128,129, enhancing their
degradation by UV-H2O2. PFOS has also been utilized as a TiO2 surface coating to
increase adsorption of PCBs130 and chlorinated aromatics106, leading to enhanced
oxidation rates. Biphasic water-perfluorocarbon systems have been utilized to increase
organic ozonation rates131 by increasing dissolved ozone concentrations. Convential
advanced oxidation methods utilizing oxygen-based radicals are not practical methods for
the decomposition of perfluorochemicals.
Persulfate Photolysis—Sulfate Radical Oxidation
Persulfate photolysis has been utilized for the oxidative degradation of a number of
organics132–136. Persulfate photolysis137 or thermolysis138 generates two sulfate radicals,
SO4⋅-, (eq. 2.4). The sulfate radical is an oxidizing radical that reacts by a direct one-
electron transfer to form sulfate (eq. 2.5). The sulfate radical has a one-electron
reduction potential of 2.3 V4, making it a stronger direct electron transfer oxidant than the
hydroxyl radical.
S2O82- + hν (< 270 nm) / ∆ → 2 SO4·- (2.4)
SO4·- + e- → SO42- (E0 = 2.3 V) (2.5)
Persulfate photolysis has been utilized to degrade a number of perfluoroalkylcarboxylates
of various chain length94,100–102. PFOA degradation by sulfate radical oxidation has
achieved minimum half-lives on the order of 1 hour, with fluoride accounting for 15% of
the total fluorine over the same period of time ([PFOA]i = 1.35 mM, [S2O82-] = 50 mM,

25
9000 W L-1, Xe-Hg lamp, 4.7 atm O2)94,100. The percent of total fluorine as fluoride can
be used as a measure of PFOA mineralization.
A reaction mechanism for the sulfate radical mediated degradation of
perfluoroalkylcarboxylates was proposed by Kutsuna and Hori102. The initial
degradation is postulated to occur through an electron transfer from the carboxylate
terminal group to the sulfate radical (eq. 2.6). The oxidized PFOA subsequently
decarboxylates to form a perfluoroheptyl radical (eq. 2.7), which reacts quantitatively
with molecular oxygen to form a perfluoroheptylperoxy radical (eq. 2.8). The
perfluoroheptylperoxy radical will react with another perfluoroheptylperoxy radical in
solution, since there are no reductants present to yield two perfluoroalkoxy radicals and
molecular oxygen (eq. 2.9). The perfluoroheptyloxy has two branching pathways:
unimolecular decomposition to yield the perfluorohexyl radical and carbonyl fluoride
(eq. 2.10), or an H-atom abstraction from an acid such as HSO4- to yield
perfluoroheptanol (eq. 2.12). The perfluorohexyl radical formed in eq. 10 will react with
O2 (eq. 2.9) and resume the radical ‘unzipping’ cycle. The COF2 will hydrolyze to yield
CO2 and two HF (eq. 2.11). The perfluoroheptanol from eq. 2.12 will unimolecularily
decompose to give the perfluoroheptylacyl fluoride and HF (eq. 2.13). Perfluoroheptyl
acyl fluoride will hydrolyze to yield perfluoroheptanoate (eq. 2.14).
CF3(CF2)6COO- + SO4·- → CF3(CF2)6COO· + SO42- (2.6)
CF3(CF2)6COO· → CF3(CF2)5CF2· + CO2 (2.7)
CF3(CF2)5CF2· + O2 → CF3(CF2)5CF2OO· (2.8)
CF3(CF2)5CF2OO· + RFOO· → CF3(CF2)5CF2O· + RFO· + O2 (2.9)
CF3(CF2)5CF2O· → CF3(CF2)4CF2· + COF2 (2.10)
COF2 + H2O → CO2 + 2 HF (2.11)
26
CF3(CF2)5CF2O· + HSO4
- → CF3(CF2)5CF2OH + SO4·- (2.12)
CF3(CF2)5CF2OH → CF3(CF2)5COF + HF (2.13)
CF3(CF2)5COF + H2O → CF3(CF2)5COO- + HF + H+ (2.14)
During photolysis, Kutsuna and Hori observed the pH decrease to < 3, due to HF
production making eq. 2.12 the major branching pathway (75%). The shorter chain
carboxylates produced will be just as recalcitrant as PFOA.
Persulfate photolysis in liquid carbon dioxide/water mixtures101 has been reported to be
a good medium for the degradation of longer chain carboxylic acids normally insoluble in
water. Through kinetic modeling of batch reactions, the second-order rate constants of
the sulfate radical with various chain-length perfluorocarboxylates have been determined
to be on the order of 104 M-1 s-1 102, consistent with a flash photolysis study139 which
measured sulfate radical reaction with trifluoroacetate to be 1.6 x 10⁴ M-1 s-1. A
relatively slow rate when compared to second-order rates of the sulfate radical with
hydrocarbons; short-chain alcohols and carboxylic acids are at the lower end with
reaction rates on the order of 106 M-1 s-1 and aromatic organics are at the upper end with
reaction rates being diffusion controlled, 109-1010 M-1 s-1 140. The presence of any other
dissolved organic species with aqueous PFOA will competitively inhibit degradation.
Persulfate photolysis would be a practical technique for the degradation of ‘pure’
aqueous PFOA. When other organics are present, significant PFOA degradation will only
occur when the PFOA concentration greatly exceeds the total organic concentration
([PFOA]/[Org]total > 100). Persulfate photolysis under the previously stated conditions
would be a viable decomposition method for perfluoroalkylcarboxylates of all chain
lengths, since they have similar second-order kinetics with the sulfate radical102.
27
Direct UV Photolysis
Photolysis is chemical bond-breaking driven by light. UV-Vis light adsorption yields
an electronically excited molecule. An electronically excited molecule has a bonding
(molecular) or non-bonding (atomic) electron promoted to an anti-bonding orbital. An
electronically excited molecule is more susceptible to chemical reaction and may open
new chemical reaction pathways unavailable to the ground state species. Terrestrial
solar-driven photolytic processes require utilization of 290–600 nm photons, due to
atmospheric absorption of higher energy light. Organics with large chromophores can be
directly photolyzed by solar irradiation141,142. Simulated sunlight applied to aqueous
solutions of PFOS97, PFOA98, and N-EtFOSE143 for 30 days had no effect on their
concentration ([FC]i = 100 μM, λ = 290-600 nm, 10 W, 5 W/L). The 8:2 fluorotelomer
alcohol did not significantly degrade under direct photolysis144.
Ultraviolet-C (UV-C, λ < 300 nm) and vacuum ultraviolet (VUV, λ < 200 nm) have
been utilized for a number of disinfection and advanced oxidation processes90. UV-C,
generated by a black or germicidal lamp (λ = 250±10 nm), is primarily used for indirect
photolyses (e.g., persulfate photolysis), disinfection, and in some cases direct
photolysis145. VUV irradiation is of high enough energy to photodissociate water into an
H-atom and HO⋅ (eq. 2.15) with a quantum yield of 0.3 at 185 nm146,147.
H2O + hν (λ < 200 nm) → H⋅ + HO⋅ (2.15)
VUV has a very short liquid penetration depth (< 100 μm) due to the strong adsorption
by water yielding a strongly oxidizing region near the lamp surface. Organic degradation
during VUV photolysis is primarily via HO oxidation148–150. Hori et al.93 reported on the
photolytic degradation of PFOA which occurred with a half-life of 24 hrs ([PFOA]i =
28
1.35 mM, 200 W Xe-Hg lamp, 22 mL, 4.8 atm O2). The primary photoproducts were
shorter chain carboxylic acids with fluoride accounting for 15% of the decomposed
PFOA fluorine after 24 hours. Aqueous PFOA VUV photolysis94,151 proceeds at a faster
rate, having a photolysis half-life of 90 minutes ([PFOA]i = 100 μM, λ = 254 nm w/
minor 185 nm, 15 W, 800 mL, pH 3.7, 40 oC, N2) with fluoride accounting for 12% of the
degraded PFOA fluorine. The gas-phase VUV photolysis of trifluoroacetic acid yields
CO2, CF3, and H-atom as predominant photoproducts (eq. 2.16)152. Aqueous PFOA will
be dissociated into its ion products at pH 3.7, and direct photolysis will be of the PFOA
anion (eq. 2.17), which may unimolecularily decompose to a perfluoro alkyl anion, CO2
and an aqueous electron which will protonate under the experimental conditions (eq.
2.18).
CF3COOH + hν (λ = 172 nm) → CF3COOH* → CF3⋅ + CO2 + H⋅ (2.16)
CF3(CF2)6COO- + hν (λ < 220 nm) → CF3(CF2)6COO-* (2.17)
CF3(CF2)6COO-* + H+ → CF3(CF2)6⋅ + CO2 + H⋅ (2.18)
The hydroxyl radical concentration in the region near the VUV lamp surface may be
great enough to also lead to PFOA oxidation and perfluoroalkyl radical formation. Since
the photolysis conditions are anoxic (i.e., N2 atmosphere) the perfluoroalkylradical will
react at diffusion-controlled rates with HO produced via water photolysis to form the
perfluoroalkyl alcohol (eq. 2.19).
CF3(CF2)6⋅ + HO⋅ → CF3(CF2)6OH (2.19)
The overall degradation mechanism will occur through similar reactions, as seen in
persulfate photolysis (eqs. 2.7–2.14), to yield a perfluoroalkyl carboxylate (PFAC) one -
CF2- unit shorter than the initial species. The produced PFAC will undergo photolysis
until the perfluorinated tail is completely unzipped. PFOS photolytic degradation has
29
also been reported99 and has a slower photolysis rate, half-life of 5.3 days, than PFOA
under similar conditions ([PFOS]i = 40 μM, λ = 254 nm, 32 W, 750 mL, 36–that 40 oC,
N2). Shorter chain perfluorocarboxylates and perfluoroalkyl alcohols were detected as
reaction intermediates. After 50% of the PFOS is decomposed, fluoride accounts for
59% of the decomposed PFOS fluorine. The greater fluoride mass balance than observed
with PFOA is likely due to faster photolysis rates of the PFAC intermediates than of the
initial PFOS. Direct photolysis of PFOS and PFOA will be negligible under
environmental conditions. Higher energy UV and VUV photolysis can degrade PFOX.
Competitive UV light absorption by solvent and other matrix components will limit
photolysis rates.
Phosphotungstic Acid Photocatalysis
Phosphotungstic acid, H3PW12O40, is a heteropolyacid or polyoxometalate that has been
utilized for photocatalytic degradation of contaminants153,154 and as an electron shuttle155–
157. PW12O403- is the predominant form when pH < 2 and absorbs light with λ < 390 nm.
Upon light adsorption, PW12O403- enters a photo-excited state enhancing its oxidation
strength (eq. 2.20).
PW12O403- + hν (< 390 nm) → PW12O40
3-* (2.20)
PFOA93, PFPA104, and TFA158 have been reported to be decomposed by H3PW12O40
photocatalysis. PFOA has half-life of 24 hours during phosphotungstic acid photolysis
([PFOA]i = 1.35 mM, [H3PW12O40] = 6.7 mM, pH < 2, 9000 W L-1, Xe-Hg lamp, 4.8 atm
O2). After 24 hours of photolysis when 50% of the PFOA is degraded, fluoride accounts
for 20% of the total fluorine. The extent of fluoride production is similar to that observed
during persulfate photolysis, suggesting a similar degradation mechanism where the
30
carboxylate headgroup is oxidatively removed and a shorter-chain
perfluoroalkylcarboxylate is formed.
Hori et al.104 proposed that PW12O403- photocatalytic PFOA decomposition involves a
photo-Kolbe type mechanism where PFOA first complexes with PW12O403- (eq. 2.21) and
upon photon adsorption an electron is directly transferred from PFOA to PW12O403- (eq.
2.22)104. Similar to the sulfate radical mechnism, PFOA will decarboxylate to form the
perfluoroheptyl radical. Oxygen is essential to the photocatalytic cycle in that it accepts
an electron from the reduced phosphotungstic acid, PW12O404-, (eq. 2.23) returning it to
its photoactive state.
CF3(CF2)6COO- + PW12O403- → CF3(CF2)6COO-···PW12O40
3- (2.21)
CF3(CF2)6COO-···PW12O403- + hν (< 390 nm) → CF3(CF2)5CF2· + CO2 + PW12O40
4-(2.22)
PW12O404- + O2 → PW12O40
3- + O2·- (2.23)
The superoxide produced in eq. 20.13 will protonate when pH < 2 to the hydroperoxy
radical (eq. 2.24) which can act as a reductant for pefluoroalkylperoxy (eq. 2.25) and
perfluoroalkoxy radicals (eq. 2.26). The perfluoroalkylhydroperoxide produced in eq. 25
will likely photolyze to a perfluoroalkoxy radical and a hydroxyl radical (eq. 2.27).
H+ + O2·- ↔ HO2· (2.24)
CF3(CF2)5CF2OO· + HO2· → CF3(CF2)5CF2OOH + O2 (2.25)
CF3(CF2)5CF2O· + HO2· → CF3(CF2)5CF2OH + O2 (2.26)
CF3(CF2)5CF2OOH + hν → CF3(CF2)5CF2O· + HO· (2.27)
The subsequent reactions of the various perfluoroalkyl radicals are analogous to those
found in the sulfate radical PFOA decomposition mechanism, eq. 2.7–2.14. Due to the
slow phosphotungstic-acid-mediated PFOA decomposition kinetics, perfsulfate
photolysis would be a preferred perfluoroalkylcarboxylate oxidation technique since it
31
operates by a similar mechanism and its degradation rate is at least an order of magnitude
faster. Phosphotungstic acid has also been shown to enhance the TiO2 photocatalytic
degradation rates of PFOA105 by acting as both an electron shuttle from TiO2 to O2 and as
a photocatalyst.
TiO2 Photocatalysis
TiO2 photocatalysis has been shown to degrade a large number of pollutants through
oxidative and reductive pathways159. The TiO2 photocatalytic degradation of a number
of perfluoroalkyl carboxylates and perfluoroalkylsulfonates was investigated105 and was
observed to be effective for the degradation of the carboxylates but not the sulfonates.
The observation is consistent with investigations of PFOS as an inert, reusable TiO2
surface coating106,107,130 to enhance adsorption of hydrophobic contaminants onto TiO2
,where PFOS was stable to photolysis periods of up to 30 hours. The TiO2 photocatalytic
degradation of PFOA was reported to be quite slow, requiring 60 hours of UV photolysis
to achieve 50% mineralization ([PFOA]i = 4.4 mM, [TiO2]i = 2.0 g L-1, pH = 1, O2, λ =
310–400 nm, 1500 W L-1). Photonic efficiencies were determined to be less than 1.0 x
10-5. The degradation mechanism is postulated to occur via a photo-Kolbe mechanism,
similar to phosphotungstic acid104, since rates increase with decreasing pH from 2.4 to
1.0160. The pKa of PFOA is estimated to be -0.51. The degradation mechanism involves
adsorption of PFOA onto the TiO2 and direct oxidation by a TiO2 valence band hole (eq.
2.28).
>TiOH·+ (hvb+) + > CF3(CF2)6COO- → >TiOH + CF3(CF2)5CF2· + CO2 (2.28)
The subsequent perfluoroalkyl radical reactions will be analogous to those observed
during phosphotungstic acid photocatalysis due to the presence of oxygen. Thus, due to
32
kinetic considerations, persulfate photolysis is a more viable perfluoroalkylcarboxylate
oxidation technique.
The TiO2 photocatalytic degradation of PFOA is slightly enhanced by the addition of
phosphotungstic acid161 or by electrophotocatalysis utilizing TiO2 with a sub-monolayer
Ni-Cu coating103. The phosphotungstic acid addition was completed under the same
conditions as listed above TiO2 photocatalysis. The optimal phosphotungstic acid
concentration was 0.5 mM, yielding a degradation rate twice as fast as TiO2 alone; at
higher concentrations the degradation rate began to decrease. The PFOA half-life during
TiO2/Ni-Cu photocatalysis was 90 min with fluoride accounting for 5% of the total
fluorine ([PFOA]i = 50 μM, λ = 254 nm, 90 W L-1, air). A direct comparison between
the TiO2 and TiO2/Ni-Cu systems is not easy due to the variations between [PFOA]i,
power density and wavelength used. A rough analysis yields a power density normalized
absolute rate of TiO2/Ni-Cu to be 7.4 times faster than TiO2 alone. Applying a potential
of -0.1 V to the TiO2/Ni-Cu system decreases the half-life by a factor of two, 45 minutes,
and increases the fluoride yield at the half-life to 20% of the total fluorine. The authors
state that PFOA is photoreductively degraded, yet the majority of the fluorine is
accounted for by shorter chain perfluoroalkylcarboxylates, which would suggest an
oxidative mechanism. A reductive mechanism would be expected to defluorinate rather
than decarboxylate. Electrochemistry using a boron-doped diamond electrode has also
been shown to degrade PFOA162.
Fe(II)/Fe(III) Photocatalysis
Photolysis of Fe(III)-carboxylate complexes involves charge transfer from the
carboxylate functional group to the Fe(III). For example, ferrioxalate photolysis163–166
will yield two CO2 molecules under oxic conditions and is commonly used as a chemical
33
actinometer. Perfluoroalkylcarboxylates (C2-C5) have been observed to decompose
during UV photolysis in the presence of Fe(III)167 ([PFC]i = 67.3 mM, [Fe3+]i = 5.0 mM,
pH = 1.5, 4.9 atm O2, Xe-Hg Lamp, 9000 W L-1). The Fe(III) photolysis PFC
degradation half-life is approximately 20 hours with fluoride accounting for 45% of the
total fluorine after 50% of the PFC is degraded. The fluoride yield is nearly double that
of other PFC direct electron transfer oxidations. Low pH aqueous iron photolysis can
also initiate indirect oxidations through photo-Fenton chemistry124. Fe(III)-
perfluorocarboxylate photochemistry is postulated to react by chemistry similar to the
analogous hydrocarbons. Initially, aqueous Fe(III) will complex with the PFAC (eq.
2.29). Fe(III)-PFAC UV photon adsorption results in a charge transfer from the PFAC to
the Fe(III) yielding Fe(II), CO2 and a perfluoroalkylradical (eq. 2.30). The perfluoroalkyl
radical will follow the chemistry observed in other oxic systems as well as additional
oxidative chemistry due to Fenton chemistry. The O2 reduction by Fe(II) will regenerate
Fe(III) (eq. 2.31).
CF3(CF2)3COO- + Fe3+ → [CF3(CF2)3COO-Fe3+]2+ (2.29)
[CF3(CF2)3COO-Fe3+]2+ + hν (λ < 300 nm) → CF3(CF2)2CF2⋅ + CO2 + Fe2+ (2.30)
Fe2+ + O2 → Fe3+ + O2⋅- (2.31)
The photolytic Fe(III) degradation of PFCs follows a similar mechanism as the other
oxidative degradations, in that an electron is removed directly from the carboxylate group
leading to decarboxylation and formation of a shorter chain PFAC through a series of
subsequent reactions.
PFOX Reduction
PFOS and PFOA oxidation is slow due to the high electronegativity of the fluorine
atoms coating the carbon chain. Per- and poly-halogenation is a common chemical
34
attribute found in environmentally persistent pollutants as they are oxidatively protected.
For example, the Stockholm Convention greatly restricted the use of the most persistent
organic pollutants (POPs) such as chlordane, DDT, hexachlorobenzene, polychlorinated
biphenyls, and polychlorinated dioxins. All of these organics were partially chlorinated
with 0.3 < Cl/C < 1.2 and <Cl/C> = 0.63. For comparison, PFOS and PFOA have a F/C
~ 2 and fluorine is more electronegative than chlorine. PFOS is being reviewed for
addition to the Stockholm Convention POP list along with organics such as
polybrominated diphenyl ethers, hexachlorocyclohexane, and endosulfan168. Reductive
dehalogenation169–174 has been utilized to remediate persistent halogenated organic
contamination, leading to an increased susceptibility to oxidation and thus reduction of
their environmental persistence. Once dehalogenation is complete, the organic ceases to
be further reduced. A subsequent oxidative, microbial, or pyrolytic/combustion step is
required to completely mineralize the reduced halo-organic.
Reductive remediation of perfluorocarboxylates and perfluorosulfonates is
feasible99,175,176. For example, PFOS can be reduced by elemental iron, Fe(0), in water
under high-temperature, high-pressure conditions (e.g., 350 oC, 20 MPa)176. Unsaturated
per- and poly-fluoroorganics (i.e., those containing aromatic, benzylic, olefinic, and
tertiary functional groups) will readily reductively defluorinate177–182. Fluoroorganics
containing only secondary and primary C-F bonds are difficult to defluorinate due to low
reduction potentials (E < -2.7 V)183,184. Only the aqueous electron and elemental alkali
and alkaline metals have lower standard reduction potentials. Reductive defluorination
kinetics are influenced by a number of FC chemical properties178,179,183,185–187 and
electron-donating strength of the reductant188. For example, branched PFOX is observed
to have faster reduction kinetics than linear PFOX99,189.
35
Sub-Critical Elemental Iron Reduction
Elemental iron, Fe(0), is a reductant and has been utilized for remediation of natural
water halocarbon contamination due to iron’s natural abundance and nontoxicity. Fe(0)
has a reduction potential of - 0.447 V (eq. 2.32) and has been shown to reduce a large
number of halocarbons169,190,191.
Fe0→ Fe2+ + 2 e-, E0 = 0.447 (2.32)
Fe(0) reactive barriers have been applied in the field to degrade chlorinated solvents and
other chemicals in groundwater192–194. Recently, nano-Fe(0) has become popular due to
the increased reactive surface area and thus reduction kinetics173,174,195. Alternatively,
bimetallic systems using metals such as Pt(0), Ni(0), or Pd(0) at percent levels with Fe(0)
have also shown faster reduction kinetics196–198 and are postulated to be H-atom
production catalysts199,200. The application of sub-critical water with the Fe(0) has been
used to enhance reaction rates and mass transfer for remediation of soils and
sediments170,172,201. Sub-critical Fe(0) has been shown to degrade PFOS176, PFHS175, and
shorter-chain perfluoroalkylsulfonate components of an anti-reflective coating ([PFOS]i =
370 μM, [Fe(0)] = 50 g L-1, 350 oC, 200 atm, Ar). The sub-critical Fe(0) PFOS
degradation half-life is 45 minutes, with fluoride accounting for 55% of the total fluorine
after 6 hours. No shorter-chain carboxylic acids were observed suggesting that reductive
defluorination is the primary degradation mechanism. Application of a subsequent
oxidation step could completely mineralize PFOX.
UV-KI Photolysis—Aqueous Electron Reduction
The aqueous electron is a powerful one-electron reductant, E = -2.87 V4. The aqueous
electron is characterized by an electron surrounded by a shell of 5 water molecules, and is
also known as the hydrated or aquated electron202. The aqueous electron can reduce most
36
halogenated contaminants at near diffusion-controlled rates127,171,203–206. Electron
tunneling leads to activation energies for reaction with halogenated organics that are
invariable and small (6 to 30 kJ/mol)207. Reaction rates of the aqueous electron with
fluorinated compounds have been reported178,179,186,187,208. Organic fluoro-saturation
decreases aqueous electron reduction kinetics, since fluorine doesn’t have any low-lying
vacant d-orbital to accept an electron. As fluoro-saturation increases the rates tend to
decrease (i.e., rates are fastest for tertiary fluorocarbons, then secondary, then primary).
Aqueous electrons can be produced by radiolytic209, photolytic210, chemical127, and
direct injection211 methods. In surface waters, the photolysis of humic materials212–214
and hard-UV photolysis of water202 are the most common sources of natural aqueous
electrons which have a steady-state concentration of 10-15 M. Second-order reaction rates
of aqueous electrons with perfluorocarboxylates have been determined to be on the order
of 107 M-1s-1 using pulse radiolysis and flash photolysis methods186,187. This is the fastest
reported second-order rate constant of these perfluorocarboxylates with any chemical
species (e.g., kPFOS+HO⋅~ kPFOS+SO4⋅- ~ 104 M-1 s-1). Pulse radiolysis experiments186
reported kPFOS+e(M-1 s-1) > kPFOA+e(M-1 s-1), suggesting sulfur-containing PFOS is easier
to reduce. Batch reactions utilizing the aquated electron (eaq−, E°aq/e = − 2.9 V), produced
by iodide photolysis, are observed to decompose both PFOS and PFOA ([PFOS]i =
[PFOA]i = 200 nM, [I-] = 10 mM, λ = 254 nm, 40 W L-1, Ar). Aquated electrons are
generated from UV-photolysis of aqueous iodide solutions via charge-transfer-to-solvent
(CTTS) states (eq. 2.33).
I- + hν → I-*CTTS → I⋅ + e-aq (QYλ=248 nm = 0.286)215 (2.33)
Fluoride is produced as a nonstoichiometric product, 10% for PFOA and 50% for PFOS,
and thus the initial PFOX molecule is degraded but not completely destroyed by
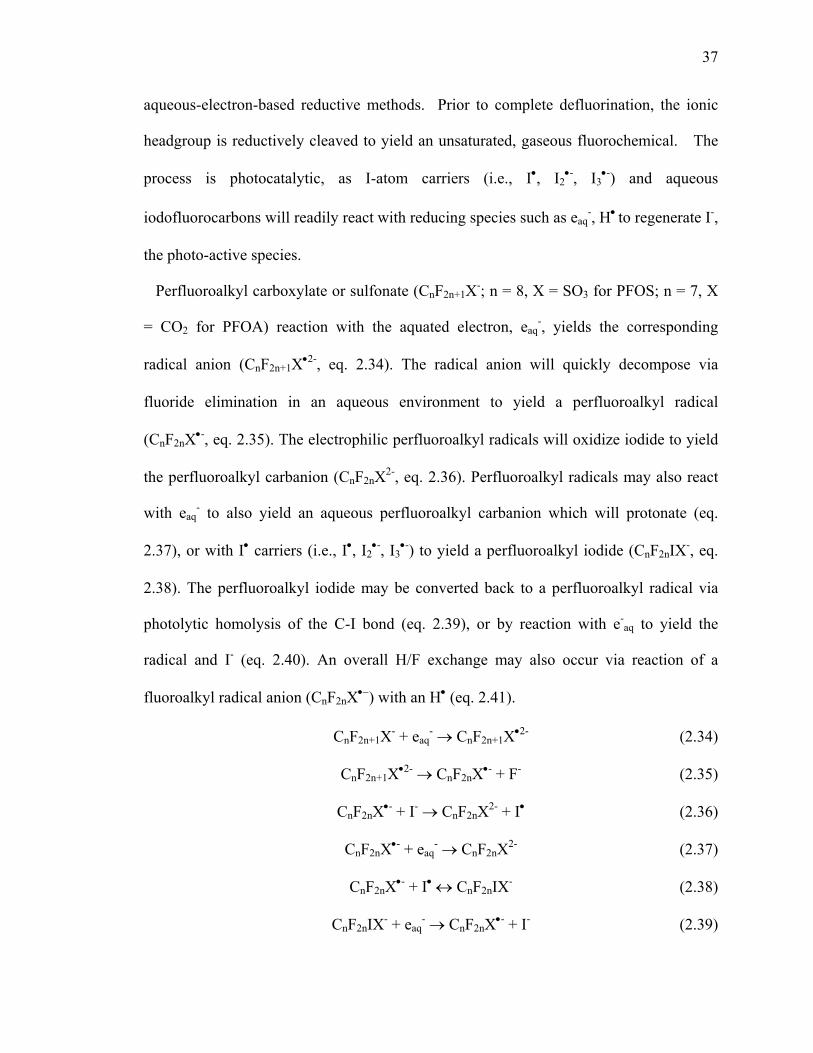
37
aqueous-electron-based reductive methods. Prior to complete defluorination, the ionic
headgroup is reductively cleaved to yield an unsaturated, gaseous fluorochemical. The
process is photocatalytic, as I-atom carriers (i.e., I•, I2•-, I3
•-) and aqueous
iodofluorocarbons will readily react with reducing species such as eaq-, H• to regenerate I-,
the photo-active species.
Perfluoroalkyl carboxylate or sulfonate (CnF2n+1X-; n = 8, X = SO3 for PFOS; n = 7, X
= CO2 for PFOA) reaction with the aquated electron, eaq-, yields the corresponding
radical anion (CnF2n+1X•2-, eq. 2.34). The radical anion will quickly decompose via
fluoride elimination in an aqueous environment to yield a perfluoroalkyl radical
(CnF2nX•-, eq. 2.35). The electrophilic perfluoroalkyl radicals will oxidize iodide to yield
the perfluoroalkyl carbanion (CnF2nX2-, eq. 2.36). Perfluoroalkyl radicals may also react
with eaq- to also yield an aqueous perfluoroalkyl carbanion which will protonate (eq.
2.37), or with I• carriers (i.e., I•, I2•-, I3
•-) to yield a perfluoroalkyl iodide (CnF2nIX-, eq.
2.38). The perfluoroalkyl iodide may be converted back to a perfluoroalkyl radical via
photolytic homolysis of the C-I bond (eq. 2.39), or by reaction with e-aq to yield the
radical and I- (eq. 2.40). An overall H/F exchange may also occur via reaction of a
fluoroalkyl radical anion (CnF2nX•−) with an H• (eq. 2.41).
CnF2n+1X- + eaq- → CnF2n+1X•2- (2.34)
CnF2n+1X•2- → CnF2nX•- + F- (2.35)
CnF2nX•- + I- → CnF2nX2- + I• (2.36)
CnF2nX•- + eaq
- → CnF2nX2- (2.37)
CnF2nX•- + I• ↔ CnF2nIX- (2.38)
CnF2nIX- + eaq- → CnF2nX•- + I- (2.39)
38
CnF2nX2- + H+/H2O → CnF2nHX- (2.40)
CnF2nX•- + H• → CnF2nHX- (2.41)
If an H/F exchange product retains the anionic carboxylate or sulfonate terminal group, it
will remain in the aqueous phase and proceed through sequential H/F exchanges.
Subsequent eaq- reductions with partially defluorinated intermediates (CnF2nIX-, CnF2n-1X-,
or CnF2nHX-) should be faster than the initial defluorination step181. After partial
reductive defluorination of PFOX, the ionic headgroup is cleaved. Ionic headgroup
cleavage yields a neutral, polyfluorinated organic, which preferentially partitions to the
gas-phase. The gaseous fluoroorganic could be completely destroyed using thermal or
plasma techniques.
Alkaline 2-Propanol Photolytic Reduction
Photolysis of alkaline 2-propanol will catalytically yield the isopropyl radical through
various radical chain initiation and propagation steps. The isopropyl radical has been
reported to dechlorinate PCBs and pesticides216–218. Photolytic production of a strong
one-electron oxidation, Ox•, will abstract an H-atom from 2-propanol to yield the
isopropyl radical (eq. 2.38)4, (CH3)2COH, which under alkaline conditions will
deprotonate to yield (eq. 2.39)219, (CH3)2CO•-, a stronger reductant (eqs. 2.40–2.41).
(CH3)2CHOH + Ox• → (CH3)2COH + Ox- (2.38)
(CH3)2COH ↔ (CH3)2CO•- + H+ (pKa = 12.03) (2.39)
(CH3)2CO + eaq- + H+ → (CH3)2COH (E = -1.4 V) (2.40)
(CH3)2CO + eaq
- → (CH3)2CO•- (E = -2.1 V) (2.41)
UV photolysis of alkaline 2-propanol99 has been observed to decompose PFOS with a
pseudo-first-order half-life of 17.8 hours ([PFOS]i = 40 μM, [NaOH]i = 90 mM, λ = 254
39
nm, 43 W L-1, T = 38-50 oC, N2). The branched PFOS isomers degraded faster than the
linear isomers consistent with electrochemical perfluoroorganic reduction where
increased PF branching yielded easier reductions183,184. The primary product observed
during the reduction is NaF(s). Similar to aqueous electron reduction, perfluoroalkyl
carboxylate or sulfonate (CnF2n+1X-; n = 8, X = SO3 for PFOS; n = 7, X = CO2 for PFOA)
reaction with (CH3)2CO•- yields the perfluoroalkyl radical and fluoride (eq 2.42). The
produced perfluoroalkyl radical will then abstract an H-atom from 2-propanol to
propagate the radical chain (eq. 2.43). Radical chain termination would occur via
reaction of two radicals (eq. 2.44).
(CH3)2CO•- + CnF2n+1X- → (CH3)2CO + CnF2nX•- + F- (2.42)
CnF2nX•- + (CH3)2CHOH → CnF2nHX- + (CH3)2COH (2.43)
CnF2nX•-/(CH3)2CO•- + CnF2nX•- → (2.44)
The radical chain mechanism makes alkaline 2-propanol an efficient PFOS degradation
technology. A degradation mass balance has yet to be completed.
BB12 Mediated Reduction
Vitamin B12 is a class of cobalamins, a cobalt ion complexed tetrapyrrole or corrin ring,
which in certain forms are metabolically active coenzymes that catalyze rearrangement
and methylation reactions220. Various B12 cofactors have been shown effective for the
dechlorination of a number of organics such as PCE, TCE, CCl4, and HCB221–224. The
complexed cobalt ion is reduced to active Co(I) through two one-electron transfers (eqs.
2.45–2.46)225,226 which can be completed in aqueous solution using Ti(III)-citrate as a
bulk reductant (eq. 2.47)227.
B12a[Co(III)] + e- → B12r[Co(II)] (E0 = -0.11 V, pH = 9) (2.45)
B12r[Co(II)] + e- → B12s[Co(I)] (E0 = -0.85, pH = 9) (2.46)
40
Ti(III)-cit → Ti(IV)-cit + e- (E0 = -0.7, pH = 9) (2.47)
The B12-Co(I) has been postulated to reduce TCE by two mechanisms: an outer-sphere
one-electron transfer223,228 yielding chloride and a radical (eq. 2.48), followed by decay
of the radical (eq. 2.49)
B12-Co(I) + Cl2C=CHCl → B12-Co(II) + ClC=CHCl + Cl- (2.48)
ClC=CHCl → ClC≡CH + Cl⋅ (2.49)
or a nucleophilic attack by B12-Co(I), one of the strongest known nucleophiles229,
yielding a carbanion222,224 (eq. 2.50) which is transformed to the reduced form (eq. 2.51).
B12-Co(I) + Cl2C=CHCl → B12-Co(III)Cl2CCHCl- (2.50)
B12-Co(III)Cl2CCHCl- + e- + H+ → B12-Co(II) + ClHC=CHCl + Cl- (2.51)
The overall TCE B12 reduction mechanism eventually yields acetylene as a final product.
Vitamin BB12 has recently been shown to be an effective electron transfer mediator for
the reduction of PFOS , with Ti(III)-citrate used as the bulk electron source ([PFOS]189i =
332 μM, [Ti(III)-cit] = 36 mM, 70 C, pH = 9.0). Reduction kinetics were determined to
be 12.3 times faster for branched PFOS (τ
o
1/2 = 33 hrs) then linear PFOS (τ1/2 = 410 hrs).
The faster kinetics for the branched form are consistent with reduction potentials
increasing as branching increases . The branched form of PFOS gave a greater F
yield per PFOS degraded, [F ]/[PFOS]
183,184 -
-br,deg = 12 vs. [F ]/[PFOS]-
lin,deg = 3, implying a
change in the overall reduction mechanism. Ti(III)-citrate was also observed to reduce
PFOS, but at a significantly lower rate than when using B12 as a electron transfer
mediator. As with the Fe(0) reduction of PFOS and PFHS, a greater-than-standard
temperature is required to drive the reaction on a reasonable time scale. The ability of
41
B12B to reduce PFOS, suggests that it may be possible for anaerobic bacteria to decompose
perfluorochemicals and that it is more likely for them to degrade nonlinear PFCs.
PFOX Thermolysis
The high-temperature processing of organic materials will lead to pyrolytic reactions in
the absence of oxygen and combustion reactions in the presence of oxygen. The
thermolysis of fluorochemicals has been documented experimentally under more
controlled conditions to determine individual reaction kinetics and mechanisms230–241 and
under more industrial conditions to test incinerability83,111,113 or other thermal
degradation processes242. A comprehensive experimental and theoretical database of C1
and C2 fluorochemical pyrolytic and combustion mechanisms, thermochemistry, and
kinetics has been reported243. Fluorochemical C-C bonds (100 kcal/mol) in a
fluorochemical will break prior to C-F bonds (120 kcal/mol) to yield fluoroalkyl radicals.
The fluoroalkyl radical produced will be electrophilic and less stable towards thermal
decomposition than the parent compound. Pyrolysis of longer perfluorochemical chains
will tend to yield tetrafluoroethene, C2F4, difluorocarbene, CF2, and the trifluoromethyl
radical, CF3 as the primary C1 and C2 products. Under combustion conditions, these
radicals are readily transformed into CO, CO2, and HF 243
Thermal degradation of solid PFOA and PFOS salts244–246 and gaseous PFOA (acid and
ammonium salts)230,247 has been reported. The primary products during the thermolysis
of perfluoroalkylcarboxylates are the analogous 1H-perfluoroalkane for the salts (NH4+,
H+, eq. 2.52)230,245,247, and the perfluoroolefin as well as the acyl fluoride and the
anhydride for metal salts (Na+, K+, Ca2+, etc.)245. A similar mechanism may be expected
for perfluoroalkylsulfonates (eq. 2.53), as the C-S bond has been observed to be mostly
broken during PFOS pyrolysis248.

42
CF3(CF2)6COO-NH4+
(s or g) + Δ → CF3(CF2)5CF2H(g) + CO2(g) + NH3(g) (2.52)
CF3(CF2)7SO3-K+
(s or g) + Δ → CF3(CF2)5CF=CF2(g) + SO3(g) + K+F-(s) (2.53)
A C-C bond breaking mechanism may also be the initial unimolecular decomposition
step as observed in perfluorohexane pyrolysis231. A comparison of the extent of pyrolysis
of similar carboxylate and sulfonate salts246 reveals temperatures required for equivalent
sulfonate salt decomposition to be 100 to 200 K greater than the corresponding
carboxylate salt. The acid and ammonium salts are thermally converted to 1H-
perfluoroalkane245–247 and have a significantly lower decomposition temperature since no
C-F bonds are broken. Thermolysis in the presence of ethylene glycol also primarily
produces the1H-perfluoroalkane245 suggesting that the perfluoroalkylanion is a weaker
acid (pKaHOCH2CH2OH = 14.2).The produced perfluoroolefin or 1H-perfluoroalkane will
undergo further pyrolytic reactions to eventually yield C2F6 and C2F4231,243. If water
and/or oxygen are present, the primary end-products will be CO, CO2, and HF.
Incineration
Combustion is the most common thermal treatment of waste. Incineration, a
combustion-based process, is one of the oldest chemical destruction techniques and today
the waste heat from incineration can be converted usable energy. Incineration involves
heating a substance to >1000 oC for at least 2 s. Incineration is commonly used in
countries where land is scarce and solid waste must be thermally processed, > 95%, prior
to landfill disposal. The test for determining the applicability of incineration for a
chemical is to detemine the temperature at which > 99% of a chemical is destroyed after
2 s of applied heat. A number of fluorochemicals have been tested for incinerability. A
fluorotelomer based acrylic polymer was found to be > 99% destroyed at 950 oC as a free
polymer and at 700 oC when coated on a fabric113. Carbon tetrafluoride, CF4, one of the
43
most recalcitrant fluorochemicals, will be > 99% destroyed under incinerator
conditions83. CF4 has an estimated atmospheric lifetime of > 50,000 years with the
dominant degradation pathway being diffusion into high-temperature incinerators and
power plants249. Laboratory scale studies have shown PFOS and perfluorosulfonamides
to be > 99% destroyed at 600 oC248,250. Gas-phase NMR studies have determined the >
99% destruction temperature for various PFOA salts to be in the range of 300–350
oC230,247. Therefore, incinerator conditions will be sufficient to completely destroy
fluorochemicals in polymer, coating, and monomer forms. Incineration is most energy
efficient for solid wastes, since all the heat will go into destroying the contaminant in
question. Highly concentrated aqueous fluorochemical solutions and fluorochemicals
adsorbed to a solid matrix could also be incinerated, but energy will be wasted on
destroying the matrix.
Sonochemistry
Sonochemistry is the driving of chemical reactions by application of an acoustic field to
a solution251–253. The chemistry is generated by acoustic cavitation of microscopic
bubbles and has been utilized for the decomposition of a number of aqueous chemical
contaminants254–258 including chlorocarbons259–261 and perfluorocarbons92,262. Application
of ultrasonic field to an aqueous solution initially nucleates cavitation bubbles which will
undergo stable and transient bubble collapse events251,263–266. Transiently collapsing
bubbles generate the observed chemistry. After expanding to a radial maximum,
transient bubbles undergo a quasi-adiabatic compression and the PdV energy is converted
into kinetic energy of the trapped gas molecules. Transient bubble collapses generate
average vapor temperatures near 5,000 K267,268 and much higher bubble vapor core
temperatures (> 10,000 K), which generate sonoluminescence269,270. Hot vapor will
44
collide with the collapsing bubble wall; transfer of heat from the vapor to the bubble wall
will generate interfacial temperatures measured to be at least 800 K251,255. Water vapor
within the collapsing bubble will pyrolyze to yield an H-atom and a hydroxyl radical (eq.
2.54), the hydroxyl eventually pyrolyzes as well to yield an O-atom and an H-atom (eq.
2.55)251.
H2O + Δ → HO⋅ + H⋅ (2.54)
HO⋅ + Δ → O + H⋅ (2.55)
The radicals produced will react preferentially with chemicals partitioning to the bubble
gas-phase. A fraction of the radicals will be transported to the bubble interface and a
smaller fraction to the bulk aqueous phase where they can react with aqueous
contaminants. Chemicals preferentially partitioning to the bubble vapor will decompose
via pyrolytic and combustion reactions259. Hydrocarbon surfactants will degrade via
hydroxyl radical oxidation at the interface271. Surfactants that are difficult to oxidize,
such as PFOS and PFOA, will pyrolytically decompose at the bubble-water interface92.
Sonochemistry has been observed to degrade PFOS and PFOA92 with the primary ionic
products being fluoride and sulfate ([PFOS]i = 20 μM, f = 200 kHz, 200 W, 3 W/cm2, 20
oC, argon). Under these conditions the sonochemical half-life of PFOA was 22 minutes
and of PFOS was 43 minutes. The initial decomposition step was determined to occur at
the bubble-water interface. Time-dependent product analyses during PFOS and PFOA
sonolysis was used to investigate the mechanism and kinetics of the overall degradation
process ([PFOS]i = 10 μM, f = 358/618 kHz, 250 WL, 6.4 W/cm2, 10 oC, argon)262.
Under these conditions, the decomposition half-life was reduced to 17 and 26 minutes for
PFOA and PFOS, respectively. The nearly immediate production of mineralized fluorine
(fluoride), sulfur (sulfate), and carbon (CO and CO2) products after decomposition of the

45
initial perfluorinated surfactant implies that sonochemical PFOS/PFOA mineralization
(i.e., conversion to inorganic products) has overall kinetics similar to the decomposition
of the perfluorinated surfactant (eq. 2.56),
dttionMineralizad
dtPFOXd ][
=−
(2.56)
or that the primary intermediates produced from PFOS and PFOA sonolysis have much
shorter half-lives than their parent surfactants. Assuming that the initial decomposition
step is pyrolytic, the primary fluorochemical intermediates are expected to be
perfluoroolefins and 1H-perfluoroalkanes, eqs. 2.52–2.53. The high Henry’s constants3
of the primary fluorochemical intermediates favor partitioning into the bubble vapor
,where they will be pyrolyzed into their C1 fluororadical constituents (eq. 2.57)231,272.
CF3(CF2)5CF2H(g) + Δ → CF3 + 5 :CF2 + CF2H (2.57)
The C1 fluororadicals will subsequently react with H2O, HO⋅, H⋅, and O-atom in the
bubble vapor to yield CO, CO2, and HF243. More recent studies have shown that
perfluorochemical adsorption to acoustically cavitating bubble interfaces is enhanced
when the bubble interfaces are lightly populated. The adsorption enhancements increase
the effective concentration of dilute perfluorochemical solutions by 1–2 orders of
magnitude. Sonochemical degradation studies on groundwater containing
perfluorochemicals have shown that organic content has only minimal effects on
decomposition rates, even when organic concentrations are many orders of magnitude
greater than fluorochemical concentrations, due to preferential adsorption of PFCs to the
bubble-water interface.
PFOX Degradation Technology Summary
46
In Tables 2.1 & 2.2 we have compiled the aqueous PFOX degradation parameters for
the most viable techniques: reactions conditions, initial concentrations, degradation
kinetics, degradation products, and energy required to reduce the initial PFOX
concentration by 50% and the energy required per μmole. However, neither the absolute
or normalized energy is optimal for comparison of the reviewed techniques. As [PFOX]i
increases, the inherent efficiency of any chemical process will also increase if the
concentration is below kinetic saturation. For example, see the data on UV-KI or
sonolytic degradation of PFOX at [PFOX]i = 200 nM vs. 20 μM. In both cases for PFOS
and PFOA the absolute amount of energy required for 50% degradation decreases by 45–
75% upon decreasing [PFOX]i. However, since the concentration decreases by 2 orders
of magnitude, the energy required to degrade a μmole of PFOX will increase by at least
an order of magnitude.
In terms of reaction conditions, the techniques with no chemical additives such as
photoelectrocatalysis, sonolysis, and direct photolysis are advantageous. Although, the
sulfate (persulfate), TiO2(s), iron (Fe(0), Fe2+/Fe3+), and iodide (UV-KI) are relatively
innocuous and shouldn’t be an environmental issue. Sub-critical Fe(0) has safety
implications of operating under high-pressure, high-temperature conditions.273 Acoustic
and UV-based systems will require reactor cooling.
A comparison of degradation kinetics will be headgroup dependent (i.e, PFOS and
PFOA have dissimilar degradation rates). PFOA is more kinetically susceptible to
oxidative, and photolytic processes, whereas PFOS is more susceptible to reductive
processes. Both PFOS and PFOA are susceptible to sonolysis, a thermal-based process.
For example, PFOA has a degradation half-life less than 60 minutes by direct photolysis
(λ = 195 nm), persulfate photolysis (λ = 254 nm), photoelectrocatalysis, and sonolysis,
47
and PFOS has a degradation half-life under 60 min for sub-critical Fe(0) and sonolysis.
Sonolysis is the only technique that has been shown to quickly degrade both as it can
create incinerator level temperatures, if only for a short (ns) period of time. Kinetics will
be of importance in flowing systems where the aqueous PFOX will only be in the reactor
for a finite period. Whereas there are batch reactor cases (e.g., manufacturing waste)
where treatment time is not a factor and the kinetics will be relatively unimportant.
PFOX degradation products are dependent upon whether the technique used is
oxidative, reductive or thermal. Thermal methods, such as sonolysis and incineration,
have a distinct advantage. PFOX is sonolytically mineralized to F-, SO42-, CO, and CO2
nearly immediately after the initial degradation step. Thus PFOX sonolytic
mineralization efficacy is equivalent to its degradation efficacy. Reductive methods,
such as sub-critical Fe(0), UV-KI, and UV-NaOH-IPA, will to some extent defluorinate
PFOS and PFOA. Defluorination will yield either an olefin or a hydride which will be
easier to oxidize than PFOX. However, even partially fluorinated species have long
environmental lifetimes. For example, fluoroform, CF3H, has an atmospheric lifetime of
250–390 years.274 Direct photolytic and oxidative processes are weakest in terms of
degradation products. Oxidation of PFOX cleaves the headgroup and after a series of
subsequent reactions the highest yield product is a perfluorocarboxylate with one less -
CF2- group, which is just as recalcitrant as the initial compound. For example, persulfate
photolysis is one of the most energy-efficient processes for PFOA degradation, but would
require approximately 50x more energy to completely mineralize PFOA, which is similar
to the energy requirement for sonolytic mineralization.
As discussed earlier, it is difficult to directly compare energetic efficiencies due to
factors such as initial concentration used and whether interest is in initial PFOX
48
degradation or complete mineralization. Tables 2.1 & 2.2 can be used for a rough
measure of which treatment technology is energetically viable. The PFOX treatment
technology utilized will strongly depend on the situation in question and the desired
results. For example, our group has shown that sonolysis is a viable method for the
degradation of PFOX in groundwater, even though they were at relatively low
concentrations, 100 ppb, as compared to other matrix components. This is a result of
PFOX being strong surfactants and thus will preferentially adsorb to the bubble-water
interface, the active site in sonolysis, over other chemical species. Redox and photolytic
methods would have a much greater loss of efficacy when utilized to degrade PFOX in
groundwater due to reactive radical scavenging by NOM, dissolved and solid metals, and
co-contaminants.
It is of note that none of the reviewed methods approaches the normalized energy for
production of PFOX. The concentration effect (i.e., production concentrations are much
greater than waste/water concentrations) is a major factor in this deficiency. Assuming
C-F bond formation is the most energetically consuming step in producing PFOS, we will
make a rough estimate of energy per μmole to produce PFOS. Electrochemical
conversion of octanesulfonyl fluoride to perfluorooctane sulfonyl fluoride is completed in
concentrated HF with an applied voltage of 4-7 V, 2 electrons are required to convert C(-
I)-H to C(+I)-F, and there are 17 C-F bonds in PFOS. Thus approximately 1.31–2.28 x
104 kJ mol-1 or 1.31–2.28 x 10⁻² kJ μmol-1 is necessary to create PFOS—a value orders of
magnitude greater than the energy required for sonolytic mineralization of 10 μM PFOS:
95 kJ μmol-1. Therefore, investigations into the energy usage optimization of the
currently reviewed methods, as well as research into new techniques for aqueous PFOX
removal or degradation, would be fruitful in reducing the overall environmental impact of
49
this class of chemicals. Hybrid methods containing two or more of the previously stated
techniques are likely to be viable solutions. For example, we have found that the iron and
DOC levels in leachate reduce the PFOS and PFOA sonolytic degradation rates by
factors of four and three, respectively. However, the sonozone process275–278, the
simultaneous application of ozone and ultrasound, nearly rectifies the rates to those
observed under pristine conditions. Further investigations are needed into novel oxidative
and reductive techniques as well as hybrid (synergistic) remediation techniques to
degrade particularly recalcitrant pollutants such as aqueous PFOS and PFOA.
.
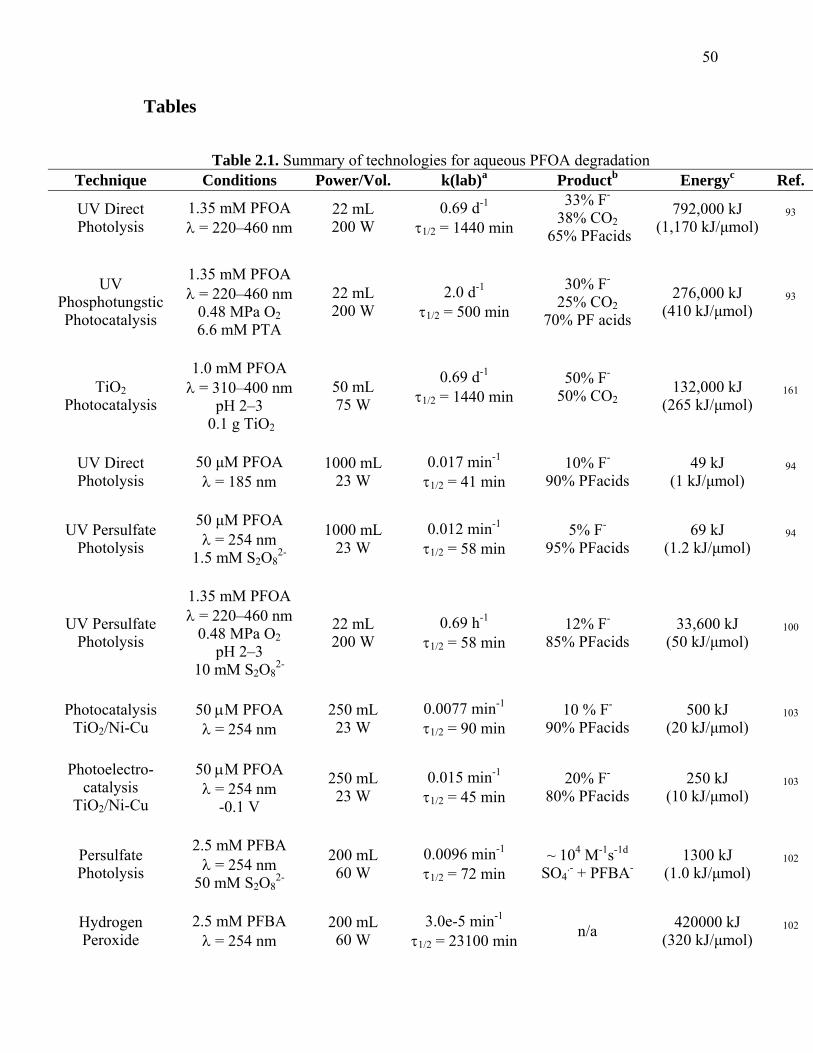
50
Tables
Table 2.1. Summary of technologies for aqueous PFOA degradation Technique Conditions Power/Vol. k(lab)a Productb Energyc Ref.
UV Direct Photolysis
1.35 mM PFOA λ = 220–460 nm
22 mL 200 W
0.69 d-1
τ1/2 = 1440 min
33% F-
38% CO2 65% PFacids
792,000 kJ (1,170 kJ/μmol)
93
UV Phosphotungstic Photocatalysis
1.35 mM PFOA λ = 220–460 nm
0.48 MPa O26.6 mM PTA
22 mL 200 W
2.0 d-1
τ1/2 = 500 min
30% F-
25% CO270% PF acids
276,000 kJ (410 kJ/μmol)
93
TiO2 Photocatalysis
1.0 mM PFOA λ = 310–400 nm
pH 2–3 0.1 g TiO2
50 mL 75 W
0.69 d-1
τ1/2 = 1440 min
50% F-
50% CO2
132,000 kJ (265 kJ/μmol)
161
UV Direct Photolysis
50 μM PFOA λ = 185 nm
1000 mL 23 W
0.017 min-1
τ1/2 = 41 min 10% F-
90% PFacids 49 kJ
(1 kJ/μmol) 94
UV Persulfate Photolysis
50 μM PFOA λ = 254 nm
1.5 mM S2O82-
1000 mL 23 W
0.012 min-1
τ1/2 = 58 min 5% F-
95% PFacids 69 kJ
(1.2 kJ/μmol) 94
UV Persulfate Photolysis
1.35 mM PFOA λ = 220–460 nm
0.48 MPa O2pH 2–3
10 mM S2O82-
22 mL 200 W
0.69 h-1
τ1/2 = 58 min 12% F-
85% PFacids 33,600 kJ
(50 kJ/μmol) 100
Photocatalysis
TiO2/Ni-Cu 50 μM PFOA λ = 254 nm
250 mL 23 W
0.0077 min-1
τ1/2 = 90 min 10 % F-
90% PFacids 500 kJ
(20 kJ/μmol) 103
Photoelectro-
catalysis TiO2/Ni-Cu
50 μM PFOA λ = 254 nm
-0.1 V
250 mL 23 W
0.015 min-1
τ1/2 = 45 min 20% F-
80% PFacids 250 kJ
(10 kJ/μmol) 103
Persulfate Photolysis
2.5 mM PFBA λ = 254 nm
50 mM S2O82-
200 mL 60 W
0.0096 min-1
τ1/2 = 72 min ~ 104 M-1s-1d
SO4.- + PFBA-
1300 kJ (1.0 kJ/μmol)
102
Hydrogen Peroxide
2.5 mM PFBA λ = 254 nm
200 mL 60 W
3.0e-5 min-1
τ1/2 = 23100 min n/a 420000 kJ (320 kJ/μmol)
102
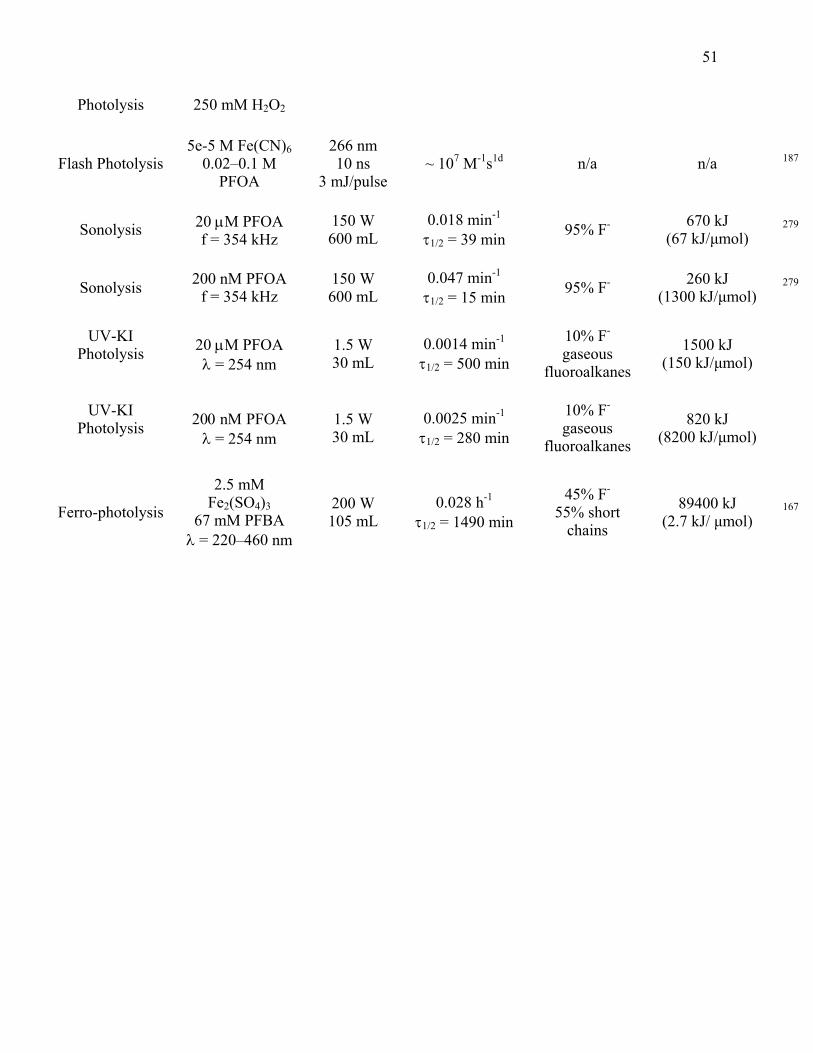
51
Photolysis 250 mM H2O2
Flash Photolysis 5e-5 M Fe(CN)6
0.02–0.1 M PFOA
266 nm 10 ns
3 mJ/pulse ~ 107 M-1s1d n/a n/a 187
Sonolysis 20 μM PFOA f = 354 kHz
150 W 600 mL
0.018 min-1
τ1/2 = 39 min 95% F- 670 kJ (67 kJ/μmol)
279
Sonolysis 200 nM PFOA f = 354 kHz
150 W 600 mL
0.047 min-1
τ1/2 = 15 min 95% F- 260 kJ (1300 kJ/μmol)
279
UV-KI
Photolysis
20 μM PFOA λ = 254 nm
1.5 W 30 mL
0.0014 min-1
τ1/2 = 500 min
10% F-
gaseous fluoroalkanes
1500 kJ (150 kJ/μmol)
UV-KI
Photolysis
200 nΜ PFOA λ = 254 nm
1.5 W 30 mL
0.0025 min-1
τ1/2 = 280 min
10% F-
gaseous fluoroalkanes
820 kJ (8200 kJ/μmol)
Ferro-photolysis
2.5 mM Fe2(SO4)3
67 mM PFBA λ = 220–460 nm
200 W 105 mL
0.028 h-1
τ1/2 = 1490 min
45% F-
55% short chains
89400 kJ (2.7 kJ/ μmol)
167

52
Table 2.2. Summary of technologies for aqueous PFOS degradation Technique Conditions Power/Vol. k(lab)a Productsb Energyc Ref.
Sub-Critical Fe(0)
370 μM PFOS 0.5 g Fe(0)
350 oC, 20 MPa 10 mL 0.013 min-1
τ1/2 = 53 min 50% F- 2,000 kJ (11 kJ / μmol)
176
UV Direct Photolysis
40 μM PFOS λ = 254 nm
32 W 750 mL
0.13 day-1
τ1/2 = 7700 min 71% F-
90% SO42-
17,000 kJ (850 kJ / μmol)
99
UV Alkaline
IPA Photolysis 40 μM PFOS λ = 254 nm
32 W 750 mL
0.93 day-1
τ1/2 = 1070 min NaF(s)2,500 kJ
(125 kJ / μmol) 99
Sonolysis 20 μM PFOS f = 354 kHz
150 W 600 mL
0.011 min-1
τ1/2 = 63 min 95% F-
100% SO42-
945 kJ (95 kJ / μmol)
279
Sonolysis 200 nM PFOS f = 354 kHz
150 W 600 mL
0.023 min-1
τ1/2 = 30 min 95% F-
100% SO42-
450 kJ (4500 kJ/μmol)
279
UV-KI Photolysis
20 μM PFOS λ = 254 nm
[KI] = 10 mM
1.5 W 30 mL
0.002 min-1
τ1/2 = 350 min
50% F-
50%
fluoroalkanes
960 kJ (96 kJ / μmol)
UV-KI Photolysis
200 nM PFOS λ = 254 nm
[KI] = 10 mM
1.5 W 30 mL
0.008 min-1
τ1/2 = 87 min
50% F-
50%
fluoroalkanes
260 kJ (1250 kJ/μmol)
53
References
(1) Goss, K. U. Environ. Sci. Technol. 2008, 42, 456.
(2) Goss, K. U.; Bronner, G. J. Phys. Chem. A 2006, 110, 9518.
(3) Goss, K. U.; Bronner, G.; Harner, T.; Monika, H.; Schmidt, T. C. Environ. Sci.
Technol. 2006, 40, 3572.
(4) Wardman, P. J. Phys. Chem. Ref. Data 1989, 18, 1637.
(5) 3M Company. The Science of Organic Fluorochemistry; Docket AR226-0547; Office
of Pollution Prevention and Toxics, U.S. Environmental Protection Agency: Washington,
D.C., 1999; p. 12.
(6) 3M Company. Removal of PFOA with Granular Activated Carbon: 3M Wastewater
Treatment System Monitoring; Docket AR226-1699; Office of Pollution Prevention &
Toxics, U.S. Environmental Protection Agency: Washington, D.C., 2004; p 5.
(7) Sinclair, E.; Kannan, K. Environ. Sci. Technol. 2006, 40, 1408.
(8) Schultz, M. M.; Higgins, C. P.; Huset, C. A.; Luthy, R. G.; Barofsky, D. F.; Field, J.
A. Environ. Sci. Technol. 2006, 40, 7350.
(9) Morris, R. A.; Miller, T. M.; Viggiano, A. A.; Paulson, J. F.; Solomon, S.; Reid, G. J.
Geophys. Res.—Atmos. 1995, 100, 1287.
(10) Shinoda, K.; Hato, M.; Hayashi, T. J. Phys. Chem. 1972, 76, 909.
(11) Lopez-Fontan, J. L.; Sarmiento, F.; Schulz, P. C. Colloid Polym. Sci. 2005, 283, 862.
(12) Lu, J. R.; Ottewill, R. H.; Rennie, A. R. Colloid Surf. A—Physicochem. Eng. Asp.
2001, 183, 15.
(13) Simister, E. A.; Lee, E. M.; Lu, J. R.; Thomas, R. K.; Ottewill, R. H.; Rennie, A. R.;
Penfold, J. J. Chem. Soc.—Faraday Trans. 1992, 88, 3033.
54
(14) Boulanger, B.; Peck, A. M.; Schnoor, J. L.; Hornbuckle, K. C. Environ. Sci.
Technol. 2005, 39, 74.
(15) Boulanger, B.; Vargo, J.; Schnoor, J. L.; Hornbuckle, K. C. Environ. Sci. Technol.
2004, 38, 4064.
(16) Hansen, K. J.; Johnson, H. O.; Eldridge, J. S.; Butenhoff, J. L.; Dick, L. A. Environ.
Sci. Technol. 2002, 36, 1681.
(17) Harada, K.; Saito, N.; Sasaki, K.; Inoue, K.; Koizumi, A. Bull. Environ. Contam.
Toxicol. 2003, 71, 31.
(18) Kim, S. K.; Kannan, K. Environ. Sci. Technol. 2007, 41, 8328.
(19) McLachlan, M. S.; Holmstrom, K. E.; Reth, M.; Berger, U. Environ. Sci. Technol.
2007, 41, 7260.
(20) Moody, C. A.; Hebert, G. N.; Strauss, S. H.; Field, J. A. J. Environ. Monit. 2003,
5, 341.
(21) Moody, C. A.; Martin, J. W.; Kwan, W. C.; Muir, D. C. G.; Mabury, S. C.
Environ. Sci. Technol. 2002, 36, 545.
(22) Schultz, M. M.; Barofsky, D. F.; Field, J. A. Environ. Eng. Sci. 2003, 20, 487.
(23) Yamashita, N.; Kannan, K.; Taniyasu, S.; Horii, Y.; Petrick, G.; Gamo, T. Mar.
Pollut. Bull. 2005, 51, 658.
(24) 3M Company. Sulfonated perfluorochemicals in the environment: Sources,
dispersion, fate and effects; Docket AR226-0620; Office of Pollution Prevention &
Toxics, U.S. Environmental Protection Agency: Washington, D.C., 2000; p 51.
(25) Armitage, J.; Cousins, I. T.; Buck, R. C.; Prevedouros, K.; Russell, M. H.;
MacLeod, M.; Korzeniowski, S. H. Environ. Sci. Technol. 2006, 40, 6969.
55
(26) Saito, N.; Harada, K.; Inoue, K.; Sasaki, K.; Yoshinaga, T.; Koizumi, A. J.
Occup. Health 2004, 46, 49.
(27) Schultz, M. M.; Barofsky, D. F.; Field, J. A. Environ. Sci. Technol. 2004, 38,
1828.
(28) Scott, B. F.; Moody, C. A.; Spencer, C.; Small, J. M.; Muir, D. C. G.; Mabury, S.
A. Environ. Sci. Technol. 2006, 40, 6405.
(29) Scott, B. F.; Spencer, C.; Mabury, S. A.; Muir, D. C. G. Environ. Sci. Technol.
2006, 40, 7167.
(30) Senthilkumar, K.; Ohi, E.; Sajwan, K.; Takasuga, T.; Kannan, K. Bull. Environ.
Contam. Toxicol. 2007, 79, 427.
(31) So, M. K.; Miyake, Y.; Yeung, W. Y.; Ho, Y. M.; Taniyasu, S.; Rostkowski, P.;
Yamashita, N.; Zhou, B. S.; Shi, X. J.; Wang, J. X.; Giesy, J. P.; Yu, H.; Lam, P. K. S.
Chemosphere 2007, 68, 2085.
(32) So, M. K.; Taniyasu, S.; Yamashita, N.; Giesy, J. P.; Zheng, J.; Fang, Z.; Im, S.
H.; Lam, P. K. S. Environ. Sci. Technol. 2004, 38, 4056.
(33) Yamashita, N.; Kannan, K.; Taniyasu, S.; Horii, Y.; Okazawa, T.; Petrick, G.;
Gamo, T. Environ. Sci. Technol. 2004, 38, 5522.
(34) Yamashita, N.; Taniyasu, S.; Petrick, G.; Wei, S.; Gamo, T.; Lam, P. K. S.;
Kannan, K. Chemosphere 2008, 70, 1247.
(35) Calafat, A. M.; Kuklenyik, Z.; Caudill, S. P.; Reidy, J. A.; Needham, L. L.
Environ. Sci. Technol. 2006, 40, 2128.
(36) Calafat, A. M.; Needham, L. L.; Kuklenyik, Z.; Reidy, J. A.; Tully, J. S.; Aguilar-
Villalobos, M.; Naeher, L. P. Chemosphere 2006, 63, 490.

56
(37) Martin, J. W.; Whittle, D. M.; Muir, D. C. G.; Mabury, S. A. Environ. Sci.
Technol. 2004, 38, 5379.
(38) Martin, J. W.; Smithwick, M. M.; Braune, B. M.; Hoekstra, P. F.; Muir, D. C. G.;
Mabury, S. A. Environ. Sci. Technol. 2004, 38, 373.
(39) Giesy, J. P.; Kannan, K. Environ. Sci. Technol. 2001, 35, 1339.
(40) Holmstrom, K. E.; Jarnberg, U.; Bignert, A. Environ. Sci. Technol. 2005, 39, 80.
(41) Houde, M.; Balmer, B. C.; Brandsma, S.; Wells, R. S.; Rowles, T. K.; Solomon,
K. R.; Muir, D. C. G. Environ. Toxicol. Chem. 2006, 25, 2405.
(42) Houde, M.; Martin, J. W.; Letcher, R. J.; Solomon, K. R.; Muir, D. C. G. Environ.
Sci. Technol. 2006, 40, 3463.
(43) Kannan, K.; Choi, J. W.; Iseki, N.; Senthilkumar, K.; Kim, D. H.; Masunaga, S.;
Giesy, J. P. Chemosphere 2002, 49, 225.
(44) Kannan, K.; Corsolini, S.; Falandysz, J.; Fillmann, G.; Kumar, K. S.; Loganathan,
B. G.; Mohd, M. A.; Olivero, J.; Van Wouwe, N.; Yang, J. H.; Aldous, K. M. Environ.
Sci. Technol. 2004, 38, 4489.
(45) Kannan, K.; Corsolini, S.; Falandysz, J.; Oehme, G.; Focardi, S.; Giesy, J. P.
Environ. Sci. Technol. 2002, 36, 3210.
(46) Kannan, K.; Koistinen, J.; Beckmen, K.; Evans, T.; Gorzelany, J. F.; Hansen, K.
J.; Jones, P. D.; Helle, E.; Nyman, M.; Giesy, J. P. Environ. Sci. Technol. 2001, 35, 1593.
(47) Kannan, K.; Newsted, J.; Halbrook, R. S.; Giesy, J. P. Environ. Sci. Technol.
2002, 36, 2566.
(48) Kannan, K.; Tao, L.; Sinclair, E.; Pastva, S. D.; Jude, D. J.; Giesy, J. P. Arch.
Environ. Contam. Toxicol. 2005, 48, 559.

57
(49) Nakata, H.; Kannan, K.; Nasu, T.; Cho, H. S.; Sinclair, E.; Takemura, A. Environ.
Sci. Technol. 2006, 40, 4916.
(50) Olsen, G. W.; Church, T. R.; Larson, E. B.; van Belle, G.; Lundberg, J. K.;
Hansen, K. J.; Burris, J. M.; Mandel, J. H.; Zobel, L. R. Chemosphere 2004, 54, 1599.
(51) Olsen, G. W.; Church, T. R.; Miller, J. P.; Burris, J. M.; Hansen, K. J.; Lundberg,
J. K.; Armitage, J. B.; Herron, R. M.; Medhdizadehkashi, Z.; Nobiletti, J. B.; O'Neill, E.
M.; Mandel, J. H.; Zobel, L. R. Environ. Health Perspect. 2003, 111, 1892.
(52) Olsen, G. W.; Huang, H. Y.; Helzlsouer, K. J.; Hansen, K. J.; Butenhoff, J. L.;
Mandel, J. H. Environ. Health Perspect. 2005, 113, 539.
(53) Olsen, G. W.; Mair, D. C.; Reagen, W. K.; Ellefson, M. E.; Ehresman, D. J.;
Butenhoff, J. L.; Zobel, L. R. Chemosphere 2007, 68, 105.
(54) Sinclair, E.; Mayack, D. T.; Roblee, K.; Yamashita, N.; Kannan, K. Arch.
Environ. Contam. Toxicol. 2006, 50, 398.
(55) Smithwick, M.; Mabury, S. A.; Solomon, K. R.; Sonne, C.; Martin, J. W.; Born,
E. W.; Dietz, R.; Derocher, A. E.; Letcher, R. J.; Evans, T. J.; Gabrielsen, G. W.; Nagy,
J.; Stirling, I.; Taylor, M. K.; Muir, D. C. G. Environ. Sci. Technol. 2005, 39, 5517.
(56) Taniyasu, S.; Kannan, K.; Horii, Y.; Hanari, N.; Yamashita, N. Environ. Sci.
Technol. 2003, 37, 2634.
(57) Tomy, G. T.; Budakowski, W.; Halldorson, T.; Helm, P. A.; Stern, G. A.; Friesen,
K.; Pepper, K.; Tittlemier, S. A.; Fisk, A. T. Environ. Sci. Technol. 2004, 38, 6475.
(58) Van de Vijver, K. I.; Hoff, P. T.; Das, K.; Van Dongen, W.; Esmans, E. L.;
Siebert, U.; Bouquegneau, J. M.; Blust, R.; De Coen, W. M. Mar. Pollut. Bull. 2004, 48,
992.
58
(59) Verreault, J.; Berger, U.; Gabrielsen, G. W. Environ. Sci. Technol. 2007, 41,
6671.
(60) Prevedouros, K.; Cousins, I. T.; Buck, R. C.; Korzeniowski, S. H. Environ. Sci.
Technol. 2006, 40, 32.
(61) Kubwabo, C.; Stewart, B.; Zhu, J. P.; Marro, L. J. Environ. Monit. 2005, 7, 1074.
(62) Moriwaki, H.; Takata, Y.; Arakawa, R. J. Environ. Monit. 2003, 5, 753.
(63) Ellis, D. A.; Mabury, S. A.; Martin, J. W.; Muir, D. C. G. Nature 2001, 412, 321.
(64) Tittlemier, S. A.; Pepper, K.; Seymour, C.; Moisey, J.; Bronson, R.; Cao, X. L.;
Dabeka, R. W. J. Agric. Food Chem. 2007, 55, 3203.
(65) Begley, T. H.; White, K.; Honigfort, P.; Twaroski, M. L.; Neches, R.; Walker, R.
A. Food Addit. Contam. 2005, 22, 1023.
(66) Young, C. J.; Furdui, V. I.; Franklin, J.; Koerner, R. M.; Muir, D. C. G.; Mabury,
S. A. Environ. Sci. Technol. 2007, 41, 3455.
(67) D'Eon, J. C.; Hurley, M. D.; Wallington, T. J.; Mabury, S. A. Environ. Sci.
Technol. 2006, 40, 1862.
(68) Martin, J. W.; Ellis, D. A.; Mabury, S. A.; Hurley, M. D.; Wallington, T. J.
Environ. Sci. Technol. 2006, 40, 864.
(69) 3M Company. Study of the Stability of MeFOSEA in Aqueous Buffers; Docket
AR226-0380; Office of Pollution Prevention and Toxics, U.S. Environmental Protection
Agency: Washington, D.C., 1999; p. 69.
(70) Tomy, G. T.; Tittlemier, S. A.; Palace, V. P.; Budakowski, W. R.; Braekevelt, E.;
Brinkworth, L.; Friesen, K. Environ. Sci. Technol. 2004, 38, 758.
(71) Xu, L.; Krenitsky, D. M.; Seacat, A. M.; Butenhoff, J. L.; Anders, M. W. Chem.
Res. Toxicol. 2004, 17, 767.
59
(72) Additional Characterization of Metabolites of T-6292, T-6293 and T-6294 from
Rat and Human Hepatocytes; Docket AR226-0163; Office of Pollution Prevention and
Toxics, U.S. Environmental Protection Agency: Washington, D.C., 1998; p. 69.
(73) Effect of N-Alkyl Perfluorooctylsulfonamides on Mitochondrial Bioenergetics In
Vitro; Docket AR226-0166; Office of Pollution Prevention and Toxics, U.S.
Environmental Protection Agency: Washington, D.C., 1998; p. 10.
(74) Hagen, D. F.; Belisle, J.; Johnson, J. D.; Venkateswarlu, P. Anal. Biochem. 1981,
118, 336.
(75) Ellis, D. A.; Martin, J. W.; De Silva, A. O.; Mabury, S. A.; Hurley, M. D.;
Andersen, M. P. S.; Wallington, T. J. Environ. Sci. Technol. 2004, 38, 3316.
(76) Stock, N. L.; Lau, F. K.; Ellis, D. A.; Martin, J. W.; Muir, D. C. G.; Mabury, S. A.
Environ. Sci. Technol. 2004, 38, 991.
(77) Shoeib, M.; Harner, T.; Vlahos, P. Environ. Sci. Technol. 2006, 40, 7577.
(78) 3M Company. Phase-out Plan for POSF-Based Products Docket AR226-0588;
Office of Pollution Prevention & Toxics, U.S. Environmental Protection Agency:
Washington, D.C., 2000; p. 11.
(79) Yarwood, G.; Kemball-Cook, S.; Keinath, M.; Waterland, R. L.; Korzeniowski, S.
H.; Buck, R. C.; Russell, M. H.; Washburn, S. T. Environ. Sci. Technol. 2007.
(80) Investigation of Perfluorochemical (PFC) Contamination in Minnesota Phase 1;
Senate Environment Committee: Minnesota, 2006; p. 79.
(81) Schwarzenbach, R. P.; Escher, B. I.; Fenner, K.; Hofstetter, T. B.; Johnson, C. A.;
von Gunten, U.; Wehrli, B. Science 2006, 313, 1072.
(82) Lampert, D. J.; Frisch, M. A.; Speitel, G. E. Practice Periodical of Hazardous,
Toxic and Radioactive Waste Management 2007, 11.
60
(83) Tsang, W.; Burgess, D. R.; Babushok, V. Combustion Science and Technology
1998, 139, 385.
(84) Higgins, C. P.; Field, J. A.; Criddle, C. S.; Luthy, R. G. Environ. Sci. Technol.
2005, 39, 3946.
(85) Schroder, H. F. J. Chromatogr. A 2003, 1020, 131.
(86) Hollingsworth, J.; Sierra-Alvarez, R.; Zhou, M.; Ogden, K. L.; Field, J. A.
Chemosphere 2005, 59, 1219.
(87) Key, B. D.; Howell, R. D.; Criddle, C. S. Environ. Sci. Technol. 1998, 32, 2283.
(88) 3M Company. Biodegradation studies of fluorocarbons—III; Docket AR226-
0489; Office of Pollution Prevention & Toxics, U.S. Environmental Protection Agency:
Washington, D.C., 1978; p. 19.
(89) 3M Company. Biodegradation studies of Fluorocarbons; Docket AR226-0058;
Office of Pollution Prevention & Toxics, U.S. Environmental Protection Agency:
Washington, D.C., 1994; p. 4.
(90) Oppenlander, T. Photochemical Purification of Water and Air; Wiley-VCH:
Weinheim, 2003.
(91) Schroder, H. F.; Meesters, R. J. W. J. Chromatogr. A 2005, 1082, 110.
(92) Moriwaki, H.; Takagi, Y.; Tanaka, M.; Tsuruho, K.; Okitsu, K.; Maeda, Y.
Environ. Sci. Technol. 2005, 39, 3388.
(93) Hori, H.; Hayakawa, E.; Einaga, H.; Kutsuna, S.; Koike, K.; Ibusuki, T.;
Kiatagawa, H.; Arakawa, R. Environ. Sci. Technol. 2004, 38, 6118.
(94) Chen, J.; Zhang, P. Water Sci. Technol. 2006, 54.
(95) Chen, J.; Zhang, P.; Liu, J. Journal of Environmental Sciences—China 2007, 19.
(96) Yamamoto, T.; Noma, Y.; Sakai, S.; Shibata, Y. Environ. Sci. Technol. 2007.
61
(97) 3M Company. Summary of Photolysis Studies using Simulated Sunlight on the
Potassium Salt of Perfluorooctanesulfonic Acid; Docket AR226-0056; Office of
Pollution Prevention & Toxics, U.S. Environmental Protection Agency: Washington,
D.C., 1978; p. 17.
(98) 3M Company. FC-143 Photolysis Study using Simulated Sunlight; Docket
AR226-0490; Office of Pollution Prevention & Toxics, U.S. Environmental Protection
Agency: Washington, D.C., 1979; p. 15.
(99) Yamamoto, T.; Noma, Y.; Sakai, S. I.; Shibata, Y. Environ. Sci. Technol. 2007,
41, 5660.
(100) Hori, H.; Yamamoto, A.; Hayakawa, E.; Taniyasu, S.; Yamashita, N.; Kutsuna,
S.; Kiatagawa, H.; Arakawa, R. Environ. Sci. Technol. 2005, 39, 2383.
(101) Hori, H.; Yamamoto, A.; Kutsuna, S. Environ. Sci. Technol. 2005, 39, 7692.
(102) Kutsuna, S.; Hori, H. Int. J. Chem. Kin. 2007, 276.
(103) Chen, J.; Zhang, P. Y.; Zhang, L. Chem. Lett. 2006, 35, 230.
(104) Hori, H.; Hayakawa, E.; Koike, K.; Einaga, H.; Ibusuki, T. J. Mol. Catal. A—
Chem. 2004, 211, 35.
(105) Dillert, R.; Bahnemann, D.; Hidaka, H. Chemosphere 2007, 67.
(106) Yuan, Q.; Ravikrishna, R.; Valsaraj, K. T. Sep. Purif. Technol. 2001, 24.
(107) Hidaka, H.; Jou, H.; Nohara, K.; Zhao, J. Chemosphere 1992, 25, 1589.
(108) Vecitis, C. D.; Park, H.; Cheng, J.; Mader, B. M.; Hoffmann, M. R. J. Phys.
Chem. C 2008, 112, 43, 16850.
(109) Sundstrom, D. W.; Klei, H. E. Wastewater Treatment; Prentice-Hall: Englewood
Cliffs, 1979.
62
(110) Boulanger, B.; Vargo, J. D.; Schnoor, J. L.; Hornbuckle, K. C. Environ. Sci.
Technol. 2005, 39, 5524.
(111) Loganathan, B. G.; Sajwan, K. S.; Sinclair, E.; Kumar, K. S.; Kannan, K. Water
Research 2007, 41, 4611.
(112) DuPont. Accelerated Biodegradation of 8-2 Telomer B Alcohol; Docket AR226-
1264; Office of Pollution Prevention and Toxics, U.S. Environmental Protection Agency:
Washington, D.C., 2003; p. 45.
(113) Yamada, T.; Taylor, P. H.; Buck, R. C.; Kaiser, M. A.; Giraud, R. J. Chemosphere
2005, 61, 974.
(114) Tang, C. Y. Y.; Fu, Q. S.; Robertson, A. P.; Criddle, C. S.; Leckie, J. O. Environ.
Sci. Technol. 2006, 40, 7343.
(115) Tang, C. Y.; Fu, Q. S.; Criddle, C. S.; Leckie, J. O. Environ. Sci. Technol. 2007,
41, 2008.
(116) Higgins, C. P.; Luthy, R. G. Environ. Sci. Technol. 2006, 40, 7251.
(117) Johnson, R. L.; Anschutz, A. J.; Smolen, J. M.; Simcik, M. F.; Penn, R. L. J.
Chem. Eng. Data 2007, 52, 1165.
(118) Pera-Titus, M.; Garcia-Molina, V.; Banos, M. A.; Gimenez, J.; Esplugas, S. Appl.
Catal. B—Environ. 2004, 47, 219.
(119) Andreozzi, R.; Caprio, V.; Insola, A.; Marotta, R. Catal. Today 1999, 53, 51.
(120) Legrini, O.; Oliveros, E.; Braun, A. M. Chem. Rev. 1993, 93, 671.
(121) Kochany, J.; Bolton, J. R. Environ. Sci. Technol. 1992, 26, 262.
(122) Hoigne, J.; Bader, H. Water Research 1983, 17, 173.
(123) Hoigne, J.; Bader, H. Water Research 1983, 17, 185.
(124) Zepp, R. G.; Faust, B. C.; Hoigne, J. Environ. Sci. Technol. 1992, 26, 313.
63
(125) Hua, I.; Hoffmann, M. R. Environ. Sci. Technol. 1997, 31, 2237.
(126) Acero, J. L.; Haderlein, S. B.; Schmidt, T. C.; Suter, M. J. F.; Von Gunten, U.
Environ. Sci. Technol. 2001, 35, 4252.
(127) Buxton, G. V.; Greenstock, C. L.; Helman, W. P.; Ross, A. B. J. Phys. Chem. Ref.
Data 1988, 17, 513.
(128) An, Y. J.; Jeong, S. W. Journal of Colloid and Interface Science 2001, 242, 419.
(129) An, Y. J.; Carraway, E. R.; Schlautman, M. A. Water Research 2002, 36, 300.
(130) Huang, Q.; Hong, C. S. Chemosphere 2000, 41.
(131) Gromadzka, K.; Swietlik, J. Water Research 2007, 41, 2572.
(132) Waldemer, R. H.; Tratnyek, P. G.; Johnson, R. L.; Nurmi, J. T. Environ. Sci.
Technol. 2007, 41, 1010.
(133) Lau, T. K.; Chu, W.; Graham, N. J. D. Environ. Sci. Technol. 2007, 41, 613.
(134) Anipsitakis, G. P.; Dionysiou, D. D. Environ. Sci. Technol. 2004, 38, 3705.
(135) Anipsitakis, G. P.; Dionysiou, D. D. Environ. Sci. Technol. 2003, 37, 4790.
(136) Ball, D. L.; Edwards, J. O. J. Am. Chem. Soc. 1956, 78, 1125.
(137) Dogliott, L.; Hayon, E. J. Phys. Chem. 1967, 71, 2511.
(138) Kolthoff, I. M.; Miller, I. K. J. Am. Chem. Soc. 1951, 73, 3055.
(139) Maruthamuthu, P.; Padmaja, S.; Huie, R. E. Int. J. Chem. Kin. 1995, 27.
(140) Neta, P.; Huie, R. E.; Ross, A. B. J. Phys. Chem. Ref. Data 1988, 17, 1027.
(141) Schwarzenbach, R. P.; Gschwend, P. M.; Imboden, D. M. Environmental Organic
Chemistry, Second ed.; Wiley: New York, 2003.
(142) Zepp, R. G.; Cline, D. M. Environ. Sci. Technol. 1977, 11, 359.
64
(143) 3M Company. FM-3422: Photolysis Study using Simulated Sunlight; Docket
AR226-0363; Office of Pollution Prevention & Toxics, U.S. Environmental Protection
Agency: Washington, D.C., 1981; p. 20.
(144) Gauthier, S. A.; Mabury, S. A. Environ. Toxicol. Chem. 2005, 24, 1837.
(145) Lee, C.; Choi, W.; Kim, Y. G.; Yoon, J. Environ. Sci. Technol. 2005, 39, 2101.
(146) Getoff, N.; Schenck, G. O. Photochemistry and Photobiology 1968, 8, 167.
(147) Fricke, H.; Hart, E. J. J. Chem. Phys. 1936, 4, 418.
(148) Oppenlander, T.; Gliese, S. Chemosphere 2000, 40, 15.
(149) Jakob, L.; Hashem, T. M.; Burki, S.; Guindy, N. M.; Braun, A. M. Journal of
Photochemistry and Photobiology A—Chemistry 1993, 75, 97.
(150) Quici, N.; Litter, M. I.; Braun, A. A.; Oliveros, E. Journal of Photochemistry and
Photobiology A—Chemistry 2008, 197, 306.
(151) Chen, J.; Zhang, P. Y.; Liu, J. J. Environ. Sci 2007, 19, 387.
(152) Osborne, M. C.; Li, Q.; Smith, I. W. M. Physical Chemistry Chemical Physics
1999, 1, 1447.
(153) Ozer, R. R.; Ferry, J. L. Environ. Sci. Technol. 2001, 35, 3242.
(154) Fox, M. A.; Cardona, R.; Gaillard, E. J. Am. Chem. Soc. 1987, 109, 6347.
(155) Lee, J.; Kim, J.; Choi, W. Environ. Sci. Technol. 2007, 41, 3335.
(156) Weinstock, I. A. Chem. Rev. 1998, 98, 113.
(157) Akid, R.; Darwent, J. R. J. Chem. Soc.—Dalton Trans. 1985, 395.
(158) Hori, H.; Takano, Y.; Koike, K.; Takeuchi, K.; Einaga, H. Environ. Sci. Technol.
2003, 37, 418.
(159) Hoffmann, M. R.; Martin, S. T.; Choi, W. Y.; Bahnemann, D. W. Chem. Rev.
1995, 95, 69.
65
(160) Kormann, C.; Bahnemann, D. W.; Hoffmann, M. R. Environ. Sci. Technol. 1991,
25, 494.
(161) Dillert, R.; Bahnemann, D.; Hidaka, H. Chemosphere 2007, 67, 785.
(162) Guan, B.; Zhi, J.; Zhang, X.; Murakami, T.; Fujishima, A. Electrochem. Commun.
2007, 9, 2817.
(163) Lee, J.; Seliger, H. H. J. Chem. Phys. 1964, 40, 519.
(164) Hatchard, C. G.; Parker, C. A. Proceedings of the Royal Society of London Series
A—Mathematical and Physical Sciences 1956, 235, 518.
(165) Parker, C. A. Proceedings of the Royal Society of London Series A—
Mathematical and Physical Sciences 1953, 220, 104.
(166) Allmand, A. J.; Webb, W. W. Journal of the Chemical Society 1929, 1518.
(167) Hori, H.; Yamamoto, A.; Koike, K.; Kutsuna, S.; Osaka, I.; Arakawa, R.
Chemosphere 2007, 68, 572.
(168)http://chm.pops.int/Convention/POPsReviewCommittee/Chemicalsunderreview/tabi
d/242/language/en-US/Default.aspx.
(169) Sayles, G. D.; You, G. R.; Wang, M. X.; Kupferle, M. J. Environ. Sci. Technol.
1997, 31, 3448.
(170) Yak, H. K.; Wenclawiak, B. W.; Cheng, I. F.; Doyle, J. G.; Wai, C. M. Environ.
Sci. Technol. 1999, 33, 1307.
(171) Jones, C. G.; Silverman, J.; Al-Sheikhly, M.; Neta, P.; Poster, D. L. Environ. Sci.
Technol. 2003, 37, 5773.
(172) Hinz, D. C.; Wai, C. M.; Wenclawiak, B. W. J. Environ. Monit. 2000, 2, 45.
(173) Zhang, W. X. J. Nanopart. Res. 2003, 5, 323.
(174) Wang, C. B.; Zhang, W. X. Environ. Sci. Technol. 1997, 31, 2154.
66
(175) Hori, H.; Nagaoka, Y.; Sano, T.; Kutsuna, S. Chemosphere 2008, 70, 800.
(176) Hori, H.; Nagaoka, Y.; Yamamoto, A.; Sano, T.; Yamashita, N.; Taniyasu, S.;
Kutsuna, S.; Osaka, I.; Arakawa, R. Environ. Sci. Technol. 2006, 40, 1049.
(177) Macnicol, D. D.; Robertson, C. D. Nature 1988, 332, 59.
(178) Shoute, L. C. T.; Mittal, J. P.; Neta, P. J. Phys. Chem. 1996, 100, 11355.
(179) Shoute, L. C. T.; Mittal, J. P.; Neta, P. J. Phys. Chem. 1996, 100, 3016.
(180) Watson, P. L.; Tulip, T. H.; Williams, I. Organometallics 1990, 9, 1999.
(181) Combellas, C.; Kanoufi, F.; Thiebault, A. Journal of Physical Chemistry B 2003,
107, 10894.
(182) Corvaja, C.; Farnia, G.; Formenton, G.; Navarrini, W.; Sandona, G.; Tortelli, V. J.
Phys. Chem. 1994, 98, 2307.
(183) Marsella, J. A.; Gilicinski, A. G.; Coughlin, A. M.; Pez, G. P. J. Org. Chem.
1992, 57, 2856.
(184) Pud, A. A.; Shapoval, G. S.; Kukhar, V. P.; Mikulina, O. E.; Gervits, L. L.
Electrochim. Acta 1995, 40, 1157.
(185) Chen, X. D.; Lemal, D. M. J. Fluor. Chem. 2006, 127, 1158.
(186) Szajdzinska-Pietek, E.; Gebicki, J. L. Res. Chem. Intermed. 2000, 26, 897.
(187) Huang, L.; Dong, W. B.; Hou, H. Q. Chem. Phys. Lett. 2007, 436, 124.
(188) Ono, T.; Fukaya, H.; Hayashi, E.; Saida, H.; Abe, T.; Henderson, P. B.;
Fernandez, R. E.; Scherer, K. V. J. Fluor. Chem. 1999, 97, 173.
(189) Ochoa-Herrera, V.; Sierra-Alvarez, R.; Somogyi, A.; Jacobsen, N. E.; Wysocki,
V. H.; Field, J. A. Environ. Sci. Technol. 2008, 42, 3260.
(190) Johnson, T. L.; Scherer, M. M.; Tratnyek, P. G. Environ. Sci. Technol. 1996, 30,
2634.
67
(191) Roberts, A. L.; Totten, L. A.; Arnold, W. A.; Burris, D. R.; Campbell, T. J.
Environ. Sci. Technol. 1996, 30, 2654.
(192) Puls, R. W.; Paul, C. J.; Powell, R. M. Appl. Geochem. 1999, 14, 989.
(193) Tratnyek, P. G.; Johnson, T. L.; Scherer, M. M.; Eykholt, G. R. Ground Water
Monit. Remediat. 1997, 17, 108.
(194) Cantrell, K. J.; Kaplan, D. I.; Wietsma, T. W. J. Hazard. Mater. 1995, 42, 201.
(195) Liu, Y. Q.; Majetich, S. A.; Tilton, R. D.; Sholl, D. S.; Lowry, G. V. Environ. Sci.
Technol. 2005, 39, 1338.
(196) Elliott, D. W.; Zhang, W. X. Environ. Sci. Technol. 2001, 35, 4922.
(197) Kim, Y. H.; Carraway, E. R. Environ. Sci. Technol. 2000, 34, 2014.
(198) Zhang, W. X.; Wang, C. B.; Lien, H. L. Catal. Today 1998, 40, 387.
(199) Bransfield, S. J.; Cwiertny, D. M.; Livi, K.; Fairbrother, D. H. Appl. Catal. B—
Environ. 2007, 76, 348.
(200) Cwiertny, D. M.; Bransfield, S. J.; Livi, K. J. T.; Fairbrother, D. H.; Roberts, A.
L. Environ. Sci. Technol. 2006, 40, 6837.
(201) Marshall, W. D.; Kubatova, A.; Lagadec, A. J. M.; Miller, D. J.; Hawthorne, S. B.
Green Chem. 2002, 4, 17.
(202) Hart, E. J.; Anbar, M. The Hydrated Electron; John Wiley & Sons, Inc.: New
York, 1970.
(203) Mezyk, S. P.; Helgeson, T.; Cole, S. K.; Cooper, W. J.; Fox, R. V.; Gardinali, P.
R.; Mincher, B. J. J. Phys. Chem. A 2006, 110, 2176.
(204) Milosavljevic, B. H.; LaVerne, J. A.; Pimblott, S. M. J. Phys. Chem. A 2005, 109,
7751.

68
(205) Johnson, H. D.; Cooper, W. J.; Mezyk, S. P.; Bartels, D. M. Radiat. Phys. Chem.
2002, 65, 317.
(206) Nickelsen, M. G.; Cooper, W. J.; Secker, D. A.; Rosocha, L. A.; Kurucz, C. N.;
Waite, T. D. Radiat. Phys. Chem. 2002, 65, 579.
(207) Rahn, R. O.; Stephan, M. I.; Bolton, J. R.; Goren, E.; Shaw, P.-S.; Lykke, K. R.
Photochem. Photobiol. 2003, 78, 146.
(208) Anbar, M.; Hart, E. J. J. Phys. Chem. 1965, 69, 271.
(209) Czapski, G.; Schwarz, H. A. J. Phys. Chem. 1962, 66, 471.
(210) Matheson, M. S.; Mulac, W. A.; Rabani, J. J. Phys. Chem. 1963, 67, 2613.
(211) Hart, E. J.; Boag, J. W. J. Am. Chem. Soc. 1962, 84, 4090.
(212) Thomas-Smith, T. E.; Blough, N. V. Environ. Sci. Technol. 2001, 35, 2721.
(213) Hoigne, J.; Faust, B. C.; Haag, W. R.; Scully, F. E.; Zepp, R. G. Acs Symposium
Series 1989, 219, 363.
(214) Zepp, R. G.; Braun, A. M.; Hoigne, J.; Leenheer, J. A. Environ. Sci. Technol.
1987, 21, 485.
(215) Lian, R.; Oulianov, D. A.; Crowell, R. A.; Shkrob, I. A.; Chen, X. Y.; Bradforth,
S. E. J. Phys. Chem. A 2006, 110, 9071.
(216) Nishiwaki, T.; Usui, M.; Anda, K.; Hida, M. Bull. Chem. Soc. Jpn. 1979, 52, 821.
(217) Yao, Y.; Kakimoto, K.; Ogawa, H. I.; Kato, Y.; Hanada, Y.; Shinohara, R.;
Yoshino, E. Chemosphere 1997, 35, 2891.
(218) Hawari, J.; Demeter, A.; Samson, R. Environ. Sci. Technol. 1992, 26, 2022.
(219) Schwarz, H. A.; Dodson, R. W. J. Phys. Chem. 1989, 93, 409.
(220) Murakami, Y.; Kikuchi, J.; Hisaeda, Y.; Hayashida, O. Chem. Rev. 1996, 96, 721.
(221) Gantzer, C. J.; Wackett, L. P. Environ. Sci. Technol. 1991, 25, 715.
69
(222) Costentin, C.; Robert, M.; Saveant, J. M. J. Am. Chem. Soc. 2005, 127, 12154.
(223) Glod, G.; Angst, W.; Holliger, C.; Schwarzenbach, R. P. Environ. Sci. Technol.
1997, 31, 253.
(224) Wood, J. M.; Kennedy, F. S.; Wolfe, R. S. Biochemistry 1968, 7, 1707.
(225) Lexa, D.; Saveant, J. M. J. Am. Chem. Soc. 1978, 100, 3220.
(226) Lexa, D.; Saveant, J. M.; Zickler, J. J. Am. Chem. Soc. 1977, 99, 2786.
(227) Zehnder, A. J. B.; Wuhrmann, K. Science 1976, 194, 1165.
(228) Shey, J.; van der Donk, W. A. J. Am. Chem. Soc. 2000, 122, 12403.
(229) Schrauze, G.N.; Deutsch, E.; Windgass, R.J.. J. Am. Chem. Soc. 1968, 90, 2441.
(230) Krusic, P. J.; Marchione, A. A.; Roe, D. C. J. Fluor. Chem. 2005, 126, 1510.
(231) Ainagos, A. F. Kinet. Catal. 1991, 32, 720.
(232) Hynes, R. G.; Mackie, J. C.; Masri, A. R. J. Phys. Chem. A 1999, 103, 54.
(233) Atkinson, B.; McKeagan, D. Chem. Commun. 1966, 189.
(234) Bauer, S. H.; Hou, K. C.; Resler, E. L. Phys. Fluids 1969, 12, I125.
(235) Blake, P. G.; Tomlinso.A. D. Journal of the Chemical Society B—Physical
Organic 1971, 1596.
(236) Brown, C. E.; Smith, D. R. Can. J. Chem.—Rev. Can. Chim. 1988, 66, 609.
(237) Chowdhury, P. K. J. Phys. Chem. 1995, 99, 12084.
(238) Longfellow, C. A.; Smoliar, L. A.; Lee, Y. T.; Lee, Y. R.; Yeh, C. Y.; Lin, S. M.
J. Phys. Chem. A 1997, 101, 338.
(239) Matula, R. A. J. Phys. Chem. 1968, 72, 3054.
(240) Millward, G. E.; Tschuiko.E. J. Phys. Chem. 1972, 76, 292.
(241) Tschuiko, E. J. Chem. Phys. 1968, 49, 3115.
(242) Lee, M. C.; Choi, W. J. Ind. Eng. Chem. 2004, 10, 107.
70
(243) Burgess, D. R.; Zachariah, M. R.; Tsang, W.; Westmoreland, P. R. Prog. Energy
Combust. Sci. 1995, 21, 453.
(244) Lines, D.; Sutcliffe, H. J. Fluor. Chem. 1984, 25, 505.
(245) Lazerte, J. D.; Hals, L. J.; Reid, T. S.; Smith, G. H. J. Am. Chem. Soc. 1953, 75,
4525.
(246) Glockner, V.; Lunkwitz, K.; Prescher, D. Tenside Surf. Det. 1989, 26.
(247) Krusic, P. J.; Roe, D. C. Anal. Chem. 2004, 76, 3800.
(248) 3M Company. Laboratory-Scale Thermal Degradation of Perfluorooctanyl
Sulfonate and Related Substances; Docket AR226-1366; Office of Pollution Prevention
& Toxics, U.S. Environmental Protection Agency: Washington, D.C., 2003; p. 13.
(249) Ravishankara, A. R.; Solomon, S.; Turnipseed, A. A.; Warren, R. F. Science
1993, 259, 194.
(250) 3M Company. Final Report—Laboratory-Scale Thermal Degradation of
Perfluoro-Octanyl Sulfonate and Related Substances; Docket AR226-1367; Office of
Pollution Prevention & Toxics, U.S. Environmental Protection Agency: Washington,
D.C., 2003; p. 142.
(251) Leighton, T. G. The Acoustic Bubble; Academic Press: London, 1994.
(252) Mason, T. J.; Lorimer, J. P. Sonochemistry: theory, applications and uses of
ultrasound in chemistry; Halsted Press: New York, 1988.
(253) Suslick, K. S. Ultrasound: Its Chemical, Physical, and Biological Effects; VCH,
New York, 1988.
(254) Destaillats, H.; Hung, H. M.; Hoffmann, M. R. Environ. Sci. Technol. 2000, 34,
311.
(255) Kotronarou, A.; Mills, G.; Hoffmann, M. R. J. Phys. Chem. 1991, 95, 3630.
71
(256) Vinodgopal, K.; Ashokkumar, M.; Grieser, F. J. Phys. Chem. B 2001, 105, 3338.
(257) Manousaki, E.; Psillakis, E.; Kalogerakis, N.; Mantzavinos, D. Water Res. 2004,
38, 3751.
(258) Petrier, C.; Lamy, M. F.; Francony, A.; Benahcene, A.; David, B.; Renaudin, V.;
Gondrexon, N. J. Phys. Chem. 1994, 98, 10514.
(259) Hung, H. M.; Hoffmann, M. R. J. Phys. Chem. A 1999, 103, 2734.
(260) Jennings, B. H.; Townsend, S. N. J. Phys. Chem. 1961, 65, 1574.
(261) Petrier, C.; David, B.; Laguian, S. Chemosphere 1996, 32, 1709.
(262) Vecitis, C. D.; Park, H.; Cheng, J.; Mader, B. T.; Hoffmann, M. R. J. Phys. Chem.
A 2008, 112, 4261.
(263) Suslick, K. S.; Hammerton, D. A.; Cline, R. E. J. Am. Chem. Soc. 1986, 108,
5641.
(264) Price, G. J.; Ashokkumar, M.; Hodnett, M.; Zequiri, B.; Grieser, F. J. Phys.
Chem. B 2005, 109, 17799.
(265) Sunartio, D.; Ashokkumar, M.; Grieser, F. J. Am. Chem. Soc. 2007, 129, 6031.
(266) Brennen, C. E. Cavitation and Bubble Dynamics; Oxford University Press: New
York, 1995.
(267) Didenko, Y. T.; McNamara, W. B.; Suslick, K. S. J. Am. Chem. Soc. 1999, 121,
5817.
(268) Ciawi, E.; Rae, J.; Ashokkumar, M.; Grieser, F. J. Phys. Chem. B 2006, 110,
13656.
(269) Ashokkumar, M.; Grieser, F. J. Am. Chem. Soc. 2005, 127, 5326.
(270) Eddingsaas, N. C.; Suslick, K. S. J. Am. Chem. Soc. 2007, 129, 3838.
(271) Sostaric, J. Z.; Riesz, P. J. Am. Chem. Soc. 2001, 123, 11010.

72
(272) Kato, S.; Makide, Y.; Tominaga, T.; Takeuchi, K. J. Phys. Chem. 1987, 91, 4278.
(273) Kolaczkowski, S. T.; Plucinski, P.; Beltran, F. J.; Rivas, F. J.; McLurgh, D. B.
Chem. Eng. J. 1999, 73, 143.
(274) Chang, M. B.; Chang, J. S. Industrial & Engineering Chemistry Research 2006,
45, 4101.
(275) Destaillats, H.; Colussi, A. J.; Joseph, J. M.; Hoffmann, M. R. J. Phys. Chem. A
2000, 104, 8930.
(276) Weavers, L. K.; Malmstadt, N.; Hoffmann, M. R. Environ. Sci. Technol. 2000, 34,
1280.
(277) Lesko, T.; Colussi, A. J.; Hoffmann, M. R. Environ. Sci. Technol. 2006, 40, 6818.
(278) Weavers, L. K.; Ling, F. H.; Hoffmann, M. R. Environ. Sci. Technol. 1998, 32,
2727.
(279) Vecitis, C. D.; Park, H.; Cheng, J.; Mader, B. T.; Hoffmann, M. R. J. Phys. Chem.
C 2008, 112, 16850.
73
Chapter 3
Sonolytic Conversion of the Aqueous
Perfluorinated Surfactants,
Perfluorooctanoate (PFOA) and
Perfluorooctanesulfonate (PFOS) into
Inorganic Constituents
Sections reprinted with permission from Vecitis, C. D.; Park H.; Cheng J.; Mader, B. T.;
Hoffmann, M. R. Journal of Physical Chemistry A 2008, 112, 4261–4270.
© 2008 American Chemical Society
74
Abstract
The perfluorinated surfactants perfluorooctane sulfonate (PFOS) and perfluorooctanoate
(PFOA) are recognized as widespread in the environment as well as recalcitrant towards
most conventional water treatment technologies. In this study acoustic cavitation as
driven by high-frequency ultrasound is shown to be effective in the degradation of
aqueous solutions of PFOS and PFOA, and effective over a wide range of concentrations
from 10 nM to 10 μM for a given compound. Sulfur, fluorine, and carbon mass balances
indicate that mineralization occurs immediately following the degradation of the initial
perfluorinated surfactant. Near-complete conversion of PFOS and PFOA to CO, CO2, F-,
and SO42- occurs due to pyrolytic reactions at the surface and vapor phase of transiently
collapsing cavitation bubbles. The initial PFOS or PFOA pyrolytic degradation occurs at
the bubble-water interface and involves the loss of the ionic functional group leading to
the formation of the corresponding 1H-fluoroalkane or perfluoroolefin. The
fluorochemical intermediates undergo a series of pyrolytic reactions in the bubble vapor
leading to C1 fluoro-radicals. Secondary vapor-phase bimolecular reactions coupled with
concomitant hydrolysis converts the C1 fluoro-radicals to carbon monoxide, carbon
dioxide and HF, forming a proton and fluoride upon dissolution. Sonochemical half-
lives, which are calculated from high-temperature gas-phase kinetics, are consistent with
kinetic observations and suggest that mineralization occurs shortly after an initial
perfluorinated surfactant interfacial pyrolysis.
75
Introduction
Over the last 60 years, fluorochemicals (FCs) have been used for a wide variety of
applications such as water-proofing of materials, protective coating of metals, fire-
fighting foams for electrical and grease fires, semi-conductor etching, and lubrication.
The widespread use of these compounds is due to their favorable physical properties,
which include chemical stability, low coefficients of friction, and low polarizabilities
(i.e., fluorophilicity)1. The same properties that make FCs valuable as commercial
products make them difficult to treat using most conventional environmental remediation
strategies or waste treatment technologies2–4. For example, Schultz et al.3 reported that
the total mass of PFOA and PFOS is not reduced (i.e., is resistant to physical and
biological treatments) during conventional wastewater treatment processes.
Consequently, fluorochemicals have become widespread in the environment5–7.
Most conventional degradation technologies are ineffective for the in situ degradation
of aqueous PFOS and PFOA, present in the aqueous phase, since they are inherently
recalcitrant to chemical and microbiological treatment2,3,8–11. Advanced oxidation
processes (AOPs)12, which utilize the hydroxyl radical, such as UV-ozonation13,
peroxone (i.e., a mixture of O3 and H2O2)13, or Fenton’s reagent (i.e., H2O2 and Fe2+
salts)13–15 have been shown to be ineffective for PFOA and PFOS destruction. A number
of photolytic methods such as direct photolysis15–20, persulfate photolysis16,21–23, alkaline
isopropanol photolysis19 and photocatalysis15,24–28 have shown varying degrees of
efficacy on higher concentrations of perfluorocarboxylates. However, none of these
methods lead to the mineralization of PFOS and PFOA. Reduction by elemental iron
under near-super-critical water conditions has been shown to be possible for PFOS
degradation29. However, scale-up of high-pressure, high-temperature treatment systems is
76
difficult30. Moriwaki et al.14 have shown that ultrasonic irradiation of aqueous solutions
can degrade these compounds with fluoride and sulfate as the primary degradation
products.
Sonochemistry, as induced by ultrasonic irradiation of aqueous solutions at near-
ambient temperatures and pressures, has been shown to be effective for the treatment of a
wide variety of chemical contaminants31–35. Ultrasonic pressure waves force the
formation and quasi-adiabatic collapse of vapor bubbles formed from pre-existing gas
nuclei36. The transient collapse of aqueous cavitation bubbles has been shown through
chemical methods to raise average internal vapor temperatures near 4000 K37–39 and are
supported by single-bubble collapse models40–42, while bubble-water interface
temperatures have been calculated to be in the range of 600 to 1000 K34. These transient
high temperatures lead to in situ pyrolytic reactions in the vapor and interfacial regions of
each collapsing bubble, resulting in the breakdown of water-producing hydroxyl radicals
(.OH), oxygen atoms (O), and hydrogen atoms (H.). These transient radicals react readily
with compounds in the bubble gas-phase or at the bubble interface. Some of the radical
species are dispersed into the bulk solution by nonspherical bubble collapse. Ultrasonic
degradation is effective for the removal of contaminants with high Henry’s Law
constants43–45 that partition into the vapor phase of the bubble, or for chemical
contaminants which partition to the air-water interface46–48 such as PFOS and PFOA14.
We hereby report a detailed investigation into the kinetics and mechanism of the
sonochemical conversion of aqueous PFOS and PFOA to inorganic constituents.
Experimental Methods
Ammonium perfluorooctanoate (APFO) and potassium perfluorooctanesulfonate
(PFOS) standards, consisting of a mixture of branched and linear isomers, were provided
77
by 3M Company. Ammonium acetate (> 99 %) and methanol (HR-GC > 99.99 %) were
obtained from EMD Chemicals, Inc. Aqueous solutions were prepared with purified
water using a Milli-Q system (18.2 MΩ cm-1 resistivity).
Sonications at frequencies of 354 and 618 kHz were performed using an Allied Signal
Elac Nautik ultrasonic transducer (23.6 cm2) at an applied power of 150 W with the
solution contained in a 600 mL jacketed glass reactor. The temperature was controlled
with a Neslab RTE-111 refrigerated bath maintained at 10 ºC. Sonications performed at
500 kHz were completed with an Undatim ultrasonic transducer (25.5 cm2) at an applied
power of 75 W with the solution contained in a 400 mL jacketed glass reactor. The
temperature was controlled with a Haake A80 refrigerated bath set to 10 oC. All
reactions were sparged with argon for at least 30 minutes prior to reaction. Initial
solution pH was between 7 and 8 for all reactions. Calorimetry was done to determine
the acoustic power transferred to solution. At 354, 500, and 618 kHz the applied
(calorimetric) power densities in W L-1 were 250 (200), 150 (128), and 250 (208),
respectively. The applied acoustic power densities will be referred to in the text.
A number of reactor configurations, initial concentrations, and mixtures were used for
the various experiments. PFOS and PFOA were analyzed for in all experiments by an
HPLC-MSD-Ion Trap (Agilent). Fluoride and sulfate were analyzed by ion
chromatography (Dionex) and completed using 618 kHz, 250 W L-1, and 6.4 W cm-2 on a
closed system where the produced gas was resparged into solution to retain all products:
PFOS and PFOA were sonicated separately at initial concentrations of approximately 10
µM. Trace gas analyses by GC-MS (Agilent) and FT-IR (Midac) were sonicated at 500
kHz, 150 W L-1, and 2.9 W cm2 on a closed system where the headspace was recirculated
but not resparged through a 300 mL multiple reflection FT-IR cell with an in-line valved
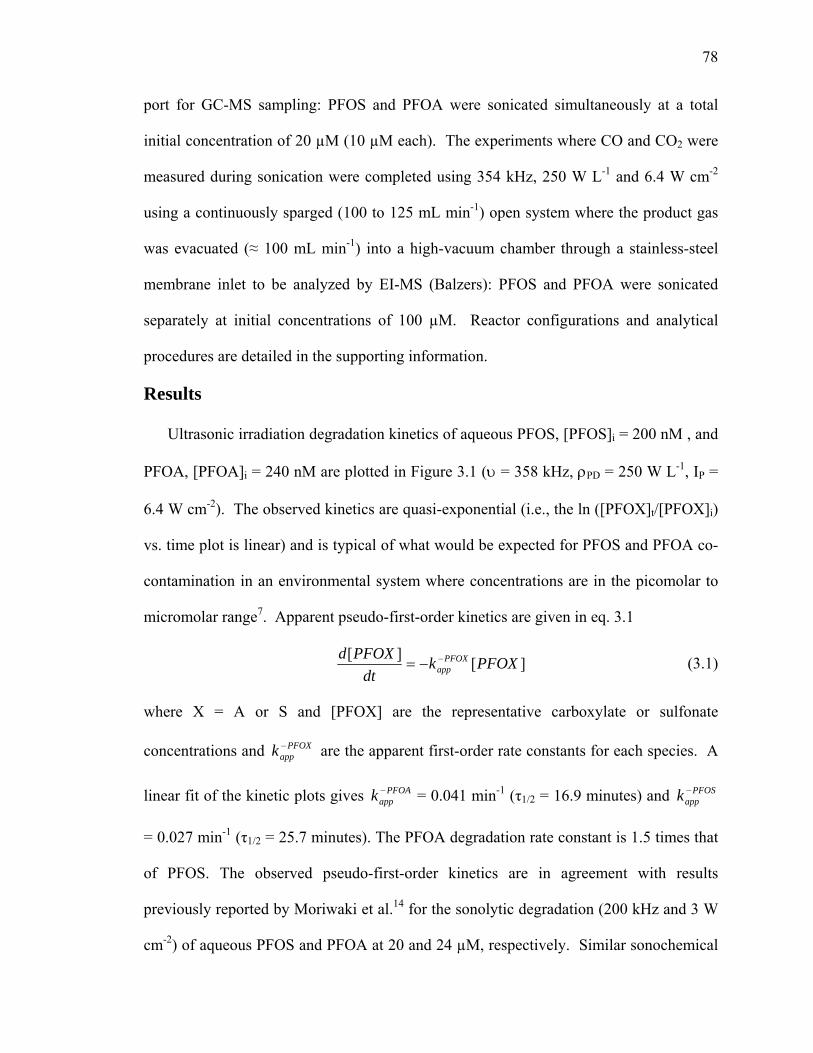
78
port for GC-MS sampling: PFOS and PFOA were sonicated simultaneously at a total
initial concentration of 20 µM (10 µM each). The experiments where CO and CO2 were
measured during sonication were completed using 354 kHz, 250 W L-1 and 6.4 W cm-2
using a continuously sparged (100 to 125 mL min-1) open system where the product gas
was evacuated (≈ 100 mL min-1) into a high-vacuum chamber through a stainless-steel
membrane inlet to be analyzed by EI-MS (Balzers): PFOS and PFOA were sonicated
separately at initial concentrations of 100 µM. Reactor configurations and analytical
procedures are detailed in the supporting information.
Results
Ultrasonic irradiation degradation kinetics of aqueous PFOS, [PFOS]i = 200 nM , and
PFOA, [PFOA]i = 240 nM are plotted in Figure 3.1 (υ = 358 kHz, ρPD = 250 W L-1, IP =
6.4 W cm-2). The observed kinetics are quasi-exponential (i.e., the ln ([PFOX]t/[PFOX]i)
vs. time plot is linear) and is typical of what would be expected for PFOS and PFOA co-
contamination in an environmental system where concentrations are in the picomolar to
micromolar range7. Apparent pseudo-first-order kinetics are given in eq. 3.1
][][ PFOXkdt
PFOXd PFOXapp−−= (3.1)
where X = A or S and [PFOX] are the representative carboxylate or sulfonate
concentrations and are the apparent first-order rate constants for each species. A
linear fit of the kinetic plots gives = 0.041 min
PFOXappk −
PFOAappk − -1 (τ1/2 = 16.9 minutes) and
= 0.027 min
PFOSappk −
-1 (τ1/2 = 25.7 minutes). The PFOA degradation rate constant is 1.5 times that
of PFOS. The observed pseudo-first-order kinetics are in agreement with results
previously reported by Moriwaki et al.14 for the sonolytic degradation (200 kHz and 3 W
cm-2) of aqueous PFOS and PFOA at 20 and 24 µM, respectively. Similar sonochemical
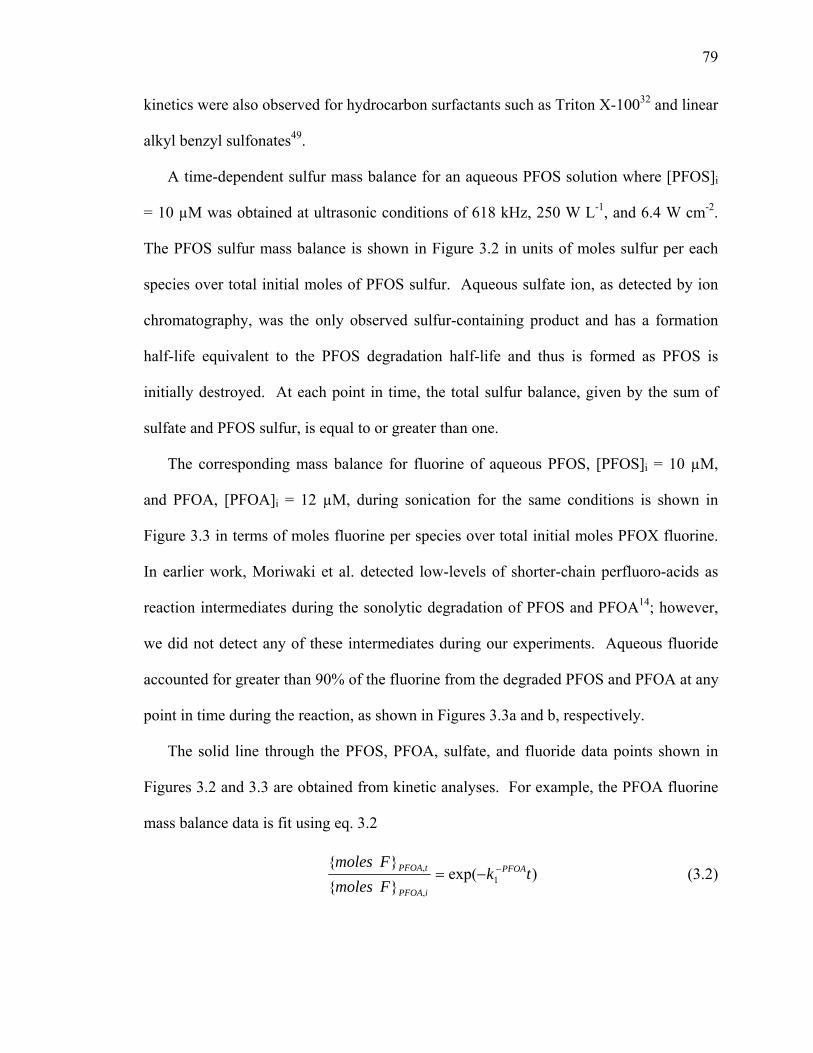
79
kinetics were also observed for hydrocarbon surfactants such as Triton X-10032 and linear
alkyl benzyl sulfonates49.
A time-dependent sulfur mass balance for an aqueous PFOS solution where [PFOS]i
= 10 µM was obtained at ultrasonic conditions of 618 kHz, 250 W L-1, and 6.4 W cm-2.
The PFOS sulfur mass balance is shown in Figure 3.2 in units of moles sulfur per each
species over total initial moles of PFOS sulfur. Aqueous sulfate ion, as detected by ion
chromatography, was the only observed sulfur-containing product and has a formation
half-life equivalent to the PFOS degradation half-life and thus is formed as PFOS is
initially destroyed. At each point in time, the total sulfur balance, given by the sum of
sulfate and PFOS sulfur, is equal to or greater than one.
The corresponding mass balance for fluorine of aqueous PFOS, [PFOS]i = 10 µM,
and PFOA, [PFOA]i = 12 µM, during sonication for the same conditions is shown in
Figure 3.3 in terms of moles fluorine per species over total initial moles PFOX fluorine.
In earlier work, Moriwaki et al. detected low-levels of shorter-chain perfluoro-acids as
reaction intermediates during the sonolytic degradation of PFOS and PFOA14; however,
we did not detect any of these intermediates during our experiments. Aqueous fluoride
accounted for greater than 90% of the fluorine from the degraded PFOS and PFOA at any
point in time during the reaction, as shown in Figures 3.3a and b, respectively.
The solid line through the PFOS, PFOA, sulfate, and fluoride data points shown in
Figures 3.2 and 3.3 are obtained from kinetic analyses. For example, the PFOA fluorine
mass balance data is fit using eq. 3.2
)exp(
1,
, tkFmolesFmoles PFOA
iPFOA
tPFOA −−= (3.2)
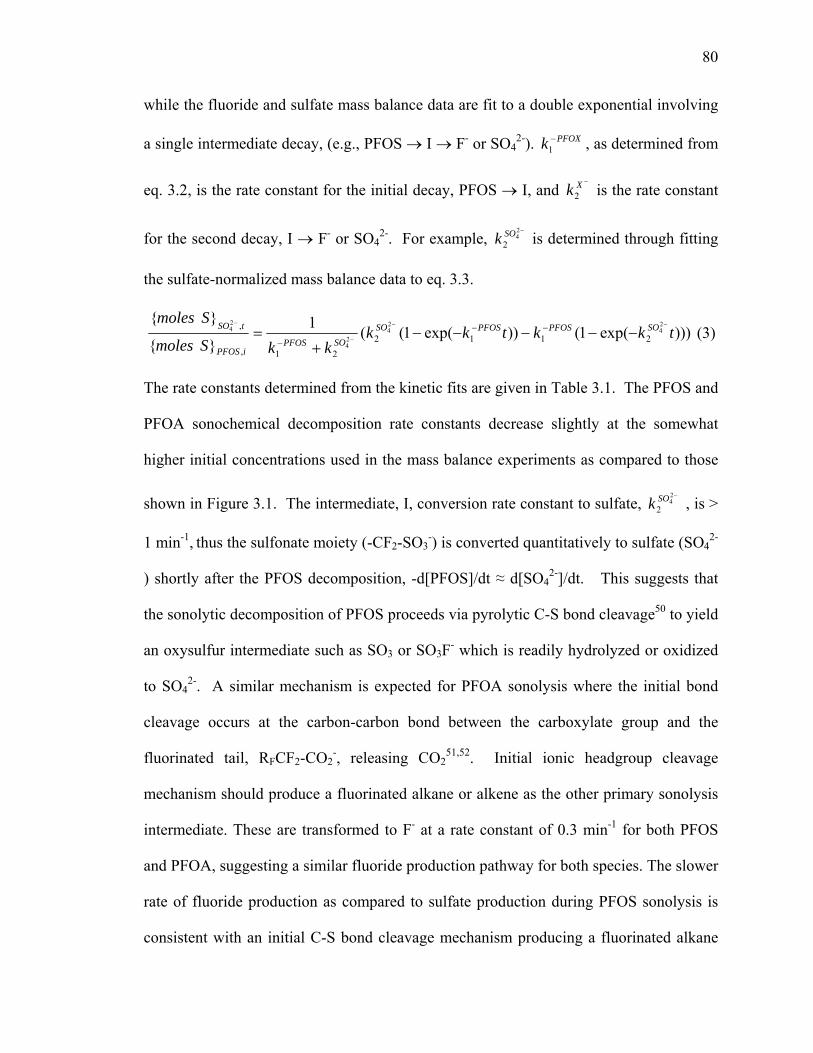
80
while the fluoride and sulfate mass balance data are fit to a double exponential involving
a single intermediate decay, (e.g., PFOS → I → F- or SO42-). , as determined from
eq. 3.2, is the rate constant for the initial decay, PFOS → I, and is the rate constant
for the second decay, I → F
PFOXk −1
−Xk2
- or SO42-. For example, is determined through fitting
the sulfate-normalized mass balance data to eq. 3.3.
−24
2SOk
)))exp(1())exp(1((1
24
24
24
24
211221,
, tkktkkkkSmoles
SmolesSOPFOSPFOSSO
SOPFOSiPFOS
tSO −−
−
−
−−−−−+
= −−
− (3)
The rate constants determined from the kinetic fits are given in Table 3.1. The PFOS and
PFOA sonochemical decomposition rate constants decrease slightly at the somewhat
higher initial concentrations used in the mass balance experiments as compared to those
shown in Figure 3.1. The intermediate, I, conversion rate constant to sulfate, , is >
1 min
−24
2SOk
-1, thus the sulfonate moiety (-CF2-SO3-) is converted quantitatively to sulfate (SO4
2-
) shortly after the PFOS decomposition, -d[PFOS]/dt ≈ d[SO42-]/dt. This suggests that
the sonolytic decomposition of PFOS proceeds via pyrolytic C-S bond cleavage50 to yield
an oxysulfur intermediate such as SO3 or SO3F- which is readily hydrolyzed or oxidized
to SO42-. A similar mechanism is expected for PFOA sonolysis where the initial bond
cleavage occurs at the carbon-carbon bond between the carboxylate group and the
fluorinated tail, RFCF2-CO2-, releasing CO2
51,52. Initial ionic headgroup cleavage
mechanism should produce a fluorinated alkane or alkene as the other primary sonolysis
intermediate. These are transformed to F- at a rate constant of 0.3 min-1 for both PFOS
and PFOA, suggesting a similar fluoride production pathway for both species. The slower
rate of fluoride production as compared to sulfate production during PFOS sonolysis is
consistent with an initial C-S bond cleavage mechanism producing a fluorinated alkane
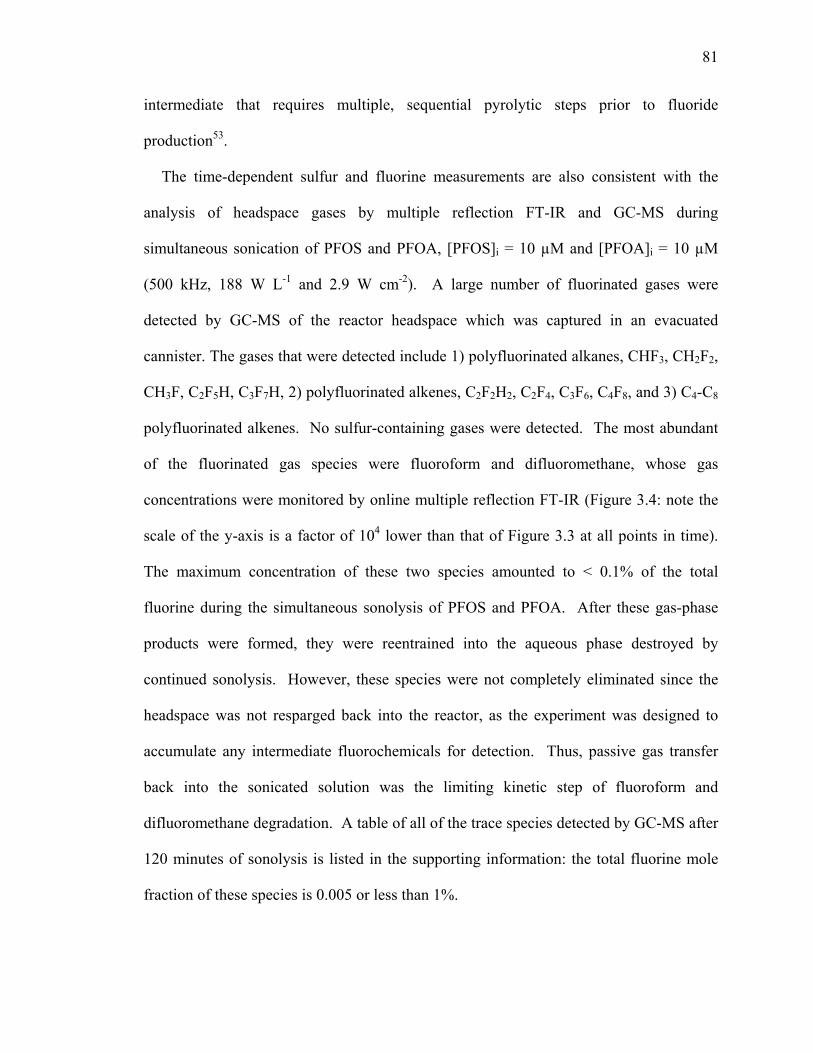
81
intermediate that requires multiple, sequential pyrolytic steps prior to fluoride
production53.
The time-dependent sulfur and fluorine measurements are also consistent with the
analysis of headspace gases by multiple reflection FT-IR and GC-MS during
simultaneous sonication of PFOS and PFOA, [PFOS]i = 10 µM and [PFOA]i = 10 µM
(500 kHz, 188 W L-1 and 2.9 W cm-2). A large number of fluorinated gases were
detected by GC-MS of the reactor headspace which was captured in an evacuated
cannister. The gases that were detected include 1) polyfluorinated alkanes, CHF3, CH2F2,
CH3F, C2F5H, C3F7H, 2) polyfluorinated alkenes, C2F2H2, C2F4, C3F6, C4F8, and 3) C4-C8
polyfluorinated alkenes. No sulfur-containing gases were detected. The most abundant
of the fluorinated gas species were fluoroform and difluoromethane, whose gas
concentrations were monitored by online multiple reflection FT-IR (Figure 3.4: note the
scale of the y-axis is a factor of 104 lower than that of Figure 3.3 at all points in time).
The maximum concentration of these two species amounted to < 0.1% of the total
fluorine during the simultaneous sonolysis of PFOS and PFOA. After these gas-phase
products were formed, they were reentrained into the aqueous phase destroyed by
continued sonolysis. However, these species were not completely eliminated since the
headspace was not resparged back into the reactor, as the experiment was designed to
accumulate any intermediate fluorochemicals for detection. Thus, passive gas transfer
back into the sonicated solution was the limiting kinetic step of fluoroform and
difluoromethane degradation. A table of all of the trace species detected by GC-MS after
120 minutes of sonolysis is listed in the supporting information: the total fluorine mole
fraction of these species is 0.005 or less than 1%.

82
A carbon mass balance for the sonolytic degradation of PFOA and PFOS is plotted in
Figures 3.5a and b as moles of carbon per species over the total initial moles of carbon
vs. time, [PFOS]i = 100 µM and [PFOA]i = 100 µM (354 kHz, 250 W L-1, and 6.4 W cm-
2). The primary carbon-containing species were the initial surfactant as detected by
HPLC-MS and CO and CO2, which were detected using real-time EI-MS. Other possible
gaseous intermediates including formaldehyde, carbonyl fluoride, HF did not exceed the
limit of detection. Real-time mass spectrometry was used to reduce the effect of any
secondary gas product oxidation, CO(g) → CO2(g), or reduction/thermolysis, CO2(g) →
CO(g)54,55, that may occur in subsequent bubble collapse events. After 120 minutes of
sonolysis, 64.6 ≤ 9.2% of the carbon from decomposed PFOA was converted to CO and
32.1 ≤ 7.0% was converted to CO2, while, in the case of PFOS sonolysis, the conversions
to CO and CO2 are 74.0 ≤ 5.3 % and 14.6 ≤ 5.0%, respectively, yielding observed
product ratios of [CO]/[CO2]PFOA = 2.0 and [CO]/[CO2]PFOS = 5.1.
Discussion
Interfacial Pyrolysis of the Initial Perfluorinated Surfactant
PFOS and PFOA are surfactants56–59. PFOS is considered to be a more effective
surfactant since it has one more carbon than PFOA in its perfluorinated tail. Their
surfactant properties coupled with their small Henry’s constants (Table 3.2) precludes
their diffusive transfer to the bubble vapor phase. These properties are consistent with
sonochemical degradation at the bubble-water interface14 Oxidation by hydroxyl
radicals32,47 at collapsing bubble-water interfaces is a possible mechanism. An upper
limit for the second-order rate constant for the reaction of hydroxyl radical, < 106 M-1s-1,
with both PFOA and PFOS has been estimated by analogy to the measured rate constant
of hydroxyl radical reacting with trifluoroacetate. For comparison, oxalate (C2O42-),
83
which is thought to be responsible for the slow TOC elimination during sonication60, has
a second-order rate constant with hydroxyl radical of 4.7 x 10⁷ M-1s-1; which is at least an
order of magnitude greater than that of PFOS and PFOA. TOC elimination, and thus
oxalate oxidation, has a sonolytic half-life under similar conditions of ten hours60. Given
these arguments, hydroxyl radical oxidation appears to play a minor role in PFOS and
PFOA degradation14. Thus, interfacial pyrolytic decomposition appears to be the primary
pathway for the sonochemical degradation of the perfluorinated surfactants.
Interfacial pyrolysis can be broken down conceptually into two fundamental steps.
The first step involves the diffusion and adsorption of PFOS or PFOA to a transiently
cavitating bubble interface (Step 1, Scheme 3.1) followed by a second step involving
pyrolytic degradation at the cavitating-bubble interface (Step 2, Scheme 3.1).
The time-dependent mass balances shown in Figures 3.2–3.5 provide some insight into
the sonolytic degradation mechanism of PFOS and PFOA. Of particular interest is the
almost immediate production of inorganic sulfur (sulfate) and fluorine (fluoride)
contrasted with a slightly delayed production of CO and CO2. This suggests that
dt
tionMineralizaddtPFOXd )(][
=− (3.4)
and that the primary intermediates produced during PFOS and PFOA decomposition
appear to have much shorter half-lives than precursors. Given these observations, it is
clear that
dt
PFOXddt
teIntermediaPFd ][][>>
− (3.5)
and that the decomposition of the perfluoro-intermediates occurs in the vapor phase.
Sonochemical reactions involving species that can partition to the vapor phase of a
collapsing bubble (i.e., those having high Henry’s constants) generally have the fastest

84
degradation rates. The similarity between the fluorochemical surfactant degradation rates
and the rates of mineralization suggests that the fluorointermediates formed from the
initial pyrolytic reactions have high Henry’s constants.
Pyrolysis of perfluorinated surfactants has been reported for several
perfluoroalkanecarboxylates and perfluoroalkanesulfonates in the solid phase50,52,61 and
perfluoroalkanecarboxylates in the vapor phase51,62. The primary products of
perfluoroalkanecarboxylate pyrolysis product are reported to be the analogous 1H-
perfluoroalkanes (eq. 3.6) for NH4+ salts52,62, and perfluoroolefins (eq. 3.7) with lesser
amounts of perfluoroanhydrides and perfluoroacyl fluorides for alkaline and alkali salts52.
)(3)(2)(2523)(4623 )()( gggs NHCOHCFCFCFNHCOOCFCF ++⎯→⎯Δ+− (3.6)
)()(2)(2423)(623 )()( sggs FKCOCFCFCFCFKCOOCFCF −+Δ+− ++=⎯→⎯ (3.7)
Products generated during the thermal degradation of perfluorosulfonates have not been
identified50. Ammonium perfluorooctanoate, which is thermally converted to the 1H-
perfluoroalkane52,62, decomposes at a temperature 50 to 100 K lower than that of the
alkali and alkaline salts50,52,61. Excess water has been observed to have an effect on the
Arrhenius parameters of PFOA-NH4+ thermolysis62 by increasing log A values from 13.6
s-1 to 15.4 s-1 and activation energy from 150 kJ mol-1 to 172 kJ mol-1. These activation
energies are much lower than expected for the –CF2-CF2- bond breaking which are
typically > 300 kJ mol-1 (Table 3.3). Initial cleavage of the C-C bond between the
perfluorinated tail and the carboxylate group yields gaseous carbon dioxide and a
perfluoroalkyl anion (eq. 3.8). The perfluoroanion can form a 1H-perfluoroalkane by
proton transfer (eq. 3.9), which eliminates a C-F bond-breaking step (450 kJ mol-1) and
circumvents the perfluoroolefin formation pathway (eq. 3.10).

85
(3.8) )(22523623 )()( gCOCFCFCFCOOCFCF +⎯→⎯ −Δ−
(3.9) −+− +⎯⎯ →⎯ HOHCFCFCFCFCFCF OH25232523 )()( 2
(3.10) 24232523 )()( CFCFCFCFCFCFCF =⎯→⎯Δ−
A proton transfer mechanism can explain the lower decomposition temperatures of the
ammonium salts (eq. 3.6) as compared to the alkali and alkaline salts (eq. 3.7). Typical
thermal decomposition of similar perfluoroalkane-carboxylate and -sulfonate salts50
indicates that sulfonate salts decompose at higher temperatures (e.g., 100 to 200 K
higher) than corresponding carboxylate salts. These observations are consistent with the
relative sonolytic degradation rates of PFOA ( = 0.041 minPFOAappk − -1) and PFOS ( PFOS
appk − =
0.027 min-1), in spite of the greater interfacial activity and tendencies of PFOS.
In summary, initial PFOX decomposition involves the loss of the ionic headgroup:
CO2 in the case of PFOA, and SO3 in the case of PFOS. The pyrolytic cleavage of the
ionic headgroups of both molecules leads to the formation of C7 and C8
perfluorocarbanion intermediates for PFOA and PFOS, respectively. The
perfluorocarbanion is protonated to form a 1H-perfluoroalkane (eq. 3.9) or undergoes
fluoride elimination to form a perfluoroolefin (eq. 3.10), (Step 2, Scheme 3.1). SO3
produced during PFOS decomposition hydrolyzes rapidly (Step 3, Scheme 3.1) to form
sulfate with the release of two protons.
Unimolecular Decomposition of the Fluorocarbon Tail
The organo-fluorines in the C7 and C8 fluorochemical intermediates are
sonochemically converted into F- with a pseudo-first-order rate constant of 0.3 min-1 (τ1/2
86
= 2.3 min). The fluorochemical intermediate degradation rates are greater than the
sonochemical degradation rates reported for chlorinated hydrocarbons63,64. The Henry’s
constants for the likely 1H-perfluoroalkane (eq. 3.9) and perfluoroolefin (eq. 3.10)
intermediates have been estimated by two different methods and determined to be on the
order of 105 to 106 atm L mol-1 (Table 3.1). Colussi et al.45 established a correlation
between the Henry’s constant, , for chlorinated hydrocarbons, x, and their apparent
sonolytic degradation rate constants where: = 4.5 x 10
xWAK −
xappsonok −
,-3 0.3x
WAK − (s-1). Given the
range of Henry’s constants for the perfluorointermediates, we estimate sonolytic half-
lives from 1 to 3 s; these times are shorter but consistent with the observed fluoride
production kinetics (τ = 140 s). Partitioning of fluororocarbons between phases can
not be estimated accurately using parameters determined for hydrocarbons
1/2
65–67. For
example, measurement66 of Henry’s constants for perfluoroolefins is difficult. The
perfluoro-intermediates may not immediately partition into the vapor phase rapidly, but
dwell for a period of time at the bubble-water interface before pyrolytic vapor-phase
decomposition.
The apparent discrepancy between the observed F- production rates and estimated
degradation rates of these fluoro-intermediates may be due to a greater number of
acoustic cycles to produce F-, CO, and CO2. The unimolecular decomposition kinetics
for C7 and C8 fluorocarbon-intermediates in question have not been determined
experimentally or computationally. Instead, we will use kinetic parameters for shorter-
chain fluorochemicals in order to estimate decomposition rates.
Pyrolytic kinetics of (experimental technique listed in parentheses) 1H-
perfluoropropane (IRMPD)68, 1-perfluorobutene (IRMPD)69, perfluorohexane (VLPP)53,
87
and their decomposition intermediates are listed in Table 3.3. First-order rate constants
and half-lives are estimated using a temperature of 2500 K, which is less than the average
vapor temperature achieved during a single transient cavitation event37,39,70,71 in water. At
2500 K, experimentally determined Arrhenius parameters should be valid. It is noted
that all of the possible fluorocarbon-intermediates have at least one estimated C-C bond-
breaking decomposition pathway with a half-life under 100 ps, and the subsequent
fluoroalkyl radical intermediates all have faster C-C bond-breaking kinetics. The
unimolecular decomposition kinetics will dominate the bimolecular reaction kinetics and
we can assume that the initial fluoro-intermediate will dissociate into C1 fluoro-radical
constituents prior to any intervening bimolecular reactions.
In Scheme 3.2, we propose a degradation mechanism for perfluorooctene in a
cavitating bubble. The values above the reaction arrows are the estimated times for
greater than 99% of the reaction. The stoichiometries for 1H-perfluoroheptane and
perfluorooctene decompositions are given in eqs. 3.11 and 3.12, respectively.
HCFCFCFHCFCFCF 2232523 5)( ++⎯→⎯Δ (3.11)
CFCFCFCFCFCFCF ++⎯→⎯= Δ232523 6)( (3.12)
The C1 fluoro-radical products retain their original C-F bond intact since the average –C-
C- bond strength (410 kJ mol-1) is substantially less than the average C-F bond strength
(530 kJ mol-1). For comparison, the O-H bond strength of water is 498 kJ mol-1.
Numerical simulations by Yasui et al.42 and Colussi et al.40 have modeled the time-
dependent temperature evolution and the subsequent chemical reactions taking place
during a transiently cavitation event at 300 kHz. In both cases, the maximum bubble-
vapor temperatures were above 2500 K. Under these conditions, the characteristic time
for the reactions portrayed in Scheme 3.2 to take place is 1 ns. Therefore, the C7 or C8
88
fluoro-intermediates should be completely dissociated into C1 fluoro-radical constituents
in a single acoustic cycle.
Transformation of C1 Fluoro-radical Intermediates into CO and CO2
The initial sonochemical decomposition steps of PFOS and PFOA produce either C7 or
C8 1H-perfluoroalkanes (eq. 3.9) or perfluoroolefins (eq. 3.10), (Step 2, Scheme 3.1).
These intermediates are then pyrolytically decomposed into C1 fluoro-radicals (eqs. 3.11,
3.12): trifluoromethyl radical (·CF3), difluoromethyl radical (·CHF2), fluoromethylidyne
(CF), and difluorocarbene (:CF2), (Step 4, Scheme 3.1). The C1 fluoro-radicals are
subsequently transformed into carbon monoxide and carbon dioxide. A series of
bimolecular reactions with H2O, H·, HO·, and O-atom are proposed in Table 3.4 for the
conversion of the C1 fluoro-radicals into CO, CO2, and HF72. The second-order reaction
rate constants are estimated at 4000 K, where H2O thermolysis is significant. Several
assumptions are made when estimating the high-temperature kinetics. First, it is assumed
that the radical intermediates constitute a neglible fraction of the total bubble vapor
content; as a consequence fluoro-radical/fluoro-radical reactions can be neglected.
Second, the C1 fluoro-radical unimolecular decomposition is assumed to be of minor
importance, since at aqueous cavitation temperatures39,70, the thermolytic splitting of
water, which has a lesser bond strength than fluoro-radical C-F bonds, is dominant.
Finally, the sonolytic interconversion of CO and CO248,54
is assumed to be insignificant
since has a half-life on the order of one hour under similar conditionsCOCO ⎯→⎯)))2
54.
Furthermore, if interconversion of CO and CO2 were significant during sonolysis, then
the CO/CO2 product ratios for PFOS and PFOA would be similar; however, we observe
[CO]/[CO2]PFOA = 2.0 and [CO]/[CO2]PFOS = 5.1.
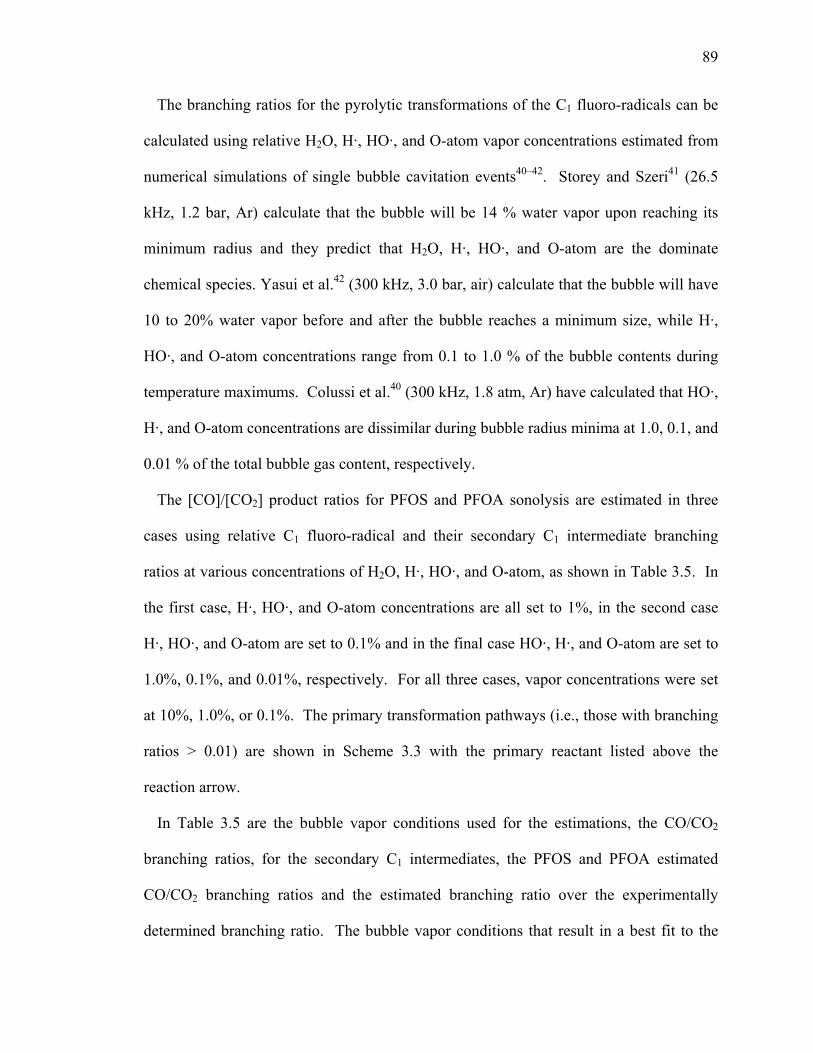
89
The branching ratios for the pyrolytic transformations of the C1 fluoro-radicals can be
calculated using relative H2O, H·, HO·, and O-atom vapor concentrations estimated from
numerical simulations of single bubble cavitation events40–42. Storey and Szeri41 (26.5
kHz, 1.2 bar, Ar) calculate that the bubble will be 14 % water vapor upon reaching its
minimum radius and they predict that H2O, H·, HO·, and O-atom are the dominate
chemical species. Yasui et al.42 (300 kHz, 3.0 bar, air) calculate that the bubble will have
10 to 20% water vapor before and after the bubble reaches a minimum size, while H·,
HO·, and O-atom concentrations range from 0.1 to 1.0 % of the bubble contents during
temperature maximums. Colussi et al.40 (300 kHz, 1.8 atm, Ar) have calculated that HO·,
H·, and O-atom concentrations are dissimilar during bubble radius minima at 1.0, 0.1, and
0.01 % of the total bubble gas content, respectively.
The [CO]/[CO2] product ratios for PFOS and PFOA sonolysis are estimated in three
cases using relative C1 fluoro-radical and their secondary C1 intermediate branching
ratios at various concentrations of H2O, H·, HO·, and O-atom, as shown in Table 3.5. In
the first case, H·, HO·, and O-atom concentrations are all set to 1%, in the second case
H·, HO·, and O-atom are set to 0.1% and in the final case HO·, H·, and O-atom are set to
1.0%, 0.1%, and 0.01%, respectively. For all three cases, vapor concentrations were set
at 10%, 1.0%, or 0.1%. The primary transformation pathways (i.e., those with branching
ratios > 0.01) are shown in Scheme 3.3 with the primary reactant listed above the
reaction arrow.
In Table 3.5 are the bubble vapor conditions used for the estimations, the CO/CO2
branching ratios, for the secondary C1 intermediates, the PFOS and PFOA estimated
CO/CO2 branching ratios and the estimated branching ratio over the experimentally
determined branching ratio. The bubble vapor conditions that result in a best fit to the

90
experimental data were 10% water vapor and 1% or 0.1% H·, HO·, and O-atom. When a
range of radical concentrations were varied, the CO/CO2 branching ratios were
underestimated by 55 to 80%. This underestimation was primarily due to the reduced H·
vapor concentration, H·/HO· = 0.1, yielding a more oxidizing bubble vapor and thus the
more oxidized carbon product, CO2. The CO/CO2 branching ratios for CFO and CF2O
are observed to favor CO2 over CO upon decreasing H· concentration. Reducing the
relative water vapor concentration increases the CO branching ratio of CF2O.
An analagous calculation as presented above for the unimolecular decomposition of
the initial fluorochemical intermediate can be used to estimate the number of acoustic
cycles, or sonication time, for the C1 fluoroadicals in Scheme 3.3 to completely pyrolyze
into CO and CO2. If we considered the reaction with the longest half-life, COF2 + H2O
→ CO2 + 2 HF, at 8.15 µs (4000 K, 10% H2O), and that eight half-lives are needed to
destroy > 99% of the initial compound, the time for complete transformation would be 65
µs. Using a conservative 0.50 ns high temperature period per cycle, it will take 1.3 x 10⁵
acoustic cycles to completely eliminate COF2. Likewise, the total time for the sonolytic
transformation of the C1-fluororadical is estimated to be 0.36 s (2.8 µs per cycle at 354
kHz). The calculated time is inline with the characteristic degradation time (e.g., 1 to 3 s)
using the empirical Henry’s constant estimation45. And once again this calculation is in
general agreement, but much shorter, than the experimentally observed fluoride
production half-life of 2 minutes. The discrepancy between calculation and experiment
suggests that fluorochemical intermediates partitioning to the bubble vapor phase and not
pyrolytic degradation may be the rate-limiting step in fluoride production. More
importantly, both experimental results and kinetic estimations agree with the conclusion
that shortly after the sonochemical decomposition of a perfluorinated surfactant, PFOS or

91
PFOA, their fluoro-intermediates are transformed relatively quickly into inorganic
constituents of PFOX: F-, SO42-, CO, and CO2.
Conclusions
Perfluorinated surfactants are widespread in the environment and recalcitrant towards
most conventional water-treatment technologies. Incineration is a viable method for
degradation of concentrated manufacturing wastes, yet not efficient for more dilute
aqueous solutions. Acoustic cavitation as driven by ultrasonic cavitation has been shown
to be both an effective and a relatively fast method for the complete destruction and
mineralization of PFOS and PFOA over a wide range of initial concentrations.
Conventional methods such as hydroxyl radical oxidation13 and bio-degradation8 have
been shown to have minimal effect on the elimination on these compounds from water.
Photodegradation techniques15,16,21,22,24,26 as well as elemental iron reduction in sub-
critical water29 have been shown to degrade these species. However, minimum
degradation half-lives are in the range of 45 to 120 minutes and achieve a maximum of
50% mineralization. Shorter perfluorinated acids are produced as by-products; these
latter products are just as recalcitrant as the initial perfluorinated compounds. The PFOS
and PFOA degradation rates presented here both have a degradation half-life of 30
minutes or less and achieve complete mineralization immediately after the decomposition
of the initial product, as shown by time-dependent product analysis and kinetic
estimations. Previous studies73 have shown that sonolytic rates can be scaled linearly by
increasing acoustic power density and that scaling-up the reactor size has minimal effect
on the observed reaction rates. Therefore, ultrasonically driven acoustic cavitation
provides a technically viable method for the treatment of aqueous perfluorinated

92
surfactant waste waters over a rather wide range of concentrations (i.e., 10 nM (5 ppb) to
10 mM (5 ppm) in this study).
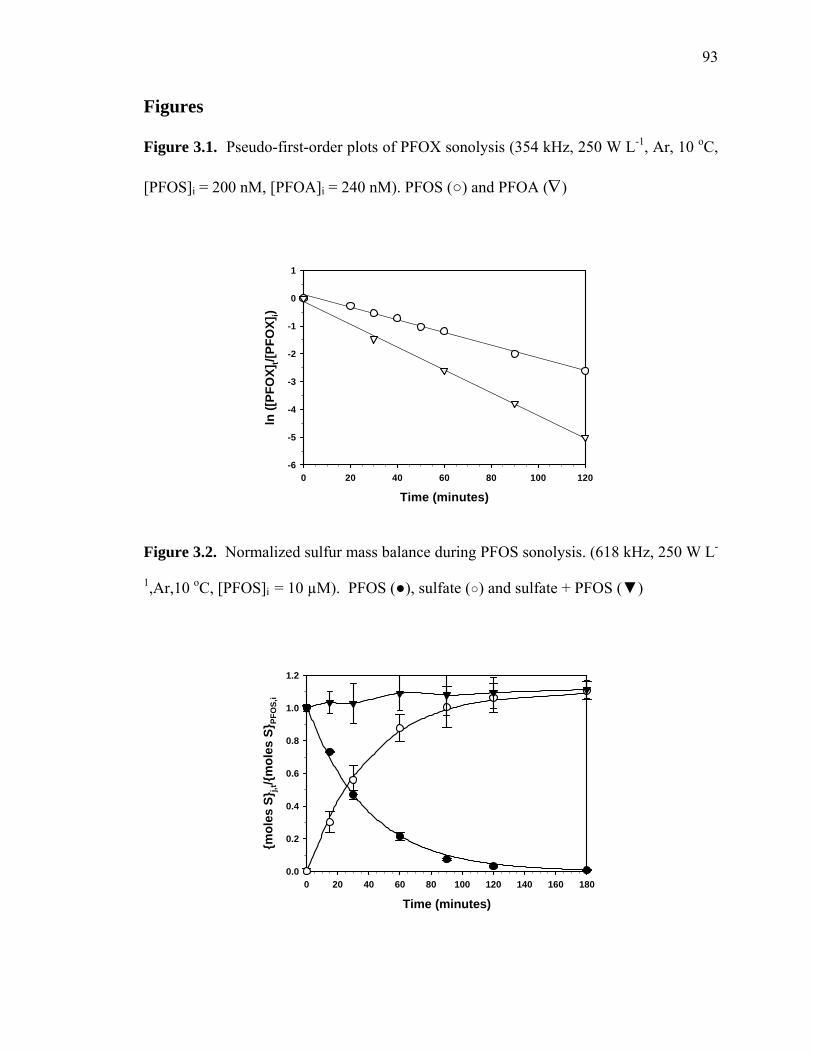
93
Figures
Figure 3.1. Pseudo-first-order plots of PFOX sonolysis (354 kHz, 250 W L-1, Ar, 10 oC,
[PFOS]i = 200 nM, [PFOA]i = 240 nM). PFOS () and PFOA (∇)
Time (minutes)0 20 40 60 80 100 120
ln ([
PFO
X]t/[
PFO
X]i)
-6
-5
-4
-3
-2
-1
0
1
Figure 3.2. Normalized sulfur mass balance during PFOS sonolysis. (618 kHz, 250 W L-
1,Ar,10 oC, [PFOS]i = 10 µM). PFOS (), sulfate () and sulfate + PFOS ()
Time (minutes)0 20 40 60 80 100 120 140 160 180
mol
es S
j,t/m
oles
S PF
OS,
i
0.0
0.2
0.4
0.6
0.8
1.0
1.2

94
Figure 3.3. Normalized fluorine mass balance during PFOX sonolysis (618 kHz, 250 W
L-1, Ar, 10 oC). A) [PFOS]i = 10 µM; PFOS (), fluoride (), and PFOS + fluoride ().
B) [PFOA]i = 12 µM; PFOA (), fluoride () and PFOA + fluoride ().
Time (minutes)0 20 40 60 80 100 120 140 160 180
mol
es F
j,t/m
oles
F PF
OS,
i
0.0
0.2
0.4
0.6
0.8
1.0
A
Time (minutes)0 20 40 60 80 100 120
mol
es F
j,t/m
oles
F PF
OA,
i
0.0
0.2
0.4
0.6
0.8
1.0
B
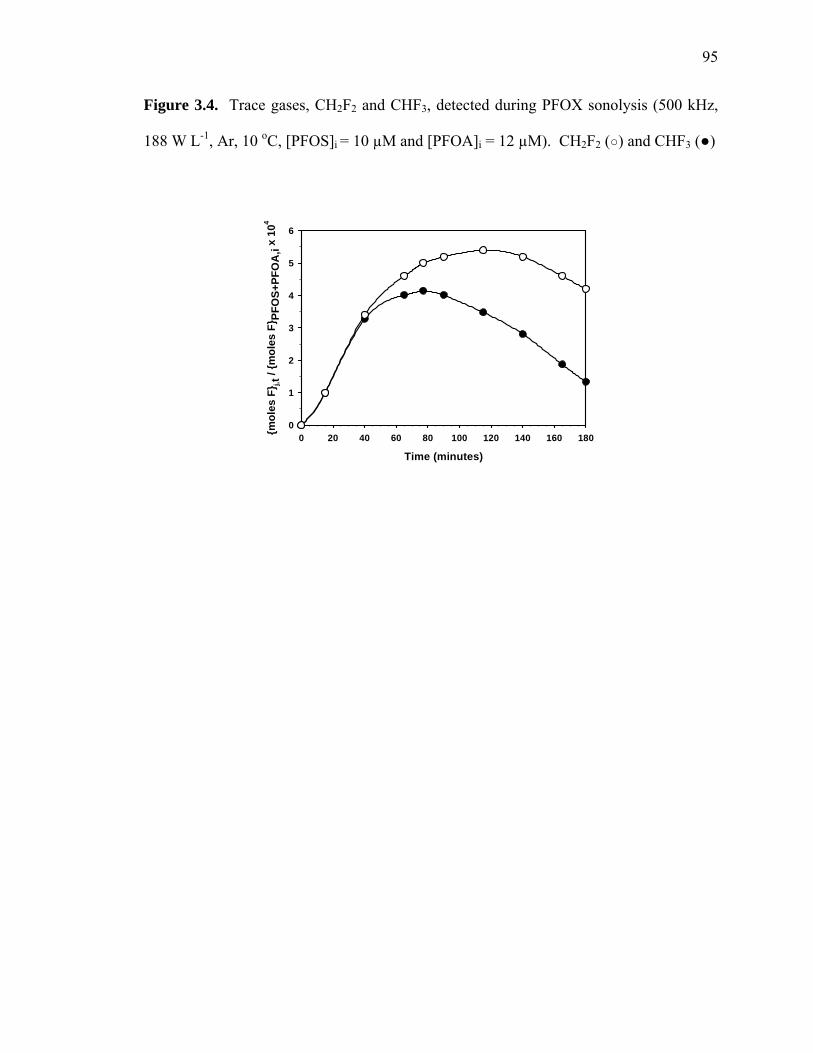
95
Figure 3.4. Trace gases, CH2F2 and CHF3, detected during PFOX sonolysis (500 kHz,
188 W L-1, Ar, 10 oC, [PFOS]i = 10 µM and [PFOA]i = 12 µM). CH2F2 () and CHF3 ()
Time (minutes)
0 20 40 60 80 100 120 140 160 180mol
es F
j, t /
mol
es F
PFO
S+PF
OA
,i x
104
0
1
2
3
4
5
6

96
Figure 3.5. Normalized carbon mass balance plots during PFOX sonolysis (354 kHz,
250 W L-1, Ar, 10 oC). A) [PFOS]i = 100 µM; PFOS (◊), CO (), CO2 (∇), CO + CO2
(), and PFOS + CO + CO2 (♦). B) [PFOA]i = 100 µM; PFOA (◊), CO (), CO2 (∇), CO
+ CO2 (), and PFOA + CO + CO2 (♦)
Time (minutes)0 20 40 60 80 100 12
0
mol
es C
j,t /
mol
es C
PFO
S,i
0.0
0.2
0.4
0.6
0.8
1.0
A
Time (minutes)0 20 40 60 80 100 120
mol
es C
j,t /
mol
es C
PFO
A,i
0.0
0.2
0.4
0.6
0.8
1.0
B
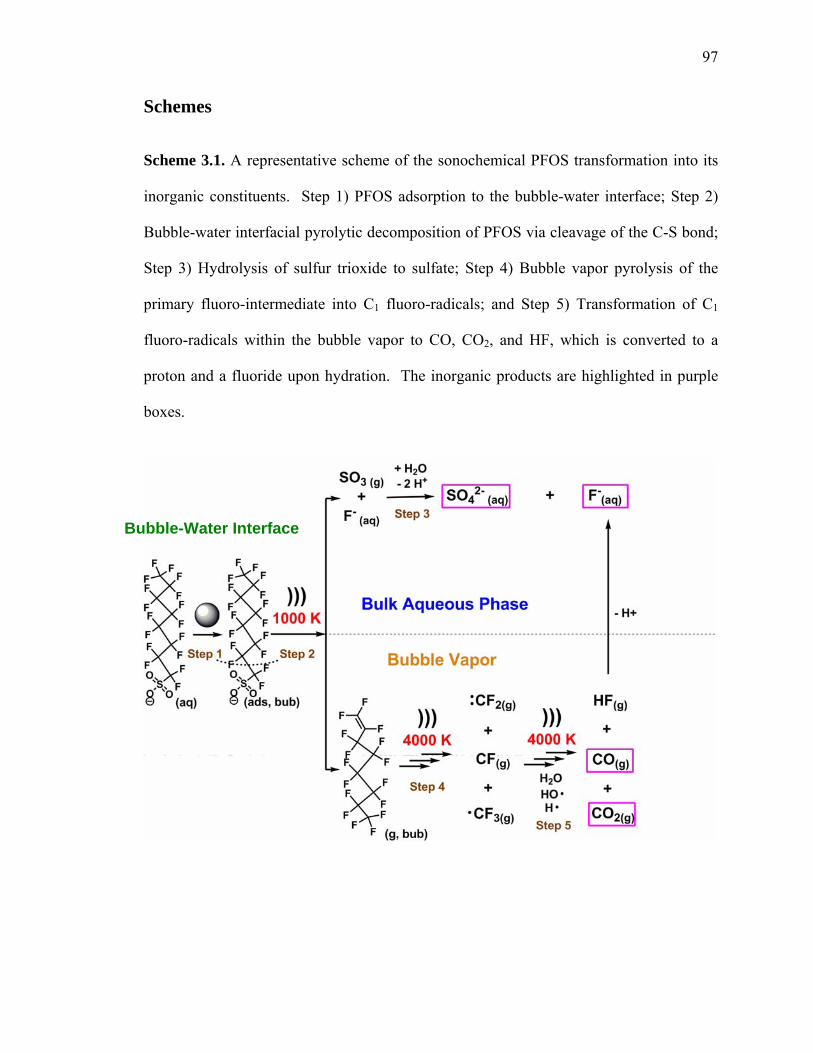
97
Schemes
Scheme 3.1. A representative scheme of the sonochemical PFOS transformation into its
inorganic constituents. Step 1) PFOS adsorption to the bubble-water interface; Step 2)
Bubble-water interfacial pyrolytic decomposition of PFOS via cleavage of the C-S bond;
Step 3) Hydrolysis of sulfur trioxide to sulfate; Step 4) Bubble vapor pyrolysis of the
primary fluoro-intermediate into C1 fluoro-radicals; and Step 5) Transformation of C1
fluoro-radicals within the bubble vapor to CO, CO2, and HF, which is converted to a
proton and a fluoride upon hydration. The inorganic products are highlighted in purple
boxes.
Bubble-Water Interface

98
Scheme 3.2. A representative scheme of sonolytic fluorointermediate unimolecular
decomposition yielding C1 fluoro-radicals (Step 4, Scheme 3.1). The time for > 99 %
reaction progress at 2500 K is reported above the reaction arrow. The C1 fluoro-radicals
are shown in boxes.
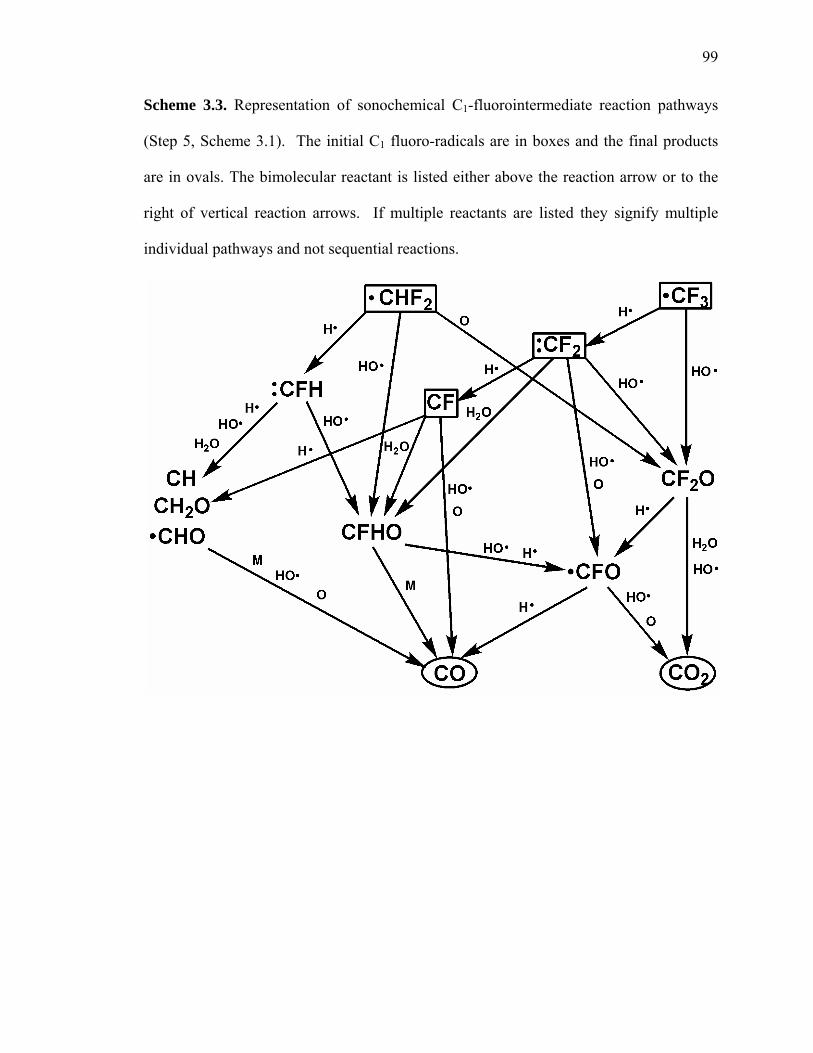
99
Scheme 3.3. Representation of sonochemical C1-fluorointermediate reaction pathways
(Step 5, Scheme 3.1). The initial C1 fluoro-radicals are in boxes and the final products
are in ovals. The bimolecular reactant is listed either above the reaction arrow or to the
right of vertical reaction arrows. If multiple reactants are listed they signify multiple
individual pathways and not sequential reactions.
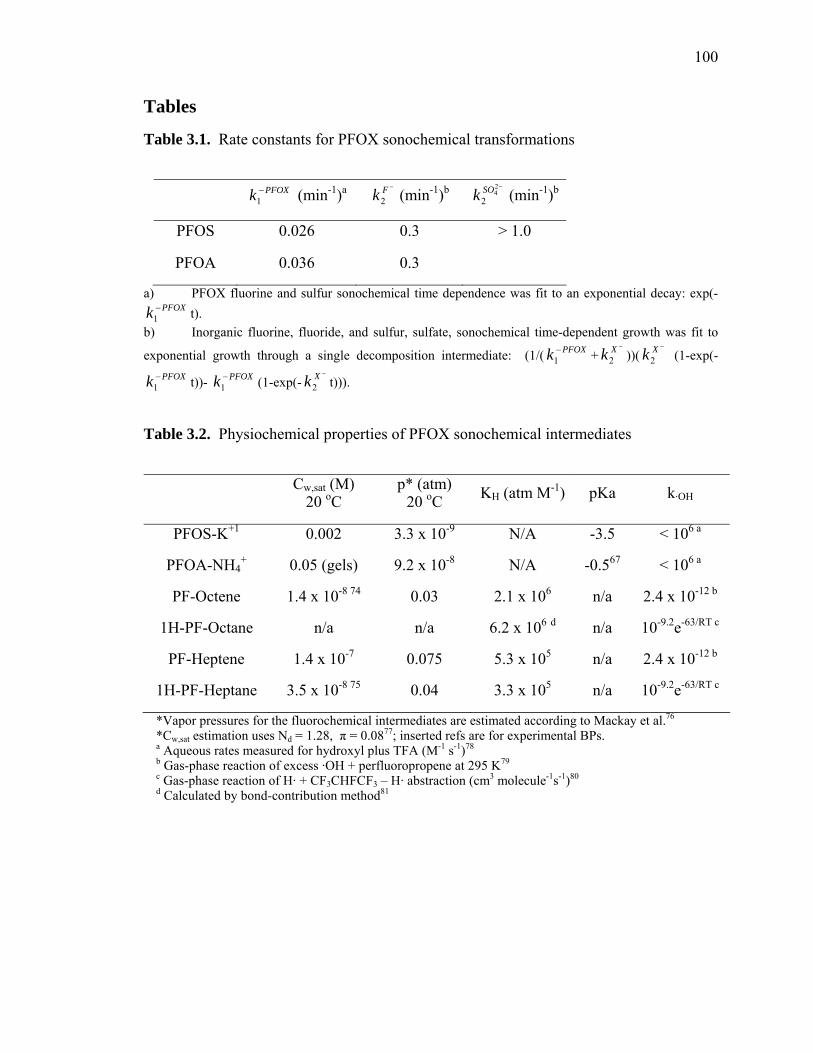
100
Tables
Table 3.1. Rate constants for PFOX sonochemical transformations
PFOXk −1 (min-1)a −Fk2 (min-1)b −2
42SOk (min-1)b
PFOS 0.026 0.3 > 1.0
PFOA 0.036 0.3
a) PFOX fluorine and sulfur sonochemical time dependence was fit to an exponential decay: exp(-t). PFOXk −
1b) Inorganic fluorine, fluoride, and sulfur, sulfate, sonochemical time-dependent growth was fit to
exponential growth through a single decomposition intermediate: (1/( + ))( (1-exp(-
t))- (1-exp(- t))).
PFOXk −1
−Xk2−Xk2
PFOXk −1
PFOXk −1
−Xk2
Table 3.2. Physiochemical properties of PFOX sonochemical intermediates
Cw,sat (M) 20 oC
p* (atm) 20 oC KH (atm M-1) pKa k·OH
PFOS-K+1 0.002 3.3 x 10⁻⁹ N/A -3.5 < 106 a
PFOA-NH4+ 0.05 (gels) 9.2 x 10⁻⁸ N/A -0.567 < 106 a
PF-Octene 1.4 x 10⁻⁸ 74 0.03 2.1 x 10⁶ n/a 2.4 x 10⁻¹² b
1H-PF-Octane n/a n/a 6.2 x 10⁶ d n/a 10-9.2e-63/RT c
PF-Heptene 1.4 x 10⁻⁷ 0.075 5.3 x 10⁵ n/a 2.4 x 10⁻¹² b
1H-PF-Heptane 3.5 x 10⁻⁸ 75 0.04 3.3 x 10⁵ n/a 10-9.2e-63/RT c
*Vapor pressures for the fluorochemical intermediates are estimated according to Mackay et al.76 *Cw,sat estimation uses Nd = 1.28, π = 0.0877; inserted refs are for experimental BPs. a Aqueous rates measured for hydroxyl plus TFA (M-1 s-1)78 b Gas-phase reaction of excess ·OH + perfluoropropene at 295 K79 c Gas-phase reaction of H· + CF3CHFCF3 – H· abstraction (cm3 molecule-1s-1)80 d Calculated by bond-contribution method81
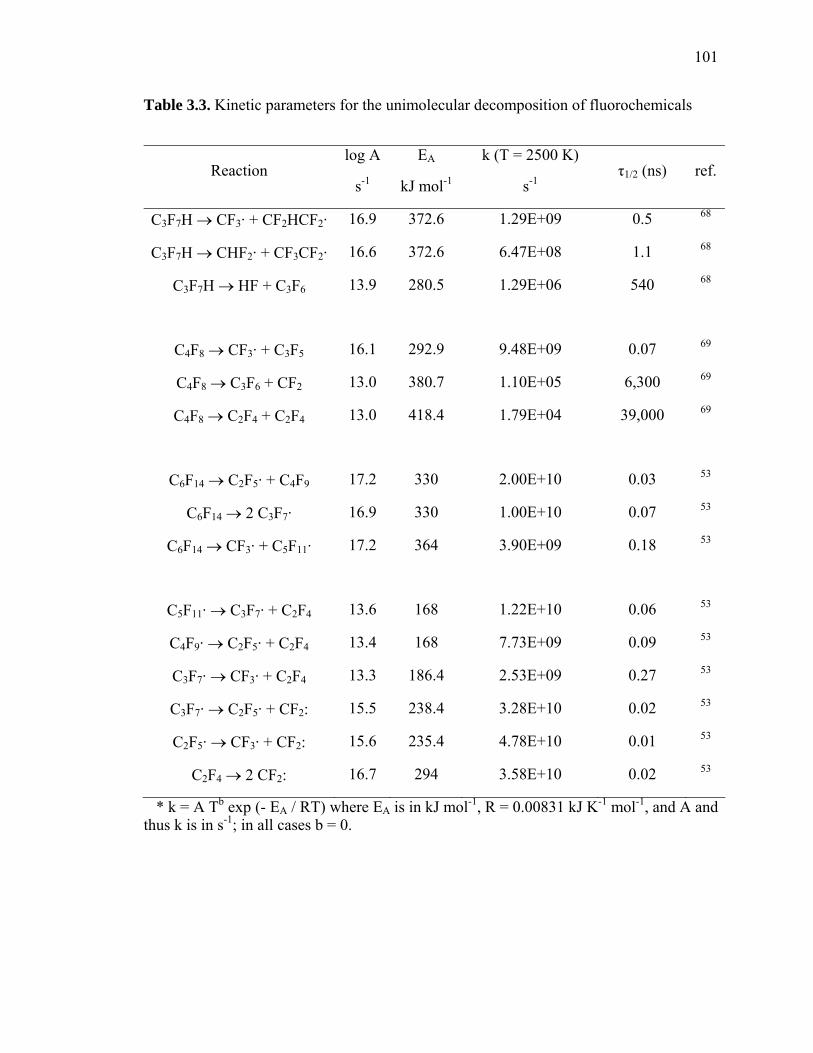
101
Table 3.3. Kinetic parameters for the unimolecular decomposition of fluorochemicals
Reaction log A
s-1
EA
kJ mol-1
k (T = 2500 K)
s-1τ1/2 (ns) ref.
C3F7H → CF3· + CF2HCF2· 16.9 372.6 1.29E+09 0.5 68
C3F7H → CHF2· + CF3CF2· 16.6 372.6 6.47E+08 1.1 68
C3F7H → HF + C3F6 13.9 280.5 1.29E+06 540 68
C4F8 → CF3· + C3F5 16.1 292.9 9.48E+09 0.07 69
C4F8 → C3F6 + CF2 13.0 380.7 1.10E+05 6,300 69
C4F8 → C2F4 + C2F4 13.0 418.4 1.79E+04 39,000 69
C6F14 → C2F5· + C4F9 17.2 330 2.00E+10 0.03 53
C6F14 → 2 C3F7· 16.9 330 1.00E+10 0.07 53
C6F14 → CF3· + C5F11· 17.2 364 3.90E+09 0.18 53
C5F11· → C3F7· + C2F4 13.6 168 1.22E+10 0.06 53
C4F9· → C2F5· + C2F4 13.4 168 7.73E+09 0.09 53
C3F7· → CF3· + C2F4 13.3 186.4 2.53E+09 0.27 53
C3F7· → C2F5· + CF2: 15.5 238.4 3.28E+10 0.02 53
C2F5· → CF3· + CF2: 15.6 235.4 4.78E+10 0.01 53
C2F4 → 2 CF2: 16.7 294 3.58E+10 0.02 53
* k = A Tb exp (- EA / RT) where EA is in kJ mol-1, R = 0.00831 kJ K-1 mol-1, and A and thus k is in s-1; in all cases b = 0.
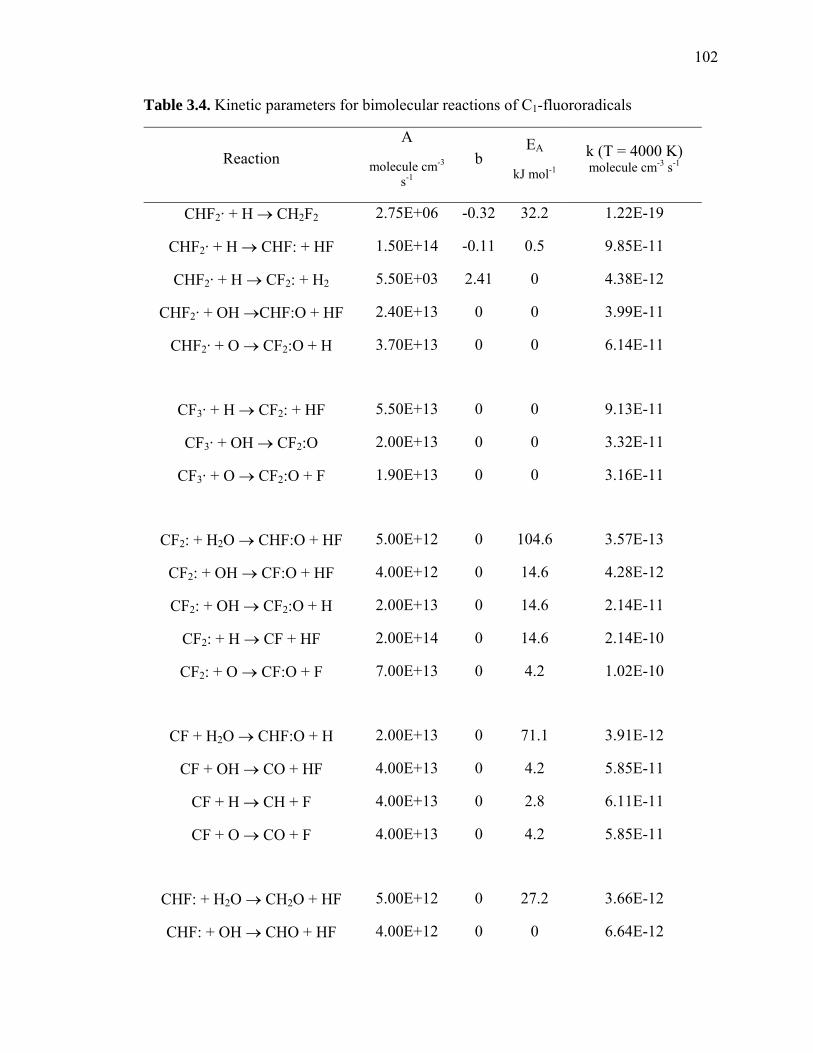
102
Table 3.4. Kinetic parameters for bimolecular reactions of C -fluororadical1 s
Reaction A
molecule cm-3 s-1
b EA
kJ mol-1
k (T = 4000 K) molecule cm-3 s-1
CHF2· + H → CH2F2 2.75E+06 -0.32 32.2 1.22E-19
CHF2· + H → CHF: + HF 1.50E+14 -0.11 0.5 9.85E-11
CHF2· + H → CF2: + H2 5.50E+03 2.41 0 4.38E-12
CHF2· + OH →CHF:O + HF 2.40E+13 0 0 3.99E-11
CHF2· + O → CF2:O + H 3.70E+13 0 0 6.14E-11
CF3· + H → CF2: + HF 5.50E+13 0 0 9.13E-11
CF3· + OH → CF2:O 2.00E+13 0 0 3.32E-11
CF3· + O → CF2:O + F 1.90E+13 0 0 3.16E-11
CF2: + H2O → CHF:O + HF 5.00E+12 0 104.6 3.57E-13
CF2: + OH → CF:O + HF 4.00E+12 0 14.6 4.28E-12
CF2: + OH → CF2:O + H 2.00E+13 0 14.6 2.14E-11
CF2: + H → CF + HF 2.00E+14 0 14.6 2.14E-10
CF2: + O → CF:O + F 7.00E+13 0 4.2 1.02E-10
CF + H2O → CHF:O + H 2.00E+13 0 71.1 3.91E-12
CF + OH → CO + HF 4.00E+13 0 4.2 5.85E-11
CF + H → CH + F 4.00E+13 0 2.8 6.11E-11
CF + O → CO + F 4.00E+13 0 4.2 5.85E-11
CHF: + H2O → CH2O + HF 5.00E+12 0 27.2 3.66E-12
CHF: + OH → CHO + HF 4.00E+12 0 0 6.64E-12
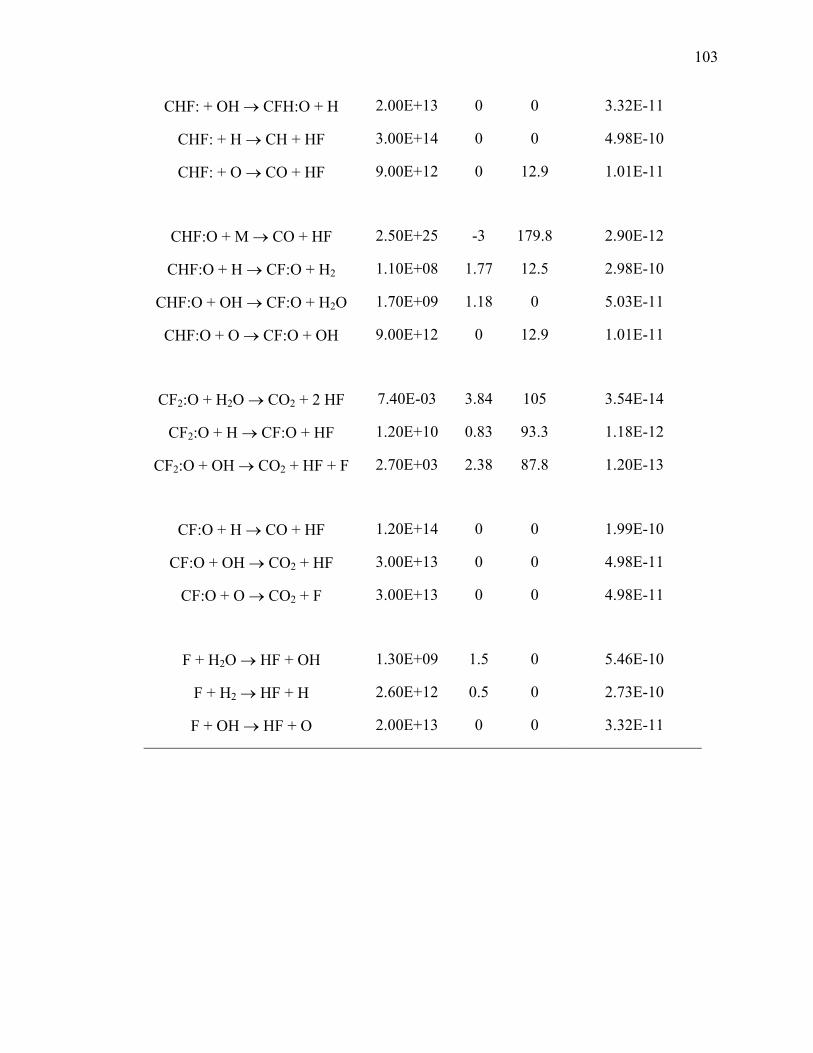
103
CHF: + OH → CFH:O + H 2.00E+13 0 0 3.32E-11
CHF: + H → CH + HF 3.00E+14 0 0 4.98E-10
CHF: + O → CO + HF 9.00E+12 0 12.9 1.01E-11
CHF:O + M → CO + HF 2.50E+25 -3 179.8 2.90E-12
CHF:O + H → CF:O + H2 1.10E+08 1.77 12.5 2.98E-10
CHF:O + OH → CF:O + H2O 1.70E+09 1.18 0 5.03E-11
CHF:O + O → CF:O + OH 9.00E+12 0 12.9 1.01E-11
CF2:O + H2O → CO2 + 2 HF 7.40E-03 3.84 105 3.54E-14
CF2:O + H → CF:O + HF 1.20E+10 0.83 93.3 1.18E-12
CF2:O + OH → CO2 + HF + F 2.70E+03 2.38 87.8 1.20E-13
CF:O + H → CO + HF 1.20E+14 0 0 1.99E-10
CF:O + OH → CO2 + HF 3.00E+13 0 0 4.98E-11
CF:O + O → CO2 + F 3.00E+13 0 0 4.98E-11
F + H2O → HF + OH 1.30E+09 1.5 0 5.46E-10
F + H2 → HF + H 2.60E+12 0.5 0 2.73E-10
F + OH → HF + O 2.00E+13 0 0 3.32E-11
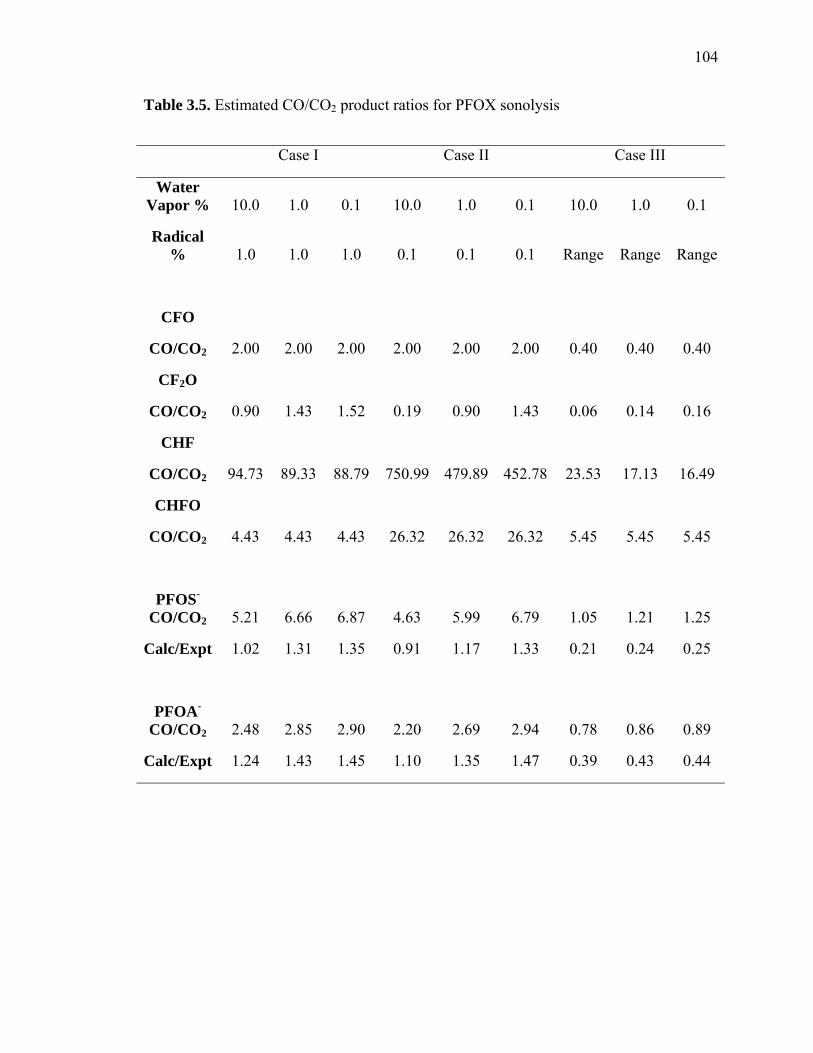
104
Table 3.5. Estimated CO/CO2 product ratios for PFOX sonolysis
Case I Case II Case III
Water Vapor % 10.0 1.0 0.1 10.0 1.0 0.1 10.0 1.0 0.1
Radical % 1.0 1.0 1.0 0.1 0.1 0.1 Range Range Range
CFO
CO/CO2 2.00 2.00 2.00 2.00 2.00 2.00 0.40 0.40 0.40
CF2O
CO/CO2 0.90 1.43 1.52 0.19 0.90 1.43 0.06 0.14 0.16
CHF
CO/CO2 94.73 89.33 88.79 750.99 479.89 452.78 23.53 17.13 16.49
CHFO
CO/CO2 4.43 4.43 4.43 26.32 26.32 26.32 5.45 5.45 5.45
PFOS-
CO/CO2 5.21 6.66 6.87 4.63 5.99 6.79 1.05 1.21 1.25
Calc/Expt 1.02 1.31 1.35 0.91 1.17 1.33 0.21 0.24 0.25
PFOA-
CO/CO2 2.48 2.85 2.90 2.20 2.69 2.94 0.78 0.86 0.89
Calc/Expt 1.24 1.43 1.45 1.10 1.35 1.47 0.39 0.43 0.44

105
References
(1) 3M Company. Docket AR226-0547; Office of Pollution Prevention and Toxics;
U.S. Environmental Protection Agency: Washington, D.C., 1999; p. 12.
(2) Sinclair, E.; Kannan, K. Environ. Sci. Technol. 2006, 40, 1408.
(3) Schultz, M. M.; Higgins, C. P.; Huset, C. A.; Luthy, R. G.; Barofsky, D. F.; Field,
J. A. Environ. Sci. Technol. 2006, 40, 7350.
(4) Boulanger, B.; Vargo, J. D.; Schnoor, J. L.; Hornbuckle, K. C. Environ. Sci.
Technol. 2005, 39, 5524.
(5) Martin, J. W.; Whittle, D. M.; Muir, D. C. G.; Mabury, S. A. Environ. Sci.
Technol. 2004, 38, 5379.
(6) Martin, J. W.; Smithwick, M. M.; Braune, B. M.; Hoekstra, P. F.; Muir, D. C. G.;
Mabury, S. A. Environ. Sci. Technol. 2004, 38, 373.
(7) Schultz, M. M.; Barofsky, D. F.; Field, J. A. Environ. Eng. Sci. 2003, 20, 487.
(8) Key, B. D.; Howell, R. D.; Criddle, C. S. Environ. Sci. Technol. 1998, 32, 2283.
(9) Hollingsworth, J.; Sierra-Alvarez, R.; Zhou, M.; Ogden, K. L.; Field, J. A.
Chemosphere 2005, 59, 1219.
(10) 3M Company; Docket AR226-0489; Office of Pollution Prevention & Toxics;
U.S. Environmental Protection Agency: Washington, D.C., 1978; p. 19.
(11) 3M Company; Docket AR226-0058; Office of Pollution Prevention & Toxics;
U.S. Environmental Protection Agency: Washington, D.C., 1994; p. 4.
(12) Oppenlander, T. Photochemical Purification of Water and Air; Wiley-VCH:
Weinheim, 2003.
(13) Schroder, H. F.; Meesters, R. J. W. J. Chromatogr. A 2005, 1082, 110.

106
(14) Moriwaki, H.; Takagi, Y.; Tanaka, M.; Tsuruho, K.; Okitsu, K.; Maeda, Y.
Environ. Sci. Technol. 2005, 39, 3388.
(15) Hori, H.; Hayakawa, E.; Einaga, H.; Kutsuna, S.; Koike, K.; Ibusuki, T.;
Kiatagawa, H.; Arakawa, R. Environ. Sci. Technol. 2004, 38, 6118.
(16) Chen, J.; Zhang, P. Water Sci. Technol. 2006, 54.
(17) 3M Company; Docket AR226-0056; Office of Pollution Prevention & Toxics;
U.S. Environmental Protection Agency: Washington, D.C., 1978; p. 17.
(18) 3M Company; Docket AR226-0490; Office of Pollution Prevention & Toxics;
U.S. Environmental Protection Agency: Washington, D.C., 1979; p. 15.
(19) Yamamoto, T.; Noma, Y.; Sakai, S. I.; Shibata, Y. Environ. Sci. Technol. 2007,
41, 5660.
(20) Chen, J.; Zhang, P. Y.; Liu, J. J. Environ. Sci 2007, 19, 387.
(21) Hori, H.; Yamamoto, A.; Hayakawa, E.; Taniyasu, S.; Yamashita, N.; Kutsuna,
S.; Kiatagawa, H.; Arakawa, R. Environ. Sci. Technol. 2005, 39, 2383.
(22) Hori, H.; Yamamoto, A.; Kutsuna, S. Environ. Sci. Technol. 2005, 39, 7692.
(23) Kutsuna, S.; Hori, H. Int. J. Chem. Kin. 2007, 276.
(24) Chen, J.; Zhang, P. Y.; Zhang, L. Chem. Lett. 2006, 35, 230.
(25) Hori, H.; Hayakawa, E.; Koike, K.; Einaga, H.; Ibusuki, T. J. Mol. Catal. A–
Chem. 2004, 211, 35.
(26) Dillert, R.; Bahnemann, D.; Hidaka, H. Chemosphere 2007, 67.
(27) Yuan, Q.; Ravikrishna, R.; Valsaraj, K. T. Sep. Purif. Technol. 2001, 24.
(28) Hidaka, H.; Jou, H.; Nohara, K.; Zhao, J. Chemosphere 1992, 25, 1589.
(29) Hori, H.; Nagaoka, Y.; Yamamoto, A.; Sano, T.; Yamashita, N.; Taniyasu, S.;
Kutsuna, S.; Osaka, I.; Arakawa, R. Environ. Sci. Technol. 2006, 40, 1049.
107
(30) Kolaczkowski, S. T.; Plucinski, P.; Beltran, F. J.; Rivas, F. J.; McLurgh, D. B.
Chem. Eng. J. 1999, 73, 143.
(31) Vinodgopal, K.; Ashokkumar, M.; Grieser, F. J. Phys. Chem. B 2001, 105, 3338.
(32) Destaillats, H.; Hung, H. M.; Hoffmann, M. R. Environ. Sci. Technol. 2000, 34,
311.
(33) Hua, I.; Hoffmann, M. R. Environ. Sci. Technol. 1996, 30, 864.
(34) Kotronarou, A.; Mills, G.; Hoffmann, M. R. J. Phys. Chem. 1991, 95, 3630.
(35) Petrier, C.; David, B.; Laguian, S. Chemosphere 1996, 32, 1709.
(36) Brennen, C. E. Cavitation and Bubble Dynamics; Oxford University Press: New
York, 1995.
(37) Misik, V.; Miyoshi, N.; Riesz, P. J. Phys. Chem. 1995, 99, 3605.
(38) Leighton, T. G. The Acoustic Bubble; Academic Press: London, 1994.
(39) Didenko, Y. T.; McNamara, W. B.; Suslick, K. S. J. Phys. Chem. A 1999, 103,
10783.
(40) Colussi, A. J.; Weavers, L. K.; Hoffmann, M. R. J. Phys. Chem. A 1998, 102,
6927.
(41) Storey, B. D.; Szeri, A. J. Proc. R. Soc. London Ser. A–Math. Phys. Eng. Sci.
2000, 456, 1685.
(42) Yasui, K.; Tuziuti, T.; Kozuka, T.; Towata, A.; Iida, Y. J. Chem. Phys. 2007, 127.
(43) Krishna, C. M.; Lion, Y.; Kondo, T.; Riesz, P. J. Phys. Chem. 1987, 91, 5847.
(44) Jennings, B. H.; Townsend, S. N. J. Phys. Chem. 1961, 65, 1574.
(45) Colussi, A. J.; Hung, H. M.; Hoffmann, M. R. J. Phys. Chem. A 1999, 103, 2696.
(46) Yang, L. M.; Rathman, J. F.; Weavers, L. K. J. Phys. Chem. B 2005, 109, 16203.
(47) Sostaric, J. Z.; Riesz, P. J. Am. Chem. Soc. 2001, 123, 11010.
108
(48) Henglein, A.; Kormann, C. Int. J. Radiat. Biol. 1985, 48, 251.
(49) Manousaki, E.; Psillakis, E.; Kalogerakis, N.; Mantzavinos, D. Water Res. 2004,
38, 3751.
(50) Glockner, V.; Lunkwitz, K.; Prescher, D. Tenside Surf. Det. 1989, 26.
(51) Krusic, P. J.; Marchione, A. A.; Roe, D. C. J. Fluor. Chem. 2005, 126, 1510.
(52) Lazerte, J. D.; Hals, L. J.; Reid, T. S.; Smith, G. H. J. Am. Chem. Soc. 1953, 75,
4525.
(53) Ainagos, A. F. Kinet. Catal. 1991, 32, 720.
(54) Harada, H. Ultrason. Sonochem. 1998, 5, 73.
(55) Henglein, A. Z. Naturforsch. (B) 1985, 40, 100.
(56) Lopez-Fontan, J. L.; Gonzalez-Perez, A.; Costa, J.; Ruso, J. M.; Prieto, G.;
Schulz, P. C.; Sarmiento, M. J. Colloid Interface Sci. 2006, 294, 458.
(57) Lopez-Fontan, J. L.; Sarmiento, F.; Schulz, P. C. Colloid Polym. Sci. 2005, 283,
862.
(58) Simister, E. A.; Lee, E. M.; Lu, J. R.; Thomas, R. K.; Ottewill, R. H.; Rennie, A.
R.; Penfold, J. J. Chem. Soc.–Faraday Trans. 1992, 88, 3033.
(59) Shinoda, K.; Hato, M.; Hayashi, T. J. Phys. Chem. 1972, 76, 909.
(60) Lesko, T.; Colussi, A. J.; Hoffmann, M. R. Environ. Sci. Technol. 2006, 40, 6818.
(61) Lines, D.; Sutcliffe, H. J. Fluor. Chem. 1984, 25, 505.
(62) Krusic, P. J.; Roe, D. C. Anal. Chem. 2004, 76, 3800.
(63) Hung, H. M.; Hoffmann, M. R. Environ. Sci. Technol. 1998, 32, 3011.
(64) Hung, H. M.; Hoffmann, M. R. J. Phys. Chem. A 1999, 103, 2734.
(65) Goss, K. U.; Bronner, G. J. Phys. Chem. A 2006, 110, 9518.
109
(66) Goss, K. U.; Bronner, G.; Harner, T.; Monika, H.; Schmidt, T. C. Environ. Sci.
Technol. 2006, 40, 3572.
(67) Goss, K.-U. Environ. Sci. Technol. 2008, 42, 456.
(68) Kato, S.; Makide, Y.; Tominaga, T.; Takeuchi, K. J. Phys. Chem. 1987, 91, 4278.
(69) Longfellow, C. A.; Berrie, C. L.; Suits, A. G.; Lee, Y. T. J. Chem. Phys. 1997,
107, 7202.
(70) Ciawi, E.; Rae, J.; Ashokkumar, M.; Grieser, F. J. Phys. Chem. B 2006, 110,
13656.
(71) Didenko, Y. T.; McNamara, W. B.; Suslick, K. S. J. Am. Chem. Soc. 1999, 121,
5817.
(72) Burgess, D. R.; Zachariah, M. R.; Tsang, W.; Westmoreland, P. R. Prog. Energy
Combust. Sci. 1995, 21, 453.
(73) Destaillats, H.; Lesko, T. M.; Knowlton, M.; Wallace, H.; Hoffmann, M. R. Ind.
Eng. Chem. Res. 2001, 40, 3855.
(74) Galyautdinov, I. V.; Nazmeeva, S. R.; Savchenko, R. G.; Ves'kina, N. A.;
Nedopekin, D. V.; Fatykhov, A. A.; Khalilov, L. M.; Odinokov, V. N. Russ. J. Organ.
Chem. 2004, 40, 675.
(75) Huang, B. N.; Haas, A.; Lieb, M. J. Fluor. Chem. 1987, 36, 49.
(76) Mackay, D.; Bobra, A.; Chan, D. W.; Shiu, W. Y. Environ. Sci. Technol. 1982,
16, 645.
(77) Schwarzenbach, R. P.; Gschwend, P. M.; Imboden, D. M. Environmental Organic
Chemistry, Second ed.; Wiley: New York, 2003.
(78) Maruthamuthu, P.; Padmaja, S.; Huie, R. E. Int. J. Chem. Kin. 1995, 27.

110
(79) Mashino, M.; Ninomiya, Y.; Kawasaki, M.; Wallington, T. J.; Hurley, M. D. J.
Phys. Chem. A 2000, 104, 7255.
(80) Yamamoto, O.; Takahashi, K.; Inomata, T. J. Phys. Chem. A 2004, 108, 1417.
(81) Hine, J.; Mookerjee, P. K. J. Org. Chem. 1975, 40, 292.
111
Chapter 4
Enhancement of Perfluorooctanoate (PFOA)
and Perfluorooctanesulfonate (PFOS)
Activity at Acoustic Cavitation Bubble
Interfaces
Sections reprinted with permission from Vecitis C. D.; Park H.; Cheng J.; Mader, B. T.;
Hoffmann, M. R.; Journal of Physical Chemistry C 2008, 112, 16850–16857.
© 2008 American Chemical Society
112
Abstract
Acoustic cavitation driven by ultrasonic irradiation decomposes and mineralizes the
recalcitrant perfluorinated surfactants, perfluorooctanesulfonate (PFOS) and
perfluorooctanoate (PFOA). Pyrolytic cleavage of the ionic headgroup is the rate-
determining step. In this study, we examine the sonochemical adsorption of PFOX,
where X = S for PFOS and A for PFOA, by determining kinetic order and absolute rates
over an initial PFOX concentration range of 20 nM to 200 μM. Sonochemical PFOX
kinetics transition from pseudo-first-order at low initial concentrations, [PFOX]i < 20
μM, to zero-order kinetics at high initial concentrations, [PFOX]i > 40 μM, as the bubble
interface sites are saturated. At PFOX concentrations below 100 μM, concentration-
dependent rates were modeled with Langmuir-Hinshelwood kinetics. Empirically
determined rate maximums, V = 2230 ± 560 nM minMax− PFOA -1 and = 230 ± 60 nM
min
VMax−PFOS
-1, were used in the LH model, and sonochemical surface activities were estimated to
be, = 120,000 MKSonoPFOS -1 and = 28,500 MKSono
PFOA -1—60 and 80 times greater than
equilibrium surface activities, and . These results suggest enhanced
sonochemical degradation rates for PFOX when the bubble interface is under-saturated
populated. The present results are compared to previously reported sonochemical
kinetics of nonvolatile surfactants.
KEqPFOS KEq
PFOA
113
Introduction
Fluorine is the most electronegative of elements. Fluorochemicals (FCs), organics
with the majority of their hydrogens replaced by fluorines, display unique properties as
compared to their hydrocarbon analogs1. The C-F bond is the strongest among organics
(> 110 kcal/mol), and low C-F bond polarizabilites gives them both hydrophobic and
oleophobic character. Fluorination protects against oxidation and FC coatings provide
water and oil resistance. However, these same fluorochemical properties make them
environmentally persistent and recalcitrant towards most conventional water-treatment
technologies2,3, since they are inert towards common chemical and microbial treatment4–
6. Sulfate radical7–9, advanced reduction10,11, and photolytic techniques8,12,13 can degrade
perfluorinated surfactants, most yielding shorter-chain FCs as products. Moriwaki et al.4
reported that ultrasonic irradiation of aqueous perfluorochemical solutions may provide a
practical alternative.
Acoustic cavitation, as driven by ultrasonic irradiation, can be utilized for the
decomposition of aqueous chemical contaminants15–18. Application of ultrasound to
aqueous solutions forms cavitation bubbles, which will undergo transient collapse
events5. Quasi-adiabatic compression of transient bubbles generates average vapor
temperatures near 5000 K20,21 and much higher bubble vapor core temperatures that lead
to sonoluminescence6,7. Water vapor readily pyrolyzes under the transient high
temperatures producing O-atoms, hydroxyl radicals, and H-atoms8. Hot vapor colliding
with the collapsing bubble wall generates interfacial temperatures of at least 800 K8,9.
Chemicals preferentially partitioning to the bubble vapor will decompose via pyrolytic
and combustion reactions10. Involatile surfactants that are difficult to oxidize, such as
PFOS and PFOA, will pyrolytically decompose at the bubble-water interface4.

114
Understanding the physical processes that control PFOX (X = S or A) degradation
rates is key to optimization of their sonochemical kinetics. PFOX sonochemical
degradation involves an initial, rate-determining ionic headgroup cleavage at the bubble-
water interface followed by relatively quick mineralization of the fluorocarbon tail11.
However, adsorption of PFOS and PFOA to the bubble-water interface, a physical
process required before interfacial sonochemistry can occur, has yet to be investigated.
Henglein and Kormann12 noted that hydroxyl radical scavenging activity increased
with increasing organic chain length at cavitation bubble interfaces, while Fyrillas and
Szeri made numerical calculations13 of nonvolatile surfactant adsorption to an oscillating
bubble interface. Their model calculations predicted a decrease in the maximum Gibbs
surface excess, Γ , as compared to the equilibrium max surface excess, , due
to surface site limitations at bubble radial minimums and an increase in sonochemical
surface activity, , relative to equilibrium surface activity, , due to high-velocity
radial oscillations. Concentration-dependent sonochemical degradation kinetics of humic
materials
Max ,Sono ΓMax,Eq
KSono KEq
14 and pesticides15 have been empirically modeled by Langmuir-Hinshelwood
kinetics, suggesting adsorption to the bubble-water interface is the initial step in their
primary sonochemical decomposition mechanism and is limiting at high concentrations.
Sostaric and Reisz31,32 observed saturation of alkyl radical production during
concentration-dependent sonolysis of alkyl sulfates and sulfonates. However, radical
production from nonvolatile surfactants of various chain lengths did not correlate well
with equilibrium Gibb’s surface excess values, . The lack of correlation was
concluded to arise from relatively short acoustic bubble lifetimes (100s of μs) as
compared to ionic surfactant equilibration times (> 1 ms). Tronson et. al.
ΓEq
16 observed that
115
Langmuir competitive adsorption modeling using equilibrium SDS surface excess values,
, did not fit trends expected from sonoluminescence data. Total acoustic bubble
volume measurements as a function of alcohol conentration correlated well with ,
however, overestimated sonochemical ionic surfactant adsorption
ΓEqSDS
ΓEq
ΓEq17. Sonochemical
adsorption of nonvolatile (i.e., ionic) surfactants is not well described by equilibrium
partitioning.
Here, we investigate sonochemical PFOS and PFOA adsorption to the bubble-water
interface by determining absolute rates over 4 orders of magnitude of initial PFOX
concentrations. Sonochemical effects on surface activity, vs. , are evaluated
by modeling the concentration-dependent kinetics with the Langmuir-Hinshelwood
formalism using an empirically determined V , and comparing the results to
equilibrium surface partitioning determined by surface tension measurements.
Sonochemical PFOX surface activity determined here is compared to previously
observed results.
KSonoPFOX KEq
PFOX
Max− PFOX
Experimental Methods
Ammonium perfluorooctanoate (APFO) and sodium perfluorosulfonate (PFOS) were
provided by the 3M Corporation. Ammonium acetate (> 99%) and methanol (HR-GC >
99.99%) were obtained from EMD Chemicals, Inc. Aqueous solutions were prepared
with distilled and deionized water that was further purified using a MilliPore system
(18.2 MΩ-cm resistivity).
Ultrasonic irradiation was performed at a frequency of 354 kHz and an applied power
density of 250 W L-1 with an Allied Signal ELAC Nautik ultrasonic transducer. The
average energy transferred to solution was 75%, as determined by calorimetry. The

116
reaction solution was contained in a 600 mL water-jacketed, glass reactor. The
temperature was controlled with a Haake A80 refrigerated bath maintained at 10 ºC. All
reactions were continuously sparged with argon for 30 minutes prior to and for the
duration of the reaction. PFOS and PFOA were sonicated simultaneously over an initial
concentration range of 20 nM to 200 μM. Higher concentrations were not tested as
sonication caused the compounds to precipitate. Concentration vs. time profiles were
fitted either to a single exponential decay for first-order kinetics, or linearly for zero-
order kinetics.
Analysis of PFOA and PFOS was completed by HPLC-MS. The samples were
placed into 750 μL polypropylene autosampler vials and sealed with a PTFE septum
crimp cap. For reactions with intial concentrations greater than 250 ppb, serial dilutions
to achieve a concentration ~ 50 ppb were completed prior to analysis. Aliquots (20 μL)
were injected into an Agilent 1100 LC for separation on a Betasil C18 column (Thermo-
Electron) of dimensions 2.1 mm ID, 100 mm length, and 5 μm particle size. A 2 mM
aqueous ammonium acetate / methanol mobile phase at a flow rate of 0.75 mL min-1 was
used with an initial composition of 70:30 water / methanol. Analytical procedures are
detailed in previous reports11. The HPLC effluents were analyzed with an Agilent Ion
Trap MS in the negative ion mode for the perfluorooctanesulfonate molecular ion (m/z =
499) and the decarboxylated perfluoroctanoate (m/z = 369). The nebulizer gas pressure
was 40 PSI, while the drying gas flow rate and temperature were 9 L min-1 and 325 ºC,
respectively. The capillary voltage was set at + 3500 V and the skimmer voltage was – 15
V. Quantification was completed by first producing a calibration curve using 8
concentrations between 1 ppb and 200 ppb fitted to a quadratic with X-1 weighting.
117
Surface tension measurements were made with a De Nouy tensiometer utilizing the
standard ring method (ASTM D1331-89). The tensiometer was calibrated with a weight
of known mass. Each sample was measured three times with the deviation between
measurements less than 1%. The PFOS measurements were completed up to ~ 1 mM
where the compound became insoluble. The curve was fitted to the surface pressure
equation of state using Matlab to determine the partitioning coefficient and the maximum
surface concentration.
Results
PFOX Concentration-Dependent Sonochemical Kinetics
Sonolysis of aqueous solutions containing both PFOS and PFOA were carried out
over a range of initial concentrations from 20 nM to 200 μM (ν = 354 kHz, ρPD = 250 W
L-1, I = 6.4 W cm-2). A plot of [PFOS]t/[PFOS]i vs. time for a representative set of PFOS
concentrations is shown in Figure 4.1a. At PFOS concentrations over the range of 20 nM
to 14 μM, the observed kinetics are pseudo-first-order over four half-lives and are fitted
to a single exponential decay. Previously reported results on PFOS and PFOA
sonochemical decomposition completed at [PFOS]i ≤ 20 μM displayed a similar kinetic
order4,11. At PFOS concentrations of 39 μM to 202 μM, the reaction kinetics are zero-
order over the entire time-course. At an intermediate PFOS concentration of 30 μM, the
data is fit to a quasi-exponential decay after the concentration dropped below 25 μM after
30 minutes of sonication. The transition from pseudo-first-order kinetics at low
concentrations to zero-order kinetics at high concentrations is consistent with saturation
kinetics. Initial PFOS sonochemical decomposition occurs pyrolytically at the bubble-
water interface, therefore at high [PFOS]i the number of transiently cavitating bubble-
water interfacial adsorption sites becomes saturated.
118
A qualitatively similar transition was observed for the sonolytic degradation of PFOA
upon increasing the initial PFOA concentration. A plot of [PFOA]t/[PFOA]i vs. time for
a representative set of concentrations is shown in Figure 4.1b. At initial PFOA
concentrations over the range of 24 nM to 6.5 μM, the reaction kinetics are pseudo first-
order over at least four half-lives and are fitted to an exponential decay. At higher initial
concentrations where [PFOA]i ≥ 35 μM, the reaction kinetics are zero-order over the
entire time-course. At intermediate concentrations of 13.2, 16.6, and 30.5 μM, the
reaction kinetics appear to be exponential after the first 30 minutes of reaction. The
kinetic transition from pseudo-first-order to zero-order decay is similar to that observed
for PFOS, and consistent with saturation kinetics
The observed kinetic parameters are given in Table 4.1. For low initial
concentrations, [PFOS]i < 25 μM and [PFOS]i < 13 μM, the time-dependent plot was
fitted to an exponential curve to determine the first-order rate constant, (minkapp−PFOX -1),
and eq. 4.1 was used to determine the absolute rate.
d[PFOX]dt
= −kapp− PFOX [PFOX] (4.1)
For high initial concentrations, [PFOX]i > 40 μM, the time-dependent plot was fitted to a
linear curve with the slope, , taken to be the absolute degradation rate, eq. 4.2. kapp−PFOX '
d[PFOX]dt
= −kapp− PFOX ' (4.2)
For intermediate concentrations, the decay for the first 30 minutes was assumed to be
linear and fit to eq. 4.2 and the decay after 30 minutes was fit to eq. 4.1. The overall
degradation rate in Table 4.1 was taken as the temporal average of these two rates.
Equilibrium Partitioning to the Air-Water Interface
119
The Langmuir model describes adsorption to an interface. In the Langmuir model, the
surface excess, , is a function of the equilibrium interface partitioning constant or
surface activity, in L mol
Γex
K eq-1, and the maximum surface concentration, Γ in mol mmax
-
2. For example, equilibrium adsorption of PFOX to the air-water interface is modeled as
shown in eq. 4.3.
Γex,eqPFOX = ΓMax,eq
PFOX KeqPFOX[PFOX]
1+ KeqPFOX[PFOX]
(4.3)
The corresponding and values are determined from the dependence of
surface tension on [PFOX], Figure 4.2, by least-squares fitting of the surface pressure to
the Szyszkowski equation, eq. 4.4
Γeq,exPFOX Keq
PFOX
(4.4) Π = γ 0 − γ [PFOX ] = nRT ΓMax,eqPFOX ln(1+ Keq
PFOX [PFOX])
where Π is the surface pressure in N m-1, γ0 = 0.072 N m-1 is the surface tension of pure
water, and γ[PFOX] is the surface tension at [PFOX]. Maximum air-water interface
concentrations of Γ = 4.5 x 10Max,eqPFOA -6 mol m-2 and Γ = 5.1 x 10Max,eq
PFOS -6 mol m-2, and
equilibrium partitioning coefficients of = 360 L molKeqPFOA -1 and = 1970 L molKeq
PFOS -1
are determined. The surface tension of solutions containing both PFOS and PFOA at
equal concentrations was also measured and is plotted in Figure 4.2a. The stronger
surfactant, PFOS, controls the surface tension as observed by the near overlap of the
γ[PFOS] vs. [PFOS] curve and the γ[PFOS]+[PFOA] vs. [PFOS] + [PFOA] curve. Both the
PFOS alone and [PFOS] + [PFOA] curves truncate between 1 to 2 mM, as the sodium
salt of PFOS becomes insoluble in water. However, the agreement Γ and
values calculated here with previously determined values
Max,eqPFOX Keq
PFOX
35–38 shows that solubility limits
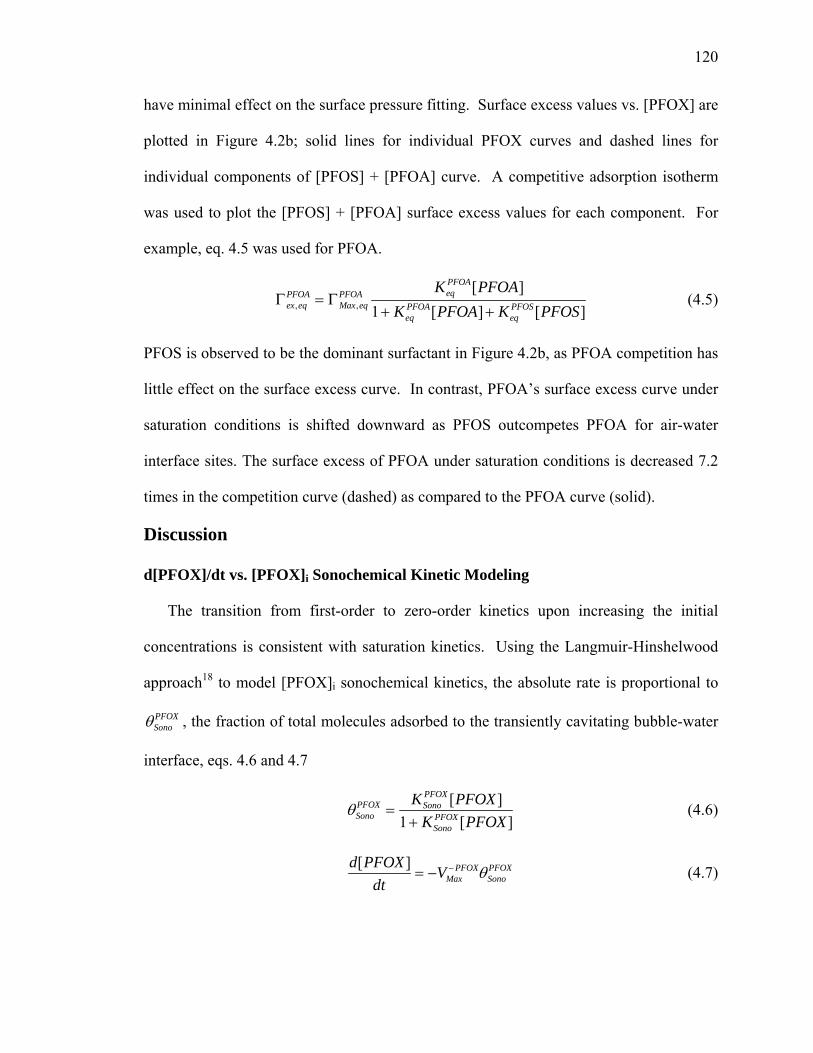
120
have minimal effect on the surface pressure fitting. Surface excess values vs. [PFOX] are
plotted in Figure 4.2b; solid lines for individual PFOX curves and dashed lines for
individual components of [PFOS] + [PFOA] curve. A competitive adsorption isotherm
was used to plot the [PFOS] + [PFOA] surface excess values for each component. For
example, eq. 4.5 was used for PFOA.
Γex,eqPFOA = ΓMax,eq
PFOA KeqPFOA[PFOA]
1+ KeqPFOA[PFOA] + Keq
PFOS[PFOS] (4.5)
PFOS is observed to be the dominant surfactant in Figure 4.2b, as PFOA competition has
little effect on the surface excess curve. In contrast, PFOA’s surface excess curve under
saturation conditions is shifted downward as PFOS outcompetes PFOA for air-water
interface sites. The surface excess of PFOA under saturation conditions is decreased 7.2
times in the competition curve (dashed) as compared to the PFOA curve (solid).
Discussion
d[PFOX]/dt vs. [PFOX]i Sonochemical Kinetic Modeling
The transition from first-order to zero-order kinetics upon increasing the initial
concentrations is consistent with saturation kinetics. Using the Langmuir-Hinshelwood
approach18 to model [PFOX]i sonochemical kinetics, the absolute rate is proportional to
, the fraction of total molecules adsorbed to the transiently cavitating bubble-water
interface, eqs. 4.6 and 4.7
θSonoPFOX
θSonoPFOX =
KSonoPFOX [PFOX]
1 + KSonoPFOX[PFOX]
(4.6)
d[PFOX]dt
= −VMax− PFOXθSono
PFOX (4.7)

121
where V (M sMax− PFOX -1) is the maximum reaction rate when all the available bubble surface
sorption sites are occupied.
The transition in kinetic regimes is consistent with Langmuir-Hinshelwood kinetic
limits. At low PFOX concentration, when the surface is undersaturated and the observed
kinetics are pseudo-first-order:
(4.8) KSonoPFOX [PFOX] << 1
(4.9) θSonoPFOX = KSono
PFOX [PFOX]
d[PFOX]dt
= kapp− PFOX [PFOX] = −VMax
− PFOX KSonoPFOX [PFOX] (4.10)
(4.11) kapp−PFOX = −VMax
−PFOXKSonoPFOX
At intermediate concentration, there is a barrier to continued adsorption as the interfacial
sites become increasingly populated, % levels:
d[PFOX]
dt= −VMax
− PFOX KSonoPFOX[PFOX]
1+ KSonoPFOX[PFOX]
(4.12)
At high concentration, all of the surface sites are occupied and the maximum absolute
rate is achieved:
(4.13) KSonoPFOX [PFOX] >> 1
d[PFOX]dt
= −VMax− PFOX (4.14)
Thus, at low and intermediate concentration the kinetics are controlled by the fraction of
the total PFOX molecules, which are absorbed to the bubble-water interface, as given by
the Langmuir isotherm (eq. 4.6). At high concentration, the bubble-water interface is
saturated with PFOX molecules and the rate is limited by the intrinsic chemical reaction
rate (e.g., PFOX pyrolysis)40–45.
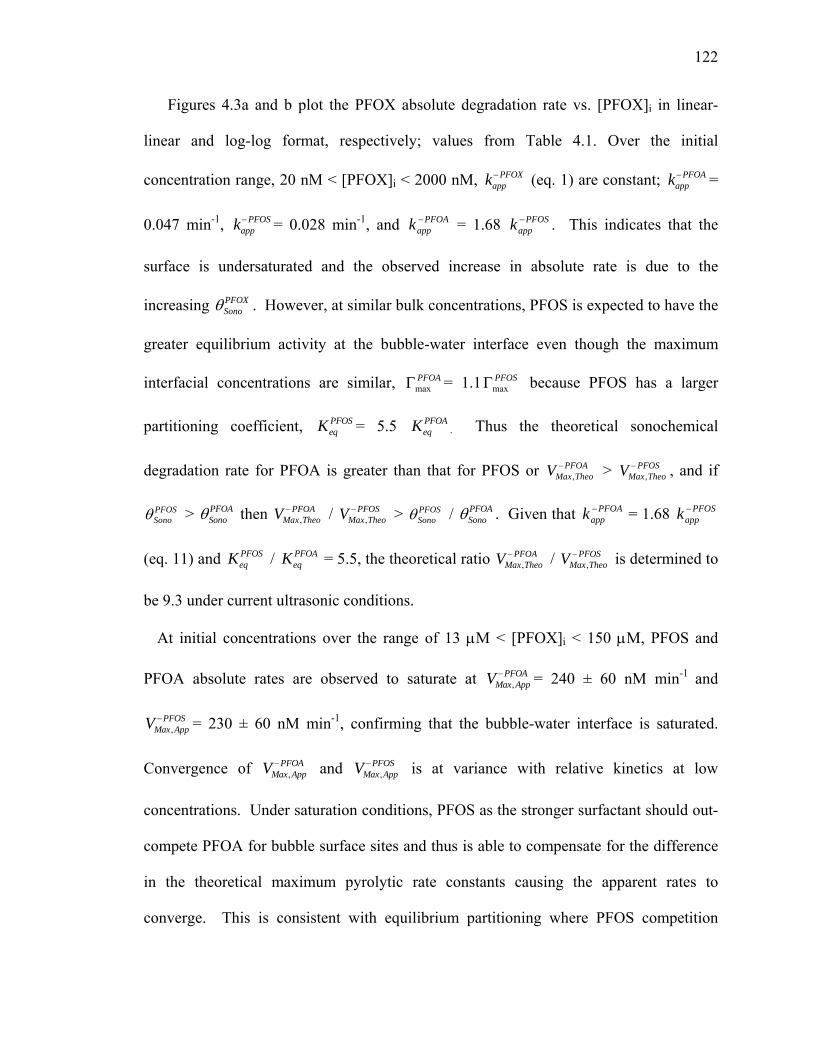
122
Figures 4.3a and b plot the PFOX absolute degradation rate vs. [PFOX]i in linear-
linear and log-log format, respectively; values from Table 4.1. Over the initial
concentration range, 20 nM < [PFOX]i < 2000 nM, (eq. 1) are constant; =
0.047 min
kapp−PFOX kapp
−PFOA
-1, = 0.028 minkapp− PFOS -1, and = 1.68 . This indicates that the
surface is undersaturated and the observed increase in absolute rate is due to the
increasing . However, at similar bulk concentrations, PFOS is expected to have the
greater equilibrium activity at the bubble-water interface even though the maximum
interfacial concentrations are similar, = 1.1 because PFOS has a larger
partitioning coefficient, = 5.5
PFOAappk − PFOS
appk −
θSonoPFOX
PFOAmaxΓ PFOS
maxΓ
KeqPFOS Keq
PFOA. Thus the theoretical sonochemical
degradation rate for PFOA is greater than that for PFOS or V > V , and if
> then V / V > / . Given that = 1.68
(eq. 11) and / = 5.5, the theoretical ratio V / V is determined to
be 9.3 under current ultrasonic conditions.
Max,Theo− PFOA
Max,Theo− PFOS
θSonoPFOS θSono
PFOAMax,Theo− PFOA
Max,Theo− PFOS θSono
PFOS θSonoPFOA PFOA
appk − PFOSappk −
KeqPFOS Keq
PFOAMax,Theo− PFOA
Max,Theo− PFOS
At initial concentrations over the range of 13 μM < [PFOX]i < 150 μM, PFOS and
PFOA absolute rates are observed to saturate at V = 240 ± 60 nM minMax,App−PFOA -1 and
= 230 ± 60 nM minVMax,App−PFOS -1, confirming that the bubble-water interface is saturated.
Convergence of V and V is at variance with relative kinetics at low
concentrations. Under saturation conditions, PFOS as the stronger surfactant should out-
compete PFOA for bubble surface sites and thus is able to compensate for the difference
in the theoretical maximum pyrolytic rate constants causing the apparent rates to
converge. This is consistent with equilibrium partitioning where PFOS competition
Max,App−PFOA
Max,App−PFOS
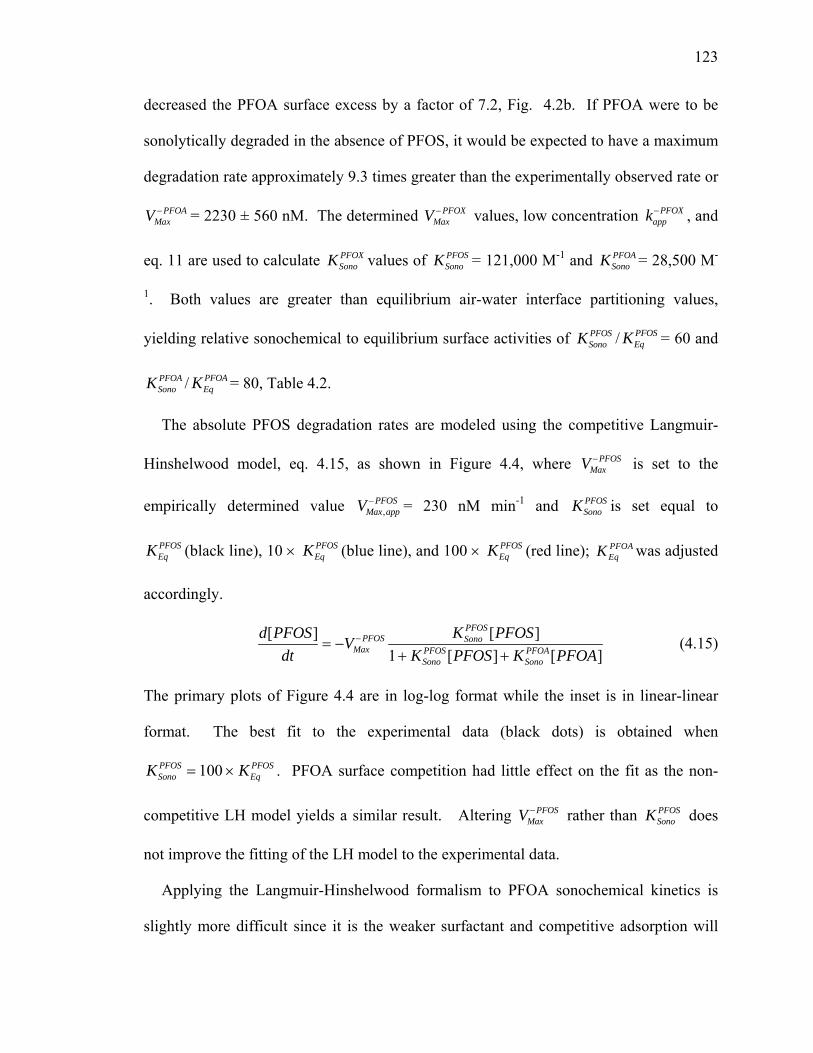
123
decreased the PFOA surface excess by a factor of 7.2, Fig. 4.2b. If PFOA were to be
sonolytically degraded in the absence of PFOS, it would be expected to have a maximum
degradation rate approximately 9.3 times greater than the experimentally observed rate or
= 2230 ± 560 nM. The determined V values, low concentration , and
eq. 11 are used to calculate values of K = 121,000 M
VMax− PFOA
Max− PFOX kapp
−PFOX
KSonoPFOX
SonoPFOS -1 and = 28,500 MKSono
PFOA -
1. Both values are greater than equilibrium air-water interface partitioning values,
yielding relative sonochemical to equilibrium surface activities of / = 60 and
/ = 80, Table 4.2.
KSonoPFOS KEq
PFOS
KSonoPFOA KEq
PFOA
The absolute PFOS degradation rates are modeled using the competitive Langmuir-
Hinshelwood model, eq. 4.15, as shown in Figure 4.4, where V is set to the
empirically determined value V = 230 nM min
Max−PFOS
Max,app−PFOS -1 and is set equal to
(black line), 10 × (blue line), and 100 × (red line); was adjusted
accordingly.
KSonoPFOS
KEqPFOS KEq
PFOS KEqPFOS KEq
PFOA
d[PFOS]
dt= −VMax
− PFOS KSonoPFOS[PFOS]
1+ KSonoPFOS[PFOS] + KSono
PFOA[PFOA] (4.15)
The primary plots of Figure 4.4 are in log-log format while the inset is in linear-linear
format. The best fit to the experimental data (black dots) is obtained when
. PFOA surface competition had little effect on the fit as the non-
competitive LH model yields a similar result. Altering V rather than does
not improve the fitting of the LH model to the experimental data.
KSonoPFOS = 100 × KEq
PFOS
Max−PFOS KSono
PFOS
Applying the Langmuir-Hinshelwood formalism to PFOA sonochemical kinetics is
slightly more difficult since it is the weaker surfactant and competitive adsorption will
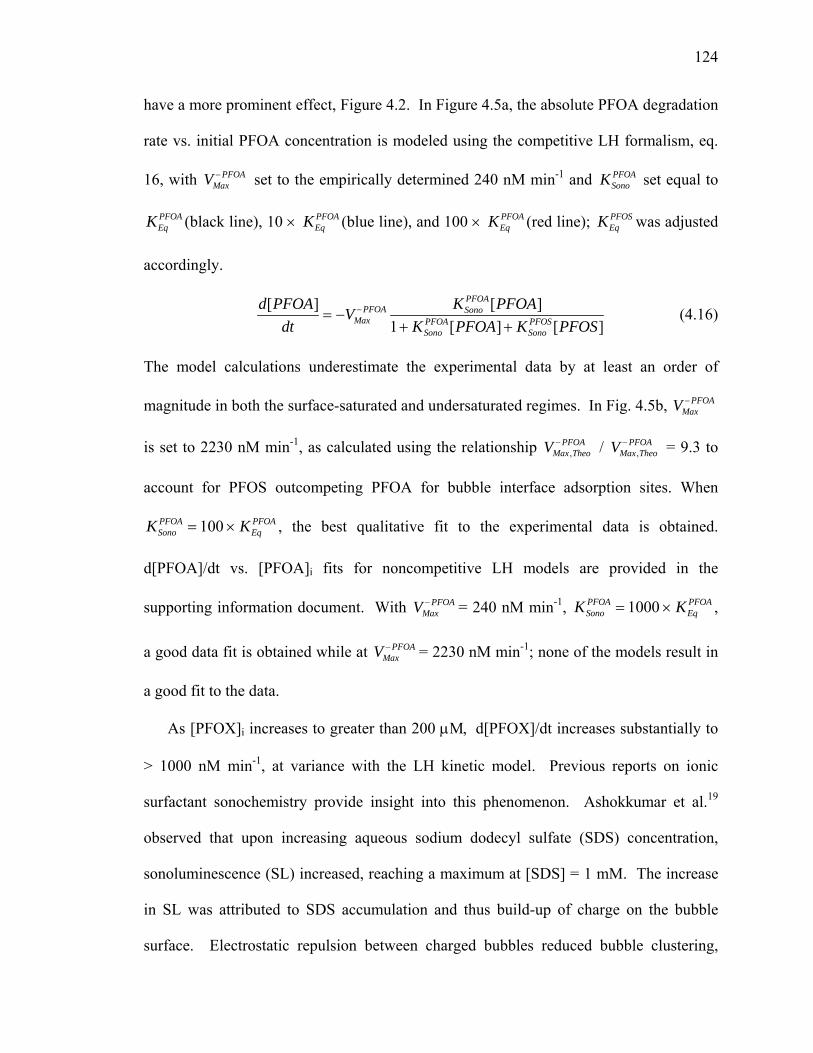
124
have a more prominent effect, Figure 4.2. In Figure 4.5a, the absolute PFOA degradation
rate vs. initial PFOA concentration is modeled using the competitive LH formalism, eq.
16, with V set to the empirically determined 240 nM minMax− PFOA -1 and set equal to
(black line), 10 × (blue line), and 100 × (red line); was adjusted
accordingly.
KSonoPFOA
KEqPFOA KEq
PFOA KEqPFOA KEq
PFOS
d[PFOA]
dt= −VMax
− PFOA KSonoPFOA[PFOA]
1+ KSonoPFOA[PFOA] + KSono
PFOS[PFOS] (4.16)
The model calculations underestimate the experimental data by at least an order of
magnitude in both the surface-saturated and undersaturated regimes. In Fig. 4.5b, V
is set to 2230 nM min
Max− PFOA
-1, as calculated using the relationship V / = 9.3 to
account for PFOS outcompeting PFOA for bubble interface adsorption sites. When
, the best qualitative fit to the experimental data is obtained.
d[PFOA]/dt vs. [PFOA]
Max,Theo− PFOA VMax,Theo
− PFOA
KSonoPFOA = 100 × KEq
PFOA
i fits for noncompetitive LH models are provided in the
supporting information document. With V = 240 nM minMax− PFOA -1, ,
a good data fit is obtained while at V = 2230 nM min
KSonoPFOA = 1000 × KEq
PFOA
Max− PFOA -1; none of the models result in
a good fit to the data.
As [PFOX]i increases to greater than 200 μM, d[PFOX]/dt increases substantially to
> 1000 nM min-1, at variance with the LH kinetic model. Previous reports on ionic
surfactant sonochemistry provide insight into this phenomenon. Ashokkumar et al.19
observed that upon increasing aqueous sodium dodecyl sulfate (SDS) concentration,
sonoluminescence (SL) increased, reaching a maximum at [SDS] = 1 mM. The increase
in SL was attributed to SDS accumulation and thus build-up of charge on the bubble
surface. Electrostatic repulsion between charged bubbles reduced bubble clustering,

125
leading to a greater number of more intense SL active bubble events. Total bubble
volume was reported to decrease as bulk [SDS] was increased, with a 50% reduction in
total bubble volume at [SDS] = 100 μM20 suggesting a reduction in bubble coalescence.
Increasing [SDS] led to a decrease in broadband acoustic emission, even though total
acoustic emission increased21, suggesting a transition to a greater number of more intense
bubble collapse events22 due to reduction in bubble-bubble clustering and coalescence.
As anionic surfactants, PFOS and PFOA would be expected to have a similar effect on
bubble-bubble interactions as SDS. The increase in PFOX absolute degradation rate
occurs at [PFOX]i > 100 μM , consistent with SDS concentrations where SL, total bubble
volume, and acoustic emission effects are observed to take affect. Reduction in bubble-
bubble coalescence and clustering leading to a greater number of more intense bubble
collapse events would result in a greater number of bubble interface face adsorption sites
and consequently an increase in PFOX sonochemical degradation kinetics.
Non-Equilibrium Bubble Surface Activity
Optimized fitting of the experimental kinetic data as a function of [PFOX] to the LH
model gives = 60 and = 80 . Data from two previous reports,
which are fit to LH kinetics, is presented in Table 4.2. Concentration-dependent alkyl
radical production for sodium dodecyl sulfate (SDS) and sodium octyl sulfate (SOS)
from the work of Sostaric and Reisz
KSonoPFOS KEq
PFOS KSonoPFOA KEq
PFOA
31 was fit to the LH model using an empirically
determined maximum rate of alkyl radical production. For both compounds, K
appears to be greater than . The relative difference between and was
greater for the weaker surfactant: = 12.5 vs. = 410 . This trend is
expected to hold for sodium pentyl sulfonate (SPSo), a weaker surfactant than SOS,
Sono
KEq KSono KEq
KSonoSDS KEq
SDS KSonoSOS KEq
SOS
126
which had a similar sonochemical surface activity to SOS and SDS. Kim and Jung29
modeled sonochemical degradation of humic acids (anionic, surface-active, natural
organic matter) with LH kinetics and their results give values of as well.
The humic acid degradation kinetics gave the greatest relative surface activity difference,
= 3400 ; most likely due to the very high applied acoustic power density,
14,000 W L
KSono > KEq
KSonoHumic KEq
Humic
-1.
Greater sonochemical surface activity over that of the predicted equilibrium surface
activity was predicted by the calcuations of Fryllis and Szeri13. Their work argues that
high-velocity bubble oscillations should increase the transport of surfactants to a lightly
populated surface. Their conclusions are in qualitative agreement with the work of Eller
and Flynn23 on rectified diffusion. Under their ‘high frequency approximation’, which is
valid for f > 20 kHz, diffusion can be assumed to be a slow process as compared to the
radial motion of acoustic bubbles. For example, the sonochemical surface activity can be
broken in the ratio of the rates of adsorption to and desorption from the interface:
KSono =kads
kdes
. Thus an increase in or a decrease in will result in an increase in
. It is much easier to rationalize an increase in . For a lightly populated surface
and processes such as high-velocity bubble oscillations or acoustic
microstreaming may enhance diffusion to the bubble interface. A rough, yet insightful
example will be presented to further this point.
kads kdes
KSono kads
kads = kdif
A transiently cavitating bubble will expand from its average initial radius, R0, to its
max radius, Rmax, over a period of 0.5f, where f is the ultrasonic frequency5. Rmax (μm)
can be calculated using the equation:
127
(4.17) 3/12/16max ]3/)1(21[))(1)(/103()( −+−= −
aaa PPPfxmR μ
where Pa is the acoustic pressure ( bar), ρ is the density of
water (1000 kg m
101325/)2( 2/1ALa ICP ρ=
-3), CL is the speed of sound in water (1500 m s-1), and IA is the acoustic
intensity (51000 W m-2 at a calorimetric power of 120 watts over a transducer area of
23.5 cm2). Assuming a monotonic distribution of bubbles24, R0 can be estimated as the
average of Rmax/2.5, which is the dynamic limit for transient cavitation, and RB, which is
Blake’s radius of bubble dissolution5. Since RB << Rmax/2.5 the value of R0 is roughly
Rmax/5. Sonochemical parameters of 354 kHz and 120 watts correspond to Rmax = 18 μm
and Rmax/5 = 3.6 μm. Thus, a point on the bubble surface travels a radial distance of 14.4
μm over the rarefaction period of 1.4 μs and assuming a constant radial velocity, a point
at the bubble surface will travel at 10 m s-1 during expansion under present sonochemical
conditions. If we assume a diffusion constant of 10-5 cm2 s-1 or 10-3 μm2 μs-1 for PFOS
and PFOA, over a period of 1.4 μs a single molecule is expected to travel around 35 nm,
which is much less than the bubble radial motion of 14.4 μm over the same period.
The differential volume between the average initial bubble, R0 = 3.6 μm, and a bubble
at its maximum radius, Rmax = 18 μm, is Vdiff = (4/3) π (183 – 3.63) = 24200 μm3. Using
the high-frequency assumption that the rate of diffusion is significantly less than the rate
of radial expansion, then all of the PFOS or PFOA molecules contained in the initial
volume would be packed into a sheath of 35 nm in radius around the maximal bubble
volume, Vsheath = (4/3) π (18.0353 – 183) = 143 μm3. The ratio of the initial differential
bubble volume to the bubble sheath volume, Vdiff/Vsheath = 170. This suggests that the
sonochemically induced increase in PFOS and PFOA surface activity may be partially
due to high-velocity bubble oscillations enhancing the diffusion of the fluorochemicals to
128
the bubble-water. Other effects such as acoustic microstreaming24 may also be
responsible for enhanced diffusion to the bubble interface and thus the sonochemical
surface activity
The results here are seemingly at variance with recent work by Tronson et al.33 and
Sunartio et al.34 which concluded that the Gibb’s surface excess was not attained for non-
volatile surfactants. Fyrillas and Szeri28 predicted that high-velocity bubble oscillations
would reduce the maximal surfactant bubble surface population. This is consistent with
conclusions that relatively short acoustic bubble lifetimes (~ 100 μs), as compared to
ionic surfactant equilibration times (> 1 ms), led to the Gibb’s surface excess not being
attained during ultrasonic irradiation. Examples of possible nonequilibrium
sonochemical PFOS surface activites, , and possible nonequilibrium sonochemical
max surface excesses, , and their affects on the surface excess population,
(eq. 3), are presented in Figure 4.6. Variations in lead to a vertical shift in the
vs. [PFOS] curve, with the expected sonochemical effect to be a decrease in
and thus an overall, concentration-independent decrease in . Variations in
lead to a horizontal shift in the vs. [PFOS] curve. The experimental results
presented here suggest an increase in and thus a shift in the direction of the
ordinate. If a decrease in and an increase in occur upon moving from
equilibrium air-water interface partitioning to a sonochemical air-water interface
partitioning, then under surface saturation conditions a decrease would still be
predicted. Therefore, the experimental results presented suggesting a sonochemical
increase in surface activity, , are not necessarily at variance with previous
K PFOS
ΓMaxPFOS Γex
PFOS
ΓMaxPFOS
ΓexPFOS ΓMax
PFOS
Γ exPFOS
K PFOS ΓexPFOS
K PFOS
ΓMaxPFOS K PFOS
ΓexPFOS
KSono > KEq

129
results suggesting the Gibb’s surface excess was not attained for nonvolatile solutes. For
example, in Figure 4.6c, simultaneous variations in both and have been
plotted. Decreasing by a factor of ten also reduces under lightly populated
conditions by a factor of 10 (green line). Increasing by a factor of 10 (blue line)
brings to the equilibrium level (black line) for undersaturation conditons.
Furthermore, when is decreased by a factor of 10 and is increased by a
factor of 100 (red line), the then exceeds the predicted equilibrium adsorption limit
for lightly populated conditions and is still below predicted equilibrium adsorption for
saturation conditions.
ΓMaxPFOS K PFOS
Γ MaxPFOS Γex
PFOS
K PFOS
ΓexPFOS
Γ MaxPFOS K PFOS
ΓexPFOS
Conclusions
The sonochemical degradation kinetics of PFOS and PFOA have been studied over the
concentration range of 20 nM < [PFOX]I < 200 μM. The kinetics are fit to the Langmuir-
Hinshelwood model using experimental rate maximums of V = 2230 ± 560 nM minMax− PFOA -
1 and = 230 ± 60 nM minVMax−PFOS -1. The corresponding sonochemical bubble surface
activities for PFOS and PFOA are determined to be = 120,000 MKSonoPFOS -1 and =
28,500 M
KSonoPFOA
-1, respectively. Competitive bubble surface adsorption is factored into the LH
model in order to accurately model the kinetics of PFOA under saturation conditions.
The sonochemical surface activities, , are 50 to 100 times greater than the
predicted equilibrium air-water interfacial activities, , as determined via
concentration-dependent surface tension measurements. The apparent enhancements in
bubble surface activities has positive implications for the application of ultrasonic
irradation as a treatment technology for dilute, < 1 μM, aqueous solutions of PFOS and
KSonoPFOX
KEqPFOX

130
PFOA. At low concentrations, the efficacy of conventional chemical treatment methods
is greatly reduced due to concentration effects. These results will also have implications
for the sonochemical destruction of other pollutants where adsorption to the transiently
cavitating bubble interface is expected to partially mediate absolute degradation rates.
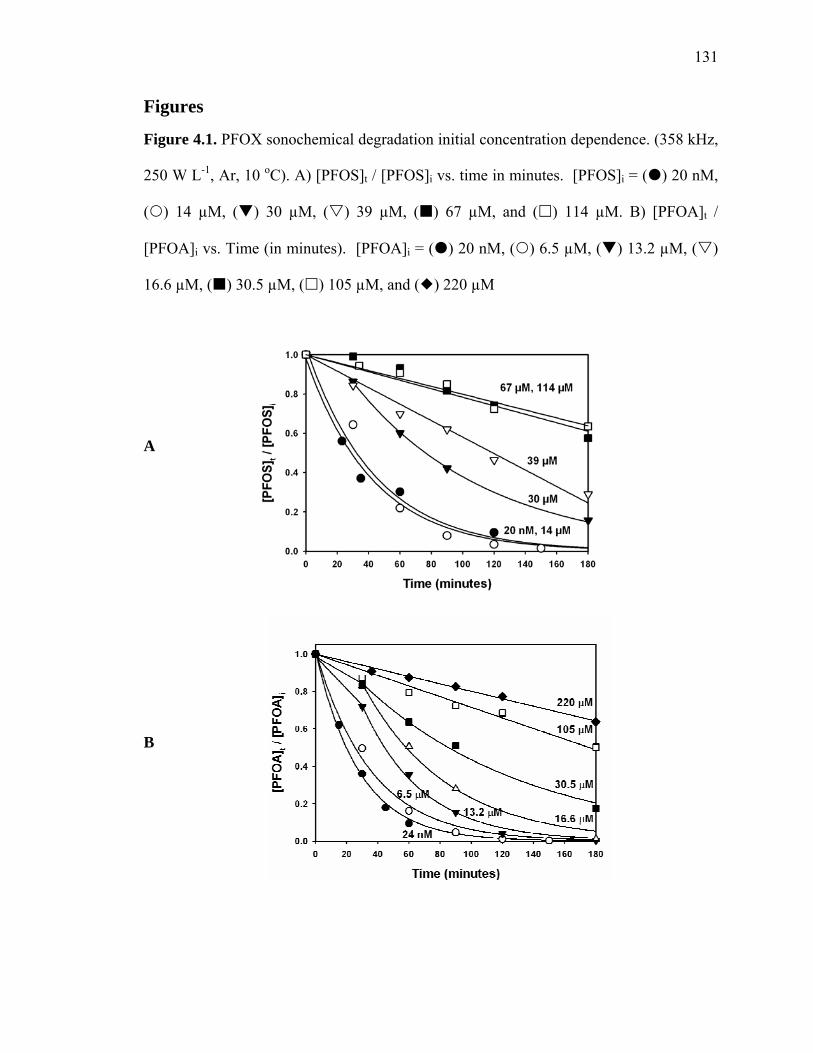
131
Figures
Figure 4.1. PFOX sonochemical degradation initial concentration dependence. (358 kHz,
250 W L-1, Ar, 10 oC). A) [PFOS]t / [PFOS]i vs. time in minutes. [PFOS]i = ( ) 20 nM,
( ) 14 µM, ( ) 30 µM, ( ) 39 µM, ( ) 67 µM, and ( ) 114 µM. B) [PFOA]t /
[PFOA]i vs. Time (in minutes). [PFOA]i = ( ) 20 nM, ( ) 6.5 µM, ( ) 13.2 µM, ( )
16.6 µM, ( ) 30.5 µM, ( ) 105 µM, and ( ) 220 µM
A
B
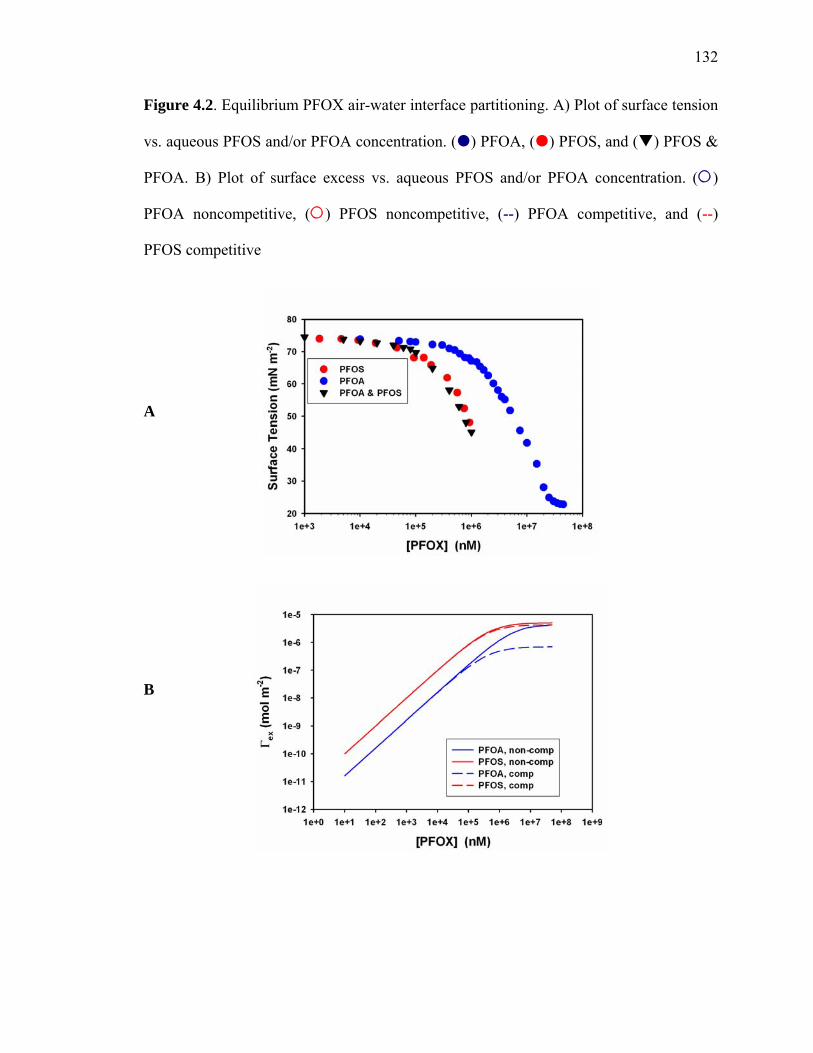
132
Figure 4.2. Equilibrium PFOX air-water interface partitioning. A) Plot of surface tension
vs. aqueous PFOS and/or PFOA concentration. ( ) PFOA, ( ) PFOS, and ( ) PFOS &
PFOA. B) Plot of surface excess vs. aqueous PFOS and/or PFOA concentration. ( )
PFOA noncompetitive, ( ) PFOS noncompetitive, (--) PFOA competitive, and (--)
PFOS competitive
A
B
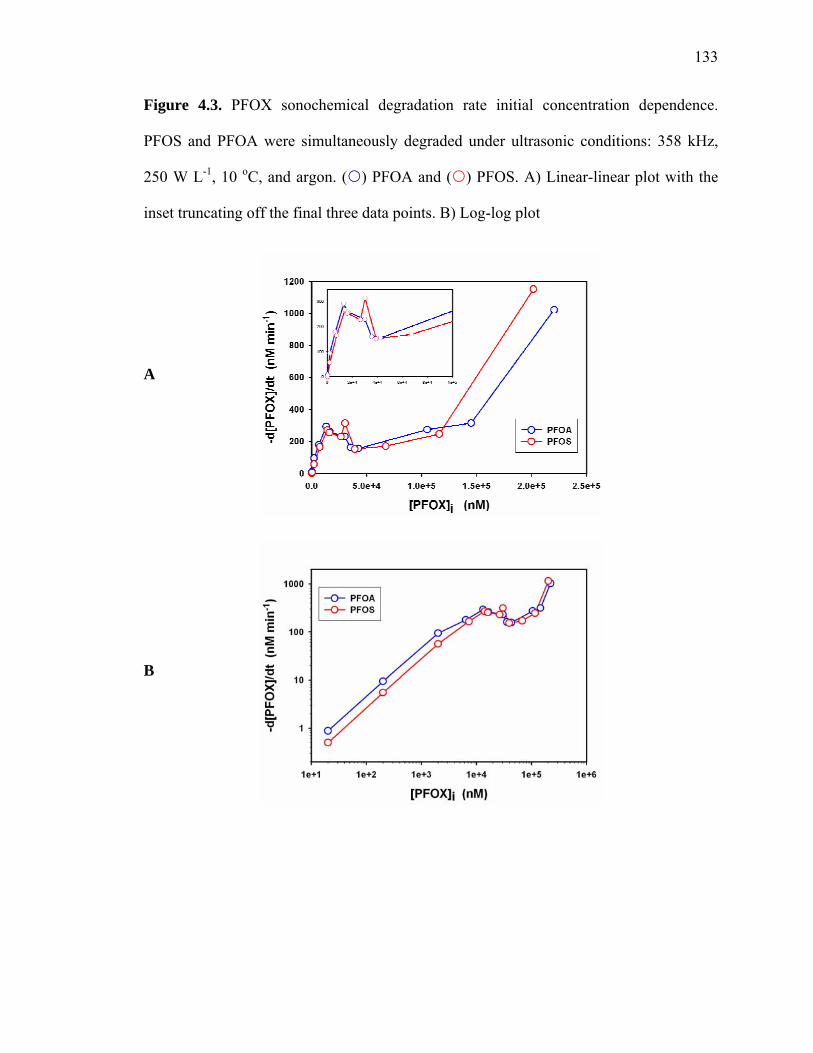
133
Figure 4.3. PFOX sonochemical degradation rate initial concentration dependence.
PFOS and PFOA were simultaneously degraded under ultrasonic conditions: 358 kHz,
250 W L-1, 10 oC, and argon. ( ) PFOA and ( ) PFOS. A) Linear-linear plot with the
inset truncating off the final three data points. B) Log-log plot
A
B

134
Figure 4.4. Kinetic modeling of PFOS sonolysis concentration-dependent kinetics. –
[PFOS]/dt vs. [PFOX]i fitted by competitive Langmuir-Hinshelwood model, eq. 4.15:
= 230 nM minVMax,app−PFOS -1. ( ) Experimental, () ,
() and ()
KSonoPFOS = KEq
PFOS
KSonoPFOS = 10 × KEq
PFOS KSonoPFOS = 100 × KEq
PFOS
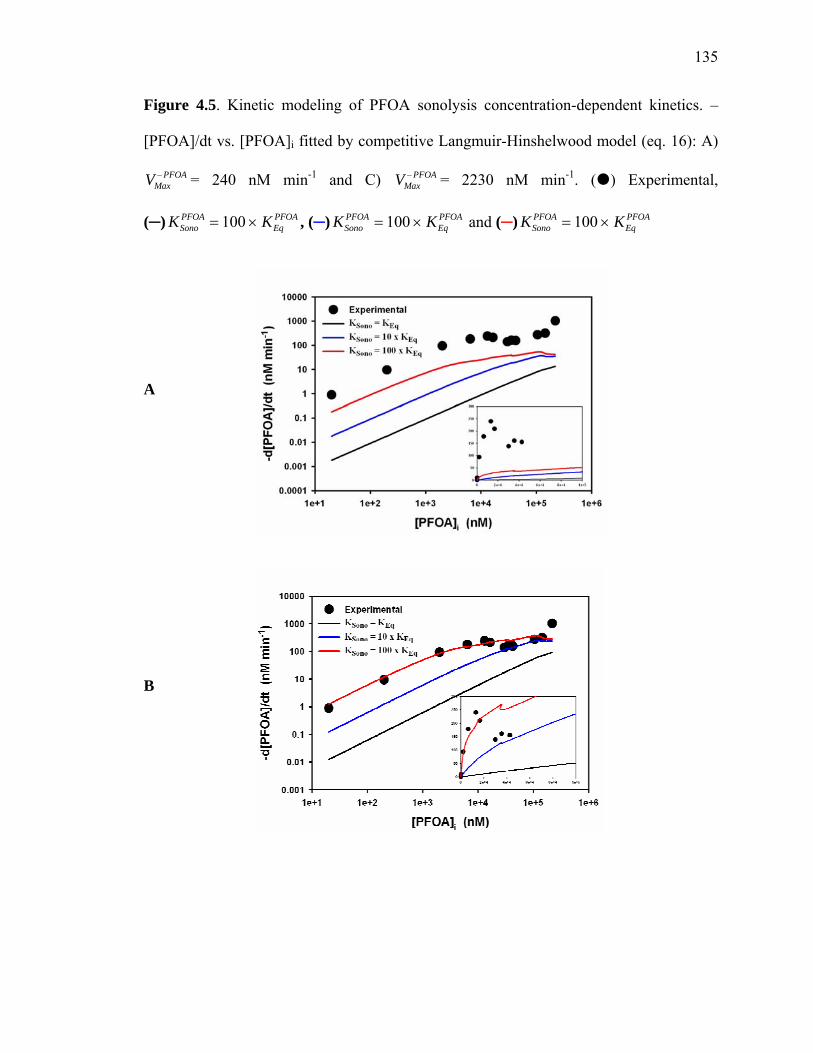
135
Figure 4.5. Kinetic modeling of PFOA sonolysis concentration-dependent kinetics. –
[PFOA]/dt vs. [PFOA]i fitted by competitive Langmuir-Hinshelwood model (eq. 16): A)
= 240 nM minVMax− PFOA -1 and C) V = 2230 nM minMax
− PFOA -1. ( ) Experimental,
() , () and () KSonoPFOA = 100 × KEq
PFOA KSonoPFOA = 100 × KEq
PFOA KSonoPFOA = 100 × KEq
PFOA
A
B
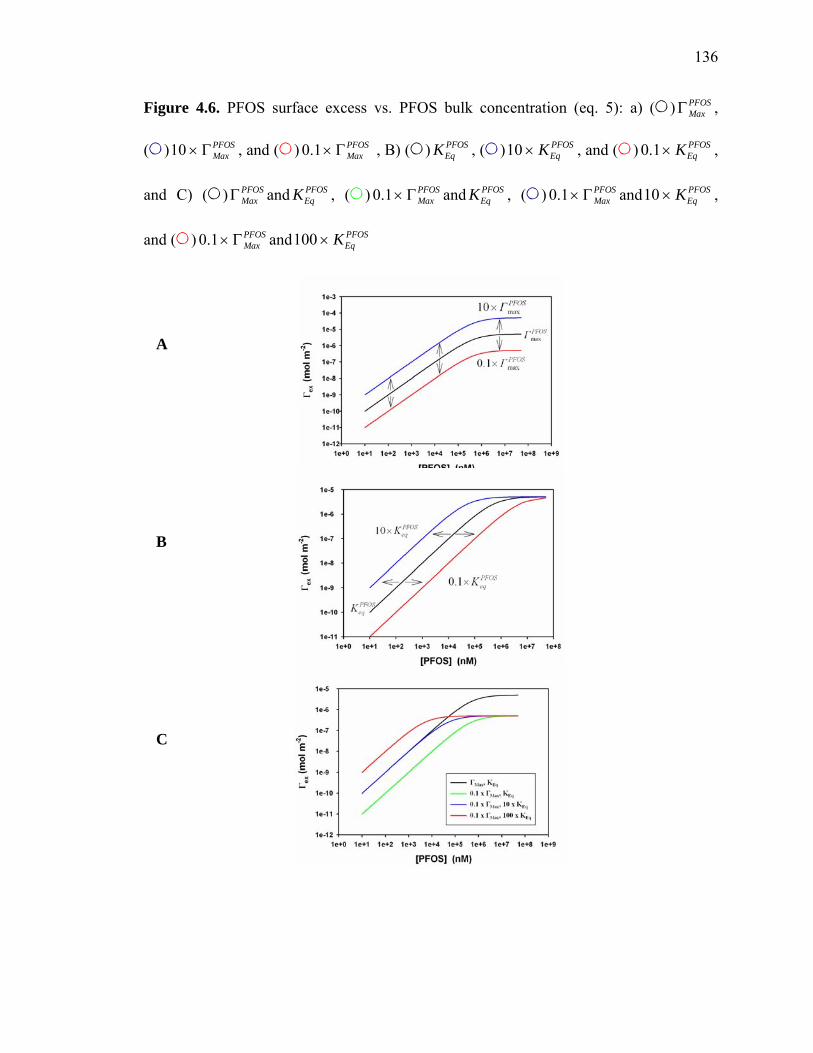
136
Figure 4.6. PFOS surface excess vs. PFOS bulk concentration (eq. 5): a) ( ) ,
( )1 , and ( ) 0 , B) ( ) , ( )10 , and ( ) ,
and C) ( ) and , ( ) and , ( ) and10 ,
and ( ) and100
ΓMaxPFOS
0 × ΓMaxPFOS .1× ΓMax
PFOS KEqPFOS × KEq
PFOS 0.1× KEqPFOS
ΓMaxPFOS KEq
PFOS 0.1× ΓMaxPFOS KEq
PFOS 0.1× ΓMaxPFOS × KEq
PFOS
0.1× ΓMaxPFOS × KEq
PFOS
A
B
C
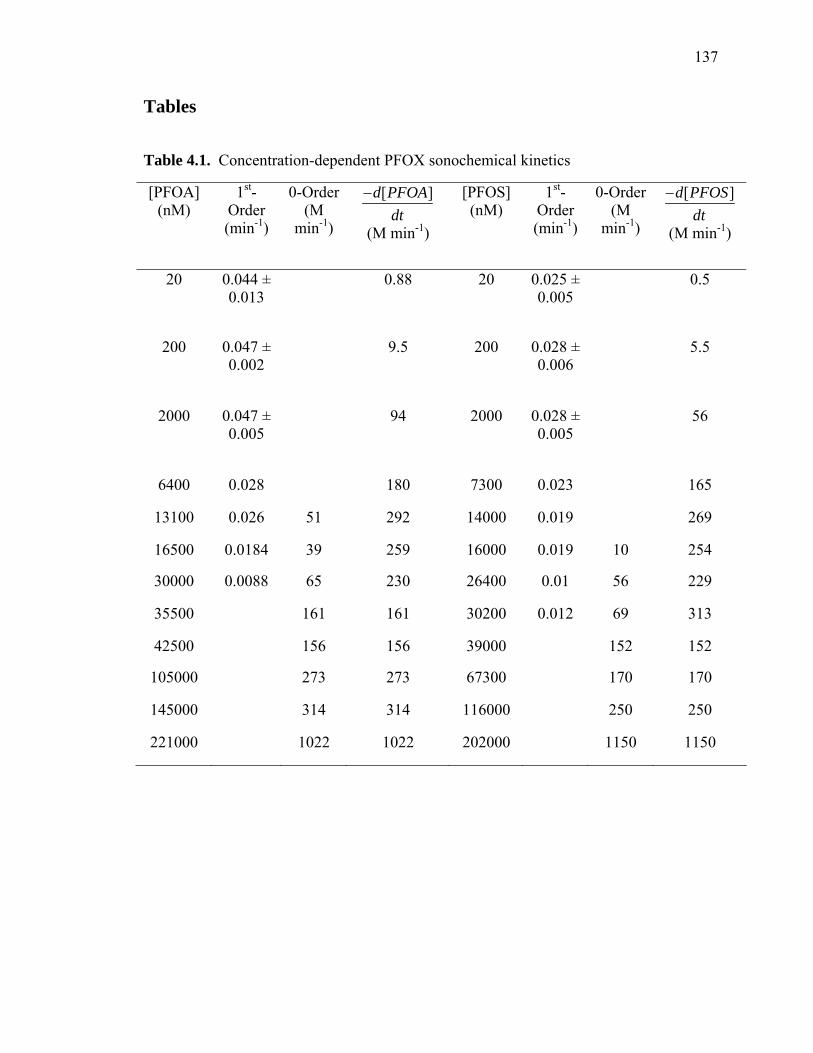
137
Tables
Table 4.1. Concentration-dependent PFOX sonochemical kinetics
[PFOA] (nM)
1st-Order (min-1)
0-Order (M
min-1)
−d[PFOA]dt
(M min-1)
[PFOS] (nM)
1st-Order (min-1)
0-Order (M
min-1)
−d[PFOS]dt
(M min-1)
20 0.044 ± 0.013
0.88 20 0.025 ± 0.005
0.5
200 0.047 ± 0.002
9.5 200 0.028 ± 0.006
5.5
2000 0.047 ± 0.005
94 2000 0.028 ± 0.005
56
6400 0.028 180 7300 0.023 165
13100 0.026 51 292 14000 0.019 269
16500 0.0184 39 259 16000 0.019 10 254
30000 0.0088 65 230 26400 0.01 56 229
35500 161 161 30200 0.012 69 313
42500 156 156 39000 152 152
105000 273 273 67300 170 170
145000 314 314 116000 250 250
221000 1022 1022 202000 1150 1150

138
Table 4.2. Sonochemical vs. equilibrium surface activity
Applied Power
Density (W L-1)
Frequency (kHz)
Γeq,max
(mol m-2)
Keq
(M-1) Vsono,max
KSono
(M-1)
KSono
KEq
Ref.
PFOS 354 250 5.1e-6 1,970 230 nM min-1 121,000 60 this
work
PFOA 354 250 4.5e-6 360 1660 nM
min-128,500 80 this
work
SDS 47 6.9e-625 40025 1 μM
min-1 5,000 12.5 26
SOS 47 6.4e-625 2225 1.4 μM
min-1 8,000 410 26
Humic 20 14,000 4.6e-627 1,18027 4e6 3,400 29

139
References
(1) 3M Company. The Science of Organic Fluorochemistry; Docket AR226-0547;
Office of Pollution Prevention and Toxics, U.S. Environmental Protection Agency:
Washington, D.C., 1999; p. 12.
(2) 3M Company. Sulfonated perfluorochemicals in the environment: Sources,
dispersion, fate and effects; Docket AR226-0620; Office of Pollution Prevention &
Toxics, U.S. Environmental Protection Agency: Washington, D.C., 2000; p. 51.
(3) 3M Company. Removal of PFOA with Granular Activated Carbon: 3M
Wastewater Treatment System Monitoring; Docket AR226-1699; Office of Pollution
Prevention & Toxics, U.S. Environmental Protection Agency: Washington, D.C., 2004;
p. 5.
(4) Key, B. D.; Howell, R. D.; Criddle, C. S. Environ. Sci. Technol. 1998, 32, 2283.
(5) Schultz, M. M.; Higgins, C. P.; Huset, C. A.; Luthy, R. G.; Barofsky, D. F.; Field,
J. A. Environ. Sci. Technol. 2006, 40, 7350.
(6) Schroder, H. F.; Meesters, R. J. W. J. Chromatogr. A 2005, 1082, 110.
(7) Hori, H.; Yamamoto, A.; Hayakawa, E.; Taniyasu, S.; Yamashita, N.; Kutsuna,
S.; Kiatagawa, H.; Arakawa, R. Environ. Sci. Technol. 2005, 39, 2383.
(8) Chen, J.; Zhang, P. Water Sci. Technol. 2006, 54.
(9) Hori, H.; Hayakawa, E.; Einaga, H.; Kutsuna, S.; Koike, K.; Ibusuki, T.;
Kiatagawa, H.; Arakawa, R. Environ. Sci. Technol. 2004, 38, 6118.
(10) Hori, H.; Nagaoka, Y.; Yamamoto, A.; Sano, T.; Yamashita, N.; Taniyasu, S.;
Kutsuna, S.; Osaka, I.; Arakawa, R. Environ. Sci. Technol. 2006, 40, 1049.
(11) Yamamoto, T.; Noma, Y.; Sakai, S. I.; Shibata, Y. Environ. Sci. Technol. 2007,
41, 5660.
140
(12) Hori, H.; Hayakawa, E.; Koike, K.; Einaga, H.; Ibusuki, T. J. Mol. Catal. A—
Chem. 2004, 211, 35.
(13) Dillert, R.; Bahnemann, D.; Hidaka, H. Chemosphere 2007, 67, 785.
(14) Moriwaki, H.; Takagi, Y.; Tanaka, M.; Tsuruho, K.; Okitsu, K.; Maeda, Y.
Environ. Sci. Technol. 2005, 39, 3388.
(15) Jennings, B. H.; Townsend, S. N. J. Phys. Chem. 1961, 65, 1574.
(16) Destaillats, H.; Hung, H. M.; Hoffmann, M. R. Environ. Sci. Technol. 2000, 34,
311.
(17) Kotronarou, A.; Mills, G.; Hoffmann, M. R. J. Phys. Chem. 1991, 95, 3630.
(18) Petrier, C.; David, B.; Laguian, S. Chemosphere 1996, 32, 1709.
(19) Brennen, C. E. Cavitation and Bubble Dynamics; Oxford University Press: New
York, 1995.
(20) Didenko, Y. T.; McNamara, W. B.; Suslick, K. S. J. Am. Chem. Soc. 1999, 121,
5817.
(21) Ciawi, E.; Rae, J.; Ashokkumar, M.; Grieser, F. J. Phys. Chem. B 2006, 110,
13656.
(22) Ashokkumar, M.; Grieser, F. J. Am. Chem. Soc. 2005, 127, 5326.
(23) Eddingsaas, N. C.; Suslick, K. S. J. Am. Chem. Soc. 2007, 129, 3838.
(24) Leighton, T. G. The Acoustic Bubble; Academic Press: London, 1994.
(25) Hung, H. M.; Hoffmann, M. R. J. Phys. Chem. A 1999, 103, 2734.
(26) Vecitis, C. D.; Park, H.; Cheng, J.; Mader, B. M.; Hoffmann, M. R. J. Phys.
Chem. C 2008, 112.
(27) Henglein, A.; Kormann, C. Int. J. Radiat. Biol. 1985, 48, 251.
(28) Fyrillas, M. M.; Szeri, A. J. J. Fluid Mech. 1996, 311, 361.
141
(29) Kim, I. K.; Jung, O. J. Bull. Korean Chem. Soc. 2001, 22, 1093.
(30) O'Shea, K. E.; Aguila, A.; Vinodgopal, K.; Kamat, P. V. Res. Chem. Intermed.
1998, 24, 695.
(31) Sostaric, J. Z.; Riesz, P. J. Am. Chem. Soc. 2001, 123, 11010.
(32) Sostaric, J. Z.; Riesz, P. J. Phys. Chem. B 2002, 106, 12537.
(33) Tronson, R.; Ashokkumar, M.; Grieser, F. J. Phys. Chem. B 2003, 107, 7307.
(34) Sunartio, D.; Ashokkumar, M.; Grieser, F. J. Am. Chem. Soc. 2007, 129, 6031.
(35) Lopez-Fontan, J. L.; Gonzalez-Perez, A.; Costa, J.; Ruso, J. M.; Prieto, G.;
Schulz, P. C.; Sarmiento, M. J. Colloid Interface Sci. 2006, 294, 458.
(36) Lopez-Fontan, J. L.; Sarmiento, F.; Schulz, P. C. Colloid Polym. Sci. 2005, 283,
862.
(37) Simister, E. A.; Lee, E. M.; Lu, J. R.; Thomas, R. K.; Ottewill, R. H.; Rennie, A.
R.; Penfold, J. J. Chem. Soc.—Faraday Trans. 1992, 88, 3033.
(38) Shinoda, K.; Hato, M.; Hayashi, T. J. Phys. Chem. 1972, 76, 909.
(39) Langmuir, I. J. Am. Chem. Soc. 1916, 38, 2221.
(40) Glockner, V.; Lunkwitz, K.; Prescher, D. Tenside Surf. Det. 1989, 26.
(41) Lines, D.; Sutcliffe, H. J. Fluor. Chem. 1984, 25, 505.
(42) Lazerte, J. D.; Hals, L. J.; Reid, T. S.; Smith, G. H. J. Am. Chem. Soc. 1953, 75,
4525.
(43) Hals, L. J.; Reid, T. S.; Smith, G. H. J. Am. Chem. Soc. 1951, 73, 4054.
(44) Krusic, P. J.; Marchione, A. A.; Roe, D. C. J. Fluor. Chem. 2005, 126, 1510.
(45) Krusic, P. J.; Roe, D. C. Anal. Chem. 2004, 76, 3800.
(46) Ashokkumar, M.; Hall, R.; Mulvaney, P.; Grieser, F. J. Phys. Chem. B 1997, 101,
10845.
142
(47) Lee, J.; Kentish, S. E.; Ashokkurnar, M. J. Phys. Chem. B 2005, 109, 5095.
(48) Ashokkumar, M.; Hodnett, M.; Zeqiri, B.; Grieser, F.; Price, G. J. J. Am. Chem.
Soc. 2007, 129, 2250.
(49) Price, G. J.; Ashokkumar, M.; Hodnett, M.; Zequiri, B.; Grieser, F. J. Phys.
Chem. B 2005, 109, 17799.
(50) Eller, A.; Flynn, H. G. J. Acoust. Soc. Am. 1965, 37, 493.
(51) Colussi, A. J.; Hung, H. M.; Hoffmann, M. R. J. Phys. Chem. A 1999, 103, 2696.
(52) Lunkenheimer, K.; Czichocki, G.; Hirte, R.; Barzyk, W. Colloid Surf. A—
Physicochem. Eng. Asp. 1995, 101, 187.
(53) Tuckermann, R. Atmos. Environ. 2007, 41, 6265.

143
Chapter 5
Reductive Defluorination of Aqueous
Perfluorinated Alkyl Surfactants: Effects of
Ionic Headgroup and Chain Length
Sections reprinted with permission from Park, H.; Vecitis, C. D.; Cheng, J.; Choi, W.;
Mader, B. T.; Hoffmann, M. R. Journal of Physical Chemistry A 2009, 113, 4, 690–696.
© 2009 American Chemical Society.
144
Abstract
Perfluorinated chemicals (PFCs) are distributed throughout the environment. In the case
of perfluorinated alkyl carboxylates and sulfonates, they can be classified as persistent
organic pollutants since they have relatively high water solubilities and are resistant to
oxidation. With this in mind, we report on the reductive defluorination of
perfluorobutanoate, PFBA (C3F7CO2-), perfluorohexanoate, PFHA (C5F11CO2
-),
perfluorooctanoate, PFOA (C7F15CO2-), perfluorobutane sulfonate, PFBS (C4F9SO3
-),
perfluorohexane sulfonate, PFHS (C6F13SO3-), and perfluorooctane sulfonate, PFOS
(C8F17SO3-), by aquated electrons, eaq
-, that are generated from the UV photolysis (λ =
254 nm) of iodide. The ionic headgroup (-SO3- vs. -CO2
-) has a significant effect on the
reduction kinetics and extent of defluorination (F-Index; -[F-]produced/[PFC]degraded).
Perfluoroalkylsulfonate reduction kinetics and the F-index increase linearly with
increasing chain length. In contrast, perfluoroalkylcarboxylate chain length appears to
have a negligible effect on the observed kinetics and the F-index. H/F ratios in the
gaseous fluoroorganic products are consistent with measured F-indexes. Incomplete
defluorination of the gaseous products suggests a reductive cleavage of the ionic
headgroup occurs before complete defluorination. Detailed mechanisms involving
initiation by aquated electrons are proposed.
145
Introduction
Fluorinated chemicals (FCs), such as fluorotelomer alcohols, partially fluorinated
amphiphiles, perfluoroalkyl carboxylates, and perfluoroalkylsulfonates, have been widely
used for water-proofing textiles, as protective coatings on metals, in aqueous film-
forming foams (AFFFs), in semi-conductor etching, and as lubricants. Atmospheric
oxidation1,2 and bio-transformation3,4 can convert partially fluorinated chemicals into
environmentally persistent perfluorochemicals (PFCs). For example, perfluorooctane
sulfonate (PFOS) and perfluorooctanoate (PFOA) have been detected globally in surface
waters5,6 due to atmospheric7 and oceanic transportation8.
Perfluorochemicals are chemically inert due to relatively high organic bond strengths
(e.g., 413.0 kJ/mol for F3C-CF3; 530.5 kJ/mol for F-C2F5)9 and fluorine’s
electronegativity making them resistant to conventional advanced oxidation processes
(AOPs)10–13. For example, hydroxyl radical (•OH) with a reduction potential of E° = 2.73
V14 reacts with a typical hydrocarbon octanoate with a second-order rate constant that is
>109 M-1s-1 15, however, the corresponding second-order rate constants, when the
compounds are perfluorinated, have an upper limit of < 105 M-1s-1 (e.g., PFOA and
PFOS)16. Direct electron transfer oxidation processes (e.g., S2O82-/UV13 and PW12O40
3-
/UV12) and aqueous pyrolysis (i.e., sonolysis)17,18 have shown to be more effective for
PFC remediation. Perfluorocarboxylate reaction rate constants with sulfate radical (SO4•-)
are estimated to be on the order of 104 M-1s-1 19,20. At this level, the reaction rate
constants are orders of magnitude lower than the sulfate radical constants with
hydrocarbons21.
146
Reductive remediation of perfluorocarboxylates and perfluorosulfonates is feasible22–
24. For example, PFOS and PFHS can be reduced by elemental iron (Fe(0), E = - 0.447
V)14 in water under extreme conditions (350 oC, 20 MPa)23,24. Aromatic25,26, benzylic27,
olefinic28,29, and tertiary30–32 fluoroorganics readily undergo reductive defluorination by
chemical and electrochemical methods. Studies on linear fluorochemicals containing only
secondary20 and primary33 C-F bonds are limited due to low (E < -2.7 V) reduction
potentials34,35. Reductive fluoride elimination is influenced by a number of chemical
properties, such as C-F bonding character (e.g., σ vs. π character)26, electron density36,
redox potential35, anion radical stability25, ionic head group16, –(CF2)n− chain length20,
and electron-donating reagent strength37. The activation energies of aqueous electron
reactions with halo-organics are invariable and small (6 to 30 kJ/mol) due to tunneling
effects38. However, fluoroorganic reduction rates are lower than other organohalogens
since fluorine has no low-lying vacant d-orbital to accept an electron. Low PFC water
solubility has limited most reductive defluorination studies to organic solvents39.
A systematic study on the reductive remediation of aqueous PFCs (C3F7CO2-,
C5F11CO2-, C7F15CO2
-, C4F9SO3-, C6F13SO3
-, and C8F17SO3-) has yet to be completed. We
here utilize the aquated electron (eaq−, E°aq/e = − 2.9 V), a powerful reductant, to
decompose a number of perfluoroalkyl carboxylates and perfluoroalkyl sulfonates of
varying chain (hydrophobic tail) length (e.g., C3 to C8). Aquated electrons are generated
from UV-photolysis of aqueous iodide solutions via charge-transfer-to-solvent (CTTS)
states40. The kinetics and mechanism of aqueous PFC reduction is significantly affected
by ionic headgroup speciation and fluorinated tail length.
Experimental Details

147
Perfluorooctanoate (PFOA: C7F15CO2NH4, 3M), perfluorohexanoate (PFHA:
C5F11CO2H, > 97%, Fluka), perfluorobutanoate (PFBA: C3F7CO2H, > 98%, Aldrich),
perfluorooctane sulfonate (PFOS: C8F17SO3K, 3M), perfluorohexane sulfonate (PFHS:
C6F13SO3K, > 98%, Fluka), and perfluorobutane sulfonate (PFBS: C4F9SO3K, 3M
Company) were used as received. PFC stock solutions were prepared to be 500 mg/L and
the pH was adjusted to between 6 and 8 with HCl or NH4OH. A 1 mol/L KI (Fisher)
aqueous stock solution was freshly prepared every week and stored in the dark.
PFC and KI stock solutions were diluted with Milli-Q water to 30 mL. Photolysis was
completed in a Pyrex glass reactor with a quartz window and irradiated with 254 nm light
source (UVP, 8 W). Argon or air was continuously purged through the aqueous solution
or through the headspace. A 0.5 mL sample aliquot was taken at different time points
during photolysis, and if necessary, diluted prior to analysis. The incident photon flux
was determined to be 5.17(±0.06) ×10-5 mol L-1 min-1 by iodide/iodate actinometry using
the intrinsic quantum yield of iodide/iodate as a reference38.
Initial PFC and possible aqueous-phase intermediate analysis was completed by
HPLC-MS (Agilent 1100 LC and Agilent Ion Trap) with a Betasil C18 column (Thermo-
Electron) of dimensions 2.1 mm ID, 100 mm length and 5 μm-particle size. A 2 mM
aqueous ammonium acetate:methanol gradient mobile phase at a flow rate of 0.3 mL min-
1 was used for separation. The samples were analyzed by the MS/MS (Agilent, MSD
Trap) in negative mode monitoring for the molecular ions of PFOS (m/z = 499), PFHS
(m/z = 399), and PFBS (m/z = 299), and decarboxylated ions of PFOA (m/z = 369),
PFHA (m/z = 269), and PFBA (m/z = 169). The nebulizer gas pressure was 40 PSI,
drying gas flow rate and temperature were 9 L min-1 and 325 ºC, the capillary voltage
148
was set at + 3500 V and the skimmer voltage was – 15 V. HPLC analytical procedures
are detailed elsewhere18.
Ion chromatography (Dionex DX-500) was used for the analysis of fluoride and other
ionic intermediates. 0.5 mL aliquots were transferred from the reactor to disposable
PolyVial sample vials (PolyVial) and sealed with filter caps (PolyVial) and loaded onto
an AS-40 autosampler. The 0.5 ml sample was injected and anions were separated on an
IonPac AS11-HC anion exchange column and quantified by conductivity measurement.
The gaseous fluorointermediates produced were analyzed by GC-MS. The reactor
headspace was continuously purged with argon. The purge gas containing the reaction
intermediates was circulated over a thermal desorption tube (CarboTrap, Supelco) to
adsorb the intermediates. After completion of the reaction, the purge gas was turned off
and the tubes were sealed to atmosphere. GC-MS analysis consisted of thermal
desorption of the intermediates from the tube (OI Analytical), and analysis of the
desorbed gases by GC-MS (Agilent 6890 GC and 5973 MSD).
Results and Discussion
Figure 5.1 shows the time course for the reductive decomposition of PFOS and PFOA
during the photolysis (λ = 254 nm) of an aqueous iodide solution in the presence of argon
and air ([PFOS]i = 0.20 μM, [PFOA]i = 0.24 μM, [I-]i = 10 mM). The quantum yield for
the generation of aquated electrons from iodide photolysis at 248 nm (eq. 5.1) is 28%39.
In the presence of air, PFOS and PFOA are degraded (Figure 5.1) due to the rapid
reaction (k3 = 1.9×10¹⁰ M-1 s-1)15 of the aquated electron with dissolved oxygen (~ 0.2
mM) (eq. 5.3).
(5.1) - -*CTTS aqI + I I + ehv •→ → -
149
(5.2) -aqe + I I• → -
-
2-
(5.3) -aq 2 2e + O O→
- -aqe + PFOX PFOX•→ (5.4)
However, in the presence of Ar (i.e., in the absence of air) PFOS and PFOA initial
decomposition (eq. 5.4, where X = S and A for sulfonate and carboxylate, respectively)
follows pseudo-first-order kinetics. Under these conditions, the rate of PFOS reduction is
two times greater than that of PFOA ( = 6.5 × 10kapp−PFOS -3 min-1; = 2.9 × 10kapp
−PFOA -3 min-1).
The relative photoreduction rates ( / ) are consistent with those observed in
pulse radiolysis
kapp−PFOS kapp
−PFOA
16 where and for reduction by aquated electrons are
reported to be 7.3 × 10
k4−PFOS k4
−PFOA
7 M-1 s-1 and 5.1 × 10⁷ M-1 s-1, respectively. A more recent laser
flash photolysis study20 reported = 1.7 × 10k4−PFOA 7 M-1 s-1.
The quantum yields for the photoreduction of PFOS and PFOA are 11.8 × 10⁻⁴ and
6.4 × 10⁻⁴, respectively. The relatively low quantum yields (~ 0.1%) indicate that there
are quenching reactions for aquated electrons. Photodetachment of an aquated electron
produces iodine atom (I•, eq. 5.1). I• complexes with a neighboring iodide forming the
diiodide radical anion ( , eq. 5,5’) with an equilibrium constant, K-2I 5 > 1.2 × 10⁴. The
complexation is diffusion controlled and [I-]ss >> [e-]ss such that >> and 5k 2k -2I /I• = 120.
The diffusion-controlled reaction (k6 = 3.2×10⁹ M-1 s-1) between two molecules (eq.
5.6) produces triiodide (I
-2I
3-) and I-.
(5.5, 5.5’) -2I + I I• ←⎯→ -
- (5.6) - - -2 2 3I + I I + I→
150
Aquated electron quenching may occur via I• carriers (eq. 5.7) or by way of hydrogen
production (eq. 5.8).
(5.7) - - - - -aq 2 3 2e + I /I I /I I• •→ + -
→
2-
(5.8) - + - +aq aq 2e + H H ; H + e + H H• •→
As shown in Figure 5.2a, the steady-state triiodide concentration, [I3-]ss, is almost
negligible in aqueous solutions without PFOX (i.e., in the absence of dissolved oxygen)
and increases to micromolar levels upon addition of PFOX, suggesting the I• carrier
quenching is the predominant mechanism. Minimal pH changes during the reactions
(Figure 5.2b) is consistent with I• carrier quenching. H•, intermediates in eq. 5.8, may
also be quenched by I• carriers. In particular in the absence of PFOX and oxygen, pH
rises up to 10–11 immediately after light irradiation, probably due to proton consumption
by eaq− (eq. 5.8). The PFOA photolysis also continuously increases the pH, whereas the
pH at the PFOS photolysis is decreased soon after initial increase. The bell-shaped pH
change is ascribed to the initial proton consumption and the post-release of fluoride ion
(i.e., pKa (HF) = 3.45). This indicates that the pH changes are primarily caused by the
fluoride production and could be used as an indicator of the defluorination.
Reaction of the initial perfluorinated alkyl carboxylate or sulfonate with eaq- yields the
corresponding radical anion (CnF2n+1X•2-; n = 8, X = SO3 for PFOS•2-; n = 7, X = CO2 for
PFOA•2-, eq. 5.4). The radical anion will quickly decompose via fluoride elimination27,41
to yield the perfluoroalkyl radical (CnF2nX•-, eq. 5.9).
(5.9) 2- - -n 2n+1 n 2nC F X C F X + F• •→
(5.10) - -n 2n aq n 2nC F X + e C F X• →
151
CnF2nX•- + I• hv
⎯ →⎯← ⎯⎯ CnF2nIX- (5.11, 5.11’)
(5.12) CnF2nIX− + eaq
- → CnF2nX•- + I-
(5.13) 2- - -n 2n n 2n-1C F X C F X + F→
(5.14) 2- + -n 2n 2 n 2nC F X + H /H O C F HX→
(5.15) -n 2n n 2nC F X + H C F HX• • → -
The electrophilic perfluoroalkyl radicals42–44 may react further with eaq- to yield
carbanions (CnF2nX2-, eq 10) or with I• carriers (i.e., I•, I2•-, I3
•-) to yield the
perfluoroalkyl iodide carboxylate or sulfonate (CnF2nIX-, eq. 5.11). The perfluoroalkyl
iodide carboxylates and sulfonates will be converted back to perfluoroalkyl radicals via
photolytic homolysis of the C-I bond (eq 5.11’) or via reaction with e-aq to yield the
radical and I- (eq. 5.12)45. In organic solvents, the carbanion intramolecularily
defluorinates to give an olefin (eq 5.13).27,35 However, in the presence of water, the
carbanion, which is a strong base, will be protonated. An overall H/F exchange may also
occur via reaction of a fluoroalkyl radical anion (CnF2nX•−) with an H• (eq. 5.15). If an
H/F exchange product retains the anionic carboxylate or sulfonate terminal group, it will
remain in the aqueous phase and proceed through sequential H/F exchanges. Subsequent
eaq- reductions with partially defluorinated intermediates (CnF2nIX-, CnF2n-1X- or CnF2nHX-)
should be faster than the initial defluorination step27.
A systematic study of perfluorochemical decomposition was completed by reducing
the shorter-chained PFCs (PFHS, PFBS, PFHA, and PFBA, where H = hexane and B =
butane) under the same photolytic conditions. Figure 5.3a and b show the time-dependent
reactions of all six PFCs with the aquated electron. The three perfluoroalkyl carboxylates
152
have similar pseudo-first-order degradation rates, k ≈ ≈ ≈ 1.3 × 10app−PFOA kapp
−PFHA kapp−PFBA -3
min-1 (Figure 5.3a), and the carboxylate kinetics are plotted on the sulfonate curve as a
dashed line for comparison (Figure 5.3b). In contrast, the perfluoroalkyl sulfonates
kinetics are dependent on chain length, k > > and the rate decreases
with decreasing chain length (3.0×10
app−PFOS kapp
−PFHS kapp−PFBS
-3, 1.2×10⁻³, and 4.0×10⁻⁴ min-1 for PFOS, PFHS,
and PFBS, respectively). Accordingly, quantum yields for the degradation of the
carboxylates are independent of chain length, i.e., PFBA (7.05×10⁻⁴) ≈ PFHA (6.94 × 10⁻⁴)
≈ PFOA (6.36 × 10⁻⁴), whereas those for the sulfonates are chain length dependent, i.e.,
PFOS (11.8 × 10⁻⁴) > PFHS (5.71 × 10⁻⁴) > PFBS (2.41 × 10⁻⁴) (Table 5.1).
The aqueous electron-mediated reduction of perfluorochemicals eventually eliminates
fluoride (F-) and thus fluoride measurements give insight into the overall mechanism and
extent of reduction. The time-dependent F- production during degradation of the
perfluorocarboxylates and the perfluorosulfonates are shown in Figures 5.4a and b,
respectively. Similar to the decomposition kinetics, the perfluorocarboxylate F-
production has no chain-length dependence ([F-] = 5 ~ 12 μM at 2.5 h-photolysis),
whereas the perfluorosulfonate F- production is dependent on chain length; F- production
decreases with decreasing chain length ([F-] = 58, 23, and 5 μM at 2.5 h-photolysis for
PFOS, PFHS, and PFBS, respectively). Alternatively, the F- yield can be evaluated using
the F-index (i.e., -[F-]produced/[PFC]degraded). F-indices for all PFCs are observed to grow
linearly over the course of the reaction. For the three carboxylates, the F-index is between
1 and 2, suggesting a reductive mechanism independent of chain length. For the
sulfonates, the F-index is related to the number of carbons in the hydrophobic tail, with
approximately one defluorination per carbon (i.e., 9, 6, and 3 for PFOS, PFHS, and PFBS,

153
respectively). In both cases, defluorination is incomplete, suggesting loss of partially
defluorinated species to the gas phase, which implies loss of the sulfonate or carboxylate
ionic headgroup prior to complete defluorination.
The data from Figures 5.3 and 5.4 has been compiled in Figure 5.5. , and the F-
index for all six PFCs are plotted as a function of fluorocarbon chain length. It appears
that the carboxylates have a similar degradation mechanism since both the kinetics and F-
indices show no chain-length dependence. Minimal defluorination suggests that the
carboxylate group is lost shortly after the initial reduction or simultaneously with the
reduction. In the case of hydrocarbon carboxylates,
kapp−PFC
46 the aquated electron-mediated
reduction occurs at the carbonyl group with subsequent loss of HO- and CO, yielding an
alkyl radical, or in this case a fluoroalkyl radical (RF•, eq. 5.16).
(5.16)
An initial defluorination may be required at the alpha carbon to the carbonyl to favor the
decarboxylation mechanism. A similar mechanism may be active for the desulfonation of
the perfluoroalkyl sulfonates. In contrast to the carboxylates, a larger number of reductive
defluorinations is required prior to loss of the ionic headgroup, suggesting initial
defluorination occurs at carbons away from the sulfonate group.
Gaseous intermediates produced during PFC reduction were trapped in thermal
desorption tubes and analyzed by GC-MS. A number of intermediates were identified,
which were composed of carbon, fluorine, hydrogen, and iodine (Figure 5.6 and Table
5.2). The perfluoroalkyl carboxylate gaseous intermediates were primarily composed of
C-F bonds, consistent with F-indices. The perfluoroalkyl sulfonate intermediates had a

154
greater degree of H/F exchange (i.e., degree of reduction), which is also consistent with
F-indices for these compounds. The agreement between H/F exchange and the F-index
suggests initial defluorination is primarily followed by protonation of the carbanion
intermediate (eq. 5.14) or perfluororadical reaction with H-atom (eq. 5.15), with minor
olefinization (eq. 5.13). It is of note that the reduction products of the perfluorinated
chemicals in aprotic solvents are primarily olefins. Also, the sulfonates have a larger
number of unique gaseous intermediates as compared to the carboxylates. For example,
PFOS has a more diverse set of intermediates ranging from C1 to C8 and 3 times the total
number of intermediates as PFOA (Table 5.2).
A large majority of the gases produced are iodinated and the noniodinated minority
generally contains an olefin. On average, a single I• is incorporated into a gaseous
fluorointermediate suggesting partitioning out of solution quickly follows neutral
fluororadical iodination. For example, the reaction of the fluoroalkyl radical (RF•)
produced in eq. 5.16 with I• results in a product that has a high tendency to partition into
the vapor phase (eq. 5.17).
(5.17) R F
• + I• carriers → R FI(aq) → R FI(g)
The absence of vapor-phase intermediates with higher degrees of iodination may be due
to subsequent photolytic cleavage or reduction of C-I bonds by aquated electron (eqs.
5.11’ and 5.12, respectively) formed from the aqueous fluoro-intermediates. It should be
noted that a C-I bond (bond strength, 209 kJ/mol) is weaker than a C-F bond (bond
strength, 460 kJ/mol). In addition, perfluorooctyl iodide (C8F17I) is observed as the
heaviest intermediate during PFOS photolysis, whereas perfluorohexyl iodide (C6F13I)—
not C7F15I— is detected during PFOA photolysis. This suggests the presence of a
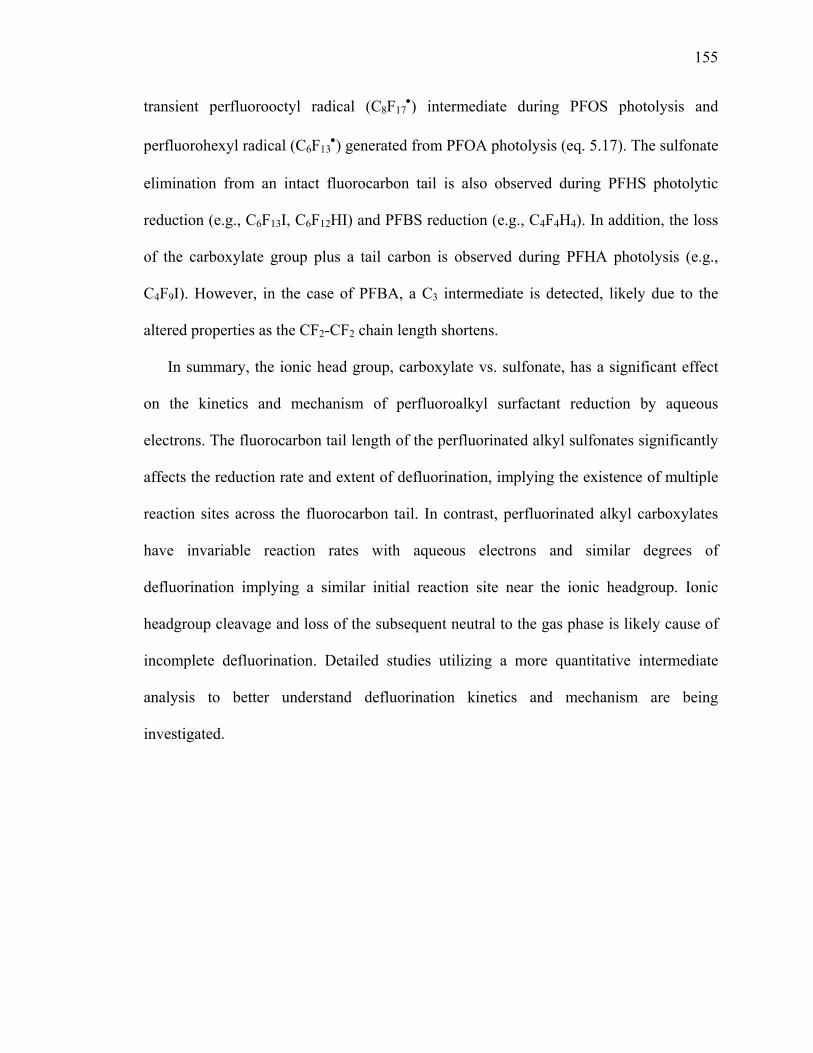
155
transient perfluorooctyl radical (C8F17•) intermediate during PFOS photolysis and
perfluorohexyl radical (C6F13•) generated from PFOA photolysis (eq. 5.17). The sulfonate
elimination from an intact fluorocarbon tail is also observed during PFHS photolytic
reduction (e.g., C6F13I, C6F12HI) and PFBS reduction (e.g., C4F4H4). In addition, the loss
of the carboxylate group plus a tail carbon is observed during PFHA photolysis (e.g.,
C4F9I). However, in the case of PFBA, a C3 intermediate is detected, likely due to the
altered properties as the CF2-CF2 chain length shortens.
In summary, the ionic head group, carboxylate vs. sulfonate, has a significant effect
on the kinetics and mechanism of perfluoroalkyl surfactant reduction by aqueous
electrons. The fluorocarbon tail length of the perfluorinated alkyl sulfonates significantly
affects the reduction rate and extent of defluorination, implying the existence of multiple
reaction sites across the fluorocarbon tail. In contrast, perfluorinated alkyl carboxylates
have invariable reaction rates with aqueous electrons and similar degrees of
defluorination implying a similar initial reaction site near the ionic headgroup. Ionic
headgroup cleavage and loss of the subsequent neutral to the gas phase is likely cause of
incomplete defluorination. Detailed studies utilizing a more quantitative intermediate
analysis to better understand defluorination kinetics and mechanism are being
investigated.
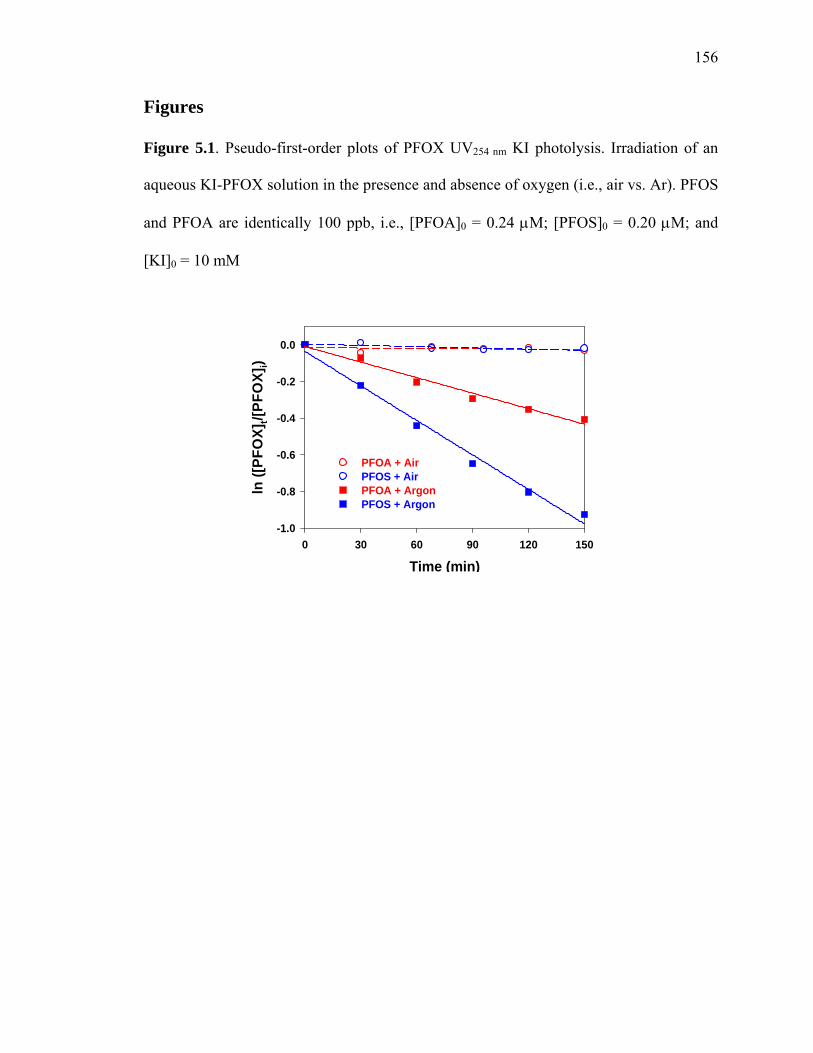
156
Figures Figure 5.1. Pseudo-first-order plots of PFOX UV254 nm KI photolysis. Irradiation of an
aqueous KI-PFOX solution in the presence and absence of oxygen (i.e., air vs. Ar). PFOS
and PFOA are identically 100 ppb, i.e., [PFOA]0 = 0.24 μM; [PFOS]0 = 0.20 μM; and
[KI]0 = 10 mM
Time (min)0 30 60 90 120 150
ln ([
PFO
X]t/[
PFO
X]i)
-1.0
-0.8
-0.6
-0.4
-0.2
0.0 PFOA + Air
PFOS + Air PFOA + Argon PFOS + Argon
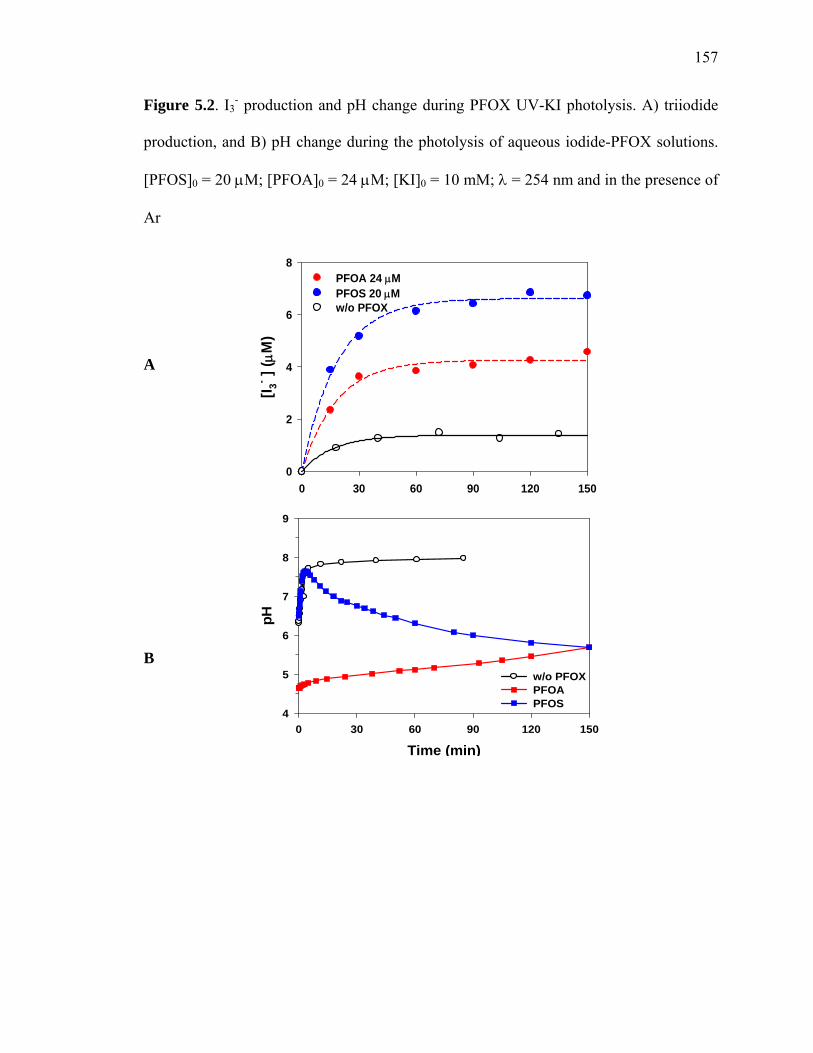
157
Figure 5.2. I3- production and pH change during PFOX UV-KI photolysis. A) triiodide
production, and B) pH change during the photolysis of aqueous iodide-PFOX solutions.
[PFOS]0 = 20 μM; [PFOA]0 = 24 μM; [KI]0 = 10 mM; λ = 254 nm and in the presence of
Ar
Time (min)0 30 60 90 120 150
[I 3- ] ( μ
M)
0
2
4
6
8PFOA 24 μMPFOS 20 μMw/o PFOX
A
Time (min)0 30 60 90 120 150
pH
4
5
6
7
8
9
w/o PFOXPFOAPFOS
B
158
Figure 5.3. PFXA and PFXS (X = O, H, B) degradation during UV-KI photolysis. λ =
254 nm irradiation of aqueous KI solution in the presence of Ar. All PFCs are identically
10 ppm, i.e., [PFOS]0 = 20 μM; [PFHS]0 = 25.1 μM; [PFBS]0 = 33.4 μM; [PFOA]0 = 24
μM; [PFHA]0 = 31.9 μM; [PFBA]0 = 46.0 μM; and [KI]0 = 10 mM
Time (min)0 30 60 90 120 150
[PFX
S]t/[
PFXS
] i
0.0
0.2
0.4
0.6
0.8
1.0
PFOSPFHSPFBSPFOA (for comparison)
0.0
0.2
0.4
0.6
0.8
1.0
[PFX
A] t/[
PFXA
] i
PFBAPFHAPFOA
0 30 60 90 120 150
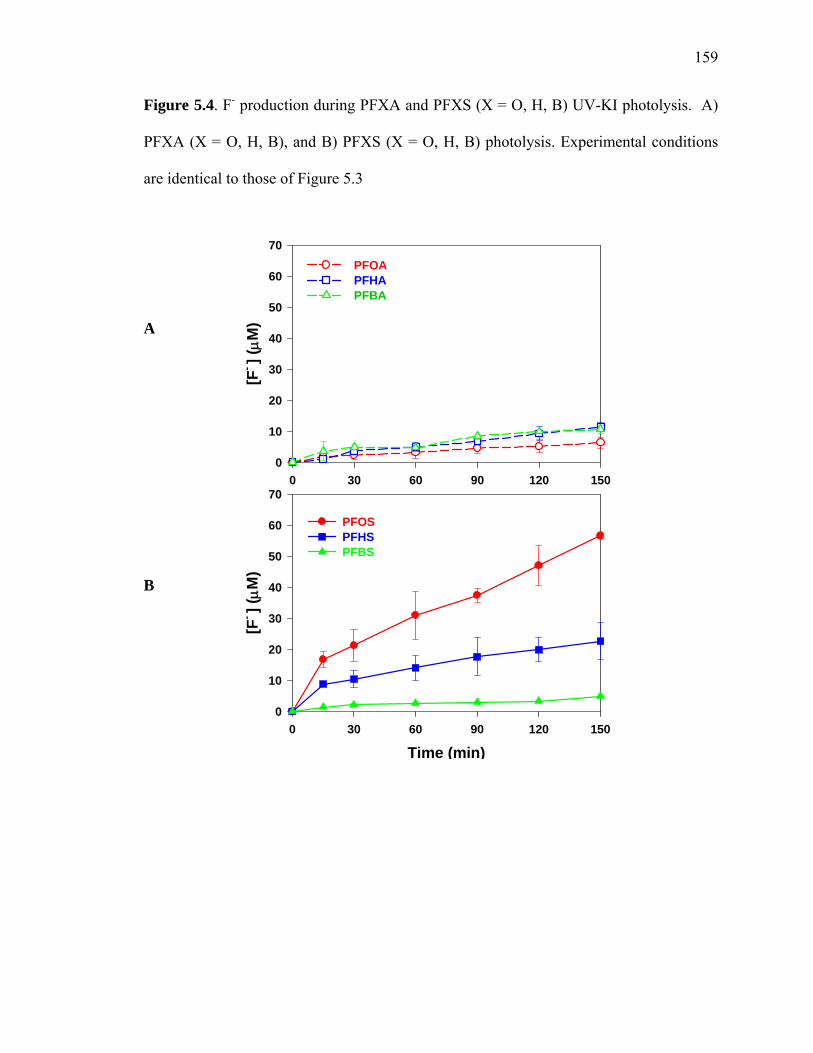
159
Figure 5.4. F- production during PFXA and PFXS (X = O, H, B) UV-KI photolysis. A)
PFXA (X = O, H, B), and B) PFXS (X = O, H, B) photolysis. Experimental conditions
are identical to those of Figure 5.3
Time (min)0 30 60 90 120 150
[F- ] (
μM)
0
10
20
30
40
50
60
70
0
10
20
30
40
50
60
70
A
B
PFOSPFHSPFBS
PFOAPFHA PFBA
[F- ] (
μM)
0 30 60 90 120 150

160
Figure 5.5. Effects of chain length on FC UV-KI degradation rates and F-index.
Experimental conditions are identical to those of Figure 5.3
Fluorocarbon Number2 3 4 5 6 7 8 9
-kap
p (m
in-1
)
0.0
5.0e-4
1.0e-3
1.5e-3
2.0e-3
2.5e-3
3.0e-3
3.5e-3
F-In
dex
0
2
4
6
8
10Carboxylate (k)Sulfonate (k)Carboxylate (F)Sulfonate (F)
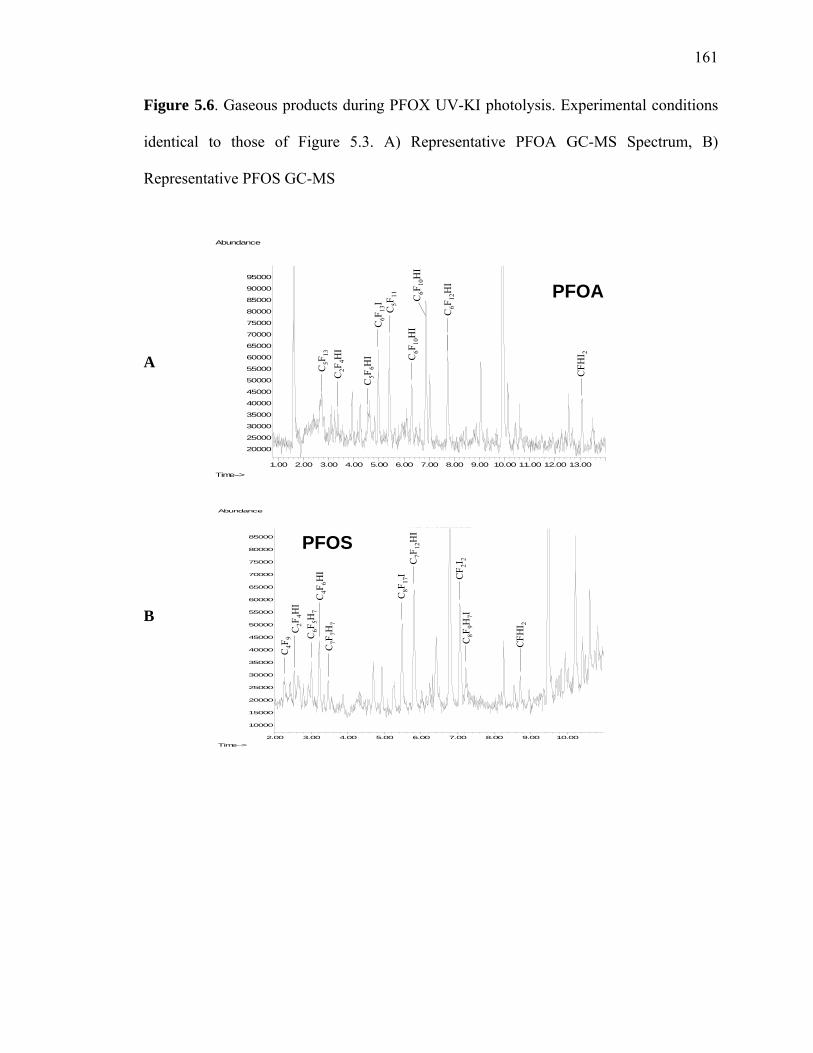
161
Figure 5.6. Gaseous products during PFOX UV-KI photolysis. Experimental conditions
identical to those of Figure 5.3. A) Representative PFOA GC-MS Spectrum, B)
Representative PFOS GC-MS
2.00 3.00 4.00 5.00 6.00 7.00 8.00 9.00 10.00
10000
15000
20000
25000
30000
35000
40000
45000
50000
55000
60000
65000
70000
75000
80000
85000
Time-->
Abundance
TIC: 07092801.D
C4F
9C
2F4H
IC
6F5H
7C
4F6H
IC
7F7H
7
C7F
12H
IC
8F17
I CF 2I
2C
8F9H
7I
CFH
I 2
PFOS
1.00 2.00 3.00 4.00 5.00 6.00 7.00 8.00 9.00 10.00 11.00 12.00 13.00
20000
25000
30000
35000
40000
45000
50000
55000
60000
65000
70000
75000
80000
85000
90000
95000
Time-->
Abundance
TIC: 07100200.D
C6F
10H
IC6F
13I
C6F
12H
I
C6F
10H
I
C5F
13
C5F
6HI
CFH
I 2
C5F
11
C2F
4HI
PFOA
A
B
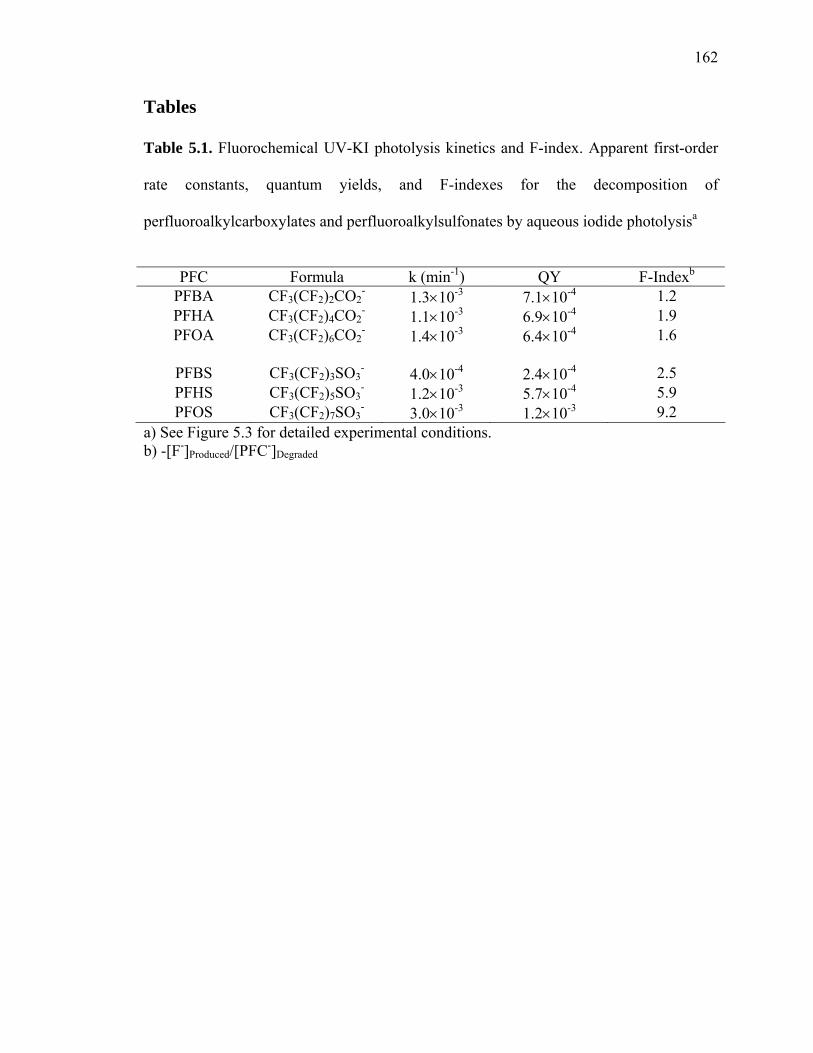
162
Tables Table 5.1. Fluorochemical UV-KI photolysis kinetics and F-index. Apparent first-order
rate constants, quantum yields, and F-indexes for the decomposition of
perfluoroalkylcarboxylates and perfluoroalkylsulfonates by aqueous iodide photolysisa
PFC Formula k (min-1) QY F-Indexb
PFBA CF3(CF2)2CO2- 1.3×10⁻³ 7.1×10⁻⁴ 1.2
PFHA CF3(CF2)4CO2- 1.1×10⁻³ 6.9×10⁻⁴ 1.9
PFOA CF3(CF2)6CO2- 1.4×10⁻³ 6.4×10⁻⁴ 1.6
PFBS CF3(CF2)3SO3
- 4.0×10⁻⁴ 2.4×10⁻⁴ 2.5 PFHS CF3(CF2)5SO3
- 1.2×10⁻³ 5.7×10⁻⁴ 5.9 PFOS CF3(CF2)7SO3
- 3.0×10⁻³ 1.2×10⁻³ 9.2 a) See Figure 5.3 for detailed experimental conditions. b) -[F-]Produced/[PFC-]Degraded
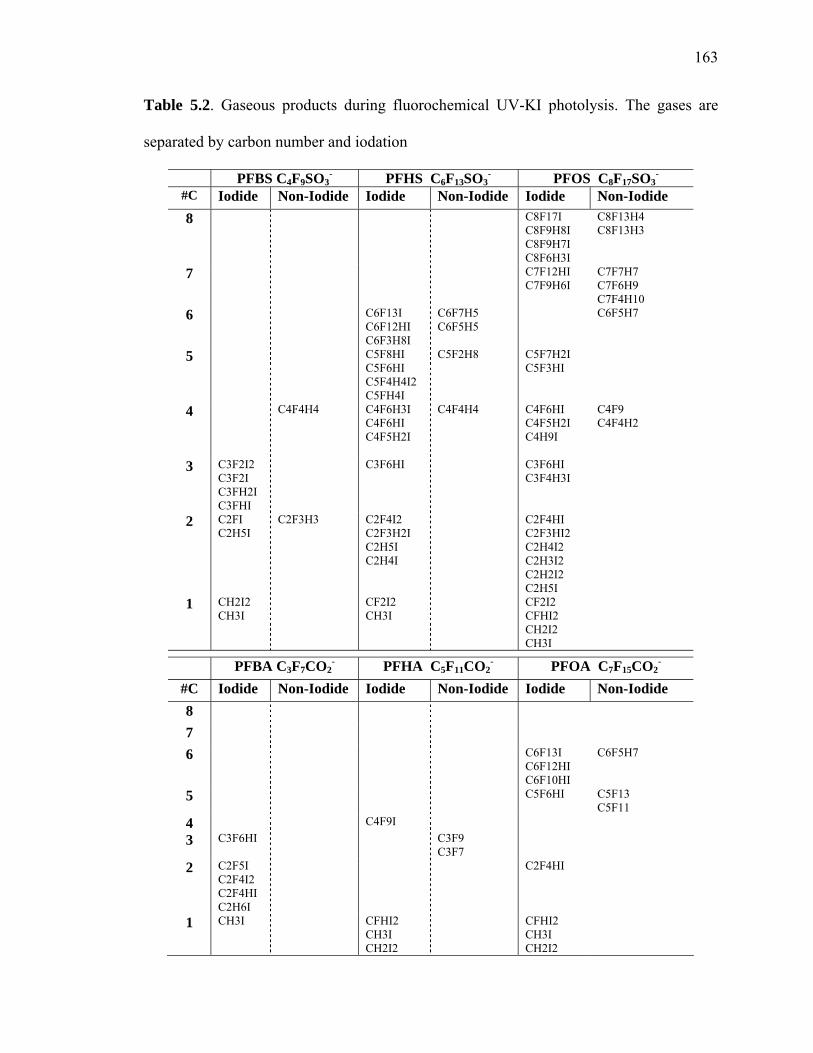
163
Table 5.2. Gaseous products during fluorochemical UV-KI photolysis. The gases are
separated by carbon number and iodation
PFBS C4F9SO3- PFHS C6F13SO3
- PFOS C8F17SO3-
#C Iodide Non-Iodide Iodide Non-Iodide Iodide Non-Iodide 8 C8F17I
C8F9H8I C8F9H7I C8F6H3I
C8F13H4 C8F13H3
7 C7F12HI C7F9H6I
C7F7H7 C7F6H9 C7F4H10
6 C6F13I C6F12HI C6F3H8I
C6F7H5 C6F5H5
C6F5H7
5 C5F8HI C5F6HI C5F4H4I2 C5FH4I
C5F2H8 C5F7H2I C5F3HI
4 C4F4H4 C4F6H3I C4F6HI
C4F4H4
C4F6HI
C4F5H2I
C4F5H2I C4H9I
C4F9 C4F4H2
3 C3F2I2 C3F2I C3FH2I C3FHI
C3F6HI C3F6HI C3F4H3I
2 C2FI C2H5I
C2F3H3
C2F4I2 C2F3H2I C2H5I
C2F4HI
C2H4I
C2F3HI2 C2H4I2 C2H3I2 C2H2I2 C2H5I
1 CH2I2 CH3I
CF2I2 CF2I2 CFHI2 CH2I2
CH3I
CH3I
PFBA C3F7CO2- PFHA C5F11CO2
- PFOA C7F15CO2-
#C Iodide Non-Iodide Iodide Non-Iodide Iodide Non-Iodide 8
7
6 C6F13I C6F12HI C6F10HI
C6F5H7
5 C5F6HI C5F13 C5F11
4 C4F9I 3 C3F6HI C3F9
C3F7
2 C2F5I C2F4I2 C2F4HI C2H6I
C2F4HI
1 CH3I CFHI2 CFHI2 CH3I CH3I CH2I2 CH2I2
164
References (1) D'Eon, J. C.; Hurley, M. D.; Wallington, T. J.; Mabury, S. A. Environ. Sci.
Technol. 2006, 40, 1862.
(2) Martin, J. W.; Ellis, D. A.; Mabury, S. A.; Hurley, M. D.; Wallington, T. J.
Environ. Sci. Technol. 2006, 40, 864.
(3) Xu, L.; Krenitsky, D. M.; Seacat, A. M.; Butenhoff, J. L.; Anders, M. W. Chem.
Res. Toxicol. 2004, 17, 767.
(4) Tomy, G. T.; Tittlemier, S. A.; Palace, V. P.; Budakowski, W. R.; Braekevelt, E.;
Brinkworth, L.; Friesen, K. Environ. Sci. Technol. 2004, 38, 758.
(5) Scott, B. F.; Moody, C. A.; Spencer, C.; Small, J. M.; Muir, D. C. G.; Mabury, S.
A. Environ. Sci. Technol. 2006, 40, 6405.
(6) Skutlarek, D.; Exner, M.; Farber, H. Environ. Sci. Pollut. Res. 2006, 13, 299.
(7) Shoeib, M.; Harner, T.; Vlahos, P. Environ. Sci. Technol. 2006, 40, 7577.
(8) Yamashita, N.; Kannan, K.; Taniyasu, S.; Horii, Y.; Petrick, G.; Gamo, T. Mar.
Pollut. Bull. 2005, 51, 658.
(9) The Science of Organic Fluorochemistry. Office of Pollution Prevention and
Toxics; Docket AR226-0547; U.S. Environmental Protection Agency: Washington, D.C.,
1999; p. 12.
(10) Schroder, H. F.; Meesters, R. J. W. J. Chromatogr. A 2005, 1082, 110.
(11) Dillert, R.; Bahnemann, D.; Hidaka, H. Chemosphere 2007, 67, 785.
(12) Hori, H.; Hayakawa, E.; Einaga, H.; Kutsuna, S.; Koike, K.; Ibusuki, T.;
Kiatagawa, H.; Arakawa, R. Environ. Sci. Technol. 2004, 38, 6118.
165
(13) Hori, H.; Yamamoto, A.; Hayakawa, E.; Taniyasu, S.; Yamashita, N.; Kutsuna, S.
Environ. Sci. Technol. 2005, 39, 2383.
(14) Wardman, P. J. Phys. Chem. Ref. Data 1989, 18, 1637.
(15) Buxton, G. V.; Greenstock, C. L.; Helman, W. P.; Ross, A. B. J. Phys. Chem. Ref.
Data 1988, 17, 513.
(16) Szajdzinska-Pietek, E.; Gebicki, J. L. Res. Chem. Intermed. 2000, 26, 897.
(17) Moriwaki, H.; Takagi, Y.; Tanaka, M.; Tsuruho, K.; Okitsu, K.; Maeda, Y.
Environ. Sci. Technol. 2005, 39, 3388.
(18) Vecitis, C. D.; Park, H.; Cheng, J.; Mader, B. T.; Hoffmann, M. R. J. Phys. Chem.
A 2008, 112, 4261.
(19) Kutsuna, S.; Hori, H. Int. J. Chem. Kinet. 2007, 39, 276.
(20) Huang, L.; Dong, W. B.; Hou, H. Q. Chem. Phys. Lett. 2007, 436, 124.
(21) Neta, P.; Huie, R. E.; Ross, A. B. J. Phys. Chem. Ref. Data 1988, 17, 1027.
(22) Yamamoto, T.; Noma, Y.; Sakai, S. I.; Shibata, Y. Environ. Sci. Technol. 2007,
41, 5660.
(23) Hori, H.; Nagaoka, Y.; Yamamoto, A.; Sano, T.; Yamashita, N.; Taniyasu, S.;
Kutsuna, S.; Osaka, I.; Arakawa, R. Environ. Sci. Technol. 2006, 40, 1049.
(24) Hori, H.; Nagaoka, Y.; Sano, T.; Kutsuna, S. Chemosphere 2008, 70, 800.
(25) Shoute, L. C. T.; Mittal, J. P.; Neta, P. J. Phys. Chem. 1996, 100, 3016.
(26) Shoute, L. C. T.; Mittal, J. P.; Neta, P. J. Phys. Chem. 1996, 100, 11355.
(27) Combellas, C.; Kanoufi, F.; Thiebault, A. J. Phys. Chem. B 2003, 107, 10894.
(28) Corvaja, C.; Farnia, G.; Formenton, G.; Navarrini, W.; Sandona, G.; Tortelli, V.
Journal of Physical Chemistry 1994, 98, 2307.
166
(29) Watson, P. L.; Tulip, T. H.; Williams, I. Organometallics 1990, 9, 1999.
(30) Burdeniuc, J.; Chupka, W.; Crabtree, R. H. J. Am. Chem. Soc. 1995, 117, 10119.
(31) Macnicol, D. D.; Robertson, C. D. Nature 1988, 332, 59.
(32) Scherer, K. V.; Ono, T.; Yamanouchi, K.; Fernandez, R.; Henderson, P.;
Goldwhite, H. J. Am. Chem. Soc. 1985, 107, 718.
(33) Anbar, M.; Hart, E. J. J. Phys. Chem. 1965, 69, 271.
(34) Pud, A. A.; Shapoval, G. S.; Kukhar, V. P.; Mikulina, O. E.; Gervits, L. L.
Electrochim. Acta 1995, 40, 1157.
(35) Marsella, J. A.; Gilicinski, A. G.; Coughlin, A. M.; Pez, G. P. J. Org. Chem. 1992,
57, 2856.
(36) Chen, X. D.; Lemal, D. M. J. Fluor. Chem. 2006, 127, 1158.
(37) Ono, T.; Fukaya, H.; Hayashi, E.; Saida, H.; Abe, T.; Henderson, P. B.; Fernandez,
R. E.; Scherer, K. V. J. Fluor. Chem. 1999, 97, 173.
(38) Rahn, R. O.; Stephan, M. I.; Bolton, J. R.; Goren, E.; Shaw, P.-S.; Lykke, K. R.
Photochem. Photobiol. 2003, 78, 146.
(39) Sauer, M. C.; Crowell, R. A.; Shkrob, I. A. J. Phys. Chem. A 2004, 108, 5490.
(40) Lehr, L.; Zanni, M. T.; Frischkorn, C.; Weinkauf, R.; Neumark, D. M. Science
1999, 284, 635.
(41) Andrieux, C. P.; Combellas, C.; Kanoufi, F.; Saveant, J. M.; Thiebault, A. J. Am.
Chem. Soc. 1997, 119, 9527.
(42) Avila, D. V.; Ingold, K. U.; Lusztyk, J.; Dolbier, W. R.; Pan, H. Q. J. Am. Chem.
Soc. 1993, 115, 1577.
167
(43) Avila, D. V.; Ingold, K. U.; Lusztyk, J.; Dolbier, W. R.; Pan, H. Q.; Muir, M. J.
Am. Chem. Soc. 1994, 116, 99.
(44) Zhang, L.; Dolbier, W. R.; Sheeller, B.; Ingold, K. U. J. Am. Chem. Soc. 2002,
124, 6362.
(45) Dolbier, W. R. Chem. Rev. 1996, 96, 1557.
(46) Hart, E. J.; Anbar, M. The Hydrated Electron; Wiley-Interscience: New York,
1970.
168
Chapter 6
Mass Spectrometric Detection of Oxidation
Products and Intermediates of Aqueous
Aerosol Iodide and/or Thiosulfate Reaction
with Gaseous Ozone
Sections reprinted with permission from Enami, S.; Vecitis, C. D.; Cheng, J.; Hoffmann,
M. R.; Colussi, A. J. Journal of Physical Chemical A 2007, 111, 50, 13032–13037.
© 2007 American Chemical Society
169
Abstract
The intermediates ISO3- (m/z = 207) and IS2O3
- (m/z = 239) generated in aqueous
(NaI/Na2S2O3) microdroplets traversing dilute O3 gas plumes are detected via online
electrospray mass spectrometry within ~ 1 ms, and their stabilities gauged by
collisionally induced dissociation. The simultaneous detection of anionic reactants and
the S2O62-, HSO4
-, IO3-, and I3
- products, as a function of experimental conditions,
provides evidence for air-water interfacial reactions, as compared to strictly bulk aqueous
reactions. For example, O3(aq) reacts ~ 3 times faster with I- than with S2O32- in bulk
solution; only S2O32- is significantly depleted in the interfacial layers of [I-]/[S2O3
2-] = 10
microdroplets below [O3(g)] ~ 50 ppm. This suggests that either interfacial kinetics are
at variance with bulk aqueous kinetics and/or I- mediates that ozone oxidation of S2O32-.
170
Introduction
Atmospheric aerosols absorb and scatter solar radiation1 and mediate important
chemical processes2, , ,3 4 5. For example, atmospheric SO2 and NOx can be oxidized in the
gas-phase, but acid rain results from their faster processing in aqueous aerosol
droplets6, , .7 8 However, the analysis of gas-aerosol reaction mechanisms and kinetics is
assumed to follow concepts derived from studies performed in bulk aqueous solution9,10.
However, the possibility of unique reaction mechanisms and enhanced chemical kinetics
of air-water interfacial reactions, as well as the reduced water activity in atmospheric
aerosol particles, should prevent the simple extrapolation of bulk data to the aerosol
phase. The minimal examination of reactions specific to the air-water interface is a result
of the technical difficulties associated with producing radially small aerosol particles
under atmospherically relevant conditions in the laboratory and probing their chemical
transformations while suspended in reactive atmospheres. Most studies, with a few
exceptions11, ,12 13, have monitored the uptake of reactive gases by stationary trains of
~10– 100 μm droplets14 that would have exceedingly large settling velocities (~1 km
day-1), short residence times (i.e., negligible number densities in the atmosphere), and
relatively low surface-area-to-volume ratios15.
Here, we report experiments in which the chemical composition of aqueous droplets (r
= 0.5 to 3.0 microns) undergoing chemical reaction with a reactive gas is directly
monitored by electrospray mass spectrometry (ES-MS) in ~ 1–10 ms time frames. The
fast oxidations of I-(aq) and S2O32-(aq) by O3(g), which proceed at nearly diffusionally
controlled rates in bulk solution16, are studied by spraying droplets across O3/air gas
plumes. We detect and quantify anion reactants and products, as well as the previously

171
postulated short-lived reaction intermediates ISO3- and IS2O3
-. Our results show that this
technique is capable of tracking chemical reactions in the condensed phase during fast
aerosol-gas reactions. ES-MS has been previously used for online monitoring of thermal,
electrochemical and photochemical reactions17, , , , , , , , , , ,18 19 20 21 22 23 24 25 26 27 28.
Experimental
The experimental setup is shown in Figures 6.1a and b. Aqueous solutions were
pumped (50 μL min-1) into the reaction chamber through a grounded stainless steel
needle injector (~ 50 μM radius bore)29and pneumatically sprayed by means of coaxially
flowing nebulizer gas. The difference between the exit velocities of the liquid jet (10.6
cm s-1) and nebulizer gas (2.65 × 104 cm s-1) is so large that the drag imposed on the
liquid breaks it apart into micrometer size droplets. The terminal velocities of the
microdroplets produced are ~ 102–103 cm s-1,30 which lead to transit times around 1 to 10
ms across the ~ 0.5 cm wide ozone plume. The droplets are produced by fragmentation
of electrically neutral solutions from a grounded injector, and are charged via statistical
fluctuations that scale with (drop size)-1/2 31. The ensemble of spray droplets is on average
neutral, but individual droplets carry charges that follow a Gaussian distribution, as
expected for a random process. For example, this phenomenon is the basis of the classical
oil drop experiment performed by Millikan to determine the magnitude of the elementary
charge32 and leads to the charge of sea-sprayed aerosols. The finer sea water aerosol
droplets, which will remain airborne the longest after generation during bubble bursting,
are reported to be negatively charged33. It should be emphasized that charge separation
during pneumatic nebulization of liquids does not produce highly charged droplets (10 to
100 charges per droplet vs. 10,000 charges per droplet) such as those created during
172
electrospray ionization using high-field nozzles34. The spray droplets eventually contract
through solvent evaporation, a process regulated by ambient temperature and relative
humidity, thereby increasing electrostatic repulsion among excess surface charges. In
highly charged droplets, Coulomb explosions may occur, producing a distribution of
smaller, charged droplets. Once charged droplets near radii on the nm scale, ion
evaporation may occur, yielding hydrated, gas-phase ions35. Similar events will proceed
in both sea-sprayed marine aerosols as they rise into the dry atmosphere, and our spray
chamber as the droplets are electrostatically extracted into a high-temperature,
high-flow-rate, dry-nitrogen gas stream. The drying events will generate smaller aerosols
and eventually gas-phase ions whose chemical distribution is enriched in tensio- or
surface active species. Thus, the ESMS technique effectively samples the interfacial
layers of droplets.
Ozone was generated by flowing ultrapure O2(g) (0.1 L/min, Air Liquide) through a
commercial ozonizer (Ozone Solution), diluted tenfold with ultrapure N2(g) (0.9 L/min)
and quantified by UV absorption spectrophotometry (HP 8452) at 250 and 300 nm
[absorption cross-sections σ(250 nm) = 1.1 x 10⁻¹⁷, σ(300 nm) = 3.9 x 10⁻¹⁹ cm2
molecule-1 at 298 K]36 prior to entering the reaction chamber. In the text, the reported
[O3(g)] values, which correspond to the concentrations actually sensed by droplets in the
reaction chamber, are estimated to be ~ 10 times smaller than the values determined from
UV absorbances due to further dilution by the N2 drying gas (Fig. 6.1a, 10 L/min). Gas
flows were regulated by calibrated mass flow controllers (MKS). Typical instrumental
parameters were as follows: drying gas temperature, 340 oC; Nebulizer pressure, 28 psi;
collector capillary voltage, +3.5 kV; fragmentor voltage, 22 V. Solutions were prepared

173
with MilliQ water that had been previously purged with ultrapure N2(g) for at least 30
min. NaI (> 99 %), Na2SO3 (> 98 %) and Na2S2O3 (> 99.999 %) were obtained from
Sigma-Aldrich. Solution pH was measured with a calibrated pH meter (VWR, SB21).
Results and Discussion
We have recently shown that I- is rapidly oxidized to I3- and IO3
- by O3(g) at ppm
levels in this experimental setup37. Thiosulfate is expected to react with O3(g) at similar
rates38. Since I2/I3- also react rapidly with S2O3
2-, it should be possible to observe the
transient intermediates I2S2O32- and IS2O3
- proposed by Raschig a century ago to account
for their slow conversion into tetrathionate (see also Table 6.1)39, , , , . 40 41 42 43
I2 + I- → ← I3
- (6.1, 6.1’)
I2 + S2O32- → ← I2S2O3
2- (6.2, 6.2’)
I3- + S2O3
2- → ← I2S2O3
2- + I- (6.3, 6.3’)
I2S2O32- → ← IS2O3
- + I- (6.4, 6.4’)
IS2O3- + S2O3
2- → I- + S4O62- (6.5)
A similar mechanism has been proposed for the I2/I3- + HSO3
-/SO32- reaction, which
proceeds via the ISO3- intermediate44, , , .45 46 47 The absorption spectra assigned by Packer
and Anderson to the I2S2O32- and IS2O3
- intermediates detected in their pulse radiolysis
experiments48, were found to be blue-shifted relative to those of I3- and I2.
Identification of anion products and intermediates
Figure 6.2 shows the mass spectra of aqueous Na2S2O3 microdroplets in the absence
and presence of O3(g). Signals at m/z = 112, 135, and 293, which are ascribed to S2O3.-,
NaS2O3-, and Na3(S2O3)2
-, respectively, are observed in the absence of O3(g). We detect
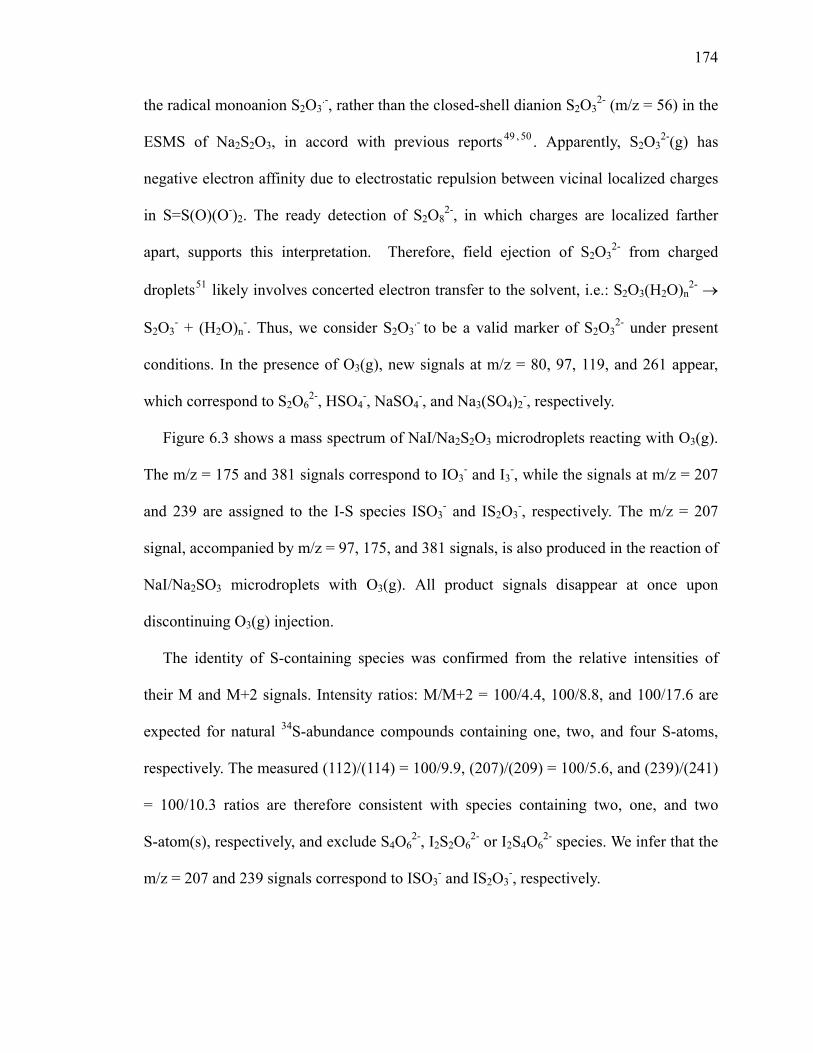
174
the radical monoanion S2O3.-, rather than the closed-shell dianion S2O3
2- (m/z = 56) in the
ESMS of Na2S2O3, in accord with previous reports49 , 50 . Apparently, S2O32-(g) has
negative electron affinity due to electrostatic repulsion between vicinal localized charges
in S=S(O)(O-)2. The ready detection of S2O82-, in which charges are localized farther
apart, supports this interpretation. Therefore, field ejection of S2O32- from charged
droplets51 likely involves concerted electron transfer to the solvent, i.e.: S2O3(H2O)n2- →
S2O3- + (H2O)n
-. Thus, we consider S2O3.- to be a valid marker of S2O3
2- under present
conditions. In the presence of O3(g), new signals at m/z = 80, 97, 119, and 261 appear,
which correspond to S2O62-, HSO4
-, NaSO4-, and Na3(SO4)2
-, respectively.
Figure 6.3 shows a mass spectrum of NaI/Na2S2O3 microdroplets reacting with O3(g).
The m/z = 175 and 381 signals correspond to IO3- and I3
-, while the signals at m/z = 207
and 239 are assigned to the I-S species ISO3- and IS2O3
-, respectively. The m/z = 207
signal, accompanied by m/z = 97, 175, and 381 signals, is also produced in the reaction of
NaI/Na2SO3 microdroplets with O3(g). All product signals disappear at once upon
discontinuing O3(g) injection.
The identity of S-containing species was confirmed from the relative intensities of
their M and M+2 signals. Intensity ratios: M/M+2 = 100/4.4, 100/8.8, and 100/17.6 are
expected for natural 34S-abundance compounds containing one, two, and four S-atoms,
respectively. The measured (112)/(114) = 100/9.9, (207)/(209) = 100/5.6, and (239)/(241)
= 100/10.3 ratios are therefore consistent with species containing two, one, and two
S-atom(s), respectively, and exclude S4O62-, I2S2O6
2- or I2S4O62- species. We infer that the
m/z = 207 and 239 signals correspond to ISO3- and IS2O3
-, respectively.

175
Reaction Mechanism
Further information is gained by studying the dependence of signal intensities on
[O3(g)]. Reactant anion signal intensities at m/z = 112 (S2O3-), 127 (I-) and 135 (NaS2O3
-)
decline with increasing [O3(g)], as shown in Figure 6.4a. Product and intermediate anion
signal intensities at m/z = 80 (S2O62-), 97 (HSO4
-), 119 (NaSO4-), 175 (IO3
-), 381 (I3-),
207 (ISO3-), and 239 (IS2O3
-) are all enhanced upon increasing [O3(g)], as shown in
Figure 6.4b and c. Note the upward inflections observed at ~ 50 ppm O3(g) in Figures
6.4b and c.
Figure 6.5 shows a plot of the [HSO4-]/[S2O6
2-] ratio as function of [O3(g)]. A
nonvanishing value below ~ 50 ppm O3(g) is a direct indication that S2O62- and HSO4
- are
primary species produced in competing pathways, eqs. 6.10a and b in Table 6.152. The
marked increase of this ratio at higher [O3(g)], however, shows that further HSO4- is
produced in the oxidation of reactive byproducts. This interpretation is confirmed by the
inertness of 0.1 mM S2O62- toward O3, together with the lack of HSO4
- (m/z = 97)
production below 420 ppm O3(g). Neither does a 0.25 mM S4O62- solution, prepared by
titration of 0.5 mM S2O32- with I3
-:53
I3- + 2S2O3
2- → 3I- + S4O62- (6.6)
and subsequently sprayed in the reaction chamber, react with O3(g). The m/z = 112
(S4O62-) and 97 (HSO4
-) signal intensities remain constant below 520 ppm O3(g).
Figure 6.6 shows how ISO3-, IS2O3
-, HSO4-, and IO3
- signal intensities vary with
[O3(g)], and indicates that HSO4-, IO3
-, ISO3-, and IS2O3
- are later generation species
whose rates of formation have a stronger, direct dependence on [O3(g)] than those of
S2O62- and I3
-.
176
We recently found that in this setup the oxidation of I- by O3(g) yields iodate, IO3-, and
triiodide, I3- (R12-14)29. I3
- is in equilibrium with I- and I254,55, ,56 57 (R1). I3
- and/or I2
3
can
then react with HSO - or S2 3O 2- 28,32according to reactions R2-R3 and R7-R8 . The fact
that we do not observe I2 3SO 2- (m/z = 167) or I2 2 3S O 2- (m/z = 183) in NaI/Na2 3
2 2 3 3
SO or
NaI/Na S O droplets in contact with O (g) implies that their decomposition lifetimes are
much shorter than ~ 1 to 10 ms under present conditions (eqs. 6.4’ and 6.9); in accord
with Margerum et al.32 I2 2 3S O 2- is thermodynamically stable (k2 -2 2/k = K = 3.2 x 10⁷ -1 M ),
but kinetically reactive (k4 -4 4
2 2 3
/k = K = 0.245 M). The dissociation equilibrium constant of
I S O 2-, K4 3 = 0.245 M, is ~ 100 times larger than that of I -, k-1 1/k = 1.39 x 10⁻³ M.58 Our
results do not exclude, however, the participation of hypoiodous acid, HOI, which is
considered to be more reactive than I2 3 or I - as oxidant.
HOI + S2O32- + H+ → IS2O3
- + H2O (6.15)
The dependence of IS2O3- (m/z = 239) signal intensity in 30 μM Na2S2O3 droplets as a
function of [NaI] in the range of 1–300 μM, at constant [O3(g)] = 300 ppm, is shown in
Figure 6.7a. The observed exponential growth to a maximum is qualitatively consistent
with the proposed mechanism of formation. Figure 6.7b shows the dependence of IS2O3-
(m/z = 239) signal intensity in 30 μM NaI droplets as a function of [Na2S2O3] in the range
of 1–300 μM, at constant [O3(g)] = 350 ppm. In contrast with the behavior observed in
Figure 6.7a, IS2O3- peaks at [Na2S2O3] ~ 100 μM. This response implies that S2O3
2-
participates both in the formation and destruction of IS2O3-, and is consistent with the
increasing role of eq. 6.5 at higher [Na2S2O3]32. From the reported value of k5 = 1.29 x
106 M-1 s-1, we estimate that the half-life of IS2O3- in eq. 6.5 is ~ 5 ms at [Na2S2O3] ~ 100
μM, which provides a direct measure of our temporal window. The rapid hydrolysis of
177
ISO3-, eq. 6.16, regenerates I-,44 and may be responsible for the results shown in Figure
6.8a.
Interfacial Reaction Kinetics
Figure 6.8 shows the dependence of [I-] and [S2O32-] vs. [O3(g)] in three different
solutions: [NaI]0 = [Na2S2O3]0 = 30 μM (a), [NaI]0 = 10 × [Na2S2O3]0 = 300 μM (b), and
[Na2S2O3]0 = 10 × [NaI]0 = 300 μM (c). S2O32- undergoes significant oxidation in all
cases over the entire [O3(g)] range covered in these experiments. In contrast, I- oxidation
begins above [O3(g)] ~ 50 ppm in the a and b mixtures, and is fully inhibited in c. Since
O3(aq) reacts ~ 3 times faster with I- than with S2O32- in the bulk (see Table 6.1) these
observations imply that the interfacial layers of the droplets are predominantly populated
by S2O32- and/or that reactivities at the air-water interface are significantly different than
in the bulk. Considering that the ratio of signal intensities, I(S2O3.-)/I(I-) = 1.2 ± 0.1, in
equimolar Na2S2O3/NaI solutions is a direct measure of the relative affinities of S2O32-
and I- for the interfacial layers of microdroplets, we must conclude that their relative
reactivities toward O3(g) are indeed reversed relative to the bulk. Note that decrease of I-
at [O3(g)] ≥ 50 ppm in Figure 6.8a coincides with the onset of the IS2O3- and ISO3
- in
Figure 6.4c, supporting the proposed involvement of the products of I- oxidation in their
mechanism of formation.
Intermediate Stability
We probed the thermal stability of the ISO3-, IS2O3
-, and I3- in the gas-phase via
collisional-induced dissociation experiments, in which the variation of ion signal
intensities were recorded as function of fragmentor voltage (FV). FV is the electrical
potential difference between the capillary exit and the first skimmer, a region where ions

178
are accelerated up to excess kinetic energies given by: KE = FE × qi = ½ mi vi2 (qi is the
charge, mi the mass, and vi the excess velocity of ion i, respectively). Molecular ions
convert their excess KE into internal (vibrational/rotational) excitation during impact
with (N2) bath gas molecules prior to undergoing collisionally induced dissociation
(CID)59. Figure 6.9a shows the dependence of m/z = 127 (I-), 207 (ISO3-), 239 (IS2O3
-)
and 381 (I3-) signal intensities on FV. The monotonous increase of the I- signal reveals
that ion collection efficiencies generally increase with FV. The maxima observed in the
case of ISO3-, IS2O3
-, and I3- indicates, therefore, the onset of fragmentation. Curve
deconvolution into two sigmoids, followed by the conversion of laboratory (KE) to
center-of-mass (CEM) kinetic energies—CEM = m/(m + M) KE, where m = 28 is the
molecular mass of the N2 collider gas and M = 207, 239, or 381, the molecular masses of
the various anions—leads to the fragmentation curves shown in Figure 6.9b. Threshold
CEM energies are consistent with the reported values for BDE(I-−I2) = 1.31 eV60, and
BDE(I-−SO3) = 1.67 eV61. The fact that IS2O3- and ISO3
- have similar stabilities in the
gas-phase suggests the presence of weak I-S bonds in both species32.
179
Figures
Figure 6.1. Diagram of electrospray and overall reactor setup. A) Schematic diagram of
electrospraying chamber and O3(g) injection system. B) An overview of the experimental
setup. MFC stands for mass flow controller
Heated N2 drying gas
O3/O2/N2
Solution from syringe pump
Teflon Tube
Stainless steel Nebulizer
To MS7.5 mm
7.5 mm
3.5 kV-+
A
ESMS
System
UV-VIS
MFC
MFC
OzonizerO2
N 2
Teflon Tube
Teflon Tube
Teflon Tube
B

180
Figure 6.2. ESI-MS of aqueous Na2S2O3 and gaseous O3 reaction products. (100 μM
Na2S2O3, pH 6.2) droplets in the presence of 640 ppm O3(g) (), and in its absence ().
A) m/z = 112 (S2O3-); B) 135 (NaS2O3
-); C) 293 [Na3(S2O3)2-]; P) 80 (S2O6
2-); Q) 97
(HSO4-); R) 119 (NaSO4
-); S) 261 [Na3(SO4)2-]
Figure 6.3. ESI-MS of aqueous Na2S2O3-NaI droplets and gaseous O3 reaction products.
(100 μM Na2S2O3 + 100 μM NaI, pH 6.2) microdroplets in the presence of 760 ppm
O3(g) (), and in its absence (). D) m/z = 127 (I-); E) 277 (NaI2-); U) 159 (IO2
-), V) 175
(IO3-); W) 381 (I3
-); X) 207 (ISO3-); Y) 239 (IS2O3
-); Z) 255 (IS2O4-)
m/z
50 100 150 200 250 300 350 400
No
rma
lize
d s
ign
al in
ten
sit
y
0
20
40
60
80
100
P
Q
RS
A
BC
m/z
100 150 200 250 300 350 400
No
rma
lize
d s
ign
al in
ten
sit
y
0
20
40
60
80
100
D
E
U V
X
Y
Z
W

181
Figure 6.4. Na2S2O3-NaI(aq,drop) and O3(g) reaction products vs. [O3(g)]. (100 μM Na2S2O3
+ 100 μM NaI, pH 6.2) A) ESMS signal intensities at m/z = 112 (S2O3-, ), 127 (I-, ),
and 135 (NaS2O3-, ) vs. [O3(g)]. B) ESMS signal intensities at m/z = 80 (S2O6
2-, Δ), 97
(HSO4-, ), 175 (IO3
-, ), and 381 (I3-, ) vs. [O3(g)]. C)ESMS signal intensities at m/z =
207 (ISO3-, ◊), 239 (IS2O3
-, ♦) vs. [O3(g)]
[O3] / ppm
1 10 100 1000
Sig
nal in
ten
sit
y / 1
05 c
ou
nts
s-1
0.0
0.1
0.2
0.3
0.4
A
[O3] / ppm
1 10 100 1000
Sig
na
l in
ten
sit
y / 1
05 c
ou
nts
s-1
0.0
0.1
0.2
B
[O3] / ppm
1 10 100 1000
Sig
na
l in
ten
sit
y / 1
05 c
ou
nts
s-1
0.0
0.2
0.4
0.6
0.8
1.0
C
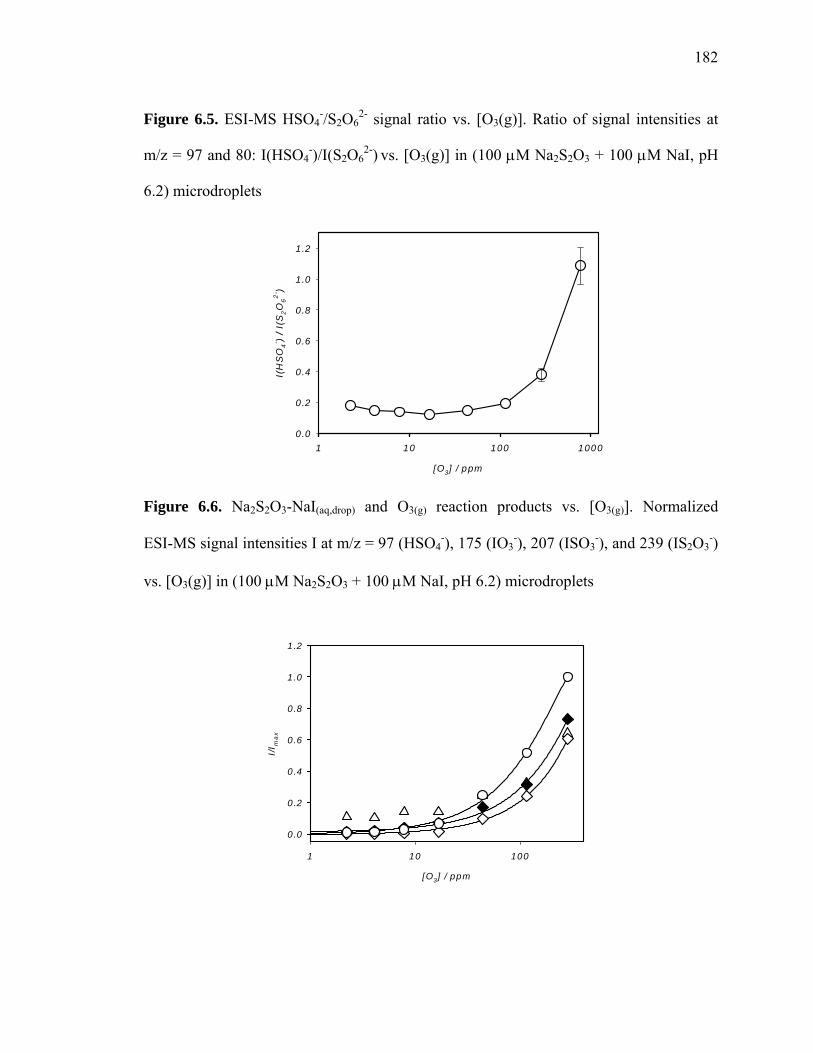
182
Figure 6.5. ESI-MS HSO4-/S2O6
2- signal ratio vs. [O3(g)]. Ratio of signal intensities at
m/z = 97 and 80: I(HSO4-)/I(S2O6
2-) vs. [O3(g)] in (100 μM Na2S2O3 + 100 μM NaI, pH
6.2) microdroplets
[O3] / ppm
1 10 100 1000
I(H
SO
4- )
/ I(
S2O
62
- )
0.0
0.2
0.4
0.6
0.8
1.0
1.2
Figure 6.6. Na2S2O3-NaI(aq,drop) and O3(g) reaction products vs. [O3(g)]. Normalized
ESI-MS signal intensities I at m/z = 97 (HSO4-), 175 (IO3
-), 207 (ISO3-), and 239 (IS2O3
-)
vs. [O3(g)] in (100 μM Na2S2O3 + 100 μM NaI, pH 6.2) microdroplets
[O3] / ppm
1 10 100
I/I m
ax
0.0
0.2
0.4
0.6
0.8
1.0
1.2

183
Figure 6.7. IS2O3- signal intensities vs. [Na2S2O3] and [NaI]. A) [Na2S2O3]0 in (Na2S2O3
+ 30 μM NaI, pH 6.2) microdroplets at [O3(g)] = 350 ppm, and B) [NaI]0 in (30 μM
Na2S2O3 + NaI, pH 6.2) microdroplets at [O3(g)] = 300 ppm
[I-] / μM
0 50 100 150 200 250 300
Sig
nal in
ten
sit
y / 1
05 c
ou
nts
s-1
0.0
0.5
1.0
1.5
2.0
[S2O32-] / μM
0 50 100 150 200 250 300
Sig
na
l in
ten
sit
y / 1
05 c
ou
nts
s-1
0.0
0.2
0.4
0.6
0.8
1.0
A
B
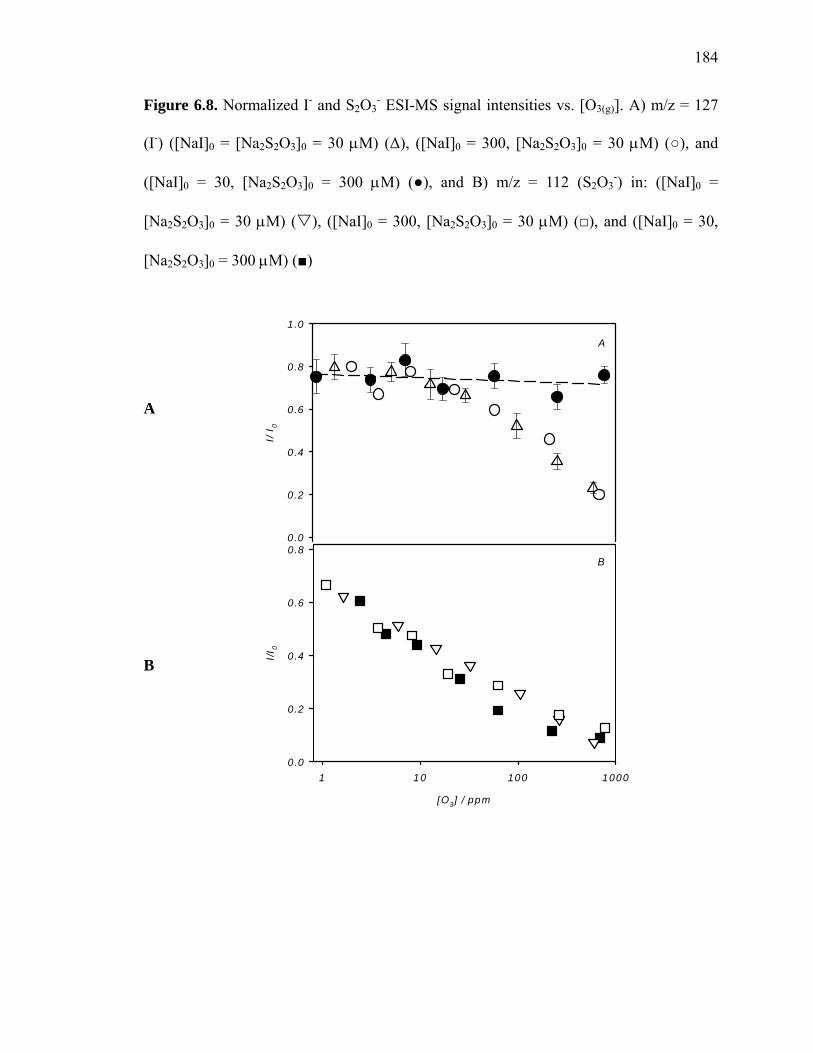
184
Figure 6.8. Normalized I- and S2O3- ESI-MS signal intensities vs. [O3(g)]. A) m/z = 127
(I-) ([NaI]0 = [Na2S2O3]0 = 30 μM) (Δ), ([NaI]0 = 300, [Na2S2O3]0 = 30 μM) (), and
([NaI]0 = 30, [Na2S2O3]0 = 300 μM) (), and B) m/z = 112 (S2O3-) in: ([NaI]0 =
[Na2S2O3]0 = 30 μM) ( ), ([NaI]0 = 300, [Na2S2O3]0 = 30 μM) (), and ([NaI]0 = 30,
[Na2S2O3]0 = 300 μM) ()
[O3] / ppm
1 10 100 1000
I/I 0
0.0
0.2
0.4
0.6
0.8
I/ I
0
0.0
0.2
0.4
0.6
0.8
1.0
A
B
A
B
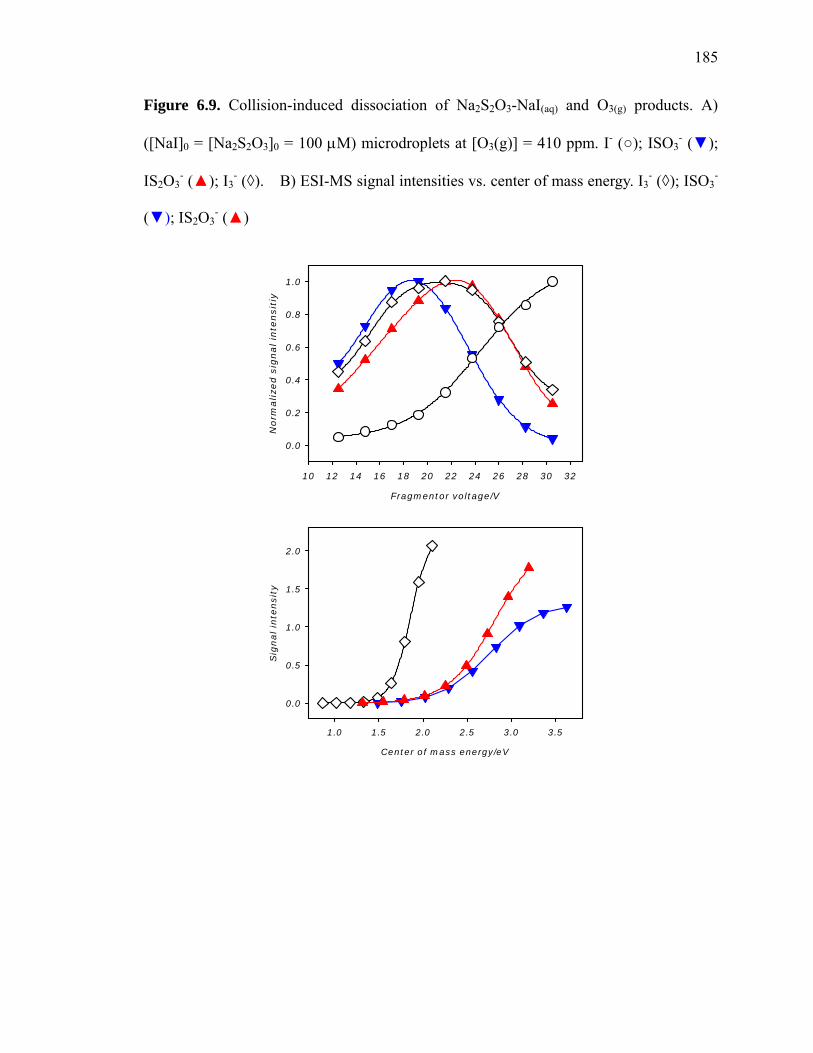
185
Figure 6.9. Collision-induced dissociation of Na2S2O3-NaI(aq) and O3(g) products. A)
([NaI]0 = [Na2S2O3]0 = 100 μM) microdroplets at [O3(g)] = 410 ppm. I- (); ISO3- ();
IS2O3- (); I3
- (◊). B) ESI-MS signal intensities vs. center of mass energy. I3- (◊); ISO3
-
(); IS2O3- ()
A
B
Fragmentor voltage/V
10 12 14 16 18 20 22 24 26 28 30 32
No
rma
lize
d s
ign
al in
ten
sit
iy
0.0
0.2
0.4
0.6
0.8
1.0
Center of mass energy/eV
1.0 1.5 2.0 2.5 3.0 3.5
Sig
na
l in
ten
sit
y
0.0
0.5
1.0
1.5
2.0

186
Tables
Table 6.1. Kinetic data for Na2S2O3-NaI(aq) and O3(g) reactions at 298 K
eq# Reaction Rate or equilibrium
constants (M, s units)Ref.
6.1 I2 + I- → ← I3
- 721 M-1 566.2 6.2’ I2 + S2O3
2- → ← I2S2O3
2- 7.8 × 10⁹ M-1 s-1
2.5 × 10² s-141
6.3 6.3’ I3
- + S2O32- → ← I2S2O3
2- + I- 4.2 × 10⁸ M-1 s-1
9.5 × 10³ s-141
6.4 6.4’ I2S2O3
2- → ← IS2O3
- + I- 0.245 M 41
6.5 IS2O3- + S2O3
2- → I- + S4O62- 1.3 × 10⁶ M-1 s-1 41
6.6 I3- + 2S2O3
2- → 3I- + S4O62-
N/A 41
6.7 I2 + HSO3- → I2SO3
2- + H+1.7 × 10⁹ M-1 s-1
6.8 I3- + HSO3
- → I- + I2SO32- + H+
1.5 × 10⁷ M-1 s-1 44
6.9 I2SO32- → ISO3
- + I-N/A 44
6.10a 6.10b
S2O32- + O3 → S2O6
2-
→ SO42- + SO2
3.7 × 10⁸ M-1 s-1
38
6.11 SO2 + H2O → ← HSO3
- + H+1.3 x 10⁻² M
62
6.12 I- + O3 + H+ → HOI + O2 1.2 × 10⁹ M-1 s-1 166.13 HOI + 2O3→ IO3
- + 2O2 + H+ 3.6 × 10⁴ M-1 s-1 636.14 HOI + I- + H+ → I2 + H2O 4.4 × 10¹² M-2 s-1 646.15 HOI + S2O3
2- + H+ → IS2O3- + H2O N/A
6.16 ISO3-+ H2O → I- + SO4
2- + 2H+ 298 s-1 44
187
References
(1) Satheesh, S. K.; Moorthy, K. K. Atmos. Environ. 2005, 39, 2089.
(2) Herrmann, H.; Chem. Rev. 2003, 103, 4691.
(3) Reid, J. P.; Sayer, R. M. Chem. Soc. Rev. 2003, 32, 70.
(4) Nissenson, P.; Knox, C. J. H.; Finlayson-Pitts, B. J.; Phillips, L. F.; Dabdub, D.
Phys. Chem Chem. Phys. 2006, 8, 4700.
(5) Pilinis, C.; Pandis, S. N.; Seinfeld, J. H. J. Geophys. Res. 1995, 100, 18739.
(6) Hoffmann, M. R.; Edwards, J. J. Phys. Chem. 1975, 79,2096.
(7) Mcardle, J. V.; Hoffmann, M. R. J. Phys. Chem. 1983, 87, 5425.
(8) Hoffmann, M. R. Atmos. Environ. 1986, 20, 1145.
(9) Hunt, S. W.; Roeselova, M.; Wang, W.; Wingen, L. M.; Knipping, E. M.; Tobias,
D. J.; Dabdub, D.; Finlayson-Pitts, B. J. J. Phys. Chem. A, 2004, 102, 11559.
(10) Hu, J. H.; Shi, Q.; Davidovitz, P.; Worsnop, D. R.; Zahniser, M. S.; Kolb, C. E., J.
Phys.Chem. 1995, 99, 8768.
(11) Schütze, M.; Herrmann, H. Phys. Chem. Chem. Phys. 2006, 4, 60.
(12) Tolocka, M. P.; Saul, T. D.; Johnston, M. V. J. Phys. Chem. A 2004, 108, 2659.
(13) González-Labrada, E.; Schmidt, R.; DeWolf, E. Chem.Comm. 2006, 23, 2471.
(14) Davidovits, P.; Kolb, C. E.; Williams, L. R.: Jayne, J. T.; T Worsnop, D. R. Chem.
Rev. 2006, 106, 1323.
(15) Finlayson-Pitts, B. J.; Pitts, J.N. Chemistry of the upper and lower atmosphere,
Academic Press: San Diego, California, 2000; p. 364.
(16) Liu, Q.; Schurter, L. M.; Muller, C. E.; Aloisio, S.; Francisco, J. D.; Margerum,
D.W. Inorg. Chem. 2001, 40, 4436.
188
(17) Espenson, H. E.; Tan, H.; Mollah, S.; Houk, R. S.; Eager, M. D. Inorg. Chem.
1998, 37, 4621.
(18) Bakhtiar, R.; Hop, C. E. C. A. J. Phys. Org. Chem. 1999, 12, 511.
(19) Arakawa R.; Liu, J.; Mizuno, K.; Inoue, H.; Doe H.; Matsuo, T. Int. J. Mass
Spectrom. 1997, 160, 371. B. Arakawa, R.; Tachiyashiki, S.; Matsuo, T. Anal. Chem.
1995, 67, 4133. C. Arakawa, R.; Mimura, S.; Mastsubayashi, G.; Matsuo, T. Inorg. Chem.
1996, 35, 5725. D. Arakawa, R.; Matsuda, F.; Mastsubayashi, G. Am. Soc. Mass
Spectrom. 1997, 8, 713 .
(20) Aliprantis, A. O.; Canary, J. W. J. Am. Chem. Soc. 1994, 116, 6985.
(21) Brum, J.; Dell’Orco, P.; Lapka, S.; Muske, K.; Sisko, J. Rapid Commun. Mass
Spectrom. 2001, 15, 1548.
(22) Zechel, D. L.; Konermann, L.; Withers, S. G.; Douglas, D. J. Biochemistry
1998, 37, 7664.
(23) Xu, X.; Lu, W.; Cole, R. B. Anal. Chem. 1996, 68, 4244.
(24) Brum, J.; Dell’Orco, P. Rapid Commun. Mass Spectrom. 1998, 12, 741.
(25) Volmer, D. A. J. Chromatogr. A 1998, 794, 129.
(26) Santos, L. S.; Knaack, L.; Metzger, J. O. Int. J. Mass. Spec. 2005, 246, 84.
(27) Ding, W.; Johnson, K. A.; Kutal, C.; Amster, I. J. Anal. Chem. 2003, 75, 4624.
(28) Thomas, M. C.; Mitchell, T. W.; Blanksby, S. J. J. Am. Chem. Soc. 2005, 128, 58.
(29) Cheng. J.; Vecitis, C. D.; Hoffmann, M. R.; Colussi, A. J. J. Phys. Chem. B. 2006,
110, 25598.
(30) Kahen, K.; Jorabchi, K.; Gray, C.; Montaser, A. Anal. Chem. 2004, 76, 7194.
(31) Dodd, E. E. J. Appl. Phys. 1953, 24, 73.

189
(32) Millikan, R. A. Science 1910, 32, 436.
(33) Reiter, R. J. Geophys. Res. 1994, 99, 10807.
(34) Fenn, J. B. J. Am. Soc. Mass Spectrom. 1993, 4, 524.
(35) Kebarle, P. J. Mass Spectrom. 2000, 35, 804.
(36) Sander, S. P., et al. Chemical Kinetics and Photochemical Data for Use in
Stratospheric Modeling, Evaluation 15; Jet Propulsion Laboratory: Pasadena, CA, 2006.
(37) Enami, S.; Vecitis, C. D.; Cheng. J.; Hoffmann, M. R.; Colussi, A. J. J. Phys.
Chem. A, 2007, 111, 50, 13032.
(38) Muller, B.; Heal, M. R., Phys. Chem. Chem. Phys. 2002, 4, 3365.
(39) Raschig, F. Chem. Ztg. 1908, 32, 1203.
(40) Raschig, F. Ber. Dtsch. Chem. Ges. 1915, 48, 2088.
(41) Scheper, W. M.; Margerum, D. W. Inorg. Chem. 1992, 31, 5466.
(42) Dodd, G.; Griffith, R. O. Trans. Faraday. Soc. 1949, 45, 546.
(43) Awtrey, A.; Connick, R. E. J. Am. Chem. Soc. 1951, 73, 1341.
(44) Yiin B. S.; Margerum, D. W. Inorg. Chem. 1990, 29, 1559.
(45) Landolt, H. Ber. Dtsch. Chem. Ges. 1886, 19, 1317.
(46) Bunau, G.V.; Eigen, M. Z. Physik. Chem. (Frankfurt) 1962, 32, 27.
(47) Inoue, H.; Sudo, Y. Kogyo Kagaku Zasshi 1967, 70, 123.
(48) Packer, J. E.; Anderson, R. F. Aust. J. Chem. 1997, 50, 435.
(49) Stewart, I. I.; Barnett, D. A.; Horlick, G. J. Anal. Atom. Spec. 1996, 11, 877.
(50) Agnes, G. R.; Stewart, I. I.; Horlick, G. Appl. Spec. 1994, 48, 1347.
(51) Kebarle, P. J. Mass Spectrom. 2000, 35, 804.
(52) Gmelins Handbuch der anorganischen Chemie, Schwefel, Teil B, Lieferung 2;

190
Verlag: Weinheim; 1960, p. 896, and references therein.
(53) Harris, W. E.; Daniel, C. Quantitative Chemical Analysis, 3rd ed.; Freeman: New
York, 1991.
(54) Myers, O. E. J. Chem. Phys. 1958, 28, 1027.
(55) Ramette, R. W.; Sandford, Jr., R. W. 1965, 87, 5001.
(56) McIndoe, J. S.; Tuck, D. G. Dalton Trans. 2003, 2, 244.
(57) Troy, R. C.; Kelly, M. D.; Nagy, J. C.; Margerum, D. W. Inorg. Chem. 1991, 30,
4838.
(58) Ramette, R. W.; Sandford, R. W. J. Am. Chem. Soc. 1965, 87, 5001.
(59) Schneider B. B.; Chen. D. Y. Anal. Chem. 2000, 72, 791.
(60) Nizzi, K. E., Pommerening, C. A., Sunderlin, L. S., J. Phys. Chem. A, 1998, 102,
7674.
(61) Hao, C., Gilbert, T. M., Sunderlin, L. S., Can. J. Chem. 2005, 83, 2013
(62) Sillén, G. H.; Martell, A. E. Stability Constants of Metal-Ion Complexes, Special
Publication 17; Chemical Society: London, 1964.
(63) Bichsel, Y.; von Gunten, U.; Environ. Sci. Technol. 1999, 33, 4040.
(64) Eigen, M.; Kustin, K. J. Am. Chem. Soc. 1962, 84, 1355.
191
Chapter 7
Mass Spectrometric Detection of Ozonation
Products and Intermediates of Aqueous
Aerosol Iodide and/or Sulfite: Implications
for Interfacial Kinetics and Iodide-Mediated
Sulfite Oxidation
Sections reprinted as rights of author from Enami, S.; Vecitis, C. D.; Cheng, J.; Hoffmann,
M. R.; Colussi, A. J. Chemical Physics Letters. 2008, 455, 316–320.
© 2008 Elselvier
192
Abstract
The oxidations of sulfite and iodide in the interfacial layers of aqueous droplets
exposed for ~ 1 to 10 ms to O3(g) are investigated by online mass spectrometry of
electrostatically ejected anions. S(IV) oxidation losses in Na2SO3 microdroplets are
proportional to [S(IV)] [O3(g)] up to ~ 90% conversion. In contrast, although I- is more
abundant than HSO3- in the interfacial layers of equimolar (Na2SO3 + NaI) microdroplets
and ~ 3 times more reactive than HSO3- toward O3(aq) in bulk solution, it is converted
with minimal loss to I3- and IO3
-, plus a persistent ISO3- intermediate. These observations
reveal unanticipated interfacial gradients, reactivity patterns, and transport phenomena
that had not been taken into account in previous treatments of fast gas-liquid reactions
and may be of importance for gas-aerosol reactions in the Marine Boundary Layer.
193
Introduction
The number density, size, and optical and chemical properties of atmospheric aerosols
significantly impact the Earth’s climate1. Aerosols absorb/scatter solar radiation2, but
also support key chemical processes 3 , ,4 5 . For example, SO2(g) is a pervasive
anthropogenic contaminant, which largely partitions into aqueous aerosol droplets6,7,
where it is assumed to be rapidly oxidized by the sparingly water-soluble O3(g)8 in a
process that mediates tropospheric sulfur chemistry9, ,10 11. The oxidation of SO2 by O3
has been thoroughly investigated in bulk water12,13 and aqueous sulfuric acid14, ,15 16.
Since SO32- is far more reactive than HSO3
- [pKa(HSO3-) = 6.30]17, overall reaction rates
markedly increase above pH ~ 6.
Gas-liquid reactions have been previously investigated by monitoring the uptake of
reactive gases by stationary trains of ~ 10–100 μm droplets at relatively low pressures (~
10–50 Torr)18 or on coated-wall Knudsen flow reactors19, and the results interpreted on
the basis of continuous models parametrized with kinetic and transport data in bulk
fluids20 . However, there is now firm evidence that air/liquid interfaces are unique
reaction media. Enhanced reactivity18, 21 , selective anion enrichment 22 , and higher
acidity23 , have been predicted for these interfaces. These predictions remain to be
thoroughly evaluated24. Recently we reported experiments in which the composition of
the interfaces of aqueous halide microdroplets undergoing chemical reaction with O3(g)
was monitored by mass spectrometry with millisecond time resolution25,26. Here we
report a kinetic and mechanistic study of interfacial S(IV)/I- + O3(g) aerosol chemistry
that further illustrates the peculiarities of these systems.
194
Experimental
Experiments were performed in the spraying chamber of a commercial electrospray
mass spectrometer (HP-1100). Sodium iodide and/or bisulfite solutions (10–100 μM)
were directly infused (50 μL min-1) into the chamber through a grounded stainless steel
needle injector (100 μm internal diameter, 150 μm external diameter) surrounded by a
coaxial sheath (250 μm internal diameter) issuing 0.5 L min-1 of nebulizer N2 gas. The
difference between the exit velocities of the liquid jet (10.6 cm s-1) and nebulizer gas
(2.65 × 104 cm s-1) is so large that the drag imposed on the liquid breaks it apart into
microdroplets. The terminal velocities reached by these microdroplets are between 102
and 103 cm s-1 27. The transit times of microdroplets across the ~ 0.5 cm intersection with
the ozone plume are 1 ms < τ < 10 ms. It should be emphasized that the pneumatically
generated spray from the grounded nozzle injector is comprised of a normal distribution
of weakly charged droplets centered at zero charge, as expected from statistical charge
separation in the fragmentation of a neutral liquid jet25,26. This mechanism naturally
discriminates against the production of highly charged droplets. Charged droplets of
either sign can be electrostatically extracted into the mass spectrometer by applying a
suitable bias (+/- 3-4 kV) at its inlet port.
After leaving the reaction zone, microdroplets rapidly evaporate, leading to sudden
volume reduction and concomitant surface charge repulsion. Such droplets become
mechanically unstable when Coulombic repulsive forces overtake liquid cohesive forces,
casuing the droplets to ‘explode’ by shedding their interfacial films to produce smaller
droplets. This phenomenon repeats itself until nanometer droplets are formed. Ions will
be field-ejected from the outer layers of these last-generation nanodroplets28. This
195
analytical technique therefore reports the composition of the nanodroplets produced from
the outer interfacial layers of microdroplets that had reacted with O3(g). Typical
instrumental parameters were as follows: drying gas temperature, 340 oC; nebulizer pressure,
30 PSI; collector capillary voltage, +3.5 kV; fragmentor voltage, 19 V. Further experimental
details and results were reported elsewhere25,29.
Ozone was generated by flowing O2(g) (0.1 L/min, Air Liquid America Co.) through a
commercial ozonizer (Ozone Solutions), diluted tenfold with ultrapure N2(g) (0.9 L/min), and
quantified by UV absorption spectrophotometry (HP 8452) [using absorption cross-sections
σ(250 nm) = 1.1 x 10⁻¹⁷ cm2 molecule-1, and σ(300 nm) = 3.9 x 10⁻¹⁹ cm2 molecule-1 at 298
K]30 prior to being injected into the chamber. Actual [O3(g)] in the reaction chamber is about
10 times smaller than the values determined in this manner, due to further dilution by the hot
(250o C) N2 drying gas (10 L/min). Gas flows were regulated by mass flow controllers (MKS).
Solutions were prepared with MilliQ water that had been previously purged with ultrapure
N2(g) for at least 30 min to prevent reactant autooxidation. NaI (> 99 %) and Na2SO3 (> 98 %)
were obtained from Sigma-Aldrich. Solution pH was measured with a calibrated pH meter
(VWR, SB21). Molecular formula assignments of S-containing species could be confirmed
from the (M+2)/M ratios associated with natural abundance sulfur isotopes: 34S/ 32S = 0.044.
Results and Discussion
The typical data obtained from these experiments is shown in Figure 7.1, which
displays the mass spectra of aqueous Na2SO3 microdroplets in the absence and presence
of ozone. Signals at m/z = 61, 81, and 97, which are ascribed to HCO3- (from atmospheric
CO2), HSO3-, and HSO4
- (a pervasive byproduct of S(IV) autooxidation), respectively, are
observed in the absence of O3(g) (Figure 7.1, lower panel)31. Upon addition of O3(g),

196
HSO4- is significantly enhanced, and new signals appear at m/z = 119 (NaSO4
-) and m/z =
261 [Na3(SO4)2-] (Figure 7.1, upper panel), indicating extensive S(IV) → S(VI)
processing. The dependences of HSO3- and HSO4
- interfacial concentrations on [O3(g)] in
microdroplets that had been exposed to O3(g) for ~ 1 to 10 ms are shown in Figure 7.2a.
The reactant conversion vs. [O3(g)] data of Figure 7.2a cannot be analyzed using
integrated kinetic equations for constant volume batch reactors, such as those employed
in conventional studies, in which concentrations are expressed as explicit functions of
time. 32 The chemical events probed in present experiments actually occur in a
few-nm-thick open films that exchange ionic solutes with the droplets interior and O3(g)
with the gas-phase, in ~ 1 to 10 ms time frames. The analysis of gas-liquid reactions has
been conventionally carried out via coupled partial differential equations associated with
diffusional transport in homogeneous media separated by sharp boundaries33. Such
methodology may not be appropriate to our films, because diffusional transport applies to
large molecular assemblies spread over lengths much longer than mean free paths, and
the medium in which transport takes place is no longer homogeneous or isotropic close to
the interface, where compositional gradients arise even in the absence of chemical
reaction.29 Therefore, the issue of whether our findings correspond to surface or bulk
reactive transformations should be decided by an in-depth evaluation of the data rather
than by strict compliance with previously established models33.
By assuming that the interfacial liquid films are in solubility or collisional equilibrium
with O3(g) (i.e., [O3(int)] ∝ [O3(g)]), we can tentatively treat them as unidimensional
flow reactors where reactive losses are offset by reactant inflow from the underlying
layers.

197
d[S(IV)]/dt = [S(IV)] - [S(IV)]0 τ-1 = - kR [S(IV)]n [O3(g)] + [S(IV)]0 - [S(IV)]τt-1
(7.1)
In eq. 7.1, τ is the average contact time between microdroplets and O3(g), τt is the
average time for bulk S(IV) to replenish a partially depleted film, kR is an effective
reaction rate constant, and n is a phenomenological kinetic order that reflects the
influence of mass transport over a particular range of experimental conditions24,34 Figure
7.2b shows that γ = [HSO3-]/[HSO3
-]0 closely follows a single exponential decay to a
nonzero limiting value: γ = γ∞ + γ0 exp(- β [O3(g)], which is consistent with an
interfacial chemical reaction largely unperturbed by S(IV) transport from the droplets
core below ~ 500 ppm O3(g). However, the fact that γ∞ ~ 0.1 at ~ 1200 ppm O3(g)
indicates that conversion is ultimately limited by mass transfer. Accordingly, a [S(IV)]0 –
[S(IV)])/[S(IV)]n vs. kR [τ/(1 + τ τt-1)] [O3(g)] plot (from eq. 7.1]) is linearized with n =
1.0 ± 0.1 (r2 = 0.998) independent of [S(IV)]0 (Figure 7.2c). A kinetic order n
significantly smaller than 1 would have indicated that the interfacial film is competitively
replenished by intradroplet transport. The oxidation of I- under similar conditions yields,
for example: n = 0.67 ± 0.03.25 These results are quite reproducible under various
experimental conditions, although we have no direct control of the droplet size
distribution.
Figure 7.3 shows the mass spectra of NaI/Na2SO3 microdroplets in the absence (Figure
7.3, lower panel) and presence (Figure 7.3, upper panel) of O3(g). The m/z = 175 and 381
product signals correspond to IO3- and I3
-, whereas the dominant m/z = 207 signal is
assigned to the ISO3- intermediate. HSO4
-, IO3-, and ISO3
- signal intensities
monotonically increase at higher [O3(g)] (Figure 7.4). In contrast, I3- displays a broad
198
maximum at ~80 ppm O3(g). These processes likely proceed via the set of reactions
shown in Table 7.1. The fact that I3- signals peak and then decline with [O3(g)], while IO3
-
signals keep increasing, follows from I- and O3 competition for the HOI precursor, eqs.
7.1, 7.10, and 7.11 in Table 7.1 (Scheme 7.1). We found that I- signals are larger than
those of HSO3- in an equimolar NaI/Na2SO3 solution, and also larger than in a NaI
solution of the same concentration. In other words, I- competes favorably with HSO3- for
the air/water interface, even at sub-millimolar bulk concentrations and in the absence of
O3(g). Thus, I- is enriched near the air-water interface proper, while HSO3- lies behind in
the deeper layers under stationary conditions. The differential affinity of the various
anions for the interfacial region is a phenomenon that has not been taken into account in
previous work on gas-liquid reactions.
Considering that S(IV) mixtures at pH 6.6 (which consist of 0.7 HSO3- + 0.3 SO3
2-)
react with a composite second-order rate constant: kII[S(IV) + O3] ~ 4 × 10⁸ M-1 s-1, that
is ~ 3 times smaller than kII(I- + O3) = 1.2 × 10⁹ M-1 s-1 in bulk solution, the fact that I- is
oxidized to IO3-, I3
-, and ISO3- without apparent loss of interfacial I- is an unexpected
result (Figure 7.4b). The IO3- and I3
- yields: Y(X) = [S(X-) fx-1]/[S(I-)0 – S(I-)], measured
in NaI/Na2SO3 solutions at [O3(g)] = 210 ppm, [NaI] = 10 μM, are also anomalous
because they increase with [Na2SO3], eventually exceeding unity (Figure 7.5). S(X)s are
ESMS signal intensities, and fxs the relative response factors (fIO3- = S(IO3-)/S(I-) = 0.80,
and fI3- = S(I3-)/S(I-) = 0.76) determined under present experimental conditions.
It is apparent that the interfacial layers are efficiently replenished with I- from the
droplet’s core during reaction with O3(g), and that this process is enhanced in the
presence of S(IV). This phenomenon arises from interfacial anion fractionation. As O3
199
penetrates the droplets, it largely reacts with I- first, but increasingly so with HSO3-
further inside, thereby minimizing I- depletion from the underlying region that eventually
resupplies the outermost layers. [S(IV)] × [I-] also peaks in this region, maximizing ISO3-
production, whose hydrolysis, eq. 7.6, regenerates I- and contributes to buffering
interfacial I- concentrations (Scheme 7.1). The ISO3- intermediate may derive from I2/I3
-
via reactions R2-R535, , ,36 37 38, but more likely from HOI via eq. 7.12. The fact that ISO3-
signals are ~ 20 times more intense than those of IO3- and I3
- under most conditions
supports the efficient scavenging of HOI, the initial precursor of IO3- and I3
- by S(IV),
reactions R10–R12.
In summary, we have shown that it is possible to monitor fast reactions in the
interfacial layers of aqueous microdroplets during exposure to a reactive gas by mass
spectrometry. The larger propensity of I- vs. HSO3- for the air-water interface influences
their reactions with O3(g) via a combination of physical and chemical processes.
Mutually inert solutes can compete for reactive gases in ways that are beginning to be
understood.
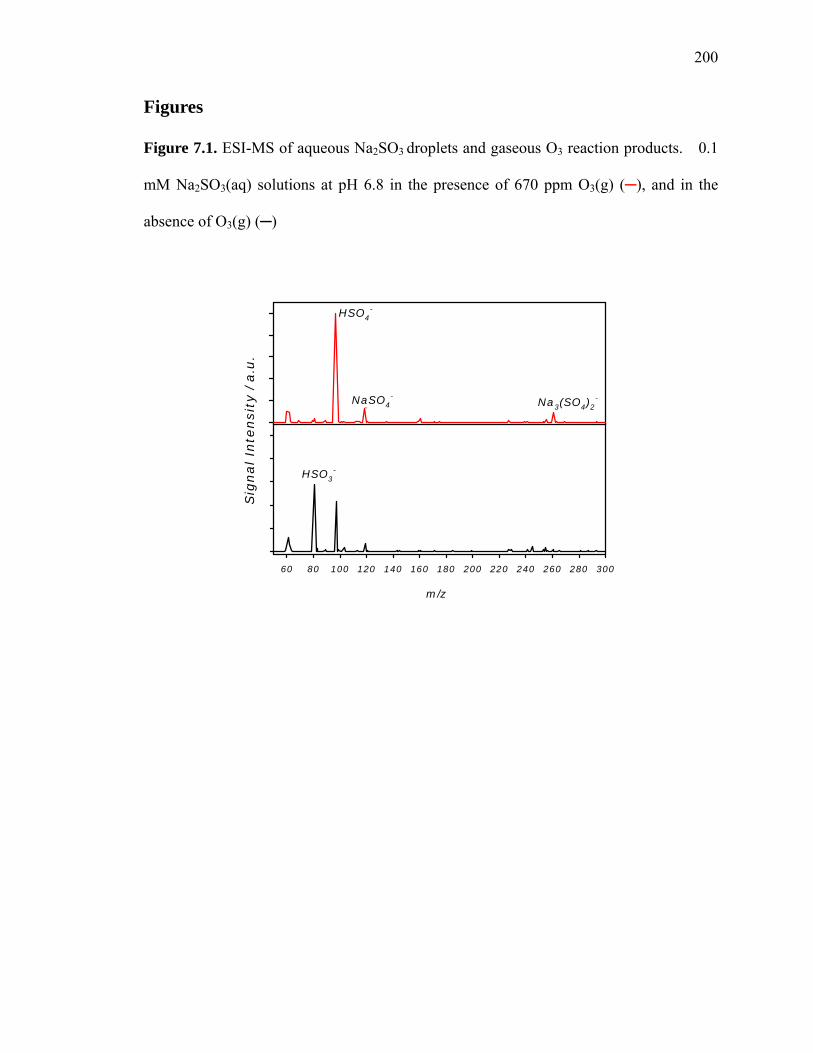
200
Figures
Figure 7.1. ESI-MS of aqueous Na2SO3 droplets and gaseous O3 reaction products. 0.1
mM Na2SO3(aq) solutions at pH 6.8 in the presence of 670 ppm O3(g) (), and in the
absence of O3(g) ()
60 80 100 120 140 160 180 200 220 240 260 280 300
Sig
na
l In
ten
sit
y / a
.u.
A
P
Q R
m/z
HSO4-
NaSO4-
HSO3-
Na3(SO4)2-
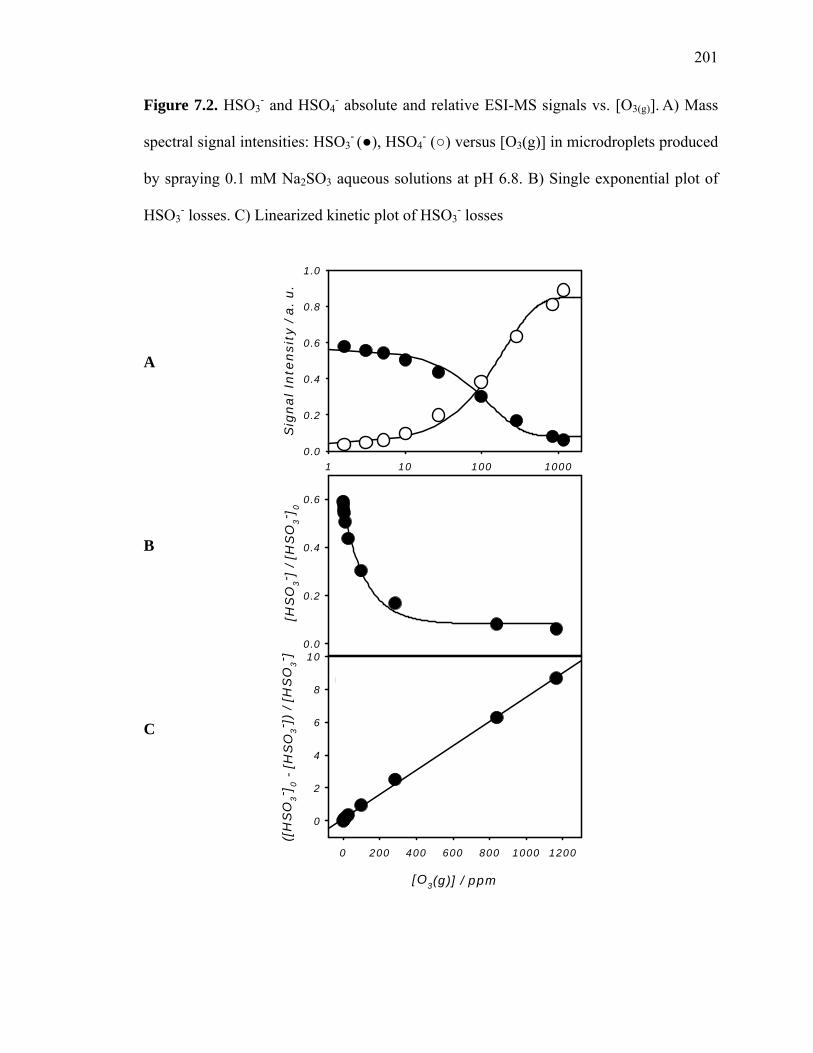
201
Figure 7.2. HSO3- and HSO4
- absolute and relative ESI-MS signals vs. [O3(g)]. A) Mass
spectral signal intensities: HSO3- (), HSO4
- () versus [O3(g)] in microdroplets produced
by spraying 0.1 mM Na2SO3 aqueous solutions at pH 6.8. B) Single exponential plot of
HSO3- losses. C) Linearized kinetic plot of HSO3
- losses
[O3(g)] / ppm
0 200 400 600 800 1000 1200
([H
SO
3- ]
0 - [
HS
O3- ]
) / [H
SO
3- ]
0
2
4
6
8
10
1 10 100 1000
Sig
na
l In
ten
sit
y / a
. u
.
0.0
0.2
0.4
0.6
0.8
1.0
A[H
SO
3- ]
/ [
HS
O3- ]
0
0.0
0.2
0.4
0.6 B
C
A
B
C

202
Figure 7.3. ESI-MS of aqueous Na2SO3-NaI droplets and gaseous O3 reaction products.
(0.1 mM Na2SO3 + 0.1 mM NaI) aqueous solutions at pH 6.6 in the presence of 50 ppm
O3(g) (), and in the absence of O3(g) (). See also Figure 7.1 for further spectral
assignments S
igna
l In
ten
sit
y / a
.u.
m/z50 100 150 200 250 300 350 400
X
Y Z
B
C
ISO3-
I3-
NaI2-
I-
IO3-
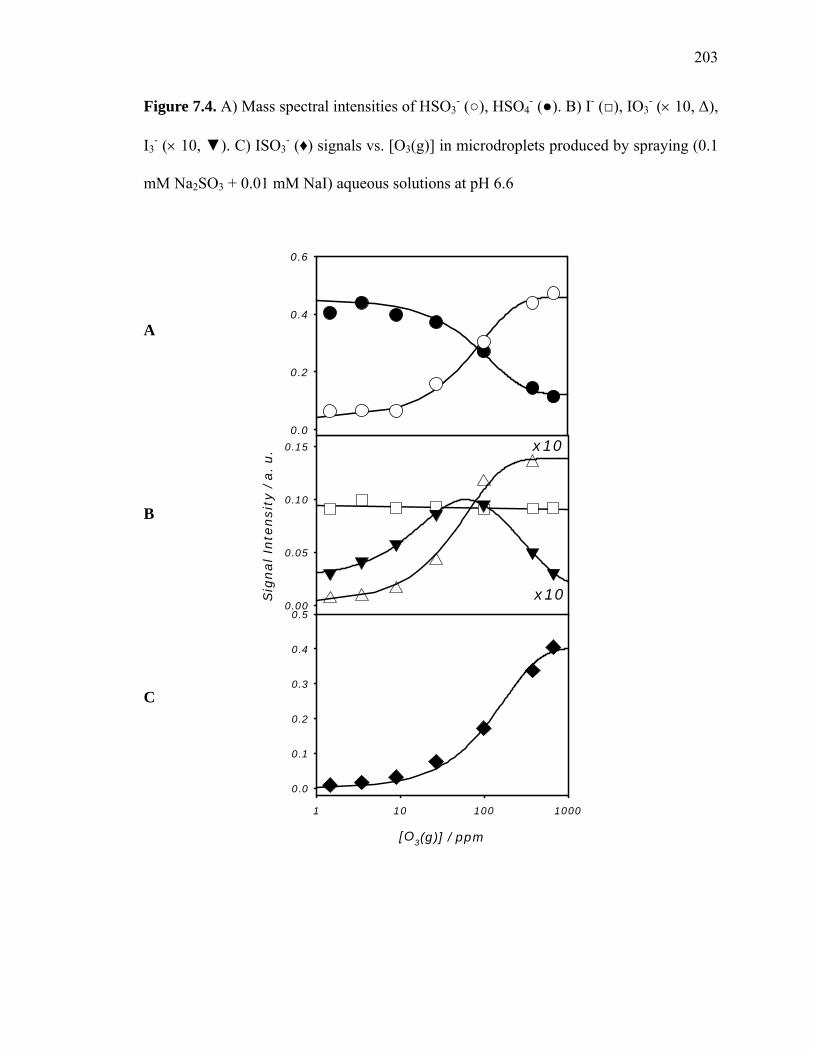
203
Figure 7.4. A) Mass spectral intensities of HSO3- (), HSO4
- (). B) I- (), IO3- (× 10, Δ),
I3- (× 10, ). C) ISO3
- (♦) signals vs. [O3(g)] in microdroplets produced by spraying (0.1
mM Na2SO3 + 0.01 mM NaI) aqueous solutions at pH 6.6
Sig
nal In
tensit
y / a
. u.
0.00
0.05
0.10
0.15
0.0
0.2
0.4
0.6
[O3(g)] / ppm
1 10 100 1000
0.0
0.1
0.2
0.3
0.4
0.5
A
x10
x10
B
C
A
B
C
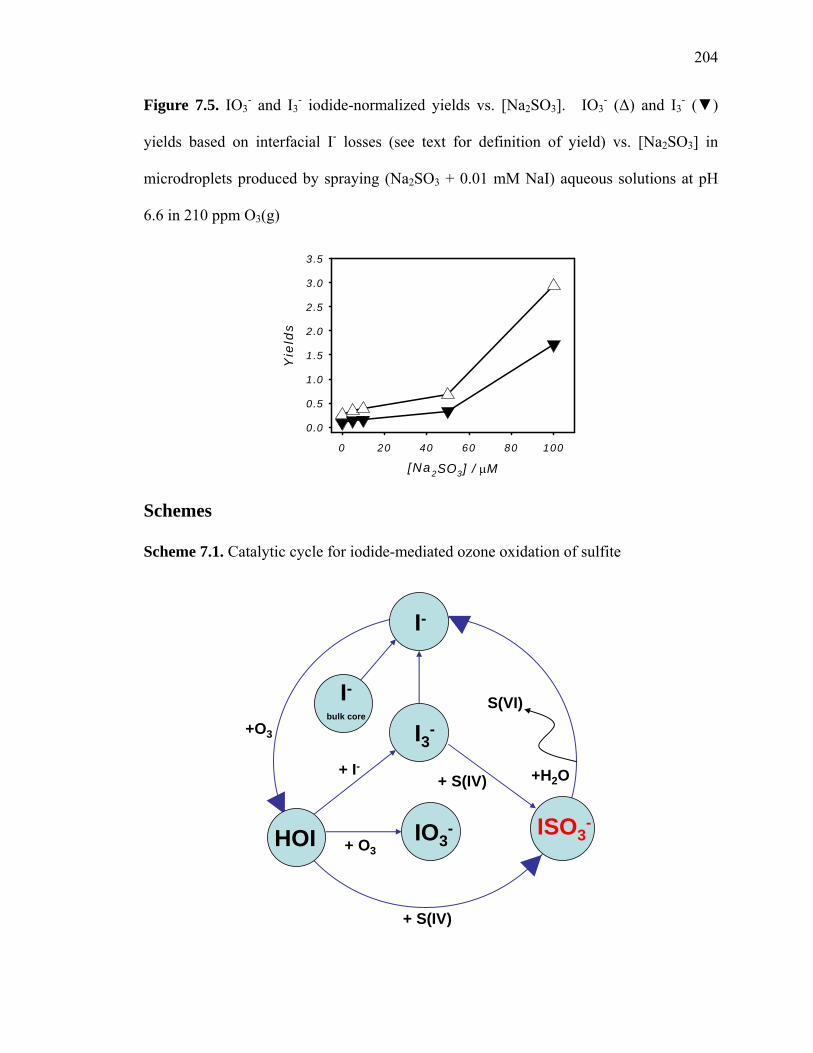
204
Figure 7.5. IO3- and I3
- iodide-normalized yields vs. [Na2SO3]. IO3- (Δ) and I3
- ()
yields based on interfacial I- losses (see text for definition of yield) vs. [Na2SO3] in
microdroplets produced by spraying (Na2SO3 + 0.01 mM NaI) aqueous solutions at pH
6.6 in 210 ppm O3(g)
[Na2SO3] / μM
0 20 40 60 80 100
Yie
lds
0.0
0.5
1.0
1.5
2.0
2.5
3.0
3.5
Schemes
Scheme 7.1. Catalytic cycle for iodide-mediated ozone oxidation of sulfite
I-
HOI ISO3-IO3
-
I3-S(VI)
+O3
+ S(IV)
+ I-
+ O3
+H2O
I-bulk core
+ S(IV)

205
Tables
Table 7.1. Kinetic data for Na2SO3-NaI(aq) and O3(g) reactions at 298 K
eq# Reaction Rate, equilibrium constants in M, s units Ref.
7.1 I2 + I- → ← I3
- 721 M-1 397.2 I2 + SO3
2- → ISO3- + I-
3.1 x 10⁹ M-1 s-1 35
7.3 I3- + SO3
2- → ISO3- + 2I-
2.9 × 10⁸ M-1 s-1 35
7.4 I2 + HSO3- → I- + ISO3
- + H+1.7 × 10⁹ M-1 s-1 35
7.5 I3- + HSO3
- → 2I- + ISO3- + H+
1.5 × 10⁷ M-1 s-1 35
7.6 ISO3-+ H2O → I- + SO4
2- + 2H+298 s-1 35
7.7 SO32- + O3 → SO4
2- + O2 1.5 × 10⁹ M-1 s-1 9
7.8 HSO3- + O3 → HSO4
- + O2 3.7 x 10⁵ M-1 s-1 9
7.9 I- + O3 + H+ → HOI + O2 1.2 × 10⁹ M-1 s-1 40
7.10 HOI + 2O3→ IO3- + 2O2 + H+ 3.6 × 10⁴ M-1 s-1 41
7.11 HOI + I- + H+ → I2 + H2O 4.4 × 10¹² M-2 s-1 42
7.12
HOI + SO3
2- + H+ → ISO3- + H2O
N/A N/A
206
References
(1) Pilinis, C.; Pandis, S. N.; Seinfeld J. H. J. Geophys. Res. 1995, 100, 18739.
(2) Satheesh, S. K.; Moorthy, K. K.; Atmos. Environ. 2005, 39, 2089.
(3) Herrmann, H. Chem. Rev. 2003, 103, 4691.
(4) Reid, J. P.; Sayer, R. M.; Chem. Soc. Rev. 2003, 32, 70.
(5) Nissenson, P.; Knox, C. J. H.; Finlayson-Pitts, B. J.; Phillips, L. F.; Dabdub, D.
Phys. Chem Chem. Phys. 2006, 8, 4700.
(6) Finlayson-Pitts, B. J.; Pitts, J. N. Chemistry of the upper and lower atmosphere,
Academic Press; San Diego, CA, 2000.
(7) Martin, L. R.; Damschen, D. E. Atmos. Environ. 1981, 15, 1615.
(8) Shorter, J. A.; De Bruyn, W. J.; Hu, J.; Swartz, E.; Davidovits, P.; Worsnop, D. R.;
Zahniser, M. S.; Kolb, C. E. Environ. Sci. Technol. 1995, 29, 1171.
(9) Hoffmann, M. R.; Atmos. Environ. 1986, 20, 1145.
(10) Tie, X.; Brasseur, G..; Emmons, L.; Horowitz, L.; Kinnison, D.; J. Geophys. Res.
2001, 106, 22931.
(11) Tie, X.X.; Madronich, S.; Walters, S.; Edwards, S. P.; Ginoux, P.; Mahowald, N.;
Zhang, R. Y.; Lou, C.; Brasseur, G.. J. Geophys. Res. 2005, 110, D03204.
(12) Lagrange, J.; Pallares, C.; Wenger, G..; Lagrange, P. J. Geophys. Res. 1994, 99,
14595.
(13) Botha, C. F.; Hahn, J.; Pienaar, J. J.; van Eldik, R. Atmos. Environ. 1994, 28,
3207.
(14) Tarbuck, T. L.; Richmond, G. L. J. Am. Chem. Soc. 2006, 128, 3256.
(15) Boniface, J.; Shi, Q.; Li, Y. Q.; Cheung, J. L.; Rattigan, O. V.; Davidovits, J.;
207
Worsnop, D. R.; Jayne, J. T.; Kolb, C. E. J. Phys. Chem. A 2000, 104, 7502.
(16) Rattigan, O. V.; Boniface, J.; Swartz, E.; Davidovits, P.; Jayne, J. T.; Kolb, C. E.;
Worsnop, D. R. J. Geophys. Res. 2000, 105, 29065.
(17) Liu, Q.; Schurter, L. M.; Muller, C. E.; Aloisio, S.; Francisco, J. S.; Margerum, D.
W. Inorg. Chem. 2001, 40, 4436.
(18) Davidovits, P.; Kolb, C. E.; Williams, L. R.; Jayne, J. T.; Worsnop, D. R. Chem.
Rev. 2006, 106, 1323.
(19) Underwood, G.. M.; Li, P.; Usher, C. R.; Grassian, V. H. J. Phys. Chem. A 2000,
104, 819.
(20) Schutze, M.; Herrmann, H. Phys. Chem. Chem. Phys. 2002, 4, 60.
(21) Boniface, J.; Shi, Q.; Li, Y. Q.; Cheung, J. L.; Rattigan, O. V; Davidovits, P.;
Worsnop, D. R.; Jayne, J. T.; Kolb, C. E. J. Phys. Chem. A 2000, 104, 7502.
(22) Knipping, E. M.; Lakin, M. J.; Foster, K. L.; Jungwirth, P.; Tobias, D. J.; Gerber,
R. B.; Dabdub, D.; Finlayson-Pitts, B. J. Science 2000, 288, 301.
(23) Buch, V.; Milet, A.; Vácha, R.; Jungwirth, P.; Devlin, J. P. Proc. Natl. Acad. Sci. U.
S. A. 2007, 104, 7342.
(24) Smith, G.. D.; Woods III, E.; DeForest, C. L.; Baer, T.; Miller, R. E. J. Phys. Chem.
A 2002, 106, 8085.
(25) Enami, S.; Vecitis, C. D.; Cheng. J.; Hoffmann, M. R.; Colussi, A. J. J. Phys.
Chem. A 2007, 111, 8749.
(26) Enami, S.; Vecitis, C. D.; Cheng. J.; Hoffmann, M. R.; Colussi, A. J. J. Phys.
Chem. A 2007, 111, 13032.
(27) Kahen, K.; Jorabchi, K.; Gray, C.; Montaser, A. Anal. Chem. 2004, 76, 7194.
208
(28) Kebarle, P.; J. Mass Spectrom. 2001, 35, 804.
(29) Cheng, J.; Vecitis, C. D.; Hoffmann, M. R.; Colussi, A. J. J. Phys. Chem. B 2006,
110 25598.
(30) Sander, S. P. et al. Chemical Kinetics and Photochemical Data for Use in
Stratospheric Modeling; Evaluation 15; Jet Propulsion Laboratory: Pasadena, CA, 2006.
(31) Stewart, I. I.; Barnett, D. A.; Horlick, G.. J. Anal. Atom. Spec. 1996, 11, 877.
(32) Benson, S. W. The Foundations of Chemical Kinetics; McGraw-Hill: New York,
1960.
(33) Danckwerts, P. V., Gas-Liquid Reactions; McGraw-Hill: New York, 1970.
(34) Hanson, D. R.; Ravishankara, A. R. J. Phys. Chem. 1994, 98, 5728.
(35) Yiin, B. S.; Margerum, D. W. Inorg. Chem. 1990, 29 1559.
(36) Landolt, H., Ber. Dtsch. Chem. Ges. 1886, 19, 1317.
(37) Bunau, G.. V.; Eigen, M. Z. Physik. Chem. (Frankfurt) 1962, 32, 27.
(38) Inoue, H.; Sudo, Y.; Kogyo Kagaku Zasshi 1967, 70, 123.
(39) Troy, R. C.; Kelly, M. D.; Nagy, J.C.; Margerum, D.W. Inorg. Chem. 1991, 30,
4838.
(40) Magi, L.; Schweitzer, F.; Pallares, C.; Cherif, S.; Mirabel, P.; George, C. J. Phys.
Chem. A 1999, 101, 4943.
(41) Bichsel, Y.; von Gunten, U. Environ. Sci. Technol. 1999, 33, 4040.
(42) Eigen, M.; Kustin, K. J. Am. Chem. Soc. 1962, 84, 1355.
209
Chapter 8
Iodide-Mediated Gaseous Ozone Oxidation
of Aerosol Bromide and Chloride as a
Possible Source of Gaseous Marine
Halogens
Sections reprinted with permission from Enami, S.; Vecitis, C. D.; Cheng, J.; Hoffmann,
M. R.; Colussi, A. J. Journal of Physical Chemistry A 2007, 111, 8749-8752.
© 2007 American Chemical Society
210
Abstract
A few gaseous bromine molecules per trillion (ppt) cause the complete destruction of
ozone in the lower troposphere during the polar sunrise and about half of the losses
associated with the ‘ozone hole’ in the stratosphere. Recent field measurements of BrO in
the free troposphere suggest an even more global role of atmospheric bromine. Models
quantifying ozone trends by assuming atmospheric inorganic bromine (Bry) stems
exclusively from long-lived bromoalkane gases significantly underpredict BrO
measurements. This discrepancy implies a tropospheric background level of ~ 4 ppt Bry
of unknown origin. Here we report that I- efficiently mediates the oxidation of Br- and Cl-
in aqueous droplets exposed to gaseous ozone. Br- and Cl-, which are kinetically
unreactive towards O3 in comparison to I-, and were previously deemed unlikely direct
precursors of atmospheric halogens, are readily converted into IBr2- and ICl2
- in the
presence of I- and gaseous ozone. Fine sea salt aerosol particles (r < 1 micron) are
reported to be enriched in I- and Br- and may be a global source of photoactive gaseous
halogen compounds in the atmosphere even in the absence of sunlight.
211
Introduction
Bromine critically affects atmospheric ozone at all altitudes, playing a crucial role in
the ozone depletion events (ODEs) observed in the polar lower troposphere during early
spring1-3. Despite its lower abundance, bromine is 45–70 times more efficient than
chlorine as a catalyst of stratospheric ozone depletion4. The mechanism of atmospheric
bromine production from its primary seawater bromide source is not fully understood5. It
has been generally assumed that gaseous inorganic bromine (Bry) is released in the
stratosphere by the short wavelength photolysis of long-lived source gases, such as
biogenic methyl bromide and anthropogenic halons6. However, recent field (surface
station, balloon, and satellite) BrO measurements, which are broadly consistent with each
other, significantly exceed model predictions based on those BrO source assumptions7–9
The implication is that some Bry is directly delivered to the free troposphere, possibly
carried by sea salt aerosol itself8,10–12. Marine aerosols appear to be plausible vehicles for
halogen activation since a fraction of the sea spray aerosols are fine (r < 1 micron)
particles that remain suspended long enough to undergo chemical processing.
Polar ODEs require the presence of appreciable levels (t10 ppt) of rapidly
photolyzable Br2(g) in the boundary layer at the end of the polar winter night13-15. Since
ODEs are also observed under pristine Antarctic conditions, the conversion of marine Br-
into Br2(g) should involve an oxidant that persists in the dark, such as O3. The inertness
of Br- and Cl- towards O3 is circumvented in sea salt as compared to NaCl and NaBr
alone16. That significantly more Br2(g) is emitted from sea salt than from pure NaBr
exposed to O3(g) implies that Br- oxidation is catalyzed or mediated by a minor
component of the sea salt17. I- is one viable sea salt component since it reacts at diffusion-
212
controlled rates with ozone. Halogen activation may also occur to some extent on the
surface of sea ice, which has been reported to catalyze a number of atmospherically
relevant reactions.
The enrichment of seawater anions such as Br- and I- in fine marine aerosol particles
would be expected to enhance the possible halogen activation18–20. Relative anion
populations, fi, at the interface of droplets produced from equimolar solutions were
recently shown to increase exponentially with ionic radius ri, i.e.: fi ∝ exp(β ri), fI-/fBr- =
5.2, fBr-/fCl- = 3.4.21 This correlation reveals that anion fractionation at the air/water
interface is simply another manifestation of the Hofmeister effects generally observed at
aqueous interfaces in contact with less polarizable media.22 The enrichment of Br- and I-
in fine aerosol particles of greater surface-area-to-volume ratios would be expected to
enhance oxidation kinetics by ozone, which partitions weakly to the aqueous phase from
the gas phase, via reactions at the air-water interface.
We investigated this possibility in laboratory experiments where the reaction products
of aqueous halide droplets sprayed into an O3(g) plume are monitored via online
electrospray mass spectrometry (ESMS) of the evaporated anions (Figure 6.1).
Small drops are usually charged, even when produced by fragmentation of electrically
neutral liquids, due to statistical fluctuations that scale with (drop size)-1/2 23. For
example, submicron marine aerosol drops are, on average, negatively charged24. Water
evaporation regulated by ambient relative humidity will eventually shrink the suspended
droplets, subsequently increasing electrostatic repulsion among excess surface charges.
Coulomb explosions may ensue if charge density is great enough and highly charged
droplets lose interfacial charge and mass into smaller droplets25. These events, if
213
replicated by the subsequent droplets, generate small particles that are enriched (i.e., net
enrichment ∝ (fi)m, where m is the number of successive Coulomb explosions) in Br- and
I-. This mechanism provides a physicochemical (i.e., abiotic)1,26 explanation for anion
enrichment in aerosol particles, as well as for its inverse dependence on particle size and
statistical variations among individual particles of similar size19. Anion enrichment may
also be partially due to droplet acidification resulting in protonation and then gasification
of the weaker acids. Smaller particles drawing mass and surface charge from larger units
is consistent with observations that Br- is enriched in submicron particles while depleted
in larger specimens2.
Figure 8.1a shows the extent of I- oxidation in aqueous NaI microdroplets injected in
O3(g) gas mixtures at atmospheric pressure. Interfacial I- concentration decreases by ~
50% after exposure to [O3(g)] > 100 ppm for > 1 to 10 ms (i.e., I- reacts with O3 with an
apparent pseudo-first-order rate constant, kI ~ 103 s-1, that can be formally calculated
from the reaction rate constant in bulk solution: kII(I- + O3)aq = 1.2 × 10⁹ M-1 s-1 28, and
[O3(aq)] ~ 1 μM (from Henry’s law constant H = 0.01 M atm-1 for O3 in water at 298 K).
I- oxidation proceeds at rates R-I- given by: R-I
- ∝ [I-]n [O3(g)]. The actual n value may be
obtained from the fact that at steady state: IF(I-) – [I-] τ-1 – kR [I-]n [O3(g)] = 0, where IF(I-
) is the I- inflow to the reaction zone, i.e., the intersection between the droplets and the
O3(g) plumes in Figure 6.1, τ is the transit time through this zone, kR the overall reaction
rate constant, and n the effective kinetic order of [I-] in eq. 8.129. Since: IF(I-) – [I-]0 τ-1 =
0 at [O3(g)] = 0, a plot of ([I-]0 – [I-])/[I-]n vs. [O3(g)] should be linear. The data of Figure
8.1a are linearized provided that ⟨n⟩ = 0.67 ± 0.03 in the range 1 ≤ [NaI]/μM ≤ 30 ([I-] =
0.5 μM in seawater) (Figure 8.1b). In this context 0.5 ≤ ⟨n⟩ ≤ 1 is an empirical parameter
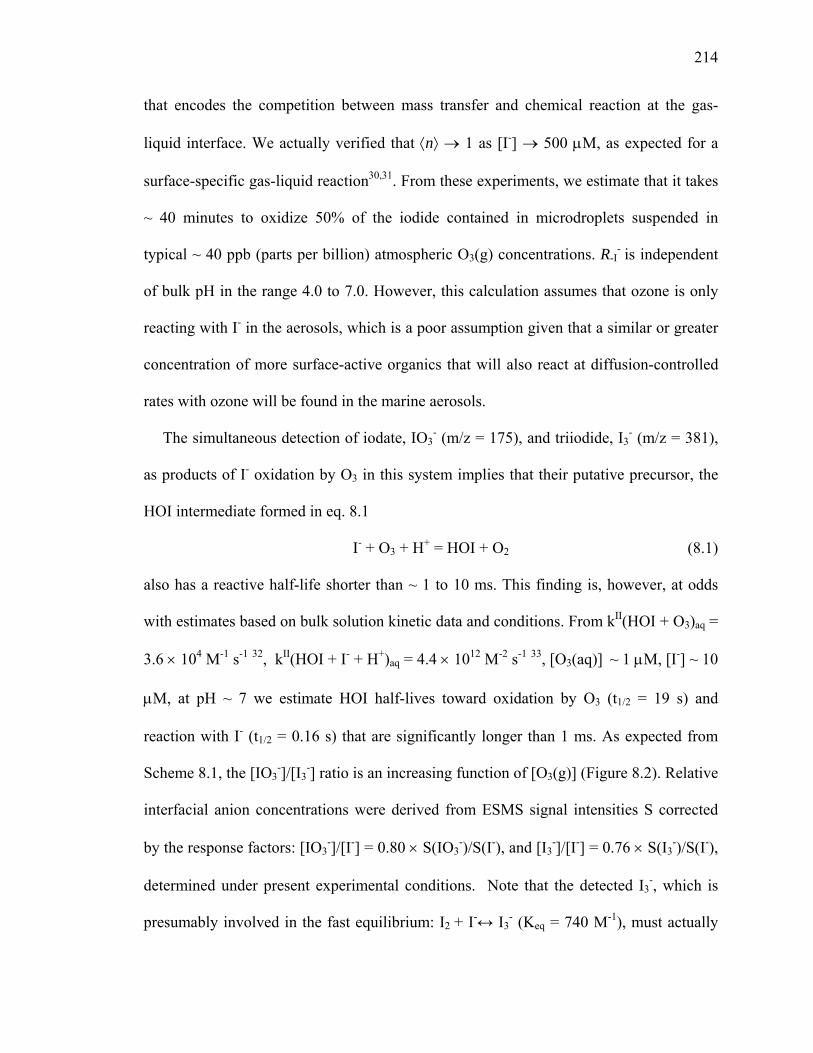
214
that encodes the competition between mass transfer and chemical reaction at the gas-
liquid interface. We actually verified that ⟨n⟩ → 1 as [I-] → 500 μM, as expected for a
surface-specific gas-liquid reaction30,31. From these experiments, we estimate that it takes
~ 40 minutes to oxidize 50% of the iodide contained in microdroplets suspended in
typical ~ 40 ppb (parts per billion) atmospheric O3(g) concentrations. R-I- is independent
of bulk pH in the range 4.0 to 7.0. However, this calculation assumes that ozone is only
reacting with I- in the aerosols, which is a poor assumption given that a similar or greater
concentration of more surface-active organics that will also react at diffusion-controlled
rates with ozone will be found in the marine aerosols.
The simultaneous detection of iodate, IO3- (m/z = 175), and triiodide, I3
- (m/z = 381),
as products of I- oxidation by O3 in this system implies that their putative precursor, the
HOI intermediate formed in eq. 8.1
I- + O3 + H+ = HOI + O2 (8.1)
also has a reactive half-life shorter than ~ 1 to 10 ms. This finding is, however, at odds
with estimates based on bulk solution kinetic data and conditions. From kII(HOI + O3)aq =
3.6 × 10⁴ M-1 s-1 32, kII(HOI + I- + H+)aq = 4.4 × 10¹² M-2 s-1 33, [O3(aq)] ~ 1 μM, [I-] ~ 10
μM, at pH ~ 7 we estimate HOI half-lives toward oxidation by O3 (t1/2 = 19 s) and
reaction with I- (t1/2 = 0.16 s) that are significantly longer than 1 ms. As expected from
Scheme 8.1, the [IO3-]/[I3
-] ratio is an increasing function of [O3(g)] (Figure 8.2). Relative
interfacial anion concentrations were derived from ESMS signal intensities S corrected
by the response factors: [IO3-]/[I-] = 0.80 × S(IO3
-)/S(I-), and [I3-]/[I-] = 0.76 × S(I3
-)/S(I-),
determined under present experimental conditions. Note that the detected I3-, which is
presumably involved in the fast equilibrium: I2 + I-↔ I3- (Keq = 740 M-1), must actually
215
desorb from microdroplets in which [I-] necessarily exceeds the μM range. Thus, while I-
is oxidized to HOI immediately after the droplets enter the O3(g) plume, subsequent
chemistry takes place in the increasingly concentrated aqueous media resulting from
rapid solvent evaporation due to high (10 L/min) and hot (250o C) dry N2 cross-flows 25.
Similar conditions are expected to develop, albeit at a slower pace, in the marine aerosol
as they rise into the dry atmosphere34. IO3- and I3
- yields calculated from interfacial I-
losses (m/z = 127) circumstantially exceed unity, revealing that interfacial layers are
competitively replenished with I- from the droplets core. These results suggest that the
rates and mechanisms of chemical reactions at aerosol interfaces cannot be directly
inferred from those in bulk solution35.
We confirmed that aqueous Br- and Cl- are inert toward O3 under present conditions,
in line with reported rate constants kII(Br- + O3)aq = 248 M-1 s-1 28, and kII(Cl- + O3)aq = 0.1
M-1 s-1, that are t107 times smaller than kII(I- + O3)aq in bulk solution. However, ozonation
experiments performed on (NaI + NaBr) and (NaI + NaCl) solutions readily yield the
trihalide anions IBr2- and ICl2
- (Figures 8.3a and 8.3b). IBr2- and ICl2
- production rates
increase with [O3(g)] (Figure 8.4) while Br- inhibits I- depletion and depresses IO3- and I3
-
formation (Figure 8.5). IBr2- and ICl2
- are, therefore, the products of Br- and Cl- oxidation
by I-containing intermediates, such as HOI or the primary adduct I-OOO-, that are
considerably more reactive than O3. Since rate constants for the reactions of halide anions
with HOI are similar (I- ~ Br- ~ 10 Cl-)36 the huge selectivity of the stronger oxidizer O3
for I- vs. Br-/Cl- is counterintuitive. Note that spin conservation requires the formation of
excited O2(1Δg) in eq. 8.1. This restriction is more likely to be lifted by I- than by Br- or
Cl- via heavy atom enhancement of crossing rates into the triplet manifold that leads to
216
ground state O2(3Σg)37. By mitigating spin conservation constraints, eq. 8.1 becomes the
gateway to the I--mediated production of Br2 (and Cl2) from sea salt (Scheme 8.1). The
efficiency of this cycle (i.e., the [Br2]/[IO3-] ratio) is expected to be a direct function of
[Br-]/[O3] at the droplets interface. Since Cl- will always be present in large excess ([Cl-
]/[Br-]/[I-] = 1.1 × 10⁶/1680/1 in seawater) sea salt particles exposed to O3(g) will
generate IBr2- and ICl2
- rather than I3-, depending on actual interfacial halide and [O3(g)],
and some Br- will remain even after extensive atmospheric processing. Scheme 8.1
actually provides a plausible mechanism for buffering the [IO3-]/[I-] ratio38.
Present experiments and analysis suggest that I- may be the ‘minor component’ that
enhances O3 uptake and concomitant Br2 formation in sea salt.17 The iodide-mediated
oxidation cycle in Scheme 8.1 qualifies as the previously unidentified dark process that
may liberate dihalogens such as IBr(g), ICl(g), or even Cl2(g) and Br2(g) from sea salt
into the boundary layer during the polar winter night15. The accumulation of these
species on aerosol surfaces or in the atmosphere would prime the sudden destruction of
O3 at polar sunrise due to their quick photolysis (τ1/2 ~ 1 to 2 min)1. The proposed
mechanism of marine halide ozone oxidation should operate over the oceans worldwide,
rather than just around coastal regions, at rates that may be locally modulated by wind
speed, relative humidity, and atmospheric ozone concentration8. The fast halogen
activation rates demonstrated by our experiments may exceed aerosol transport rates. In
summary, fine marine aerosols are expected to be naturally enriched in I- and Br-, and the
oxidation of these species by reactive gases such as ozone may release gaseous halogen
species into the atmosphere even in the absence of sunlight. Further experiments will be
completed to evaluate this process under more environmental conditions.
217
Figures
Figure 8.1. Normalized iodide concentrations [I-]/[I-]0 vs. [O3(g)] A) (ô): 1 μM. (æ): 10
μM. (ò) : 30 μM NaI) droplets. B) Linearized plot of the data of Figure 8.1a. See text.
(ô): 1 μM; (æ): 10 μM; (ò) : 30 μM NaI
A
B
[O3(g)]/ppmv
1 10 100 1000
[I- ]
/[I-
] 0
0.0
0.2
0.4
0.6
0.8
1.0
[O3(g)]/ppmv
0 200 400 600
([I-
] 0-[
I-])
/[I-
]0.6
7
0
5
10
15
20
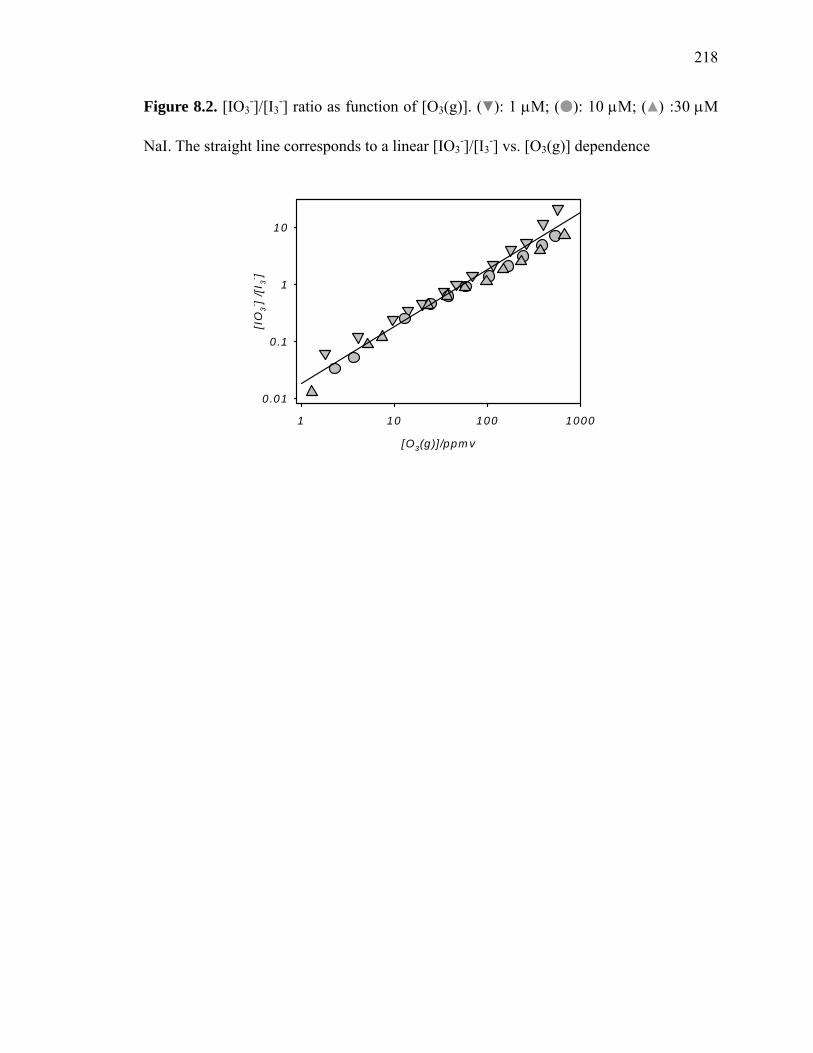
218
Figure 8.2. [IO3-]/[I3
-] ratio as function of [O3(g)]. (ô): 1 μM; (æ): 10 μM; (ò) :30 μM
NaI. The straight line corresponds to a linear [IO3-]/[I3
-] vs. [O3(g)] dependence
[O3(g)]/ppmv
1 10 100 1000
[IO
3- ]
/[I 3
- ]
0.01
0.1
1
10

219
Figure 8.3. Aqueous NaBr-NaI or NaCl-NaI and O3(g) reaction products. A) Negative ion
mass spectra of aqueous (10 μM NaI + 100 μM NaBr) droplets. Blue trace: Mass
spectrum in 1 atm N2. Peak 1: m/z = 127 (I-). Peak group 2: m/z = 181, 183, and 185
(NaBr2-). Red trace: Mass spectrum in [840 ppm O3(g) + 1 atm N2] gas mixtures. Peak
X: m/z = 175 (IO3-). Peak group Y: m/z = 285 (I79Br79Br-), m/z = 287 (I79Br81Br-), m/z =
289 (I81Br81Br-). Peak Z: m/z = 381 (I3-). B) Negative ion mass spectra of aqueous (10
μM NaI + 10 mM NaCl) droplets. Blue trace: mass spectrum in 1 atm N2. Peak 1: m/z =
127 (I-). Peak group 2: m/z = 151, 153, 155, and 157 (Na2Cl3-). Peak group 3: m/z = 209
to 217 (Na3Cl4-). Red trace: mass spectrum in [690 ppm O3(g) + 1 atm N2] gas mixtures.
Peak X: m/z = 175 (IO3-). Peak group W: m/z = 197 (I35Cl35Cl-), m/z = 199 (I35Cl37Cl-),
m/z = 201 (I37Cl37Cl-)
150200
250300
350400
sig
na
l in
tensit
y/a
.u.
m/z
1
21 2
Y
Z
X
A
120 140160
180200
220240
sig
na
l in
ten
sit
y/a
.u.
m/z
1
2
1
X
B
32
3
W
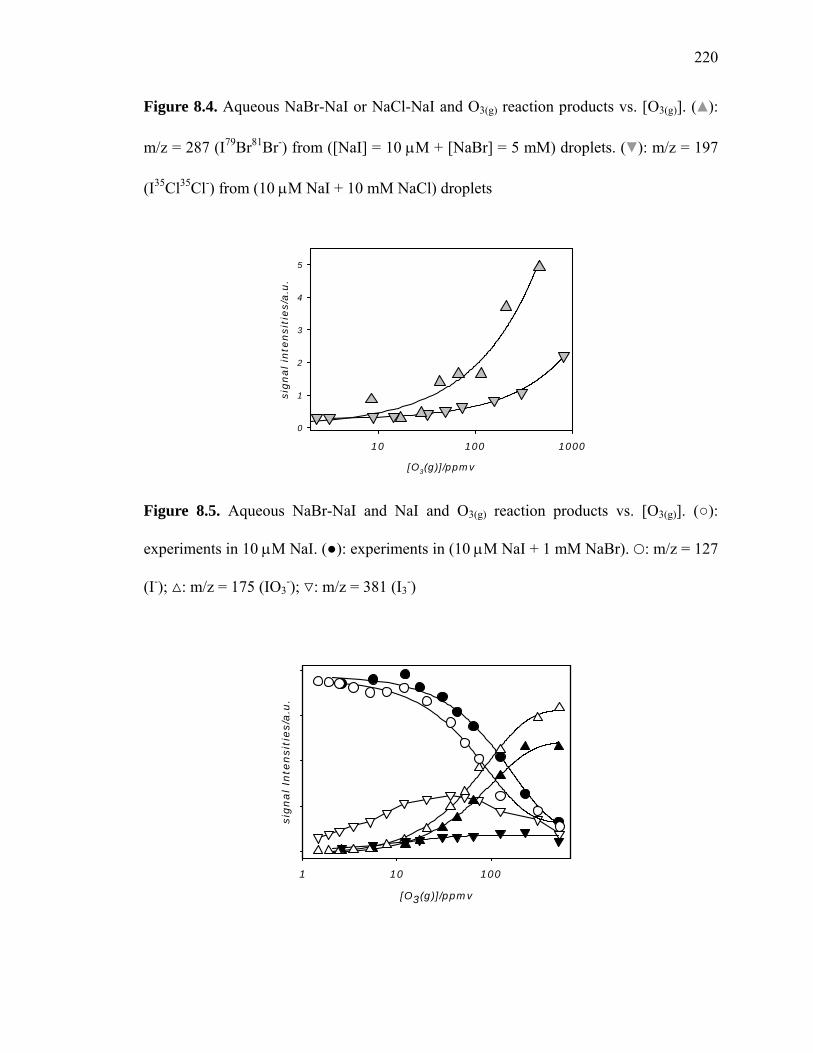
220
Figure 8.4. Aqueous NaBr-NaI or NaCl-NaI and O3(g) reaction products vs. [O3(g)]. (ò):
m/z = 287 (I79Br81Br-) from ([NaI] = 10 μM + [NaBr] = 5 mM) droplets. (ô): m/z = 197
(I35Cl35Cl-) from (10 μM NaI + 10 mM NaCl) droplets
[O3(g)]/ppmv
10 100 1000
sig
na
l in
ten
sit
ies/a
.u.
0
1
2
3
4
5
Figure 8.5. Aqueous NaBr-NaI and NaI and O3(g) reaction products vs. [O3(g)]. ():
experiments in 10 μM NaI. (): experiments in (10 μM NaI + 1 mM NaBr). ç: m/z = 127
(I-); ó: m/z = 175 (IO3-); õ: m/z = 381 (I3
-)
[O3(g)]/ppmv
1 10 100
sig
na
l In
ten
sit
ies/a
.u.
0
2e+3
4e+3
6e+3
8e+3
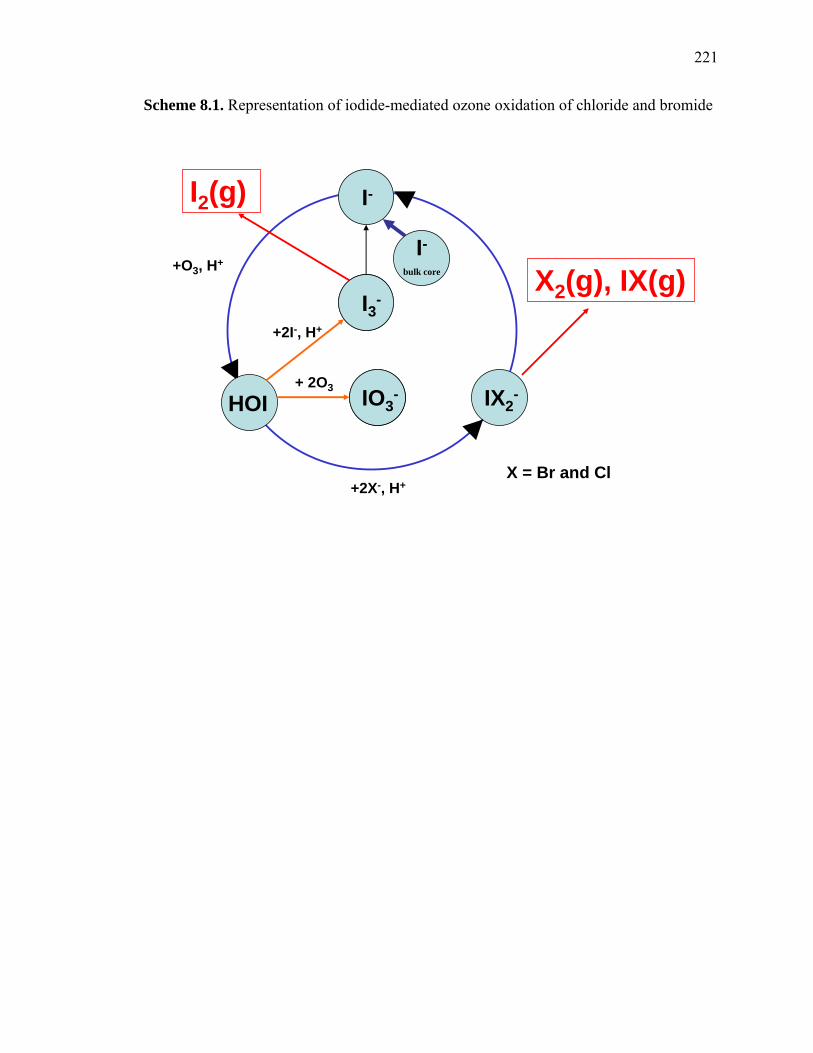
221
Scheme 8.1. Representation of iodide-mediated ozone oxidation of chloride and bromide
I-
HOI IX2-IO3
-IO3-
I3-I3-X2(g), IX(g)
I2(g)
+O3, H+
+2X-, H+
+2I-, H+
+ 2O3
X = Br and Cl
I-bulk core

222
References
(1) Barrie, L. A.; Bottenheim, J. W.; Schnell, R. C.; Crutzen, P. J.; Rasmussen, R. A.
Nature 1988, 334, 138.
(2) Sander, R.; Keene, W. C.; Pszenny, A. A. P.; Arimoto, R.; Ayers, G. P.;
Baboukas, E.; Cainey, J. M.; Crutzen, P. J.; Duce, R. A.; Honninger, G.; Huebert, B. J.;
Maenhaut, W.; Mihalopoulos, N.; Turekian, V. C.; Van Dingenen, R. Atmos. Chem.
Phys. 2003, 1301.
(3) Yang, X.; Cox, R. A.; Warwick, N. J.; Pyle, J. A.; Carver, G. D.; O'Connor, F.
M.; Savage, N. H. J. Geophys. Res. 2005, 110, D23311.
(4) Sinnhuber, B. M.; Sheode, N.; Sinnhuber, M.; Chipperfield, M. P. Atmos. Chem.
Phys. Discuss. 2006, 6497.
(5) Simpson, W. R.; Von Glasow, R.; Riedel, K.; Anderson, P.; Ariya, P.;
Bottenheim, J. W.; Burrows, J.; Carpenter, L.; Friess, U.; Goodsite, M. E.; Heard, D.;
Hutterli, M.; Jacobi, H. W.; Kaleschke, L.; Neff, B.; Plane, J.; Platt, U.; Richter, A.;
Roscoe, H.; Sander, R.; Shepson, P. B.; Sodeau, J.; Steffen, A.; Wagner, T.; Wolff, E.
Atmos. Chem. Phys. Discuss. 2007, 7, 4285.
(6) World Metereological Organization (WMO), Global Ozone Research and
Monitoring Project, Scientific Assessment of Ozone Depletion: 2002, Report No. 47;
Geneva, 2003.
(7) Sioris, C. E.; Kovalenko, L. J.; McLinden, C. A.; Salawitch, R. J.; Van
Roozendael, M.; Goutail, F.; Dorf, M.; Pfeilsticker, K.; Chance, K.; von Savigny, C.; Liu,
X.; Kurosu, T. P.; Pommereau, J. P.; Bosch, H.; Frerick, J. J. Geophys. Res. 2006, 111,
D14301.

223
(8) Dorf, M.; Butler, J. H.; Butz, A.; Camy-Peyret, C.; Chipperfield, M. P.; Kritten,
L.; Montzka, S. A.; Simmes, B.; Weidner, F.; Pfeilsticker, K. Geophys. Res. Lett. 2006,
33, L24803.
(9) Schofield, R.; Johnston, P. V.; Thomas, A.; Kreher, K.; Connor, B. J.; Wood, S.;
Shooter, D.; Chipperfield, M. P.; Richter, A.; von Glasow, R.; Rodgers, D. C. J. Geophys.
Res. 2006, 111, D22310.
(10) Salawitch, R. J. Nature 2006, 439, 275.
(11) Salawitch, R. J.; Weisenstein, D. K.; Kovalenko, L. J.; Sioris, C. E.; Wennberg, P.
O.; Chance, K.; Ko, M. K. W.; McLinden, C. A. Geophys. Res. Lett. 2005, 32, L05811.
(12) von Glasow, R.; von Kuhlmann, R.; Lawrence, M. G.; Platt, U.; Crutzen, P. J.
Atmos. Chem. Phys. 2004, 4, 2481.
(13) Li, S. M.; Yokouchi, Y.; Barrie, L. A.; Muthuramu, K.; Shepson, P. B.;
Bottenheim, J. W.; Sturges, W. T.; Landsberger, S. J. Geophys. Res. 1994, 99, 25415.
(14) Foster, K. L.; Plastridge, R. A.; Bottenheim, J. W.; Shepson, P. B.; Finlayson-
Pitts, B. J.; Spicer, C. W. Science 2001, 291, 471.
(15) Hara, K.; Osada, K.; Matsunaga, K.; Iwasaka, Y.; Shibata, T.; Furuya, K. J.
Geophys. Res. 2002, 107, D4361.
(16) Finlayson-Pitts, B. J. Chem. Rev. 2003, 103, 4801.
(17) Mochida, M.; Hirokawa, J.; Akimoto, H. Geophys. Res. Lett. 2000, 27, 2629.
(18) Lewis, E. R.; Schwartz, S. E. Sea Salt Aerosol Production: Mechanisms,
Methods, Measurements and Models—A Critical Review, Vol. Geophysical Monograph
152; American Geophysical Union: Washington, D.C., 2004.
224
(19) Murphy, D. M.; Thomson, D. S.; Middlebrook, A. M. Geophys. Res. Lett. 1997,
24, 3197.
(20) Murphy, D. M.; Cziczo, D. J.; Froyd, K. D.; Hudson, P. K.; Matthew, B. M.;
Middlebrook, A. M.; Peltier, R. E.; Sullivan, A.; Thompson, D. S.; Weber, R. J. J.
Geophys. Res. 2006, 111, D23S32.
(21) Cheng, J.; Vecitis, C.; Hoffmann, M. R.; Colussi, A. J. J. Phys. Chem. B 2006,
110, 25598.
(22) Pegram, L. M.; Record, M. T. J. Phys. Chem. B 2007, 111, 5411.
(23) Dodd, E. E. J. Appl. Phys. 1953, 24, 73.
(24) Reiter, R. J. Geophys. Res. 1994, 99, 10807.
(25) Kebarle, P. J. Mass Spectrom. 2000, 35, 804.
(26) Carpenter, L. J.; Hopkins, J. R.; Jones, C. E.; Lewis, A. C.; Parthipan, R.; Wevill,
D. J. Environ. Sci. Technol. 2005, 39, 8812.
(27) Simpson, W. R.; Alvarez-Aviles, L.; Douglas, T. A.; Sturm, M.; Domine, F.
Geophys. Res. Lett. 2005, 32, L04811.
(28) Liu, Q.; Schurter, L. M.; Muller, C. E.; Aloisio, S.; Francisco, J. S.; Margerum, D.
W. Inorg. Chem. 2001, 40, 4436.
(29) Colussi, A. J.; Baghal-Vayjooee, M. H.; Benson, S. W. J. Am. Chem. Soc. 1978,
100, 3214.
(30) Davidovits, P.; Kolb, C. E.; Williams, L. R.; Jayne, J. T.; Worsnop, D. R. Chem.
Rev. 2006, 106, 1323.
(31) Hanson, D. R. J. Phys. Chem. B 1997, 101, 4998.
(32) Bichsel, Y.; von Gunten, U. Environ. Sci. Technol. 1999, 33, 4040.
225
(33) Eigen, M.; Kustin, K. J. Am. Chem. Soc. 1962, 84, 1355.
(34) Gao, Y.; Chen, S. B.; Yu, L. E. Atmos. Environ. 2007, 41, 2019.
(35) Hunt, S. W.; Roeselova, M.; Wang, W.; Wingen, L. M.; Knipping, E. M.; Tobias,
D. J.; Dabdub, D.; Finlayson-Pitts, B. J. J. Phys. Chem. A 2004, 108, 11559.
(36) Vogt, R.; Sander, R.; von Glasow, R.; Crutzen, P. J. J. Atmos. Chem. 1999, 32,
375.
(37) Muñoz, F.; Mvula, E.; Braslavsky, S. E.; von Sonntag, C. J. Chem. Soc. Perkin
Trans. 2 2001, 1109.
(38) Bruchert, W.; Helfrich, A.; Zinn, N.; Klimach, T.; Breckenheimer, M.; Chen, H.;
Lai, S.; Hoffmann, T.; Bettmer, J. Anal. Chem. 2007, 79, 1714.
226
Chapter 9
Solar-Powered Electrochemical Production
of Molecular Hydrogen from Water
Sections reprinted with permission from Park, H.; Vecitis, C. D.; Choi, W.; Weres, O.;
Hoffmann, M. R. Journal of Physical Chemistry C 2008, 112, 4, 885–889.
© 2008 American Chemical Society
227
Abstract
Electrochemical water splitting powered by conventional electricity or photovoltaic
arrays produces molecular hydrogen at the cathode while organic compound oxidation
under mild conditions takes place at the anode in competition with the production of
oxygen. An electrolytic cell, which is based on the coupling of bismuth-doped titanium
dioxide anodes (BiOx-TiO2) with stainless steel cathodes (SS), is characterized in terms
of hydrogen production efficiency and organic compound degradation. In the solar-
powered PV-electrochemical system, the production of molecular oxygen at the anode is
suppressed by the simultaneous oxidation and mineralization of organic compounds
dissolved in water. In addition, the anodic oxidation of organic substrates has a
synergistic effect on hydrogen production at the cathode that results in a 53% increase in
the energy efficiency for H2 generation at circum-neutral pH in the presence of dilute
electrolyte solutions.
228
Introduction
At the present time, the majority of industrial-scale hydrogen is produced by steam-
methane reformation (SMR), even though the high temperature conversion of methane to
hydrogen results in the concomitant production of carbon monoxide and carbon dioxide
at a weight ratio of CO2 to H2 equal to 2.5. As a consequence, SMR has a relatively large
carbon footprint. Carbon-free water electrolysis is considered to be less attractive given
the rising costs of electricity1-3. However, the direct utilization of solar light for hydrogen
production through photocatalytic4 or photo-electrochemical5,6 water splitting may
provide an economically viable alternative source of hydrogen in the future.
There have been several previous reports of electrolysis systems powered nominally by
photovoltaic arrays7-9. The PV arrays are used to convert solar light to electricity in order
to power alkaline (e.g., 27% KOH at pH 14.7) electrolyzers for producing hydrogen gas.
However, these systems are thought to be impractical in that the cost of hydrogen is
greater than conventional DC-electrolysis, which in turn, is more expensive than SMR.
Narayanan et al. describe a DC-powered hybrid system that drives a methanol fuel cell
in reverse10, while Soler et al. report on a solar-powered photo-Fenton process that
produces hydrogen noncatalytically under severe condition with a limited number of
organic substrates11. Mathieson et al. described a hybrid electrolytic system that
functions via the induced corrosion of the anode to release the corresponding metal ions
to solution, which lead to the coagulation and subsequent removal of high-molecular-
weight organic compounds from water12. Drew et al. reported TiO2/Ru-Pt hybrid catalyst
for boosting fuel cell performance13.
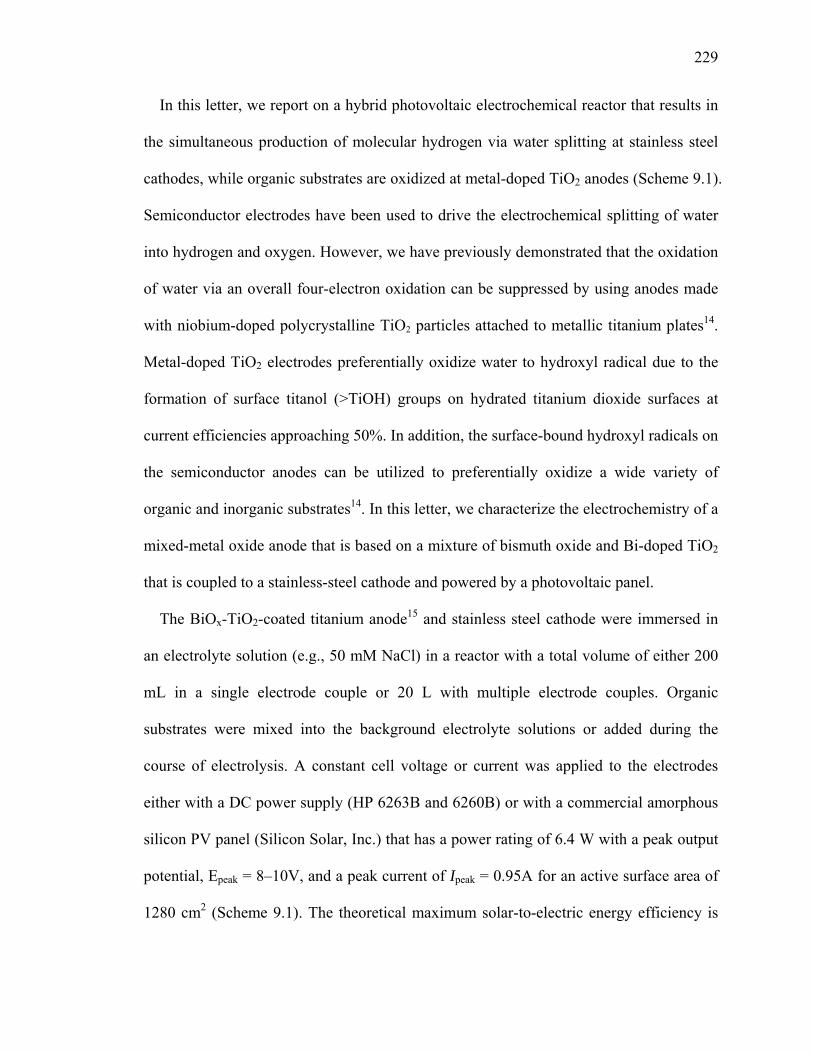
229
In this letter, we report on a hybrid photovoltaic electrochemical reactor that results in
the simultaneous production of molecular hydrogen via water splitting at stainless steel
cathodes, while organic substrates are oxidized at metal-doped TiO2 anodes (Scheme 9.1).
Semiconductor electrodes have been used to drive the electrochemical splitting of water
into hydrogen and oxygen. However, we have previously demonstrated that the oxidation
of water via an overall four-electron oxidation can be suppressed by using anodes made
with niobium-doped polycrystalline TiO2 particles attached to metallic titanium plates14.
Metal-doped TiO2 electrodes preferentially oxidize water to hydroxyl radical due to the
formation of surface titanol (>TiOH) groups on hydrated titanium dioxide surfaces at
current efficiencies approaching 50%. In addition, the surface-bound hydroxyl radicals on
the semiconductor anodes can be utilized to preferentially oxidize a wide variety of
organic and inorganic substrates14. In this letter, we characterize the electrochemistry of a
mixed-metal oxide anode that is based on a mixture of bismuth oxide and Bi-doped TiO2
that is coupled to a stainless-steel cathode and powered by a photovoltaic panel.
The BiOx-TiO2-coated titanium anode15 and stainless steel cathode were immersed in
an electrolyte solution (e.g., 50 mM NaCl) in a reactor with a total volume of either 200
mL in a single electrode couple or 20 L with multiple electrode couples. Organic
substrates were mixed into the background electrolyte solutions or added during the
course of electrolysis. A constant cell voltage or current was applied to the electrodes
either with a DC power supply (HP 6263B and 6260B) or with a commercial amorphous
silicon PV panel (Silicon Solar, Inc.) that has a power rating of 6.4 W with a peak output
potential, Epeak = 8–10V, and a peak current of Ipeak = 0.95A for an active surface area of
1280 cm2 (Scheme 9.1). The theoretical maximum solar-to-electric energy efficiency is

230
estimated to be 4.5% according to the specifications of the PV manufacturer. Solar
radiation was monitored by a pyranometer (Apogee) connected to a data-logger
(Campbell Scientific). Cell voltage (Ecell) and current (Icell) were monitored with a digital
multimeter (Fluke). The current efficiencies and the energy efficiencies are obtained as
follows in eqs. 9.1 and 9.2.
2 2 2# molecules produced (H , O , or CO ) or degraded (phenol)Current efficiency (%) = n 100# electrons
× ×
(9.1)
22
cell cell
(39W h/g H rate 2g/mol)H production energy efficiency (%) = 100E I
⋅ × ××
× (9.2)
where n = 2 and 4 for hydrogen and oxygen production cathodic current (CE) efficiencies,
respectively. For anodic current efficiencies, n = 1 for one-electron oxidation of phenol,
and n = 14/3 for complete mineralization from phenol carbon to carbon dioxide.
The electrolytic reactors were sealed to the atmosphere and the headspace gas was
extracted at a known rate by a peristaltic pump. The extracted headspace gas was pulled
through a stainless steel membrane into the vacuum chamber (5.0 × 10 torr), evacuated
by a membrane pump and a turbo pump (Pfeiffer Vacuum), where it was ionized by high-
energy electrons and analyzed by quadrupole mass spectrometry (Balzers). The volume
percent of the headspace was calculated by assuming that the observed signal intensity
was directly proportional to the ion current measured by the mass spectrometer (i.e., the
transfer of all gases through the membrane and their 70 eV electron ionization cross-
sections were roughly equivalent). This assumption is validated by the fact that ambient
air was measured to be 77% nitrogen, 17% oxygen, 5% water vapor, and 1% argon.
-6
Aqueous organic compounds including intermediates were analyzed by high
performance liquid chromatography (HPLC, Agilent 1100 series) with separation on a
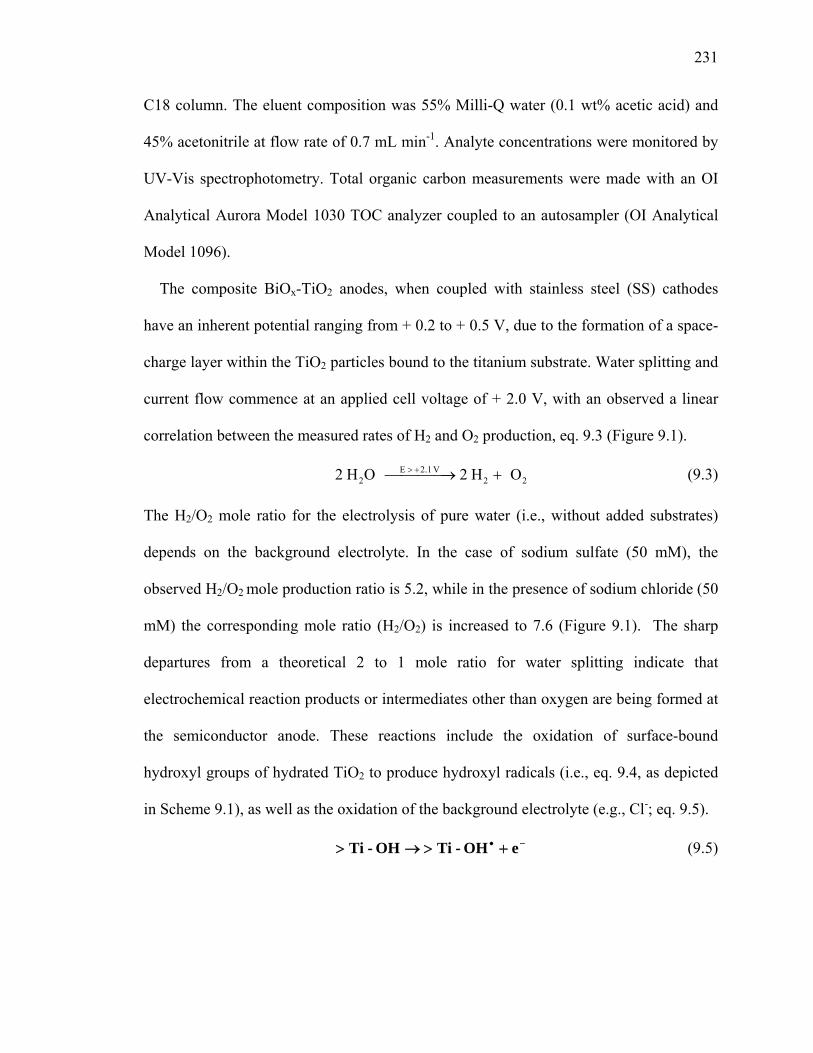
231
C18 column. The eluent composition was 55% Milli-Q water (0.1 wt% acetic acid) and
45% acetonitrile at flow rate of 0.7 mL min . Analyte concentrations were monitored by
UV-Vis spectrophotometry. Total organic carbon measurements were made with an OI
Analytical Aurora Model 1030 TOC analyzer coupled to an autosampler (OI Analytical
Model 1096).
-1
The composite BiOx-TiO2 anodes, when coupled with stainless steel (SS) cathodes
have an inherent potential ranging from + 0.2 to + 0.5 V, due to the formation of a space-
charge layer within the TiO2 particles bound to the titanium substrate. Water splitting and
current flow commence at an applied cell voltage of + 2.0 V, with an observed a linear
correlation between the measured rates of H2 and O2 production, eq. 9.3 (Figure 9.1).
(9.3) E 2.1 V22 H O 2 H O> +⎯⎯⎯⎯→ +2 2
The H2/O2 mole ratio for the electrolysis of pure water (i.e., without added substrates)
depends on the background electrolyte. In the case of sodium sulfate (50 mM), the
observed H2/O2 mole production ratio is 5.2, while in the presence of sodium chloride (50
mM) the corresponding mole ratio (H2/O2) is increased to 7.6 (Figure 9.1). The sharp
departures from a theoretical 2 to 1 mole ratio for water splitting indicate that
electrochemical reaction products or intermediates other than oxygen are being formed at
the semiconductor anode. These reactions include the oxidation of surface-bound
hydroxyl groups of hydrated TiO2 to produce hydroxyl radicals (i.e., eq. 9.4, as depicted
in Scheme 9.1), as well as the oxidation of the background electrolyte (e.g., Cl-; eq. 9.5).
(9.5) −• +>→> eOH-Ti OH-Ti

232
At applied potentials greater than 2.0 V, the one-electron oxidation of chloride
(E°(Cl•/Cl-) = 2.55 V vs. NHE) and sulfate (E°(SO4•-/SO4
2-) = 2.43 V vs. NHE) are
competitive with water oxidation.
When powered by a photovoltaic (PV) panel, the cell voltage (Ecell) of the reactor
increases to +4 V with a corresponding current (Icell) close to 0.9 A (i.e., 30 mA cm-2), as
shown in Figure 9.2. The voltage and current of the electrodes are nearly constant under
steady sunlight irradiation at a measured solar flux of 1100 W⋅m-2. The hybrid PV-
electrochemical reactor system produces hydrogen at a rate of 0.18 mmol min-1 and
oxygen at rate of 0.028 mmol min-1, which corresponds to a ratio of the rates of
production (i.e., a H2/O2 mole ratio) that is near 7.
With the addition of phenol, the hydrogen production rate is enhanced by 20 to 30%
and the oxygen production rate is slightly decreased. The overall energy efficiency for H2
production ranges from 30 to 40% depending on the PV panel output energy. The DC-
powered current efficiency for the hybrid electrolysis ranges from 70 to 95%, while the
corresponding energy efficiencies for H2 production range from 36 to 61%, depending on
operating conditions (Table 9.1). These values compare favorably with industrial-scale
electrolysis employing alkaline or proton exchange membrane electrolyzers with reported
energy efficiencies ranging from 56 to 73%. Our hybrid PV- and DC-powered systems
operate at comparable efficiencies; however, they have distinct advantages over
commercial electrolytic devices, in that the hybrid system is efficient at low electrolyte
concentrations at circum-neutral pH under ambient temperature and pressure. The overall
solar-to-hydrogen energy efficiency is thereby limited by the actual solar light energy-to-
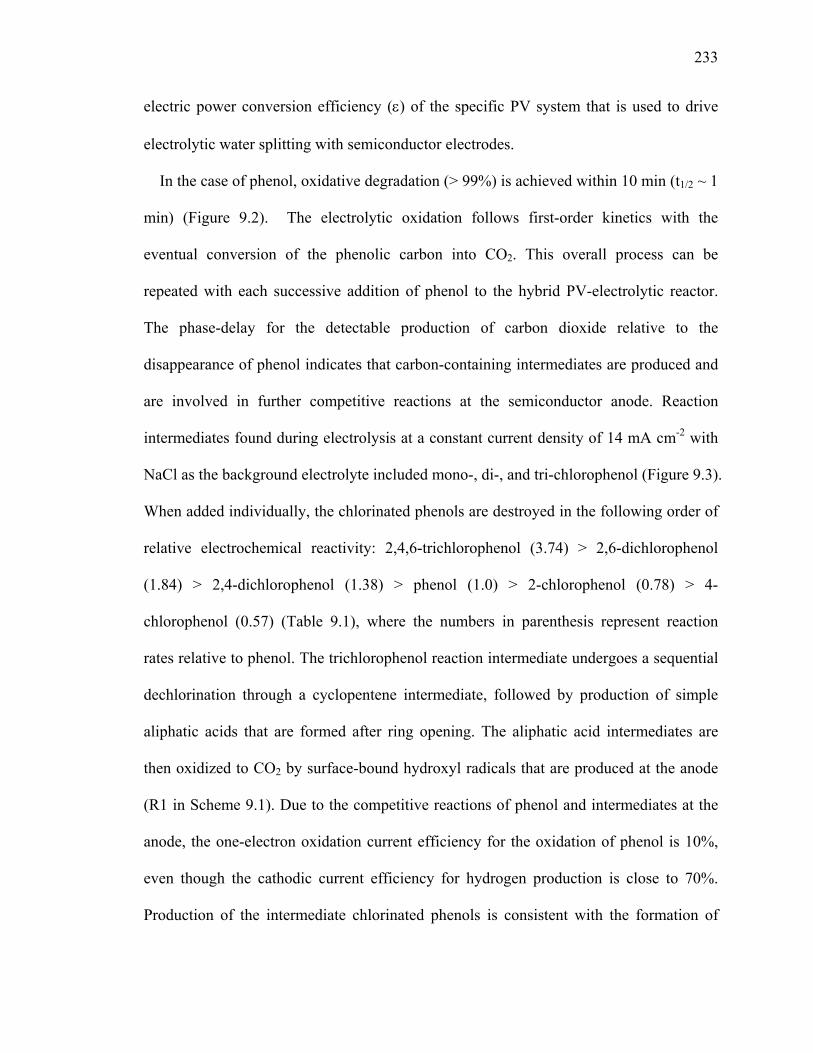
233
electric power conversion efficiency (ε) of the specific PV system that is used to drive
electrolytic water splitting with semiconductor electrodes.
In the case of phenol, oxidative degradation (> 99%) is achieved within 10 min (t1/2 ~ 1
min) (Figure 9.2). The electrolytic oxidation follows first-order kinetics with the
eventual conversion of the phenolic carbon into CO2. This overall process can be
repeated with each successive addition of phenol to the hybrid PV-electrolytic reactor.
The phase-delay for the detectable production of carbon dioxide relative to the
disappearance of phenol indicates that carbon-containing intermediates are produced and
are involved in further competitive reactions at the semiconductor anode. Reaction
intermediates found during electrolysis at a constant current density of 14 mA cm-2 with
NaCl as the background electrolyte included mono-, di-, and tri-chlorophenol (Figure 9.3).
When added individually, the chlorinated phenols are destroyed in the following order of
relative electrochemical reactivity: 2,4,6-trichlorophenol (3.74) > 2,6-dichlorophenol
(1.84) > 2,4-dichlorophenol (1.38) > phenol (1.0) > 2-chlorophenol (0.78) > 4-
chlorophenol (0.57) (Table 9.1), where the numbers in parenthesis represent reaction
rates relative to phenol. The trichlorophenol reaction intermediate undergoes a sequential
dechlorination through a cyclopentene intermediate, followed by production of simple
aliphatic acids that are formed after ring opening. The aliphatic acid intermediates are
then oxidized to CO2 by surface-bound hydroxyl radicals that are produced at the anode
(R1 in Scheme 9.1). Due to the competitive reactions of phenol and intermediates at the
anode, the one-electron oxidation current efficiency for the oxidation of phenol is 10%,
even though the cathodic current efficiency for hydrogen production is close to 70%.
Production of the intermediate chlorinated phenols is consistent with the formation of
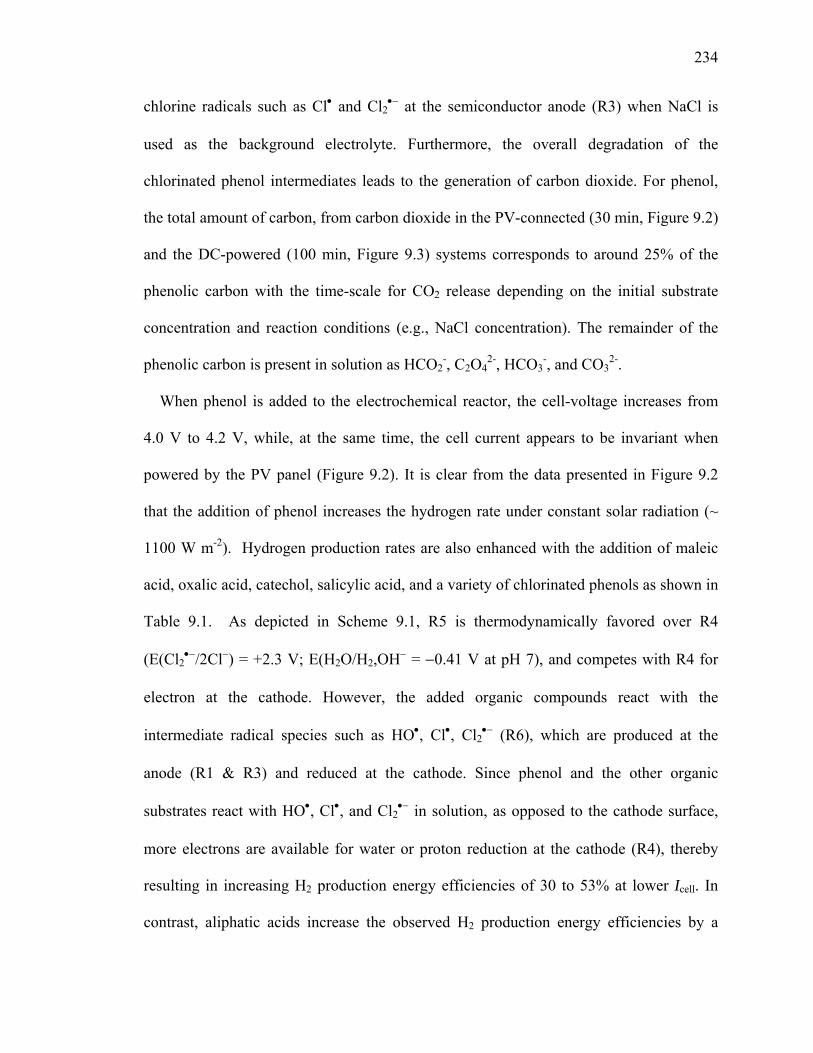
234
chlorine radicals such as Cl• and Cl2•− at the semiconductor anode (R3) when NaCl is
used as the background electrolyte. Furthermore, the overall degradation of the
chlorinated phenol intermediates leads to the generation of carbon dioxide. For phenol,
the total amount of carbon, from carbon dioxide in the PV-connected (30 min, Figure 9.2)
and the DC-powered (100 min, Figure 9.3) systems corresponds to around 25% of the
phenolic carbon with the time-scale for CO2 release depending on the initial substrate
concentration and reaction conditions (e.g., NaCl concentration). The remainder of the
phenolic carbon is present in solution as HCO2-, C2O4
2-, HCO3-, and CO3
2-.
When phenol is added to the electrochemical reactor, the cell-voltage increases from
4.0 V to 4.2 V, while, at the same time, the cell current appears to be invariant when
powered by the PV panel (Figure 9.2). It is clear from the data presented in Figure 9.2
that the addition of phenol increases the hydrogen rate under constant solar radiation (~
1100 W m-2). Hydrogen production rates are also enhanced with the addition of maleic
acid, oxalic acid, catechol, salicylic acid, and a variety of chlorinated phenols as shown in
Table 9.1. As depicted in Scheme 9.1, R5 is thermodynamically favored over R4
(E(Cl2•−/2Cl−) = +2.3 V; E(H2O/H2,OH− = −0.41 V at pH 7), and competes with R4 for
electron at the cathode. However, the added organic compounds react with the
intermediate radical species such as HO•, Cl•, Cl2•− (R6), which are produced at the
anode (R1 & R3) and reduced at the cathode. Since phenol and the other organic
substrates react with HO•, Cl•, and Cl2•− in solution, as opposed to the cathode surface,
more electrons are available for water or proton reduction at the cathode (R4), thereby
resulting in increasing H2 production energy efficiencies of 30 to 53% at lower Icell. In
contrast, aliphatic acids increase the observed H2 production energy efficiencies by a
235
smaller amount (~ 10%) due to their slower oxidation kinetics and lesser radical (e.g.,
Cl2•−) reaction rates.
We envision that hybrid PV electrochemical systems could be used for solar-powered
water purification, coupled with the generation of a potentially useful and energy rich
byproduct. Also, solar light could be directly irradiated to the anode connected to PV to
boost the organic oxidation and give much greater synergy effects on the hydrogen
production.
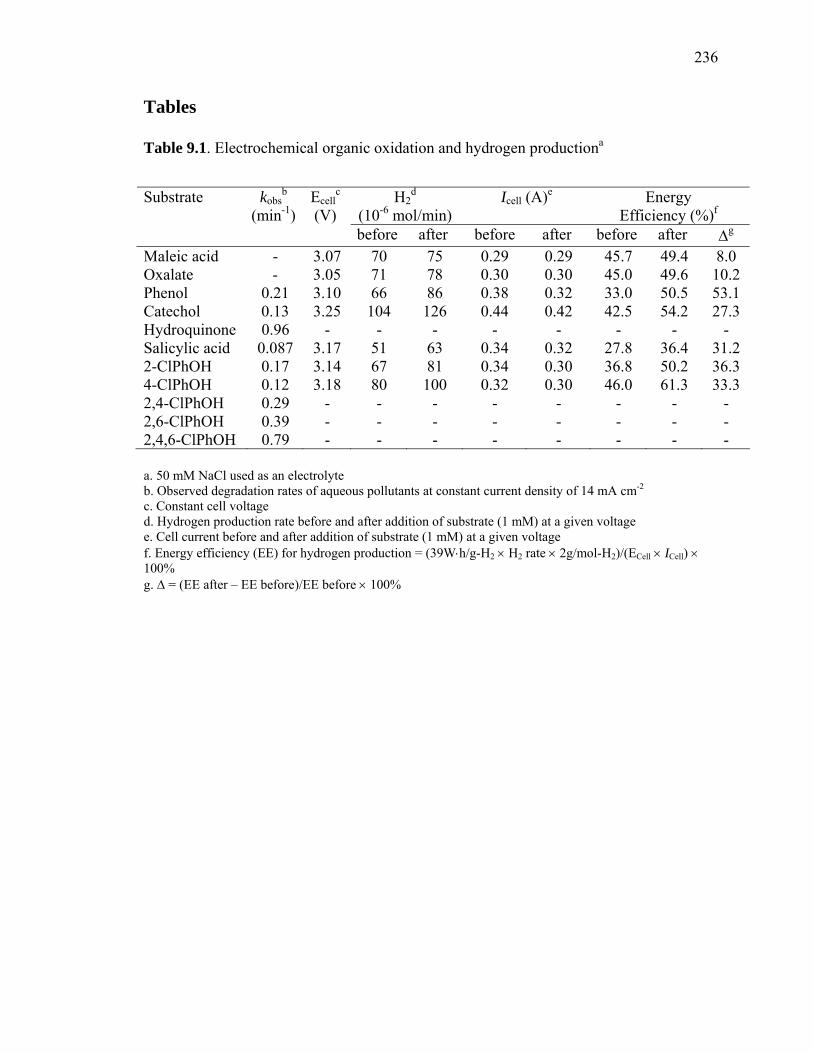
236
Tables
Table 9.1. Electrochemical organic oxidation and hydrogen productiona
a. 50 mM NaCl used as an electrolyte b. Observed degradation rates of aqueous pollutants at constant current density of 14 mA cm-2
c. Constant cell voltage d. Hydrogen production rate before and after addition of substrate (1 mM) at a given voltage e. Cell current before and after addition of substrate (1 mM) at a given voltage f. Energy efficiency (EE) for hydrogen production = (39W⋅h/g-H2 × H2 rate × 2g/mol-H2)/(ECell × ICell) × 100% g. Δ = (EE after – EE before)/EE before × 100%
H2d
(10-6 mol/min) Icell (A)e Energy
Efficiency (%)fSubstrate kobs
b Ecellc
(min-1) (V) before after before after before after Δg
Maleic acid - 3.07 70 75 0.29 0.29 45.7 49.4 8.0 Oxalate - 3.05 71 78 0.30 0.30 45.0 49.6 10.2 Phenol 0.21 3.10 66 86 0.38 0.32 33.0 50.5 53.1 Catechol 0.13 3.25 104 126 0.44 0.42 42.5 54.2 27.3 Hydroquinone 0.96 - - - - - - - - Salicylic acid 0.087 3.17 51 63 0.34 0.32 27.8 36.4 31.2 2-ClPhOH 0.17 3.14 67 81 0.34 0.30 36.8 50.2 36.3 4-ClPhOH 0.12 3.18 80 100 0.32 0.30 46.0 61.3 33.3 2,4-ClPhOH 0.29 - - - - - - - - 2,6-ClPhOH 0.39 - - - - - - - - 2,4,6-ClPhOH 0.79 - - - - - - - -

237
Figures
Figure 9.1. Electrochemical H2 and O2 production. A) Real-time profiles of H2 and O2 as
a function of cell voltage (Ecell). B) Effects of Ecell on cell current (Icell). C) Icell vs. the H2
and O2 production rates in different supporting electrolyte medium (Na2SO4 vs. NaCl). 50
mM NaCl or 50 mM
Time (min)0 20 40 60 80 100
Rat
e ( μ
mol
/min
)
0
100
200
300
400
500
2.674
3.06
3.35
3.86
4.28
A H2
O2
NaCl
Ecell (V)0 1 2 3 4 5
I cell (
mA
/cm
2 )
0
10
20
30
40
50
Rat
e ( μ
mol
/min
)
0
100
200
300
400
500
Current
HydrogenOxygen
B Ecell = 2.0 V
C
Icell (mA/cm2)0 10 20 30 40 50 60
Rat
e ( μ
mol
/min
)
0
100
200
300
400
500
600(Na2SO4) H2 slope: 11.08; R2 = 0.996
(Na2SO4) O2 slope: 2.138; R2 = 0.994
(NaCl) H2 slope: 9.056; R2 = 0.999
(NaCl) O2 slope: 1.193; R2 = 0.990
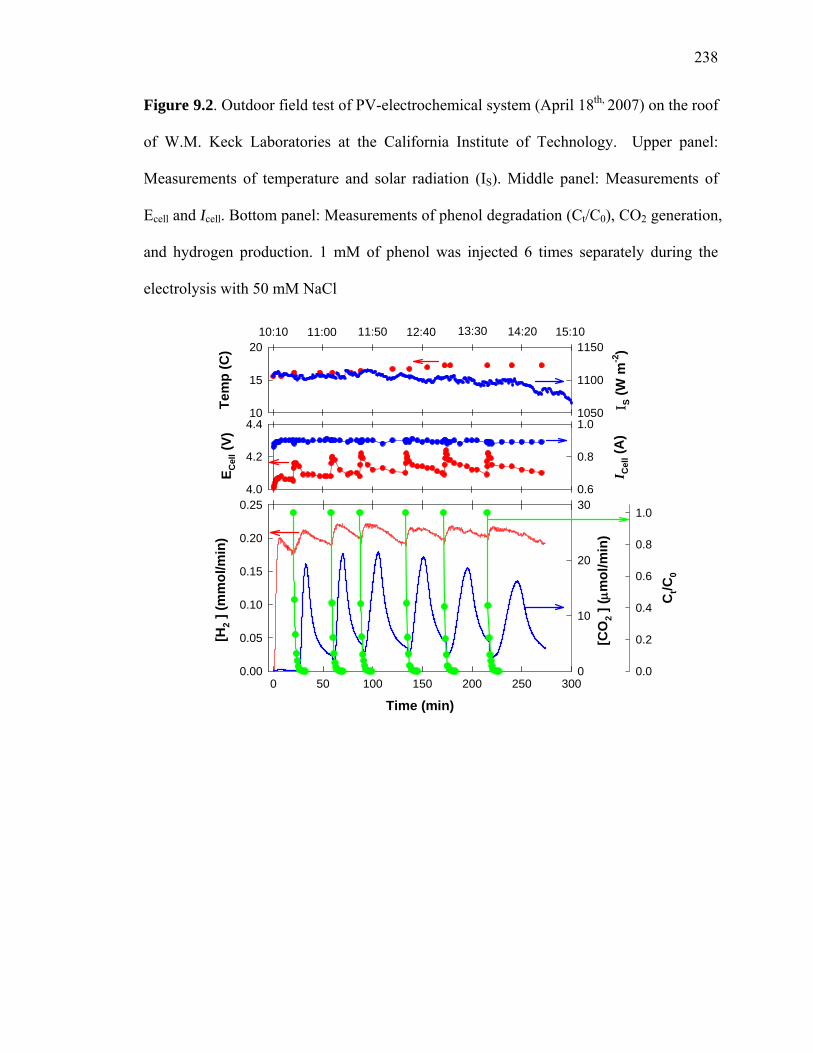
238
Figure 9.2. Outdoor field test of PV-electrochemical system (April 18th, 2007) on the roof
of W.M. Keck Laboratories at the California Institute of Technology. Upper panel:
Measurements of temperature and solar radiation (IS). Middle panel: Measurements of
Ecell and Icell. Bottom panel: Measurements of phenol degradation (Ct/C0), CO2 generation,
and hydrogen production. 1 mM of phenol was injected 6 times separately during the
electrolysis with 50 mM NaCl
Time (min)0 50 100 150 200 250 300
[H2 ]
(mm
ol/m
in)
0.00
0.05
0.10
0.15
0.20
0.25
[CO
2 ] ( μ
mol
/min
)
0
10
20
30
Ct/C
00.0
0.2
0.4
0.6
0.8
1.0
Tem
p (C
)
10
15
20
Ι S (W
m-2
)
1050
1100
1150
E Cel
l (V)
4.0
4.2
4.4
I Cel
l (A
)
0.6
0.8
1.0
10:10 11:00 11:50 12:40 13:30 14:20 15:10
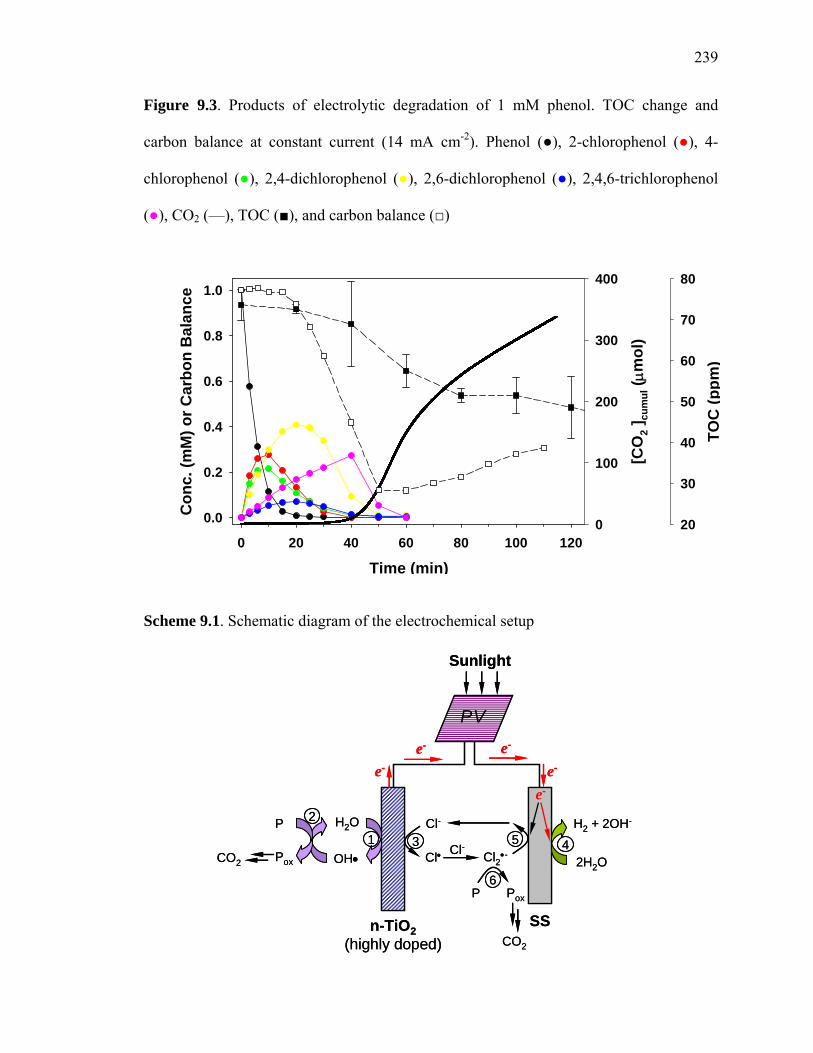
239
Figure 9.3. Products of electrolytic degradation of 1 mM phenol. TOC change and
carbon balance at constant current (14 mA cm-2). Phenol (), 2-chlorophenol (), 4-
chlorophenol (), 2,4-dichlorophenol (), 2,6-dichlorophenol (), 2,4,6-trichlorophenol
(), CO2 (—), TOC (), and carbon balance ()
Time (min)0 20 40 60 80 100 120
Con
c. (m
M) o
r Car
bon
Bal
ance
0.0
0.2
0.4
0.6
0.8
1.0
[CO
2 ]cu
mul
( μm
ol)
0
100
200
300
400
TOC
(ppm
)
20
30
40
50
60
70
80
Scheme 9.1. Schematic diagram of the electrochemical setup
H2O
OH•
P
PoxCO2
Cl-
Cl• Cl- Cl2•-
P Pox
CO2
2H2O
H2 + 2OH-
PV
e-e- e-
e-
e-
Sunlight
n-TiO2(highly doped)
SS
PV
1
2
3 45
6
H2O
OH•
P
PoxCO2
Cl-
Cl• Cl- Cl2•-
P Pox
CO2
2H2O
H2 + 2OH-
e-e- e-
e-
e-
Sunlight
n-TiO2(highly doped)
SS
2
1 53 4
6
240
References
1. Turner, J. A. Science 2004, 305, 972.
2. Solar and Wind Technologies for Hydrogen Production, available at
http://www.hydrogen.energy.gov/congress_reports.html.
3. Ivy, J. Summary of Electrolytic Hydrogen Production: Milestone Completion
Report, available at www.nrel.gov/hydrogen/pdfs/36734.pdf.
4. Maeda, K.; Teramura, K.; Lu, D. L.; Takata, T.; Saito, N.; Inoue, Y.; Domen, K.
Nature 2006, 440, 295.
5. Grätzel, M. Nature 2001, 414, 338.
6. Khaselev, O.; Turner, J. A. Science 1998, 280, 425.
7. Friberg, R. Int. J. Hydrogen Energy 1993, 18, 853.
8. Ahmad, G. E.; El Shenawy, E. T. Renewable Energy 2006, 31, 1043.
9. Lehman, P. A.; Chamberlin, C. E.; Pauletto, G.; Rocheleau, M. A. Int. J.
Hydrogen Energy 1997, 22, 465.
10. Narayanan, S. R.; W., C.; Jeffries-Nakamura, B.; Valdez, T. I. Hydrogen
Generation by Electrolysis of Aqueous Organic Solutions; U.S. Patent 6,368,492;
Apr. 9, 2002.
11. Soler, L.; Macanas, J.; Munoz, M.; Casado, J. Int. J. Hydrogen Energy 2006, 31,
129.
12. Mathieson, G.; Langdon, A.; Jamieson, G. Dev. Chem. Eng. Mineral Process
2006, 14, 71.
13. Drew, K.; Girishkumar, G.; Vinodgopal, K.; Kamat, P.V. J. Phys. Chem. B 2005,
109, 11851.
241
14. Kesselman, J. M.; Weres, O.; Lewis, N. S.; Hoffmann, M. R. J. Phys. Chem. B
1997, 101, 2637.
15. Weres, O. Electrode with Surface Comprising Oxides of Titanium and Bismuth
and Water Purification Process Using This Electrode; U.S. Patent 0,000,774
A1; Jan. 4, 2007.
242
Chapter 10
Electrochemical Anodic Oxidation of
Organic Compounds Coupled with the
Cathodic Production of Molecular Hydrogen
Sections reprinted with permission from Park, H.; Vecitis, C. D.; Hoffmann, M. R.
Journal of Physical Chemistry A 2008, 112, 33, 7616-7626.
© 2008 American Chemical Society
243
Abstract
A Bi-doped TiO2 anode, which is prepared from a mixed-metal oxide coating deposited
on Ti metal, coupled with a stainless steel cathode is shown to be efficient for
conventional water splitting. In this hybrid photovoltaic/electrochemical system, a
photovoltaic (PV) cell is used to convert solar light to electricity, which is then used to
oxidize a series of phenolic compounds at the semiconductor anode to carbon dioxide,
with the simultaneous production of molecular hydrogen from water/proton reduction at
the stainless steel cathode. Degradation of phenol in the presence of a background NaCl
electrolyte produces chlorinated phenols as reaction intermediates which are
subsequently oxidized completely to carbon dioxide and low-molecular-weight
carboxylic acids. The anodic current efficiency for the complete oxidation of phenolic
compounds ranges from 3 to 17%, while the cathodic current efficiency and the energy
efficiency for hydrogen gas generation ranges from 68 to 95% and from 30 to 70%,
respectively.

244
Introduction
Hydrogen is under consideration as a viable alternative and renewable energy source.
This is partially due to the increasing price of fossil fuels and a growing demand for fuels
that are carbon-free and therefore environmentally benign1–3. In the United States alone,
the hydrogen market was estimated to have an economic value of $798 million in 2005;
this number is expected to rise to $1,600 million in 20103. Hydrogen is produced
primarily by steam-methane reformation (SMR). SMR accounts for 95% and 48% of all
hydrogen produced in the U.S. and in the world, respectively. However, the SMR process
has a large carbon footprint in the form of carbon dioxide and carbon monoxide
emissions. For example, the carbon released during SMR is 2.5 times by mass greater
than the hydrogen produced.
Electrochemical water splitting (i.e., electrolysis) provides a zero-carbon alternative to
SMR. However, the major component of the cost of electrolytic hydrogen production is
not the energy efficiency, but the price of electricity. In this regard, the U.S. Department
of Energy (DOE) has established a target energy efficiency of 76% (corresponding to
$2.75/GGE H2) for electrolytic hydrogen generation (e.g., alkaline electrolyzers or proton
exchange membrane electrolyzers) by 2015. The current average for commercial
electrolyzers is 62%4. In order to reduce the overall cost of the electrolysis, low-cost,
renewable energy sources, such as solar light, should be utilized as an energy source.
Alternatively, the overall costs could also be reduced by implementation of a dual-
purpose electrolytic system that couples hydrogen generation with energy-intensive water
or wastewater treatment.

245
The underlying concept of solar-light driven (PV) electrolysis for hydrogen production
has been previously suggested and evaluated5–9. The primary objective is to produce
hydrogen as a storable fuel of high energy density for the dark generation of electricity.
This approach is an alternative to a battery-based storage system. However, the PV-
electrolyzer-hydrogen systems were determined to be economically impractical as
compared to the PV-electricity-battery systems, due to inefficiencies of converting
electrons to hydrogen. Thus it is suggested to simultaneously treat wastewater by
electrolysis to improve overall energy efficiencies. Hybrid systems which electrolytically
produce hydrogen while simultaneously oxidizing organic substrates have also been
reported10–12. However, the previously reported systems operate noncatalytically, with
much lower efficiencies, and require severe conditions (e.g., pH < 2, molar ranges of
reagents), making them nonpractical.
Therefore, in order to address the goal of PV-driven electrolytic hydrogen production
with simultaneous oxidation of wastewater constituents, we have combined a stainless-
steel (SS) cathode for reductive hydrogen production with a Bi-doped TiO2 anode for
oxidative organic destruction. It was determined that the hybrid electrolysis system
operates catalytically (addition of organics increases H2 production efficiencies) under
mild conditions (50 mM salt) with relatively high efficiencies (30% to 70% H2 energy
efficiencies).
The details of the electrochemistry give insight into these processes. The anode
generates oxidizing radical species (e.g., OH•, Cl•) (eq. 10.1), which subsequently react
with aqueous pollutants while the cathode splits water into hydrogen (eq. 10.2). Oxygen
evolution via water oxidation (eq. 10.3) is normally the complementary reaction to H2
246
production (eq. 10.2) and thus the generation of radical species (eq. 10.1) at the anode
results in nonstoichiometric water splitting (i.e., H2/O2 > 2).
H2O → OH• + H+ + e− (E° = 2.74 V vs. NHE) (10.1)
2H2O + 2e− → H2 + 2OH− (E° = 0 V) (10.2)
2H2O → O2 + 4H+ + 4e− (E° = 1.23 V) (10.3)
CxHyOz + (x + 0.25y – 0.5z) O2 → xCO2 + 0.5 yH2O (10.4)
Previously, we developed a Nb4+-doped polycrystalline TiO2 anode, which generated
hydroxyl radical via one-electron oxidation of water at average current efficiencies of
50%13-16. However, a newer, more robust, and longer lived semiconductor anode based
on a mixed metal oxide of BiOx-TiO2 has been developed. This anode operates at current
efficiencies in the range of 20 to 30%17. In this study, a BiOx-TiO2 anode is coupled with
stainless steel cathode and powered by a photovoltaic (PV) array to oxidize organic
substrates while simultaneously generating molecular hydrogen (Scheme 10.1)18,19.
Phenol is used as a model chemical substrate as phenolic compounds are a common
contaminant present in industrial (solvents) and municipal (detergent by-products)
wastewater20,21.
Experimental Methods
Electrodes
The anode was prepared as follows: 1) A Ti metal sheet (Ti-Gr.2 sheet, 0.50 mm thick)
was cleaned using SiC paper (120 to 240 grit) before coating with a sequence of
substrates (Scheme 10.2a). 2) An initial metal oxide coating containing Ir and Ta oxides
at an Ir:Ta = mole ratio of 0.67:0.33 is deposited and annealed to the Ti metal base. 3) A
second metal oxide coating of Bi-doped SnO at a Sn:Bi mole ratio of 0.9:0.1 is applied 2
247
and annealed. 4) A third layer of Bi-doped TiO at a Ti:Bi mole ratio of 0.96:0.04 is
applied and annealed at high temperature. 5) The final step involves the deposition of the
anodically active overcoat that also contains Bi-doped TiO at a Ti:Bi mole ratio of
0.9:0.1. Each successive step of coating requires a specific heat-treatment regime at
different temperatures and durations. More details are provided elsewhere . Two types
of anode-cathode couples were used for the experiments reported herein. The first couple
is composed of a single anode with an active area of contact with the electrolyte solution
of 10.0 × 2.0 cm , and two-piece stainless-steel (SS) cathodes (Hastelloy C-22) of the
same size on both sides (i.e., a sandwich configuration) of the Bi-doped TiO anode, at a
separation distance of 2 mm. The second configuration involves a small pilot-scale
reactor consisting of 5 anode plates (5 pieces × 800 cm /piece) and 6 stainless steel
cathode plates that face each other with a distance of separation of 2 mm (Scheme 10.2b).
2
2
17
2
2
2
Electrolysis Experiments
The BiOx-TiO2 anode and SS cathode couple was immersed in an aqueous electrolyte
solution of 50 mM NaCl (200 mL or 20 L) and was stirred under continuous purging with
air or nitrogen as a background carrier gas. The target substrates (e.g., phenol) were
mixed in with a background electrolyte or added during the course of electrolysis. A
constant cell voltage or current was applied to the electrodes with a DC power supply
(HP 6263B and 6260B). For the PV-powered electrolyses, a commercial thin film,
amorphous silicon PV (Silicon Solar, Inc.) with a peak power output of 6.4 W (PVpeak =
Epeak ×Ipeak; Epeak = 8 – 10 V; Ipeak = 0.95A) and with active surface area of 1280 cm2 was
used (Scheme 9.1). Incident solar radiation was monitored and recorded with a
pyranometer (Apogee) connected to a datalogger (Campbell Scientific). Cell voltage (Ecell)
248
and cell current (Icell) were measured by multimeters (Fluke). The current efficiencies
(CEs) and the energy efficiencies (EEs) for hydrogen production (i.e., higher heating
value) were obtained by the following equations 10.5–10.9
2 2 2Number of molecules produced (H , O , or CO ) or degraded (phenol)CE (%) = ×n×100Number of electrons flowed
(10.5)
22
cell cell
(39 W h/g H rate 2 g/mol)DC or PV-powered Electrolytic H EE = 100%E I
⎛ ⎞⋅ × ××⎜ ⎟×⎝ ⎠
(10.6)
cell cell cellPV = E (applied to the cell reactor)I× (10.7)
cellcell -2 2
PV (W)Solar-to-PV EE = 100%Solar Flux (W cm ) PV Area (cm )
⎛ ⎞×⎜ ⎟×⎝ ⎠
(10.8)
( )22Solar-to-H EE = Electrolytic H EE Solar-to-PV EE 100%× × (10.9)
where n = 2 and 4 for hydrogen and oxygen production in cathodic current efficiencies
(CCEs), respectively. For the anodic current efficiencies (ACEs), n = 1 for one-electron
oxidation of phenol (ACE-I), and n = 14/3 for complete oxidation from carbon at phenol
to carbon at carbon dioxide (ACE-II).
Analytical Procedures
The reactor was sealed from the ambient atmosphere. At a given rate, the headspace
gas of the reactor was extracted with a peristaltic pump and extracted by a differentially
pumped membrane inlet into a low-pressure cell with a quadrupole mass spectrometry
(Balzers) via a turbo pump (Pfeiffer; 5.0 × 10 torr). The volume percent of various gases
in the headspace was calculated assuming that the percent was directly proportional to the
ion current measured by the mass spectrometer, and that the transfer of all gases through
-6
249
the membrane and their 70 eV electron ionization cross-sections were approximately
equivalent. This assumption was validated in part since ambient air was measured to be
77% nitrogen, 17% oxygen, 5% water vapor, and 1% argon.
Aqueous organic compounds including intermediates were analyzed by a high-
performance liquid chromatography (HPLC, Agilent 1100 series) with a C18 column.
The eluent was composed of 55% Milli-Q water (0.1 wt% acetic acid) and 45%
acetonitrile at flow rate of 0.7 mL/min. Analyte concentration was monitored by UV-Vis
spectrophotometry. Total organic carbon was determined (TOC, OI Analytical Aurora
Model 1030) with an autosampler (OI Analytical Model 1096).
Results and Discussion
Electrolytic Nonstoichiometric Water Splitting
Figure 10.1 shows a typical DC-powered electrolysis at the BiO -TiO anode coupled
to the stainless-steel cathode couple in the presence of sodium chloride as a supporting
electrolyte. Water splitting is initiated at 2.0V which is approximately 0.8 V higher than
the ideal potential (E° = 1.23 V). The rates of H production and O production increase
with increasing cell voltage (E ). Furthermore, cell currents (I ) also increase in a
linear fashion with increasing E above 2.1V. The rates of formation of H and O ,
respectively, are 9.0 μmol/min per mA/cm and 1.3 μmol/min per mA/cm , which
correspond to nonstoichiometric H to O ratios between 6 and 7, depending on the
specific experimental conditions. This indicates additional anodic reactions (eq. 10.1) as
well as water oxidation (eq. 10.3) takes place simultaneously at the anode. Water
oxidation at the surface of a semiconducting, metal oxide (MO) anode like TiO is known
to proceed by the coupling of two surface-bound hydroxyl radicals (eq. 10.10 & 10.11).
x 2
2 2
cell cell
cell 2 2
2 2
2 2
2
250
≡Ti-OH+ H O → ≡Ti-OH[OH ] + H + e (10.10) 2•
ad+ −
2≡Ti-OH[OH ] → 2≡Ti-OH + O + 2H + 2e (10.11) •ad 2
+ −
The current efficiencies for the hydrogen production at the SS cathode are close to 70%
while those for the oxygen production at the BiO -TiO anode are in the range of 10 to
25% (Figure 10.1c). In spite of an initial N atmosphere, H O can be produced via
superoxide/hydroperoxyl radical pathway at the cathode (eqs. 10.12 to 10.14) due to
oxygen reduction.
x 2
2 2 2
O + e → O (at the SS) (10.12) 2−
2−
O + H → HOO (pK = 4.88) (10.13) 2− + •
a
2 HOO → H O + O (10.14) •2 2 2
The cathodic reaction 10.12 will limit the current efficiency for the hydrogen production.
The energy efficiencies, which are expressed in terms of Higher Heating Values (HHV)
for H production, are in the range of 35 to 60% (Figure 10.1d). This value decreases
with increasing applied power. However, the energy efficiency can be improved, either
by reducing the ohmic potential drop in the cell by increasing electrolyte concentration,
or by coating noble metal (e.g., Pt) on the stainless-steel cathode.
2
Electrochemical Oxidation of Organic Compounds
The electrochemical oxidation and complete degradation of phenol at current density
of I = 14 mA/cm is shown in Figure 10.2. Phenol is completely degraded following first-
order kinetics with an apparent half-life of t = 4.25 min.
2
1/2 The end-product of phenol
oxidation, CO2, is initially detected after 38 min of electrolysis (Figure 10.2a). Under
these conditions, the H2 production rate (i.e., 95 μmol/min) is reduced slightly to 90
μmol/min, concomitant with initiation of CO2 production, while the O2 production rate

251
remains steady at 15 μmol/min. As phenol degrades, mono-, di-, and trichlorinated
phenols are formed as intermediates by stepwise chlorination of the parent phenol. The
chlorinated phenols are completely decomposed within 1 h (Figure 10.2b and Scheme
10.2). When added separately, the chlorinated phenols are degraded with similar kinetics
to phenol in following order of electrochemical reactivity: 2,4,6-trichlorophenol (3.74) >
2,6-dichlorophenol (1.84) > 2,4-dichlorophenol (1.38) > phenol (1.0) > 2-chlorophenol
(0.78) > 4-chlorophenol (0.57). The numbers in parenthesis are observed reaction rates
relative to phenol. At around 40 min of electrolysis, trichlorophenol begins to degrade
rapidly (Figure 10.2a) and at the same time carbon dioxide release begins (Figure 10.2a).
The total organic carbon (TOC) concentration also begins to decrease dramatically at this
time (Figure 10.2c), consistent with CO2 production. It is notable that after 2 h
electrolysis the total amount of CO2 released accounts for 25% of the initial amount of
carbon present in phenol, while carbon removal based on TOC measurements is close to
34%. The “apparent carbon deficit” (~ 9%) consists of dissolved carbonate (CO32−) and
bicarbonate (HCO3−), which are removed by acidification prior to actual TOC
measurements.
The phenol oxidation intermediates observed during the electrolytic degradation of
phenol vary depending on the composition of anode surface and on the nature of the
supporting electrolyte. In the case of Na2SO4, oxygenated or hydroxylated phenols such
as catechol, hydroquinone, and benzoquinone are observed as the primary aromatic
intermediates22–26. In contrast, for NaCl, a carbon-based anode produces chlorinated
phenols as intermediates and SnO2/Ti and IrO2/Ti anodes produce nonchlorinated
intermediates27. The electrolysis with NaCl as a background electrolyte is reported to
252
generate active chlorine species, such as chlorine radical (Cl•), dichloride radical anion
(Cl2•−), and hypochlorous acid/hyperchlorite (HOCl/OCl−) via surface-bound hydroxyl
radical mediated pathways (eqs. 10.15–10.18).
≡Ti-OH[OH ] + Cl → ≡Ti-OH + Cl•ad
− • + HO− (10.15)
Cl• + Cl → − Cl2•− (K = 1.4 × 10⁵ M-1) (10.16)
≡Ti-OH[OH•]ad + Cl− → ≡Ti-OH + HOCl + e− (10.17)
HOCl → OCl− + H+ (pKa = 7.46) (10.18)
The rate constants for the reaction of hydroxyl radical, chlorine radical, dichloride radical
anion, and HClO with phenol are 6.6×10⁹ M-1s-1,28 2.5×10¹⁰ M-1s-1, 2.5×10⁸ M-1s-1, and
2.2×10⁴ M-1s-1 29,30, respectively. As a consequence, phenol and its oxidation
intermediates have a variety of degradation pathways, including surface-bound/free
hydroxyl radicals, chlorine radicals, dichloride radical anions, hypochlorite ions, and
possibly hydrogen peroxide as well.
As the current density is increased from 7 to 38 mA/cm2, the half life (t1/2) for phenol
oxidation along with the anodic current efficiency (ACE-II) for complete oxidation of
phenol carbon (formal charge -2/3) to carbon dioxide (formal charge +4) decreases
(Figure 10.3). The faster phenol oxidation rates yield shorter CO2 release phase-delays of
60 to 15 min. However, the amount of carbon dioxide released during the course of the
electrolysis and the anodic current efficiency (ACE-I) for one-electron oxidation of
phenol (PhOH → PhOH+ + e−) is not altered significantly (Figure 10.3c). In addition,
cathodic current efficiency (CCE) for hydrogen production is almost invariable in the
range of 50 to 70%.
253
The initial concentration of phenol markedly affects the apparent degradation rate. The
half life grows linearly with concentration over the range of 0.5 to 2.0 mM (Figure 10.4)
and increases by two orders of magnitude at higher concentrations (i.e., t1/2 = 1.28 min at
0.5 mM and t1/2 = 150 min at 10 mM). As the concentration of phenol is increased, a
greater number of reaction intermediates are produced, which in turn compete with
phenol for oxidants. This should result in both a decrease in t1/2 and a lengthening of the
release onset time of carbon dioxide. The anodic current efficiency (ACE-I) is lowered
somewhat to 8% at concentrations above 1.0 mM, while the ACE-II ranges from 5 to
10%. On the other hand, CCE is invariable (~ 68%) to increasing the initial phenol
concentration. This indicates that anodic radical production and subsequent organic
oxidation has minimal effects on the hydrogen production as long as substrates are
initially present in the medium. A comparison of hydrogen production with and without
organic substrates suggests addition of aqueous pollutants synergistically enhances the H2
production rate18,19.
The electrolytic efficiency of Na2SO4 vs. NaCl as background electrolyte was also
compared. The phenol degradation rate in NaCl is two orders of magnitude faster than
that in Na2SO4 (Figure 10.5). Sodium phosphate and carbonate have similar effects to
sodium sulfate as background electrolytes. However, the cathodic H2 production
efficiency using Na2SO4 as an electrolyte is 23% greater than NaCl. When 50 mM NaCl
is added to a 50 mM Na2SO4 solution at increasing concentrations, the phenol
degradation efficiency increases while the H2 production efficiency decreases (i.e., CCE
at 50 mM Na2SO4 = 95%; CCE at 50 mM Na2SO4 + 50 mM NaCl = 73%; CCE at 50 mM

254
NaCl = 68%). This indicates the anode is oxidatively active during generation of chlorine
radical species and suggests these chlorine radicals can interrupt H2 production.
During the course of electrolysis of water and electrolyte alone, the pH of solution
rises initially from pH 6 to 10 and then remains constant throughout. After current is
removed, the pH decreases to 9.5 (Figure 10.6). In contrast, when electrolysis takes place
in the presence of phenol, the pH increases initially to 11 and then decreases quickly to
pH 7 after 20 min, and then remains in the circum-neutral range (~ pH 7.5) during the
latter stages of electrolysis. The cathodic reduction of protons results in a rise in the
measured pH. However, the progressive oxidation of phenol eventually produces organic
acids such as oxalic, maleic, and formic acid, which account for the subsequent drop in
pH. Eventually, these daughter acids are further degraded at the anode surface by
surface-bound hydroxyl radicals to aqueous CO2 (e.g., CO2⋅H2O, HCO3−, CO3
2−) with the
subsequent release of gaseous CO2 accounting for the slight increase of the pH after 38
min of electrolysis (Scheme 10.2). This is the time that measurable CO2 is released from
the reactor (Figure 10.2a vs. Figure 10.6).
At pH 10, phenol is partially deprotonated (pKa = 9.98) while the BiOx-TiO2 anode due
to the presence of Lewis acid metals (e.g., Bi) at the surface should be positively charged
despite the predominance of TiO2 (pHzpc of TiO2 ~ 6.8). Thus, the ability of phenol to
react directly at the anode surface at pH 10 is possible but the degree of interaction is
unlikely to be strong. In contrast, substrates that are able to strongly adsorb to the anode
via surface complexation should be oxidized quickly and immediately release CO2 by
multi-electron transfers instead of sequential one-electron transfers. This conjecture is
confirmed by the results shown in Figure 10.7 for the oxidation of catechol (pKa1 = 9.45;

255
pKa2 = 12.8)31. Catechol functions as a monodentate or a bidentate ligand binding at one
or two surface titanol groups. Thus as soon as the electrolysis is initiated, CO2 is
immediately released from solution and continues over the 2 hour period of electrolysis.
Salicylic acid (pKa1 = 2.97; pKa2 = 13.74) also shows the same behavior. Both
compounds have been observed to chelate TiO2 surfaces (as depicted on the right-hand
side of Figure 10.7)31,32, and multiple electrons can be transferred to the anode within
seconds after the initiation of electrolysis. Nevertheless, the first-order rate constants for
degradation of catechol and salicylic acid are lowered by approximately 50% compared
to phenol (kcatechol/kphenol = 0.59; ksalicylic acid/kphenol = 0.41). In the case of phenol, oxidation
primarily occurs on homogeneously distributed phenol molecules (and intermediates) in
the bulk solution, whereas in the cases of catechol and salicylic acid, the oxidation
preferentially occurs to the adsorbed molecules rather than the ones remaining in the bulk.
This should result in immediate and complete oxidation of the adsorbed phenol molecules,
but a slower oxidation rate of the phenol molecules in the bulk solution.
Solar Powered Electrolysis and Scale-Up
Figure 10.8 shows the hydrogen production and organic oxidation results of a PV-
driven hybrid reactor system under two different solar light irradiation conditions. The
total incident solar light radiation energy of A (I ) is measured at 0.107 ± 0.005 W/cm ,
while that of B (I ) is around 0.100 ± 0.005 W/cm . The overall reaction scheme is
similar to that in Figure 10.2a. As soon as the PV is connected to the electrode couples,
hydrogen and oxygen are produced and phenol is degraded, following apparent first-order
kinetics. Carbon dioxide is released during the latter stages of the electrolysis. The
difference of incident solar energy only affects the rate of hydrogen production; the
S,B2
S,A2
256
phenol degradation rate, the oxygen generation rate, and the carbon dioxide release time-
delay are almost invariable. At the condition B, the energy efficiency for the hydrogen
production is around 30%. According to manufacturer, a theoretical maximum power of
the PV is 6.4 W corresponding to 4.5% of the average solar light radiation energy (I
= 1100 W/m ). However, when the PV is directly connected to the electrode couple, the
power applied to the electrolysis (PV ) was 3.5 W (3.9V×0.9A). This corresponds to
55% of the PV and 2.5% of the I .
peak S,0
2
cell
peak S,0
To investigate the effect of solar flux on the PV power and the H production, the PV-
connected hybrid reactor was tested on a cloudy day. As shown in Figure 10.9, I , E ,
and I vary over the range of 0.1 W/cm to 0.08 W/cm , 4.1 V to 3.7 V, and 0.7 A to 0.9
A, respectively. The I continually decreases over the period of time from 15 min to 50
min of electrolysis, and the PV and the H production rate also follow the trend.
However, upon addition of phenol to the reactor at 52 min, the H production rate
substantially increases in spite of a continued decrease in I and PV . The H production
rate begins to decrease again after reaching a rate maximum of ~ 0.21 mmol/min. This
behavior was observed again after a subsequent phenol addition at around 80 min.
2
S cell
cell2 2
S
cell 2
2
S cell 2
The
synergistic effect of phenol addition on H2 production efficiency has been qualitatively
described elsewhere18. Briefly, oxidants such as HO•, Cl•, Cl2•−, and HClO/ClO-
produced at the anode can act as electron shuttles consuming electrons at the cathode.
Reactive oxidant reduction is thermodynamically favored over proton/water reduction.
When organics such as phenol are added to the system, they consume oxidants and a
greater fraction of cathodic electrons are available for proton/water reduction. Our
257
observations show this can increase H2 production energy efficiencies by as much as 30
to 53% at low Icell.
The PVcell is correlated to the IS with and without phenol addition (Figure 10.10a).
Without phenol addition (i.e., pure electrolysis), the PVcell efficiency (= PVcell/IS × 100%)
is determined to be 2.0 to 2.8 %. The lower efficiency than supplier-reported (PVpeak =
4.5%) is probably due to overestimation of the array performance by the supplier and a
conversion efficiency loss by the heating of the array and ohmic drop within the reactor33.
The PVcell efficiency increases linearly by 1.5 times from 2.37% to 3.58% by addition of
phenol. The presence of phenol molecules also affects the electrolytic H2 energy
efficiency and behavior. As PVcell increases in the absence of organics, the electrolytic H2
production increases linearly with an average efficiency of 22% (= H2 energy/PVcell in
Figure 10.10b). However, in the presence of phenol, the H2 production energy
efficiencies do not correlate with PVcell. Prior to phenol addition, the electrolytic H2
energy efficiency is around 20%. After phenol addition, PVcell decreases to 2.1×10⁻³
W/cm2 and H2 production efficiencies increase to nearly 40%. The overall solar-to-H2
energy efficiency (= H2 energy/IS × 100%) also displays a similar trend. In the absence of
phenol, the overall efficiency is around 0.67% (Figure 10.10c). The addition of phenol
increases the overall efficiency from 0.53% (5.5×10⁻⁴ W cm-2/ 1.03×10⁻¹ W cm-2) to 1.0%
(8.1×10⁻⁴ W cm-2/8.1×10-2 W cm-2), which is similar to the efficiency observed in Figure
10.8.
For evaluation of a sub-pilot scale electrolysis, a 20 L batch reactor was prepared using
5 anodes (each, 800 cm2) and 6 cathodes of the same dimensions arranged in an
alternative fashion (Scheme 10.2b). At a total power of 60 W (3 V×20 A), carbon
258
dioxide production is observed after 20 min, and the hydrogen production rate is 3.5×10⁻³
mol/min with an energy efficiency of 28% (Figure 10.11a). The degradation half-life of 1
mM phenol is < 2 min. Based on these operation conditions, we can estimate the PV area
required (i.e., PVcell efficiency = PVcell/(IS,0 × PV area) × 100%) to treat variable
volumes of wastewater contaminated with 1 mM phenol (Figure 10.11b). It is clear that
water-treatment capacity is strongly related to the PV area and efficiency. For example,
treatment of 16 metric tons of water (i.e., 1.6 kg phenol) daily (i.e., operation for 9 h/day)
requires a 62 m2 PV panel operating at 10% efficiency. In addition, hydrogen is obtained
as a potentially useful byproduct. Hydrogen production rates are affected both by the
water treatment capacity and H2 energy efficiency (Figure 10.11c). Small-scale reactors
are usually better than large reactors for energy efficiency. At a H2 energy efficiency of
60%, the treatment of 16 tons of water with a PV of 10% efficiency will yield around 1
kg of H2.
Technical Consideration.
Electrodes
Commercial electrolytic water splitting typically employs Pt group metals (PGM) as
anodes and Ni-based alloy (e.g., Ni-Zn, Ni-Al, Ni-Co, Ni-Mo-Cd)34-36, stainless steel36, or
noble metals (e.g., Pt, Au) as cathodes, and operates at extreme conditions such as high
electrolyte concentrations (> 1.0 mol/L), high pH (> 1.0 mol/L KOH), and high pressure.
The main reason for employing the Pt-based anode is that Pt catalyzes the four-electron
oxidation of water (10.3). However, for the electrochemical oxidation of organic
compounds (10.4), the anode should preferentially generate surface-bound or
homogeneous radical species (e.g., HO•, Cl•).
259
A variety of anodes, such as single metal oxides (e.g., PbO224,25,37-41, SnO2
24,37,39,42,
IrO242,43, RuO2
43), multiple metal oxides (e.g., Ta2O5/IrO244, Bi-PbO2/Pt40, PbO2/SnO2
45,
IrO2/RuO2/TiO246), and boron-doped diamond (BDD)47 have been utilized for the
electrolytic treatment of aqueous chemical contaminants. For example, PbO2 coated on
titanium substrate has been widely studied; however, the likely release of lead ions and
long-term anodic stability issues are drawbacks to the practical application of PbO2
anodes. The BDD electrode has also been the subject of a number of studies due to its
great stability and wide potential window47; yet the high price of synthetic diamond
hinders application even at the pilot scale. Application of Pt-based anodes is impractical
due to formation of polymeric surface films during phenol oxidation, which reduces
energy efficiencies22,48,49. In comparison, the BiOx-TiO2 anode employed in this study is
found to be very stable and results in decent current efficiencies in the range of 25 to 36%
for oxidation of propylene glycol17. In addition, it has been manufactured at the sub-pilot
scale with electrode areas nearing a square meter at relatively low costs. Various cathodes
are available for use in combination with the BiOx-TiO2 anode. From an economical
point of view, SS is the most feasible in cost, stability, and availability. Surface treatment
of SS (e.g., Ni or Pt-coating) may catalyze electron transfer to protons/water and increase
H2 energy efficiencies50,51. However, a great increase is not expected, since energy
efficiencies are already in the range of 30% to 70%.
Technical Comparison
It should be noted that the PV-electrolysis-water-treatment system used in this study
has many differences as compared to the commercial PV-electrolyzer systems. First, few
experimental studies on hybrid PV-electrolyzer technologies for H2 production and
260
organic oxidation operating at such mild conditions (atmospheric pressure, pH 6 to 11, 50
mM salt) have been reported. For example, Ahmad and Shenway evaluated a PV-driven
electrolysis system for hydrogen production with reported electrolysis efficiencies of
60% (similar to our system) under much harsher conditions (27% KOH solution; ~ 4.8
mol/L; pH 14.7)6. Comparison of the solar-to-H2 energy efficiency is not reliable due to
different overall purpose and conditions. A high-powered and efficient PV usually has a
high solar-to-H2 efficiency. Photovoltaic arrays of 5–9 kW PVpeak and 8.1–8.4% PVcell
efficiency, coupled with alkaline electrolyzer (30% KOH) of 62 to 77% electrolytic H2
efficiency, have overall solar-to-H2 efficiency of 3.6 to 6.2%33,52. The alkaline
electrolyzer of similar electrolytic H2 efficiency (60%) has a much lowered solar-to-H2
energy efficiency of 1.5% when coupled to a lower power PV (PVpeak = 53 W)6. Due to
the extremely high electrolyte concentration, which is a usual condition for optimal
efficiency during alkaline electrolysis, it is impractical for application to water treatment.
In comparison, our system operates over a similar efficiency range (electrolytic H2
energy efficiency of 30% to 70%; solar-to-H2 energy efficiency ~ 1.0%) with a low-
power PV (PVpeak = 6.4 W) at two-orders of magnitude lower electrolyte concentrations
(2 × 10⁻² to 5 × 10⁻² mol/L).
Second, PV-electrolyzer systems on a lab or pilot scale have been considered and
examined as alternatives to a system of PV-electricity-battery. The systems are typically
composed of PV arrays for converting solar light to electricity, alkaline electrolyzers for
producing hydrogen using the electricity, hydrogen storage tanks, and fuel cells for
producing electricity from the stored hydrogen (and oxygen). Therefore, the primary goal
of theses studies is to utilize hydrogen as a storable medium for the dark generation of
261
electricity. However, the PV-electrolyzer systems, which produce hydrogen, are found to
be economically impractical compared to conventional PV-electricity-battery
combinations. For example, total annual cost of the electricity from the electrolyze-based
systems is around 3 times and 4 times higher than those of the battery-based systems due
to energy losses during electrolysis and fuel-cell processes8. The hydrogen produced from
a typical PV-electrolyzer system is also more expensive than SMR. On the other hand, if
the hydrogen production can be combined with costly wastewater treatment, then PV-
electrolyzer systems may become economically viable53,54.
This hybrid system should be distinguished from reported electrochemical hybrid
systems for hydrogen production and chemical oxidation in terms of practical operation
and efficiency. Most hybrid systems operate with limited number of organic chemicals at
lower efficiencies. For example, the DC-powered electrolytic hydrogen production from
methanol was reported, but the system only works with methanol (i.e., a reversed direct
methanol fuel cell process)12. A hybrid system of electro-assisted photo-Fenton oxidation
and cathodic hydrogen production was described, yet the system operates only for a
limited number of substrates under limited conditions and needs post-electrolysis
treatment to separate the consumed reagents10. In contrast, our system has been proven to
decompose and mineralize a variety of phenolic compounds (e.g., phenol, mono-, di-,
trichlorinated phenols, catechol, hydroquinone, resorcinol, salicylic acids, etc.), aliphatic
acids (e.g., maleic acid, malonic acid, oxalic acid, fumaric acid, polypropylene, etc.), and
dyestuffs (methyl orange, ortho-methyl red, para-methyl red, methylene blue, acid orange
7, rhodamine B, etc.)18,19. These chemicals are commonly found in industrial and
domestic wastewaters.
262
Application
Some issues would limit the applications of the presented hybrid system to a
conventional water treatment facility. First the electrolyte (i.e., NaCl), which is
intrinsically necessary for the electrolysis. However, the sodium chloride is the most
abundant constituent of a water/wastewater stream, in the range 1 to 9300 kg/day21, and
wastewater inflows have a high conductivity in the range of 620 to 3550 μS/cm55. In
addition, this hybrid is found to work efficiently even at 21 mM NaCl (~ 1.2 g/L)17. The
other is that the electrolysis could produce some toxic byproducts. However, no
chlorinated gases such as methyl chloride, dichloromethane, chloroform, tetrachloride,
phosgene, vinyl chloride, or chlorine were detected during the electrolysis in the presence
of phenol. The chlorinated phenols produced are very rapidly converted to carbon dioxide
(e.g., k2,4,6-ClPhOH / kPhOH > 3.7), water, and chloride.
Separation and purification of the evolved gas stream is absolutely necessary. However,
it is not a difficult challenge. Proton-exchange membranes such as Nafion or porous
ceramic separators (e.g., fine glass frit) can be put between the anode and cathode. Since
oxygen and carbon dioxide are produced at the anode, both gases are effectively
separated from hydrogen produced at the cathode provided that there is an appropriate
membrane separating the two compartments. In addition, even if hydrogen is mixed with
carbon dioxide, CO2 can be readily removed just by chemical absorption process (e.g.,
flowing carbon dioxide gas through amine solution), which is a typical CO2 separation
process in gas turbine power plants.
Current water and wastewater treatment plants involving a series of water treatment
processes include pre-treatment steps to screen out solid debris and large particle
263
suspended solids, physical separation such as small particle coagulation, flocculation and
sedimentation, floatation and clarification, biological treatment for removal of biological
oxygen demand, and advanced oxidation treatment such as UV/ozone process for
disinfection and reduction of chemical oxygen demand. Therefore no unit process itself
could replace the overall wastewater treatment processes. Our PV-electrolytic system
would replace conventional UV/ozone steps as an advanced oxidation or disinfection
alternative.
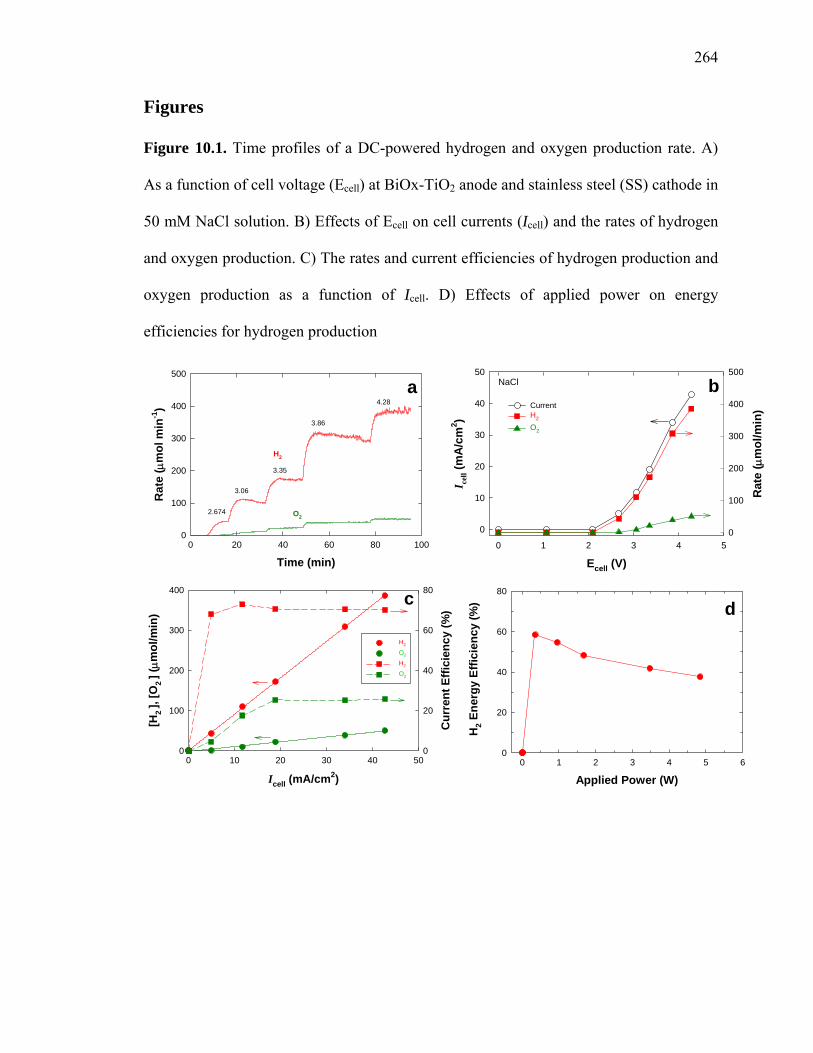
264
Figures
Figure 10.1. Time profiles of a DC-powered hydrogen and oxygen production rate. A)
As a function of cell voltage (Ecell) at BiOx-TiO2 anode and stainless steel (SS) cathode in
50 mM NaCl solution. B) Effects of Ecell on cell currents (Icell) and the rates of hydrogen
and oxygen production. C) The rates and current efficiencies of hydrogen production and
oxygen production as a function of Icell. D) Effects of applied power on energy
efficiencies for hydrogen production
d
Applied Power (W)0 1 2 3 4 5 6
H2 E
nerg
y Ef
ficie
ncy
(%)
0
20
40
60
80c
Icell (mA/cm2)0 10 20 30 40 50
[H2
], [O
2 ] (μm
ol/m
in)
0
100
200
300
400
Cur
rent
Effi
cien
cy (%
)
0
20
40
60
80
H2
O2
H2
O2
Time (min)0 20 40 60 80 100
0
100
200
300
400
500
0
10
20
30
40
50
0
100
200
300
400
500
Rat
e ( μ
mol
min
-1)
2.674
3.06
3.35
3.86
4.28
O2
a
H2
NaCl
Ecell (V)
bCurrentH2
Rat
e ( μ
mol
/min
)
0 1 2 3 4 5
I cell (
mA
/cm
2 )
O2
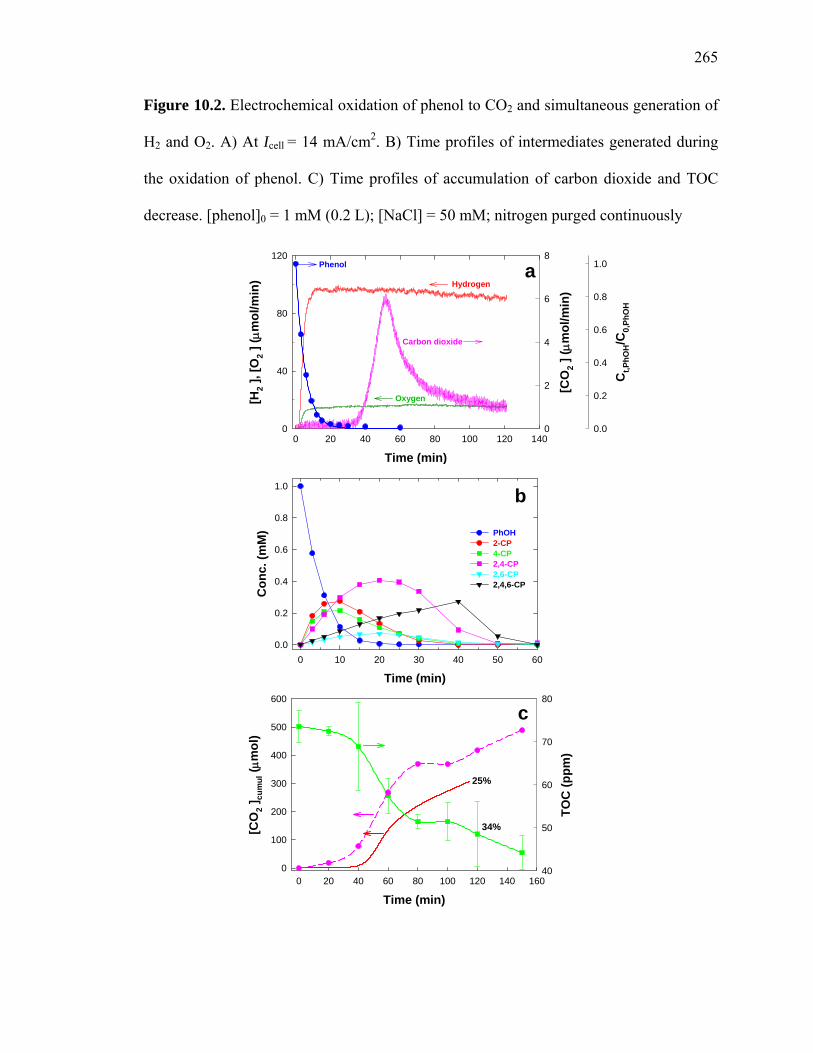
265
Figure 10.2. Electrochemical oxidation of phenol to CO2 and simultaneous generation of
H2 and O2. A) At Icell = 14 mA/cm2. B) Time profiles of intermediates generated during
the oxidation of phenol. C) Time profiles of accumulation of carbon dioxide and TOC
decrease. [phenol]0 = 1 mM (0.2 L); [NaCl] = 50 mM; nitrogen purged continuously
a
Time (min)0 20 40 60 80 100 120 140
[H2 ]
, [O
2 ] ( μ
mol
/min
)
0
40
80
120
[CO
2 ] ( μ
mol
/min
)
0
2
4
6
8
Ct,P
hOH/C
0,Ph
OH
0.0
0.2
0.4
0.6
0.8
1.0Phenol
Hydrogen
Carbon dioxide
Oxygen
b
Time (min)
0.0
0.2
0.4
0.6
0.8
1.0
PhOH
Con
c. (m
M)
2-CP4-CP2,4-CP2,6-CP2,4,6-CP
0 10 20 30 40 50 60
0
100
200
300
400
500
600
c
Time (min)0 20 40 60 80 100 120 140 160
40
50
60
70
80
[CO
2 ]cu
mul
( μm
ol)
TOC
(ppm
)
25%
34%

266
Figure 10.3. Effects of Icell on observed electrochemistry. A) degradation of phenol, B)
release of carbon dioxide, and C) half life time (t1/2) for degradation of phenol, anodic
efficiencies (AE-I, AE-II: see experimental section), and cathodic efficiencies (CE).
Experimental conditions identical to those of Figure 10.2
Current Density (mA/cm2)0 10 20 30 40
Ano
dic
Effic
ienc
y (%
)H
alf L
ife T
ime
(min
)
0
2
4
6
8
10
12
Cat
hodi
c Ef
ficie
ncy
(%)
0
20
40
60
80
100
ACE-IACE-IIt1/2
CCE
Time (min)0 10 20 30 40
ln (C
t/C0)
-6
-5
-4
-3
-2
-1
0
7142438
Current Density(mA/cm2)
Time (min)0 20 40 60 80 100 120 140
[CO
2 ] ( μ
mol
/min
)
2
4
6
8
10
1238 (279) 24 (294)
14 (305)
7 (323)
a
b
c
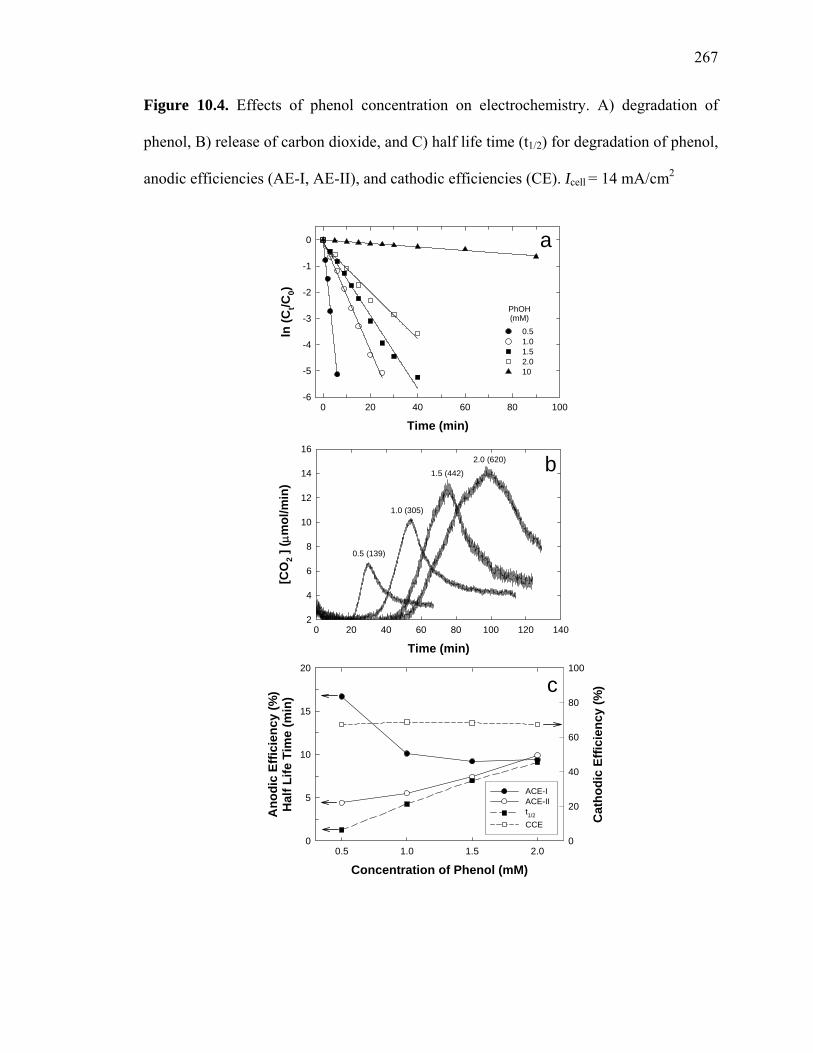
267
Figure 10.4. Effects of phenol concentration on electrochemistry. A) degradation of
phenol, B) release of carbon dioxide, and C) half life time (t1/2) for degradation of phenol,
anodic efficiencies (AE-I, AE-II), and cathodic efficiencies (CE). Icell = 14 mA/cm2
Concentration of Phenol (mM)0.5 1.0 1.5 2.0
Ano
dic
Effic
ienc
y (%
)H
alf L
ife T
ime
(min
)
0
5
10
15
20
Cat
hodi
c Ef
ficie
ncy
(%)
0
20
40
60
80
100
ACE-I ACE-II t1/2 CCE
ln(phOH) vs rate
Time (min)0 20 40 60 80 100
ln (C
t/C0)
-6
-5
-4
-3
-2
-1
0
0.51.01.52.010
PhOH(mM)
Time (min)0 20 40 60 80 100 120 140
[CO
2 ] ( μ
mol
/min
)
2
4
6
8
10
12
14
16
0.5 (139)
1.0 (305)
1.5 (442)
2.0 (620)
a
b
c

268
Figure 10.5. Effect of NaCl concentration on the electrochemistry. Degradation rate (k)
of phenol () and the current efficiency for hydrogen production () in 50 mM Na2SO4.
For comparison, effect of 50 mM NaCl without Na2SO4 was also shown for k () and
hydrogen production (). The current efficiency for hydrogen = (number of H2 molecules
× 2) / (number of electrons) × 100%
[NaCl] (mM) in 50 mM Na2SO40 10 20 30 40 50 60
k (m
in-1
)
0.00
0.05
0.10
0.15
0.20
0.25
H2 C
urre
nt E
ffici
ency
(%)
65
70
75
80
85
90
95
100
Figure 10.6. Time profiles of pH change during the course of electrolysis. Icell = 14
mA/cm2 in the absence and presence of 1 mM phenol
Time (min)0 40 80 120 160 200
pH
6
7
8
9
10
11
12
NaClNaCl+PhOH
OFF
OFF
ON
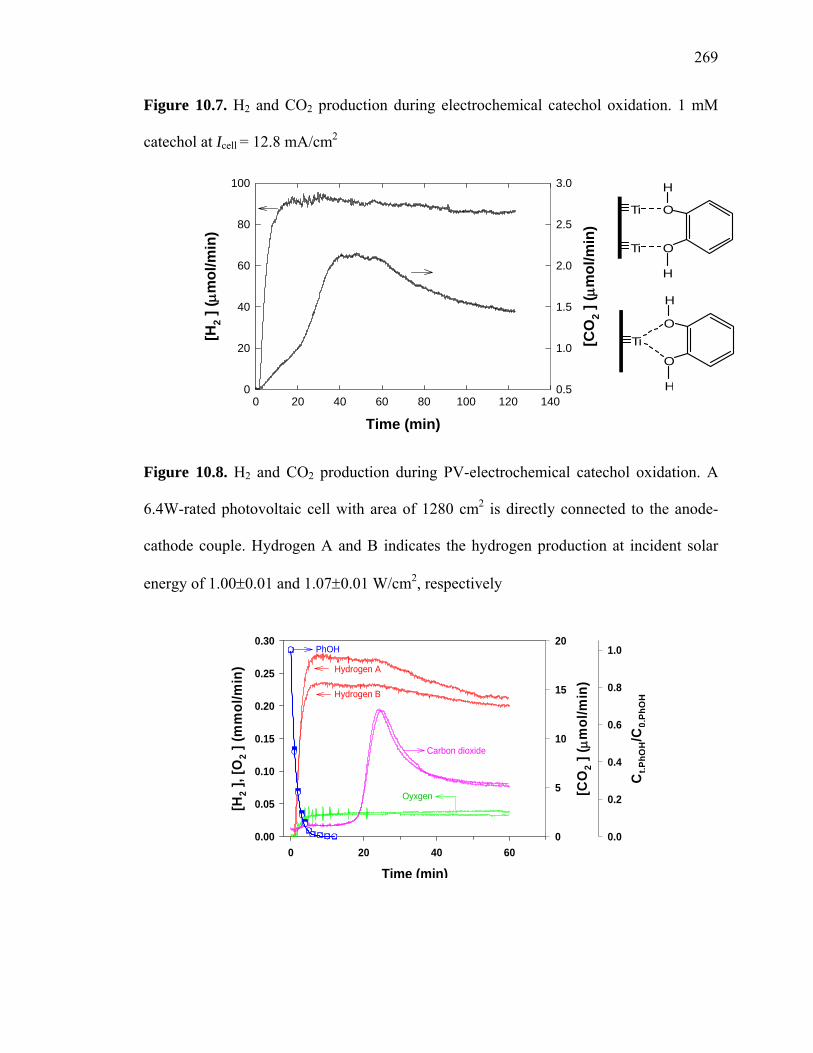
269
Figure 10.7. H2 and CO2 production during electrochemical catechol oxidation. 1 mM
catechol at Icell = 12.8 mA/cm2
Time (min)0 20 40 60 80 100 120 140
[H2 ]
( μm
ol/m
in)
0
20
40
60
80
100
[CO
2 ] ( μ
mol
/min
)
0.5
1.0
1.5
2.0
2.5
3.0
Ti
Ti
O
O
H
H
TiO
O
H
H
Figure 10.8. H2 and CO2 production during PV-electrochemical catechol oxidation. A
6.4W-rated photovoltaic cell with area of 1280 cm2 is directly connected to the anode-
cathode couple. Hydrogen A and B indicates the hydrogen production at incident solar
energy of 1.00±0.01 and 1.07±0.01 W/cm2, respectively
Time (min)0 20 40 60
[H2 ]
, [O
2 ] (m
mol
/min
)
0.00
0.05
0.10
0.15
0.20
0.25
0.30
[CO
2 ] ( μ
mol
/min
)
0
5
10
15
20C
t,PhO
H/C
0,Ph
OH
0.0
0.2
0.4
0.6
0.8
1.0PhOH
Hydrogen A
Hydrogen B
Carbon dioxide
Oyxgen
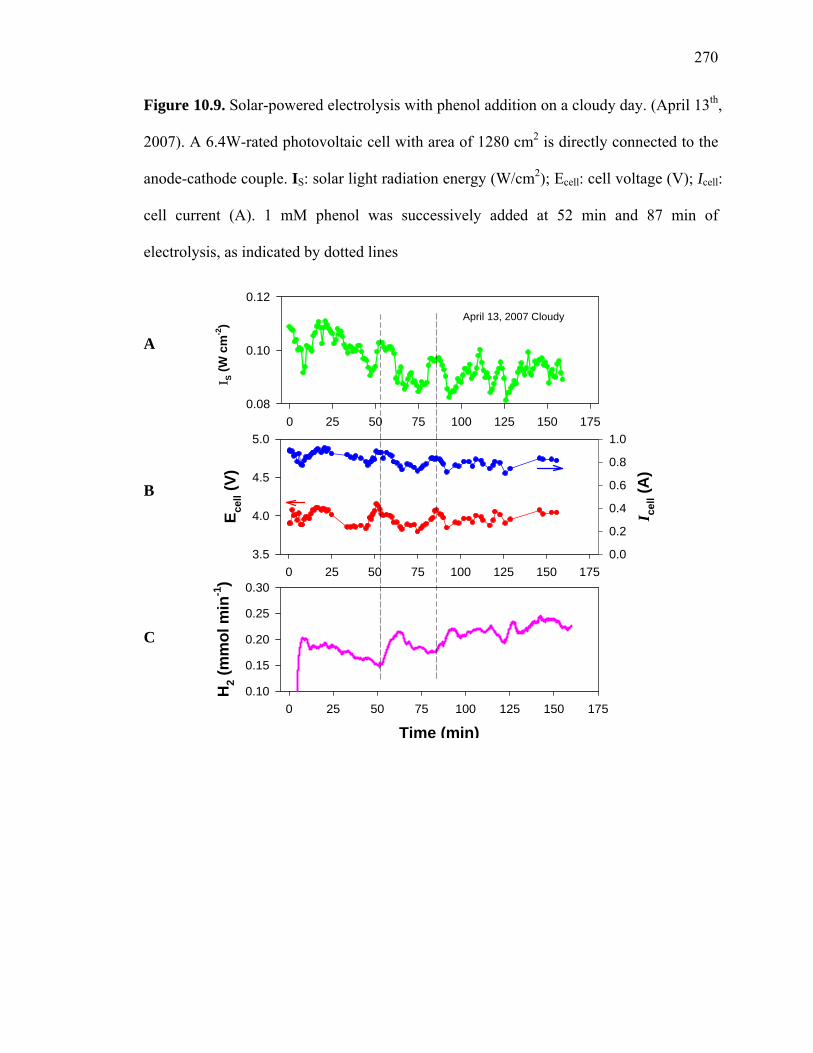
270
Figure 10.9. Solar-powered electrolysis with phenol addition on a cloudy day. (April 13th,
2007). A 6.4W-rated photovoltaic cell with area of 1280 cm2 is directly connected to the
anode-cathode couple. IS: solar light radiation energy (W/cm2); Ecell: cell voltage (V); Icell:
cell current (A). 1 mM phenol was successively added at 52 min and 87 min of
electrolysis, as indicated by dotted lines
April 13, 2007 Cloudy
0 25 50 75 100 125 150 175
Ι S (W
cm
-2)
0.08
0.10
0.12
0 25 50 75 100 125 150 175
E cell (
V)
3.5
4.0
4.5
5.0
I cell (
A)
0.0
0.2
0.4
0.6
0.8
1.0
Time (min)0 25 50 75 100 125 150 175
H2 (
mm
ol m
in-1
)
0.10
0.15
0.20
0.25
0.30
A B C
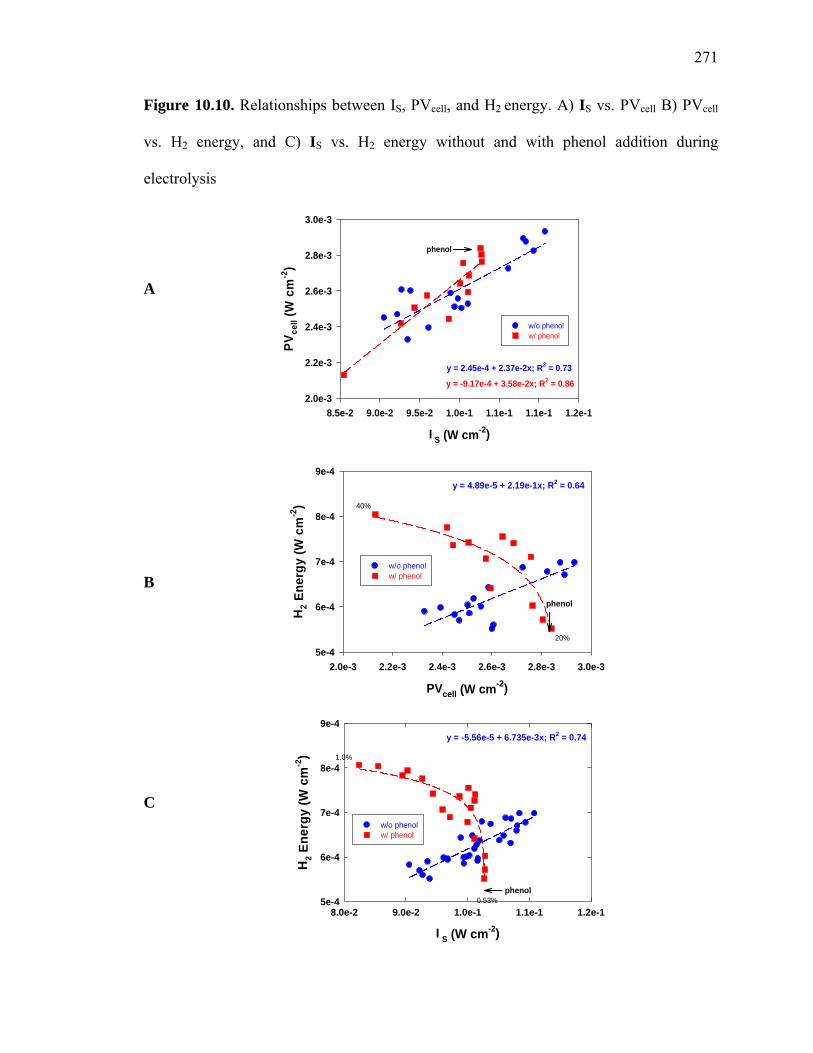
271
Figure 10.10. Relationships between IS, PVcell, and H2 energy. A) IS vs. PVcell B) PVcell
vs. H2 energy, and C) IS vs. H2 energy without and with phenol addition during
electrolysis
IS (W cm-2)
8.5e-2 9.0e-2 9.5e-2 1.0e-1 1.1e-1 1.1e-1 1.2e-1
PVce
ll (W
cm
-2)
2.0e-3
2.2e-3
2.4e-3
2.6e-3
2.8e-3
3.0e-3
w/o phenol
phenol
A
w/ phenol
y = 2.45e-4 + 2.37e-2x; R2 = 0.73
y = -9.17e-4 + 3.58e-2x; R2 = 0.86
PVcell (W cm-2)
2.0e-3 2.2e-3 2.4e-3 2.6e-3 2.8e-3 3.0e-3
H2 E
nerg
y (W
cm
-2)
5e-4
6e-4
7e-4
8e-4
9e-4
w/o phenol
y = 4.89e-5 + 2.19e-1x; R2 = 0.64
w/ phenolB
phenol
20%
40%
C
IS (W cm-2)
8.0e-2 9.0e-2 1.0e-1 1.1e-1 1.2e-1
H2 E
nerg
y (W
cm
-2)
5e-4
6e-4
7e-4
8e-4
9e-4
w/o phenol
y = -5.56e-5 + 6.735e-3x; R2 = 0.74
w/ phenol
phenol0.53%
1.0%
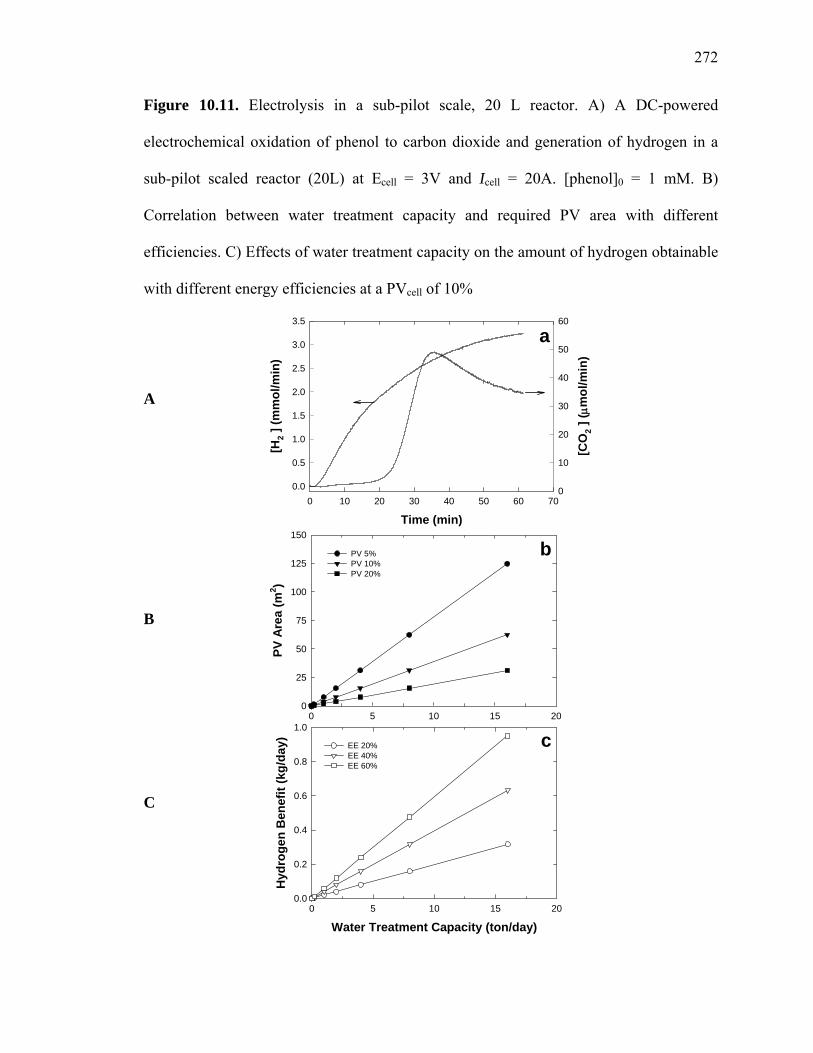
272
Figure 10.11. Electrolysis in a sub-pilot scale, 20 L reactor. A) A DC-powered
electrochemical oxidation of phenol to carbon dioxide and generation of hydrogen in a
sub-pilot scaled reactor (20L) at Ecell = 3V and Icell = 20A. [phenol]0 = 1 mM. B)
Correlation between water treatment capacity and required PV area with different
efficiencies. C) Effects of water treatment capacity on the amount of hydrogen obtainable
with different energy efficiencies at a PVcell of 10%
0 5 10 15 20
PV A
rea
(m2 )
0
25
50
75
100
125
150
PV 5% PV 10% PV 20%
Water Treatment Capacity (ton/day)0 5 10 15 20
Hyd
roge
n B
enef
it (k
g/da
y)
0.0
0.2
0.4
0.6
0.8
1.0
EE 20% EE 40% EE 60%
c
bTime (min)
0 10 20 30 40 50 60 70
[H2 ]
(mm
ol/m
in)
0.0
0.5
1.0
1.5
2.0
2.5
3.0
3.5
[CO
2 ] ( μ
mol
/min
)
0
10
20
30
40
50
60
a
A
B
C
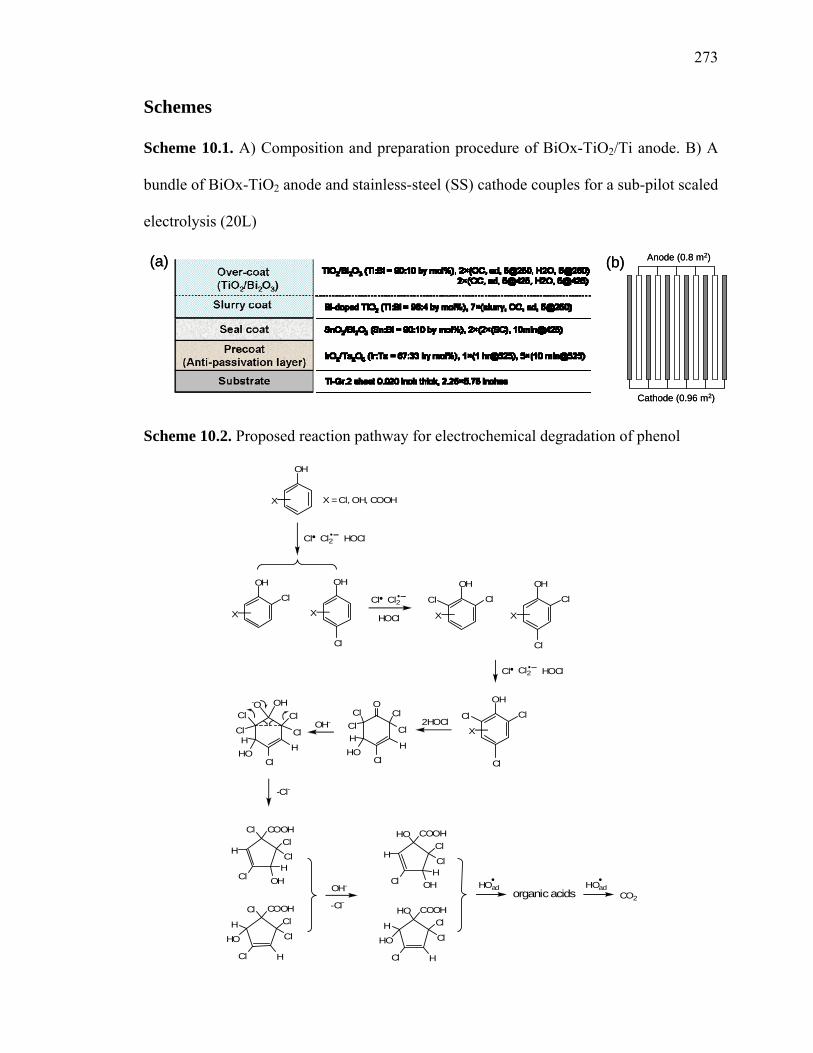
273
Schemes
Scheme 10.1. A) Composition and preparation procedure of BiOx-TiO2/Ti anode. B) A
bundle of BiOx-TiO2 anode and stainless-steel (SS) cathode couples for a sub-pilot scaled
electrolysis (20L)
Anode (0.8 m2)
Cathode (0.96 m2)
(a) (b) Anode (0.8 m2)
Cathode (0.96 m2)
(a) (b)
Scheme 10.2. Proposed reaction pathway for electrochemical degradation of phenol
OH
Cl2Cl HOCl
X X =Cl, OH, COOH
OH
X
Cl
OH
X
Cl
Cl2Cl HOCl
OH
X
Cl
OH
X
Cl
Cl2Cl
HOCl
Cl Cl
OH
X
ClCl
Cl
2HOCl
OCl
Cl
ClCl
Cl
HHO
H
COOHCl
H
ClH
OH
Cl
Cl
OH-Cl
Cl
Cl
Cl
Cl
HHO
H
-O OH
COOHCl
H
Cl H
Cl
ClHO
-Cl-
OH-
-Cl-
COOHHO
H
ClH
OH
Cl
Cl
COOHHO
H
Cl H
Cl
ClHO
HOad HOadorganicacids CO2
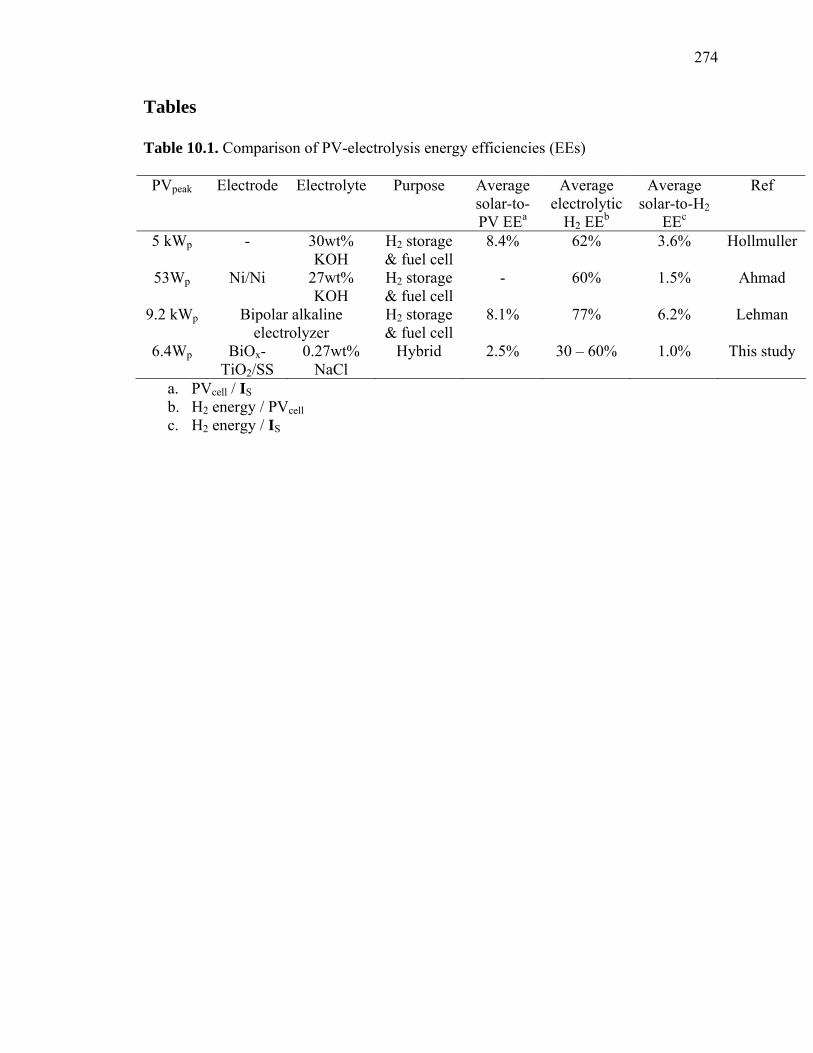
274
Tables
Table 10.1. Comparison of PV-electrolysis energy efficiencies (EEs)
PVpeak Electrode Electrolyte Purpose Average solar-to-PV EEa
Average electrolytic
H2 EEb
Average solar-to-H2
EEc
Ref
5 kWp - 30wt% KOH
H2 storage & fuel cell
8.4% 62% 3.6% Hollmuller
53Wp Ni/Ni 27wt% KOH
H2 storage & fuel cell
- 60% 1.5% Ahmad
9.2 kWp Bipolar alkaline electrolyzer
H2 storage & fuel cell
8.1% 77% 6.2% Lehman
6.4Wp BiOx-TiO2/SS
0.27wt% NaCl
Hybrid 2.5% 30 – 60% 1.0% This study
a. PVcell / IS b. H2 energy / PVcell c. H2 energy / IS
275
References
(1) International Energy Outlook 2006; Energy Information Administration.
(2) Penner, S. S. Energy 1998, 23, 71.
(3) 2005 Hydrogen Market, Hydrogen R&D and Commercial Implication in the U.S.
and E.U., available at http://www.researchandmarkets.com/reports/301714.
(4) Solar and Wind Technologies for Hydrogen Production, available at
http://www.hydrogen.energy.gov/congress_reports.html.
(5) Korposki, B.; Levene, J.; Harrison, K.; Sen, P. K.; Novachek, F. Electrolysis:
Information and Opportunities for Electric Power Plants, available at
http://www.osti.gov/bridge.
(6) Ahmad, G. E.; El Shenawy, E. T. Renewable Energy 2006, 31, 1043.
(7) Turner, J. A. Science 1999, 285, 687.
(8) Friberg, R. Int. J. Hydrogen Energy 1993, 18, 853.
(9) Szyszka, A. Int. J. Hydrogen Energy 1998, 23, 849.
(10) Soler, L.; Macanas, J.; Munoz, M.; Casado, J. Int. J. Hydrogen Energy 2006, 31,
129.
(11) Mathieson, G.; Langdon, A.; Jamieson, G. Dev. Chem. Eng. Mineral Process
2006, 14, 71.
(12) Narayanan, S. R.; W., C.; Jeffries-Nakamura, B.; Valdez, T. I. Hydrogen
Generation by Electrolysis of Aqueous Organic Solutions; U.S. Patent 6,368,492; Apr. 9,
2002.
(13) Kesselman, J. M.; Weres, O.; Lewis, N. S.; Hoffmann, M. R. J. Phys. Chem. B
1997, 101, 2637.

276
(14) Weres, O.; Hoffmann, M. R. Electrode, Electrode Manufacturing Process and
Electrochemical Cell, U.S. Patent 5,419,824, 1995.
(15) Weres, O.; Hoffmann, M. R. Electrochemical Method and Device for Generating
Hydroxyl Free Radicals and Oxidizing Chemical Substances Dissolved in Water; U.S.
Patent 5,364,508; Nov. 15, 1994.
(16) Weres, O.; Hoffmann, M. R. Electrochemical Device for Generating Hydroxyl
Free Radicals and Oxidizing Chemical Substances Dissolved in Water; U.S. Patent
5,439,577; Aug. 8, 1995.
(17) Weres, O. Electrode with Surface Comprising Oxides of Titanium and Bismuth
and Water Purification Process Using This Electrode; U.S. Patent 0,000,774 A1; Jan. 4,
2007.
(18) Park, H.; Vecitis, C. D.; Choi, W.; Weres, O.; Hoffmann, M. R. J. Phys. Chem. C
2008, 112, 885.
(19) Park, H.; Vecitis, C. D.; Hoffmann, M. R. J. Phys. Chem. C 2008, (accepted).
(20) Glassmeyer, S. T.; Furlong, E. T.; Kolpin, D. W.; Cahill, J. D.; Zaugg, S. D.;
Werner, S. L.; Meyer, M. T.; Kryak, D. D. Environ. Sci. Technol. 2005, 39, 5157.
(21) Barber, L. B.; Murphy, S. F.; Verplanck, P. L.; Sandstrom, M. W.; Taylor, H. E.;
Furlong, E. T. Environ. Sci. Technol. 2006, 40, 475.
(22) Gattrell, M.; Kirk, D. W. J. Electrochem. Soc. 1993, 140, 903.
(23) Canizares, P.; Martinez, F.; Diaz, M.; Garcia-Gomez, J.; Rodrigo, M. A. J.
Electrochem. Soc. 2002, 149, D118.
(24) Kotz, R.; Stucki, S.; Carcer, B. J. Appl. Electrochem. 1991, 21, 14.
(25) Tahar, N. B.; Savall, A. J. Electrochem. Soc. 1998, 145, 3427.

277
(26) Boudenne, J. L.; Cerclier, O.; Bianco, P. J. Electrochem. Soc. 1998, 145, 2763.
(27) Korbahti, B. K.; Salih, B.; Tanyolac, A. J. Chem. Technol. Biotechnol. 2002, 77,
70.
(28) Buxton, G. V.; Greenstock, C. L.; Helman, W. P.; Ross, A. B. J. Phys. Chem. Ref.
Data 1988, 17, 513.
(29) Hasegawa, K.; Neta, P. J. Phys. Chem. 1978, 82, 854.
(30) Gallard, H.; von Gunten, U. Environ. Sci. Technol. 2002, 36, 884.
(31) Araujo, P. Z.; Morando, P. J.; Blesa, M. A. Langmuir 2005, 21, 3470.
(32) Tunesi, S.; Anderson, M. J. Phys. Chem. 1991, 95, 3399.
(33) Hollmuller, P.; Joubert, J. M.; Lachal, B.; Yvon, K. Int. J. Hydrog. Energy 2000,
25, 97.
(34) Los, P.; Rami, A.; Lasia, A. J. Appl. Electrochem. 1993, 23, 135.
(35) Navarro-Flores, E.; Chong, Z. W.; Omanovic, S. J. Mol. Catal. A 2005, 226, 179.
(36) Radhakrishnamurthy, P.; Sathyanarayana, S.; Reddy, A. K. N. J. Appl.
Electrochem. 1977, 7, 51.
(37) Rodgers, J. D.; Jedral, W.; Bunce, N. I. Environ. Sci. Technol. 1999, 33, 1453.
(38) Bonfatti, F.; Ferro, S.; Lavezzo, F.; Malacarne, M.; Lodi, G.; De Battisti, A. J.
Electrochem. Soc. 2000, 147, 592.
(40) Iniesta, J.; Exposito, E.; Gonzalez-Garcia, J.; Montiel, V.; Aldaz, A. J.
Electrochem. Soc. 2002, 149, D57.
(41) Kaba, L.; Hitchens, G. D.; Bockris, J. O. J. Electrochem. Soc. 1990, 137, 1341.
(42) Comninellis, C.; Nerini, A. J. Appl. Electrochem. 1995, 25, 23.
278
(43) Kim, K. W.; Lee, E. H.; Kim, J. S.; Shin, K. H.; Jung, B. I. J. Electrochem. Soc.
2002, 149, D187.
(44) Fino, D.; Jara, C.; Saracco, G.; Specchia, V.; Spinelli, P. J. Appl. Electrochem.
2005, 35, 405.
(45) Gherardini, L.; Michaud, P. A.; Panizza, M.; Comninellis, C.; Vatistas, N. J.
Electrochem. Soc. 2001, 148, D78.
(46) Rajkumar, D.; Kim, J. G.; Palanivelu, K. Chem. Eng. Technol. 2005, 28, 98.
(47) Panizza, M.; Cerisola, G. Electrochim. Acta 2005, 51, 191.
(48) Koile, R. C.; Johnson, D. C. Anal. Chem. 1979, 51, 741.
(49) Boudenne, J. L.; Cerclier, O.; Galea, J.; VanderVlist, E. Appl. Catal. A. 1996, 143,
185.
(50) Whalen, J. J.; Weiland, J. D.; Searson, P. C. J. Electrochem. Soc. 2005, 152, C738.
(51) Dominey, R. N.; Lewis, N. S.; Bruce, J. A.; Bookbinder, D. C.; Wrighton, M. S. J.
Am. Chem. Soc. 1982, 104, 467.
(52) Lehman, P. A.; Chamberlin, C. E.; Pauletto, G.; Rocheleau, M. A. Int. J. Hydrog.
Energy 1997, 22, 465.
(53) Phenolic Wastewater Treatment Alternatives; Air Force Engineering and Service
Center: Tyndall AFB FL Engineering and Services Lab, 1980.
(54) Jones, O. A. H.; Green, P. G.; Voulvoulis, N.; Lester, J. N. Environ. Sci. Technol.
2007, 41, 5085.
(55) Conn, K. E.; Barber, L. B.; Brown, G. K.; Siegrist, R. L. Environ. Sci. Technol.
2006, 40, 7358.

280
Chapter 11
Enhancement of Cathodic H2 Production
Efficiencies by Simultaneous Anodic
Oxidation of Organics: Role of Substrate
and Active Chlorine Species
Sections reprinted with permission from Park, H.; Vecitis, C. D.; Hoffmann, M. R.
Journal of Physical Chemistry A 2009, 113.
© 2009 American Chemical Society
281
Abstract The need for alternative energy sources with minimal-to-no carbon footprint is growing.
A solar-powered electrochemical system which produces hydrogen via water splitting
using organic pollutants as sacrificial electron donors is a possible solution. The
hybridization of a BiOx-TiO2/Ti anode with a stainless-steel cathode powered by a photo-
voltaic (PV) array has been shown to achieve this process. The electrochemical
degradation kinetics of a variety of organic substrates is investigated as a function of a
background electrolyte NaCl vs. Na2SO4. The observed substrate (S) degradation kinetics
( ) are found to correlate well with the cell current (ISobsk− cell) and the H2 production
energy efficiency (EE) in the presence of NaCl as the background electrolyte. In the case
of Na2SO4, no correlation is observed and the degradation rates are greatly reduced in
comparison to NaCl. This suggests the primary chemical oxidant is electrolyte-dependent.
are found to be proportional to bimolecular rate constants of with the substrate
( ) and to substrate-induced ΔEEs (EE with substrate – EE without substrate) in the
presence of NaCl. The ΔEE correlation arises from the active chlorine species acting as
an electron shuttle, which compete with H
Sobssk− -
2Cl•
-2Cl S
k • +
2 production for cathodic electrons. In the
presence of the organic substrates, the active chlorine species are quenched, increasing
the fraction of electrons utilized for the H2 production.
282
Introduction
As the cost of fossil fuels increases, the development of alternative, renewable, and
environmentally benign (i.e., carbon-free) sources of energy is paramount1,2. Hydrogen,
as a potential alternative fuel, has a higher energy density (per kg) than gasoline or
alcohols and a viable storage capacity under high pressures. Electrochemical water
splitting (i.e., electrolysis) for H2 generation has a negligible carbon footprint compared
to steam methane reformation (SMR), which is the predominant H2 production method
today. At present, commercial-scale water electrolyzer efficiencies range from 50 to 75%
efficient3–5. yet the cost of electrolytic hydrogen production technology is continuing to
rise because of rising electricity costs. In order to lower the cost of electrolytic H2
production, it may prove beneficial to couple electrochemical water treatment with
hydrogen generation. The hybridization of these two processes should result in a single,
cooperative, and more cost-effective electrochemical process. Conventional water and
wastewater treatment operations are known to be energy-intensive and correspond to >
20% of local energy expenditures for water-scarce municipalities6.
Solar-powered electrolytic systems have been developed to couple hydrogen
production with the simultaneous remediation of environmentally relevant organic
pollutants7,8. In these systems, a photovoltaic (PV) cell is used to convert solar light into
DC current, which in turn powers the electrochemical cell. At a multi-component, hetero-
junction anode, organic compounds are converted primarily to carbon dioxide and lower-
molecular-weight organic acids. At a stainless-steel (SS) cathode, hydrogen is produced
via water or proton reduction. Anodic oxygen evolution (i.e., water oxidation) is
circumvented by the generation of oxidizing radical species resulting in a non-
283
stoichiometric water splitting (i.e., overall H2/O2 mole ratios of 6 to 8). Anodic current
efficiencies for the one-electron oxidation and for the complete mineralization of phenol
range from 7 to 17% and 3 to 10%, respectively. The cathodic current and energy
efficiencies for hydrogen generation range from 50 to 70% and 30 to 60%, respectively.
In addition, the oxidation of organics substrates (e.g., phenol) appears to increase 1)
the rate of H2 production, 2) the H2 production energy efficiency by 50%, and 3) the cell
voltage (Ecell) by 0.1–0.2 V in the photovoltaic (PV)-connected system7,8. The relative
degree of the apparent “substrate-induced synergy effect” is dependent on the supporting
electrolyte. For example, sodium chloride has a large efficiency enhancement effect,
whereas sodium sulfate has minimal effect. In addition, the degradation rate of phenol in
sodium chloride is faster by more than two orders of magnitude than that in sodium
sulfate.
Sodium chloride is often utilized as a supporting electrolyte in electrochemical water
treatment9–23 NaCl improves .e anodic oxidation efficiency for phenol10,11,13,15,16,
glucose12,17, p-cresol9, propylene glycol22, trichlosan14, oxalic acid18, dyestuffs20,21, and
endocrine disruptors23, compared to sodium sulfate10,12,23, sodium bicarbonate9, and
sodium nitrate23. In some cases, chlorinated substrates enhance anodic efficiencies due to
the liberation of chlorine during the course of electrolysis24. Active chlorine species such
as Cl•, Cl2•−, and ClO− are generated at the anode surface and act as indirect oxidants for
organic or inorganic reductants. However, the impact of reactive chlorine intermediates
on cathodic reactions has not been studied in detail (e.g., the impact of reaction chlorine
species on hydrogen production rates in this study). With this in mind, we have compared
a variety of substrates in terms of relative anodic oxidation efficiencies and the
284
corresponding effects on cathodic hydrogen production using NaCl or Na2SO4 as the
supporting electrolytes.
Experimental Details
Chemical Reagents
All chemicals were reagent or HPLC grade. Phenol (PhOH, J.T.Baker), catechol (CC,
Sigma), hydroquinone (HQ, J.T.Baker), 2-chlorophenol (2CP, Aldrich), 4-chlorophenol
(4CP, Aldrich), 2,4-dichlorophenol (24CP, TCI), 2,6-dichlorophenol (26CP, TCI), 2,4,6-
trichlorophenol (246CP, TCI), salicylic acid (SA, Aldrich), benzoic acid (BA, J.T.Baker),
methanol (EMD), sodium formate (Aldrich), sodium acetate (Aldrich), maleic acid
(Sigma), malonic acid (Sigma), sodium oxalate (Aldrich), and sodium hypochlorite
(NaOCl, VWR) were used as received. NaCl (J.T.Baker), Na2SO4 (EMD), or CO2(g)-
purged NaHCO3 was used as a supporting electrolyte.
Electrodes
A BiOx-TiO2-Ti(0) electrode was used as the primary anode. Details of the anode
preparation are provided elsewhere7,8,22. In summary, the electrode consists of a series of
metal oxide coatings on a titanium metal substrate. They include a pre-coating, sealing
coating, slurry coating, and over-coating. Each step of coating requires a specific heat
treatment regime with different temperatures and times. A single thin anode with an
active area of 25.5 cm and two stainless-steel (SS) cathodes (Hastelloy C-22) of equal
size were used as the electrodes. A cathode was placed on both sides of the double-sided
anode with a separation distance of 2 mm.
2

285
Electrolytic Reactions
The double-sided BiOx-TiO2-Ti(0) anode coupled with SS cathodes was immersed in
aqueous electrolyte solutions of either sodium chloride or sodium sulfate (200 mL). The
electrolyte solution was stirred during continuous purging with air or nitrogen as a
background carrier gas. The target substrates were added to the background electrolyte at
t = 0 or added subsequently during the course of electrolysis. A constant cell voltage or
current was applied to the electrodes with a DC-power supply (HP 6263B and 6260B).
The current efficiencies (eq. 11.1) and the energy efficiencies (eq. 11.2) were obtained
using the following equations.
2 2 2
Current efficiency (%) = Number of molecules produced (H , O , or CO ) or degraded (phenol) n 100
Number of electrons flowed× ×
(11.1)
where n = 2 and 4 for cathodic hydrogen and anodic oxygen production, respectively. For
anodic current efficiencies, n = 1 for one-electron oxidation of phenol, and n = 14/3 for
the complete oxidation of phenol carbon to carbon-dioxide carbon.
22
cell cell
(39W h/g H rate 2g/mol)H energy efficiency (%) = 100E I
⋅ × ××
× (11.2)
Chemical Analyses
The electrolytic reactor was sealed to the atmosphere. The gas in the headspace was
extracted using a peristaltic pump and pushed through a membrane inlet and then pulled
into a mass spectrometer (MS) under a vacuum (5.0 × 10 torr) generated with a turbo
pump (Pfeiffer). The extracted gases were ionized by 70 eV electron impact and
subsequently analyzed by quadrupole mass spectrometry (Balzers). The volume percent
of the headspace was calculated assuming that it was directly proportional to the ion
-6
286
current measured by the mass spectrometer (i.e., the transfer of all gases through the
membrane and their 70 eV electron ionization cross-sections were approximately
equivalent). This assumption was validated by the fact that ambient air was determined to
be 77% nitrogen, 17% oxygen, 5% water vapor, and 1% argon.
Aromatic compounds and their reaction intermediates were analyzed by a high-
performance liquid chromatography (HPLC, Agilent 1100 series) using a C18 column for
separation. The eluent was composed of 55% Milli-Q water (0.1 wt% acetic acid) and
45% acetonitrile at flow rate of 0.7 mL/min.
Results and Discussion
Substrate-Specific Reaction Rates
A time profile of H2 and O2 production at the BiOx-TiO2-Ti(0)/SS electrode couple is
shown in Figure 11.1 for a background electrolyte concentration of 50 mM NaCl. In the
absence of phenol (i.e., conventional water electrolysis), the initial H2 production rate
was observed to range from 90 to 100 μmol min-1. Under steady-state conditions,
however, the H2 production rate declined slightly to 80 μmol min-1. In contrast, with the
addition of phenol to the reaction mixture, the H2 production rate increased again to 110
μmol min-1. The apparent substrate enhancement of the H2 production rate is maintained
for a short period after the incremental addition of phenol, and then it relaxes back to the
state-state condition as the rate of CO2 production is maximized. On the other hand, the
addition of an oxidizable substrate has little impact on the rate of O2 production.
Other phenolic substrates—such as catechol, hydroquinone, salicylic acid, 2-
chlorophenol, and 4-chloropenol—exhibit similar behavior as shown in Figure 11.2a,
whereas maleic acid, malonic acid, and oxalic acid have a lesser rate enhancement than
287
the phenolic substrates. Lower molecular weight compounds such as methanol, formate,
and acetate do not show any synergistic effects on the hydrogen production rates.
The addition of phenol to the electrolytic system lowers the cell current from 0.38 A to
0.32 A under a constant DC cell voltage of 3.1 V in spite of an increase in hydrogen
production by 20 μmol min-1 (Table 11.1). Maleic acid, oxalic acid, catechol, salicylic
acid, and the chlorinated phenols also increase the hydrogen production efficiency, while
concurrently lowering cell current. When the electrolytic cell is powered by a PV array,
then the cell voltage is increased from 4.0 V to 4.2 V upon addition of phenol, while the
cell current remains constant7. Therefore, the substrate synergistic effect on the hydrogen
production energy efficiency is twofold: the hydrogen production rates are increased and
the cell currents are decreased at a constant DC cell voltage. The addition of aromatic
substrates results in an increase in the apparent energy efficiencies by 30 to 50%, whereas
the addition of maleic or oxalic acid increases the efficiencies by only 8 to 10% (Table
11.1).
The degradation of the phenolic substrates follows pseudo-first-order kinetics. The
observed reaction rate constants ( ) appear to be dependent on the chemical structure
under similar electrolytic conditions (I
Sobsk−
cell = 0.375A; 50 mM NaCl).
Sobs
d[S] [S]dt
= −k (11.3)
For example, the degradation rates of hydroquinone and 2,4,6-trichlorophenol are 4.6 and
3.7 times faster than phenol, respectively (Figure 11.2b & Table 11.1). On the other hand,
the degradation rates of salicylic acid and benzoic acid are 2 and 250 times slower than
phenol, respectively. It appears that the presence of a aromatic ring substituent such as a
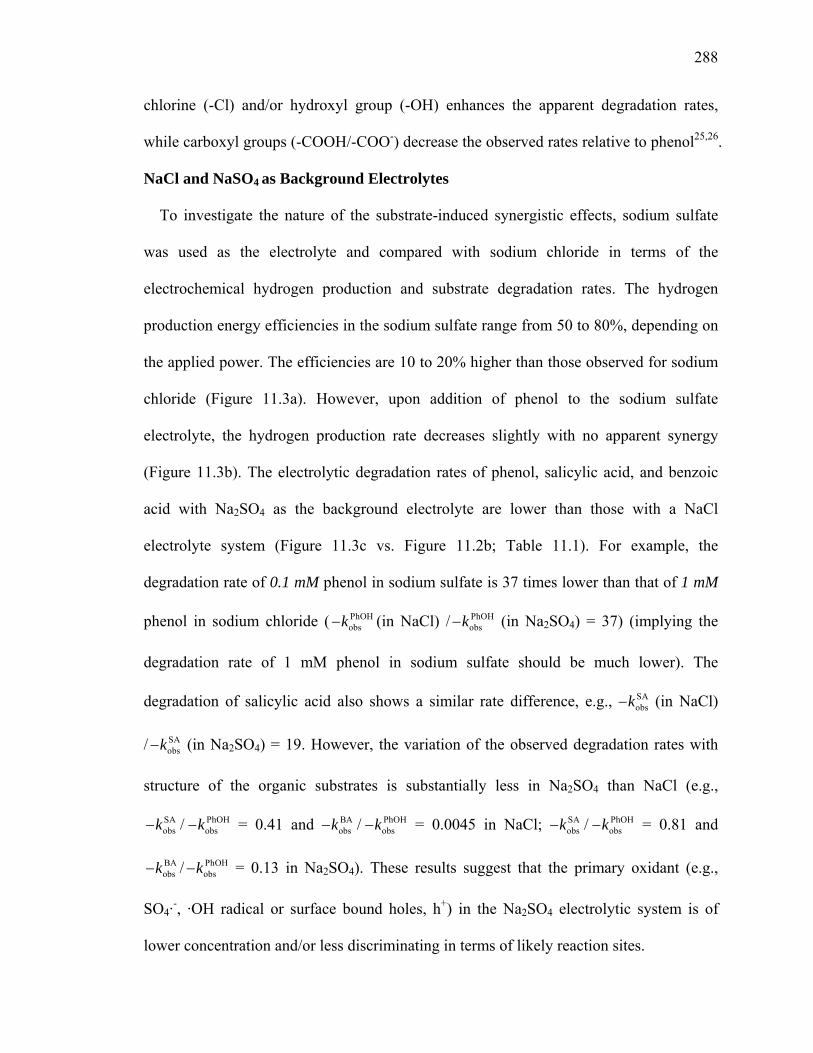
288
chlorine (-Cl) and/or hydroxyl group (-OH) enhances the apparent degradation rates,
while carboxyl groups (-COOH/-COO-) decrease the observed rates relative to phenol25,26.
NaCl and NaSO4 as Background Electrolytes
To investigate the nature of the substrate-induced synergistic effects, sodium sulfate
was used as the electrolyte and compared with sodium chloride in terms of the
electrochemical hydrogen production and substrate degradation rates. The hydrogen
production energy efficiencies in the sodium sulfate range from 50 to 80%, depending on
the applied power. The efficiencies are 10 to 20% higher than those observed for sodium
chloride (Figure 11.3a). However, upon addition of phenol to the sodium sulfate
electrolyte, the hydrogen production rate decreases slightly with no apparent synergy
(Figure 11.3b). The electrolytic degradation rates of phenol, salicylic acid, and benzoic
acid with Na2SO4 as the background electrolyte are lower than those with a NaCl
electrolyte system (Figure 11.3c vs. Figure 11.2b; Table 11.1). For example, the
degradation rate of 0.1 mM phenol in sodium sulfate is 37 times lower than that of 1 mM
phenol in sodium chloride ( (in NaCl) / (in NaPhOHobsk− PhOH
obsk− 2SO4) = 37) (implying the
degradation rate of 1 mM phenol in sodium sulfate should be much lower). The
degradation of salicylic acid also shows a similar rate difference, e.g., (in NaCl)
/ (in Na
SAobsk−
SAobsk− 2SO4) = 19. However, the variation of the observed degradation rates with
structure of the organic substrates is substantially less in Na2SO4 than NaCl (e.g.,
/ = 0.41 and / = 0.0045 in NaCl; / = 0.81 and
/ = 0.13 in Na
SAobsk− PhOH
obsk− BAobsk− PhOH
obsk− SAobsk− PhOH
obsk−
BAobsk− PhOH
obsk− 2SO4). These results suggest that the primary oxidant (e.g.,
SO4·-, ·OH radical or surface bound holes, h+) in the Na2SO4 electrolytic system is of
lower concentration and/or less discriminating in terms of likely reaction sites.
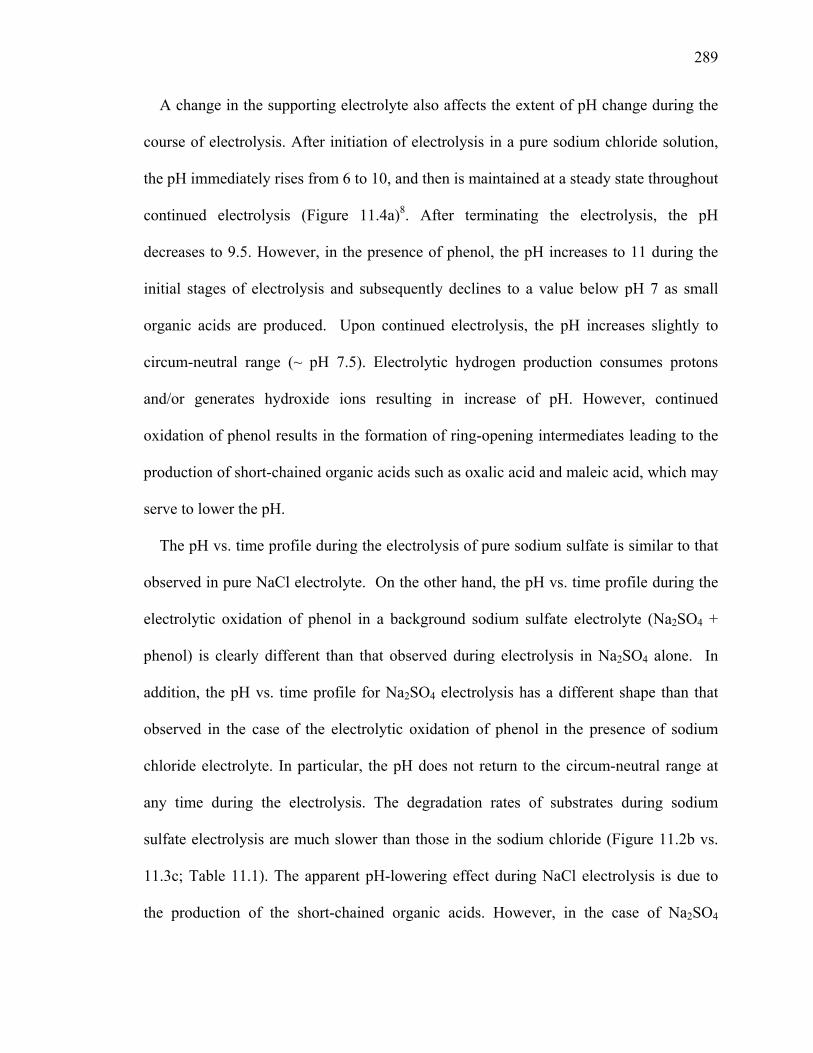
289
A change in the supporting electrolyte also affects the extent of pH change during the
course of electrolysis. After initiation of electrolysis in a pure sodium chloride solution,
the pH immediately rises from 6 to 10, and then is maintained at a steady state throughout
continued electrolysis (Figure 11.4a)8. After terminating the electrolysis, the pH
decreases to 9.5. However, in the presence of phenol, the pH increases to 11 during the
initial stages of electrolysis and subsequently declines to a value below pH 7 as small
organic acids are produced. Upon continued electrolysis, the pH increases slightly to
circum-neutral range (~ pH 7.5). Electrolytic hydrogen production consumes protons
and/or generates hydroxide ions resulting in increase of pH. However, continued
oxidation of phenol results in the formation of ring-opening intermediates leading to the
production of short-chained organic acids such as oxalic acid and maleic acid, which may
serve to lower the pH.
The pH vs. time profile during the electrolysis of pure sodium sulfate is similar to that
observed in pure NaCl electrolyte. On the other hand, the pH vs. time profile during the
electrolytic oxidation of phenol in a background sodium sulfate electrolyte (Na2SO4 +
phenol) is clearly different than that observed during electrolysis in Na2SO4 alone. In
addition, the pH vs. time profile for Na2SO4 electrolysis has a different shape than that
observed in the case of the electrolytic oxidation of phenol in the presence of sodium
chloride electrolyte. In particular, the pH does not return to the circum-neutral range at
any time during the electrolysis. The degradation rates of substrates during sodium
sulfate electrolysis are much slower than those in the sodium chloride (Figure 11.2b vs.
11.3c; Table 11.1). The apparent pH-lowering effect during NaCl electrolysis is due to
the production of the short-chained organic acids. However, in the case of Na2SO4

290
electrolytic phenol oxidation, the short-chain carboxylates are either not electrolysis
intermediates or not produced on the timescale of the current electrolysis experiments.
This is consistent with the observation that CO2 is not produced during the course of
phenol electrolysis in the presence of sodium sulfate.
Primary Reactive Intermediate Species
The presence of titanol groups (i.e., >TiOH) on the hydrated, anodic TiO2 surface
implies that the initiation of the oxidation proceeds via formation of either a surface-
bound hydroxyl radical (>Ti-OH•) or a free hydroxyl radical (•OH) (A1 in Table 11.2).
The initiation of the cathodic reaction proceeds via the one electron-reduction of
dissolved oxygen molecules (A7 and E1), protons, or water (E2). However, further
reactions may have many parallel or sequential steps in which the supporting electrolyte
is either directly or indirectly involved the subsequent reactions. For example, the
electrochemical oxidation of organic substrates in the presence of a sodium chloride
electrolyte has six or more possible oxidation pathways. They include direct electron
transfer from the substrate to surface-bound OH•, and indirect homogeneous reactions
with free OH•, Cl•, Cl2•−, HClO/ClO−, and H2O2 (Table 11.2).
>TiOH•/OH•
Figures 11.5a and b show the correlation between the normalized pseudo-first-order
electrolysis rates for the substrates ( ) and the relative bimolecular
reaction rate constants of
o S Phobs obs obs = - /- k k k OH
•OH and Cl2•− with respect to phenol ( ;
)
oOH OH+S OH+PhOH = / k k k
- - -2 2 2
oCl Cl +S Cl +PhOH
= / k k k 27–29. The vs. data are not correlated. This suggests that
hydroxyl radicals are not the primary oxidant involved in the anodic reactions. The
steady-state concentration of OH radicals (i.e., [
oobsk o
OHk
•OH] = [>Ti-OH•] + [free •OH]) can be

291
estimated assuming that 20% of applied current generates oxygen (i.e., 2Oan an0.2I I= ) and
the reaction of OH radical with Cl− is the dominant OH• pathway
( ). The assumption of - -- -
OH+SOH+Cl OH+ClO[Cl ] >> [ClO ] + [S]k k k 2O
an an/I I = 0.2 is valid, since
typical H2/O2 ratio is approximately 7 and the cathodic hydrogen production current
efficiency is 70% (i.e., H2/O2 = 7; Icell = Ian = Ica; 2Hca ca/I I = 0.7; 2 2O
an ca = 2 HI I× , thus
). 2Oan an/ = 0.2I I
2
- -
O- -an an
OH+SOH+Cl OH+ClO
4 - [OH ] = ( [Cl ] + [ClO ] + [S])[OH ]t 4FV
I Id k k kd
••− (11.4)
2
-
Oan an
SS -SSOH+Cl
4 - [OH ] = 4FV( [Cl ] )
I Ik
• (11.5)
At Icell = 0.375A and in the presence of 50 mM NaCl, the steady-state hydroxyl radical
concentration is estimated to be 1.6 × 10⁻¹⁵ mol cm-2 at the anode surface (corresponding
to 8.6×10⁻¹⁵ mol L-1 if all OH• were released to solution). This number is seven orders of
magnitude smaller than the typical site density of >Ti-OH groups on colloidal TiO2 (i.e.,
assuming 5 hydroxy sites nm-2), which is equivalent to 1×10⁻⁸ mol-OH cm-2 30. Thus,
once produced, the surface-bound or free hydroxyl radical immediately reacts with
chloride ion to yield Cl•. The low >TiOH• concentration also yields a large number of
potential binding sites for a substrate sorption to the TiO2 surface and direct electron
transfer reactions may occur simultaneously with homogeneous oxidations.
Cl•
The possible active chlorine species include Cl•, Cl2•−, HClO, and ClO-. In aqueous
solution, the active chlorine species will be in equilibrium with each other and their redox
292
potentials are as follows: E°(Cl•/Cl-) > E°(Cl2•−/2Cl−) > E°(HClO/0.5Cl2) > E°(Cl-/HClO)
> E°(Cl-/ClO-) (D1–D3)31. From a thermo-chemical perspective, Cl• is the most reactive
species towards one electron oxidation. It has a similar reactivity when compared to •OH
radical (E°(OH•/H2O) = 2.7 V)29. And the Cl• second-order rate constants for reaction
with a wide range of aliphatic organic compounds (RH) are well correlated (kOH+RH vs.
kCl+RH).32 Cl• readily undergoes rapid addition, hydrogen-abstraction, and direct electron
transfer reactions with aromatics at second-order rate constants ranging from 108 to 109
M-1 s-1. Cl• is generated through a transient adduct of Cl- with the >Ti-OH• group at the
anode surface, or by direct hole oxidation of >TiOHCl− surface groups and subsequent
protonation of the adduct (A4). Assuming all reactions are diffusion controlled, the Cl•
branching ratio depends on the Cl− concentration relative to S concentration; at low [Cl-
]/[S] < 1 , the reaction of Cl• with substrates is predominant, whereas at high [Cl-]/[S] > 1
concentration, Cl2•− formation should occur preferentially32,33. The relatively high Cl−
concentration (50 mM) as compared to substrates (~ 1 mM) in our system pushes Cl•
branching towards Cl2•− formation. The nondetection of Cl2(g) is consistent with Cl2
•−
formation (i.e., B3 and B5 are negligible).
Cl2•-
At high background chloride concentrations, [Cl-]/[S] > 1, Cl2•− should dominate the
active chlorine species. When values are plotted against known values for
phenol, salicylic acid, hydroquinone, and benzoic acid, an excellent linear correlation is
obtained (R
oobsk -
2
oCl S• +
k
2 > 0.99), as shown in Figure 11.5b. This strongly indicates that the dichloride
radical anion is a primary oxidant species during electrolysis with sodium chloride. The
293
dichloride radical anion is in equilibrium with Cl• and Cl− (B4: Keq = 1.4×10⁵ M-1; [Cl-] =
50 mM, [Cl2•−]/[Cl•] = 7×10³) and the forward reaction is diffusion controlled28,34,35. Like
Cl•, Cl2•− reacts with organics via hydrogen abstraction, electrophilic addition, and direct
electron transfer mechanisms. However, Cl2•− bimolecular oxidation kinetics is typically
two to four orders of magnitude slower than Cl•. Cl2•− reacts with the aliphatic
compounds primarily through a hydrogen abstraction mechanism with rate constants
ranging from < 103 to 106 M-1 s-1 36,37. The H-abstraction rates are controlled by the C-H
bond dissociation energy. In addition, deprotonated substrates are less reactive than their
protonated counterparts. For example, the reaction rate of Cl2•− with formic acid is two to
three orders of magnitude greater than with formate (Table 11.1), consistent with H-
abstraction being the predominant mechanism. Cl2•− oxidation mechanisms and kinetics
are also affected by size (i.e., steric hindrance) and electron donating/withdrawing
character of aromatic substituents.
The reaction of Cl2•− with aromatic compounds involves H-atom abstraction, direct
electron transfer or electrophilic addition, with rate constants ranging from 106 to 109 M-
1s-1. A previously reported Hammett plot of para-substituted phenols indicates that
electron-withdrawing substituents such as -COOH and -CN decrease the rate relative to
phenol, whereas electron-donating substituents such as -OCH3, -COO-, and -OH,
increase the rate relative to phenol36. The results suggest an electrophilic addition or
direct electron transfer mechanism, which would benefit from increased electron density,
are active. Figure 11.5d shows a plot between and the corresponding Hammett (σ)
constants. The observed V behavior suggests Cl
oobsk
2•− oxidation has two branching
pathways38,39. The negative correlation (-0.4 < σ < 0.2, R2 > 0.93) is in agreement with

294
previous pulse radiolysis results, suggesting a Cl-addition or direct electron transfer
pathway. Once σ > 0.2, is positively correlated with σ, indicating a change in the
Cl
oobsk
2•− oxidation mechanism. The addition of bulky Cl-subtituents may sterically hinder
Cl2•− from an intimate encounter with the phenol retarding a Cl-addition or direct electron
transfer pathway. Steric hindrance could explain why Cl-addition/electron transfer is no
longer the primary pathway, but can not explain the rate increase. The subsequent
addition of electron withdrawing groups removes electron density from the ring and
weakens the remaining Ar-H bonds. Cl2•− H-abstraction rates with aliphatics are directly
proportional to the C-H bond strength. This would suggest a Cl2•− H-abstraction
mechanism is present in the positive correlation regime. Another plausible explanation is
that the increased electron-withdrawing character will reduce the pKa and a shift in
branching pathway is the result of aqueous speciation (i.e, phenol vs. phenoxide).
HOCl/OCl-
Hypochlorous acid (HOCl) or hypochlorite (ClO-) can be electrochemically produced
via a number of mechanisms: direct hole oxidation of >Ti-OHCl•- at the anode surface
(A5), Cl2•−-oxidation of H2O (B7), or by reaction of Cl2
•− and >Ti-OH•/OH• (here no
distinction between surface-bound and free OH radical) (B8). Many investigators argue
that hypochlorous acid (E° = 1.63V) and hypochlorite ion (E° = 0.90V) are the primary
oxidants in the electrochemical degradation of organics in a sodium chloride
medium9,10,12,18,24. In this study, the production of hypochlorite was only observed during
the electrolysis of NaCl in the absence of organics (Figure 11.6a). During NaCl
electrolysis, hypochlorite increases in concentration reaching a plateau of 5 mM after 1 h
of electrolysis. Absence of HOCl/OCl− accumulation in the presence of phenol would
295
suggest a HOCl/OCl− loss mechanism via substrate oxidation. However, as shown in
Figure 11.5c there is no correlation between the normalized electrochemical oxidation
rates ( ) and the normalized bimolecular rate constants of HOCl with substrates
( ). Additionally, HOCl has relatively slow second-order rate constants with phenol
(e.g., = 2.19 × 10
oobsk
oHOClk
HOCl+PhOHk 4 M-1 s-1 and / = 1.14 × 10⁻²Cl +PhOH
k • HOCl+PhOHk 5) and becomes
even slower with OH- or Cl-addition (i.e., 101 to 103 M-1 s-1, / = 3.11 ×
10
-2Cl +HQ
k • HOCl+HQk
6)40. An alternative mechanism is proposed by examining the pathways for HOCl
production which involve Cl2•− as an intermediate (B7, B8). Substrate addition will
consume Cl2•− subsequently inhibiting the HOCl production pathways. The alternative
mechanism HOCl inhibition through intermediate Cl2•− consumption is consistent with
kinetic correlations and time-dependent HOCl observation.
The effect of the hypochlorite on electrochemistry was investigated by spiking the
reactor to 5 mM NaOCl during electrolysis of 50 mM NaCl at a constant cell voltage
(Ecell = 3.17 V, Figure 11.6b). Immediately after addition, the hydrogen production rate
decreased, then slowly recovered and eventually exceeded the initial production rate. The
oxygen production rate increased upon NaOCl addition and retained a higher production
rate during continued electrolysis. The addition of sodium hypochlorite also increased the
cell current from 0.38 A to 0.44 A. A subsequent NaOCl addition yielded similar results
(i.e, the cell current increases again from 0.43 A to 0.50 A). After continued electrolysis,
a slight decrease in cell current is observed (e.g., 0.44 A to 0.43 A; 0.50 A to 0.48 A).
ClIO− can be electrochemically oxidized to chlorate ion (ClVO3−) with simultaneous
generation of oxygen (B20) or reduced to chloride ion (D3). The oxidative pathway (B20)
296
increases the overall oxygen production, while the reductive pathway (D3) competitively
reduces the hydrogen production (E2) leading to initial decrease of the hydrogen
production rate. The oxidative pathway (B20) yields a greater electron flow through the
circuit and increases the cell current and the hydrogen production rate as the electrolysis
proceeds. It was reported that chlorate anion (ClO3-) is produced either when
hypochlorous acid is hydrolyzed (B20)12 or when Cl2 gas is released at a boron-doped
diamond electrode41.
H2O2
Hydrogen peroxide (H2O2) can be produced by an anodic surface recombination
pathway (A3), through hydroxyl radical recombination (B8), or hydroperoxy radical
recombination (A7c). The oxidation of substrates such as phenol with NaCl as an
electrolyte does not produce any hydroxylated intermediates (e.g., catechol,
hydroquinone, resorcinol); instead, only chlorinated phenols such as 2-/4-chlorophenol,
2,4-/2,6-dichlorophenol, and 2,4,6-trichlorophenol were observed as intermediates7,8.
This suggests that even if hydrogen peroxide is produced, it contributes little to the
oxidation of the substrates. Hydrogen peroxide can be oxidized by the hydroxyl radical
(B9, k = 2.7 × 10⁷ M-1 s-1) or Cl2•− (B12, k = 1.4 × 10⁵ M-1 s-1) to hydroperoxyl radical
(HOO•), which is further oxidized by Cl2•− to oxygen (B13) at diffusion-limited rates (k =
3 × 10⁹ M-1 s-1). In addition, hydrogen peroxide may also react with chloride ion under
present conditions yielding HOCl (B14). Despite the bulk alkaline pH (Figure 11.4a), the
near-surface region (i.e., within electrical double layer) of the metal-doped TiO2 anode
should have a lower pH due to the presence of surface-bound Lewis acid metals, driving
reaction B14 and subsequent reaction of H2O2 and HClO (B15) to yield O2.

297
Primary Electrochemical Oxidant
Most studies of the electrochemical degradation of phenolic compounds with NaCl
argue that the primary oxidant is HClO/ClO−9,10,12,18,24, which has been reported to
chlorinate phenol42,43. In contrast, we argue that Cl2•− is the primary oxidant and that
HClO/ClO− plays a only minor role, if any, in the overall oxidation mechanism. Cl2•− has
a greater one-electron oxidation potential than HClO/ClO− by 0.5/1.0 eV, and its reaction
rate constants with organics are approximately five orders of magnitude greater. In
addition, the relative bimolecular rate constants of Cl2•− with various substrates correlate
well with the observed reaction kinetics (Figure 11.5d). On the other hand there is no
correlation between relative HOCl rate constants and the observed kinetics (Figure 11.5c).
Additionally, Cl2•− consumption during substrate oxidation (C5a) will inhibit HOCl
production (B7, B8) consistent with experimental results.
NaCl electrolysis without substrate produces active chlorine species at the anode,
which can be reduced at the cathode (Scheme 11.1) yielding a null chemical cycle. Thus,
the chlorine species act as an electron relay between the anode and the cathode,
ultimately limiting H2 production rates. Upon substrate addition during electrolysis at a
constant cell voltage (Ecell) the active chlorine species rapidly oxidizes the substrates,
inhibiting the electron-shuttle pathway consistent with the observed decrease in Icell.
Despite the lower Icell, H2 production increases because a greater fraction of the cathodic
electrons are available for H2O/H+ reduction, as they are no longer scavenged by active
chlorine. If the substrates are not oxidized by the chlorine species, hydrogen production is
not enhanced. This argument explains why the extent of synergism is substrate-specific

298
and dependent upon the substrate oxidation kinetics (i.e., depletion of active chlorine
electron scavengers).
For example, the substitution-dependent trend of the observed pseudo-first-order rates
in sodium chloride is > > ~ > >> , which
parallels the apparent order of synergistic effects (i.e., ΔEE), PhOH > 2-CP > 4-CP > SA
> CC >> BA. Figure 11.7 shows the linear correlations of –k
PhOHobsk− 2-CP
obsk− 4-CPobsk− CC
obsk− SAobsk− BA
obsk−
obs vs. -ΔIcell and –kobs vs.
ΔEE with R2 = 0.90 and 0.91, respectively. This indicates that the substrate oxidation
kinetics significantly influences the cathodic hydrogen production. The minimal
synergism observed for catechol, in spite of relatively fast electrolytic degradation, can be
attributed to a different reaction mechanism. Due to neighboring aromatic -OH groups,
catechol adsorbs strongly to the metal oxide surface. Catechol oxidation is likely due to
direct electron transfer of the adsorbed (i.e., chelated) catechol to a hole at the anode
surface. If the chloride radical anion is, in fact, the primary active chlorine species, then
the substrate-dependent reaction rate can be readily interpreted. For example, is 4.5
times higher than and is 5.6 times higher than , while
/ is 0.41 and / is 0.44. The slow reaction rate of Cl
HQobsk−
PhOHobsk− -
2Cl +HQk • -
2Cl +PhOHk •
SAobsk−
PhOHobsk− -
2Cl +SAk • -
2Cl +PhOHk • 2
•− with
aliphatic substrates is consistent with the lack of synergy.
Effects of Variable Reaction Parameters
An increase in the concentration of the active chlorine species should affect the
electrolytic degradation rates and, subsequently, the rates of hydrogen production at the
cathode. When the sodium chloride concentration was increased from 0 to 50 mM in a
background sodium sulfate electrolyte (50 mM), was observed to increase PhOHobsk−
299
linearly (Figure 11.8a). Since is the product of the true first-order rate constant
( ) and the concentration of the reactive chlorine species (N
Sobsk−
-2Cl +S
k • Cl2•−ss) which can be
varied experimentally, the intrinsic contribution of the active chlorine species to the
degradation of phenol, α, can be estimated simply by plotting vs. [NaCl]. Sobsk−
- -2 2
Sobs Cl +S Cl
d[S] [S] = N [S]dt
k k • •= − × × × (11.6)
(11.7) - -2 2
Sobs Cl +S Cl
= N = [NaCl]k k α• •− ×
Sobs =
[NaCl]k α− (11.8)
α is determined to be 1.8 M-1 min-1 with a R2 > 0.99 at 1 mM phenol, 50 mM Na2SO4,
and Icell = 14.7 mA cm-2. However, when oxidation rates of 50 mM NaCl + 50 mM
Na2SO4 are compared to 50 mM NaCl (without Na2SO4), the latter is found to be higher
than the former by a factor of two. This indicates that when present together, the two
electrolytes compete for anodic oxidation, and as a consequence, the steady-state
concentration of active chlorine radical species are reduced.
The sodium chloride concentration is observed to play a negative role on cathodic
hydrogen production, even when present with Na2SO4. For example, the current
efficiency for the hydrogen production is optimized at 96% under 50 mM Na2SO4,
decreases to 80% under 50 mM NaCl + 50 mM Na2SO4, and is further lowered to 73%
under 50 mM NaCl. This observation further confirms that active chlorine radical species
act as an electron-shuttle between the anode and the cathode, whereas the primary
oxidized sulfate species is not an effective electron shuttle. Therefore, electrolytic
production of active chlorine species from chloride has a negative effect on the net

300
cathodic process of H2 production relative to sulfate, but a positive effect on the anodic
substrate oxidation.
In addition to the concentration of the supporting electrolyte, the applied cell current
also directly affects the efficiencies of the hybrid reactions. is linearly correlated to
I
Sobsk−
cell with a slope of 12.6 min-1A-1cm2 (R2 > 0.98). As a consequence, the reaction of 1 mM
phenol at Icell values up to 40 mA cm-2 is in the reaction-limited regime. In this regime,
the overall reaction rate is limited by the low steady-state concentration of aqueous
oxidizing radicals within the dynamic reaction zone. Thus, less-active chlorine species
are produced at the anode than are required to oxidize all of the substrate molecules that
enter the reaction zone. The pseudo-first-order kinetics is representative of competition
between the initial substrate and its intermediates for oxidizing radicals. The number of
dichloride radical anions can be estimated in this regime (eq. 11.9).
-2
-2
Sobs
ClCl +S
N = kk•
•
− (11.9)
At a Icell = 14.7 mA/cm2, ([Cl2•−]ss is calculated to be 1.4 × 10⁻¹¹ mol L-1). This value is
three orders of magnitude greater than the number of hydroxyl radicals estimated from eq.
11.5, but still many orders of magnitude lower than typical substrate concentration, [S].
In contrast, the cathodic hydrogen production rate does not correlate linearly with the Icell;
rather, its current efficiency increases from 45% at 7 mA cm-2 to 67% at 14.7 mA cm-2,
and then levels off at higher Icell.8 As the Icell value increases, more H2 is produced.
However, the H2 current efficiency decreases due to increasing number of dichloride
radical anions that are produced, which can scavenge electrons.
301
In a sodium sulfate electrolyte system, analogous to the chloride system, a one-electron
oxidation of sulfate to the sulfate radical (SO4•−) is predicted to produce the primary
reactive species (eq. 11.10). In spite of the high redox potential of the sulfate radical, the
substrate oxidation rates are two orders of magnitude lower than observed with sodium
chloride. This is at variance with expectations from previously reported SO4•− oxidation
kinetics (i.e, = 10 - 100).- -4 2SO +Ar Cl +Ar
/k k 36 Thus, if free SO4•− was produced, phenol
degradation in Na2SO4 would be faster than in NaCl, suggesting that if SO4•− is produced,
it is strongly bound to the metal oxide surface. Surface-bound SO4•− may react with
another surface-bound SO4•− to produce persulfate, S2O8
2− (eq. 11.11) or surface-bound
SO4•− may react with surface-bound •OH to produce peroxymonosulfate, SO5H−. As non-
radical species that would require a two-electron reduction, S2O82− would scavenge
cathodic electrons at a much slower rate than Cl2•−. Persulfate can be homolytically
cleaved into two sulfate radicals photolytically or thermally44,45. but is stable under
ambient conditions. Persulfate can be transformed into two sulfate anions and oxygen (eq
11.12) or a peroxymonosulfate and sulfate (eq 11.13). Peroxymonosulfate can be
transformed into hydrogen peroxide and sulfate (eq 11.14).
2- - -4Ti-OH + SO Ti-OH (e ) + SO4
• •> → > (11.10)
(11.11) - -4 4 2SO + SO S O• • → 2-
8
4
(11.12) 2- 2- +2 8 2 4 2S O + H O 2SO + 2H + 0.5O→
(11.13) 2- 2- 2- +2 8 2 5 4S O + H O SO + SO + 2H→
(11.14) 2- 2-5 2 2 2SO + H O H O + SO→

302
Figures
Figure 11.1. H2, O2, and CO2 production during phenol electrolysis. Ecell = 3.1 V. The
BiOx-TiO2-Ti anode and stainless-steel cathode couple was immersed in 50 mM NaCl
(0.2 L) where N2 was continuously purged through solution. 1.0 mM phenol was spiked
at intervals into the solution (as indicated by arrows). The system control was H2
production via pure water electrolysis without addition of phenol.
Time (min)0 100 200 300 400
[H2 ]
, [O
2 ] ( μ
mol
/min
)
0
20
40
60
80
100
120
[CO
2 ] ( μ
mol
/min
)
0
5
10
15
20
O2
CO2
Control H2
H2
O2
phenol phenol phenol
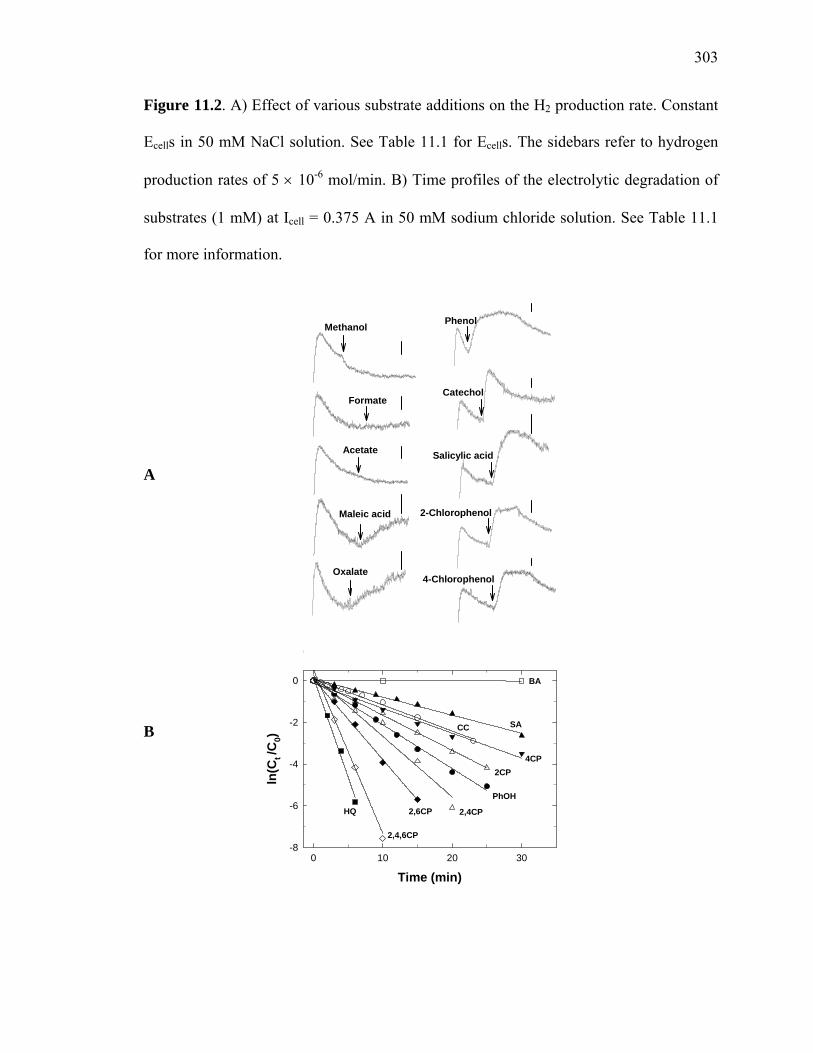
303
Figure 11.2. A) Effect of various substrate additions on the H2 production rate. Constant
Ecells in 50 mM NaCl solution. See Table 11.1 for Ecells. The sidebars refer to hydrogen
production rates of 5 × 10⁻⁶ mol/min. B) Time profiles of the electrolytic degradation of
substrates (1 mM) at Icell = 0.375 A in 50 mM sodium chloride solution. See Table 11.1
for more information.
A
B
Methanol
Formate
Acetate
Maleic acid
Oxalate
Catechol
4-Chlorophenol
Salicylic acid
2-Chlorophenol
Phenol
Time (min)0 10 20 30
ln(C
t /C0)
-8
-6
-4
-2
0
PhOH
CC
HQ
BA
SA
2CP4CP
2,4CP2,6CP
2,4,6CP
a
b
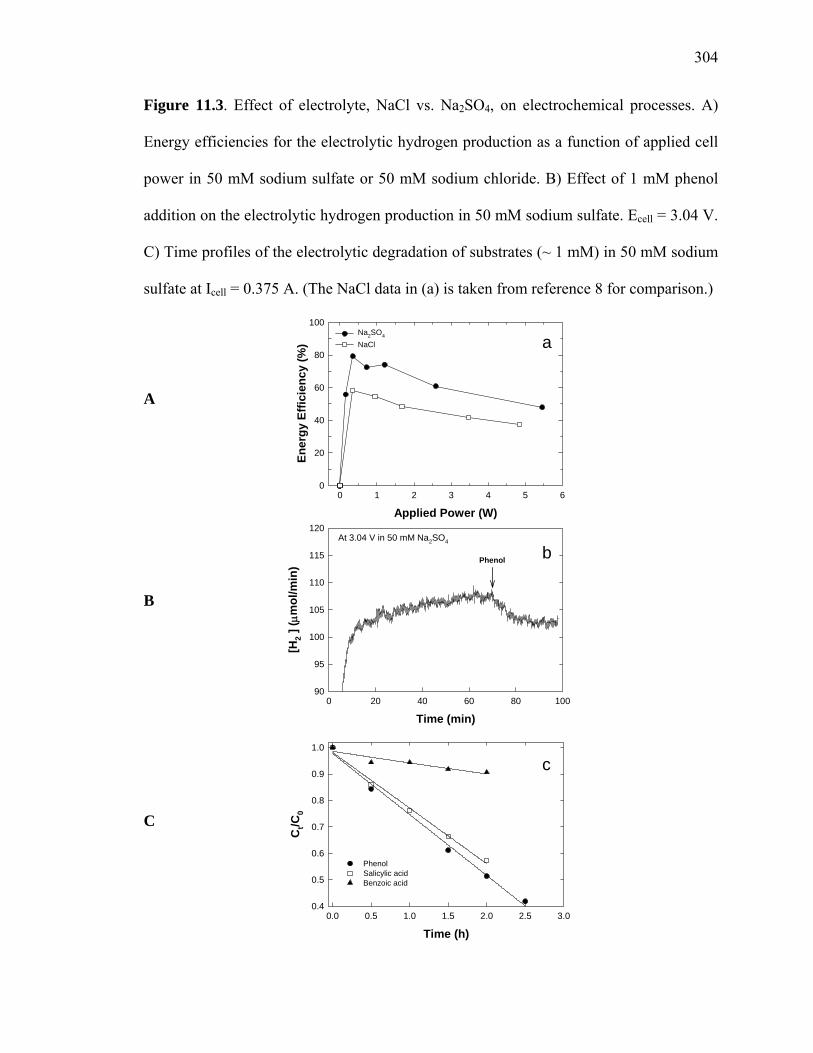
304
Figure 11.3. Effect of electrolyte, NaCl vs. Na2SO4, on electrochemical processes. A)
Energy efficiencies for the electrolytic hydrogen production as a function of applied cell
power in 50 mM sodium sulfate or 50 mM sodium chloride. B) Effect of 1 mM phenol
addition on the electrolytic hydrogen production in 50 mM sodium sulfate. Ecell = 3.04 V.
C) Time profiles of the electrolytic degradation of substrates (~ 1 mM) in 50 mM sodium
sulfate at Icell = 0.375 A. (The NaCl data in (a) is taken from reference 8 for comparison.)
A
B C
Time (h)0.0 0.5 1.0 1.5 2.0 2.5 3.0
Ct/C
0
0.4
0.5
0.6
0.7
0.8
0.9
1.0
PhenolSalicylic acidBenzoic acid
Applied Power (W)0 1 2 3 4 5 6
Ener
gy E
ffici
ency
(%)
0
20
40
60
80
100Na2SO4
NaCl
At 3.04 V in 50 mM Na2SO4
Time (min)0 20 40 60 80 100
[H2 ]
( μm
ol/m
in)
90
95
100
105
110
115
120
Phenol b
c
a

305
Figure 11.4. Time profiles of pH variation during electrolysis with and without phenol.
[Phenol]0 = 1 mM A) in 50 mM sodium chloride and B) in 50 mM sodium sulfate. Icell =
0.375 A. (Figure (A) is taken from reference 8 for comparison.)
A B
Time (min)0 40 80 120 160
pH
6
7
8
9
10
Na2SO4 Na2SO4+PhOH
ON
Time (min)0 40 80 120 160
pH
6
7
8
9
10
11
12
NaClNaCl+PhOH
ON
a
b
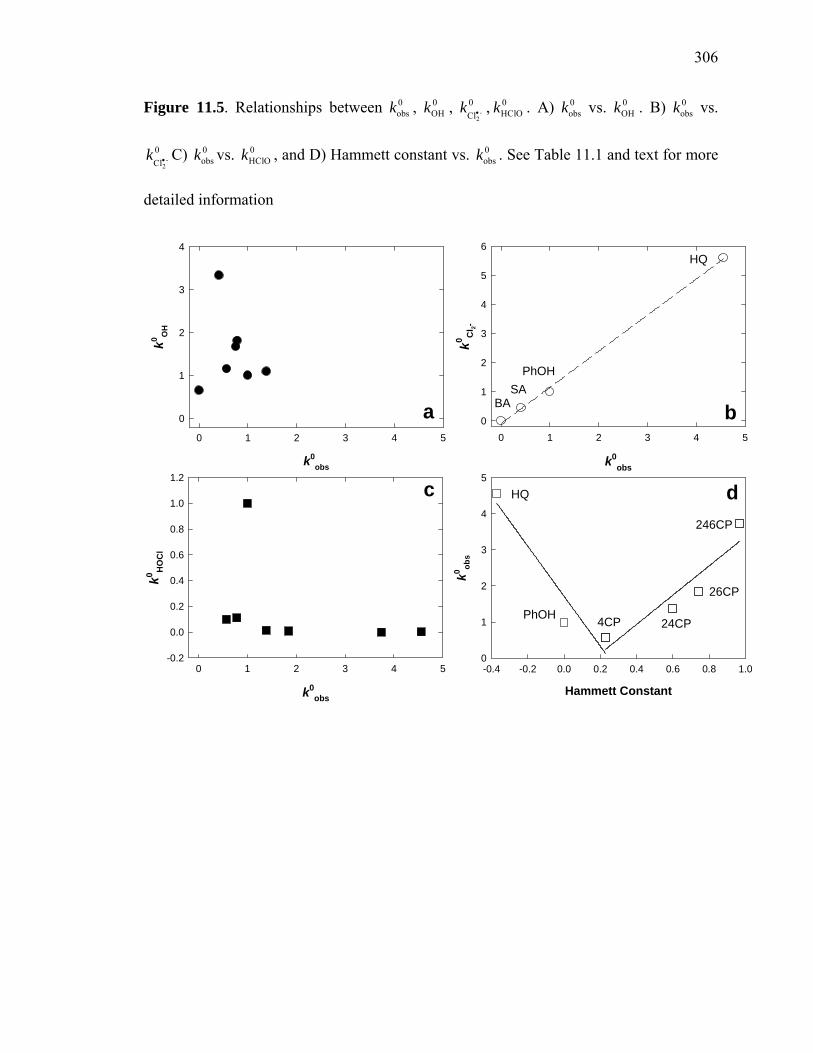
306
Figure 11.5. Relationships between , , 0obsk 0
OHk -2
0Cl
k • , . A) vs. . B) vs.
C) vs. , and D) Hammett constant vs. . See Table 11.1 and text for more
detailed information
0HClOk 0
obsk 0OHk 0
obsk
-2
0Cl
k •0obsk 0
HClOk 0obsk
a
k0obs
0 1 2 3 4 5
k0 OH
0
1
2
3
4
c
k0obs
0 1 2 3 4 5
k0 HO
Cl
-0.2
0.0
0.2
0.4
0.6
0.8
1.0
1.2
b
k0obs
0 1 2 3 4 5
k0 Cl 2-
0
1
2
3
4
5
6
d
Hammett Constant
-0.4 -0.2 0.0 0.2 0.4 0.6 0.8 1.0
k0 obs
0
1
2
3
4
5
PhOH
HQ
SABA
PhOH
HQ
4CP 24CP
26CP
246CP
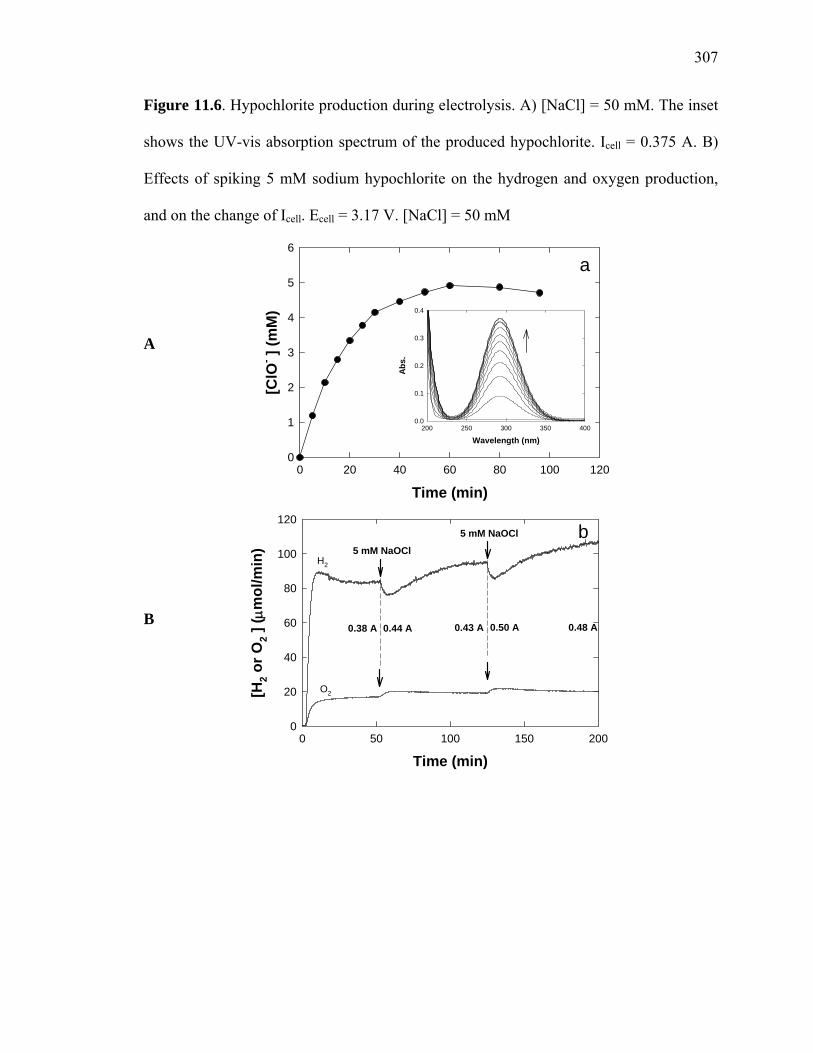
307
Figure 11.6. Hypochlorite production during electrolysis. A) [NaCl] = 50 mM. The inset
shows the UV-vis absorption spectrum of the produced hypochlorite. Icell = 0.375 A. B)
Effects of spiking 5 mM sodium hypochlorite on the hydrogen and oxygen production,
and on the change of Icell. Ecell = 3.17 V. [NaCl] = 50 mM
A B
Time (min)0 50 100 150 200
[H2 o
r O2 ]
( μm
ol/m
in)
0
20
40
60
80
100
120
0.38 A 0.44 A 0.43 A 0.50 A 0.48 A
5 mM NaOCl
5 mM NaOCl
H2
O2
Time (min)0 20 40 60 80 100 120
[ClO
- ] (m
M)
0
1
2
3
4
5
6
Wavelength (nm)200 250 300 350 400
Abs.
0.0
0.1
0.2
0.3
0.4
a
b
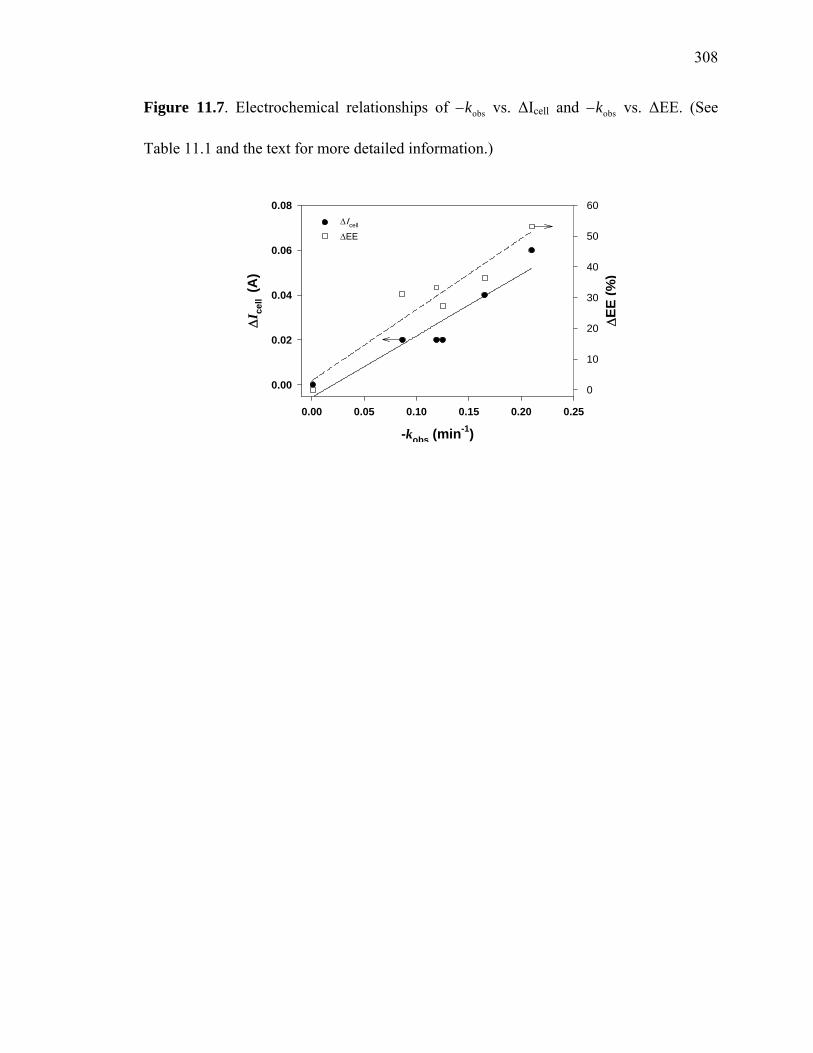
308
Figure 11.7. Electrochemical relationships of vs. ΔIobsk− cell and vs. ΔEE. (See
Table 11.1 and the text for more detailed information.)
obsk−
-kobs (min-1)0.00 0.05 0.10 0.15 0.20 0.25
ΔI ce
ll (A
)
0.00
0.02
0.04
0.06
0.08
ΔEE
(%)
0
10
20
30
40
50
60ΔIcell
ΔEE
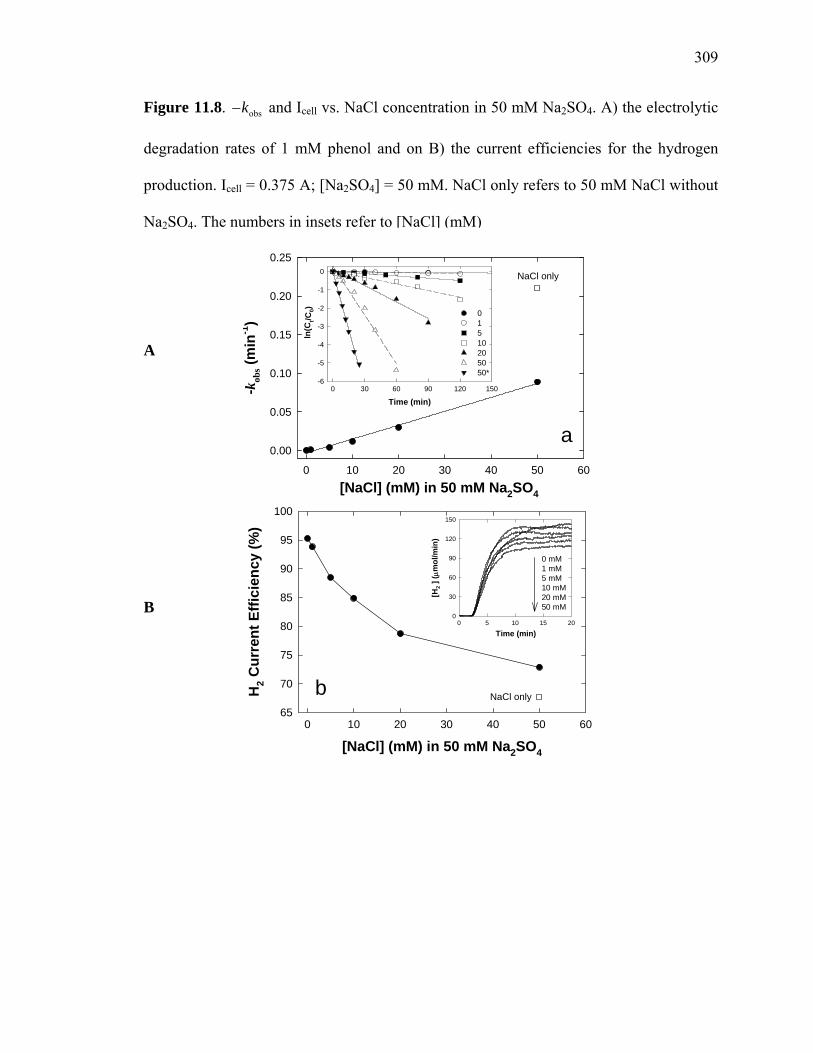
309
Figure 11.8. and Iobsk− cell vs. NaCl concentration in 50 mM Na2SO4. A) the electrolytic
degradation rates of 1 mM phenol and on B) the current efficiencies for the hydrogen
production. Icell = 0.375 A; [Na2SO4] = 50 mM. NaCl only refers to 50 mM NaCl without
Na2SO4. The numbers in insets refer to [NaCl] (mM)
A B
[NaCl] (mM) in 50 mM Na2SO4
0 10 20 30 40 50 60
H2 C
urre
nt E
ffici
ency
(%)
65
70
75
80
85
90
95
100
0 mM1 mM5 mM10 mM20 mM50 mM
Time (min)0 5 10 15 20
[H2 ]
( μm
ol/m
in)
0
30
60
90
120
150
NaCl only
[NaCl] (mM) in 50 mM Na2SO4
0 10 20 30 40 50 60
- kob
s (m
in-1
)
0.00
0.05
0.10
0.15
0.20
0.25
Time (min)0 30 60 90 120 150
ln(C
t/C0)
-6
-5
-4
-3
-2
-1
0
015102050 50*
NaCl only
a
b
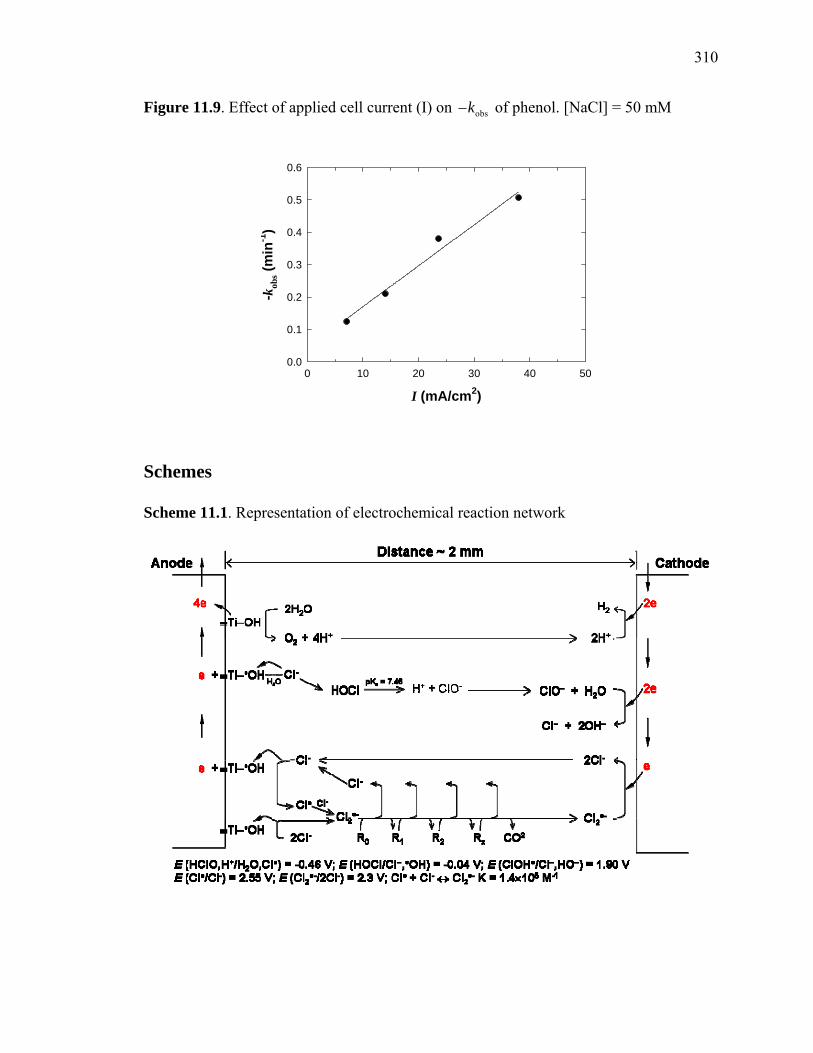
310
Figure 11.9. Effect of applied cell current (I) on of phenol. [NaCl] = 50 mM obsk−
I mA/cm2 vs -rate
I (mA/cm2)0 10 20 30 40 50
- kob
s (m
in-1
)
0.0
0.1
0.2
0.3
0.4
0.5
0.6
Schemes
Scheme 11.1. Representation of electrochemical reaction network

311
Tables
Table 11.1. Electrochemical reaction rates and properties of the substrates
a. PhOH: phenol, CC: catechol, HQ: hydroquinone, 2CP: 2-chlorophenol, 4CP: 4-chlorophenol, 24CP: 2,4-dichlorophenol, 26CP: 2,6-dichlorophenol, 246CP: 2,4,6-trichlorophenol, SA: salicylic acid (2-hydroxy benzoic acid), BA: benzoic acid. b. The observed pseudo-first order reaction rates of substrates in 50 mM NaCl or 50 mM Na2SO4. c. Concentrations of substrates, 1 ~ 2×10⁻³ M; Icell = 0.375 A in 50 mM NaCl or 50 mM Na2SO4. d. The numbers in parenthesis are the reaction rates of the substrate with respect to phenol. e. See ref. 27 f. See ref. 28 and 29. g. See ref. 39.
Substrate ΔH2(μmol /min)i
ΔIcell ΔEE -
2Cl Sk • +
(M-1s-1)fHOCl Sk +
(M-1s-1)g1/2E
(VSCE)haKp cellE S
obsk− Sobsk−
(min-1)b
in NaCl (min-1)b
in Na2SO4
OH
(M+Sk Cl +Sk •
(A)i (%)i(V)i-1s-1)e (M-1s-1)f
Methanol 9.7×10⁸
3.5×10³
15.5 3.10 0 0 0
Formate 3.2×10⁹
1.3×10⁸
1.9×10⁶
3.15 0 0 0
Formic acid
1.3×10⁸
6.7×10³
3.75
Acetate 8.5×10⁷
3.10 0 0 0
Acetic acid
1.6×10⁷
2.0×10⁸ < 1×10⁴
4.76
Maleic acid
6.0×10⁹
3.07 +5 0 8.0
Malonic 1.6×10⁷
acid Oxalate
7.7×10⁶
3.05 +7 0 10.2
Oxalic acid
1.4×10⁶
PhOHa c0.210 c5.64×10-3
(1) 6.6×10⁹
(1) 2.5×10¹⁰ 2.5×10⁸
(1) 2.19×10⁴
(1) 0.633 9.95 3.10 +20 −0.06
(1)d53.1
CC 0.125 (0.59)
1.1×10¹⁰ 0.507 9.85 3.25 +22 −0.02 (1.67)
27.3
HQ 0.957 (4.55)
5.2×10⁹ (0.79)
1.4×10⁹ (5.6)
4.5×101
(2.1×10⁻³) 0.507 9.96
2CP 0.165 (0.78)
1.2×10¹⁰ (1.81)
2.42×10³ 0.625 8.29 (0.11)
3.14 +14 −0.04 36.3
4CP 0.119 (0.57)
7.6×10⁹ (1.15)
2.17×10³
(0.10) 0.653 9.14 3.18 +20 −0.02 33.3
24CP 0.290 (1.38)
7.2×10⁹ (1.09)
3.03×10²
(0.014) 0.645 8.09
26CP 0.388 (1.84)
1.94×10² (8.9×10⁻³)
6.8
246CP 0.787 (3.74)
5.4×10⁹ (0.82)
1.28×101 0.637 (5.8×10⁻⁴)
6.21
SA 0.0865 (0.41)
4.59×10⁻³ 2.2×10¹⁰ 1.1×10⁸ 0.845 2.97 3.17 +12 31.2 −0.02 (pH 13) (0.81) (3.33) (0.44)
BA 1×10⁻³
(0.0045) 7.55×10⁻⁴
(0.13) 4.3×10⁹ (0.65)
2×10⁶ (0.008)
4.20 3.15 0 0 0
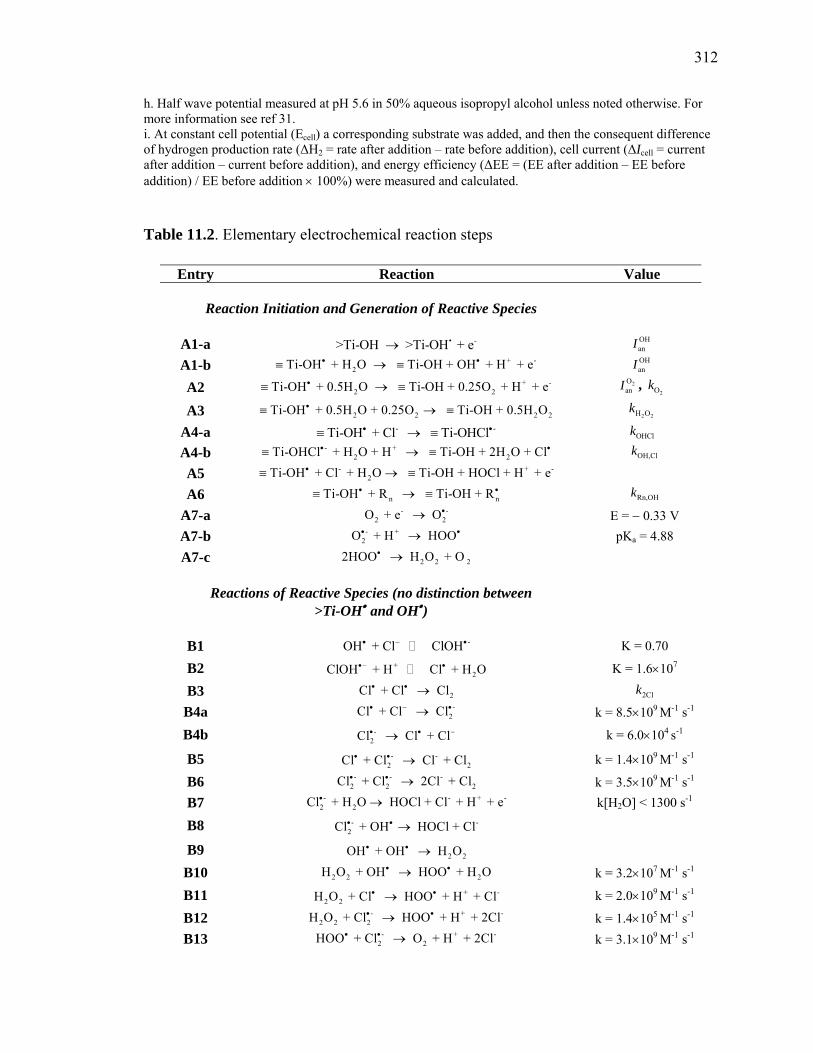
312
h. Half wave potential measured at pH 5.6 in 50% aqueous isopropyl alcohol unless noted otherwise. For more information see ref 31. i. At constant cell potential (Ecell) a corresponding substrate was added, and then the consequent difference of hydrogen production rate (ΔH2 = rate after addition – rate before addition), cell current (ΔIcell = current after addition – current before addition), and energy efficiency (ΔEE = (EE after addition – EE before addition) / EE before addition × 100%) were measured and calculated. Table 11.2. Elementary electrochemical reaction steps
Entry Reaction Value
Reaction Initiation and Generation of Reactive Species
A1-a • ->Ti-OH >Ti-OH + e→ OHanI
A1-b + -2Ti-OH + H O Ti-OH + OH + H + e• •≡ → ≡ OH
anI A2 + -
2 2Ti-OH + 0.5H O Ti-OH + 0.25O + H + e•≡ → ≡ 2OanI ,
2Ok
A3 2 2Ti-OH + 0.5H O + 0.25O Ti-OH + 0.5H O•≡ → ≡ 2 2 2 2H Ok
A4-a - -Ti-OH + Cl Ti-OHCl• •≡ → ≡ OHClk A4-b - +
2 2Ti-OHCl + H O + H Ti-OH + 2H O + Cl• •≡ → ≡ OH,Clk A5 - +
2Ti-OH + Cl + H O Ti-OH + HOCl + H + e•≡ → ≡ - A6 n nTi-OH + R Ti-OH + R• •≡ → ≡ Rn,OHk
A7-a - -2 2O + e O•→ E = − 0.33 V
A7-b - +2O + H HOO• •→ pKa = 4.88
A7-c 2 2 22HOO H O + O• →
Reactions of Reactive Species (no distinction between >Ti-OH• and OH•)
B1 -OH + Cl ClOH• − • K = 0.70
B2 +2ClOH + H Cl + H O•− • K = 1.6×10⁷
B3 2Cl + Cl Cl• • → 2Clk
B4a -2Cl + Cl Cl• − •→ k = 8.5×10⁹ M-1 s-1
B4b -2Cl Cl + Cl• • −→ k = 6.0×10⁴ s-1
B5 - -2 2Cl + Cl Cl + Cl• • → k = 1.4×10⁹ M-1 s-1
B6 - - -2 2Cl + Cl 2Cl + Cl• • → 2
+ -
-
-
k = 3.5×10⁹ M-1 s-1
B7 - -2 2Cl + H O HOCl + Cl + H + e• → k[H2O] < 1300 s-1
B8 - -2Cl + OH HOCl + Cl• • →
B9 2 2OH + OH H O• • →
B10 2 2 2H O + OH HOO + H O• •→ k = 3.2×10⁷ M-1 s-1
B11 + -2 2H O + Cl HOO + H + Cl• •→ k = 2.0×10⁹ M-1 s-1
B12 - +2 2 2H O + Cl HOO + H + 2Cl• •→ k = 1.4×10⁵ M-1 s-1
B13 - +2 2HOO + Cl O + H + 2Cl• • → k = 3.1×10⁹ M-1 s-1
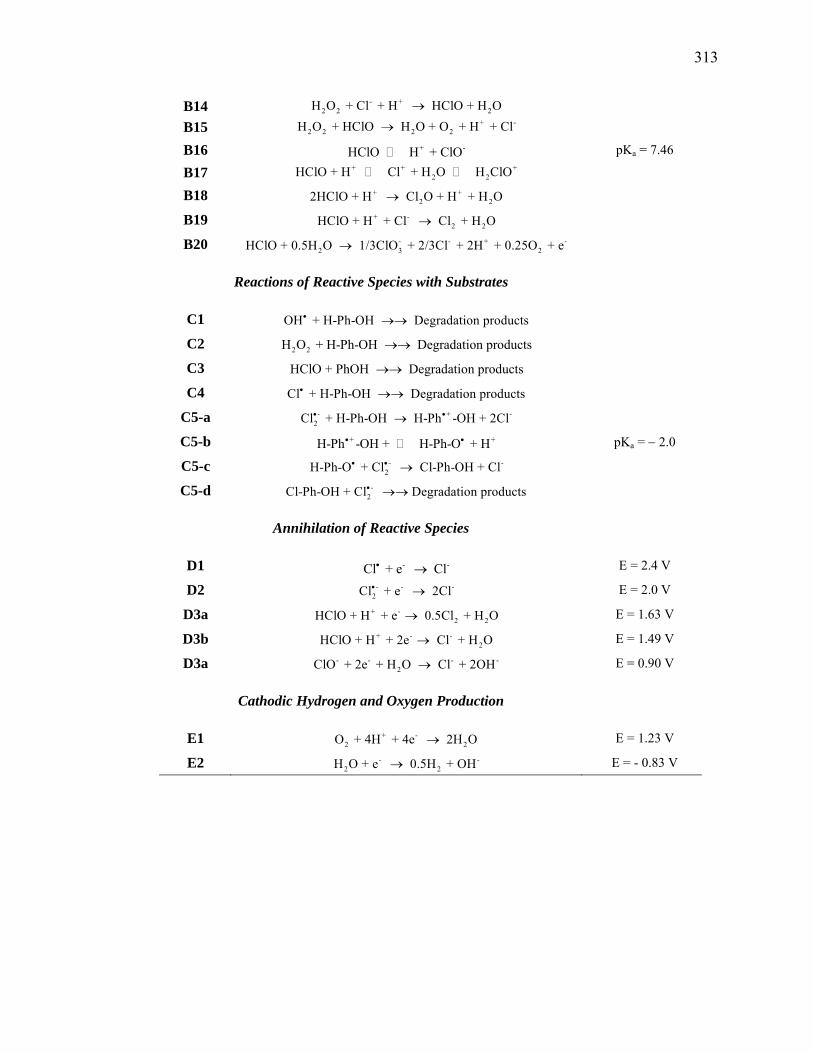
313
- +2 2 2H O + Cl + H HClO + H O→ B14
+ -2 2 2 2H O + HClO H O + O + H + Cl→ B15
+ -HClO H + ClO pKa = 7.46 B16 B17 + +
2 2HClO + H Cl + H O H ClO+
-2
-
+
-
-
+ +
2 22HClO + H Cl O + H + H O→ B18 + -
2 2HClO + H + Cl Cl + H O→ B19 - - +
2 3HClO + 0.5H O 1/3ClO + 2/3Cl + 2H + 0.25O + e→ B20
Reactions of Reactive Species with Substrates
C1 OH + H-Ph-OH Degradation products• →→
2 2H O + H-Ph-OH Degradation products→→ C2
HClO + PhOH Degradation products→→ C3
Cl + H-Ph-OH Degradation products• →→ C4 - +
2Cl + H-Ph-OH H-Ph -OH + 2Cl• •→ C5-a +H-Ph -OH + H-Ph-O + H• • pKa = − 2.0 C5-b
C5-c - -2H-Ph-O + Cl Cl-Ph-OH + Cl• • →
C5-d -2Cl-Ph-OH + Cl Degradation products• →→
Annihilation of Reactive Species
- -Cl + e Cl• → D1 E = 2.4 V - -
2Cl + e 2Cl• → D2 E = 2.0 V + -
2 2HClO + H + e 0.5Cl + H O→ D3a E = 1.63 V + - -
2HClO + H + 2e Cl + H O→ D3b E = 1.49 V - - -
2ClO + 2e + H O Cl + 2OH→ D3a E = 0.90 V
Cathodic Hydrogen and Oxygen Production
+ -2 2O + 4H + 4e 2H O→ E1 E = 1.23 V
- -2 2H O + e 0.5H + OH→ E2 E = - 0.83 V
314
References (1) International Energy Outlook 2006; Energy Information Administration.
(2) Penner, S. S. Energy 2006, 31, 33.
(3) Solar and Wind Technologies for Hydrogen Production, available at
http://www.hydrogen.energy.gov/congress_reports.html.
(4) Ivy, J. Summary of Electrolytic Hydrogen Production: Milestone Completion
Report, available at www.nrel.gov/hydrogen/pdfs/36734.pdf.
(5) Kroposki, B.; Levene, J.; Harrison, K.; P.K., S.; Novachek, F. Electrolysis:
Information and opportunities for electric power utilities, available at
http://www.osti.gov/bridge.
(6) Water and Wastewater Industry Energy Efficiency: A Research Roadmap,
available at http://www.energy.ca.gov/2004publications/CEC.
(7) Park, H.; Vecitis, C. D.; Choi, W.; Weres, O.; Hoffmann, M. R. J. Phys. Chem. C
2008, 112, 885.
(8) Park, H.; Vecitis, C. D.; Hoffmann, M. R. J. Phys. Chem. A 2008, 112, 7616.
(9) Weres, O. National Science Foundation Phase I Final Report (SRC-020) 1995.
(10) Comninellis, C.; Nerini, A. J. Appl. Electrochem. 1995, 25, 23.
(11) Lin, S. H.; Shyu, C. T.; Sun, M. C. Water Res. 1998, 32, 1059.
(12) Bonfatti, F.; Ferro, S.; Lavezzo, F.; Malacarne, M.; Lodi, G.; De Battisti, A. J.
Electrochem. Soc. 2000, 147, 592.
(13) Korbahti, B. K.; Salih, B.; Tanyolac, A. J. Chem. Technol. Biotechnol. 2002, 77,
70.
(14) Wang, J. K.; Farrell, J. Environ. Sci. Technol. 2004, 38, 5232.
315
(15) Fino, D.; Jara, C.; Saracco, G.; Specchia, V.; Spinelli, P. J. Appl. Electrochem.
2005, 35, 405.
(16) Rajkumar, D.; Kim, J. G.; Palanivelu, K. Chem. Eng. Technol. 2005, 28, 98.
(17) Bonfatti, F.; De Battisti, A.; Ferro, S.; Lodi, G.; Osti, S. Electrochim. Acta 2000,
46, 305.
(18) Martinez-Huitle, C. A.; Ferro, S.; De Battisti, A. Electrochem. Solid State Lett.
2005, 8, D35.
(19) Nikolaevsky, R.; Monosov, M.; Monosov, E.; Sharony, E.; Gurevich, D. Method
for Purification of Wastewater from Soluble Substances; U.S. Patent 5,792,336; Aug. 11,
1998.
(20) Zhan, X. M.; Wang, J. L.; Wen, X. H.; Qian, Y. Environ. Technol. 2001, 22, 1105.
(21) Naumczyk, J.; Szpyrkowicz, L.; ZilioGrandi, F. Water Sci. Technol. 1996, 34, 17.
(22) Weres, O. Electrode with Surface Comprising Oxides of Titanium and Bismuth
and Water Purification Process Using This Electrode, U.S. Patent 0,000,774 A1, Jan. 4,
2007.
(23) Murugananthan, M.; Yoshihara, S.; Rakuma, T.; Uehara, N.; Shirakashi, T.
Electrochim. Acta 2007, 52, 3242.
(24) Kaba, L.; Hitchens, G. D.; Bockris, J. O. J. Electrochem. Soc. 1990, 137, 1341.
(25) Zhu, X.; Shi, S.; J, W.; Lu, F.; Zhao, H.; Kong, J.; He, Q.; Ni, J. Environ. Sci.
Technol. 2007, 41, 6541.
(26) Torres, R. A.; Torres, W.; Peringer, P.; Pulgarin, C. Chemosphere 2003, 50, 97.
(27) Buxton, G. V.; Greenstock, C. L.; Helman, W. P.; Ross, A. B. J. Phys. Chem. Ref.
Data 1988, 17, 513.
316
(28) Yu, X. Y. J. Phys. Chem. Ref. Data 2004, 33, 747.
(29) Neta, P.; Huie, R. E.; Ross, A. B. J. Phys. Chem. Ref. Data 1988, 17, 1027.
(30) Kesselman, J. M.; Weres, O.; Lewis, N. S.; Hoffmann, M. R. J. Phys. Chem. B
1997, 101, 2637.
(31) Wardman, P. J. Phys. Chem. Ref. Data 1989, 18, 1637.
(32) Buxton, G. V.; Bydder, M.; Salmon, G. A.; Williams, J. E. Phys. Chem. Chem.
Phys. 2000, 2, 237.
(33) Gilbert, B. C.; Stell, J. K.; Peet, W. J.; Radford, K. J. J. Chem. Soc.—Faraday
Trans. I 1988, 84, 3319.
(34) Buxton, G. V.; Bydder, M.; Salmon, G. A. J. Chem. Soc.—Faraday Trans. 1998,
94, 653.
(35) Alegre, M. L.; Gerones, M.; Rosso, J. A.; Bertolotti, S. G.; Braun, A. M.; Martire,
D. O.; Gonzalez, M. C. J. Phys. Chem. A 2000, 104, 3117.
(36) Hasegawa, K.; Neta, P. J. Phys. Chem. 1978, 82, 854.
(37) Padmaja, S.; Neta, P.; Huie, R. E. J. Phys. Chem. 1992, 96, 3354.
(38) Anslyn, E. V.; Dougherty, D. A. Modern Physical Organic Chemistry; University
Science Books: Sausalito, CA, 2006.
(39) Richard, J. P.; Jencks, W. P. J. Am. Chem. Soc. 1982, 104, 4689.
(40) Gallard, H.; von Gunten, U. Environ. Sci. Technol. 2002, 36, 884.
(41) Ferro, S.; De Battisti, A.; Duo, I.; Comninellis, C.; Haenni, W.; Perret, A. J.
Electrochem. Soc. 2000, 147, 2614.
(42) Vione, D.; Maurino, V.; Minero, C.; Calza, P.; Pelizzetti, E. Environ. Sci. Technol.
2005, 39, 5066.
317
(43) Moye, C. J.; Sternhel, S. Aust. J. Chem. 1966, 19, 2107.
(44) Hori, H.; Yamamoto, A.; Hayakawa, E.; Taniyasu, S.; Yamashita, N.; Kutsuna, S.
Environ. Sci. Technol. 2005, 39, 2383.
(45) Canizares, P.; Saez, C.; Lobato, J.; Rodrigo, M. A. Ind. Eng. Chem. Res. 2004, 43,
6629.