chemical modelling programs for predicting … · chemical modelling programs for predicting...
TRANSCRIPT

Repon 3, 1991
CHEMICAL MODELLING PROGRAMS FOR PREDICTING CALCITE SCALING, APPLIED TO LOW TEMPERA1URE GEOTHERMAL WATERS IN ICELAND
Bai Liping, UNU Geothermal Training Programme, Orkustofnun - National Energy Authority, Grensasvegur 9, 108 Reykjavik, ICELAND
Permanent address: Tianjin Geothermal Research and Training Centre, Tianjin University, Tianjin 300072, P.R.CHINA

3
ABSTRACT
Three chemical models, the WATCH program, the VDATA program and the Ryznar index are used for the study of calcite scaling potential in low temperature geothermal wells in Iceland. Fields with known calcite scaling in some wells were chosen for the study. They are: Laugames field, Sudureyri field, Hrisey field, Selfoss field and Seltjamames field. The study involved training in the use of chemical models to predict calcite scaling and to determine the allowable supersaturation before calcite scaling formation becomes a problem. This is done by comparing the degree of calcite supersaturation and actual scaling status in the selected wells. The saturation index, log (Q/K) = 0.36 · 0.5 was found to be the bounda')' between calcite scaling and no scaling. If the saturation index, log (Q/K), is higher than 0.5, calcite scaling problems occur, if it is lower than 0.36, no calcite scaling will occur. Between 0.36-0.5, calcite scaling may and may not occur, depending on other factors. This implies a calcite supersaturation ratio, Q~ of 23-3.2 and thus geothermal waters can contain 2.3 times more Caeo3 in solution than the theoretical amount. The information from changes of chloride concentration and temperature as well as mixing calculations show that mixing of different waters is the main reason for the high degree of calcite supersaturation in the low temperature wells selected in this study. The results from the WATCH program agree with the results from the Ryznar index. Calcite scaling occurs at high calcite saturation index values and low Ryznar index values. Based on these findings more accurate predictions of calcite scaling can be made.

4
TABLE OF CONTENTS Page
ABSTRACT ....................•...........•........................... 3
TABLE OF CONfENTS .......•... . ... ....•.......... ..... . .............. 4
LIST OF FIGURES ...........•........... • .............................. 4
LIST OF TABLES ............ • .... .... • ................................. 5
I. INlRODUCllON ....... ........................ . . . ... ......... .. .... 6
2. CALCIUM CARBONATE SCALING IN GEOTHERMAL SYSTEMS ......•..... 7 21 Solubility of calcium carbonate . ............ .. .. .... ................ 7 22 Major reasons for calcium carbonate scaling .......................... 8 23 Models for predicting calcite scaling . . . . . . . . . . . . . . . . . . . . . . . . . . . . . . . .. 9
2.3.1 The WATCH program . . . . . . . . . . . . . . . . . . . . . . . . . . . . . . . . . . .. 9 2.3.2 The VDATA program ... .......... ... .................. 10 2.3.3 The Ryznar index. . . . . . . . . . . . .. . .. . . • . . . . . . . . . . . . . .. . . .. 10
24 Chemical data required .......... . . . .. .......................... 10 25 Criteria for scaling fonnation ....... .. ..... . .. . ......... .......... 11 26 Calcite scaling in Iceland ............. . .......................... 12
3. APPLICATION OF SCALE PREDICllON MODELS ... .. .• . .•..• ..•..•. ... 14 3.1 Laugarnes ................................................... 14 3.2 Sudureyri........................ . ........................... 19 3.3 Selfoss ............ . . .. .... ........ . . ...... .. . .. ..... .. . .. ... 22 3.4 Hrisey .......................................... .. ..... .... . 22 3.5 Seltjarnarnes ..................................... .• . . •.. .... . 29 3.6 Calculating calcite scaling tendency by using Ryznar index ... .. . .. ....... 34
4. DiSCUSSION....................................................... 36 4.1 Comparison of WATCH program, VDATA program and Ryznar index ..... 36 4.2 Supersaturation criterion for calcite scaling fonnation . . . . . . . . . . . . . . . . . . . 37 4.3 Data used for analysis. . .. . . .. .. .. .. .. . . .. . .. .. .. . .. . .. . .. .. . . ... 38
5. CONCLUSIONS ..............•..•........•..•..•..•.....•........... 39
ACKNOWLEDGEMENTS .........•..•........•..•..•.................... 40
REFERENCES ....................... . ....... ........ • ..•.. • ..•..•..... 41
APPENDIX: Typical raw chemical data used in this study ......• ..•.. • .. • ..•..... 43
LIST OF FIGURES
1. Log K for calcite, aragonite and vaterite based on the aqueous models . . . . . . . . . .. 7 2. The solubility of calcite in water and sodium chloride solutions . . . . . . . . . . . . . . . .. 8

5
Page
3. Effect of changing pH on distribution of different CO2 related ions in solution ..... 8 4. Detennination of Kc for geofluids contain. < 6000 mglkg total dissolved solids. . .. 11 5. The location of the Hrisey, Laugames. Sudureyri, Selfoss
and Seltjamames geothermal fields ........ . ................ .......... . 13 6. The location of wells in the Laugames field ............... . .............. 14 7. Caco3 supersaturation in the Laugames field . ... .............. . ......... 15 8. Chloride ions in the well water of the Laugames geothermal field ..... .. . ..... 18 9. The degree of calcite supersat. and chloride content in the Laugames field ... .. . 19 10. The location of wells in the Sudureyri geothermal field. . . . . . . . . . . . . . . . . . . . .. 19 11. Caco3 supersaturation in wells H-2 and H-5 at Sudureyri . .... .............. 20 12. Chloride in the Sudureyri wells H-2 and H-5 ............ . .. . .. .... ....... 21 13. The Caco3 supersaturation and the chloride content in Sudureyri wells . . ....... 21 14. The location of wells in Selfoss geothermal field . . . . . . . . . . . . . . . . . . . . . . . . . . . 22 15. Caco3 supersaturation in the Selfoss geothermal field ...................... 24 16. The location of wells in the Hrisey field ....................... . . .. .. .. .. 25 17. Caco3 supersaturation in the Hrisey wells (mixing of wells 10 and 11) .......... 26 18. Comparison of waters in Hrisey wells 5, 10 and 11 . . ..... .. . ....... .. . .. ... 28 19. Caco3 supersaturation in the Hrisey geothermal field .......... . .. . .. . .. . .. 29 20. The location of wells in the Seltjarnames field ............................ 29 21. Caco3 supersaturation in the Seltjarnames geothermal field ................. 30 22. Comparison of deep waters and surface waters in well SN-04 ................. 31 23. The temperature change in the Seltjamames weB SN-04 .................... 33 24. Chloride in the Seltjarnames wells SN -04, 05 and 06 ....................... 33 25. Caco3 supcrsat. and the chloride content in the Seltjamames wells . . . . . . . . . . .. 34 26. The Ryznar index in selected wells . . . . . . . . . . . . . . . . . . . . . . . . . . . . . . . . . . . . . 35 27. Comparison of Ryznar index and saturation index (log Q/K) . . . . . . . . . . . . . . . . .. 36 28. Caco3 supersaturation in selected wells. . . . . . . . . . . . . . . . . . . . . . . . . . . . . . . . .. 37 29. Chloride change after start of pumping in Laugames wells RV-5, 21, 34 and 35 ... 38
usrOFTABLFS
1. Analytical data required for thermodynamic modelling ....•..... _ .. _ . . _ . . . .. 12 2. Calcite scaling in Iceland .. ...........................•..•..•..•..... 13 3. Overview of the wells in Laugarnes geothermal field ................. •. .... 14 4. Calcite calculations for the Laugarnes geothennal field. . . . . . . . . . . . . . . . . . . . .. 16 5. Three types of well fluids and calcite scaling status in Laugarnes field. . . . . . . . . .. 17 6. Calcite calculations for the Sudureyri geothermal field ................ . ..... 20 7. Calcite calculations for the Selfoss geolhermai field ........................ 23 8. Overview of the Hrisey geothermal wells ........................ .. . .. . .. 23 9. Mixing ratio of wells 10 and 11 according to chloride ion parameter ...... . .. . .. 26 10. Mixing ratio of wells 10 and 11 according to temperature parameter . . . . . . . . . . .. 26 11. Calcite calculations and some components in Hrisey wells. . . . . . . . . . . . . . . . . . .. 27 12. Overview of the Seltjarnarnes geothennal wells ........... ...... ... .. ..... 30 13. Main aquifers in wells SN-04 - SN-06 .......... . ............•..•. .• ... .. 31 14. Calcite calculations for the Seltjarnames geothermal field. . . . . . . . . . . . . . . . . . .. 32 15. Ryznar index and calcite scaling ............... . . .. .. .. ....... .. . .• . .. . 35 16. The saturation index boundary between calcite scaling and no scaling. . . . . . . . . .. 37

6
I. INTItODUcnON
Scale formation is one of the major problems in geothermal operations. Deposition can take place in the reservoir as well as in the production, utilization and reinjection facilities. Depending on the chemical composition of the geothennal well fluids, different types of scales are found in various geothennai areas.
The presence of the calcium ion and bicarbonate alkalinity is common in almost every source. The relative insolubility of calcium carbonate is onc of the most common causes of scaling. Calcium carbonate scaling problems have been reported in most of the countries using and developing geothermal resources, for example, in Turkey (Parlaktuna and Okandan, 1988). in the United States (Vaska et aI., 1988; Lovekin, 1990 and Benoit, 1988), in New Zealand (Robson et aI., 1990), in Italy (Pieri et aI., 1988), in Greece (Koutsoukos, 1990, 1991), in Iceland (Arnor.;son, 1988; KristmannsdoUir,I988), and in China (Chang, 1990).
Understanding the mechanism of calcium carbonate formation and further, giving the precise prediction information is very important in order to decide upon the type of scale prevention or scale removal methcxls. Calcium carbonate scaling is often caused by the mixing of waters from different aquifers, but degassing of carbon dioxide because of lower pressure or flashing is the main reason for calcite scaling. From the information yielded by the scale prediction models, one can also predetermine scaling problems that may arise from fluids used in the drilling and completion operations.
Scale prediction mcxlels are also of importance in another area of geothermal operations, namely the reinjection of the heat--depleted brine or injection of foreign waters for the purpose of pressure maintenance. In such cases, the scale prediction models are extremely useful in determining the incompatibility of injected fluids with the native reservoir fluids (Yetter and Kandarpa, 1982).
Based on thermcxlynamic and experimental studies, variow calcium carbonate scaling prediction models have been developed. In Iceland the WATCH program (Arnorsson et aI., 1982), and VDATA program (Hauksson, pe". corn.) have been developed. The Ryznar index (Ellis, 1989) is also used in this study.
In this report, the WATCH program, VDATA program and Ryznar index are used to analyz.e the calcium carbonate scaling problem in low temperature wells in Iceland. The determination of allowable calcite supersaturation without scaling is attempted. In addition, a comparison and an evaluation of the prediction mcxlels are given.

7
2 CALCIUM CARBONATE SCAUNG IN GEOTHERMAL SYSTEMS
21 Solubility of calcium carbonate (calcite, aragonite and valerite)
There are three polymorphs of calcium carbonate minerals, calcite, aragonite and vaterite. Many experimental studies have been carried out to determine the solubilities of the calcium carbonate minerals in aqueous solution. Respectively, aqueous models are provided. Using these models. the equilibrium constants for calcium carbonate and its temperature dependence have been detennined (e.g. Ellis, 1959, 1963; Plummer and Busenberg, 1982; Arnar>SOn, 1982):
Calcite: logK,: -171.9065-0.077993T+2839.319T+71.595IogT (I)
Aragonite: IogK.: -171.9773-0.0n993T+2903.293/T+71.59SIogT (2)
Vaterite: logK,: -172.1295-0.077993T+3074.688/T+71.5951ogT (3)
Calcu.: logK, • 1O.22-0.0349T-2476/T (4)
Equations 1-3 are from Plummer et al., 1982, and Equation 4 from Amorsson, 1982.
· 8.0
- 9.0
-10.0
_11 .0
TemperatUre "C
The equilibrium constants of calcium carbonate as a function of temperature are show in Figure 1. The solubility of calcium carbonate decreases with increasing temperature which makes it one of the few minerals with "reverse solubility". In natural hydrothermal solutions, the solubility of the calcium carbonate is influenced by many dissolved constituents and a variety of chemical reactions in which pH, the partial pressure of carbon dioxide, P C02'
temperature and the pressure and concentrations of other dissolved salts are the main affecting facto". Adding Nael to the solution increases the solubility of calcite (Figure 2). Fluid pH controls the distribution between
AGURE 1: log K for calcite, aragonite and vaterite based on the aqueous models (data from Plummer et al. 1982; Arnar>SOn, 1982)
carbonate and bicarbonate ions. The concentration of carbonate ions increases with increasing pH (Figure 3). Thus, an increase in pH is likely to cause calcite scaling.

• ~ 10
•
M o 6 <.l • <.l . o
• 4 o ~ . :> 2
8
o~::::;;;~ 100 150 200 250 30 0
'c Temperature,
FIGURE 2: The solubility of calcite in water and sodium chloride solutions at a carbon dioxide pressure of 12.2 ba" (Ellis, 1963)
22 Major reasons for calcium carbonate scaling
~ J HO HSp 9000 Bl LJ:J 91.100749 T
Fraction 01 Total Carbon Dioxide
0
o. o o. o. o. o . o o o
9 •
• " , , , • 3 ,
b ,
I.; b a
b
. • a , b
• ° 0 1 2 3 4 5 6 7 e 9 1011 121 3 14
pH
a = CO,·, or bolXld CO, b = Hea,", or half-bol.l1d CO, C 3 H,eO .. or CO, gas
FIGURE 3: Effect of changing pH on distribution of different CO2 reI. ions in solution (Naloo Chem. Co., 1979)
The precipitation of calcium carbonate mainly occurs as a result of CO2 evolution from the liquid phase, with a consequent increase in the pH.
co, (aq) = CO, (g) (5)
H' • HCO; = CO, (aq) • H,O (6)
H' • CO,'· = HCO; (7)
This shifts the equilibrium between bicarbonates and carbonates towards the latter and the solubility product of Caco, is exceeded (Michels, 1981).
(8)
The precipitation of calcium carbonate is also caused by the heating of water. When the temperature of the water increases, the bicarbonate breaks down to carbonate and combines with calcium by the following reaction (Vaska, 1989):
(9)
The mixing of different water is another reason leading to supersaturation of calcium carbonate. This will be discussed in a later section. In addition, physical factors also affect the location of

9
calcium carbonate scaling. Scale is more easily formed on geometric irregularities such as orifices, bends, etc.
23 Models for predicting calcite scaling
23.1 The WATCH program
The computer program WATCH (Amorsson et al., 1982) is a useful tool for calculating the chemical composition of geothermal waters. This includes the pH. aqueous speciation, partial pressures of gases, redox potentials, and activity products. The program is briefly described below.
Input to the program is a component analysis of the geothermal water at the surface, including the temperature at which the pH was measured, and a reference temperature at which the composition is to be calculated. The concentrations of all the 69 species considered in the program are expressed in terms of the component concentrations by mass balance equations, and the chemical equilibria between the species are expressed as mass action equations. The two sets of equations are solved simultaneously by an iterative procedure. This procedure is carried out a few times during each run of the program. An initial estimate of the ionic strength of the water is obtained using only the concentrations of the major cations. This value of the ionic strength is used to compute activity coefficients, at the temperature of the pH measurement, using the extended Debye-Huckel formula. The chemical equilibria and mass balance equations are now solved simultaneously at this temperature to yield a distribution of species. From the new distribution of species, a proper ionic strength is computed. This ionic strength is used to recompute the activity coefficients and species concentrations, still at the temperature of the pH measurement. The concentrations of the anions of the weak acids and their complexes are now added up, weighted by the number of protons that each can accept:
This quantity, which is a measure of total alkalinity, is assumed to be constant, independent of temperature. This property is used to compute the pH at the reference temperature. The pHcalculation, the calculation of the activity coefficients, the mass balance iteration, and the ionic strength calculation are all repeated, in turn, a couple of times. The equilibrium gas pressures are then computed from the final equilibrium species concentrations.
The output from the program lists the component and species concentrations at the reference temperature, as well as the activity coefficients. Finally, the ion activity products, log Q, and solubility products, log K, of selected minerals are computed and printed. From these, it is straightforward to compute the corresponding saturation indices, log Q/K.
The WATCH program can also be used to compute the resulting species concentrations, activity coefficients, and activity and solubility products when the original water is allowed to cool conductively or by adiabatic boiling from the reference temperature to some lower temperature. This is particularly useful in the study of scaling.
In this report, the WATCH program is used to analyze chemical equilibria between calcite and solution in geothermal systems as well as the potential for calcite scaling in the process.
10
23.2 The VDATA program
The computer program VDATA (Hauksson) has been developed in Iceland for interpretation of geothennal field data such as well flow measurements, well logs and chemical analysis of wen fluids. Results of chemical analysis of water, steam and gas fractions are entered and the ion balance and mass balance calculated. For analysis of the chemical data, it is possible to calculate the chemical composition at different separation pressures and temperature. The subsurface chemical equilibrium temperatures are calculated (quarts, caleedony, Na/K, HzlHzS and COzl. Also the chemical speciation and saturation of scaling chemicals (e.g. calcite, anhydride, amorphous silica, magnesium silicate and iron sulphide) are calculated using a thermodynamic database (e.g. WATCH). Addition of various streams of scaling chemicals and calculation of chemical speciation of mixtures are possible for predicting supersaturation. For these calculations the total alkalinity, as defined above for the WATCH program, is considered an additive property and the pH of the mixture is calculated from the sum of alkalinity. Also the effect of chemical treatment, such as acidification, on saturation of scaling chemicals can be assessed.
In this report the VDATA program was used to assess the effect of mixing two fluids of different known compositions and comparing it to analysis from a well where calcite scaling has occurred.
233 The Rymar index
Based on the studies of reported conditions of scaling and corrosion in a variety of municipal systems, the Rymar index was developed to predict the likelihood of scale fonning or corrosion occurring (Naloo Cbemical Company, 1979):
where,
Thus,
where,
l/ytnar inda • 2pHs-pHa
pHs pHa
- is the pH above which calcium carbonate will precipitate. - is the measured pH of the fluid.
pHs = pCa + pALK + Kc
pCa = -log {Ca/, [Ca] - is the molar concentration of calcium, pALK = -log {ALK/, ~LKJ - is the total alkalinity of calcium,
(11)
(12)
Kc - is a function of temperature and the total diss. solid, available from Figure 4.
The calculated Ryznar index can then be used to predict the scaling tendency (see Cbapter 25).
24 ClJemical data required
Good chemical data is very important for any calculations. It depends on the analytical methods used as well as the care taken in the collection and analysis of samples. Geothermal samples must be collected in such a way, that the concentration of the elements does not change until the analysis is carried out. Sampling and analyticaL methods for geothennal fluids and gases were
described in detail by OlaCsson (1988), Arnor>son and Gunnlaugsson (1975).
Ionic charge balance and mass balance can be used to evaluate the quality of chemical data The water IS electroneutral, so the total amount of cation charges should be equal to the total amount of anion charges. Calculation of ionic balance and mass balance arc included in the WATCH and VDATA programs. Samples with more than 10% difference ID ionic balance are not usable.
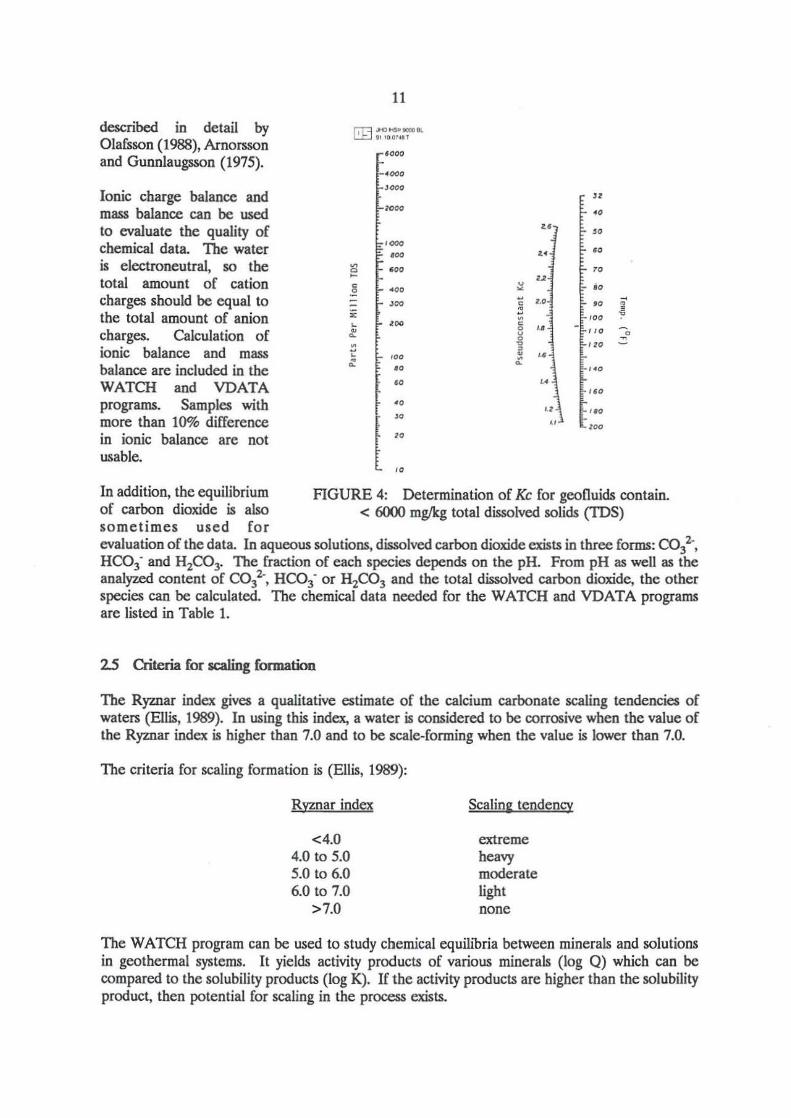
In addition, the equilibrium of carbon dioxide is also sometimes used for
11
ru-.... _--" 10'''-,
,gao
.~,
,~,
" ,,~
" " " ,-
.~ .- " i§ ." " u • '" • j ,
,~ ~ .. , "
,. • " '" " , .~
, ~
, '. , " ~ " · " , " , , '" ~ '. , " ," " ..
'" " ,. " '" ..
'" "
"
FIGURE 4: Determination of Kc for geofluids contain. < 6000 mg/kg total dissolved solids (TDS)
evaluation of the data. In aqueous solutions, dissolved carbon dioxide exists in three forms: col-, He03" and H2C03- The fraction of each species depends on the pH. From pH as well as the analyzed content of col-, HeO)- or H2C03 and the total dissolved carbon dioxide, the other species can be calculated. The chemical data needed for the WATCH and VDATA programs are listed in Table 1.
25 Criteria for scaling formation
The Ryznar index gives a qualitative estimate of the calcium carbonate scaling tendencies of waters (Ellis, 1989). In using this ind~ a water is considered to be corrosive when the value of the Ryznar index is higher than 7.0 and to be scale· forming when the value is lower than 7.0.
The criteria for scaling formation is (Ellis, 1989):
Rvznar index
<4.0 4.0 to 5.0 5.0 to 6.0 6.0 to 7.0
>7.0
Scaling tendency
extreme heavy mooerate light none
The WATCH program can be used to study chemical equilibria between minerals and solutions in geothermal systems. It yields activity products of various minerals (log Q) which can be compared to the solubility products (log K). If the activity products are higher than the solubility proouct, then potential for scaling in the process exists.
12
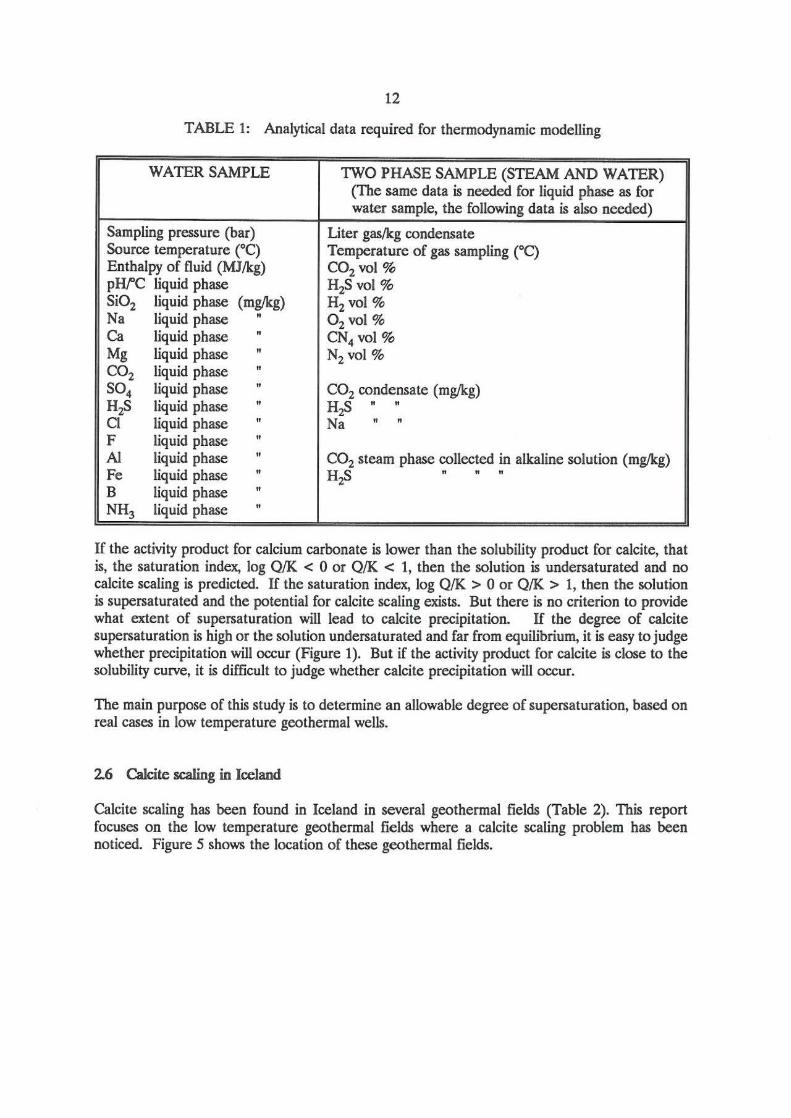
TABLE 1: Analytical data required for thermodynamic modelling
WATER SAMPLE lWO PHASE SAMPLE (STEAM AND WATER) (The same data is needed for liquid phase as for water sample, the following data is also needed)
Sampling pressure (bar) Liter gas/kg condensate Source temperature (OC) Temperature of gas sampling (OC) Enthalpy of fluid (MJlkg) CO,vol % pHfC liquid phase H,Svol % SiO, liquid phase (mgikg) H, vol % Na liquid phase " 02 val % Ca liquid phase " CN4 vel % Mg liquid phase " N2 vcl % CO, liquid phase " SO, liquid phase " CO, condensate (mgikg) HzS liquid phase " H,S " " a liquid phase " Na " " F liquid phase " AI liquid phase " CO, steam phase collected in alkaline solution (mgikg) Fe liquid phase " H,S " " " B liquid phase " NH, liquid phase "
If the activity product for calcium carbonate is lower than the solubility product for calcite, that is, the saturation index, log QIK < 0 or Q/K < I, then the solution is undersaturated and no calcite scaling is predicted. If the saturation index, log Q/K > 0 or Q/K > 1, then the solution is supersaturated and the potential for calcite scaling exists. But there is no criterion to provide what extent of supersaturation will lead to calcite precipitation. If the degree of calcite supersaturation is high or the solution undersaturated and far from equilibrium, it is easy to judge whether precipitation will occur (Figure 1). But if the activity product for calcite is close to the solubility curve, it is difficult to judge whether calcite precipitation will occur.
The main purpose of this study is to determine an allowable degree of supersaturation, based on real cases in low temperature geothermal wells.
26 Calcite scaling in Iceland
Calcite scaling has been found in Iceland in several geothermal fields (Table 2). This report focuses on the low temperature geothermal fields where a calcite scaling problem has been noticed. Figure 5 shows the location of these geothermal fields.

•
SeI'jarnarneSLLaugarnes .Selfoss
~ JHOH~VlXlD8L Ll:..J 81 10.0151 T
13
FIGURE 5: The location of the Hrisey, Laugames, Sudureyri, SeUoss and Seltjarnames geothennal fields
TABLE 2: Calci te scaling in Iceland
High and medium temperature Low temperature geothermal fields geothennal fields
Krafla borhole (well KJ-9) Hrisey (well HR-05) Svartsengi Laugames (wells RV-34 and 21)
Kroggolfsstadir Sudureyri (wells H-2 and 5) l..eira Selfoss (well I>K-Il)
Klausturholar Hveragerdi

14
3. APPUCATION OF SCALE PREDICI10N MODElS
3.1 Laugarnes
The Laugames geethermal field is located inside the city of Reykjavik (population: 134,513 with suburbs). The exploitation of bot ground water in this area was begun in 1928-1930. Now, there are 12 wells in use (Table 3). The location of these wells is shown in Figure 6. Water from this field is used in the Reykjavik Municipal Heating Service district heating system. The 13<fC water pumped from the wells is cooled to SO"C before entering the system by mixing with return water of 4(f'c. From 1982, a calcite scaling problem was found in wells RY·21 and RY·34 in succession. In order to study the changes that occurred during that period, available chemical analyses (see Appendix) were entered into the WATCH program and the results were used to compute the saturation index. The results are listed in
• well with calcite scaling
o Well without calcite scaling
.•.. Sea
o 0.5 1,Okm , ! !
........ : .. ' . '. ', ." . , ' , ;.':
: .;
o
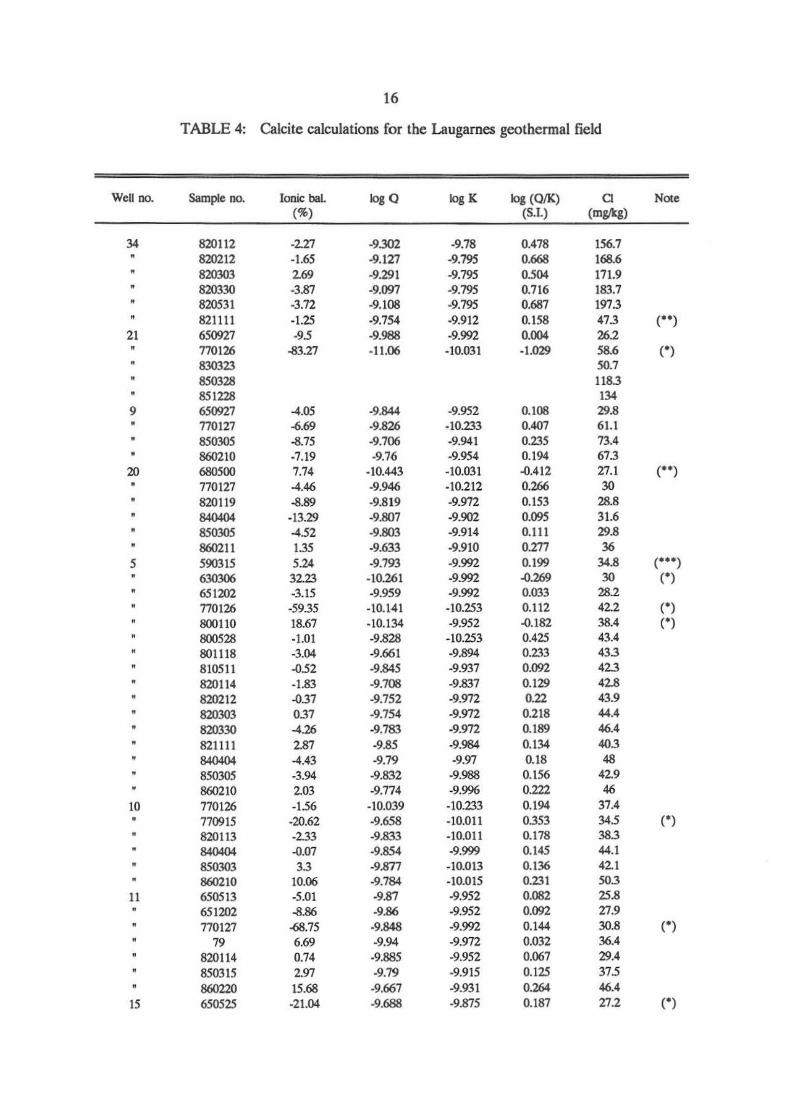
Table 4 and shown in Figure 7. FIGURE 6: The location of wells in the Laugames field
TABLE 3: Overview of the wells in Laugames geethermal field
Well DO. RV-S RV-9 RY-IO RV-ll RY-IS RV-17 RV-19 RV-20 RV-21 RV-34 RV-35 RY-38
T("C) 130 128.1 131.2 126.9 124 126.1 128 126 127 121 124B 127' Depth of 741 862 1306 928 1014 634 1239 '64 978 308S "'" 1488 well (m)
Depth 0( 68 90 92 112 112 93 79 87 112 1091 '65 '" casinC (m)
The degree of the calcite supersaturation in well RV-34 is higher than in the other wells. The calcite saturation index in well RV-21 cannot be calculated because of a lack of complete data after the calcite scaling was found. The content of chloride in well RV-21 is available and its increase is very important for analyzing the transition over to calcite scaling in this field.
The initial content of chloride in Laugames field was 20-30 mglkg, and the temperature was 120-13(fC. But in 1985 an analysis of chloride in the wells showed that the reservoir fluid could be divided into three types. shown in Table 5.

1.0
0.5
-0.5
1.0
0.5
~
~
"--o 0.0 ~
0' o
- 0.5
15
rn JHO H$F> 1111 BL 91.IO.0752T A
Calcite scaling Well-34 f : :: : :::::: : ::::: :: :::::: : : ::: :: ::~: ::- :::: :: ::: ::: ::::::::
No calcite scaling
....-:::: Well-21
70
~ JHOH$Pl111BL L.:...tJ 91.10.0753 T
~ ' .~ ~ \,.J
---66666
, , ,
75 80 85
Time (year)
Well 05 Well 20 Well 09
90
B
Well-34 f Calcite scaling ------- - ---- - ---- - - - --- --- ---- ---- -- -- - ---- --- -------------------- --- --------- --- ------- -- - ---- ---------- ~ - - ---- ----
No calcite scaling .---.~
...
~Well 10 ~Well 11 -Well 15 H-++-O We ll 17 -Well 19 --Well 35 ••••• well 38
70 75 80 85 90
Time (year) AGURE 7: Caco3 supersaturation in the Laugames field
a) wells RV-5, 9, 20, 21 and 34, b) wells RV-IO, 11, IS, 17, 19,34,35 and 38
16
TABLE 4: Calcite calculations for the Laugarnes geothermal field
Well no. Sample no. Ionic bal. logO IogK log (OIK) a N"'e (%) (S.!.) (m81's)
34 820112 -= ·9.302 ·9.78 0.478 156.7 8202t2 -1.65 -9.127 ·9.795 0.668 168.6 820303 2.69 -9.291 ·9.795 0.504 171.9 820330 -3.87 ·9.097 ·9.795 0.716 183.7 820531 -3.72 ·9.108 ·9.795 0.687 197.3 821111 -1.25 ·9.754 ·9.912 0.158 47.3 ( .. )
21 650927 ·95 ·9.988 ·9.992 0.004 26.2 710126 -83.27 -11.06 -10.031 -1.029 58.6 (0) 830323 SO.7 850328 118.3 851228 134
9 650927 -4.05 -9.844 -9.952 O.IOS 29.8 n0127 .0.69 -9.826 -10.233 0.407 61.1 850305 -8,75 -9.706 -9.941 0.235 73.4 860210 -7.19 ·9.76 -9.954 0.194 67.3
20 680500 7.74 -10.443 -10.031 -0.412 27.1 C .. )
770127 4.46 -9.946 ·10.212 0.266 30 820119 -8.89 -9.819 -9.972 0.153 28.8 840404 ·13.29 -9.807 -9.902 0.095 31.6 850305 452 -9.803 -9.914 O.lll 29.8 860211 1.35 ·9.633 -9.910 o.m 36
5 590315 5.24 ·9.793 -9.992 0.199 34.8 ( ... ) 630306 32.23 -10.261 -9.992 .{I.269 30 (0) 651202 -3.15 ·9.959 -9.992 0.033 282 170126 -59.35 -10.141 -10.253 0.112 42.2 (0) 800110 18.67 ·10.134 -9.952 .().l82 38.4 (0) 800528 -1.01 -9.828 -to.253 0.425 43.4 801118 ·3.04 -9.661 ·9.894 0.233 43.3 8105l1 .{I52 -9.845 -9.937 0.092 42.3 820114 -1.83 -9.708 -9.831 0.129 42.8 820212 .{I.37 -9.752 -9.972 0.22 43.9
820303 0.37 ·9.754 -9.972 0.218 44.4 820330 4.26 ·9.783 -9.972 0.189 46.4 821111 2.87 -9.85 -9.984 0.134 40.3 840404 -4.43 -9.79 ·9.97 0.18 48 850305 -3.94 -9.832 ·9.988 0.156 42.9 860210 2.03 -9.774 -9.996 0.222 46
10 770126 -156 -10.039 -10.233 0.194 37.4 770915 -20.62 ·9.658 -to.Oll 0.353 34.5 (0) 820113 ·2.33 -9.833 -to.ot 1 0.178 38.3 840404 .{I.07 ·9.854 -9.999 0.145 44.1 850303 3.3 ·9.877 -10.013 0.136 42.t 860210 10.06 -9.784 -10.015 0.231 SO.3
11 650513 -5.01 ·9.87 -9.952 0.082 25.8 651202 -8.86 ·9.86 -9.952 0.092 27.9 770127 -68.75 ·9.848 -9.992 0.144 30.8 (0)
79 6.69 -9.94 -9.972 0.032 36.4 820114 0.74 ·9.885 ·9.952 0.067 29.4 850315 2.97 ·9.79 -9.915 0.125 375 860220 15.68 -9.667 -9.931 0.264 46.4
15 650525 -21.04 ·9.688 ·9.875 0.187 27.2 (0)
17
Well no. Sample 00. Ionic bal. log Q logK log CQ/K) Cl Note C%) CS.!.) CmgA.g)
651202 ".94 -9m -9.875 0.005 25 770127 -3.55 -9.854 ·9.875 0.021 215 820114 ".68 -9.789 -9.875 0.086 24.8 84<l404 ·5.99 ·9.833 -9.869 0.036 24.1 860211 ·14.82 -9.6<;8 -9.875 0.207 24.'
17 650927 -3.14 -9.874 -9.952 0.078 30.3 651202 ..6 .. 63 -9.888 -9.952 0.064 30.7 680128 -6.94 -9.803 -10.031 0.228 37 770914 -14.45 -9.561 -9.952 0.391 25.5 820113 -9 -9.899 -10.091 0.192 29 820330 2..2 -9.77 -9.877 0.107 26.1 860225 -17.87 -9.563 -9.915 0.352 28.9 CO)
19 820114 -2.42 -9.861 -9.952 0.091 27.1 84<l404 2.51 -9.948 -9.95 0.002 26.3 850305 -6.1 -9.848 -9.954 0.106 24.' 860211 -10.19 -9.876 -9.947 0.071 28.3
35 800528 -279 -9.55 -9.799 0.249 41.7 801119 755 -9.597 -9.799 0.202 21.2 820113 ".64 -9.654 -9.933 0.288 51.9 860225 10.56 -9.539 -9.89 0.351 54.6
38 850305 20.96 -9.743 -9.945 0.202 64.' CO) 860210 -6.69 -9.553 -9.943 0.390 78.9
NB: CO) Data is not in ionic balance. ( .. ) Data has a large deviation from other data. (.U) Data sampled shortly after initial discharge.
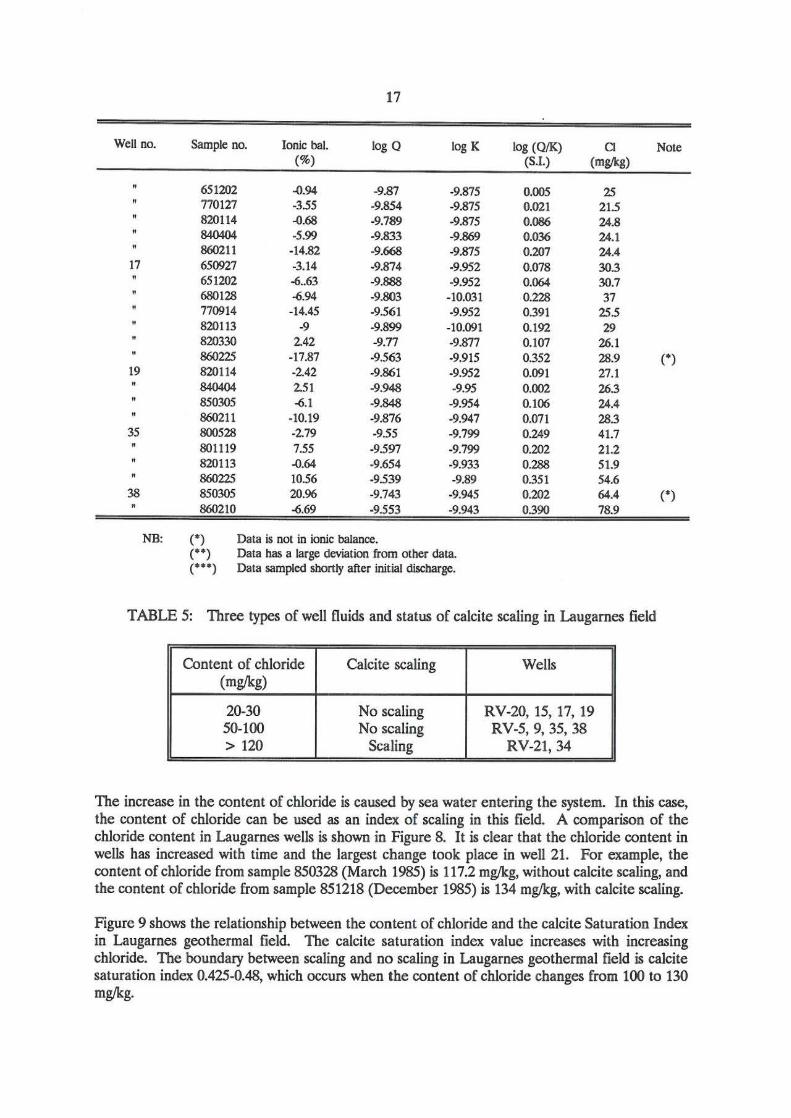
TABLE 5: Three types of well fluids and status of calcite scaling in Laugames field
Content of chloride Calcite scaling Wells (mgikg)
20-30 No scaling RV-20, IS, 17, 19 50-100 No scaling RV-5, 9, 35, 38 > 120 Scaling RV-21,34
The increase in the contcnt of chloride is caused by sea water entering the system. In this case, the contcnt of chloride can be used as an index of scaling in this field. A comparison of the chloride content in Laugames wells is shown in Figure 8. It is clear that the chloride contcnt in wells has increased with time and the largest change took place in well 21. For example, the content of chloride from sample 850328 (March 1985) is 117.2 mgikg, wi1hout calcite scaling, and the content of chloride from sample 851218 (December 1985) is 134 mgikg, with calcite scaling.
Figure 9 shows the relationship between the contcnt of chloride and the calcite Saturation Index in Laugarnes geothermal field. The calcite saturation index value increases with increasing chloride. The boundary between scaling and no scaling in Laugames geothermal field is calcite saturation index O.425...().48, which occurs when the content of chloride changes from 100 to 130 mgikg.

18
200
~Well 05
f A
~Well 20 Wel'-34
~ ~Well 09
0' ~ 150 "'-0'
E
0 ~
100 Weli-21 Q)
u L
0 .!: 0 50
• /' ~ rn JHDHSI> 1111 BL
91 .10.0754 T
065 70 75 80 85 90
Time (yea r)
200 ~Well 10 ( B --Welt 1 I +++++ Well 15 Well-34
~ ...... We ll 35
0' --- Well 19 ~ 150 --Well 38 "'- --Well 34, 21 0'
E
0 ~
100 Q) Weli - 21 u
L • 0 .!: 0 50 f
.... rn JHDH$1>1111 Bl 91 .10.0755T
065 70 75 80 85 90
Time (year) FIGURE 8: Chloride ions in the well water of the Laugames geothermal field a) wells RV-5, 9, 20, 21 and 34; b) wells RV-10, 11, 15, 19,21,34, 35 and 38

19
LO ,----- -----------------J rjT=I JHD HS~ 11 11 BL ! ~ 91.1 0.0756 T
Calcite scal ing . 0.5 -- - ---------------------- - --------- --- - - ------ ~- ------- - -- --------0----0 ---- 0 ----0-------- - ------ - - -- ----- -- - - --- - - - - -
o 0 0 00 • No calcite scoling
~ 0'» ~ ,,%0 o o
~ 0 o09J "0 + __ ~o,~~o~o _ _ _ ___ __________ _ ~ 0 .0
~
(J)
o
-0.5
• •••• We ll No.34 00000 The othe r wells
Chloride (Cl mg/kg)
AGURE 9: The degree of calcite supersaturation and chloride content in the Laugames field
3.2 Sudureyri
The Sudureyri geothennal field is a low temperature geothermal field situated in Northwest Iceland. At present, two wells are productive, H-2 and H-5 (Figure 10). Both of them face a calcite scaling problem. This problem has been solved by the injection of a phosphate scale inhibitor below the pump in the well. At the beginning of pumping, no calcite scaling was found in H-2. The water is used to preheat water for the district heating system at Sudureyri (population: 392).
FlOURE 10: The location of wells in the Sudureyri geothennal field
rn""''''''''' .,':"11",.00
/ " , o ~,
if .. It !( " :i ii
P " !,
" ~
;? " .. ,./'
.)'
f "
®.!i. -If .'l
;: ,f I:
l • ~
" '" .... i "" * , ~ , *
, I , t ,
/ t * • f i Jc 1>-
- "® .-
" DyI<es or fr8ctures
~.
20
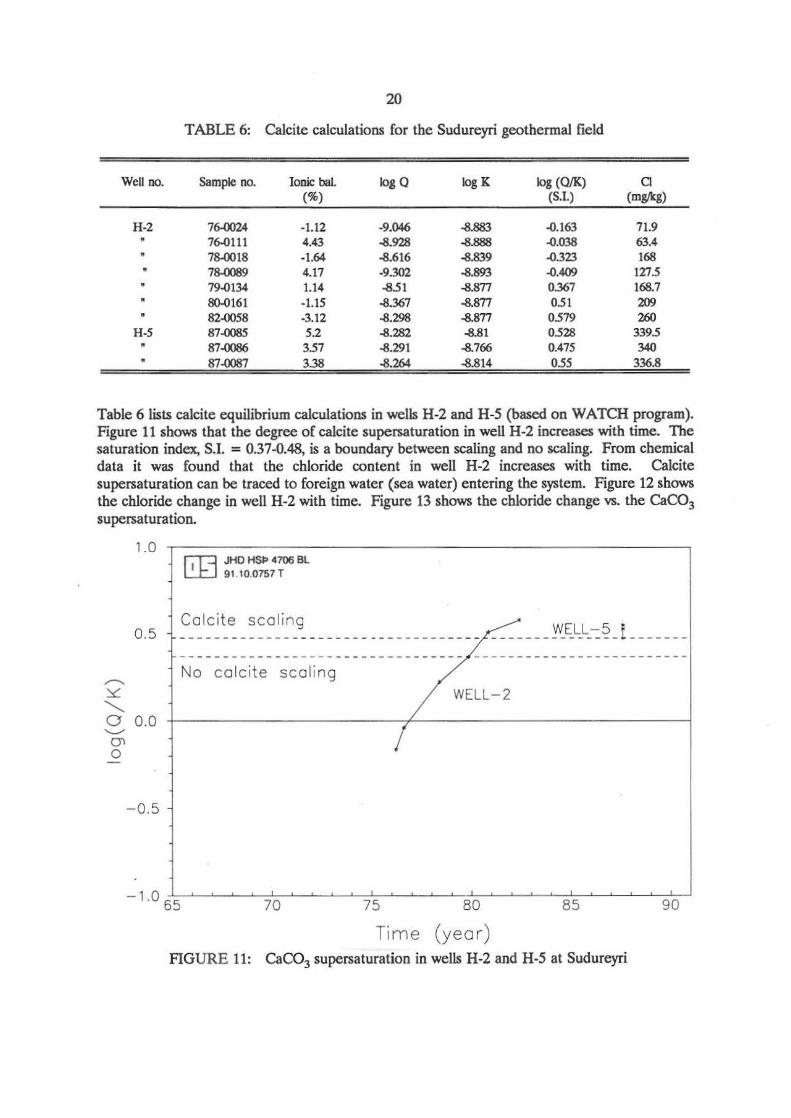
TABLE 6: Calcite calculations for the Sudureyri geothennal field
Wen 00. Sample no. Ionic bat. log Q IogK log (O/K) a (%) (5.1.) (mgf<g)
H·2 7~ -1.12 -9.046 -8.883 -0.163 71.9 76-0111 4.43 -8.928 -8.888 -0.038 63.' 78-0018 ·1.64 -8.616 -8.839 -0323 168 78.()()89 4.17 -9.302 -8.893 -0.409 127.5 79~134 1.14 -8.51 -8.m 0.367 1687 80-0161 -1.15 -8.367 -8.m 0.51 209 82~58 -3.12 -8.298 -8.877 0.579 260
H-5 87-0085 5.2 -8.282 -8.81 0.528 339.5 87.()086 3.57 -8.291 -8.766 0.475 340 87.()087 3.38 -8.264 -8.814 0.55 336.8
Table 6 lists calcite equilibrium calculations in wells H-2 and H-5 (based on WATCH program). Figure 11 shows that the degree of calcite supersaturation in well H-2 increases with time. The saturation index, S.l. = 0.37-0.48, is a boundary between scaling and no scaling. From chemical data it was found that the chloride content in well H-2 increases with time. Calcite supersaturation can be traced to foreign water (sea water) entering the system. Figure 12 shows the chloride change in well H-2 with time. Figure 13 shows the chloride change vs. the Caco3 supersaturation.
l.0
0.5
~
~
" o 0.0 ~
0> o
-0.5
r:n JHO Hg> 4706 BL ~ 9 1.10.0757 T
Calcite scali ng
No calcite scaling
_______ ~~~~~~_ t ______ _
WELL-2
I
Time (yeo r) FIGURE 11: CaC03 super.;aturation in wells H-2 and H-5 at Sudureyri

u ~
QJ -0
L
0 .c U
~
::<: '-.... 0 ~
CJ' 0
21 400~==~~~----------____________________________ -, ~ JHD HSI:> 4706 BL
300
200
100
1.0
0 .5
0 .0
-0 .5
L....CJ 91 .10.0758 T
• WELL- 5
WELL- 2
70 75 80 8 5 90
Tim e (ye ar)
FIGURE 12: Chloride in the Sudureyri wells H-2 and H-5
~ JHD HSI:> 4706 BL L.....tJ 91.10.0759 T
Ca lc ite sca li ng
No c a lcite sca lin g
--------------------\ --------
-- We ll-5 G9980Wel l- 2
Ch lorid e (C l m g / kg) FIGURE 13: The CaC03 supersaturation and the chloride content in Sudureyri wells
~,H;I"_" W ",0I.1>03IO(¥ • .
N
1
33 Selfoss
22
• WeH with calcite scajing
o Well without calcite scaling
FIGURE 14: The location of wells in the Selfoss geothermal field
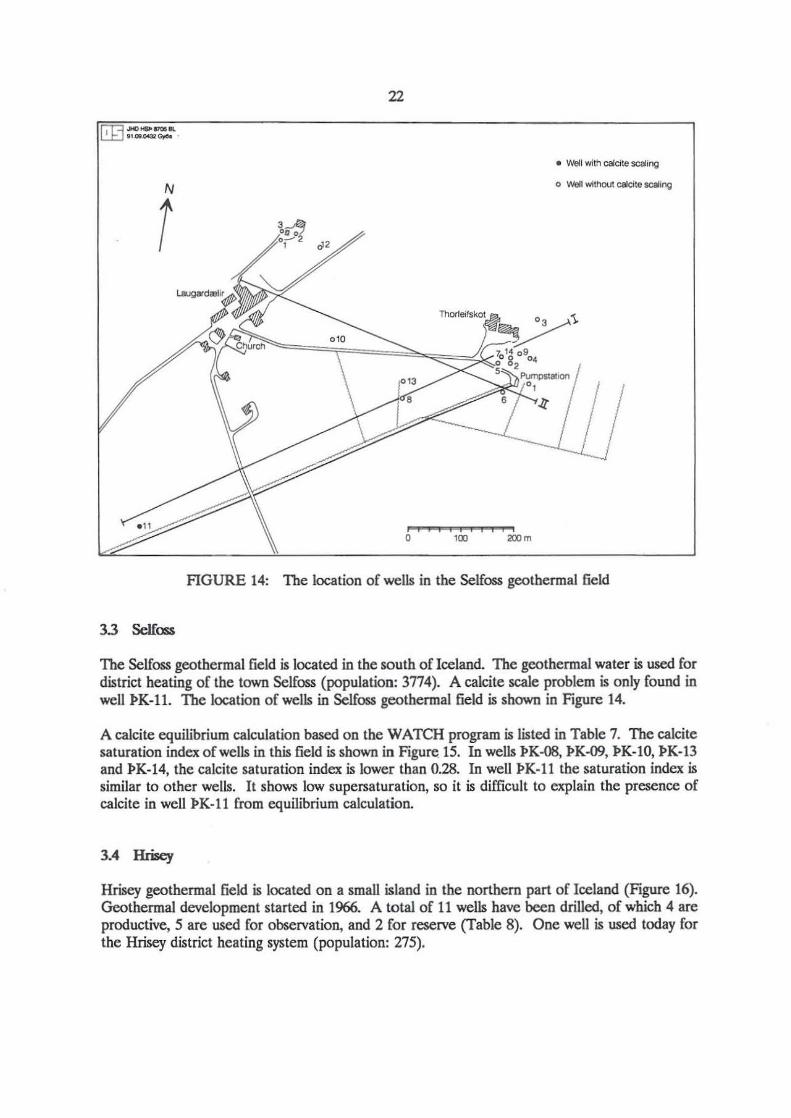
The Selfoss geothermal field is located in the south of Iceland. The geothermal water is used for district heating of the town Selfoss (population: 3774). A calcite scale problem is only found in well ~K- ll. The location of wells in Selfoss geothermal field is shown in Figure 14.
A calcite equilibrium calculation based on the WATCH program is listed in Table 7. The calcite saturation index of wells in this field is shown in Figure. IS. In wells ~K-08, ~K-09, ItK-lO, JtK-13 and JtK-14, the calcite saturation index is lower than 0.28. In welll>K-ll the saturation index is similar to other wells. It shows low supersaturation, so it is difficult to explain the presence of calcite in well ItK-ll from equilibrium calculation.
3.4 Hrisey
Hrisey geothermal field is located on a small island in the northern part of Iceland (Figure 16). Geothermal development started in 1966. A total of 11 wells have been drilled, of which 4 are productive, 5 are used for observation, and 2 for reserve (Table 8). One well is used today for the Hrisey district heating system (population: 275).

23
TABLE 7: Calcite calculations for the Selfoss geothermal field
Well 00. Sample no. Ionic bal. IogQ IogK Jog(Q/K) Note (%) (S.I.)
.K.os 68·3270 4.14 -8.691 -9.101 0.41 ( ... ) 73-0113 -5.08 -9.044 -9.146 0.102 76-0189 -13.04 -92:76 -9.131 -0.145 79-0121 -3.92 -9.109 -9.2Il8 0.099 82-0126 -0.61 -9.4 -9.158 ~.242 85-0002 ~.36 -8.828 -8.949 0.121
.K~ 79.Q120 -5.72 -9.741 -9.042 ~.699 ( ... ) 79-3011 -1.69 -8.919 -8.971 0.052 84-0091 -1.44 -8.638 -8.917 0.279 8S..()()()3 1.12 -8.674 -8.926 0.252 86<lO36 2.42 ..s.57 -8.778 0.2Il8
I>K-lO 84~ -1.12 -9.139 -9.154 0.015 85~1 0.52 ·9.17 -9.183 0.013 86<lO35 1.05 -9,(163 -9.154 0.091 87~ 0.71 -8.992 -9.101 0.109 89~5 1.4 -8.935 -9.08 0.145
JlK-ll ~125 -2.06 -8.938 -8.871 ~.067 85~ 0.75 -8.739 -8.91 0.171 86<lO38 -1.2 -8.758 -8.809 0.051
JlK-13 86<lO37 0.77 -8.995 -9.035 0.04 87~ 1.71 -9.010 -9.045 0.035 87-0100 4.7 -8.984 ·9.057 0.073 89~ 039 -8.958 -9.086 0.128 90=8 0.64 -8.925 -9.041 0.116
I:>K-14 9O~57 1.45 -8.816 -8.959 0.143
NB: Co .. ) Data sampled shortly after initial discharge.
TABLE 8: Overview of the Hrisey geothermal wells
Well Type of the wells Production Depth of Depth of Status of no. history well casing calcite
(m) (m) scaling
1 observation well 99 2 2 production well - 1977 132 53 scaling 3 observation well 637 4.4 4 • 322 2.7 5 production well 1977-1988 320/1055 92 scaling 6 reserve well for 145 1.8
well-5 7 observation well 156 6.5 8 . 176 5 9 reserve well for 224 2
well-lO 10 production well 1988- 216 143 no scaling 11 production well 1988- 130 16.4 no scaling

1.0
0 .5
-0 .5
c o ~
" ~ ~
o ~ -
24
~ JHO HSI:> 9000 BL ~ 91.10.0760T
--~- ---- -- ------- ------ - -------------------o
Ul
70 75
Time
80
(yea r)
PK-ll
--well pk 08 --well pk 13 --well pk 09 o-e-e-e-e we 11 pk 14 +-+--<-+-+ we 11 pk 10 ~well pk 11
85
FIGURE 15: Caco, supersaturation in the Selfoss geothennal field
90
Calcite scaling occurred in surface installation using water from wells 2 and 5 (pipe system). There are two main reservoirs in the geothermal system, a deep reservoir which has a temperature of about 82°C and a shallow reservoir which has a temperature of about 6()OC. The shallow reservoir is a mixture of the runoff from the deep reservoir and the cold groundwater system. Well 11 only draws water from the cold groundwater system. For well 10 the shallow reservoir is closed off by casing so it yields only water from the deep reservoir. All other wells draw water only from the shallow reservoir with minor contribution from the deep reservoir. Where there is a shallow casing there may also be minor inflow of cold water into the production wells.
The shallow reservoir is encountered as a high permeable production feedzone at about 100 m depth in all wells. This feedzone is sedimentary and interlayered between basaltic lava flows.
The mixing of the cold groundwater and runoff from the deep reservoir water appears to happen close to the well field as the produced water has not reached a chemical equilibrium at 6()Oc. In order to calculate the ratio of each component, one can use two chemically inert components such as chloride and oxygen isotope ratios and the relative temperature of the ground water and the deep reservoir.
Well 5 yields from a reservoir where the mixing of two aquifers occurs. The mixing ratio is calculated according to the chloride ion content, temperature parameter and isotope 6180+;

1. The mixing ratio IS calculated from 6 180+:
6"0+ in well 10 = -15.06 6'"0+ in well 11 = -10.8 6"0+ in well 5 = -13.49
The cold water fraction is assumed to be X, so,
or,
-13.09 = -1S.03·(I-x)+[-1O.8]·x
X · IS.06 -13.09 = 36.9% IS.06 -10.8
2 The mixing ratio is calculated from chloride ion parameters:
2S
~--- .. l:L.J .. __ ~
• HOTWATEFI
'--='.~.:t".
'. ' . --.
.. \ \ • \ \ • \ \ • \ •
.. "' .......
a in well 10 = 398.5 mg/kg (881017-0174)
a in well 11 = 20.6 mg/kg
The cold water fraction is assumed to be X. so,
FIGURE 16: The location of wells in the Hrisey field
or,
Cl content olweU 5 - 398.S·(I-x)+2O.6·x
x = 398.S - Cl content 01 weU 5 398.S -20.6
3. The mixing ratio is calculated from temperature parameters:
The temperature of well 10 = 77S'C (881017-0174) The temperature of well 11 = 9"C
The cold water fraction is assumed to be X, so,
or,
Temperature olweU S = 77.S·(I-x)+9·x
x = 77.S - Tempera""e 01 weU 5 77.5 - 9
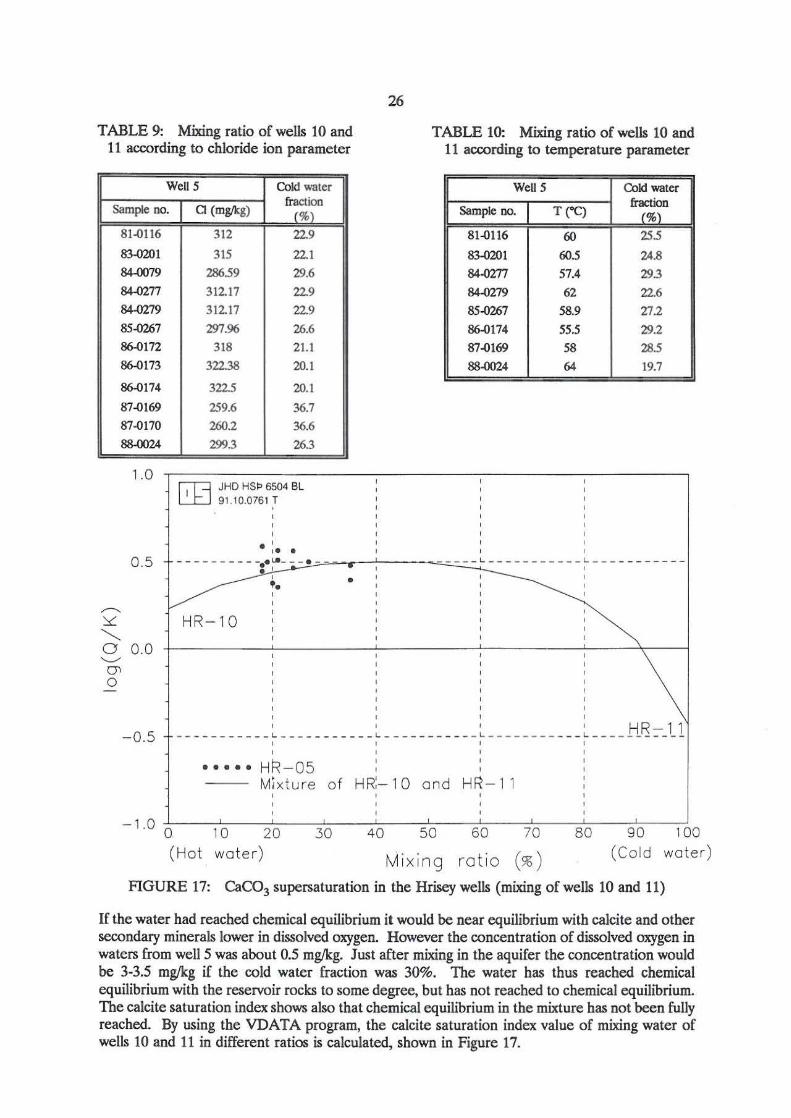
The results are listed in Tables 9 and 10, and plotted in Figure 17.
26
TABLE 9: Mixing ratio of wells 10 and 11 according to chloride ion parameter
TABLE 10: Mixing ratio of wells 10 and 11 according to temperature parameter
WellS Cold water WellS Cold water
Sampte 00. a (mg;kg) fraction
(%l fraction
Sampk: 00. T("C) (%l
81-0116
83-0201
84-0079
84.()277
84.{)279
85.()267
86-{1172
86-0173
86-0174
87..(1169
87-0170
88-0024
1.0
0.5
~
y: '-.. o 0.0 ~
0' o
-0 .5
312 22.9
315 22.1
286.59 29.6
31217 22.9
312.17 22.9
297.96 26.6
318 21.1
322.38 20.1
322.5 20.1
259.6 36.7
260.2 36.6
2993 263
~ JHO HSI:> 6504 BL Ll:J 91.10.0761 T
81 -0116 60
83-0201 60.5
84.()277 57.4
84.()279 62 85.()267 58.9
86-0174 55.5
87.{)169 58 88.()()24 64
. ' ,_ • I I
25.5
24.8
293
22.6
27.2
29.2
285
19.7
---- -- ---.. -l~j~:-~-~-~·~-~---~~------~~-~-~-~"~-~-~-:-------- ~- - - --- -----
~ :., ~: HR- l 0 : ~
, , , ,\ I I , ' HR - 11
-- -- -------~---- -------~ -------- -- -~--------- --~---- -------I , , , , , ••••• HR-05
Mixture of HR:-l0 and HR-l l
-1.0 0 10 20 30 40 50 60 70 80 90 100
(Hat water) Mixing ratio (%) (Co ld water)
FIGURE 17: Caco3 super.;aturation in the Hrisey wells (mixing of wells 10 and 11)
If the water had reached chemical equilibrium it would be near equilibrium with calcite and other secondary minerals lower in dissolved oxygen. However the concentration of dissolved oxygen in waters from well 5 was about 0.5 mglkg. Just after mixing in the aquifer the concentration would be 3-3.5 mglkg if the cold water fraction was 30%. The water has thus reached chemical equilibrium with the reservoir rocks to some degree, but has not reached to chemical equilibrium. The calcite saturation index shows also that chemical equilibrium in the mixture has not been fully reached. By using the VDATA program, the calcite saturation index value of mixing water of wells 10 and 11 in different ratios is calculated, shown in Figure 17.
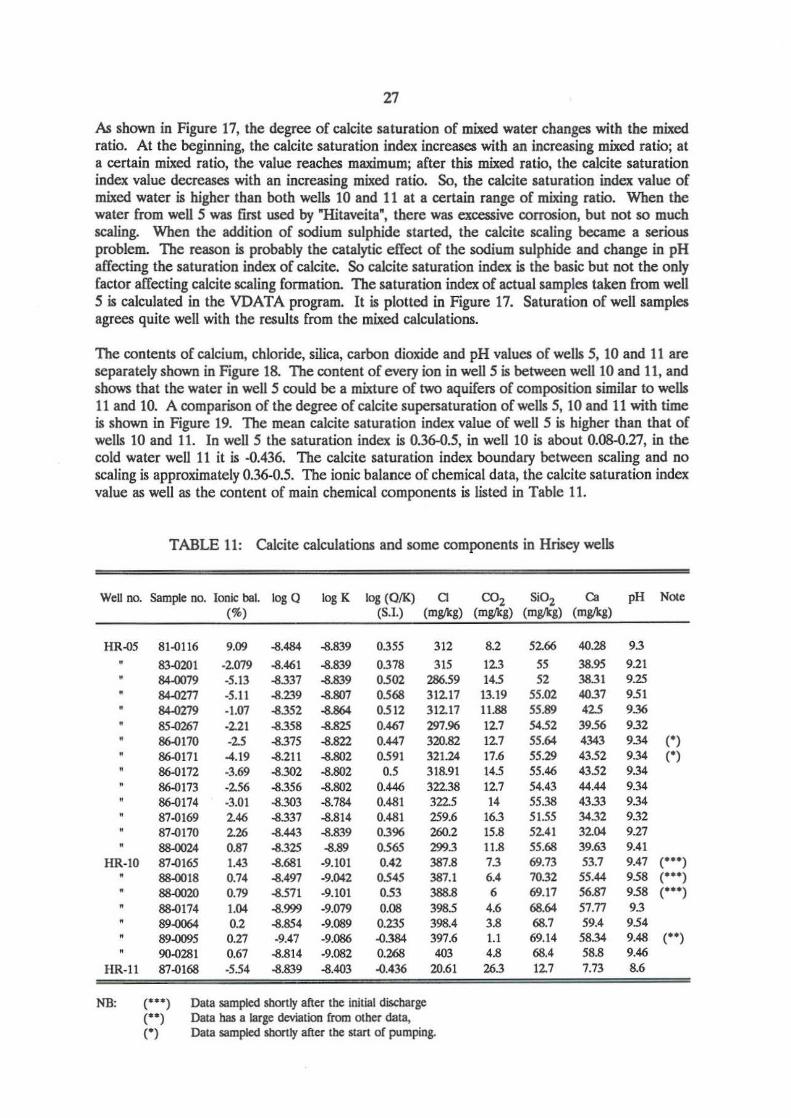
27
As shown in Figure 17, the degree of calcite saturation of mixed water changes with the mixed ratio. At the beginning, the calcite saturation index increases with an increasing mixed ratio; at a certain mixed ratio, the value reaches maximum; after this mixed ratio, the calcite saturation index value decreases with an increasing mixed ratio. So, the calcite saturation index value of mixed water is higher than both wells 10 and 11 at a certain range of mixing ratio. When the water from well 5 was first used by "Hitaveita", there was excessive corrosion, but not so much scaling. When the addition of sodium sulphide started, the calcite scaling became a serious problem. The reason is probably the catalytic effect of the sodium sulphide and change in pH affecting the saturation index of calcite. So calcite saturation index is the basic but not the only factor affecting calcite scaling formation. The saturation index of actual samples taken from well 5 is calculated in the VDATA program. It is plotted in Figure 17. Saturation of well samples agrees quite well with the results from the mixed calculations.
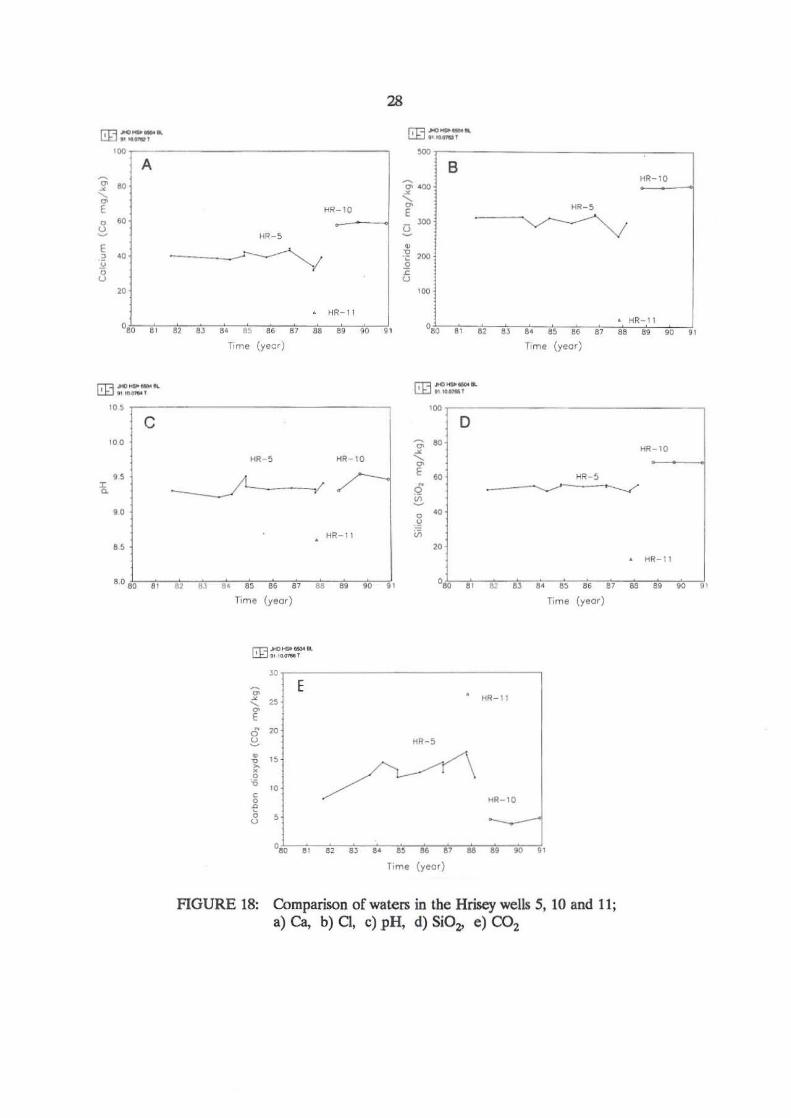
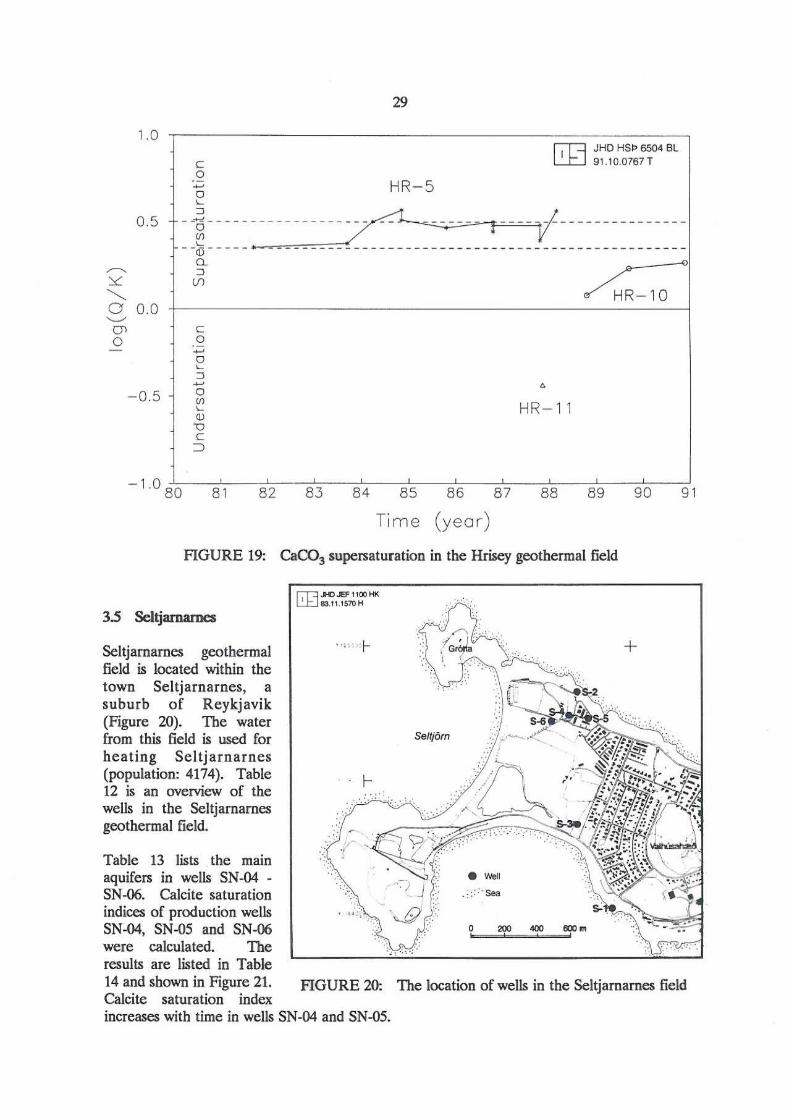
The contents of calcium, chloride, silica, carbon dioxide and pH values of wells 5, 10 and 11 are separately shown in Figure 18. The content of every ion in wellS is between well 10 and 11, and shows that the water in well 5 could be a mixture of two aquifers of composition similar to wells 11 and 10. A comparison of the degree of calcite supersaturation of wells 5, 10 and 11 with time is shown in Figure 19. The mean calcite saturation index value of well 5 is higher than that of wells 10 and 11. In well 5 the saturation index is 0.36-0.5, in well 10 is about 0.08-0.27, in the cold water well 11 it is ..0.436. The calcite saturation index boundary between scaling and no scaling is approximately 0.36-0.5. The ionic balance of chemical data, the calcite saturation index value as well as the content of main chemical components is listed in Table 11.
TABLE 11: Calcite calculations and some components in Hrisey wells
Well 00. Sample 00. Ionic bal. log Q log K log (QIK) a co, Si02 Ca pH NOIe (%) (5.1.) (mg/kg) (mg/kg) (mg/kg) (mg/kg)
HR'()5 81-0116 9.09 -8.484 -8.839 0.355 312 8.2 52.66 40.28 93
83.Q201 -2.079 ~.461 -8.839 0378 315 12.3 55 38.95 9.21 84.()()79 ·5.13 -8.337 -8.839 0502 286.59 145 52 3831 9.25 84.Q271 ·5.11 -8.239 -8.807 0568 312.17 13.19 55.02 4037 951 .w=9 ·1.07 -8352 -8.864 0512 312.17 11.88 55.89 42.5 9.36 85.()267 ·2.21 -8.358 -8.825 0.467 297.96 12.7 5452 39.56 932 86-0170 -2.5 -8.375 -8.822 0.447 320.82 12.7 55.64 4343 9.34 (0) 86-0171 -4.19 ~.211 -8.802 0591 321.24 17.6 55.29 43.52 9.34 (0) 86.Q172 ·3.69 -8.302 -8.802 0.5 318.91 14.5 55.46 43.52 9.34 86-0173 ·2.56 ~.356 -8.802 0.446 322.38 12.7 54.43 44.44 9.34 86-0174 ·3.01 -8.303 -8.784 0.481 322.5 14 55.38 43.33 9.34 87'()I69 2.46 ~337 ~.814 0.481 259.6 163 51.55 34.32 9.32 87-0170 2.26 ~.443 ~.839 0396 260.2 15.8 52.41 32.04 9.27 8S.(1024 0.87 -8325 -8.89 0.565 2993 11.8 55.68 39.63 9.41
HR·IO 87-0165 1.43 ~.681 -9.101 0.42 387.8 73 69.73 53.7 9.47 ( ... ) 88-0018 0.74 ~.497 -9.042 0.545 387.1 6.4 70.32 55.44 9.58 ( ... ) 8S.Q02O 0.79 ~.571 -9.101 053 388.8 6 69.17 56.87 9.58 ( ... ) 88-0174 1.04 -8.999 -9.079 0.06 398.5 4.6 68.64 57.TI 93 89-0064 0.2 ~.&s4 -9_089 0.235 398.4 3.8 68.7 59.4 954 89-0095 0.27 -9.47 ·9.086 .().384 397.6 1.1 69.14 58.34 9.48 ( .. ) 9O.()281 0.67 ~.814 -9.082 0.268 403 4.8 68.4 58.8 9.46
HR·lt 87.0168 -5.54 -8.839 -8.403 .().436 20.61 26.3 12.7 7.73 8.6
NB, C···) Data sampled shortly after the initial dis.charge ( .. ) Dala has a large deviation from other dala, (0) Data sampled shortly after the start or pumping.
rn---· .... _, '" A
!l '" "-~ E 0 " ~
E , -, " 0 U
"
'" "
rn :"' .. -:.~'" '"
C '00
" , •
"
" 00" "
28
rn----....... ' ... B
0;.00 • HR-IO
"-~ HR_=:' HR-IO E
~ '" ~ HP.-5
~ • .~ '" " U
'" HR-I 1 . HR-I!
" " .. " " " " " " .' '", " " " .. " .. " "' .. " Time (yecr) Time (year)
rn '"''''''_ .. ....... ' '" D
~ '" HR _IQ • KR-:; I-IR-1O "-~
E " HR-5
P / " ---- ' -./ !!\ 0
-, •
HR-11 ~
"
" " .. " " " "' " " " '" " " " .. " " " Time (yeo r) Time (yeor)
EEl :':~':. ~ ..
" ~
E <. "
HR-I!
~ <5 " ~ HR-5
• " '-~ • " • HR-IQ , , u
'" " " " ,- " " " "' .. " " Time (year)
FIGURE 18: Comparison of waters in the Hrisey wells 5, 10 and 11; a) Ca, b) Cl, c) pH, d) SiO" e) CO2
HR-11
"' "
"
" "
1.0
c o -o ~
29
HR-5
~ JHO HS~ 6504 BL L.....t:J 91 .1 0.0767 T
0.5 -~---- - - --- - ------ - - -~ -- ,---- r------; -----------------~----- -------~---------- - - ----- -- -~ -- - --- - --- ---- - -
~
y:
"--o 0.0 ~
Cl' o
- 0 .5
Q. :J
U1
c o -o ~
:J -o '" ~ '" -0 c
'"
HR-ll
- 1.0 8~0c--=8L.1--c8'"2c--=8~3--;8"'4,---=8~5---;8'"6c--=87O;---;8"'8,---=89;;--;:9:';:O-~9 I
Time (year)
FIGURE 19: Caco, supe"aturation in the Hrisey geothermal field
3.5 Seltjarnarnes
Seltjamames geothermal field is located within the town Seltjarnarnes, a suburb of Reykjavik (Figure 20). The water from this field is used for heating Seltjarnarnes (population: 4174). Table 12 is an overview of the wells in the Seltjamames geothermal field.
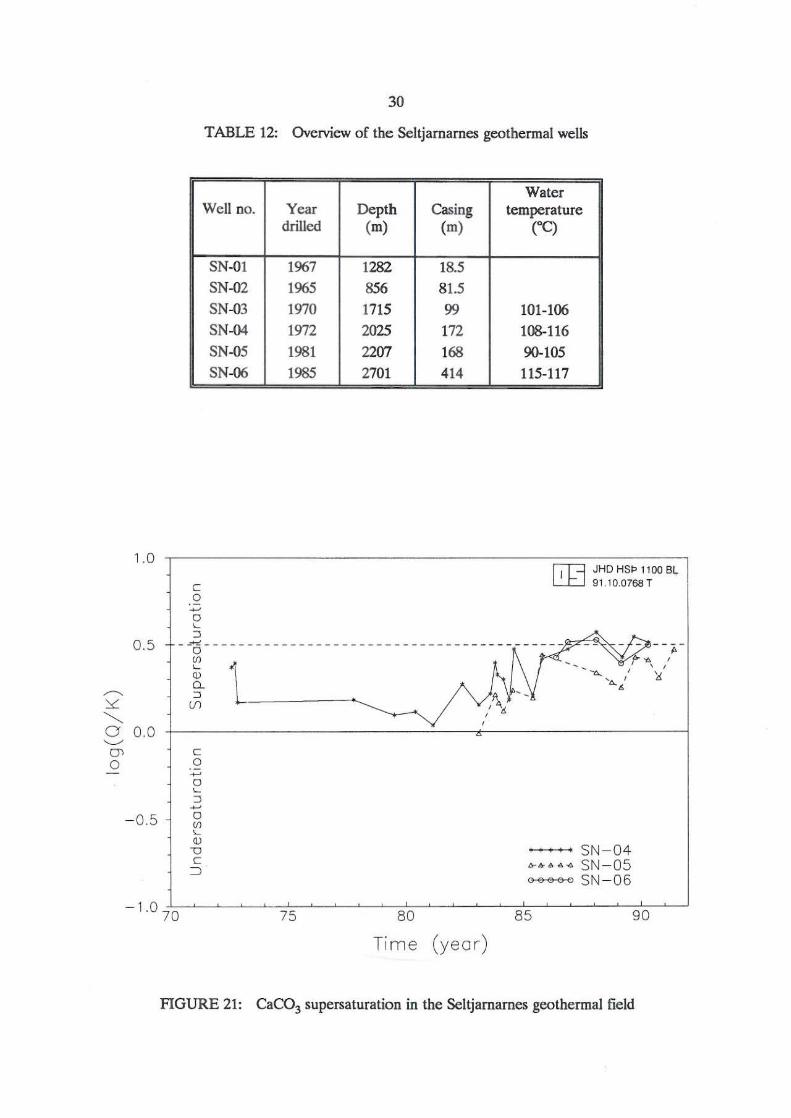
Table 13 lists the main aquifers in wells SN-04 -SN-06. Calcite saturation indices of production wells SN-04, SN-OS and SN-06 were calculated. The results are listed in Table
r.n .H).EI' 1100 HI(
L..:.l:::...J ss. H .1S7tl M
I-
Seltjom
• WO,
". ":. Sea
o 200 400 ID) l1li ,
+
14 and shown in Figure 21. FIGURE 20: The location of wells in the Seltjamames field Calcite saturation index increases with time in wells SN-04 and SN-05.
~
~
"-0 ~
a> 0
30
TABLE 12: Overview of the Seltjamames geothennal wells
Water Well no. Year Depth Casing temperature
drilled (m) (m) Cq
SN-OI 1967 1282 18.5
SN-02 1965 856 81.5 SN-03 1970 1715 99 101-J(J6
SN-04 1972 2025 172 108-116
SN-05 1981 2207 168 90-105 SN-1l6 1985 2701 414 115-117
1.0 ,-------------------------, ~ JHDHSI:> l100BL L....CJ 91.10,0768T
0 .5
0.0
- 0.5
c o ~
o L
:J --0--------------------------------- ------ ---
<n L Q) Cl. :J
III
c o ~
o L
:J ~
o <n L
Q)
"0 C
::0
, ,
SN-04 6-6-6. "'~ SN ~05
~SN-06
-1 .07JO~--~~~-~75~~~~~~870~~~--~8~5~~----~9~O~~
Time (year)
FIGURE 21: CaCO, supersaturation in the Seltjamames geothermal field

1.0
0.5
-0.5
Well
SN-04
SN-04
SN-04
SN-04
SN-05
SN-05
SN-05
SN-06
SN-06
c o ~
o ~
::>
31
TABLE 13: Main aquifers in wells SN-04 - SN-06
Tempe-Depth rature
(m) (' C) 370 75
1180 104
1840 122
1950 126
430 75
700 90
2090 >120
440-700 80
2060 133
a conceotra-tion 1984-1985
(mglkg)
2000
900 900 900 1800
800
800
2100
1000
Production 1984-1985
(%)
15
5
40
40
30
>40
<30
30
70
~ JHO HS~ 1100 BL L....CJ 91.10.0769 T
- ~ ---------- -- - --- - - ------------- ------------
I ~ 8
--- Surface water samples 00000 Deep wate r sam ples
- 1.° 7tO~----~~7~5~--~--~~80~~--~~~8~5--------~9~0~~
Ti me (ye ar) FIGURE 22: Comparison of deep waters and surface water in well SN-04
Deep samples from well SN-04 are used to compare with the surface samples. As shown in Figure 22, the calcite saturation index of deep water samples did not change, whereas the calcite saturation index: from surface samples increases with time. This is explained by a change in the relative yield of the aquifers in well SN-04 after the drilling of well SN-06 and also a collapse of the bottom 100 m in well SN-04 after 1984. Thus, well SN-04 is drawing more water from shallow, cooler and more saline aquifers with time. A temperature drop in well SN-04 also confirms this explanation (Figure 23).

32
TABLE 14: Calcite calculations for the Seltjamames geothermal field
Well no. Sample no. Ionic ba!. log Q log K Iog(Q/K) a T Note (%) (S.L) (mg/kg) ("C)
SN-04 72-0100 10.51 -9326 -9.696 031 488 114.5 72-0131 0.35 -933 ·9.724 0394 542 116 72-0155 10.46 -9541 -9.709 0.168 554 115.2 75..()()70 -6.76 -9.852 -9.705 -0.147 585.8 (0) 77-4059 5.52 -9522 -9.105 0.183 565 19-3020 -3.54 -9592 -9.687 0.095 670.8 114 ~11 3.23 -9555 -9.669 0.114 655 81'()()3O 1.59 -9.632 -9.669 0.031 662.5 113 81-0156 .{l.96 -9.211 -9.737 0526 135 116.7 ( .. ) 82.()()11 2.51 -9.432 -9.705 0.273 152 83.Q008 0.36 -9.552 -9.705 0.153 SSO 83.()199 -4.59 -9.088 -9.705 0.617 933.1 115 ( .. ) 83-0215 -5.63 -9.459 -9.678 0.219 989.8 113.5 83.{)246 -33 -9.253 -9.65 0391 9615 112 83.{)293 -7.37 ·9.382 -9.709 0.327 910 115.2 84.()()O1 -0,11 -9.41 ·9.711 0301 912.5 115.3 84.Q099 -1.98 -9.54 -9.124 0.184 1036 116 84-0114 -6.39 -9.228 -9.704 0.476 1085 114.9 84-0182 -17.77 -9.248 -9.43 0.182 1117 99.5 (0) 85 .. 0185 1.58 -9.462 -9.669 O.W7 13025 113 85.{)2S9 -1.65 -9.288 -9.101 0.419 132537 115.1 86.{)214 -5.29 -9.142 -9.618 0.476 1368.3 110.2 88'()()o3 0.25 ·9.039 -9.611 0.572 1387.4 109.8 89-0013 0.85 -9.148 -9576 0.426 1440 107.9 89'()()52 .{l.29 -9.043 -9.589 0.546 1525 108.6 9O.Q06() .{l.94 -9.086 -9.6 0.514 1629 109.2 84-0146 -5.05 -9.143 -9.402 0.341 929.3 (I) 88.{)091 2.16 -9.743 -9.401 0.336 10522 (2) 84-0147 -3.35 -9.143 -9.366 0.311 901.4 (3) 88.Q090 0.65 -9.743 -9.383 0.36 1209.8 (4)
SN.{)6 86.Q064 -4.09 -9.748 -9.322 0.426 1488.6 86.{)215 -4.13 -9.643 -9.}26 0.517 1540.2 88.QOO4 0.35 -9.743 -9.215 0.528 1616.8 89-0014 -1.23 -9.741 -9.348 0.393 1130 90.0061 -1.45 -9.156 -9.258 0.498 1810
SN.{l5 83.Q009 1.88 -9.364 -9.373 .{l.009 662.09 83.{)248 .{l.2 -9.543 -9.331 0.212 515 83.{)294 -2.4 -9.423 -9.259 0.164 682.5 84.Q008 0.52 -9.384 -9.266 0.118 180 84-0115 .{l39 -9399 -9.161 0.238 865 85-0186 -1.86 -9.337 -9.143 0.194 1022.1 SS.{)260 0.86 -9.372 .8.929 0.443 1044.06 88.Q005 .{l.22 -9.354 -9.015 0.339 1044.1 88-0130 -2.28 -9.359 -9.076 0.283 1151 89'()()15 2.36 -9.336 -9.083 0.253 1070 90.0062 .{l.28 -9.352 .8.94 0.412 1154 89-0051 0.03 -9.387 -8.959 0.428 1160 90.{)239 0.08 -9.392 -9.082 0.31 1403 91-0116 0.46 -9.361 .8.894 0.473 1340
NB, (1)-(4): Deep water samples., (1) 1820 m, (2) 1810 m, (3)1920 m, (4) 1110 m. (0) Water is not in ionic balance. ( .. ) Data has a large deviation from other data.

~
U 0 ~
Ql L
:::J ~
0 L
Ql D-E Ql
f-
~
0> ex "'-0>
E
U ~
Ql "D L
0 ..c U
33
120~--------------------------------------------,
115
110
105
~ JHDHSI> l100Bl L..CJ 91.10.0770T
1007~O~~--~~7~5~--~--~~80~~--~~~8~5--~----~9~0~~
Time (year) FIGURE 23: The temperature change in the Seltjamames well SN-04
2000
1800 SN-04 tI 6 ~ o!I ~ SN-05
1600 ~ SN-06 ••••• SN-04 Deep water samples
1400
1200 •
• 1000
800
600
400 rn JHD H$I:> 1100 BL 91.10.0771 T
200 70 75 80 85 90
Time (year)
FIGURE 24: Chloride in the Seltjamarnes wells SN -04, 05 and 06

1.0
0.5
-0 .5
c o ~
o ~
:0
34
-~----------------- - ---------------- -o _. if> ~
<V CO:0 Vl
c o ~
o ~
:0 ~
o if> ~
<V
" C ::0
• •
~ JHDHSP110QBL ~ 91 .10.0772T
~~ SN-04 !!rb- ~ "-0. SN-05 ~ SN-06
Chloride (CL mg/kg)
FIGURE 25: CaCD3 supersaturation and the chloride content in the Seltjarnames wells
Figure 24 shows that the chloride content in wells SN-04, SN-05 and SN-06 increases with time and also that the chloride content from deep water samples is lower than from surface samples. Figure 25 shows how the change of chloride concentration affects the calcite saturation index in the wells. The calcite saturation index appears to increase with an increase in the chloride content. The calcite saturation index of water from well SN-06 has not changed over time although the salinity has increased. The temperature of the production water has remained almost unchanged during the production time in this well. Well SN-05 shows oscillations in the calcite saturation index and perhaps a general increase over time. This well shows a big change in temperature throughout production. When it is rested for a few months water temperature may rise by HrC and then gradually go down. The oscillations in calcite saturation index are most certainly linked to those production periods and also subsequent temperature changes. At present, the calcite saturation index, log (Q/K), in wells SN-04 and SN-06 reaches about 0.5, but no scaling problems have been noticed yet.
3.6 Ca!culating calcite scaling tendency by using Ryzoar index
The Ryzoar index was calculated for the following wells:
Hrisey· wells 05, 10 and 11; Sudureyri - H-2 and H-5, Selfoss - JoK-11 and JoK-13
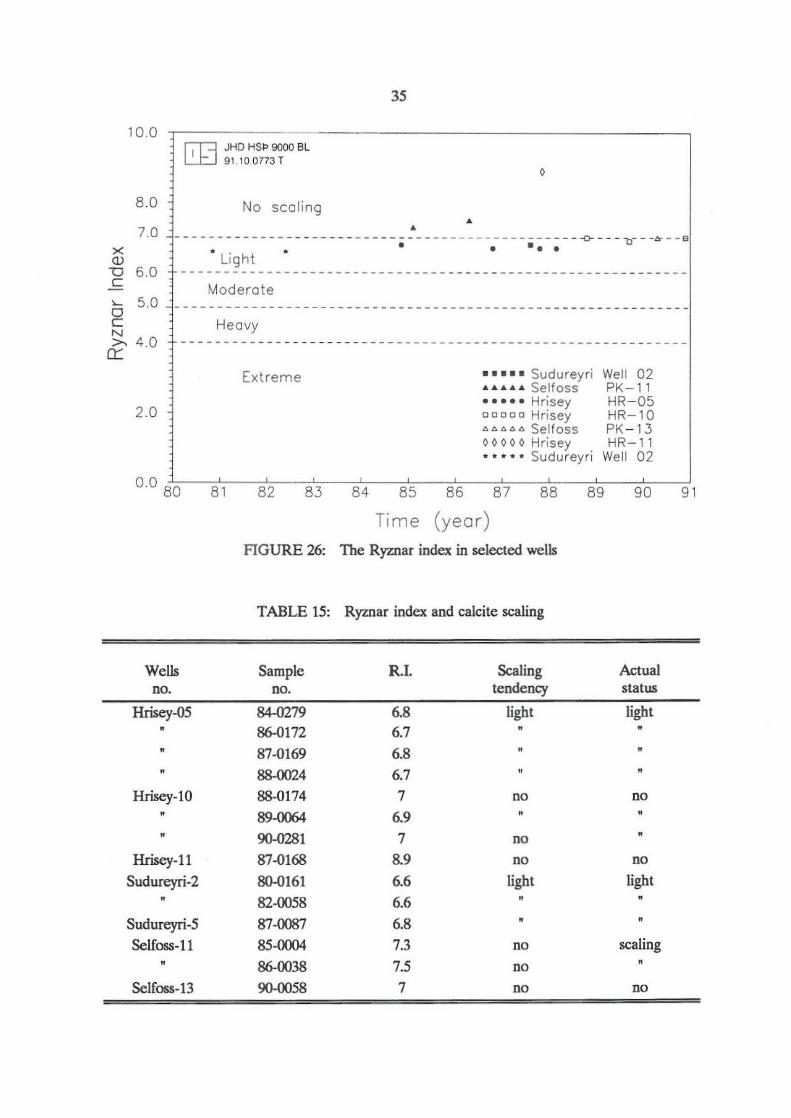
The results are shown in Figure 26. Based on the Ryznar index the calcite scaling tendency is evaluated, as well as a comparison between the evaluated scaling tendency based on the Ryznar index and the actual scaling status (listed in Table 15). The actual scaling status conforms to evaluated scaling tendencies.
10.0
8.0
rj'T"=1 JHD HSp 9000 BL ~ 91.10,0773 T
No sca ling
3S
o
• • 7.0 --------------------------- - - - - -- --- -----------~---~---~--B • • ••• x
(l)
D 6.0 c ~ 5.0 ~ N et 4.0
2.0
• Light •
Moderote
Heavy
Extreme ••••• Sudureyri ........... Selfoss ••••• Hrisey 00000 Hrisey l> '" 6lt. It. Selfoss 00000 Hrisey ...... .. .. Sudureyri
Well 02 PK - ll HR- OS HR-l0 PK-13 HR-l l
Well 02
o 0 8"'0:----;:8':-1 ---;8"'2:-----;:8:;-3 ---;80-:4:-----;:8""5 ---;8"'6:-----;:8 7"---;8"'8:-----;:8 g;;---;g"'O---::!g 1
Time (year)
FIGURE 26: The Ryznar index in selected wells
TABLE 15: Ryznar index and calcite scaling
Wells Sample R.I. Scaling Actual no. no. tendency status
Hrisey-OS 84-0279 6.8 light light • 86-0172 6.7 • • 87-0169 6.8 •
88-0024 6.7 •
Hrisey-lO 88-0174 7 no no • 89-0064 6.9 • • 90-0281 7 no
Hrisey-ll 87-0168 8.9 no no Sudureyri-2 80-0161 6.6 light light
82-0058 6.6
Sudureyri-S 87-0087 6.8 •
Selfoss-11 85-0004 7.3 no scaling 86-0038 7.S no
Selfoss-13 90-0058 7 no no

36
4. DISCUSSION
4.1 C<>mparison of WATCH p~ VDATA program and Rymar iodc:x
Three models were used to analyze calcite scaling potential in low temperature wells in Iceland. A comparison was given.
The WATCH program is a good way to study solution and ealeite equilibria, especially chemical changes in water chemistry accompanying boiling, and variable degassing. and how these changes affect the calcitelsolution equilibria.
The VDATA program is specifieally suited to study the equilibrium condition between solution and calcite and in what way the mixing of different waters will lead to calcite departure from equilibrium. It is based on the same thermodynamic database as the WATCH program.
The Ryznar index gives a qualitative estimate of the calcium carbonate scaling tendency of water. It can be used in the temperature interval 0-93.3°C
Figure 27 shows that the Ryznar index decreases with an increase in the calcite saturation index. Calcite scaling occurs at low Ryznar index values and high calcite saturation index values. The results from the WATCH program confirm the results from the Ryznar index.
~
"" "-a ~
CJ' 0
1.0
0 .5
0.0
- 0.5
Calc ite sca ling " .. '
I.T=I. JHD HSI> 9000 BL ~ 91 .10.0774T
___ ______ _____ _______ __ ~.-L -- ~ - ----- - ---- - - ---- -- - - - - - ____ _ Bou ndary
,
------------------ -- ------- u-~ - --- --- ------ ---- ----- -- - ----
••••• Sudu rey ri ............. Sel foss ••••• Hrisey 00000 Hri sey 0000 0 Hrisey """"" Sudu reyi l> l> l> l> l> Selfoss
We ll 05 PK- 11 HR-OS HR- 10 HR- 11 Well 02 PK - 13
, . ~
, No calci t ~ sc a ling
- 1 .05 .l,:.O--·~---=6-'::. O:---~---=7-'::. O:--~---=8-'::. O:--~-~9. 0
Ryznar Index FIGURE 27: c<>mparison of Ryznar index and saturation index (log QIK)

~
~
""-0 ~
Ol 0
1.0
0.5
0.0
-0.5
37
Calcite scaling "
~ JHD HSI:> 9000 BL L.:..l:J 91 .10.077ST
, , . : ~~~~~:~rJ:::: : ::::~:::::::::::::::::: ~:::::::::::::~~::~:
o
No calcite scaling o o
o
o
o
" 0 0 o 8
o
••••• with calcite scaling 00000 no calcite scaling
-1.0 7t,5~~~~-~-;;8~0~-~~-~-;;875 ~-~~~-'9;;';0"-~-'
Time (year)
FlGURE 28: Caco3 supersaturation in selected wells
4.2 SupelS3turation criterion for calcite scaling formation
A determination of a criterion for the formation of calcite scaling was attempted based on the WATCH and VDATA programs. Figure 28 shows the relationship between the degree of calcite supersaturation and calcite scaling in the Hrisey, Laugames, Sudureyri and Selfoss geothermal fields.
Table 16 lists the saturation index boundary between calcite scaling and no scaling in the Hrisey, Laugames and Sudureyri geothermal fields.
TABLE 16: The Saturation index boundary between calcite scaling and no scaling
Saturation index Geothermal fields boundary
(S.I.)
Hrisey 0.36-0.5
Laugames 0.43-0.48
Sudureyri 0.37-0.48
Selfoss <0.28 (exceptI>K-ll)
boundaries 0.36-0.5
38
The results show that if the saturation index,. log QJK is higher than 0.5, a calcite scaling problem occurs; if the calcite saturation index is lower than 0.36, there is no calcite scaling, and between 0.36 - 0.52 calcite scaling may and may not occur, depending on the flow factor, corrosion factor, etc. This implies a calcite supersaturation ratio (Q/K) of 2.3-3.2 According to this study, geothennai waters can contain 2.3 times more Caco3 in solution than the theoretical amount.
43 Data used for analysis
As mentioned in section 24, good chemical data is very important for any calculation and analysis. In this report, the following kinds of data were not used:
1. Data that is not in ionic balance. 2. Data that was sampled shortly after initial discharge. 3. Data that has a large deviation from other group data.
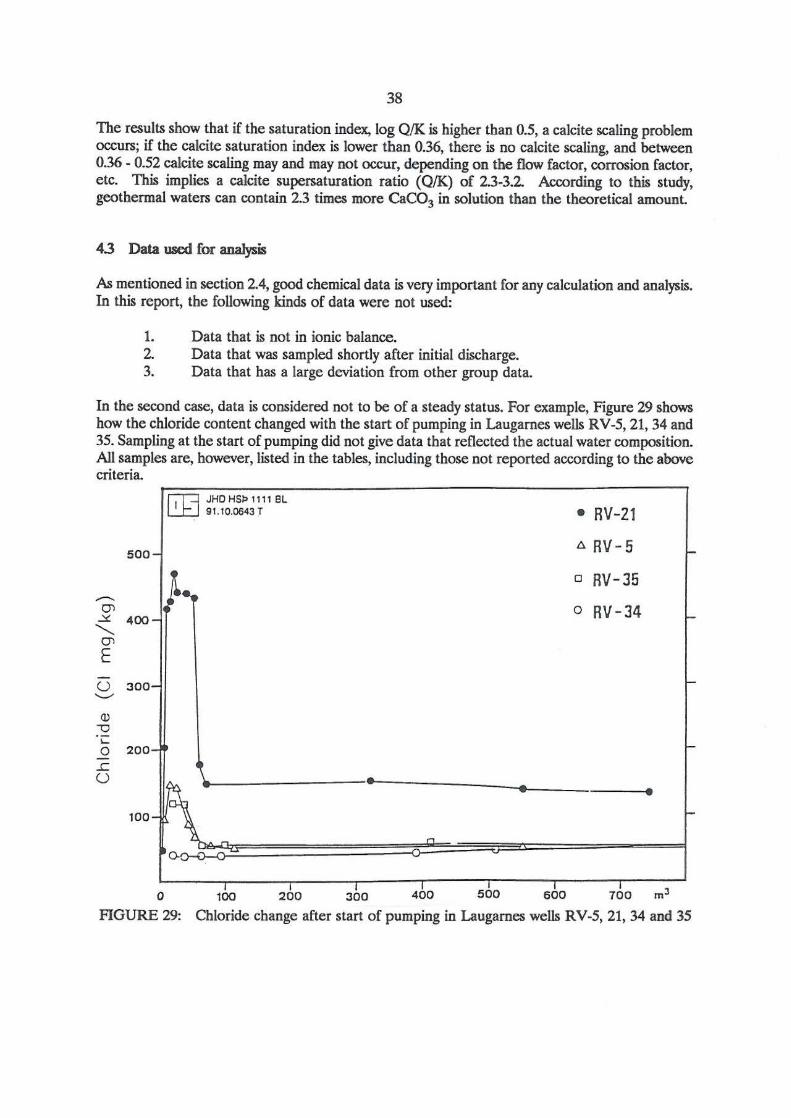
In the second case, data is considered not to be of a steady status. For example, Figure 29 shows how the chloride content changed with the start of pumping in Laugames wells RV-5, 21, 34 and 35. Sampling at the start of pumping did not give data that reflected the actual water composition. All samples are, however, listed in the tables, including those not reported according to the above criteria. rn JHOHS~ "" BL
9'.10.0643 T • RV-Zl
500- " RV-5 l-
Q RV -35 ~ ~.
o RV - 34 CJ> ""'- 4DO-"-
CJ> E
u 300- I-~
Ql
" ~ 0 200-
.re U
\ • •
WO-
• I-
O-
o FIGURE 29:
-v
I I 1 ~!. _! _~ , 100 200 300 400 500 600 700 m
Chloride change after start of pumping in Laugames wells RV-5, 21, 34 and 35

39
5. CONCLUSIONS
The main results of this study are:
1. The saturation index boundary between calcite scaling and no scaling in the selected wells is 0.36-0.5 based on the WATCH program and VDATA program. If the saturation index (log Q/K) is higher than 0.5, a calcite scaling problem occurs, if it is lower than 0.32, no calcite scaling will occur. Between 0.36-0.5 calcite scaling may and may not occur, depending on other factors. This implies that a calcite supersaturation ratio (Q/K) of 2.3~3.2 and, thus, geothermal waters can contain 2.3 times more Caco3 in solution than the theoretical amount.
2. Mixture of different waters is the main reason causing calcite scaling in the low temperature wells selected for this study. In Sudureyri well H-2. Laugames wells 21 and 34 as well as Seltjarnames wells SN-04, SN-05 and SN-06, a high degree of calcite supersaturation is led by the mixing of geothermal water with high salinity water (sea water origin). In this case, the chloride content can be an index of calcite scaling. The degree of calcite supersaturation increases with increasing chloride concentration in solution. All of these wells are within 1 km distance from the shore and the drawdown has caused the reservoir pressure to become lower than the hydrologic pressure in the surrounding sea. In Hrisey well HR-05, a high degree of calcite supersaturation is mainly caused by the mixing of geothermal water and cold water.
3. The results from the WATCH program agree with the results from the Ryznar index. The calcite saturation index increases with the decreasing of the Ryznar index. Calcite scaling occurs at high calcite saturation index values and low Ryznar index values.

40
ACKNOWLEDGEMEN1'S
I would like to express my gratitude to Sverrir Thorhallsson for his excellent supervision and guidance during the whole period and for formulating the final report and critically evaluating it.
Special thanks go to Dr. Ingvar B. Fridleifsson, the director of the UNU Geothermal Training Program for making my fellowship possible, and providing excellent work conditions during my studies.
I would also like to thank Hrefna Kristmannsdottir for providing me with valuable advice and help with the data from the Seltjamames geothermal field; Trausti Hauksson for his valuable advice and acquainting me with the "VDATA" program, making possible its accurate performance; Eioar Gunnlaugsson for his help with the Laugarnes data from Hitaveita Reyjavik; JOD Om Bjamason for his valuable advice and help with the data in Sudureyri, Selfoss, Hrisey and Seltjamames geothermal fields; Steran Amorsson for his excellent lectures; Ludvik S. Georgsson for his guidance during the training course and for editing the report; Marcia Kjartansson for editing the text; Grimur Bjornsson for his help with the reservoir information in Hrisey field; Jens Tomasson for his help with the reservoir information in Sclfoss field; all the people from the chemical laboratory for their excellent lectures and experimental guidance; all the lecturers for the useful knowledge.
Lastly, I thank the Tianjin Geothermal Research and Training Centre and anti-corrosion antiscaling section who gave me the opportunity for geothermal training in Iceland.

41
REFERENCES
Amorsson. S., 1988: Deposition of calcium carbonate minerals from geothermal waters-theoretical considerations. In Proceedings of the International Workshop on Deposition of Solids in Geothermal Systems, Reykjavik, 16-19 August.
Arnorsson, S., and Gunnlaugsson, li, 1975: Instructions for the sampling of water and noncondensible gases. Orkustofnun, Reykjavik, report OS-JHD-7552 (in Icelandic), 27 pp.
Amorsson, S., Sigurdsson. S., and, Svavarsson, H., 1982: The chemistry of geothermal waters in Iceland. 1. Calculation of aqueous speciation from <re to 3700C. Geochim. Cosmochim. Acta, 46, 1513-1532.
Benoit, W. R., 1988: Carbonate scaling characteristics in Dixie Valley, Nevada geothermal wellbores. In Proceedings of the International Workshop on Deposition of Solids in Geothermal Systems, Reykjavik, 16-19 August.
Chang, J. Y., 1990: The study and benefit analysis on the way of anticorrosioniscaling of the geothermal water of a medium or low temperature. Geothermal Resources Council Transactions, vol.14, Part IT, 1575-1582.
Ellis, A 1., 1959: The solubility of calcite in carbon dioxide solutions. Amer. J. Sci., 257, 354-365.
Ellis, A J., 1963: The solubility of calcite in sodium chloride solutions at high temperatures. Amer. J. Sci., 261, 259-267.
Ellis, P. F., 1989: "Materials selection guidelines" in "Geothermal direct use engineering and design guidebook", edited by Lienau, P. 1. and Luois, B. C., published by Geo-Heat Center, Oregon Institute of Technology K1amath Falls, Oregon, p.149-166.
Koutsoukos, P. G., 1990: Iron sulphide and calcium carbonate scaling and their relation to the corrosion of steel. Study of the corrosion and scaling in geothermal systems, the University of Patras (Greece) First six monthly report.
Koutsoukos, P. G., 1991: Iron sulphide and calcium carbonate scaling and their relation to the corrosion of steel. Study of the corrosion and scaling in geothermal systems, the University of Patras (Greece) Second six monthly report.
Kristmannsdottir, S., 1988: Types of scaling occurring by geothermal utilization in Iceland. In Proceedings of the International Workshop on Deposition of Solids in Geothermal Systems, Reykjavik, 16-19 August.
Lovekin, lames W., 1990: Control of calcium carbonate scaling using concentric tubing at Coso geothermal field. Geothermal Resources Council Transactions, vo1.14, Part 11, 1611-1617.
Michels, D.E., 1981: Field demonstration of the EFP system for carbonate scale control. Geother. Resour. Council Bull. Vcl. 11, No. 9, 3-9, Davis, CA 95617.
Nalco Chemical company, 1979: "The NALCO Water Handbook", edited by Kemmer, F. N., 799 pp.

42
Olafsson, M., 1988: Sampling methods for geothermal fluids and gases. Orkustofnun, Reykjavik, report OS-88042/JHD-06, 17 pp.
ParJaktuna, M., and Okandan, E., 1988: The use of chemical inhibitors for prevention of calcium carbonate scaling. In Proceedings of the International Workshop on Deposition of Solids in Geothermal Systems, Reykjavik, 16-19 August.
Pieri, S., Sabatelli, F. and Tarquini, B., 1988: Field testing results of downhole scaling inhibitor injection. In Proceedings of the International Workshop on Deposition of Solids in Geothermal Systems, Reykjavik, 16-19 August.
Plummer, L. N. and Busenberg, E., 1982: The solubilities of calcite, aragonite and vaterite in C02~ H20 solutions between 0 and Wc, and an evaluation of the aqueous model for the system CaCO,-CO,-H,O. Geochim. Cosmochim. Acta, 46, 1011-1040.
Robson. Q., Blair, A and Perales, K., 1990: Antiscant injection trial at KA WERAU geothermal field, New Zealand. Geothermal Resources Council Transactions, vo1.l4, Part 11, 1637·1642.
Vaska, Marcus and KeIlogg. Norm, 1988: Calcium carbonate scale control in geothermal wells. Geothermal Resources Council Bulletin. vol 18, No.6,8-12.
Vetter, O. J and Kandarpa, V., 1982: Handling of scale in geothermal operations. International conference on geothermal energy, Aorence, Italy, Proceedings, 355-372

43
APPENDIX:
Typical raw chemical data used in this study

YR MO DAY NO SAKP. NO 82 05 31 5091 LOCATION: Laugarnes, RV-34
WATER COMPOSITION (mg/kg)
TEMP. · C 119.8 SO. PH/, C 9.30/25. H2S OHMM/ ' C / CL SI02 127.5 F a DISS. NA 129.3 FE K 5.1 AL CA 23.8 NH3 MG .010 CO2 14 .8
YR MO DAY NO SAMP. NO 78 05 03 0018 LOCATION: Sudureyri, H-2
35.4 .1
197.3 .• 0
44
--==-===-----------=~-- -=======---YR MO DAY NO SAMP. NO 86 02 10 LOCATION: Laugarnes, RV-5
WATER COMPOSITION (mg/kg)
TEMP. ·C 130.2 SO. PH/ ' C 9.43/23. H2S OHMM/"C 31.8/ O. CL SI02 155.0 F a DISS. NA 63.3 FE K 2.5 AL CA 3 .• NH3 MG . 070 CO2 17.8
YR MO DAY NO SAMP. NO 82 05 01 0058 LOCATION: SUdureyri, H-2
22.5 .1
46 . 0 .90
WATER COMPOSITION (mg/kg) WATER COMPOSITION (mg/kg)
TEMP. · C 60.0 SO. PH/ ' C 9.66/18. H2S OHMM/'C 671. 0/ O. CL SI02 55.0 F a DISS. NA 121.0 FE K 1.2 AL CA 27.8 NH3 MG .260 CO2 5.7
YR MO DAY NO SAMP. NO 86 04 la 0038 LOCATION: Selfoss, pK-ll
75.4
168.0 .39
488.0
TEMP. ·C 63 . 0 SO. PH/ "C 9.43/ 21. H2S OHMM/ ' CI075.0/ 22 . CL SI02 51.9 F a DISS . NA 145.3 FE K 1.7 AL CA 60.5 NH3 MG 1. 720 CO2 9 . 2
YR MO DAY NO SAMP. NO 89 01 30 0005 LOCATION: Selfoss, pK-I0
95.3
260.0 .28
659.9
WATER COMPOSITION (mg/kg) WATER COMPOSITION (mg/kg)
TEMP. 'C 57.6 SO. 54.7 TEMP. 'C 77.6 SO. 54.3 PH/' C 8.72/2 3. H2S PH/' C 8.62/23. H2S OHMM/'C 917.0/23. CL 229.1 OHMM/· C 833.0/ 23. CL 206 . 3 SI02 62.4 F .25 S102 64.4 F .22 8 . 2 DISS. 570.5 a .1 DISS. 511.6 NA 149.6 FE NA 146.0 FE K '.3 AL K '.5 AL CA 28.5 NH3 CA 25.8 NH3 MG .050 MG .078 CO2 19.3 CO2 27.2 _______ ======s __ ============= ___ =z __
======~sss~_=_z~=zz==:==============
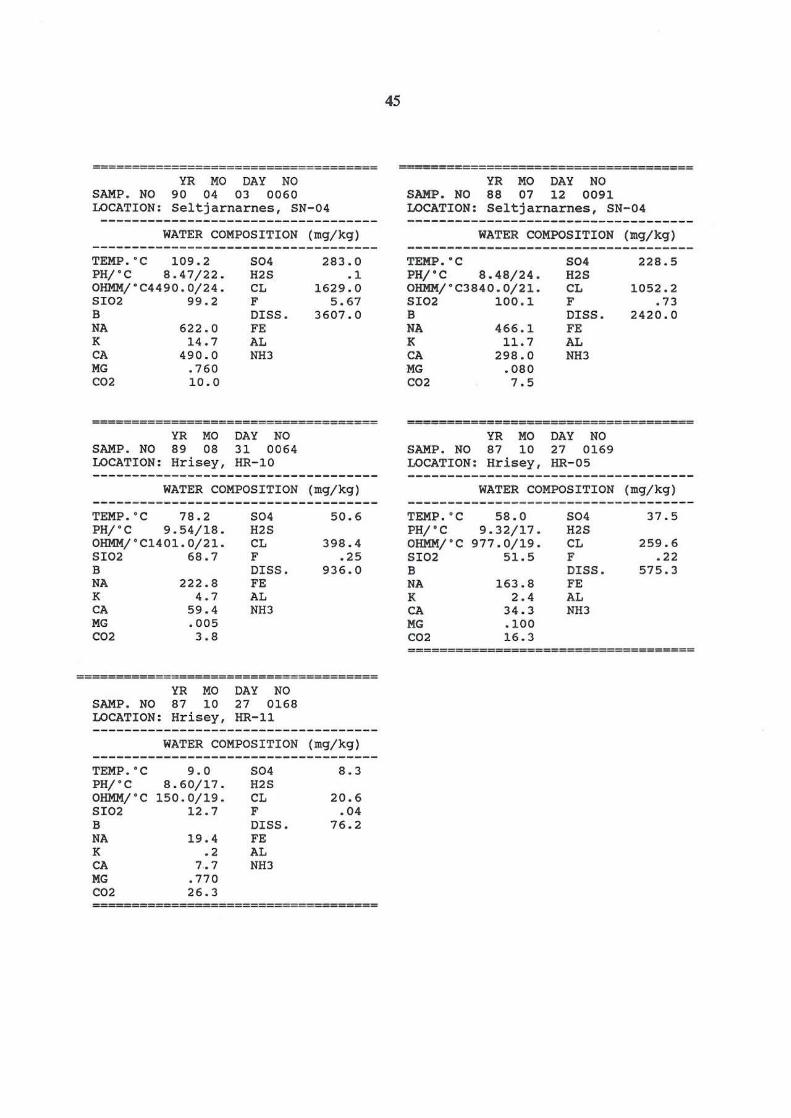
YR MO DAY NO SAMP. NO 90 04 03 0060 LOCATION : Seltjarnarnes, SN- 04
WATER COMPOSITION (mg/kg)
TEMP . ' C 109 . 2 S04 PHj ' C 8.47/22 . H2S OHMMj OC4490 . 0j24. CL 5102 99.2 F B DISS. NA 622.0 FE K 14.7 AL CA 490.0 NH3 MG . 760 CO2 10. 0
YR MO DAY NO SAMP . NO 89 08 31 0064 LOCATION : Hrisey, HR-IO
283.0 . 1
1629 . 0 5.67
3607.0
WATER COMPOSITION (mgjkg)
TEMP . ' C 78 . 2 S04 PHj "C 9 . 54/18 . H2S OHMMj OC1401.0j21. CL 5102 68.7 F B DISS . NA 222 . 8 FE K 4 . 7 AL CA 59.4 NH3 MG . 005 CO2 3 . B
YR MO DAY NO SAMP . NO 87 10 27 0168 LOCATION: Hrisey, HR-ll
50 . 6
398 . 4 .25
936 . 0
WATER COMPOSITION (mg/kg)
TEMP ." C 9 . 0 S04 B.3 PH/ ' C 8 . 60/17. H2S OHMMI ' C 150.0/19 . CL 20.6 5102 12.7 F . 04 B DISS. 76.2 NA 19.4 FE K . 2 AL CA 7 . 7 NH3 MG . 770 CO2 26 . 3
45
YR MO DAY NO SAMP. NO 88 07 12 0091 LOCATION: Seltjarnarnes, SN-04
WATER COMPOSITION (mg/kg)
TEMP. ' C S04 PH/ ' C 8.48/24. H2S OHMMj "C3840 . 0j21. CL 5102 100 . 1 F B DISS . NA 466 . 1 FE K 11. 7 AL CA 298.0 NH3 MG . 080 CO2 7.5
YR MO DAY NO SAMP . NO 87 10 27 0169 LOCATION : Hrisey , HR-OS
228.5
1052 . 2 . 73
2420.0
WATER COMPOSITION (mg/kg)
TEMP . · C 58 . 0 S04 37 . 5 PH/ ' C 9 . 32/17 . H2S OHMM/ ' C 977 . 0/19 . CL 259.6 5102 51. 5 F .22 B DISS. 575.3 NA 163 . 8 FE K 2 . 4 AL CA 34 . 3 NH3 KG . 100 CO2 16.3 ========ZZ~_2a:====K==============~=