chemical inhibition of nitrification: e methods to d and
TRANSCRIPT
CHEMICAL INHIBITION OF NITRIFICATION: EVALUATING METHODS TO DETECT AND CHARACTERIZE INHIBITION AND THE ROLE OF SELECTED STRESS
RESPONSES UPON EXPOSURE TO OXIDATIVE AND HYDROPHOBIC TOXINS
Richard Thomas Kelly II
Dissertation submitted to the faculty of the Virginia Polytechnic Institute and State University in partial fulfillment of the requirements for the degree of
DOCTOR OF PHILOSOPHY
In Civil and Environmental Engineering
Dr. Nancy G. Love, Chair Dr. Glen T. Daigger Dr. John T. Novak
Dr. Ann M. Stevens Dr. Peter J. Vikesland
June 21, 2005 Blacksburg, VA
Keywords: activated sludge, nitrification, chemical inhibition, detection, stress response,
glutathione, potassium efflux, cell membrane, fatty acid
Copyright 2005, Richard T. Kelly II

CHEMICAL INHIBITION OF NITRIFICATION: EVALUATING METHODS TO DETECT AND CHARACTERIZE INHIBITION AND THE ROLE OF SELECTED STRESS
RESPONSES UPON EXPOSURE TO OXIDATIVE AND HYDROPHOBIC TOXINS
Richard Thomas Kelly II
ABSTRACT This research first examined nitrification inhibition caused by different classes of industrially relevant chemicals on activated sludge and found that conventional aerobic nitrification was inhibited by single pulse inputs of every chemical tested, with 1-chloro-2,4-dinitrobenzene (oxidant) having the most severe impact, followed by alkaline pH 11, cadmium (heavy metal), cyanide, octanol (hydrophobic) and 2,4-dinitrophenol (respiratory uncoupler). Of the different chemicals tested, the oxidative and hydrophobic chemicals showed severe nitrification inhibition relative to other treatment processes and therefore deserved further investigation. For oxidative chemicals, we hypothesized that the more severe inhibition was because nitrifying bacteria lack one or more of the microbial stress response mechanisms used to mediate the toxic effect of oxidative chemicals. During these experiments, we showed that a rapid (minutes) antioxidant potassium efflux mechanism does not exist in two nitrifying bacteria, Nitrosomonas europaea and Nitrospira moscoviensis. Furthermore, we showed that another important antioxidant molecule, glutathione, was not oxidized as readily as in a non-nitrifying bacterium. Furthermore, we hypothesized that hydrophobic chemical-induced nitrification inhibition recovered more quickly because of the presence of membrane modification stress response mechanisms. While testing this hypothesis, we showed that N. europaea modified its cell membrane in response to hydrophobic chemicals using a long-term (hours) membrane modification mechanism that required the synthesis of new fatty acids, but it did not contain a short-term (minutes) response mechanism involving a cis/trans isomerase. Therefore, investigating these nitrifier stress responses showed that nitrifiers lack short-term stress responses that may be used to rapidly detect inhibition, indicating that conventional methods of detecting nitrification inhibition, like differential respirometry and nitrate generation rate (NGR), are still the fastest and easiest methods to use. Because several conventional methods exist, we also investigated differences between differential respirometry and a UV method we developed to measure NGR. During these tests, we showed that the UV NGR method provided a more reliable measure of nitrification inhibition than differential respirometry, and that the time to maximum nitrification inhibition depended on the properties of the chemical toxin, which implies that longer exposure times may be needed to accurately predict nitrification inhibition.

iii
ACKNOWLEDGEMENTS I would like to acknowledge the following sources of research funding and fellowship support: • Charles E. Via, Jr., Department of Civil and Environmental Engineering Fellowship • Pratt, Department of Civil and Environmental Engineering Research Fellowship • Robert Canham Graduate Studies Scholarship • Sonny Roden Memorial Scholarship • Waste Policy Institute Graduate Fellowship Program • Water Environment Research Foundation I wish to thank my advisory committee members, Dr. Glen T. Daigger, Dr. John T. Novak, Dr. Ann M. Stevens, and Dr. Peter J. Vikesland for their help and encouragement throughout my time at Virginia Tech. I would very much like to thank my academic and research advisor, Dr. Nancy G. Love, for the volumes of time and deep commitment she provided to me. Thanks to her knowledge, understanding, determination, encouragement and patience, I was able to make it through my research at Virginia Tech relatively unscathed. I would also like to thank Dr. Love for allowing me the opportunity to teach, and for her valuable mentoring during that process. I am honored to have been given the opportunity to work with and know Dr. Love and hope to work with her again in the future. I would like to thank our Laboratory Manager, Julie Petruska, Analytical Chemist, Jody Smiley, and Postdoctoral Research Associate Kartik Chandran for their assistance and guidance in the laboratory and with my research. I would also like to acknowledge the undergraduate research assistants, Kelly Mattson, Katherine Linares, Michael Hare, Suzanne Ayres, Amanda Romine and Michael Garland, without whom I would never have finished my research. I would especially like to thank fellow graduate students and good friends Susanna Leung, Ines Henriques, Mert Muftugil, and Chris and Joy Muller for helping me with research, giving me ideas, and putting up with my complaints over the past five years. Finally, I would like to thank my parents and family for their unending support; even though they may not have understood what or why I went though this process.
iv
TABLE OF CONTENTS LIST OF TABLES .............................................................................................................................. VI LIST OF FIGURES ...........................................................................................................................VIII LIST OF ABBREVIATIONS.................................................................................................................. X CHAPTER 1 EXECUTIVE SUMMARY................................................................................................. 1
1.1 Introduction................................................................................................................. 1 1.2 Phase 1 Research: Source-Effect Studies-Chapter 2.................................................. 1 1.3 Phase 2 Research: Inhibition Method Comparisons – Chapters 3 & 4...................... 4 1.4 Phase 3 Research: Oxidative Stress Responses in Nitrifying Bacteria – Chapter 5 .. 6 1.5 Phase 4 Research: Hydrophobic Stress Responses in Nitrifying Bacteria –
Chapter 6................................................................................................................... 10 1.6 References................................................................................................................. 12
CHAPTER 2 LITERATURE REVIEW ON FACTORS THAT INFLUENCE NITRIFICATION INHIBITION IN ACTIVATED SLUDGE CULTURES ................................................................................ 14
2.1 Nitrification Inhibition .............................................................................................. 14 2.2 Cell Biology and Energy Production in Nitrifying Bacteria..................................... 24 2.3 Oxidative Chemical Inhibition.................................................................................. 29 2.4 Organic Hydrophobic Chemical Inhibition .............................................................. 43 2.5 References................................................................................................................. 56
CHAPTER 3 CHEMICAL INHIBITION OF NITRIFICATION IN ACTIVATED SLUDGE ............................ 70 CHAPTER 4 ULTRAVIOLET SPECTROPHOTOMETRIC DETERMINATION OF NITRATE: DETECTING
NITRIFICATION RATES AND INHIBITION ..................................................................... 71 4.1 Abstract ..................................................................................................................... 71 4.2 Introduction............................................................................................................... 71 4.3 Methodology ............................................................................................................. 73 4.4 Results and Discussion ............................................................................................. 75 4.5 Conclusions............................................................................................................... 84 4.6 References................................................................................................................. 84
CHAPTER 5 A CRITICAL COMPARISON OF TWO COMMON METHODS TO DETECT NITRIFICATION INHIBITION IN ACTIVATED SLUDGE............................................................................ 86
5.1 Abstract ..................................................................................................................... 86 5.2 Introduction............................................................................................................... 86 5.3 Methods and Materials.............................................................................................. 89 5.4 Results and Discussion ............................................................................................. 91 5.5 Conclusions............................................................................................................. 104 5.6 References............................................................................................................... 105
CHAPTER 6 GLUTATHIONE MEDIATED OXIDATIVE STRESS RESPONSE MECHANISMS IN NITRIFYING BACTERIA ................................................................................................................ 108
6.1 Abstract ................................................................................................................... 108 6.2 Introduction............................................................................................................. 108 6.3 Methodology ........................................................................................................... 113 6.4 Results and Discussion ........................................................................................... 118

v
6.5 Conclusions............................................................................................................. 128 6.6 References............................................................................................................... 128
CHAPTER 7 CELL MEMBRANE MODIFICATIONS IN NITROSOMONAS EUROPAEA EXPOSED TO THE HYDROPHOBIC CHEMICAL 1-OCTANOL ................................................................... 132
7.1 Abstract ................................................................................................................... 132 7.2 Introduction............................................................................................................. 132 7.3 Methodology ........................................................................................................... 136 7.4 Results and Discussion ........................................................................................... 138 7.5 Conclusions............................................................................................................. 145 7.6 References............................................................................................................... 146
CHAPTER 8 ENGINEERING SIGNIFICANCE ................................................................................... 150 APPENDICES
A Chapter 3 Data ........................................................................................................ 154 B Chapter 4 Data ........................................................................................................ 193 C Chapter 5 Data ........................................................................................................ 206 D Chapter 6 Data ........................................................................................................ 230 E Chapter 7 Data ........................................................................................................ 242

vi
LIST OF TABLES
CHAPTER 1 Table 1.1 Summary of Process Effects for Seven Source Chemicals for the 10-Day SRT
Biomass Using a Pseudo-Quantitative Scale. ......................................................... 2 Table 1.2 Nitrate generation rate (NGR) inhibition levels relative to the control for the first
sample collected after each toxin was added (6 hours after addition) and recovery times to control levels based on NGR and effluent nitrate. .................................... 3
Table 1.3 Summary of selected genes involved in oxidative stress response mechanisms and their presence in the N. europaea genome.............................................................. 9
Table 1.4 Summary of select genes involved in hydrophobic stress response mechanisms and their presence in the N. europaea genome............................................................ 11
CHAPTER 2 Table 2.1 Summary of process effects for nitrifying biomass exposed to five chemical toxins
using a pseudo-quantitative scale.......................................................................... 16 Table 2.2 NGR inhibition levels relative to the control for the first sample after each toxin was
added, and recovery times to control levels based on NGR and effluent nitrate.. 23 Table 2.3 Summary of selected genes involved in oxidative stress response mechanisms and
their presence in the N. europaea genome............................................................ 36 Table 2.4 Summary of select genes involved in hydrophobic stress response mechanisms and
their presence in the N. europaea genome............................................................ 51 CHAPTER 4 Table 4.1 Precision and bias for the UV measured nitrate method for 7.1 and 26.1 mg/L-N
nitrate measured at 229 and 235 nm ..................................................................... 76 Table 4.2 Comparison of nitrite corrected UV measured nitrate concentrations to ion
chromatography (IC) measured nitrate concentrations. Number given is average of 4 measurements ± (standard deviation) ............................................................ 80
CHAPTER 5 Table 5.1 Comparison of SNGR to nSOUR for prediction of nitrification inhibition
percentages for different concentrations of cadmium, CDNB and chlorine......... 93 CHAPTER 6 Table 6.1 Summary of select genes involved in oxidative stress response mechanisms and their
presence in the N. europaea genome. ................................................................. 112 CHAPTER 7 Table 7.1 Summary of select genes involved in hydrophobic stress response mechanisms and
their presence in the N. europaea genome.......................................................... 134

vii
Table 7.2 Nitrite production rates and inhibition relative to the control for N. europaea shocked with 1-octanol ....................................................................................... 139
Table 7.3 Percent increase in fatty acid concentration after 4 hours of exposure for N. europaea and P. aeruginosa cells in the presence or absence of 1-octanol ....... 140

viii
LIST OF FIGURES
CHAPTER 2 Figure 2.1 Components of the ammonia oxidation system and electron transport in
N. europaea........................................................................................................... 27 Figure 2.2 Components of the nitrite oxidation system electron transport in Nitrobacter ........ 28 CHAPTER 4 Figure 4.1 Wavelength scan of nitrate absorbance in filtered mixed liquor .............................. 77 Figure 4.2 Linearity of UV absorbance with increasing nitrate concentration for wavelengths
from 227 to 232 nm............................................................................................... 78 Figure 4.3 Linearity of nitrite UV absorbance in mixed liquor (ML) measured at 229 nm....... 79 Figure 4.4 Nitrate generation curve for cadmium inhibited and control (0 Cd added) mixed
liquor ..................................................................................................................... 81 Figure 4.5 Nitrification inhibition curve developed using UV detection of NGR for cadmium
induced inhibition ................................................................................................. 82 CHAPTER 5 Figure 5.1 Nitrification inhibition curve developed using SNGR for chlorine bleach
(concentration determined as Cl2)......................................................................... 95 Figure 5.2 (A) Nitrate generation rate monitored over time for the control (no cadmium) and
cadmium inhibited SBR. (B) Nitrification inhibition calculated from the SNGR results for the control and cadmium inhibited reactors......................................... 98
Figure 5.3 Nitrification inhibition caused by CDNB and calculated from the SNGR results for the control and CDNB inhibited reactors.............................................................. 99
Figure 5.4 Nitrification inhibition caused by chlorine bleach and calculated from the SNGR results for the control and chlorine inhibited reactors. ....................................... 100
Figure 5.5 Comparison of nSOUR and SNGR nitrification percent inhibition for cadmium inhibited SBRs .................................................................................................... 101
Figure 5.6 Comparison of cadmium induced nitrification percent inhibition for CSTR and SBR reactors as measured by SNGR........................................................................... 103
Figure 5.7 Comparison of cadmium induced nitrification percent inhibition for CSTR and SBR reactors as measured by nSOUR......................................................................... 104
CHAPTER 6 Figure 6.1 Soluble potassium levels for mixed liquor and nitrifying enrichment culture exposed
to 50 mg/L NEM................................................................................................. 119 Figure 6.2 Soluble potassium for unshocked control, nigericin and NEM-shocked reactors of N.
europaea ............................................................................................................. 121 Figure 6.3 Soluble potassium for unshocked control, nigericin and NEM-shocked reactors of
Ni. moscoviensis.................................................................................................. 122 Figure 6.4 Soluble potassium for unshocked control, nigericin, and NEM-shocked reactors of
P. aeruginosa PAO1 ........................................................................................... 122 Figure 6.5 Average soluble potassium for unshocked control and chlorine-shocked reactors of
N. europaea......................................................................................................... 123
ix
Figure 6.6 Average soluble potassium for unshocked control and chlorine-shocked reactors of P. aeruginosa PAO1 ........................................................................................... 124
Figure 6.7 Ratio of oxidized glutathione to average total glutathione concentrations for N. europaea and P. aeruginosa cells exposed to sodium hypochlorite for 20 minutes................................................................................................................ 126
CHAPTER 7 Figure 7.1 Change in the total measured cis:trans unsaturated fatty acids ratio over time for
cells exposed to octanol ...................................................................................... 141 Figure 7.2 Change in the total saturated:unsaturated fatty acids ratio over time for cells exposed
to octanol............................................................................................................. 144

x
LIST OF ABBREVIATIONS
ABBREVIATION DESCRIPTION AMO Ammonia Monooxygenase ANAMMOX Anaerobic Ammonia Oxidation AOB Ammonia Oxidizing Bacteria ATU Allylthiourea BOD Biochemical Oxygen Demand CDNB 1-Chloro-2-4-Dinitrobenzene COD Chemical Oxygen Demand CSTR Continuously Stirred Tank Reactor DNP 2,4-Dinitrophenol GGKE Glutathione-Gated Potassium Efflux GSH Glutathione HAO Hydroxylamine Oxidoreductase HRT Hydraulic Residence Time IC Ion Chromatography LPS Lipopolysaccharide MLSS Mixed Liquor Suspended Solids MLVSS Mixed Liquor Volatile Suspended Solids NEM N-ethylmaleimide NGR Nitrate Generation Rate NOB Nitrite Oxidizing Bacteria NOR Nitrite Oxidoreductase NPR Nitrite Production Rate nSOUR Nitrification Specific Oxygen Uptake Rate OUR Oxygen Uptake Rate RND Resistance-Nodulation-Cell Division SBR Sequencing Batch Reactor SNGR Specific Nitrate Generation Rate SOUR Specific Oxygen Uptake Rate SRT Solids Residence Time TCMP 2-Chloro-6(Trichloromethyl)Pyridine TKN Total Kjeldahl Nitrogen UV Ultraviolet

1
1 EXECUTIVE SUMMARY 1.1 Introduction
Although several different methods can be used to treat wastewaters, biological
wastewater treatment is the most commonly used. Because wastewater influents have a variable
composition and can have both domestic and industrial sources, wastewater treatment facilities
can occasionally receive shock loads of toxic chemicals that will upset the treatment process.
Such upset events will disrupt different treatment processes, including BOD removal efficiency,
nitrification, settleability and deflocculation. Unfortunately, few studies have been conducted
under controlled conditions that examine the process upset effects induced by a toxic source
(Love and Bott, 2000). Additionally, very little work has been done to try and understand the
cellular level mechanistic cause of the upset effects induced by the toxicant (source). By
studying the source-cause-effect relationships of different toxins, it is possible to better
understand the nature of upset events and develop improved methods to mediate upset events or
even to detect upset events before they occur. The initial goal of this research was to determine
the source-effect relationships that are evoked in activated sludge treatment processes by several
different chemical classes from common industrial sources. From the results of the source-effect
studies, three hypothesis were developed and tested that examine detection methods and the
molecular level mechanisms that may be responsible for the increased levels of inhibition that
were found for one particular activated sludge treatment process: nitrification.
1.2 Phase 1 Research: Source-Effect Studies-Chapter 2
The initial phase of this research examined the process upset effects caused by six
different industrial chemicals: an electrophilic solvent (1-chloro-2,4-dinitrobenzene, CDNB), a
heavy metal (cadmium), a hydrophobic chemical (1-octanol), an uncoupling agent (2,4-
dinitrophenol, DNP), alkaline and acidic pH, and cyanide in its weak metal complexed form.
Respriatory inhibition testing was performed to determine the amount of chemical to add for
each shock event. The concentrations that were found to inhibit respiration by 15, 25 and 50%
of normal levels were used for these tests.
During these source-effect studies, a range of process upset effects were observed and a
summary of these are listed on Table 1.1. The results presented in this table showed that the only
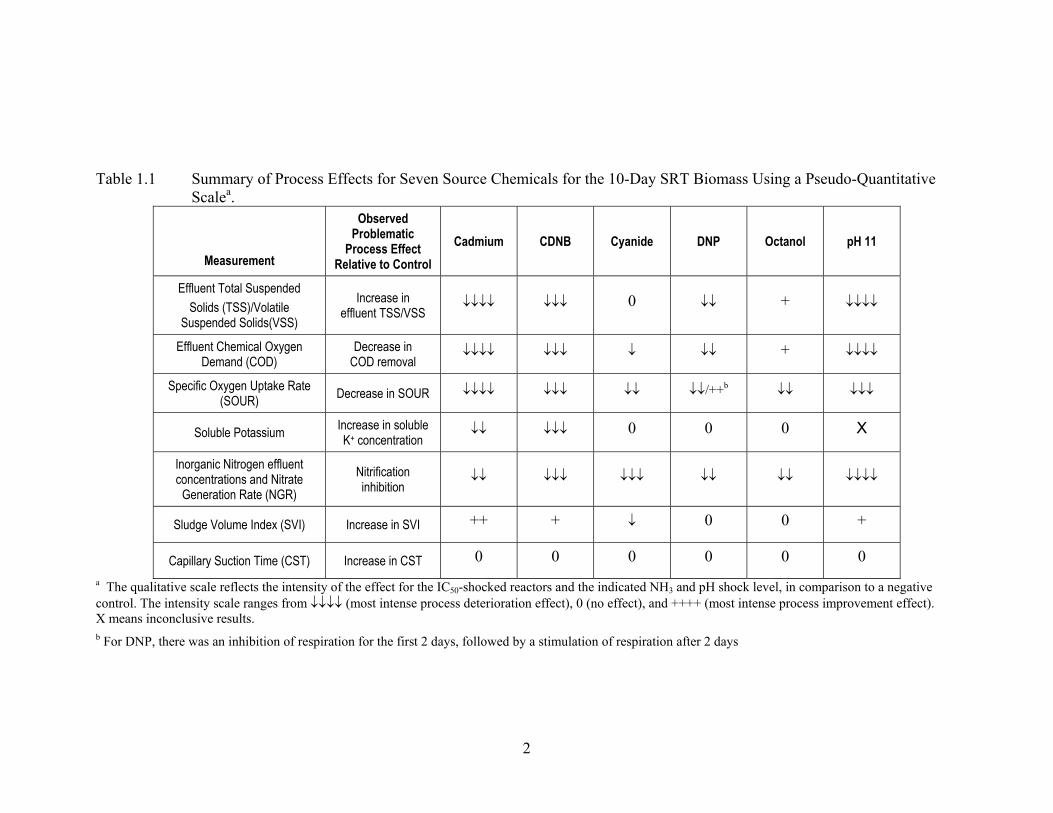
2
Table 1.1 Summary of Process Effects for Seven Source Chemicals for the 10-Day SRT Biomass Using a Pseudo-Quantitative
Scalea.
Measurement
Observed Problematic
Process Effect Relative to Control
Cadmium CDNB Cyanide DNP Octanol pH 11
Effluent Total Suspended Solids (TSS)/Volatile
Suspended Solids(VSS)
Increase in effluent TSS/VSS
↓↓↓↓ ↓↓↓ 0 ↓↓ + ↓↓↓↓
Effluent Chemical Oxygen Demand (COD)
Decrease in COD removal
↓↓↓↓ ↓↓↓ ↓ ↓↓ + ↓↓↓↓
Specific Oxygen Uptake Rate (SOUR) Decrease in SOUR ↓↓↓↓ ↓↓↓ ↓↓ ↓↓/++b ↓↓ ↓↓↓
Soluble Potassium Increase in soluble K+ concentration
↓↓ ↓↓↓ 0 0 0 X
Inorganic Nitrogen effluent concentrations and Nitrate
Generation Rate (NGR) Nitrification inhibition
↓↓ ↓↓↓ ↓↓↓ ↓↓ ↓↓ ↓↓↓↓
Sludge Volume Index (SVI) Increase in SVI ++ + ↓ 0 0 +
Capillary Suction Time (CST) Increase in CST 0 0 0 0 0 0 a The qualitative scale reflects the intensity of the effect for the IC50-shocked reactors and the indicated NH3 and pH shock level, in comparison to a negative control. The intensity scale ranges from ↓↓↓↓ (most intense process deterioration effect), 0 (no effect), and ++++ (most intense process improvement effect). X means inconclusive results. b For DNP, there was an inhibition of respiration for the first 2 days, followed by a stimulation of respiration after 2 days

3
treatment process that was negatively impacted by every contaminant tested was nitrification.
Furthermore, nitrification showed extremely long recovery times (Table 1.2). Together, this
suggested that nitrification is the most sensitive of the wastewater treatment processes tested.
The high sensitivity of nitrification to inhibition by chemical toxins has been found by others
(Daigger and Sadick, 1998; Blum and Speece, 1991; Hockenbury and Grady, 1977), but these
results present the first controlled test that examined nitrification inhibition relative to other
wastewater treatment plant processes.
Table 1.2 Nitrate generation rate (NGR) inhibition levels relative to the control for the first
sample collected after each toxin was added (6 hours after addition) and recovery times to control levels based on NGR and effluent nitrate.
NGR Percent Inhibition (7 Hours After Shocka) Low Concentrationb
(15% respiratory inhibition)
Mid Concentrationb
(25% respiratory inhibition)
High Concentrationb (50% respiratory
inhibition) Cadmium - - - CDNB 100 98 100 Cyanide 70 95 100 DNPc 18 (-25) 65 (-30) 42 (-40) Octanol 35 40 63 pHd 25 42 81
Time to Recovery (Days)
NGR Effluent NO3
- NGR Effluent NO3
- NGR Effluent NO3
- Cadmium - 2 - 6 - 11
CDNB 17 13 21 17 No Recovery 19
Cyanide 10 1 13 1 13 3 DNP 10 0 10 0 10 0
Octanol 4 No Recovery 4 No
Recovery No
Recovery No
Recovery pH 1 0 1 0 21 19
a Negative values indicate stimulation of NGR, positive values reflect decrease of NGR b Dash (-) indicates no data available c Values in parentheses indicate the maximum stimulation after recover from inhibition d For pH inhibition, low concentration = pH 5, mid concentration = pH 9, high concentration = pH 11
Given these results, we more closely examined the nitrification inhibition noted during
these experiments and found that the inhibition predicted using NGR was significantly higher
than what was predicted using respirometry. During the initial phase of the study, nitrification-
specific respiration was not examined, and we felt that the differences noted between the two

4
inhibition detection methods deserved further investigation. Furthermore, we observed that
maximum nitrification inhibition did not occur immediately after a chemical was added, but
rather several hours or days after it was added. Together, these suggested that the type of
inhibition detection method and the exposure time used for detecting inhibition is very important
in obtaining an accurate prediction of inhibition. If the method used to predict nitrification
inhibition or the contact time used during the test did not accurately predict the full extent of
inhibition, then operators using these methods could underestimate the extent of the effect and,
consequently, make poor decisions regarding the steps required to prevent or mediate
nitrification upset events. Therefore, we chose to investigate differences in nitrification
inhibition detection methods and the time-dependence of inhibition as the next phase of research.
The source-effect experiments also revealed that two contaminants showed very high
inhibition levels for nitrification relative to the other process parameters tested. These chemicals
were the oxidative/electrophilic chemical CDNB and the hydrophobic chemical 1-octanol.
CDNB showed the highest inhibition for nitrification and the longest recovery times (Table 1.2).
Octanol showed high levels of inhibition relative to other process effects, but also showed
relatively fast recovery times. We felt that the interesting results for nitrification inhibition
observed for these two chemicals deserved further investigation. After an extensive literature
review to determine possible causal mechanisms and stress responses for nitrification inhibition
caused by oxidative and hydrophobic chemical inhibition, experiments investigating a few
possible mechanisms were completed for each of these chemical classes.
1.3 Phase 2 Research: Inhibition Method Comparisons – Chapters 3 & 4
The source-effect experiments showed that respirometry and nitrate generation rate
(NGR) tests did not predict the same level of nitrification inhibition and that maximum inhibition
did not occur immediately. Given that the whole cell NGR method showed that tests lasting
hours to days might be needed to predict the degree of nitrification inhibition, we pondered
whether understanding and detecting the activation of stress mechanisms might provide a faster
means to obtain a warning of nitrification inhibition. After an extensive literature review
(presented in Chapter 2), the following hypothesis was developed:

5
Hypothesis: The severity of nitrification inhibition by industrial toxins that is predicted using inhibition detection methods is time-dependent. In addition, the most accurate methods that are used to detect nitrification inhibition are based on a direct measure of the nitrification rate.
In order to test this hypothesis, inhibition induced by CDNB, cadmium and chlorine
bleach was measured using a differential respirometric technique and NGR. In addition, time
dependence of the inhibition was examined by running both differential respirometry and NGR
tests over a long term experiment (48-72 hrs) using 4L sequencing batch reactors (SBRs). NGR
examines the rate of nitrate production and provides a direct measure of the nitrification rate.
Differential respirometry examines a nitrification-inhibited oxygen uptake rate, or OUR,
(conducted with nitrifier specific chemical inhibitors) relative to the total OUR to yield a
nitrification OUR. Although it does not directly measure a product of nitrification, this is
accepted as a measure of nitrification rate because the OUR of nitrifying bacteria
stoichiometrically relates to the rate of nitrate generation (Grady et al., 1999).
When performing these experiments, we found that current methods for analyzing nitrite
and conducting NGR tests were very time consuming. Therefore, we first set out to develop a
more rapid method for performing NGR. A method using ultraviolet spectrophotometry at
wavelengths between 225 and 240 nm without chemical manipulation was developed and
verified against ion chromatography. The method was shown to quickly and accurately measure
nitrate concentrations after correcting for nitrite interference. Additionally, cadmium, chlorine
and CDNB were tested for nitrification inhibition using this method. Cadmium presented no
interference with this method and CDNB was found to cause a correctable interference with the
test. Only chlorine provided an uncorrectable interference for this method; therefore, tests using
chlorine as an inhibitor relied upon time-consuming ion chromatography for measuring nitrate
from NGR assays.
The UV-based NGR method was used to test differences between NGR and differential
respirometry. The differential respirometry approach yield highly variable results versus NGR-
based inhibition measurements, which were much more stable. These results suggest that a
direct measure of nitrification, like NGR, provides a better measure of nitrification inhibition.
The unreliable measurements provided by differential respirometry may be partly explained by
reactions between the external nitrification inhibitor and the shock chemicals or components of
the mixed liquor matrix. Some commercially available devices used to measure nitrification

6
inhibition are based on differential respirometric techniques and these results indicate that such
devices may not accurately depict nitrification inhibition induced by chemical toxins.
Longer-term inhibition experiments showed that maximum nitrification inhibition did not
occur immediately for cadmium and CDNB. These chemicals are not quickly removed from the
wastewater stream and did not cause maximum inhibition until between 6 and 24 hours after the
chemical shock was applied. However, chlorine, a chemical that reacts and dissipates very
quickly, caused maximum inhibition almost immediately. These results suggest that inhibition is
only time dependent if the inhibitory chemical is not quickly removed from the wastewater
system and imply that measurement techniques should be performed over a longer time period to
determine maximum inhibition.
1.4 Phase 3 Research: Oxidative Stress Responses in Nitrifying Bacteria – Chapter 5
The objective of the next phase of research was to determine the reason why oxidative
chemicals like CDNB inhibited nitrification to such a significant extent. To do this, a thorough
literature review was conducted to determine both the inhibitory mechanisms of oxidative
chemicals and the stress response mechanisms bacteria have to combat oxidative stress
(presented in Chapter 1). Results of this survey showed that oxidative chemicals cause inhibition
in bacteria by damaging proteins and DNA (Ferguson et al., 1996; McLaggan et al., 2000).
Several oxidative stress response mechanisms were also found that appear to be highly
conserved in many different Gram-negative bacteria. Because the genome of the ammonia
oxidizing bacterium Nitrosomonas europaea was recently sequenced (Chain et al., 2003), we
were able to search the genome for the presence of these mechanisms (genes were present if
e≤0.001). The results of this search are shown in Table 1.3 below. Examining this table, it
appears that the genes encoding a majority of the protective enzymes are present in N. europaea,
even though the regulatory mechanisms are absent or different from those found in other
bacteria. The one mechanism that did not appear to contain the enzymes required for proper
function was the glutathione gated potassium efflux (GGKE) mechanism first described by Kroll
and Booth (1981). This mechanism induces cytoplasmic acidification which protects proteins
and DNA and activates other protective enzymes. It is thought to be highly conserved, as it was
found in several Gram-negative heterotrophic species(Booth et al., 1993). Taken together, this

7
information led us to develop the following hypothesis to explain why nitrifying bacteria appear
to be more sensitive to oxidative chemicals than other bacteria:
Hypothesis: Autotrophic nitrifying bacteria are more sensitive to shock loads of oxidative chemical toxins because they lack a potassium efflux mechanism to help protect against oxidative shock.
To address this hypothesis, we monitored nitrifying bacteria for potassium efflux in response to
the oxidative chemicals N-ethylmaleimide and chlorine bleach. We also examined if glutathione
is produced and oxidized in nitrifying bacteria exposed to electrophiles. Glutathione is a small
tripeptide molecule that is used to regulate the known GGKE mechanism. In addition,
glutathione itself works to help mediate oxidative chemical shock by acting as a sacrificial
nucleophile which gets oxidized, instead of allowing proteins and DNA to be damaged by
electrophilic stressors.
Experiments were performed using a nitrifying enrichment culture and pure cultures of
the ammonia oxidizing bacterium (AOB) N. europaea and the nitrite oxidizing bacterium (NOB)
Nitrospira moscoviensis. Pseudomonas aeruginosa, a heterotrophic bacterium with a sequenced
genome, was used as a positive control organism for all tests. For these experiments, soluble
potassium levels were monitored to observe increases associated with the GGKE mechanism, or
a surrogate potassium efflux mechanism. Results using the enrichment culture suggested that
nitrifiers did not efflux potassium in response to oxidative toxins. Because of this, further
studies were planned using pure cultures of nitrifying bacteria to address the hypothesis more
clearly. Results using the pure cultures of nitrifying bacteria suggest that neither N. europaea
nor Ni. moscoviensis efflux potassium in response to the oxidative chemical N-ethylmaleimide.
Both released potassium in response to the ionophore nigericin, which suggested that potassium
was present in the cells and could be release without lysing the cells. These results indicated that
nitrifying bacteria do not contain a GGKE mechanism or a surrogate potassium efflux
mechanism to respond to oxidative stressors, which helps to explain why nitrification is more
sensitive to oxidative chemical upset than other treatment processes. Furthermore, it presents the
first evidence for a Gram-negative bacterium that does not contain the GGKE mechanism.
These organisms may not contain a GGKE mechanism because the induced cytoplasmic
acidification would be detrimental to electron transport and energy generation in nitrifying
bacteria. In addition, it has been thought that GGKE originally evolved as a protection
mechanism for methyglyoxal, which is an oxidative byproduct of glucose metabolism (Ferguson

8
et al., 2000; Ferguson and Booth, 1998). N. europaea has historically been classified as an
obligate chemolithoautotroph that uses inorganic ammonia as its energy source and fixes carbon
dioxide as its carbon source. Recently, it was found to be a facultative chemolithoorganotroph
that can also use selected organic compounds, such as pyruvate and fructose but not glucose, as a
carbon source (Hommes et al., 2003). Consequently, it has been well established that N.
europaea does not metabolize glucose, which means it does not produce methylglyoxal and
would have no need to develop the GGKE response. Therefore, the GGKE mechanism may not
have evolved in, or was removed from nitrifying bacteria because it may interfere with the
metabolism of ammonia and nitrite.

9
Table 1.3 Summary of selected genes involved in oxidative stress response mechanisms and their presence in the N. europaea genome.
Gene Name Function Presence in N. europaea
Genes involved in the GGKE mechanism
gshB glutathione synthetase Yes gst glutathione S-transferase Yes
gorA glutathione oxidoreductase No kefB Glutathione regulated potassium efflux
system protein KefB Noa
kefC Glutathione regulated potassium efflux system protein KefC
Noa
dps DNA binding protein Dps No Genes involved in the oxyR system
oxyR oxyR system regulatory protein OxyR No katG hydroperoxidase/catalase Nob
aphCF alkyl hydroperoxide reductase Nob grxA glutaredoxin Nob trxC thioredoxin Nob oxyS regulatory RNA No
Genes involved in the soxRS system
soxR soxRS system regulatory protein SoxR No soxS soxRS system regulatory protein Soxs No sodA Manganese superoxide dismutase Nob tolC outer membrane efflux protein TolC Yesc
arcAB multidrug resistance efflux system arcAB Nod rpoS regulated oxidative stress response genes
rpoS sigma factor S No katE hydroperoxidase/catalase Nob nth endoonuclease No
sodC copper-zinc superoxide dismutase No xthA Exonuclease III Yesc topA topoisomerase I Nob
a pH adaptation potassium efflux system protein F and D found, but not glutathione regulated b homologous gene with unknown regulation mechanism found c BLAST search yielded protein with similar coding strand d arcAB not found but numerous multidrug efflux pumps located in genome
Concentrations of the total and oxidized forms of glutathione were also monitored to
determine the behavior of glutathione in response to varying concentrations of chlorine bleach.
These results showed that glutathione was oxidized in both N. europaea and P. aeruginosa, but

10
that the amount of glutathione oxidized per mg of chlorine added was less in N. europaea. This
may be due to the large membrane structures of nitrifying bacteria, which may prevent oxidative
chemicals from entering cells and reacting with glutathione quickly. Coupled with known
genomic information, the results of this study provide greater insight into why nitrification is one
of the most susceptible processes in biological wastewater treatment.
1.5 Phase 4 Research: Hydrophobic Stress Responses in Nitrifying Bacteria – Chapter 6
The objective of the final phase of the research was to examine why nitrification was
inhibited by the hydrophobic chemical 1-octanol, but recovered more quickly from the shock
event. After performing a review of the available literature (Chapter 1), we found that
hydrophobic chemicals cause inhibition mainly by interacting with the cell membrane of bacteria
(Sikkema et al., 1995). This has been found to affect the membrane fluidity (Sikkema et al.,
1994) and cause swelling of the membrane bilayer (Aono et al., 1994). The membrane swelling
and fluidity alterations have been associated with leakage of macromolecules and ions out of the
cells (Aono et al., 1994; Heipieper et al., 1991), which causes a disruption of the proton gradient
and membrane potential (Sikkema et al., 1994). Recovery from hydrophobic stress events has
been associated with several response mechanisms, and search of the N. europaea genome
revealed that genes coding for these enzymes exist (Table 1.4). As Table 1.4 shows, several
multidrug efflux systems exist in N. europaea to remove the toxins from the cells and
membranes. In addition, enzymes that modify the cell membrane to combat the fluidity changes
associated with hydrophobic shock were found. Given that several mechanisms were found, we
developed the following hypothesis:
Hypothesis: Hydrophobic organic chemicals are toxic to nitrifying organisms due to the insertion of these chemicals into the cell membranes, and recovery is mediated by altering the membrane structure.
To test this hypothesis, the research objective was to determine if the membrane fatty acid
content is altered in response to hydrophobic chemicals. This was used to both confirm insertion
of the chemicals into the membrane as well as confirm that nitrifiers contain stress mechanisms
to alter membrane fatty acid composition in response to changes in membrane fluidity induced
by hydrophobic chemicals.
Experiments were performed using pure cultures of the AOB N. europaea. P. aeruginosa
was used as a positive control organism for all tests. For these experiments, changes in the fatty

11
acid content of the cell membrane were measured in response to shock loads of 1-octanol. P.
aeruginosa showed an increase in the amount of saturated fatty acids and an increase in the
relative amounts of cis isomers to trans isomers of C18 unsaturated fatty acids. Results obtained
with N. europaeashowed that the cells modified the saturated-to-unsaturated fatty acid ratio in
response to the hydrophobic chemical 1-octanol, and the modification of this ratio corresponded
with recovery of the nitrite production rate, indicating that modifying the membrane may
contribute to recovery of the ammonia oxidizing capabilities of N. europaea. This agrees with
our hypothesis that membrane modifications occur in response to hydrophobic chemical shock
that allow for nitrification recovery, but the lack of any cis-to-trans ratio modifications
contradicts the genomic information that indicates this organism should be capable of modifying
the cis-to-trans ratio as a short-term stress response. Although this study provides evidence that
some membrane modification mechanisms exist, other stress response mechanisms may exist
and more research is needed in this area to determine exactly what mechanisms are activated in
the presence of hydrophobic contaminants.
Table 1.4 Summary of select genes involved in hydrophobic stress response mechanisms
and their presence in the N. europaea genome. Gene/Protein Name Function Presence in N. europaea
Membrane Modification Mechanisms β-ketoacyl-ACP
synthase II modification of membrane fatty acid
composition Probable Homolog Found
cti fatty acid cis-trans isomerase Probable Homolog Found Efflux Systems
AcrA-AcrB-TolC multidrug/solvent efflux system Probable Homologs Found AcrR acrAB system regulator No
MexA-MexB-OprM multidrug/solvent efflux system Probable Homologs Found MexC-MexD-OprJ multidrug/solvent efflux system Probable Homologs Found MexE-MexF-OprN multidrug/solvent efflux system Probable Homologs Found
MexR mex systems regulator No SrpA-SrpB-SrpC multidrug/solvent efflux system Probable Homologs Founda TtgA-TtgB-TtgC multidrug/solvent efflux system Probable Homologs Founda
MepA-MepB-MepC multidrug/solvent efflux system Unknownb MepR mepABC system regulator Unknownb
a Homologous SrpB sequence in N. europaea is the same sequence homologous to TtgB b mepABC and mepR could not be checked against N. europaea genome as gene sequences could not be located

12
1.6 References
Aono, R., Kobayashi, H., Joblin, K.N., and Horikoshi, K. (1994) Effects of organic solvents on growth of Escherichia coli K-12. Bioscience, Biotechnology and Biochemistry 58, 2009-2014.
Blum, D.J.W. and Speece, R.E. (1991) A database of chemical toxicity to environmental bacteria and its use in interspecies comparisons and correlations. Research Journal Water Pollution Control Federation 63 (3), 198-207.
Booth, I.R., Douglas, R.M., Ferguson, G.P., Lamb, A.J., Munro, A.W., and Ritchie, G.Y. (1993) K+ efflux systems. In: Bakker, E.P. (ed), Alkali Cation Transport Systems in Prokaryotes, pp. 291-309, CRC Press, Boca Raton, FL.
Chain, P., Lamerdin, J., Larimer, F., Regala, W., Lao, V., Land, M., Hauser, L., Hooper, A., Klotz, M., Norton, J., Sayavedra-Soto, L., Arciero, D., Hommes, N., Whittaker, M., and Arp, D. (2003) Complete Genome sequence of the ammonia-oxidizing bacterium and obligate chemolithoautotroph Nitrosomonas europaea. Journal of Bacteriology 185 (9), 2759-2773.
Daigger, G.T. and Sadick, T.E. (1998) Evaluation of methods to detect and control nitrification inhibition with specific application to incinerator flue-gas scrubber water. Water Environment Research 70 (7), 1248-1257.
Ferguson, G.P., Battista, J.R., Lee, A.T., and Booth, I.R. (2000) Protection of the DNA during the exposure of Escherichia coli cells to a toxic metabolite: the role of the KefB and KefC potassium channels. Molecular Microbiology 35 (1), 113-22.
Ferguson, G.P. and Booth, I.R. (1998) Importance of glutathione for growth and survival of Escherichia coli cells: detoxification of methylglyoxal and maintenance of intracellular K+. Journal of Bacteriology 180 (16), 4314-8.
Ferguson, G.P., Chacko, A.D., Lee, C.H., Booth, I.R., and Lee, C. (1996) The activity of the high-affinity K+ uptake system Kdp sensitizes cells of Escherichia coli to methylglyoxal. Journal of Bacteriology 178 (13), 3957-61.
Grady Jr., C.P.L., Daigger, G.T., and Lim, H.C. (1999) Biological Wastewater Treatment, Second Edition. Marcel Dekker, Inc., New York, NY.
Heipieper, H.J., Keweloh, H., and Rehm, H.J. (1991) Influence of phenols on growth and membrane permeability of free and imobilized Escherichia coli. Applied and Environmental Microbiology 57, 1213-1217.
Hockenbury, M.R. and Grady Jr., C.P.L. (1977) Inhibition of nitrification-effects of selected organic compounds. Journal Water Pollution Control Federation 49, 768-777.
Hommes, N.G., Sayavedra-Soto, L.A. and Arp, D.J. Chemolithoorganotrophic growth of Nitrosomonas europaea on fructose. Journal of Bacteriology 185 (23), 6809-6814.
Keener, W.K. and Arp, D.J. (1994) Transformations of aromatic-compounds by Nitrosomonas europaea. Applied and Environmental Microbiology 60 (6), 1914-1920.

13
Kroll R. G. and Booth, I.R. (1981) The role of potassium transport in the generation of a pH gradient in Escherichia coli. Biochemistry Journal 198, 691-698.
Love, N.G. and Bott, C.B. (2001) A review and needs survey of upset early warning devices. Water Environment Research Foundation. Alexandria, VA.
McLaggan, D., Rufino, H., Jaspars, M., and Booth, I. R. (2000) Glutathione-dependent conversion of N-ethylmaleimide to the maleamic acid by Escherichia coli: an intracellular detoxification process. Applied and Environmental Microbiology 66 (4), 1393-9.
Sikkema, J., de Bont, J.A., and Poolman, B. (1994) Interactions of cyclic hydrocarbons with biological membranes. Journal of Biology and Chemistry 269 (11), 8022-8028.
Sikkema, J., DeBont, J., and Poolman, B. (1995) Mechanism of membrane toxicity of hydrocarbons. Microbiological Reviews 59 (2), 201-222.

14
2 LITERATURE REVIEW ON FACTORS THAT INFLUENCE NITRIFICATION
INHIBITION IN ACTIVATED SLUDGE CULTURES
2.1 Nitrification Inhibition
2.1.1 Overview of Nitrification Inhibition
Ammonia toxicity to aquatic organisms has been well documented using both
invertebrate organisms like cladocerans (Sarma et al., 2003) and vertebrates like fish (Hillaby
and Randall, 1979; Wicks et al., 2002). Due to this toxicity, it is important to remove ammonia
or convert it to another form before discharging ammonia-containing wastewaters into rivers,
lakes and streams. To this end, numerous processes have been developed using both chemical
and biological methods of ammonia removal. Of these processes, the most common biological
process for ammonia removal is conventional aerobic nitrification, which involves the
conversion of ammonia to nitrate through biological oxidation. This conversion is accomplished
using two genera of bacteria, the ammonia oxidizing bacteria (AOB) that oxidize ammonia to
nitrite, and the nitrite oxidizing bacteria (NOB) that convert the nitrite produced by the AOB to
nitrate. Aerobic nitrification is used not only to convert ammonia to a less toxic form (nitrate)
before discharge, but it is also commonly used for total nitrogen removal at wastewater plants.
Nitrification is important in total nitrogen removal because many wastewater treatment facilities
that are required to remove total nitrogen must convert the ammonia to nitrate during nitrification
before the nitrate can be converted to gaseous nitrogen during the anoxic process of
denitrification. As regulations governing ammonia and total nitrogen discharge into receiving
waters become more strict, the extent to which nitrification is utilized will grow. Thus, it
becomes very clear that aerobic nitrification remains a very important process in conventional
wastewater treatment.
In an ideal world, nitrification of wastewaters would occur without any difficulties under
a variety of operational conditions. Unfortunately, this is not the case and nitrification can be
disrupted, or “upset” very easily. These upset events can be caused by operational and design
problems or induced by shock loads of a variety of industrial chemical toxins. In fact, the
process of nitrification has been found to be more sensitive to such upset events than processes
such as BOD removal. In a study performed by Blum and Speece (1991), the inhibition of
ammonia oxidation by Nitrosomonas europaea, a common ammonia oxidizing bacterium, was
15
examined with relation to the respiration inhibition of activated sludge aerobic heterotrophs.
During the study, they found that the concentration causing 50% inhibition of ammonia
oxidation was substantially lower than the concentration causing 50% inhibition of respiration in
the heterotrophs for nearly all of the chemicals tested. In fact, of 67 chemicals tested, only 7
were found to have similar or lower impact on the nitrifying organism than the heterotrophs. In a
similar study performed by Wood et al. (1981), a comparison was made between the nitrification
efficiency and BOD removal efficiency of an activated sludge exposed to different chemical
toxins. Their results were in agreement with those found by Blum and Speece in that many
compounds appeared to be less toxic to carbonaceous BOD removal (performed by heterotrophic
bacteria) than to ammonia oxidation and nitrate production. In addition to results found by
others, studies performed in our laboratory have also found the nitrification process to be
especially susceptible to inhibition when compared with other processes like COD removal,
respiration and effluent suspended solids removal (Love et al., 2002a; Love et al., 2002b; Love et
al., 2003). Table 2.1 summarizes the effects from six different chemicals tested in our lab on
different wastewater treatment processes. The scale presented is pseudo-quantitative and based
on the relative impact of each process effect and comparisons of impact between contaminants.

16
Table 2.1 Summary of process effects for nitrifying biomass exposed to five chemical toxins using a pseudo-quantitative scale1.
Measurement
Observed Problematic
Process Effect Relative to
Control
Cadmium CDNB Cyanide DNP Octanol pH 11
Effluent Total Suspended
Solids (TSS)/Volatile Suspended
Solids(VSS)
Increase in effluent TSS/VSS
↓↓↓↓ ↓↓↓ 0 ↓↓ + ↓↓↓↓
Effluent Chemical Oxygen Demand
(COD)
Decrease in COD removal
↓↓↓↓ ↓↓↓ ↓ ↓↓ + ↓↓↓↓
Specific Oxygen Uptake Rate (SOUR)
Decrease in SOUR
↓↓↓↓ ↓↓↓ ↓↓ ↓↓/+
+b ↓↓ ↓↓↓
Soluble Potassium Increase in
soluble K+ concentration
↓↓ ↓↓↓ 0 0 0 X
Inorganic Nitrogen effluent concentrations and Nitrate Generation
Rate (NGR)
Nitrification inhibition
↓↓ ↓↓↓ ↓↓↓ ↓↓ ↓↓ ↓↓↓↓
Sludge Volume Index (SVI) Increase in SVI ++ + ↓ 0 0 +
Capillary Suction Time (CST) Increase in CST 0 0 0 0 0 0
a The qualitative scale reflects the intensity of the effect for the IC50-shocked reactors and the indicated NH3 and pH shock level, in comparison to a negative control. The intensity scale ranges from ↓↓↓↓ (most intense process deterioration effect), 0 (no effect), and ++++ (most intense process improvement effect). X means inconclusive results. b For DNP, there was an inhibition of respiration for the first 2 days, followed by a stimulation of respiration after 2 days. 2.1.2 Methods Used to Detect Nitrification Inhibition
Detecting nitrification inhibition is important for identifying and preventing nitrification
upset from occurring. Several methods exist for determining nitrification inhibition in activated
sludge treatment systems by comparing nitrification rates. One of the most common of the rate
detection methods is respirometry (Ren, 2004). Respirometry is a rapid test (often < 20 minutes)
and is accepted as a measure of nitrification rate because the oxygen uptake rate (OUR) of
nitrifying bacteria stoichiometrically relates to the rate of nitrate generation (White, 2000; Grady
et al., 1999). Unfortunately, it measures the total oxygen uptake rate of all biomass, not just the
17
nitrifiers. To determine the OUR of only the nitrifiers in mixed liquor, two different techniques
have been applied. The first technique involves aerating the biomass for several hours without
any substrate so that the biomass is in an endogenous state. The OUR of the total endogenous
biomass is measured and compared with the OUR of biomass to which ammonia was added so
that only the nitrifying bacteria are respiring above the endogenous state. The difference
between these rates gives the OUR of the nitrifying bacteria, which provides a surrogate measure
of the rate of nitrification (Hu et al., 2003a; Hu et al., 2003b; Chandran and Smets, 2000).
The other respirometric technique commonly employed uses selective inhibitors of
nitrification to determine the OUR of the nitrifying bacteria. This technique, referred to as
differential respirometry, can be used on actively growing biomass because it does not require
the endogenous OUR. In this technique, the OUR of the total biomass is measured and
compared to the OUR of a biomass in which a chemical inhibitor specific to nitrification was
added so that only the nitrifying bacteria are not respiring. The nitrification OUR is determined
by subtracting the nitrification-inhibited OUR from the total OUR (Ginestet et al., 1998,
Chandran and Smets, 2000). The nitrification specific inhibitor used in differential
respirometry is typically either allylthiourea or 2-chloro-6-(trichloromethyl)pyridine (APHA,
1998; Benes et al., 2002; Reuschenbach et al., 2003).
Another method that is used to determine nitrification rates for inhibition determination is
a base titration method. This test is also very rapid and similar to respirometric tests, the validity
of this method is based on the stoichiometric relationship between the acid produced and nitrate
generated during the nitrification process (White, 2000; Grady et al., 1999). During this test, a
known concentration of a strong base is used to maintain a constant pH within the biomass over
the time period of the test. By monitoring the exact rate of base addition, the nitrification rate
can be determined from stoichiometry (Ficara and Rozzi, 2001).
The last method for measuring nitrification rates is the nitrate generation rate (NGR) test.
During this test, nitrate production is measured over time and the rate of nitrate production gives
the rate of nitrification. Unlike respirometric or titrimetric techniques, NGR detects a unique
product of nitrification and, therefore, provides a direct measure of the nitrification rate.
Although it does not require addition of any chemicals like differential respirometry or base
titration, it does generally take longer to perform than either of these methods because

18
measurements of nitrate are not able to be made continuously (Grunditz and Dalhammar, 2001;
Hooper and Terry, 1973; Lee et al., 1997).
2.1.3 Influence of Operational Practices on Nitrification
From an operational standpoint, nitrification has been found to be very unstable at low
solids retention times (SRT). This effect was described by Poduska and Andrews (1974), who
noted that the percent nitrification of wastewaters occurring at activated sludge plants increased
with increasing SRT. This increase was very drastic, going from almost no nitrification to nearly
100% nitrification over an SRT range of less than one day. These results suggest that a
minimum retention time is required for stable nitrification to occur. Results observed by
McClintock et al. (1993) also support this idea. In their study, the removal of ammonia nitrogen
increased with increasing SRT for a given temperature. In addition, McClintock also examined
changes in the rate of nitrification with changes in SRT and found that the rate of nitrification
was faster at shorter SRTs than longer SRTs, but incomplete nitrification still occurred.
Together, these results suggest that the instability of nitrification at short SRTs values is
not due to inhibition, but rather is likely due to the slow growth of the autotrophic nitrifying
bacteria. At short SRTs, nitrifying organisms would be washed out of a system because they are
growing too slowly to multiply and remain within the system. The washout was confirmed by
Abeysinghe and coworkers when they studied the effects of bioaugmentation on nitrifying
systems at short SRT values (Abeysinghe et al., 2002). During this study, the authors showed
that nitrification did not occur at a 2 day SRT but could be operated if nitrifying bacteria were
added to the wastewater. After a one-time addition of the organisms, it was noted that ammonia
oxidation to nitrate decreased with time and an analysis of the population of nitrifying organisms
showed a concurrent decrease, suggesting washout was responsible for the loss of nitrification.
Overall, this suggests that washout of nitrifying organisms at short SRT is the reason for the
observed loss of nitrification.
Loss of nitrification due to washout of the biomass can occur through mechanisms other
than short SRT. For instance, the growth rate of nitrifying organisms is known to be affected by
temperature (Abeysinghe et al., 2002; Grady et al., 1999; Hooper and Terry, 1973; McClintock
et al.,1993). The effect of temperature on the rate of nitrification was evaluated by measuring
the ammonia nitrogen remaining in various bioreactors using the same biomass but exposed to
19
different temperatures, ranging from 25ºC to 10ºC. Results observed by Hooper and Terry
(1973) and McClintock et al. (1993) show that lower temperatures yield a reduced nitrification
efficiency. A study performed by Neufeld et al. (1986) found the same reduced efficiency for
temperatures lower than 15ºC, but also found that temperatures above 30ºC also decreased the
rate of oxidation and efficiency of nitrification. Abeysinghe and coworkers (2002) used the
information gained about decreased rates of nitrification due to temperature and evaluated the
washout of nitrifying bacteria at low temperatures during bioaugmentation. During their study, a
5 day SRT reactor was operated at 22ºC and full nitrification occurred. However, when the
reactor temperature was dropped to 4ºC, it was noted that nitrification did not occur to any great
extent. Upon direct addition of nitrifying organisms, ammonia oxidation began to occur but
could not be maintained without constant addition of new organisms. To test if this was due to
washout, the concentration of nitrifying organisms was monitored after a one-time addition to the
low temperature reactor. Immediately, the nitrifier population began to decrease, which
coincided with the observed reduced nitrification efficiency. Together, their data suggest that the
loss of nitrification at low temperatures is due to a depressed growth rate in the nitrifying
organisms that results in their washout from the reactor. This is supported by results presented
by Grady et al. (1999) and McClintock et al. (1993), where increasing the SRT of low
temperature inhibited nitrifying reactors can increase the nitrification efficiency by increasing the
detainment of nitrifying bacteria. Thus, it appears that a major mechanism for loss of
nitrification may be due to the washout of nitrifying organisms, which could not only be due to a
decreased retention time for the biomass, but also due to inhibition of growth that can be caused
by a number of sources, including temperature deviations and inhibition by chemical toxins.
2.1.4 Influence of Chemicals on Nitrification
Much of the research on nitrification inhibition by chemical toxins has been focused on
identifying which chemicals affect the nitrification process. Several comprehensive studies on
the impact of chemicals on nitrification inhibition have been performed. Possibly the earliest
and most extensive study was performed by Tomlinson and coworkers (1966) who found that
nitrification in activated sludge is adversely affected by a very wide range of industrial chemicals
from cyanides and azides to sulfur compounds, phenolic compounds, alcohols, heavy metals,
metal binding agents and antibiotic drugs like hydroxyquinoline and streptomycin. Since then,
20
several other studies have been performed, including the study by Blum and Speece (1991) that
compared organism sensitivities. During their study, they found that ammonia oxidizing bacteria
are adversely affected by many organic hydrophobic chemical compounds, including aromatics
like xylene and toluene, chlorinated aromatics, alcohols like octanol, many respiratory
uncouplers, many aliphatic and halogenated aliphatics, ethers, ketones and nitrile compounds.
Hooper and Terry (1973) also performed an extensive study confirming much of what was
previously known about inhibition of ammonia oxidizing bacteria by metal binding compounds,
respiratory uncouplers and alcohols, but they also found that many enzyme and heme-protein
binding compounds also inhibited pure cultures of ammonia oxidizing bacteria. A more detailed
description of some of the more come commonly studied inhibitors of nitrifying bacteria follows.
Cyanide is one of the more often studied chemical inhibitors of nitrification. Cyanide can
be widely present in wastewaters due to its use in metal-plating and its presence in flue-scrubber
gas wash waters. The presence of even small amounts of cyanide has been found to be
extremely detrimental to the nitrification process, with concentrations of free cyanide (HCN or
CN-) as low as 0.1 mg/L inhibiting nitrification in activated sludge (Neufeld et al., 1986).
Neufeld et al. (1986) also showed that metal-cyanide complexes and thiocyanates were toxic, but
to a much lesser extent. The influence of cyanide on activated sludge has not only been studied
on laboratory-scale activated sludge and enrichment culture systems (Gaudy et al., 1982;
Gernaey et al., 1997; Ludzack and Schaffer, 1962; Neufeld et al., 1986; Tomlinson et al., 1966),
but also at full-scale treatment facilities (Daigger and Sadick, 1998).
Heavy metals are another group of widely studied and important nitrification inhibitors .
Heavy metals like cadmium, chromium, copper, lead, mercury and zinc are widely used in
industry and commonly end up in wastewater streams. Because heavy metals are prevalent in
wastewater, numerous studies have been performed to examine the effects of heavy metals on
activated sludge (Braam and Klapwijk, 1981; Gernaey et al., 1997; Lee et al., 1997) and pure
cultures (Sato et al., 1988; Tomlinson et al., 1966). In all cases, heavy metals were been found to
be toxic to nitrification, but to varying degrees.
Copper is known to be inhibitory to nitrification (Gernaey et al., 1997; Braam and
Klapwijk, 1981; Tomlinson et al., 1966). However, the results reported by Tomlinson et al. for
copper yield interesting results, as low concentrations were found to stimulate nitrification in
pure cultures of AOB. Copper has also been found to increase the ammonia oxidizing activity of

21
cell-free extracts of AOB (Ensign et al., 1993; Juliette et al., 1995). Because of these studies, it
has been hypothesized that an essential enzyme (ammonia monooxygenase) used in ammonia
oxidation contains a copper active site (Bedard and Knowles, 1989). (The enzymatic pathways
for both ammonia oxidation and nitrite oxidation are described in sections 2.2.1 and 2.2.2,
respectively) This has been supported by data showing the extreme sensitivity of nitrification to
metal binding compounds like allylthiourea (Hooper and Terry, 1973; Tomlinson et al., 1966).
These metal binding compounds seem to only selectively inhibit the ammonia oxidizing bacteria
and not the NOBs or heterotrophic bacteria, as reported by Ginestet et al. (1998).
Many organic metal chelating compounds that are found to be inhibitory to nitrification
contain sulfur groups (Hockenbury and Grady, 1977). Not only are metal chelating sulfur
compounds inhibitory, but a wide range of these chemicals have been found to be toxic to
nitrifiers (Hockenbury and Grady, 1977; Hooper and Terry, 1973; Tomlinson et al., 1966).
Juliette and coworkers (1993) found that thioethers were inhibitory to AOBs because they acted
as a competitive substrate and are broken down to sulfoxides. In addition, even the sulfur
containing amino acids cysteine and methionine have been found to inhibit nitrification
(Apontoweil and Berends, 1975; Ferguson et al., 1995; Wagner and Loy, 2002). Together, these
results show the extreme toxicity of sulfur containing compounds to nitrification, and AOB in
particular.
Upon further examination of the different chemical upsets that occur, it appears that
solution pH plays a very important role in the stability of nitrification, as pH extremes can be
inhibitory to the bacteria that carry out this process. It has been reported that AOB grow
optimally between pH 5.8 and 8.5, while NOB grow best from pH 6.5 to 8.5 (Princic et al.,
1998). Princic and coworkers also found that nitrification was inhibited at pH values below 5.8
for a nitrifying mixed culture enriched from activated sludge. However, when examining pH
effects on nitrifying organisms it is important to remember the speciation of ammonia and nitrite,
the two substrates used for energy production in AOB and NOB. It had previously been known
that ammonia and nitrite were actually toxic to the organisms that utilize and produce them. In a
revolutionary study by Anthonisen and coworkers (Anthonisen et al., 1976), it was determined
that inhibition was due to free ammonia (NH3) and nitrous acid (HNO2) rather than ammonium
(NH4+) or nitrite (NO2
-). The speciation of these, and therefore the toxicity of each, is dependent
upon pH and concentration, where significant portions of the total nitrite is in the form of nitrous

22
acid at low pH values and a significant percentage of the total ammonia is in the free ammonia
form at high pH values. In addition, Anthonisen et al. found that AOB were less sensitive to free
ammonia than the NOB, but no significant difference was noted between the organisms for
nitrite inhibition. Thus, when pH is considered as an inhibiting agent of nitrification, it is
important to consider the effects of speciation on other chemicals in the solution.
Research done in our laboratory also examined the effects of selected chemicals on
nitrification in activated sludge (Kelly et al., 2004). For our experiments, six different chemicals
were tested from six different chemicals classes (defined by their toxic mode of action) in order
to determine which chemical classes may inhibit nitrification and to what extent. The chemical
classes (and the representative chemical studied from that class) used in these experiments were:
heavy metal (cadmium), cyanide, pH (pH 11), electrophile/oxidative chemical (1-chloro 2,4-
dinitrobenzene/CDNB), organic respiratory uncoupler (2,4-dinitrobenzene/DNP) and a
hydrophobic organic chemical (octanol). During our study, a one-time shock of the chemical
was added to sequencing batch reactors containing a nitrifying activated sludge, and both nitrate
generation rates (NGRs) and effluent nitrogen species were monitored over time. In addition,
time to full recovery of nitrification was determined during this experiment. The results of this
study are summarized on Table 2.2 and reflect the impact of low, mid and high concentrations of
each chemical (i.e., concentrations that caused 15, 25 and 50% respiratory inhibition in activated
sludge, respectively) on both NGR and the time to recover from nitrification inhibition.
When examining this data in conjunction with the data presented in Table 2.1 above, two
things become very apparent. First, every chemical we tested impacted nitrification to some
extent, which is consistent with the sensitivity of nitrification and nitrifying bacteria found by
others. Second, the inhibition caused by each chemical and the time to it took to recover from
that inhibition varied substantially with the type and class of chemical tested. From this data, it
appears that the most severe inhibition and longest recovery times for nitrification was due to the
electrophilic chemical CDNB. Very little is known about these chemicals as far as their impact
on nitrification as few detailed studies have targeted them. To date, no literature has been found
that has specifically examined the effects of CDNB on nitrifying biomasses, making CDNB and
other electrophiles prime candidates for further study.
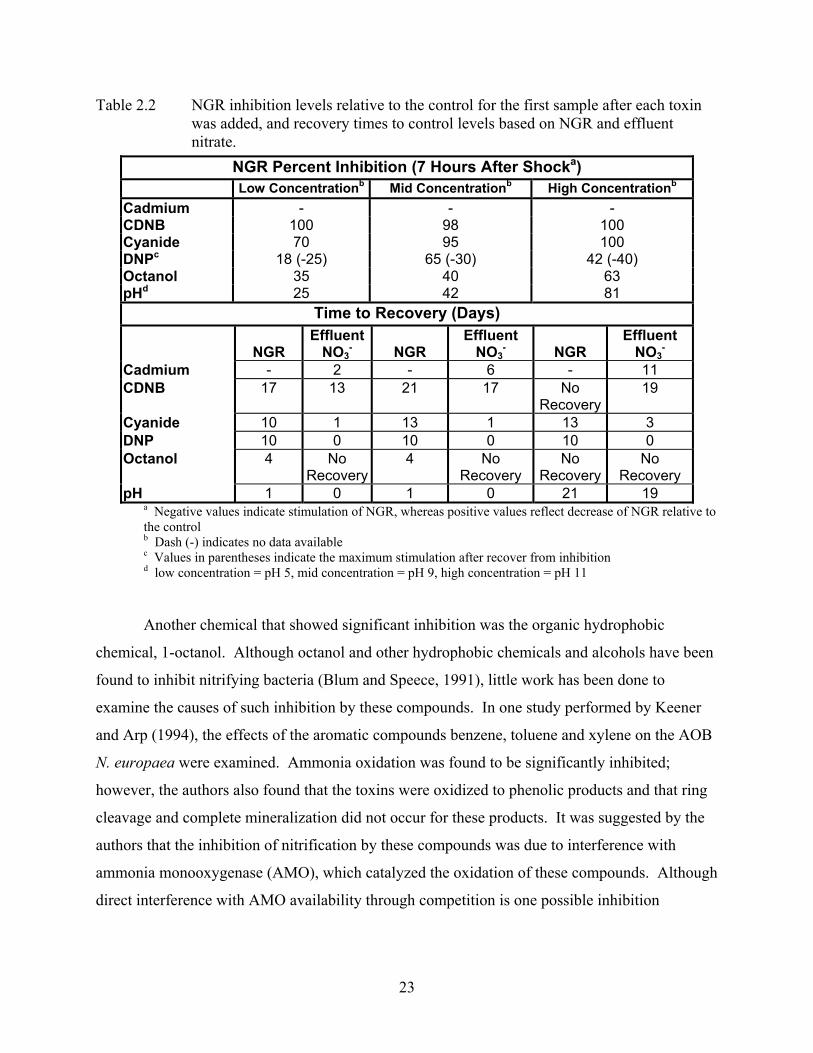
23
Table 2.2 NGR inhibition levels relative to the control for the first sample after each toxin was added, and recovery times to control levels based on NGR and effluent nitrate.
a Negative values indicate stimulation of NGR, whereas positive values reflect decrease of NGR relative to the control b Dash (-) indicates no data available c Values in parentheses indicate the maximum stimulation after recover from inhibition d low concentration = pH 5, mid concentration = pH 9, high concentration = pH 11
Another chemical that showed significant inhibition was the organic hydrophobic
chemical, 1-octanol. Although octanol and other hydrophobic chemicals and alcohols have been
found to inhibit nitrifying bacteria (Blum and Speece, 1991), little work has been done to
examine the causes of such inhibition by these compounds. In one study performed by Keener
and Arp (1994), the effects of the aromatic compounds benzene, toluene and xylene on the AOB
N. europaea were examined. Ammonia oxidation was found to be significantly inhibited;
however, the authors also found that the toxins were oxidized to phenolic products and that ring
cleavage and complete mineralization did not occur for these products. It was suggested by the
authors that the inhibition of nitrification by these compounds was due to interference with
ammonia monooxygenase (AMO), which catalyzed the oxidation of these compounds. Although
direct interference with AMO availability through competition is one possible inhibition
NGR Percent Inhibition (7 Hours After Shocka) Low Concentrationb Mid Concentrationb High Concentrationb
Cadmium - - - CDNB 100 98 100 Cyanide 70 95 100 DNPc 18 (-25) 65 (-30) 42 (-40) Octanol 35 40 63 pHd 25 42 81
Time to Recovery (Days)
NGR Effluent
NO3-
NGR
Effluent NO3
-
NGR Effluent
NO3-
Cadmium - 2 - 6 - 11 CDNB 17 13 21 17 No
Recovery 19
Cyanide 10 1 13 1 13 3 DNP 10 0 10 0 10 0 Octanol 4 No
Recovery4 No
Recovery No
Recovery No
Recovery pH 1 0 1 0 21 19
24
mechanism for hydrophobic organic contaminants, there may be other causes of inhibition that
have not yet been investigated.
AMO is just one enzyme involved in the ammonia oxidation pathway. The other major
enzyme, described in more detail below, is hydroxylamine oxidoreductase (HAO). Several
studies have been performed to investigate the differential inhibition of these two molecules.
The general consensus of those studies is that, for a given chemical inhibitor, AMO is the more
sensitive enzyme (Hooper and Terry, 1973; Tomlinson et al., 1966). These conclusions were
drawn through experiments where hydroxylamine was added to ammonia oxidizing cultures.
Hydroxylamine is the product of AMO-controlled ammonia oxidation and the substrate used by
HAO to produce nitrite. Upon addition of hydroxylamine with a toxicant, the authors found that
the rate of nitrite formation increased when compared to addition of the toxicant alone,
suggesting that AMO was the more sensitive enzyme in the ammonia oxidation pathway. Thus,
it is most likely that any chemical causing inactivation/inhibition of the enzymes in the ammonia
oxidation pathway would be directed against AMO and not due to inhibition of HAO. For NOB,
one major enzyme controls the oxidation of nitrite to nitrate, and therefore differential inhibition
of the enzymes in the pathway is not an issue.
From the vast amount of information available regarding nitrification inhibition, it is
clear that nitrification is a biological process that is very sensitive to upset from a wide variety of
sources, both physical and chemical. Due to the importance of the nitrification process to
wastewater treatment and the increased sensitivity of autotrophic nitrifying bacteria to toxic
shock loads of chemical contaminants, it becomes important to study the effects of chemical
toxins on the nitrification process, and extensive screening studies have occurred that examine
which chemicals cause nitrification. However, to date very few studies have been performed that
examine the molecular level stress responses elicited by nitrifying bacteria in response to toxic
chemicals. One objective of this study will be to conduct an initial evaluation of the role that
stress response mechanisms in nitrifying bacteria play to counteract the adverse effects of
oxidative chemicals and organic hydrophobic chemicals.
2.2 Cell Biology and Energy Production in Nitrifying Bacteria
In order to understand more exact mechanisms of inhibition in nitrifying bacteria, it is
important to understand their physiology. As discussed previously, the process of aerobic
nitrification is carried out by the AOB and NOB, which encompass two distinct classes of

25
bacteria. With very few exceptions, both AOB and NOB are obligate autotrophic bacteria
(Matin, 1978). This means that they require inorganic carbon (CO2) as the major carbon source.
Though many strains can assimilate some organic carbon, this amount is very small when
compared with inorganic carbon utilization (Matin, 1978). Carbon assimilation is a very energy
demanding process, with an estimated 80% of the energy produced by an autotroph going to
carbon fixation (Forrest and Walker, 1971; Kelly, 1978). Because of the high energy demand for
carbon fixation, the very slow growth rates observed for both genera of nitrifying bacteria are
due to their autotrophic mode of life (Wood, 1986).
2.2.1 Ammonia Oxidizing Bacteria
AOBs are all Gram-negative members of the β and γ subdivisions of proteobacteria
(Hooper et al., 1997). These organisms are autotrophic, with carbon dioxide as the main carbon
source. They use ammonia via aerobic oxidation as their main source of energy. Five major
genera of AOB have been identified. The first genus to be described was Nitrosomonas by
Sergej Winogradsky (1892). These bacteria, of which N. europaea was the first discovered and
most studied, are rod-shaped, motile bacteria with very large intracytoplasmic membranes that
are arranged around the edges of the bacteria. The Nitrosococcus were first described by
Winogradsky (1892) and further investigated by Watson (1965). These bacteria are cocci in
shape, motile and also have very large intracytoplasmic membrane areas. The Nitrosolobus, first
described by Watson and coworkers (Watson et al., 1971), are irregular in shape, motile and
partially compartmentalized by invaginations of the plasma membrane and other segments of the
cell envelope. The last two genera lack the extensive intracytoplasmic membranes observed in
the other members of the AOB. The Nitrosovibrio are motile, curved rods (Harms et al., 1976)
and the genus Nitrosospira are tightly wound, motile spirochetes (Winogradsky and
Winogradsky, 1933).
The sole source of energy for AOB comes through the aerobic oxidation of ammonia to
nitrite. Although several different genera of AOB exist, the major components of energy
generation and the electron transport chain appear to be conserved (Bock et al., 1986). In the
first step of the process, ammonia (NH3) is oxidized to hydroxylamine (NH2OH) and water using
oxygen. This reaction is catalyzed by the inner membrane-bound enzyme ammonia
monooxygenase (AMO) and requires two electrons (Andersson and Hooper, 1983; Hollocher et

26
al., 1981; Hooper et al., 1997). AMO is a multimeric protein containing two distinct subunits
(Hooper et al., 1997) and possibly containing copper (Bedard and Knowles, 1989; Ensign et al.,
1993) and iron (Keener and Arp, 1994; Zahn et al., 1996) at the active site.
After the hydroxylamine is produced from the reaction of ammonia with oxygen, it is
converted to nitric acid (HNO2) and 4 protons (H+) by the periplasmic enzyme hydroxylamine
oxidoreductase (HAO) (Wood, 1986). HAO is a monomeric protein and contains 8 heme-
binding peptide sequences (Sayavedra-Soto et al., 1994). During this oxidation of
hydroxylamine to nitric acid, 4 electrons are released and transferred to cytochrome 554 (cyt554)
(Arciero et al., 1991). From here, 2 electrons are passed to a ubiquinone (UQ) where they can be
used to maintain the operation of AMO or catalyze the formation of reduced compounds, like
NADH (Hooper et al., 1997; White, 2000). The remaining two electrons will pass through
cyctochrome c-552 (cyt552) to a cytochrome aa3 oxidase, which will transfer the electrons to the
terminal electron acceptor oxygen and use the energy to maintain the proton gradient across the
inner membrane (DiSpirito et al., 1986). The energy of the proton gradient can then be used by
an ATPase to produce ATP, which is the major energy storage molecule of all cells. This entire
process is shown schematically in Figure 2.1. From this schematic, it can be seen that the
oxygen requirements of ammonia oxidizing bacteria are very high due to the need of oxygen
both as the terminal electron acceptor in the electron transport chain, and as an electron acceptor
during the AMO catalyzed conversion of ammonia to hydroxylamine.

27
Periplasm
Cytoplasm
AMO
HAO
NH3 + O2 + 2H+ H2O + NH2OH
H2O + NH2OH
HNO2 + 4H+
cyt554cyt552
UQ
4e-
2e-
1/2 O2 + 2H+ H2O
2H+
2H+
2e-
cyt. aa3oxidase
Periplasm
Cytoplasm
AMO
HAO
NH3 + O2 + 2H+ H2O + NH2OH
H2O + NH2OH
HNO2 + 4H+
cyt554cyt552
UQ
4e-
2e-
1/2 O2 + 2H+ H2O
2H+
2H+
2e-
cyt. aa3oxidase AMO
HAO
NH3 + O2 + 2H+ H2O + NH2OH
H2O + NH2OH
HNO2 + 4H+
cyt554cyt552
UQ
4e-
2e-
1/2 O2 + 2H+ H2O
2H+
2H+
2e-
cyt. aa3oxidase
Figure 2.1 Components of the ammonia oxidation system and electron transport in N.
europaea. Figure adapted from White (2000).
2.2.2 Nitrite Oxidizing Bacteria
Some of the NOB are closely related to the AOB. Many NOB are members of the α, δ
and γ subdivisions of proteobacteria; however, a distantly related phylum of NOB known as
Nitrospira were identified more recently (Burrell et al.,1998). NOB are autotrophic, like the
AOB, and derive their energy from the aerobic oxidation of nitrite to nitrate.
There have been four genera of NOB described to date. The first isolated and best
described is Nitrobacter winogradsky (Winogradsky, 1892). These organisms are motile and
have been found to be pleomorphic, meaning that they can be found as rods, cocci or pear-
shaped. As with many of the AOB, Nitrobacter have large intracytoplasmic membranes. The
second genus is Nitrococcus, first described by Watson and Waterbury (Watson and Waterbury,
1971). They are coccoid shaped, motile cells with large intracytoplasmic membranes that live in
marine environments. In the same paper, Watson and Waterbury first describe the third genus of
nitrite oxidizers, Nitrospina. These organisms also grow in marine environments but are rod-
shaped and do not have extensive intracytoplasmic membranes. The last and most recently

28
discovered genus is Nitrospira (Watson et al., 1986). These organisms are tightly or loosely
wound spirochetes with a very wide periplasmic space and no intracytoplasmic membranes.
NOB convert nitrite to nitrate and, as with the ammonia oxidizing bacteria, it appears that
the oxidizing systems are conserved across the different genera. The conversion of nitrite to
nitrate is catalyzed by a membrane bound enzyme known as nitrite oxidoreductase (NOR)
(Wood, 1986), as shown schematically in Figure 2.2 (O'Kelly et al., 1970; Sundermeyer-Klinger
et al., 1984; Tanaka et al., 1983). Like AMO, NOR is a multimeric protein with two subunits
and is known to have redox centers (active sites) of molybdenum, copper, manganese and an
iron-sulfur (Meincke et al., 1992). During this process, two electrons are released and transferred
to a cytochrome c (cyt. c) (Sundermeyer-Klinger et al., 1984). It is suspected that the transfer
from NOR to the cytochrome is driven by the membrane potential (Nicholls and Ferguson,
1992). Once at the cytochome c, the electrons can then be transferred for use in production of
reduced compounds like NADH or shifted to a cytochrome aa3 oxidase (Wood, 1986). Here, as
with most aerobic bacteria, the cytochrome aa3 oxidase transfers the two electrons to oxygen, the
terminal electron acceptor, and uses the energy gained to maintain a proton gradient across the
inner membrane. Again, it is this proton gradient that provides most of the energy to the cell.
NO2- + H2O
cyt. c
2e-
1/2 O2 + 2H+ H2O
2H+
2H+
2e-
NO3- + 2H+
To NADH production
cyt. aa3oxidase NOR
NO2- + H2O
cyt. c
2e-
1/2 O2 + 2H+ H2O
2H+
2H+
2e-
NO3- + 2H+
To NADH production
cyt. aa3oxidase NOR
Figure 2.2 Components of the nitrite oxidation system electron transport in Nitrobacter.
Figure adapted from White (2000).

29
2.3 Oxidative Chemical Inhibition
As stated previously, results found in our lab showed that the most severe inhibition of
nitrification was due to the uncharged organic oxidative/electrophilic chemical 1-chloro-2,4-
dinitrobenzene (CDNB). A discussion of the toxic nature of CDNB and other oxidative
chemicals is given below. In addition, known stress response mechanisms for oxidative
chemical inhibition and possible reasons for the increased susceptibility of nitrifying organisms
are discussed.
2.3.1 Toxic Modes of Action
Electrophilic chemicals act as oxidizing agents by accepting electrons from other
compounds and are commonly used in industrial manufacturing processes. Despite the apparent
widespread use of uncharged organic electrophilic chemicals in industry, very few studies have
been performed that look at its effects on activated sludge bacteria. Instead, most studies on the
effects of electrophiles on bacteria have been performed using pure cultures of Gram-negative
bacteria like Escherichia coli. Although E. coli is not a prevalent organism in activated sludge
cultures, it is Gram-negative and most organisms that have been phylogenetically characterized
in activated sludge systems (including nitrifiers) are Gram-negative (Wagner and Loy, 2002).
Therefore, it is expected that chemical effects observed from pure cultures of these bacteria can
be used to draw inferences regarding the effects of electrophiles on activated sludge bacteria.
Through studies with pure cultures, several mechanisms of action have been associated
with oxidative/electrophilic chemicals. One of the two major modes of action is damage to
deoxyribonucleic acid (DNA) (Ferguson et al., 1996; Ferguson et al., 1995). More specifically,
it has been found that the uncharged electrophile methylglyoxal reacts in vitro with the
nucleotide bases guanine, adenine and cytosine (Papoulis et al., 1995). The effect of
electrophiles on DNA was elucidated by Summer and Göggelmann (1980) and Gupta and
coworkers (1997), who showed that CDNB and homologous compounds were mutagenic to the
Gram-negative organism Salmonella typhimurium. Furthermore, they showed that the degree of
mutagenicity increased with increased electronegativity (or increasing degree of electrophilicity)
of the halogen. When thinking about this toxicity mechanism with relation to nitrifying bacteria,
it can be seen that damage inflicted on the DNA of the organisms may cause inhibition through a
wide variety of means, including death and lysis of the cells, production of inactive essential

30
proteins, or failure to produce essential proteins. Any one or a combination of these may occur
and inhibit nitrification due to the presence of an oxidative chemical, resulting in growth
impairment or death.
The other major mechanism by which oxidative chemicals appear to damage or inhibit
bacteria is by directly damaging proteins (Apontoweil and Berends, 1975; Ferguson et al., 1995;
Ferguson et al., 1997; McLaggan et al., 2000). More specifically, electrophilic compounds are
thought to act by directly oxidizing thiol bonds and attacking nucleophilic protein centers
(Ferguson et al., 1995; Ferguson et al., 1997; McLaggan et al., 2000). In a study performed by
Lo and coworkers, one electrophilic compound, methylglyoxal, was found to directly attack the
side chains of the amino acids arginine, lysine and cystine (Lo et al., 1994). Extrapolating these
results to both classes of nitrifying bacteria, it can be seen that inhibition of the nitrification
process by electrophiles may also be due to action against essential proteins.
Two very important proteins from the two different classes of nitrifying organisms that
may be affected were presented above. Both AMO and NOR contain sulfur groups and thiol
bonds to maintain their three-dimensional shape and active confirmations. Reactions with these
bonds can likely alter the shape or activity of these proteins, resulting in inhibition of ammonia
or nitrite oxidation. Another possible mechanism of inhibition for AMO is interference with the
copper active site of this enzyme. It has been proposed that the copper cycles between its
oxidized and reduced states when the enzyme is active (Wood, 1986). If an oxidizing agent is
present, it would prevent reduction of the copper and thus prevent AMO from functioning
properly. An additional inhibition mechanism for NOR involves the iron-sulfur group, which
was previously identified to be the active site of the protein. The disassembly of iron-sulfur
clusters by oxidative chemicals has been documented (Carmel-Harel and Storz, 2000) and this
site may be dramatically affected by electrophilic chemicals that attack sulfur groups and thus
remove the nitrite oxidizing ability of the molecule. In addition, if redox cycling of specific
metals is required for NOR activity, which appears to be a likely possibility (Wood, 1986), then
oxidation of these metals by an electrophile would lead to inactivation of the enzyme and
inhibition of nitrite oxidation.
These molecular level toxic mechanisms can manifest into macro-scale process upset
events in activated sludge both due to the toxic mechanism and the stress-response of the
bacteria to the mechanism. Of the process performance parameters that have been monitored for
31
oxidative chemical shock, a few studies have been conducted where the effects on activated
sludge deflocculation were investigated. One study examined the effects of two electrophilic
chemicals, CDNB and N-ethylmaleimide (NEM), and found that both induced rapid
deflocculation (Bott and Love, 2002). The same deflocculation was noted when examining the
effects of cadmium, which is electrophilic, on activated sludge during the experiments of Bott
and Love and those performed by Weber and Sherrard (1980). As cadmium is a heavy metal, the
exact mechanism for the cause of the deflocculation event may not be the same as the organic
uncharged electrophiles CDNB and NEM, but it does lend weight to the argument that oxidative
chemicals can induce deflocculation in activated sludge. It has been hypothesized that this
deflocculation is not a direct result of the electrophilic toxins themselves but, rather, one
resulting from a protective stress-response mechanism of the bacteria to electrophilic chemicals
(Bott and Love, 2002). A detailed analysis of this and other oxidative stress-response
mechanisms found in Gram-negative bacteria is given below.
In addition to the deflocculation event noted for activated sludge biomass exposed to
electrophilic chemicals, our lab has also found that CDNB severely inhibits nitrification and that
recovery of this process takes much longer than recovery from the deflocculation event (3 days
for deflocculation versus no recovery after 28 days for nitrification) (Kelly et al., 2004; Love et
al., 2002b). From effluent nitrogen species data that was monitored over time, it was noted that
nitrite oxidation took longer to recover than did ammonia oxidation, suggesting an increased
sensitivity of NOB to electrophiles. This may be due to the iron-sulfur active site in NOR, which
is a more significant target for oxidation than the active site in AMO. It may also be due to
differences between stress response mechanisms in AOB and NOB, which will be discussed
below.
Whatever the reason for the differences in nitrifying organism inhibition, it does not
explain the increased recovery time of nitrification versus other process parameters. One
possible explanation is washout of the bacteria. As the deflocculation event occurred at the same
time nitrification was lost, the extra biomass lost due to deflocculation may account for the
nitrification loss. This is because the SRT was effectively lowered by the excess loss of biomass
in the effluent and washout of the slower growing nitrifiers may have occurred (Abeysinghe, et
al., 2002). This explanation is not likely, however, as the excess biomass lost from the system
only decreased the sustained solids retention time to 5 days, which is still above the minimum

32
SRT of 3 days for stable nitrification without further inhibition suggested by Grady et al. (1999).
In addition, nitrification inhibition occurred before any solids were wasted from the system, as
was noted by a reduced nitrate generation rate for the CDNB shocked biomass. A more likely
explanation for the increased inhibition would be washout due to the CDNB inhibition
decreasing the growth rate. This slowed growth rate may lead to washout of the biomass from
the system as described by Abeysinghe and coworkers for temperature inhibition of nitrification
(Abeysinghe et al., 2002). As long as inhibitory concentrations of the chemical remained in the
system, the growth rate would not increase to the point of allowing re-growth of the bacteria to
reestablish stable nitrification.
2.3.2 Oxidative Stress-Response Mechanisms
Glutathione, Glutathione-Gated Potassium Efflux and Cytoplasmic Acidification
It has been proposed that the deflocculation event noted during our experiments for
activated sludge exposed to electrophilic chemical toxins was caused by a rapid efflux of
potassium from the cytoplasm of the cells into the environment. The potassium efflux reduced
floc strength by increasing the intrafloc monovalent: divalent (M:D) cation ratio (Bott and Love,
2002), which has been found by others to be an important factor in controlling the strength of
activated sludge flocs (Higgins and Novak, 1997a; Higgins and Novak, 1997b; Novak et al.,
1998). It has been suggested that the potassium efflux event noted for the electrophile-shocked
activated sludge is analogous to a similar potassium efflux event noted in pure cultures of
heterotrophic Gram-negative bacteria (Bott and Love, 2002). From these pure culture
experiments, which mainly used E. coli, it appears that the observed efflux of potassium is the
direct result of a stress-response mechanism elicited by the bacteria in response to electrophilic
shock events (Booth et al., 1993; Ferguson et al., 2000; Ferguson and Booth, 1998; Ferguson,
1999). This stress response mechanism has been dubbed the glutathione gated potassium efflux
(GGKE) system (Bott and Love, 2002).
Glutathione. As the name implies, a very important molecule for activation of this stress
response mechanism is glutathione. Reduced glutathione (GSH) is a tripeptide that is found in
both eukaryotes and prokaryotes and is the major soluble non-protein thiol found in cells (Booth
et al., 1993; Elmore et al., 1990). It also appears that glutathione provides a major cellular
defense against electrophilic compounds by acting as a “sacrificial nucleophile”. As
33
electrophilic compounds act against sulfur groups in cells, glutathione “sacrifices” itself and is
oxidized by the electrophile to protect proteins and DNA and promote survival of the cell. This
has been found for both E .coli cells exposed to methyglyoxal (Carmel-Harel and Storz, 2000;
Ferguson et al., 2000; Ferguson and Booth, 1998), and chlorine bleach (Chesney et al., 1996), for
Pseudomonas fluorescens exposed to cadmium (Hultberg, 1998) and for Pseudomonas
aeruginosa exposed to reactive oxygen species (Park et al., 1993). The glutathione is then either
oxidized by the electrophile (forming GSSG) or reacted to form a glutathione-S-conjugate with
the compound (GSX) (Booth et al., 1993). In the case of CDNB, the electrophile studied in our
labs, it forms a conjugate called 2,4-dinitrobenzyl-S-glutathione (DNBSG), which is likely
exported from the cell and degraded by a transpeptidase (Ness et al., 1997; Vuilleumier, 1997).
Many times, the conjugation reactions are catalyzed by another essential molecule known as
glutathione-S-transferase (Booth et al., 1993). In addition, once molecules of glutathione are
oxidized, in most organisms they are not simply discarded, but rather returned to their reduced
state by another important NADPH-dependent molecule known as glutathione reductase (Abordo
et al., 1999; Carmel-Harel and Storz, 2000), which allows for glutathione to be recycled within
cells.
Interestingly, previous research has shown that glutathione production is induced by
oxidative chemicals such as cadmium in both human cells (Stohs and Bagchi, 1995, Ercal et al.,
2001) and in yeast cells (Vido et al., 2001) but the results for bacteria are mixed. In one study by
Park and coworkers (1993), glutathione levels increased in P. aeruginosa cells exposed to
oxygen radicals while a separate study done by Malin Hutberg (1998) showed a decrease in
glutathione levels in P. fluorescens cells exposed to cadmium. A stimulation of glutathione
production would be expected as it would provide a higher level of protection to cells in reponse
to an oxidative chemical shock event. The drop in levels seen in the Hutberg study was not
explained, but is likely because the method was only reading the reduced glutathione levels,
which would have been oxidized upon exposure to cadmium.
Glutathione Gated Potassium Efflux and Cytoplasmic Acidification. Not only does
glutathione play an important role in protecting cellular components from electrophiles through
self-sacrifice, but it also is important in regulation of the potassium efflux response. It has been
found that the reduced form of glutathione (GSH) negatively regulates (turns off) the potassium
efflux channels located in the cell membranes (Elmore et al., 1990; Miller et al., 1997).

34
Furthermore, the oxidized (GSSG) and conjugate (GSX) forms of glutathione positively regulate
(turn on) the potassium efflux channels (Elmore et al., 1990; Ferguson et al., 1993; Ferguson et
al., 1997). From the studies done to date, it appears that two potassium efflux channels exist that
are regulated, or “gated” by glutathione. Originally described in the early 1970’s as protein
channels TrkB and TrkC, they were renamed KefB and KefC by Bakker and coworkers after it
was determined that these proteins controlled the efflux of potassium from cells (Bakker et al.,
1987). These efflux pumps, which are turned on in response to oxidative stress, are potassium-
proton antiporters, meaning they influx protons as they efflux potassium cations. This results in
the acidification of the cytoplasm, which has been found to confer oxidative stress resistance to
the cells (Ferguson et al., 1996; Ferguson et al., 1998; Ferguson et al., 1997; Ness et al., 1997).
Furthermore, it appears that these two proteins do not have sulfhydryl groups that are essential
for their activity, or such groups are extremely well protected (Bakker et al., 1987) and,
therefore, potassium efflux can occur without inhibition from the electrophiles they are meant to
protect against. In addition, this system is thought to be conserved in Gram-negative bacteria as
it has been found in several different species tested, including E. coli, S. typhimurium, A.
aerogenes, P. aeruginosa and R. sphaeroides (Booth et al., 1993).
In addition to protection from electrophiles afforded by glutathione, it appears that the
acidification of the cytoplasm by the GGKE response turns on DNA repair mechanisms
(Ferguson et al., 1997), as DNA is a target for oxidative chemicals. One of these has been found
to be increased production of Dps, a protein that non-specifically binds to DNA within cells
(Hengge-Aronis, 1993). Dps is believed to bind to DNA without any sequence specificity and
afford protection to cells against oxidative damage (Hengge-Aronis, 1993; Martinez and Kolter,
1997). During oxidative challenge, Ferguson and co-workers found that levels of Dps increased
in E. coli, and the overall viability of wild type cultures increased as well over mutants deficient
in Dps (Ferguson et al., 1998). Interestingly, the stationary phase stress response regulator
RpoS, which has been found to be important in regulation of Dps transcription (Hengge-Aronis,
1993), was not required to up-regulate Dps in response to oxidative stress, suggesting that some
other regulation mechanism may be required to trigger the acidification of the cytoplasm by the
GGKE response (Ferguson et al., 1998). Several other oxidative stress-response proteins
controlled by RpoS are discussed below.

35
Recently, the complete sequence of the ammonia oxidizing bacteria Nitrosomonas
europaea was completed and analyzed (Chain et al., 2003). Availability of this genome allows
for a complete search of genes related to stress response and protection within an AOB strain,
and may give some insight into the increased sensitivity noted for these bacteria to many
chemical stressors. The known protein coding genes for N. europaea are located at the Protein
Information Resource NREF Database (http://pir.georgetown.edu) and the N. europaea genome
can be searched at the Oak Ridge National Laboratory Nitrosomonas genome homepage
(http://genome.ornl.gov/microbial/neur/embl/). A list of several known oxidative stress response
genes and their presence (or absence) in N. europaea is given in Table 2.3. Genes were
considered present at an e≤0.001.

36
Table 2.3 Summary of selected genes involved in oxidative stress response mechanisms and their presence in the N. europaea genome.
Gene Name Function Presence in N. europaea
Genes involved in the GGKE mechanism
gshB glutathione synthetase Yes gst glutathione S-transferase Yes
gorA glutathione oxidoreductase No kefB Glutathione regulated potassium efflux
system protein KefB Noa
kefC Glutathione regulated potassium efflux system protein KefC
Noa
dps DNA binding protein Dps No Genes involved in the oxyR system
oxyR oxyR system regulatory protein OxyR No katG hydroperoxidase/catalase Nob
aphCF alkyl hydroperoxide reductase Noc grxA glutaredoxin Nod trxC thioredoxin Noe oxyS regulatory RNA No
Genes involved in the soxRS system
soxR soxRS system regulatory protein SoxR No soxS soxRS system regulatory protein Soxs No sodA Manganese superoxide dismutase Nof tolC outer membrane efflux protein TolC Yesg
arcAB multidrug resistance efflux system arcAB Noh rpoS regulated oxidative stress response genes
rpoS sigma factor S No katE hydroperoxidase/catalase Nob nth endoonuclease No
sodC copper-zinc superoxide dismutase No xthA Exonuclease III Yesg topA topoisomerase I Noi
a pH adaptation potassium efflux system protein F and D found, but not glutathione regulated b catalase gene with unknown regulation mechanism found c alkyl hydroperoxide reductase gene with unknown regulation mechanism found d glutaredoxin gene with unknown regulation mechanism found e Six thioredoxin genes with unknown regulation mechanisms found f manganese iron superoxide dismutase with unknown regulation mechanism found g BLAST search yielded protein with similar coding strand h arcAB not found but numerous multidrug efflux pumps located in genome i three distinct topoisomerase genes with unknown regulation found
37
After searching the genome of N. europaea for the genes that encode the proteins
involved in the GGKE mechanism, some very interesting results were noted. First, a gene
coding for glutathione synthetase (TrEMBL # Q82V16) was present in the genome; indicating
that AOB have the ability to produce glutathione. In addition, a gene for glutathione S-
transferase (TrEMBL # Q82TE5) was also present; indicating that conjugates between
glutathione and the oxidative stressor could be produced. However, a gene coding for
glutathione reductase was not found (Chain et al., 2003), indicating that once the glutathione is
oxidized it cannot be reduced back to GSH and reused to confer protection against oxidative
chemicals. Although a genome sequence for a NOB has not yet been completed, it is possible
that many of the genes are conserved between AOB and NOB as both groups of organisms are
closely related and autotrophic. The absence of a glutathione reductase may indicate one
possible mechanism by which nitrifiers are more sensitive to oxidative stress than heterotrophic
bacteria. In addition, just because a gene is present in an organism’s genome does not mean that
the gene is expressed. Therefore, it is possible that the genes for glutathione synthetase are not
expressed and glutathione is not produced, leaving N. europaea and possibly other AOBs
without a critical oxidative stress defense mechanism.
A search was also performed to examine the presence of other genes critical to the GGKE
response mechanism, which is thought to be conserved in all Gram-negative bacteria. The
results found two different pH adaptation potassium efflux system proteins. The first, pH
adaptation potassium efflux system protein F (TrEMBL # Q82TI2), is an integral membrane
protein that is part of a pH regulation system but is not related to either KefB or KefC. The
second, PhaD (TrEMBL # Q82TI4), is a transmembrane protein with function similar to
NADH:ubiquinone oxidoreductase (complex I) ,which catalyses the transfer of two electrons
from NADH to ubiquinone and is associated with proton translocation across the membrane.
This protein was also not closely related to either of the GGKE Kef proteins. When the N.
europaea genome was searched for the presence of these genes, no positive matches were found,
indicating that the well characterized glutathione-gated potassium channels do not exist in N.
europaea. The lack of such a mechanism may mean that acidification of the cytoplasm and
activation of DNA protection proteins is not possible, or that acidification is controlled by some
other unknown mechanism. In addition, the DNA binding protein, Dps was also absent from the

38
N. europaea genome, further lending weight to the argument that acidification of the cytoplasm
does not occur in AOBs. The lack of this DNA protection mechanism may indicate why AOBs
are sensitive to electrophilic chemicals. Interestingly, it is believed that this is the first evidence
of a Gram-negative bacterium that lacks the conserved GGKE mechanism, perhaps because it is
the first autotrophic organism examined.
OxyR and SoxRS Antioxidant Systems
Oxidative stress to cells can also be induced by metabolic byproducts that are oxidative in
nature. An increase in the production of such byproducts has been found when external
oxidative chemicals like CDNB were added to pure cultures of cells (Abordo et al., 1999). Two
of the more potent oxidative chemicals produced in cells are superoxide (O2·-) and hydrogen
peroxide (H2O2), both of which are produced during the autooxidation of components of the
respiratory chain in cells (Gonzalez-Flecha and Demple, 1995). Two different stress-response
systems have been identified that work to protect cells against superoxide and hydrogen peroxide
produced in cells. These systems have been identified as the OxyR and SoxRS systems, and
some genes from these systems have also been found to afford protection to cells from external
sources of oxidation, like NEM (Vattanaviboon et al., 2001).
The OxyR System. OxyR was described through a series of mutations that increased
resistance to hydrogen peroxide and lead to an increase in the expression of hydrogen peroxide
inducible proteins (Storz and Zheng, 2000). OxyR is a regulator of many genes that are
expressed upon exposure to peroxide stress. These genes include katG, which codes for a
hydroperoxidase, and aphCF, which codes for an alkyl hydroperoxide reductase. Both of these
proteins help to mediate toxic effects of peroxides by eliminating the oxidants (Christman et al.,
1985). In addition, the genes, gorA (glutathione reductase – discussed above), grxA
(glutaredoxin) and trxC (thioredoxin) are all controlled by OxyR and help to maintain the thiol-
disulfide levels in cells by reversing damage to proteins caused by oxidizing agents (Storz and
Zheng, 2000). Interestingly, OxyR also induces expression of the non-specific DNA binding
protein Dps, discussed above (Martinez and Kolter, 1997). Finally, OxyR activates the
expression of a small RNA molecule known as OxyS, which protects cells against mutation
through an unknown mechanism (Altuvia et al., 1997). Several of the genes regulated by OxyR

39
have also been found to be regulated by the alternative sigma factor RpoS, as will be discussed
later.
Upon examining the genome of N. europaea for the presence of these genes, no matches
were found. In fact, the sequence for the regulatory gene oxyR is entirely absent from the
genome (Chain et al., 2003). The absence of this regulatory protein means that if the genes for
peroxide protection are present, then they are either controlled by some other universal regulator
or are independently regulated. In addition to the absence of oxyR, the genes encoding for OxyS
and glutathione reductase are also missing from the genome. If oxyS is missing, then AOB and
possibly NOB are missing an RNA that provides protection against mutations that can be caused
by oxidative chemicals, and may also lead to an increased sensitivity to those chemicals. The
implications for the lack of glutathione reductase are discussed above.
While matches for the OxyR regulated katG, ahpCF, grxA and trxC were not found,
genes coding proteins with the same function were noted for all of these. A gene encoding an
alkyl hydroperoxide reductase (TrEMBL # Q820H3) was found, as was a gene encoding a
generic catalase (TrEMBL # 82TK1). A catalase protein was previously found in the AOB N.
europaea and Nitrosospira multiformis during a study performed by Wood and Sorensen (Wood
and Sorensen, 2001), suggesting that genes involved in oxidative stress response might be
conserved across the different AOB species. In addition a glutaredoxin gene was found
(TrEMBL # Q82SU3) and 5 different sequences were located that code for thioredoxin-like
proteins. This means that genes are present that are capable of activating glutaredoxin and
thioredoxin, which are proteins that can repair oxidative chemical-induced damage to proteins.
Furthermore, these proteins assist in detoxifying peroxides. However, it is unclear how the
genes for these proteins are regulated in response to such oxidative stress events, and it is
possible that there is no regulatory mechanism. If this is true, then these genes could not be
expressed at a higher rate when nitrifiers are exposed to shock loads of electrophilic/oxidative
chemicals, which would leave these organisms more susceptible to inhibition by such
compounds. The study conducted by Wood and Sorensen helps to confirm this idea as the
catalase activity in both Nitrosomonas and Nitrosospira did not increase after the cells were
exposed to H2O2 (Wood and Sorensen, 2001).

40
The SoxRS System. The second system, SoxRS, has been found to increase protection
against superoxide and increase transcription of a number of superoxide inducible genes (Storz
and Zheng, 2000). Regulation of the soxRS inducible genes occurs in a two step process. The
first involves conversion of SoxR to an active state by oxidation of an iron-sulfur cluster. SoxR
in turn enhances transcription of soxS and the resulting protein, SoxS, induces expression of the
soxRS regulon genes (Wu and Weiss, 1992). One of the most important genes controlled by the
SoxRS system is sodA, which codes for a manganese superoxide dismutase that can convert
superoxide back to oxygen. In addition, this system governs expression of the DNA repair
enzyme endonuclease IV, which is important to repair any oxidative damage caused to DNA.
Interestingly, SoxS also increases expression of genes that code for outer membrane proteins
known to control multidrug efflux, tolC and acrAB. It is thought that expression of these genes
in conjunction with the noted upregulation of MicF, which represses the production of an outer
membrane porin called OmpF, will result in the exclusion of compounds that might generate
superoxide (Storz and Zheng, 2000). It is also important to note that the soxRS regulon has some
overlap with the multiple antibiotic resistance regulon controlled by the protein MarA (Storz and
Zheng, 2000). This may also explain why the genes tolC, acrAB and micF are induced by SoxS.
Examining the N. europaea genome for the presence of the genes controlled in the soxRS
regulon yields interesting results. As was found for the OxyR system, neither the gene coding
for SoxR nor the gene coding for SoxS were found in the genome (Chain et al., 2003). In
addition, a search for the multiple antibiotic resistance regulator MarA yielded negative results.
As before, this suggests that genes involved in resistance and repair of oxidative damage caused
by superoxide and other electrophiles may be regulated independently or by another universal
regulator, or may be unregulated entirely. Although the regulators of these superoxide responses
were not found, a manganese and iron superoxide dismutase (SOD) does exist in the genome
(TrEMBL # Q83W28) and has been detected in response to oxidative stress in both
Nitrosomonas and Nitrosospira (Wood and Sorensen, 2001). Many different multidrug efflux
proteins have been found in the genome of N. europaea, including a possible match for the outer
membrane protein TolC. As with peroxide resistance, the results of this search suggest that
protection of AOB from superoxide and other oxidative stress events may occur because of the
presence of enzymes like SOD, which can help in detoxifying the cells, and multidrug efflux
proteins, which can remove damaging contaminants from the cells. However, any regulatory

41
mechanisms for these systems are unknown at this time. As with catalase, results presented by
Wood and Sorensen indicate that superoxide dismutase activity is unaffected by introduction of
oxidative chemicals (Wood and Sorensen, 2001), which indicates that a regulatory mechanism
may not exist.
RpoS Controlled Oxidative Stress Responses
RpoS is a sigma subunit of RNA polymerase, which carries out transcription of genes
encoded by DNA. RpoS, or sigma S, is considered a primary sigma factor because it recognizes
similar promoter sequences to the vegetative sigma factor, sigma 70 (Lonetto et al., 1992).
Expression of RpoS is very low during the exponential phase of cell growth (active growth with
sufficient nutrients) but is high during the stationary phase of growth when cells are exposed to a
variety of stressed conditions, including high osmolarity or acidic pH (Hengge-Aronis, 2000).
RpoS is thought of as a master regulator of the general stress response (Hengge-Aronis, 2002)
and, although first discovered in E. coli, RpoS has been identified in numerous Gram-negative
bacteria but has not yet been found in members of the α proteobacteria, to which some members
of the NOB belong (Hengge-Aronis, 2000). Mutants lacking the gene that encodes RpoS have
increased sensitivity to a variety of stressors that induce the expression of that gene, including
high temperatures (Hengge-Aronis, 1993) and even oxidative chemical shock (Ferguson et al.,
1998). The increased sensitivity of rpoS mutants suggests that RpoS induces expression of
numerous genes involved in stress tolerance. Below is a discussion of critical genes regulated by
sigma S involved in oxidative stress tolerance and repair, and the implications they may have on
the oxidative stress tolerance of nitrifying bacteria. A review of many of the genes involved in
oxidative stress and other stress responses that are associated with RpoS is given by Eisenstark et
al. (Eisenstark et al., 1996).
Many of the oxidative stress genes previously discussed in conjunction with other
response mechanisms are also regulated by sigma S. The first of these is glutathione reductase
(Becker-Hapak and Eisenstark, 1995), which is involved in the reduction of glutathione and is
also known to be regulated by OxyR. Other genes in the oxyR regulon that are also regulated by
RpoS include katG, and dps (Michan et al., 1999). Interestingly, the study by Michan et al.
showed that RpoS may also control expression of oxyR itself and, thus, exert regulatory control
over the entire OxyR response mechanism. Double regulation of these genes means that they

42
may be turned on in response to other stressors, like pH or osmotic shock, and may help with
DNA repair and protection under these other stress conditions as well.
In addition to the genes already discussed, several others exist that are controlled by
RpoS and help protect cells from electrophilic shock or mediate its effects. One of these genes is
katE, which encodes a catalase that is not regulated by OxyR (Hengge-Aronis, 1993). Another
gene of importance to oxidative stress response is xthA, which codes for exonuclease III and is
involved with excising damaged sections of DNA for repair. Expression of xthA increased as
cell growth enters into the late exponential and stationary phases, and it was inferred that this
gene was regulated by RpoS (Hengge-Aronis, 1993; Sak et al., 1989). Another gene that has
more recently been found to be regulated by RpoS is sodC, which encodes a copper-zinc
superoxide dismutase that performs the same function as the iron-manganese superoxide
dismutase discussed above, except that it is exported to the periplasmic space rather than
remaining in the cytoplasm (Gort et al., 1999). Tse-Dinh found that another enzyme,
topoisomerase I, is regulated by RpoS. This enzyme was found to provide significant protection
against electrophile attack, specifically against hydrogen peroxide and NEM (Tse-Dinh, 2000).
Topoisomerase I has two possible actions that can afford protection to the DNA. One action
regulates DNA supercoiling. In its second action, topoisomerase I prevents R-loop formation at
DNA sites where high transcription rates occur as cells mount their defense against stress.
Several of these genes were notably absent from the genome of N. europaea. Although
there is a catalase gene in the genome and catalase activity has been observed, the catalase gene,
katE, was not found. In addition, no genes encoding a copper zinc superoxide dismutase were
discovered. This would suggest that the cells have no protective mechanism against superoxide
in the periplasm, and that protection only occurs in the cytoplasm where a manganese SOD
enzyme is present. Genes were found that encode for at least at least two different exonucleases
in N. europaea; however, no known match to exonuclease III was found in the protein databank.
Upon searching the N. europaea genome specifically for exonuclease III from E. coli, it appears
that a possible match does exist that has not yet been confirmed. The presence of such enzymes
is not surprising, as exonuclease activity is required for general maintenance of cells and during
replication of DNA to repair errors. A search was also performed to look for the presence of a
topoisomerase and four distinct topoisomerases were found in the genome of N. europaea.
Again, this is not surprising as topoisomerases are essential for supercoiling the DNA of bacteria

43
(as discussed above). The most interesting absence was that of the gene rpoS, which encodes for
the master general stress response regulator RpoS (Chain et al., 2003). Although RpoS is not
found in every bacterium, it is still conserved across many different genera. The absence of such
a regulatory system would mean that responses to different stressors cannot be linked, which
would mean that damage caused to proteins or DNA from one chemical stressor may go
undetected and unrepaired.
The results from our evaluation of the N. europaea genome for known
oxidative/electrophilic stress response mechanisms show that some genes that protect against this
type of stress are present, like glutathione synthetase. Although several mechanisms have
recently been identified in the genome of N. europaea, there is no guarantee that these genes are
expressed. To date, only Wood and Sorensen (2001) have shown that genes responsible for
oxidative stress mediation are expressed in AOB. Even though some genes and proteins
important to oxidative stress responses exist, several notable genes were missing from the
genome, including dps and the genes encoding the glutathione-gated potassium hydrogen
antiporters KefB and KefC, which were originally thought to be conserved in all Gram-negative
bacteria. More importantly, investigations into the genome of N. europaea have shown that the
known regulatory mechanisms for such stress response mechanisms are absent. As these
mechanisms have only been looked at in the N. europaea genome, it is possible that they are
present in other AOB and NOB. Because of the close geneology and autotrophic nature of the
nitrifying bacteria, it is more likely that their physiologies are similar and thus they may lack the
same mechanisms. Taken together, this investigation into the existence of oxidative stress
response mechanisms provides insight into possible reasons for the susceptibility of nitrifying
bacteria to electrophilic chemicals.
2.4 Organic Hydrophobic Chemical Inhibition
1-Octanol is a second chemical that showed significant inhibition of nitrification relative
to carbon removal and flocculation during our preliminary experiments. Octanol is a
hydrophobic organic chemical with solvent-like properties. A discussion of the toxic nature of
ocantol and other organic hydrophobic chemicals follows. In addition, known stress response
mechanisms for inhibition due to hydrophobic chemicals and possible reasons for the increased
susceptibility of nitrifying organisms to such chemicals are discussed.
44
2.4.1 Toxic Modes of Action
Hydrophobic organic chemicals are used widely in industrial practices, mainly as fuels
and industrial solvents. For this reason, many different hydrophobic organic chemicals have
been found in the influent and effluent waters of wastewater treatment plants (Paxeus, 1996).
Because of the widespread use of hydrophobic organic chemicals, much work has been done
examining the effects of these chemicals on bacteria; however, relatively little work has been
done using nitrifying bacteria. As with CDNB, the majority of the work has been done using
Gram-negative bacteria like E. coli and various Pseudomonad species. Again, as nitrifying
bacteria are also Gram-negative and have both outer and cytoplasmic membranes, the toxic
modes of action of hydrophobic organic solvents are likely to be the same for both.
Many hydrophobic industrial chemicals are thought to induce toxic effects through
narcosis, a mode of action marked by a slowing of cellular activity (Bradbury and Lipnick,
1990). During experiments run in our lab, 1-octanol was used as the hydrophobic organic
chemical. 1-Octanol is amphipathic, meaning that it has both polar properties (due to the
hydroxyl group on the first carbon) and nonpolar properties (due to the long hydrophobic carbon
chain). Based on previous work, 1-octanol has been said to function in a manner similar to
narcotics (Bearden et al., 1999; McKim et al., 1987; Veith et al., 1983) and the site of action of
these chemicals on organisms is thought to be the cytoplasmic membrane (Sikkema et al., 1995).
Pure culture work has shown that the main target within cells for most hydrophobic (lipophilic)
chemicals is the membrane of cells (Aono et al., 1994; Ingram, 1977; Seeman and Roth, 1972;
Sikkema et al., 1994). This is likely due to the hydrophobic nature of these molecules, which
causes the molecules to “seek out” similar molecules. When examining the physiology of
nitrifying bacteria, the majority of these bacteria contain very large cytoplasmic/inner membrane
surface areas. Because of this, they are an ideal target for hydrophobic chemical contaminants
and likely incorporate more individual hydrophobic chemical molecules per cell than other
Gram-negative bacteria with less membrane area.
The lipid bilayer that forms the cytoplasmic membrane of all living cells contains a
hydrophilic phosphate head group and a hydrophobic center that provides an ideal environment
for hydrophobic organic chemicals to locate (Cooper, 2000). The manner in which hydrophobic
solvents partition into cell membranes depends on the structure and properties of the solvent.
Short chain alkanols interact more with the phospholipid head groups, whereas completely
45
hydrophobic alkanes associate more with the hydrophobic fatty acid acyl chains. Longer chain
alkanols have the hydroxyl group associate with the phosphate head group and the carbon chain
will orient with the fatty acid tails (Weber and de Bont, 1996). The exact position of other types
of molecules is not well predicted based on structure. Less hydrophobic but non-amphipathic
molecules like toluene are expected to accumulate more between the fatty acid chains than near
the polar head groups (Lohner, 1991; Weber and de Bont, 1996). This was confirmed in a study
by Sikkema and coworkers, who showed that many different aromatic and cyclic hydrocarbons
tended to accumulate more around the fatty acid side chains than by the polar head groups of
lipid molecules (Sikkema et al., 1994).
When examining the effects of organic molecules on the membrane structures of Gram-
negative bacteria, it is important to remember that two membranes exist for these organisms, an
outer membrane and a cytoplasmic membrane. In a study done by de Smet et al., it was found
that the outer membrane of E. coli was nearly unaffected upon exposure to toluene, while
considerable damage was done to the cytoplasmic membrane (de Smet et al., 1978). Several
effects can result from the insertion of hydrophobic chemicals into the cytoplasmic membrane,
one of which is an alternation in the membrane fluidity. The membrane fluidity is an indirect
measure of the ordering of lipids in the bilayer. The more fluid the membrane, the less ordered
the lipids become. The way the membrane fluidity and stability is altered depends upon the type
and structure of the hydrophobic compound. Lohner (1991) found that for short carbon chain
alcohols (chain length, C < 10), the transition temperature of the cytoplasmic membrane
decreased and thus the fluidity increased. For longer chain (C > 10) alcohols, the opposite was
found in that the fluidity of the membrane decreased. It has been proposed that this is due to
interactions between the carbon chain of the alcohol and the fatty acid side chains of the lipids.
The longer the side chain of the alcohol, the more it can interact with the fatty acids and increase
ordering in the membrane. The shorter chain alcohols do not efficiently interact with the fatty
acids, only the phosphate head group, and therefore decrease ordering within the membrane
(Lohner, 1991; Weber and de Bont, 1996). During the same study, Lohner found that alkanes
have a similar effect on membrane fluidity, where long chain alkanes (C ≥ 12) decrease fluidity
while membranes exposed to short chain alkanes (C < 12) showed an increase in membrane
fluidity (Lohner, 1991). Again, the effects of aromatic compounds are more difficult to predict,
but a study done by Sikkema and coworkers found that the addition many different cyclic and

46
aromatic hydrocarbons caused an increase in the fluidity of the membranes (Sikkema et al.,
1994).
In parallel to the increase in fluidity, the accumulation of hydrophobic organic chemicals
in the membrane resulted in a swelling of the membrane bilayer. This effect was observed by
Seeman and Roth (1972) when examining the effects of anesthetics on human erythrocytes.
Similar results were found by Sikkema and coworkers on liposomes derived from E. coli
membranes (Sikkema et al., 1994) and by Aono et al. for E. coli K-12 intact cells (Aono et al.,
1994). The swelling of the membranes caused by accumulation of lipophilic contaminants also
causes a deterioration of the membrane integrity. This has been noted by several researchers
who have observed leakage of macromolecules like RNA, phospholipids, and proteins from the
cells into the environment and the area between the two lipid layers (Aono et al., 1994; Jackson
and de Moss, 1965; Woldringh, 1973). Even more importantly, leakage of ATP and ions like
sodium, potassium and protons across the cytoplasmic membrane has also been found in several
studies (da Silveria et al., 2002; Heipieper et al., 1991; Sikkema et al., 1994; Sikkema et al.,
1992). Furthermore, by increasing the permeability of the membrane and allowing for leakage of
protons and ions, a disruption of the proton gradient and membrane potential occurs due to
introduction of hydrophobic compounds (Sikkema et al., 1994; Sikkema et al., 1992). The
disruption of the proton gradient and membrane potential means that cells cannot gain energy for
metabolism and maintenance. Although this has not been specifically examined using nitrifying
bacteria, the effects would likely be the same. The implication of proton motive force disruption
on the process of nitrification would be devastating. For ammonia oxidation, disruption of the
proton motive force may occur due to the dependence of ammonia monooxygenase on electrons
gained in the electron transport chain (see Figure 2.1 above). If the proton motive force is
disrupted in AOB, it may cause an increase in the flow of electrons from hydroxylamine
oxidation to the terminal oxidase of the system. This would deprive the ammonia
monooxygenase of electrons required to oxidize ammonia and thereby inhibit ammonia
oxidation. This idea is similar to a theory proposed by Wood (1986) for ammonia oxidation
inhibition due to respiratory uncouplers, which also disrupt the proton motive force. When
examining inhibition to NOB through the disruption of the proton motive force, two possibilities
exist. The first is that inhibition of the AOB by hydrophobic compounds removes production of
nitrite, the electron donor for NOB, and therefore would inhibit the NOB by removing their

47
“food”. The other possibility stems from the energy barrier that is lowered by the proton motive
force that allows oxidation of nitrite (Wood, 1986). If the ability to lower this energy barrier is
removed, then nitrite will not be oxidized to nitrate as rapidly. Again, this theory is similar to
one first presented by Wood (1986) for observations into the inhibition of nitrite oxidation by
respiratory uncouplers.
In addition to disruption of the proton motive force and energy generation in cells,
alteration of membrane structure may also affect protein function. Hydrophobic chemicals are
known to adversely affect membrane bound proteins, such as transport proteins (In't Veld et al.,
1991) and cytochromes (Sikkema et al., 1994). In’t Veld postulated that the disruption of
transmembrane transport protein function was due to expansion of the membrane and increase in
the lipid bilayer thickness caused by insertion of lipophilic compounds. This increase in bilayer
thickness did not allow the proteins to function properly because they contain transmembrane
domains that are very specific to the thickness of a membrane (In't Veld et al., 1991). This may
also be a reason for the inhibition of nitrification. In AOB, the enzyme AMO is made up of two
subunits. Within each of these subunits, there are several transmembrane domains (Hooper et
al., 1997) that would not fit properly into a membrane expanded by lipophilic chemicals. This
expansion may pull the subunits apart and inactivate the enzyme.
Proteins and enzymes may also be affected directly by hydrophobic compounds. In a
study performed by Franks and Lieb, the effects of hydrophobic general anesthetics (halothane,
hexanol, decanol) on pure luciferease enzyme were examined. By removing the lipids, the direct
effects of the compound on the protein could be examined. The study showed that the luciferase
activity decreased with an increasing concentration of the anesthetic (Franks and Leib, 1984).
This suggests that the toxic mode of action of the anesthetics tested is against the enzyme
directly. The authors further hypothesized that as luciferin, the activating molecule for
luciferase, is hydrophobic and binds in a hydrophobic pocket in luciferase, then hydrophobic
chemicals may act by competitively binding in the hydrophobic pocket of the luciferase enzyme.
This may also be the case for nitrifiers. Results by Suzuki and coworkers have found that the
substrate for AMO is ammonia, not ammonium (Suzuki et al., 1974). As ammonia is an
uncharged molecule, the active site in AMO may be a hydrophobic pocket. Therefore,
hydrophobic chemicals may inhibit ammonia oxidation by competitively binding in the
hydrophobic pocket of AMO and preventing the ammonia substrate from entering the enzyme to

48
be oxidized. This is not as clear for NOB, as it is yet unknown if the substrate for nitrite
oxidoreductase is nitrite or nitrous acid.
2.4.2 Hydrophobic Stress Response Mechanisms
Membrane Modifications
Several different mechanisms exist for bacteria to cope with hydrophobic chemical stress.
The first mechanisms discovered were those that modify the membrane structure. These
modifications are meant to counteract the changes in membrane fluidity experienced upon
insertion of different hydrophobic chemicals into the cytoplasmic membrane. As was found with
the alternation in membrane fluidity, the changes of membrane composition are related to the
type of hydrophobic contaminant (Weber and de Bont, 1996). For alcohols, Ingram showed that
the fatty acid composition of the E. coli membrane was altered by the presence of alcohols and
that the composition was highly dependent on the chain length of the alcohol (Ingram, 1976).
What he found was that alcohols with a carbon chain length of 1 to 4 showed a decrease in the
16:0 fatty acid composition (palmitic acid) and an increase in the 18:1 (vaccenic acid) fatty acid
composition. As short chain alcohols are known to decrease the membrane fluidity, the increase
in unsaturated fatty acid composition would counteract this affect by increasing the membrane
fluidity. The opposite was found for alcohols with 5 or more carbons in the chain, where the
amount of 16:0 saturated fatty acids increased and the 18:1 unsaturated fatty acids decreased.
Again, these results show that the alteration in the membrane structure is meant to counteract the
increased fluidity caused by the longer chain alcohols by increasing the saturated fatty acid
content to decreased the membrane fluidity. Ingram also found that growth of E. coli ceased
upon exposure to the alcohols until these modifications to the saturated:unsaturated fatty acid
content of the cells was completed, after which growth again occurred (Ingram, 1976). Other
studies have shown that, in general, for compounds that decrease the membrane fluidity, an
increase in the amount of unsaturated fatty acids is observed and for compounds that increase the
membrane fluidity, an increase in the amount of saturated fatty acids is seen (Chen et al., 1995;
Heipieper and DeBont, 1994; Ingram, 1977).
The identification and characterization of several organic solvent tolerant mutants of both
E. coli and various Pseudomonas species also showed another important aspect of the membrane
that aids in solvent tolerance. In a study by Aono and coworkers, the cell surface properties of

49
several solvent tolerant E. coli K-12 mutants were examined with respect to the parent strain
(Aono and Kobayashi, 1997). They found that the cell surface of the mutant strains were less
hydrophobic than that of the parent strain. This would mean that less solvent would partition
into the less hydrophobic membrane of the solvent tolerant mutants. Although no differences
were found in the fatty acid content of the mutants, the mutants did produce more
lipopolysaccharide (LPS) than the parent strain, which resulted in the increased hydrophilicity of
the cells and possibly provided a barrier to the entrance of hydrophobic solvents into the cell
membranes (Aono and Kobayashi, 1997). Pinkart et al. examined the same properties for a
solvent tolerant and solvent sensitive strain of Pseudomonas putida (Pinkart et al., 1996). When
the fatty acid content of the two strains was examined, no significant differences were found;
however, significant differences did exist in the LPS content of the two strains. The solvent
tolerant strain exhibited a typical rough-type LPS when grown both in the presence and absence
of o-xylene while the solvent sensitive strain exhibited a smooth-type LPS. The solvent tolerant
strain was found to be less permeable to o-xylene and it was hypothesized that this was due to
the difference in LPS structure, not fatty acid content. Upon exposure to o-xylene, there was no
change in the LPS content of the sensitive strain while there appeared to be a shift from a higher
molecular weight LPS to a lower molecular weight LPS for the tolerant strain (Pinkart et al.,
1996). Interestingly, the permeability of the tolerant strain did not change with the changing
LPS, suggesting that the type of LPS was more important than the alteration in LPS content.
A third alteration to the membrane content has also been identified in Pseudomonas
species and occurs more rapidly than the synthesis of new fatty acids or LPS alterations. This
mechanism is the conversion of unsaturated fatty acids from the cis form to trans. This
mechanism was first described by Heipieper and coworkers as a response of Pseudomonas
putida P8 to substrate toxicity caused by phenol (Heipieper et al., 1992). During these
experiments, cells exposed to increasing amounts of phenol, which was used as the substrate,
were found to convert the 16:1 and 18:1 cis unsaturated fatty acids to 16:1 and 18:1 trans. It was
found that this conversion conferred some resistance to the bacteria against the phenol shock.
Later studies found that this conversion occurred for a number of hydrophobic solvents and also
in the Vibrio genus (Heipieper and DeBont, 1994; Junker and Ramos, 1999; Okuyama et al.,
1991; Pinkart et al., 1996). This conversion from cis to trans decreases the membrane fluidity by
increasing the ordering in the fatty acids, much the same way as the conversion from unsaturated
50
to saturated fatty acids. As this conversion occurred in seconds, and did not correspond with the
synthesis of new proteins or lipids, it was proposed that a novel enzyme performed the
conversion from cis to trans. Because this isomerization of the unsaturated fatty acids occurred
in response to 4-chlorophenol and chloramphenicol, it was suggested that the enzyme is non-
specifically regulated and likely associated with the cell membrane to rapidly respond to any
hydrophobic chemical (Heipieper et al., 1992). The gene encoding the enzyme responsible for
this conversion was later sequenced by Holtwick et al. and labeled cti for cis-trans isomerase
(Holtwick et al., 1997). This cis-trans isomerization is considered to be a short-term response
that allows cells to adapt almost immediately to solvents and provide the resistance and time
necessary to synthesize new membrane components like saturated fatty acids (Junker and
Ramos, 1999).
Several genes have been identified that are responsible for these adaptation stress
response mechanisms. It has been suggested that the synthesis of new fatty acids in response to
solvent stress is controlled by two transacylase enzymes, sn-glycerophosphate transacylase and
monoacyl glycerophosphate transacylase, which were originally thought to incorporate a greater
amount of unsaturated fatty acids into the phospholipids of E. coli in response to lowered
temperature (Ingram, 1976). It is now known that only one enzyme, β-ketoacyl-ACP synthase
II, is responsible for temperature-induced alterations in the ratio of saturated to unsaturated fatty
acids in E. coli (Magnuson et al., 1993). It is, therefore, logical that this same enzyme is
responsible for altering the ratio of saturated to unsaturated fatty acids in the membrane with
response to hydrophobic chemical shock because the same chemical alteration occurs as with
temperature shifts. This enzyme appears to be conserved in numerous bacteria, including Gram-
negative (Heidelberg et al., 2000) and Gram-positive species (Ferretti et al., 2001). After
searching the N. europaea genome for this enzyme, no exact match was found. A comparative
search of the genome against the gene sequence from E. coli yielded a probable match,
indicating that N. europaea, and likely nitrifying bacteria in general, have the ability to alter their
fatty acid composition in response to temperature and possibly hydrophobic stress. A summary
of the important stress response mechanisms and their presence in the genome of N. europaea is
listed in Table 2.4.

51
Table 2.4 Summary of select genes involved in hydrophobic stress response mechanisms and their presence in the N. europaea genome.
Gene/Protein Name Function Presence in N. europaea
Membrane Modification Mechanisms
β-ketoacyl-ACP synthase II
modification of membrane fatty acid composition
Probable Homolog Found
cti fatty acid cis-trans isomerase Probable Homolog Found Efflux Systems
AcrA-AcrB-TolC multidrug/solvent efflux system Probable Homologs Found AcrR acrAB system regulator No
MexA-MexB-OprM multidrug/solvent efflux system Probable Homologs Found MexC-MexD-OprJ multidrug/solvent efflux system Probable Homologs Found MexE-MexF-OprN multidrug/solvent efflux system Probable Homologs Found
MexR mex systems regulator No SrpA-SrpB-SrpC multidrug/solvent efflux system Probable Homologs Founda TtgA-TtgB-TtgC multidrug/solvent efflux system Probable Homologs Founda
MepA-MepB-MepC multidrug/solvent efflux system Unknownb MepR mepABC system regulator Unknownb
a Homologous SrpB sequence in N. europaea is the same sequence homologous to TtgB b mepABC and mepR could not be checked against N. europaea genome as gene sequences could not be located
The cis-trans isomerase enzyme, Cti, must be regulated, as the isomerization mechanism
occurs rapidly in response to solvent stress and in the presence of the translation blocker
chloramphenicol (Heipieper, et al., 1992); however, a regulation mechanism for this gene has not
been identified to date. As stated previously, this gene has been identified in several
Pseudomonas species, including P. aeruginosa (Stover et al., 2000), and the isomerase activity
has been noted in numerous species (Sikkema et al., 1995). Upon examination of the N.
europaea genome, no identified cis-trans isomerase gene was present. We also compared the
gene sequence of Cti in P. aeruginosa against the N. europaea genome and a probable match
was found, indicating that N. europaea likely has the ability to rapidly isomerize its unsaturated
fatty acids in response to hydrophobic stressors. The regulatory mechanism for the cis-trans
fatty acid isomerase activity is unknown, and it is not possible to examine the N. europaea
genome for its presence. However, if the regulatory mechanism does not exist, then its activity
could not be up-regulated in response to a hydrophobic chemical shock event and may indicate
why nitrifying bacteria are more sensitive to such an event.
52
Active Efflux Mechanisms
Another mechanism many bacteria have in response to hydrophobic/lipophilic chemical
stress is to actively efflux the chemical from the cell cytoplasm and membrane. Efflux systems
were originally identified for their role in effluxing a wide range of antibiotics and, therefore, are
collectively referred to as multidrug efflux systems (Kieboom and de Bont, 2000; Sikkema et al.,
1995; Weber and de Bont, 1996). These systems have all been identified as members of the
resistance-nodulation-cell division (RND) family of transporters (Kieboom and de Bont, 2000;
Paulsen et al., 1996). There are many different protein channels that have been identified as
multidrug efflux systems and all have been found to be active transporters. In other words, all
require the involvement of the proton motive force as they are either proton dependent or ATP
dependent transporters (Paulsen et al., 1996).
Initially it was unknown if these systems played a role in solvent efflux, as only the
active efflux of antibiotics had been observed. Isken and de Bont first found that 14C-labeled
toluene was removed from a strain of P. putida that cannot metabolize or transform the solvent
(Isken and de Bont, 1996). Further investigation using the respiratory chain inhibitor potassium
cyanide or the proton conductor carbonyl cyanide m-chlorphenylhydrazone showed that
significant accumulation of toluene occurred in cells exposed to either inhibitor. Together, this
suggested that an efflux mechanism existed for lipophilic chemicals and that the system was
actively regulated, rather then relying upon passive transport across the membrane; this
mechanism parallels the multidrug efflux systems previously mentioned (Isken and de Bont,
1996). A similar study performed by Ramos and coworkers confirmed this response by using a
similar compound, 1,2,4-trichlorobenzene (Ramos et al., 1997).
Upon discovery of an organic solvent efflux mechanism similar to the multidrug efflux
systems, investigations into the roles of the known multidrug efflux systems in organic solvent
efflux were performed. Several have been found to play an important role in removing organic
solvents from bacteria, and most have been identified in Pseudomonas species (Kieboom and de
Bont, 2000). One particular RND efflux system, called the AcrAB system, has been identified in
E. coli and is believed to play an important role in the tolerance of the organism to hexane,
cyclohexane (White et al., 1997) and toluene (Aono et al., 1998). This system, like all RND-type
efflux systems, is made up of three proteins working in conjunction; an inner membrane

53
transporter protein (AcrB), an outer membrane protein (TolC) and a membrane fusion protein
(AcrA) that links the two membrane proteins (Kieboom and de Bont, 2000; Paulsen et al,. 1996;
White et al., 1997). When the gene sequences for each component of the AcrAB system were
examined against the genome of N. europaea, a low percent homology match was found for
each, although a high percent homology match was not found. This suggests that increased
susceptibility of N. europaea to hydrophobic shock is not due to the lack of such a system, but
some other possibility.
Because a system similar to AcrAB was present, the regulation mechanism for this
system needs to be examined for its presence and its possible role in enhancing the susceptibility
of nitrifiers to hydrophobic chemicals. TolC was previously discussed with the soxRS oxidative
stress response mechanism. As discussed before, this protein has been found to be regulated by
MarA and SoxS. As both of these proteins are absent from the genome, it is possible that the
similar gene found in the N. europaea genome is not regulated. For the proteins AcrA and AcrB,
two possible regulatory mechanisms have been identified. One is the previously discussed
positive regulator protein MarA (Ma et al., 1995) that is notably absent from N. europaea.
Another is the protein AcrR, which mediates over expression of the acrAB gene locus (Ma et al.,
1996). This gene was also not found in the N. europaea genome. In the same study, the acrAB
system’s transcriptional activity increased as the cells entered stationary phase, suggesting that
the general stress response regulator RpoS may also play a role in the positive regulation of this
efflux system (Ma et al., 1996). The absence of RpoS from the genome for N. europaea suggests
that expression of the multidrug efflux systems in this organism and possibly all nitrifying
bacteria is constitutive and cannot be up or down regulated in response to a hydrophobic
chemical shock. Again, this lack of regulation may be important in explaining why nitrifying
bacteria are more susceptible to shock events.
All of the remaining identified solvent/multidrug efflux systems have been identified in
Pseudomonas species. Of these, three are found in P. aeruginosa. The first is the MexA-MexB-
OprM system; these three proteins are the membrane fusion protein, inner membrane transporter,
and the outer membrane protein, respectively (Li et al., 1998). This system was found to convey
the most resistance to P. aeruginosa exposed to the organic solvents n-hexane, p-xylene and
toluene when compared with the other two systems. In addition, this system was found to be
essential for growth in the presence of solvents based on experiments with a mutant strain
54
lacking the MexAB-OprM system, which failed to grow on any of the tested solvents (Li et al.,
1998). The other two systems (presented in the same protein type order as above) were MexC-
MexD-OprJ and MexE-MexF-OprN. Unlike the MexAB-OprM system, these two systems are
not expressed during growth under laboratory conditions but, instead, are only expressed in
multidrug resistant mutants of P. aeruginosa. These two systems were also found to confer
some solvent resistance but were not essential for growth of the bacteria in the presence of the
solvents (Li et al., 1998). Poole and coworkers found that these efflux systems are probably
negatively regulated in response to solvent and antibiotics by the protein MexR (Poole et al.,
1996).
Although not present in E. coli, these solvent/multidrug efflux systems may be conserved
across different Gram-negative bacteria and were also examined for their presence in N.
europaea. When examining the known proteins of N. europaea, MexB is present (TrEMBL #
Q82XT4) but none of the other proteins involved in the MexAB-OprM system or either of the
other two systems were found. When comparing the gene sequences for MexA and OprM
against the N. europaea genome, probable matches were found for both genes, indicating that
this system or a homologous system is present in the AOB. Probable matches were also found
for each of the genes of the MexCD-OprJ and MexEF-OprN efflux systems. This suggests, as
did the probable matches for the AcrAB-TolC system, that N. europaea contains several
multidrug efflux systems that are homologous to the three Mex systems of P. aeruginosa and,
therefore, would be able to survive in the presence of hydrophobic or lipophilic compounds.
MexR, the negative regulator of the Mex systems, was not present in the genome of N. europaea,
suggesting again that no regulation mechanism exists for the multidrug efflux systems within
nitrifying bacteria. However, because MexR is a negative regulator, absence of the gene for this
protein means that expression of these efflux systems may not be repressed. A lack of repression
would confer higher resistance to solvents and not increased sensitivity; however, it the latter
was the observed response. This may indicate that another regulator is present in nitrifying
bacteria, or that the constitutive expression of the Mex-like efflux systems is not enough to
overcome a high concentration shock of hydrophobic chemicals. It is also possible that this
system does not confer resistance to alcohol solvents like octanol, as no previous experiments
have shown an increased tolerance of P. aeruginosa to alcohols.

55
The remaining three RND family efflux systems were discovered in strains of P. putida.
The first of these is the SprA-SprB-SprC system and has been found to confer resistance to the
solvents toluene, p-xylene, octanol, ethylbenzene, propylbenzene, cyclohexane and hexane
(Kieboom et al., 1998a). This system functions in much the same manner as the previously
discussed systems, and contains a membrane fusion protein that links the inner membrane
transporter to the outer membrane protein. However, unlike the previously discussed systems,
SprABC is only induced by the presence of solvents, not antibiotics. It confers antibiotic
resistance to P. putida only after cells were incubated in the presence of the solvent toluene,
suggesting that antibiotics do not induce its expression (Kieboom et al., 1998a). The protein
sequences for this system could not be found in the Protein Information Resource, but were
previously determined by Kieboom et al. (1998b). By using the sequences presented in this
paper to search the genome of N. europaea, probable matches were found for each of the
components of the SrpABC system. The presence of such a system in nitrifying bacteria would
indicate that they could tolerate levels of octanol as well as other solvent tolerant bacteria, but
our results indicate otherwise. This brings up the question of regulation or even translation of
such a system. If the system cannot be expressed at higher than constitutive levels, then
increased concentrations of the solvents would not be tolerated. If the genes are not even
expressed, then efflux of the contaminants would not occur and the bacteria would be sensitive.
A second system known to confer resistance to toluene, p-xylene and cyclohexane is the
MepA-MepB-MepC system, first described by Fukumori et al. (1998). The authors found that
this system was negatively regulated by the protein MepR, which contained a gene sequence
very similar to the E. coli AcrAB system regulator AcrR. Unfortunately, the entire sequence of
this system was not published by the authors and the listed GenBank accession number
(AB008909) does not match any known sequence and thus no search of the N. europaea genome
could be performed.
The third system identified in P. putida is the TtgA-TgtB-TgtC system and has been
found to confer resistance to toluene, m-xylene and 1,2,4-trichlorobenzene (Kieboom and de
Bont, 2000). When examining for the presence of this system in N. europaea, a probable match
was found; however, the probable matching sequence for the inner membrane transporter protein
TgtB in N. europaea was the same sequence that was found to overlap for SrpB. This indicates

56
that these two systems in P. putida are very closely related and it is likely that only one such
system exists in N. europaea.
Unfortunately, hydrophobic chemical stress response mechanisms have not been as well
characterized as those for oxidative stress response. This means that more is unknown about the
regulatory mechanisms for the identified systems and it is likely that many systems have yet to
be found. From the results presented here, it appears that N. europaea, and probably other
nitrifying bacteria, do contain some of the stress response mechanisms for
hydrophobic/lipophilic chemicals. Such responses found include the systems for fatty acid
isomerization and solvent efflux. However, as with oxidative chemical stress, the existence of
genes encoding these systems does not mean that the stress response mechanisms are expressed
during episodes of hydrophobic chemical exposure. In addition, it appears that many of the
known regulatory mechanisms for solvent response are either unknown or were not found in N.
europaea, further indicating that the increases sensitivity may arise from the inability to regulate
such responses. Overall, the genomic sequence of N. europaea does provide some insight into
the nature of susceptibility to both oxidative and hydrophobic chemical shocks, but additional
information is needed in order to gain a more complete understanding of nitrification inhibition.
2.5 References
Abeysinghe, D.H., Viraj De Silva, D.G., Stahl, D.A., and Rittmann, B.E. (2002) The effectiveness of bioaugmentation in nitrifying systems stressed by a washout condition and cold temperature. Water Environment Research 72 (2), 187-199.
Abordo, E.A., Minhas, H.S., and Thornalley, P.J. (1999) Accumulation of alpha-oxoaldehydes during oxidative stress: a role in cytotoxicity. Biochemistry Pharmacology 58 (4), 641-8.
Altuvia, S., Weinstein-Fischer, D., Zhang, A., Postow, L., and Storz, G. A small, stable RNA induced by oxidative stress: role as a pleiotropic regulator and antimutator. Cell 90 (1), 43-53.
Andersson, K.K. and Hooper, A.B. (1983) O2 and H2O are each the source of one O of HNO2 produced from NH3 by Nitrosomonas; 15N-NMR evidence. FEBS Letters 164, 236-240.
Anthonisen, A.C., Loehr, R.C., Prakasam, T.B.S., and Srinath, E.G. (1976) Inhibition of nitrification by ammonia and nitrous acid. Journal Water Pollution Control Federation 48 (5), 835-852.
Aono, R. and Kobayashi, H. (1997) Cell surface properties of organic solvent-tolerant mutants of Escherichia coli K-12. Applied and Environmental Microbiology 63 (9), 3637-3642.

57
Aono, R., Kobayashi, H., Joblin, K.N., and Horikoshi, K. (1994) Effects of organic solvents on growth of Escherichia coli K-12. Bioscience, Biotechnology and Biochemistry 58, 2009-2014.
Aono, R., Tsukagoshi, N., and Yamamoto, M. (1998) Involvement of outer membrane protein TolC, a possible member of the mar-sox regulon, in maintenance and improvement of organic solvent tolerance of Escherichia coli K-12. Journal of Bacteriology 180 (4), 938-44.
APHA (1998) Standard methods for the examination of water and wastewater. APHA, Washington, DC.
Apontoweil, P. and Berends, W. (1975) Isolatoin and characterisation of glutathione-deficient mutants of Escherichia coli. Biochimica et Biophysica Acta 399, 359-378.
Arciero, D.M., Balny, C., and Hooper, A.B. (1991) Spectroscopic and rapid kinetic studies of reduction of cytochrome c554 by hydroxylamine oxidoreductase from Nitrosomonas europaea. Biochemistry 30, 11459-11465.
Bakker, E.P., Booth, I.R., Dinnbier, U., Epstein, W., and Gajewska, A. (1987) Evidence for multiple K+ export systems in Escherichia coli. Journal of Bacteriology 169 (8), 3743-3749.
Bearden, A., Sinks, G., Vaes, W., Ramous, E., Herens, J., and Schults, T. (1999) Bioavailability, biodegradation, and acclimation of Tetrahymena pyriformis to 1-octanol. Ecotoxicology and Environmental Safety 44, 86-91.
Becker-Hapak, M. and Eisenstark, A. (1995) Role of RpoS in the regulation of glutathione oxidoreductase (Gor) in Escherichia coli. FEMS Microbiology Letters 134 (1), 39-44.
Bedard, C. and Knowles, R. (1989) Physiology, biochemistry, and specific inhibitors of CH4, NH4
+, and CO oxidation by methanotrophs and nitrifiers. Microbiological Reviews 53 (1), 68-84.
Blum, D.J.W. and Speece, R.E. (1991) A database of chemical toxicity to environmental bacteria and its use in interspecies comparisons and correlations. Research Journal Water Pollution Control Federation 63 (3), 198-207.
Bock, E., Koops, H.P., and Harms, H. (1986) Cell biology of nitrifiers. In: Prosser, J.I. (ed), Nitrification. IRL Press, Oxford.
Booth, I.R., Douglas, R.M., Ferguson, G.P., Lamb, A.J., Munro, A.W., and Ritchie, G.Y. (1993) K+ efflux systems. In: Bakker, E.P. (ed), Alkali Cation Transport Systems in Prokaryotes, pp. 291-309, CRC Press, Boca Raton, FL.
Bott, C. and Love, N. (2002) Investigating a mechanistic cause for activated sludge deflocculation in response to shock loads of toxic electrophilic chemicals. Water Environment Research 74 (3), 306-315.
Braam, F. and Klapwijk, A. (1981) Effect of copper on nitrification in activated sludge. Water Research 15, 1093-1098.

58
Bradbury, S. and Lipnick, R. (1990) Introduction: structural properties for determining mechanisms of toxic action. Environmental Health Perspectives 87, 181-182.
Burrell, P.C., Keller, J., and Blackall, L.L. (1998) Microbiology of a nitrite-oxidizing bioreactor. Applied and Environmental Microbiology 64 (5), 1878-83.
Carmel-Harel, O. and Storz, G. (2000) Roles of the glutathione- and thioredoxin-dependent reduction systems in the Escherichia coli and Saccharomyces cerevisiae responses to oxidative stress. Annual Reviews in Microbiology 54, 439-61.
Chain, P., Lamerdin, J., Larimer, F., Regala, W., Lao, V., Land, M., Hauser, L., Hooper, A., Klotz, M., Norton, J., Sayavedra-Soto, L., Arciero, D., Hommes, N., Whittaker, M., and Arp, D. (2003) Complete Genome sequence of the ammonia-oxidizing bacterium and obligate chemolithoautotroph Nitrosomonas europaea. Journal of Bacteriology 185 (9), 2759-2773.
Chandran, K. and Smets, B.F. (2000) Applicability of two-step models in estimating nitrification kinetics from batch respirograms under different relative dynamics of ammonia and nitrite oxidation. Biotechnology and Bioengineering 70 (1), 54-64.
Chen, Q., Janssen, D.B., and Witholt, B. (1995) Growth on octane alters the membrane lipid fatty acids of Pseudomonas oleovorans due to the induction of alkB and synthesis of octanol. Journal of Bacteriology 177 (23), 6894-901.
Chesney, J.A., Eaton, J.W., and Mahoney, J.R. (1996) Bacterial glutathione: a sacrificial defense against chlorine compounds. Journal of Bacteriology 178 (7), 2131-2135.
Christman, M.F., Morgan, R.W., Jacobson, F.S., and Ames, B.N. (1985) Positive control of a regulon for defenses against oxidative stress and some heat-shock proteins in Salmonella typhimurium. Cell 41, 753-762.
Cooper, G. (2000) The Cell - A Molecular Approach. ASM Press, Washington, D.C.
da Silveria, M.G., San Romao, M.V., Loueiro-Dais, M.C., Rombouts, F.M., and Abee, T. (2002) Flow cytometric assessment of membrane integrity of ethanol-stress Oenococcus oeni cells. Applied and Environmental Microbiology 68 (12), 6087-6093.
Daigger, G.T. and Sadick, T.E. (1998) Evaluation of methods to detect and control nitrification inhibition with specific application to incinerator flue-gas scrubber water. Water Environment Research 70 (7), 1248-1257.
de Smet, M.J., Kingma, J., and Witholt, B. (1978) The effect of toluene on the structure and permeability of the outer and cytoplasmic membranes of Escherichia coli. Biochimica et Biophysica Acta 506, 64-80.
DiSpirito, A.A., Lipscomb, J.D., and Hooper, A.B. (1986) Cytochrome aa3 from Nitrosomonas europaea. Journal of Biological Chemistry 261, 17048-17056.

59
Eisenstark, A., Calcutt, M. J., Becker-Hapak, M., and Ivanova, A. (1996) Role of Escherichia coli rpoS and associated genes in defense against oxidative damage. Free Radical Biology and Medicine 21 (7), 975-993.
Elmore, M.J., Lamb, A.J., Ritchie, G.Y., Douglas, R.M., Munro, A., Gajewska, A., and Booth, I.R. (1990) Activation of potassium efflux from Escherichia coli by glutathione metabolites. Molecular Microbiology 4 (3), 405-412.
Ensign, S.A., Hyman, M.R., and Arp, D.J. (1993) In vitro activation of ammonia monooxygenase from Nitrosomonas europaea by copper. Journal of Bacteriology 175 (7), 1971-80.
Ercal, N., Gurer-Orhan, H., and Aykin-Burns, N. (2001) Toxic metals and oxidative stress part I: mechanisms involved in metal induced oxidative damage. Current Topics in Medicinal Chemistry 1 (6), 529-539.
Ferguson, G.P., Munro, A., Douglas, R., McLaggan, D., and Booth, I.R. (1993) Activation of potassium channels during metabolite cetoxification in Escherichia coli. Molecular Microbiology 9 (6), 1297-1303.
Ferguson, G.P., Battista, J.R., Lee, A.T., and Booth, I.R. (2000) Protection of the DNA during the exposure of Escherichia coli cells to a toxic metabolite: the role of the KefB and KefC potassium channels. Molecular Microbiology 35 (1), 113-22.
Ferguson, G.P. and Booth, I.R. (1998) Importance of glutathione for growth and survival of Escherichia coli cells: detoxification of methylglyoxal and maintenance of intracellular K+. Journal of Bacteriology 180 (16), 4314-8.
Ferguson, G.P., Chacko, A.D., Lee, C.H., Booth, I.R., and Lee, C. (1996) The activity of the high-affinity K+ uptake system Kdp sensitizes cells of Escherichia coli to methylglyoxal. Journal of Bacteriology 178 (13), 3957-61.
Ferguson, G.P., Creighton, R.I., Nikolaev, Y., and Booth, I.R. (1998) Importance of RpoS and Dps in survival of exposure of both exponential- and stationary-phase Escherichia coli cells to the electrophile N-ethylmaleimide. Journal of Bacteriology 180 (5), 1030-6.
Ferguson, G.P., McLaggan, D., and Booth, I.R. (1995) Potassium channel by glutathione-S-conjugates in Escherichia coli: protection against methylglyoxal is mediated by cytoplasmic acidification. Molecular Microbiology 17, 1025-1033.
Ferguson, G.P., Nikolaev, Y., McLaggan, D., Maclean, M., and Booth, I.R. (1997) Survival during exposure to the electrophilic reagent N-ethylmaleimide in Escherichia coli: role of KefB and KefC potassium channels. Journal of Bacteriology 179 (4), 1007-12.
Ferguson, G.P. (1999) Protective mechanisms against toxic electrophiles in Escherichia coli. Trends in Microbiology 7 (6), 242-247.

60
Ferretti, J.J., McShan, W.M., Ajdic, D., Savic, D.J., Savic, G., Lyon, K., Primeaux, C., Sezate, S., Suvorov, A.N., Kenton, S., Lai, H. S., Lin, S.P., Qian, Y., Jia, H G., Najar, F.Z., Ren, Q., Zhu, H., Song, L., White, J., Yuan, X., Clifton, S.W., Roe, B.A., and McLaughlin, R. (2001) Complete genome sequence of an M1 strain of Streptococcus pyogenes. Proceedings of the National Academy of Sciences of the United States of America 98 (8), 4658-63.
Ficara, E. and Rozzi, A. (2001) pH-stat titration to assess nitrification inhibition. Journal of Environmental Engineering-ASCE 127 (8), 698-704.
Forrest, W.W. and Walker, D.J. (1971) The generation and utilization of energy during growth. Advances in Microbiology and Physiology 5, 213-274.
Franks, N.P. and Leib, W.R. (1984) Do general anaesthics act by competitive binding to specific receptors? Nature 310 (16), 599-601.
Fukumori, F., Hirayama, H., Takami, H., Inoue, A., and Horikoshi, K. (1998) Isolation and transposition mutagenesis of a Pseudomonas putida KT2442 toluene-resistant variant: involvent of an efflux system in solvent tolerance. Extremophiles 2 (4), 395-400.
Gaudy, A.F., Gaudy, E.T., Feng, Y.J., and Brueggemann, G. (1982) Treatment of cyanide waste by the extended aeration process. Journal Water Pollution Control Federation 54 (2), 153-164.
Gernaey, K., Verschuere, L., Luyten, L., and Verstraete, W. (1997) Fast and sensitive acute toxicity detection with an enrichment nitrifying culture. Water Environment Research 69 (6), 1163-1169.
Ginestet, P., Audic, J.M., Urbain, V., and Block, J.C. (1998) Estimation of nitrifying bacterial activities by measuring oxygen uptake in the presence of the metabolic inhibitors allylthiourea and azide. Applied and Environmental Microbiology 64 (6), 2266-2268.
Gonzalez-Flecha, B. and Demple, B. (1995) Metabolic sources of hydrogen peroxide in aerobically growing Escherichia coli. Journal of Biological Chemistry 270 (23), 13681-13687.
Gort, A.S., Ferber, D.M., and Imlay, J.A. (1999) The regulation and role of the periplasmic copper, zinc superoxide dismutase of Escherichia coli. Molecular Microbiology 32 (1), 179-191.
Grady Jr., C.P.L., Daigger, G.T., and Lim, H.C. (1999) Biological Wastewater Treatment, Second Edition. Marcel Dekker, Inc., New York, NY.
Grunditz, C. and Dalhammar, G. (2001) Development of nitrification inhibition assays using pure cultures of Nitrosomonas and Nitrobacter. Water Research 35 (2), 433-440.
Gupta, R.L., Saini, B.H., and Juneja, T.R. (1997) Nitroreductase independent mutagenicity of 1-halogenated-2,4- dinitrobenzenes. Mutat Res 381 (1), 41-7.
Harms, H., Koops, H.P., and Wehrmann, H. (1976) An ammonia-oxidizing bacterium, Nitrosovibrio tenuis nov.gen. nov.sp. Archives of Microbiology 108, 105-111.

61
Heidelberg, J. F., Eisen, J. A., Nelson, W. C., Clayton, R. A., Gwinn, M. L., Dodson, R. J., Haft, D. H., Hickey, E. K., Peterson, J. D., Umayam, L., Gill, S. R., Nelson, K. E., Read, T. D., Tettelin, H., Richardson, D., Ermolaeva, M. D., Vamathevan, J., Bass, S., Qin, H., Dragoi, I., Sellers, P., McDonald, L., Utterback, T., Fleishmann, R. D., Nierman, W. C., and White, O. (2000) DNA sequence of both chromosomes of the cholera pathogen Vibrio cholerae. Nature 406, 477-83.
Heipieper, H. and DeBont, J. (1994) Adaptation of Pseudomonas putida S12 to ethanol and toluene at the level of fatty acid composition of membranes. Applied and Environmental Microbiology 60 (12), 4440-4444.
Heipieper, H., Diefenbach, R., and Keweloh, H. (1992) Conversion of cis unsaturated fatty acids to trans, a possible mechanism for the protection of phenol-degrading Pseudomonas putida P8 from substrate toxicity. Applied and Environmental Microbiology 58, 1847-1852.
Heipieper, H.J., Keweloh, H., and Rehm, H.J. (1991) Influence of phenols on growth and membrane permeability of free and imobilized Escherichia coli. Applied and Environmental Microbiology 57, 1213-1217.
Hengge-Aronis, R. (1993) Survival of hunger and stress: the role of RpoS in early stationary phase gene regulation in E. coli. Cell 72, 165-168.
Hengge-Aronis, R. (2000) The general stress response in Escherichia coli. In: Storz, G. and Hengge-Aronis, R. (eds), Bacterial Stress Responses, pp. 161-178, ASM Press, Washington, D.C.
Hengge-Aronis, R. (2002) Signal transduction and regulatory mechanisms involved in control of the {sigma}S (RpoS) subunit of RNA polymerase. Microbiology and Molecular Biology Reviews 66 (3), 373-395.
Higgins, M.J. and Novak, J.T. (1997a) Dewatering and settling of activated sludges: the case for using cation analysis. Water Environment Research 69 (2), 225-232.
Higgins, M.J. and Novak, J.T. (1997b) The effect of cations on the settling and dewatering of activated sludges: laboratory results. Water Environment Research 69 (2), 215-224.
Hillaby, B.A. and Randall, D.J. (1979) Acute ammonia toxicity and ammonia excretion in rainbow trout (Salmo gairdneri). Journal of the Fish Research Board Canada 36 (6), 621-629.
Hockenbury, M.R. and Grady Jr., C.P.L. (1977) Inhibition of nitrification-effects of selected organic compounds. Journal Water Pollution Control Federation 768-777.
Hollocher, T.C., Tate, M.E., and Nicholas, D.J.D. (1981) Oxidationof ammonia by Nitrosomonas europaea: definitive 18O-tracer evidence that hydroxylamine formation involves a monooxygnease. Journal of Biological Chemistry 256, 10834-10836.
62
Holtwick, R., Meinhardt, F., and Keweloh, H. (1997) cis-trans Isomerization of unsaturated fatty acids: cloning and sequencing of the cti gene from Pseudomonas putida P8. Applied and Environmental Microbiology 63 (11), 4292-4297.
Hommes, N.G., Sayavedra-Soto, L.A. and Arp, D.J. Chemolithoorganotrophic growth of Nitrosomonas europaea on fructose. Journal of Bacteriology 185 (23), 6809-6814.
Hooper, A.B. and Terry, K.R. (1973) Specific inhibitors of ammonia oxidation in Nitrosomonas. Journal of Bacteriology 115 (2), 480-485.
Hooper, A.B., Vannelli, T., Bergmann, D.J., and Arciero, D.M. (1997) Enzymology of the oxidation of ammonia to nitrite by bacteria. Antonie Van Leeuwenhoek 71 (1-2), 59-67.
Hu, Z.Q., Chandran, K., Grasso, D., and Smets, B.F. (2003a) Impact of metal sorption and internalization on nitrification inhibition. Environmental Science and Technology 37 (4), 728-734.
Hu, Z.Q., Chandran, K., Grasso, D., and Smets, B.F. (2003b) Nitrification inhibition by ethylenediamine-based chelating agents. Environmental Engineering Science 20 (3), 219-228.
Hultberg, M. (1998) Rhizobacterial glutathione levels as affected by starvation and cadmium exposure. Current Microbiology 37 (5), 301-305.
In't Veld, G., Dreissen, A.J.M., Op den Kamp, J.A.F., and Konings, W.N. (1991) Hydrophobic membrane thickness and lipid-protein interactions of the leucine transport system of Lactococcus lactis. Biochimica et Biophysica Acta 1065, 203-212.
Ingram, L. (1977) Changes in lipid composition of Escherichia coli resulting from growth with organic solvents and with food additives. Applied and Environmental Microbiology 35 (5), 1233-1236.
Ingram, L.O. (1976) Adaptation of membrane lipids to alcohols. Journal of Bacteriology 125 670-678.
Isken, S. and de Bont, J.A. (1996) Active efflux of toluene in a solvent-resistant bacterium. Journal of Bacteriology 178 (20), 6056-6058.
Jackson, R.W. and de Moss, J.A. (1965) Effects of toluene on Escherichia coli. Journal of Bacteriology 90, 1420-1425.
Juliette, L.Y., Hyman, M.R., and Arp, D.J. (1993) Inhibition of ammonia oxidation in Nitrosomonas europaea by sulfur compounds: thioethers are oxidized to sulfoxides by ammonia monooxygenase. Applied and Environmental Microbiology 59 (11), 3718-3727.
Juliette, L.Y., Hyman, M.R., and Arp, D.J. (1995) Roles of bovine serum albumin and copper in the assay and stability of ammonia monooxygenase activity in vitro. Journal of Bacteriology 177 (17), 4908-4913.

63
Junker, F. and Ramos, J.L. (1999) Involvement of the cis/trans isomerase Cti in solvent resistance of Pseudomonas putida DOT-T1E. Journal of Bacteriology 181 (18), 5693-5700.
Keener, W.K. and Arp, D.J. (1994) Transformations of aromatic-compounds by Nitrosomonas europaea. Applied and Environmental Microbiology 60 (6), 1914-1920.
Kelly, D.P. (1978) Bioenergetics of chemolithotrophic bacteria. In: Bull, A.T. and Meadow, P.M. (eds), Companion to Microbiology, pp. 363-386, Longman, London.
Kelly II, R.T., Henriques, I.D.S., and Love, N.G. (2004) Chemical inhibition of nitrification in activated sludge. Biotechnology and Bioengineering 85 (6), 683-694.
Kieboom, J. and de Bont, J.A.M. (2000) Mechanisms of organic solvent tolerance in bacteria. In: Storz, G. and Hengge-Aronis, R. (eds), Bacterial Stress Responses, ASM Press, Washington, D.C.
Kieboom, J., Dennis, J., Zylstra, G., and DeBont, J. (1998a) Active efflux of organic solvents by Pseudomonas putida S12 is induced by solvents. Journal of Bacteriology 180 (24), 6769-6772.
Kieboom, J., Dennis, J.J., Bont, J.A.M.d., and Zylstra, G.J. (1998b) Identification and molecular characterization of an efflux pump involved in Pseudomonas putida S12 solvent tolerance. The Journal of Biological Chemistry 273 (1), 85-91.
Lee, Y.-W., Ong, S.-K., and Sato, C. (1997) Effects of heavy metals on nitrifying bacteria. Water Science and Technology 36 (12), 69-74.
Li, X.Z., Zhang, L., and Poole, K. (1998) Role of the multidrug efflux systems of Pseudomonas aeruginosa in organic solvent tolerance. Journal of Bacteriology 180 (11), 2987-2991.
Lo, T.W.C., Westwood, M.E., McLellan, A.C., Selwood, T., and Thornalley, P.J. (1994) Binding and modification of proteins under physiological conditions. Journal of Biological Chemistry 269, 32299-32305.
Lohner, K. (1991) Effects of small organic molecules on phospholipid phase transitions. Chemistry and Physics of Lipids 57, 341-352.
Lonetto, M., Gribskov, M., and Gross, C.A. (1992) The sigma 70 family: sequence conservation and evolutionary relationships. Journal of Bacteriology 174, 3843-3849.
Love, N.G., Dauphinais, J.L., Henriques, I.D.S., and Kelly II, R.T. (2002a) Project Report No. 2. Upset Early Warning Systems for Biological Treatment Processes - Phase II: Fundamental Studies on Source-Cause-Effect Relationships. January 2002. Alexandria, VA, Water Environment Research Foundation.
Love, N.G., Dauphinais, J.L., Henriques, I.D.S., and Kelly II, R.T. (2002b) Project Report No. 3. Upset Early Warning Systems for Biological Treatment Processes - Phase II: Fundamental Studies on Source-Cause-Effect Relationships. October 2002. Alexandria, VA, Water Environment Research Foundation.

64
Love, N.G., Dauphinais, J.L., Henriques, I.D.S., and Kelly II, R.T. (2003) Project Report No. 4. Upset Early Warning Systems for Biological Treatment Processes - Phase II: Fundamental Studies on Source-Cause-Effect Relationships. April 2003. Alexandria, VA, Water Environment Research Foundation.
Ludzack, F.J. and Schaffer, R.B. (1962) Activated sludge treatment of cyanide, cyanate and thiocyanate. Journal Water Pollution Control Federation 34, 320-341.
Ma, D., Alberti, M., Lynch, C., Nikaido, H., and Hearst, J.E. (1996) The local repressor AcrR plays a modulating role in the regulation of acrAB genes of Escherichia coli by global stress signals. Molecular Microbiology 19 ,101-112.
Ma, D., Cook, D.N., Alberti, M., Pon, N.G., Nikaido, H., and Hearst, J.E. (1995) Genes acrA and acrB encode a stress-induced efflux system of Escherichia coli. Molecular Microbiology 16, 45-55.
Magnuson, K., Jackowski, S., Rock, C.O., and Cronan, J.E. Jr. (1993) Regulation of fatty acid biosynthesis in Escherichia coli. Microbiological Reviews 57 (3), 522-542.
Martinez, A. and Kolter, R. (1997) Protection of DNA during oxidative stress by the nonspecific DNA- binding protein Dps. Journal of Bacteriology 179 (16), 5188-5194.
Matin, A. (1978) Organic nutrition of chemolithotrophic bacteria. Annual Reviews of Microbiology 32, 433-468.
McClintock, S., Randall, C., and Pattarkine, V. (1993) Effects of temperature and mean cell residence time on biological nutrient removal processes. Water Environment Research 65 (2), 110-118.
McKim, J., Schmieder, P., Carlson, R., Hunt, E., and Niemi, G. (1987) Use of respiratory-cardiovascular responses of rainbow trout (Salmo gairdneri) in identifying acute toxiciy syndromes in fish: Part 1. pentachlorophenol, 2,4-dinitrophenol, Tricaine, methanesulfonate, and 1-octanol. Environmental Toxicology and Chemistry 6 ,295-312.
McLaggan, D., Rufino, H., Jaspars, M., and Booth, I. R. (2000) Glutathione-dependent conversion of N-ethylmaleimide to the maleamic acid by Escherichia coli: an intracellular detoxification process. Applied and Environmental Microbiology 66 (4), 1393-9.
Meincke, M., Bock, E., Kastrau, D., and Kroneck, P.M.H. (1992) Nitrite oxidoreductase from Nitrobacter hamburgensis - redox centers and their catalytic role. Archives of Microbiology 158 (2), 127-131.
Michan, C., Manchado, M., Dorado, G., and Pueyo, C. (1999) In vivo transcription of the Escherichia coli oxyR regulon as a function of growth phase and in response to oxidative stress. Journal of Bacteriology 181 (9), 2759-2764.

65
Miller, S., Douglas, R.M., Carter, P., and Booth, I.R. (1997) Mutations in the glutathione-gated KefC K+ efflux system of Escherichia coli that cause constitutive activation. Journal of Biological Chemistry 272 (40), 24942-24947.
Ness, L., Ferguson, G., Nikolaev, Y., and Booth, I. (1997) Survival of Escherichia coli cells exposed to iodoacetate and chlorodinitrobenzene is independent of the glutathione-gated K+ efflux systems KefB and KefC. Applied and Environmental Microbiology 63 (10), 4083-4086.
Neufeld, R. , Greenfeld, J., and Rieder, B. (1986) Temperature, cyanide and phenolic nitrification inhibition. Water Research 20, (5), 633-642.
Nicholls, D.G. and Ferguson, S.J. (1992) Bioenergetics 2. Academic Press, London.
Novak, J.T., Love, N.G., Smith, M.L., and Wheeler, E.R. (1998) The effect of cationic salt addition on the settling and dewatering properties of an industrial activated sludge. Water Environment Research 70, (5), 984-996.
O'Kelly, J.C., Becker, G.E., and Nason, A. (1970) Characterization of the particulate nitrite oxidase and its component activities from the chemoautotroph Nitrobacter agilis. Biochimica et Biophysica Acta 205, 409-425.
Okuyama, H., Okajima, N., Saski, S., Higashi, S., and Murata, N. (1991) The cis/trans isomerization of the double bond of a fatty acid as a strategy for adaptation to changes in ambient temperature in the psychrophilic bacterium Vibrio sp. strain ABE-1. Biochimica et Biophysica Acta 1084, 13-20.
Papoulis, A., Al-Abed, Y., and Bucala, R. (1995) Identification of N2-(1-carboxyethyl) guanine (CEG) as a guanine advance glycosylation end product. Biochemistry 34, 648-655.
Park, M.K., Myers, R.A.M., and Marzella, L. (1993) Hyperoxia and prolongation of aminoglycoside-induced postantibiotic effect in Pseudomonas aeruginosa - role of reactive oxygen species. Antimicrobial Agents and Chemotherapy 37 (1), 120-122.
Paulsen, I.T., Brown, M.H., and Skurray, R.A. (1996) Proton-dependent multidrug efflux systems. Microbiological Reviews 60 (4), 575-608.
Paxeus, N. (1996) Organic pollutants in the effluents of large wastewater treatment plants in sweden. Water Research 30 (5), 1115-1122.
Pinkart, H.C., Wolfram, J.W., Rogers, R., and White, D.C. (1996) Cell envelope changes in solvent-tolerant and solvent-sensitive Pseudomonas putida strains following exposure to o-xylene. Applied and Environmental Microbiology 62 (3), 1129-1132.
Poduska, R.A. and Andrews, J.F. (1974) Dynamics of nitrification in the activated sludge process. Proceedings of the 29th Industrial Waste Conference, 145.

66
Poole, K., Tetro, K., Zhao, Q., Neshat, S., Heinrichs, D.E., and Bianco, N. (1996) Expression of the multidrug resistance operon mexA-mexB-oprM in Pseudomonas aeruginosa: mexR encodes a regulator of operon expression. Antimicrobial Agents and Chemotherapy 40 (9), 2021-2028.
Princic, A., Mahne, I., Megusar, F., Paul, E. A., and Tiedje, J. M. (1998) Effects of pH and oxygen and ammonia concentrations on the community structure of nitrifying bacteria from wastewater. Applied and Environmental Microbiology 64 (10), 3584-3590.
Ramos, J.L., Duque, E., Rodriguez-Herva, J.J., Godoy, P, Haidour, A., Reyes, F., and Fernandez-Barrero, A. (1997) Mechanisms for solvent tolerance in bacteria. Journal of Biological Chemistry 272 (7), 3887-3890.
Ren, S.J. (2004) Assessing wastewater toxicity to activated sludge: recent research and developments. Environment International 30 (8), 1151-1164.
Sak, B.D., Eisenstark, A., and Touati, D. (1989) Exonuclease III and the catalase hydroperoxidase II in Escherichia coli are both regulated by the katF gene product. Proceedings of the National Academy of Sciences of the United States of America 86 (9), 3271-3275.
Sarma, S.S.S., Mangas-Ramirez, E., and Nandini, S. (2003) Effect of ammonia toxicity on the competition among three species of cladocerans (Crustacea: Cladocera). Ecotoxicology and Environmental Safety 55 (2), 227-235.
Sato, C., Leung, S.W., and Schnoor, J.L. (1988) Toxic response of Nitrosomonas europaea to copper in inorganic medium and wastewater. Water Research 22 (9), 1117-1127.
Sayavedra-Soto, L.A., Hommes, N.G., and Arp, D.J. (1994) Characterization of the gene encoding hydroxylamine oxidoreductase in Nitrosomonas europaea. Journal of Bacteriology 176 (2), 504-510.
Seeman, P. and Roth, S. (1972) General anesthetics expand cell membranes at surgical concentrations. Biochimica et Biophysica Acta 255, 171-177.
Sikkema, J., de Bont, J.A., and Poolman, B. (1994) Interactions of cyclic hydrocarbons with biological membranes. Journal of Biology and Chemistry 269 (11), 8022-8028.
Sikkema, J., DeBont, J., and Poolman, B. (1995) Mechanism of membrane toxicity of hydrocarbons. Mictobiological Reviews 59 (2), 201-222.
Sikkema, J. , Poolman, B., Konings, W.N., and de Bont, J.A.M. (1992) Effects of the membrane action of tetralin on the functinal and structural properties of artificial and bacterial membranes. Journal of Bacteriology 174 2986-2992.
Stohs, S.J. and Bagchi, D. (1995) Oxidative mechanisms in the toxicity of metal ions. Free Radical Biology & Medicine 18 (2), 321-336.
Storz, G. and Zheng, M. (2000) Oxidative Stress. In: Storz, G. and Hengge-Aronis, R. (eds), Bacterial Stress Responses, pp. 47-59, ASM Press, Washington, D.C.

67
Stover, C. K., Pham, X. Q., Erwin, A. L., Mizoguchi, S. D., Warrener, P., Hickey, M. J., Brinkman, F. S., Hufnagle, W. O., Kowalik, D. J., Lagrou, M., Garber, R. L., Goltry, L., Tolentino, E., Westbrock-Wadman, S., Yuan, Y., Brody, L. L., Coulter, S. N., Folger, K. R., Kas, A., Larbig, K., Lim, R., Smith, K., Spencer, D., Wong, G. K., Wu, Z., Paulsen, I. T., Reizer, J., Saier, M. H., Hancock, R. E., Lory, S., and Olson, M. V. (2000) Complete genome sequence of Pseudomonas aeruginosa PA01, an opportunistic pathogen. Nature 406, 959-64.
Summer, K.-H. and Göggelmann, w. (1980) Mutagenicity of 1-fluoro-2, 4-dinitrobenzene is affected by bacterial glutathione. Mutation Research 70, 173-178.
Sundermeyer-Klinger, H., MeyerW., Warninghoff, B., and Bock, E. (1984) Membrane-bound nitrite oxidoreductase of Nitrobacter: evidence for a nitrate reductase system. Archives of Microbiology 140, 153-158.
Suzuki, I., Dular, U., and Kwok, S.C. (1974) Ammonia or ammonium ion as substrate for oxidation by Nitrosomonas europaea cells and extracts. Journal of Bacteriology 120 (1), 556-8.
Tanaka, Y., FukumoriY., and Yamanaka, T. (1983) Purification of cytochrome a1c1 from Nitrobacter agilis and characterization of nitrite oxidation system of the bacterium. Archives of Microbiology 135, 265-271.
Tomlinson, T.G., Boon, A.G., and Trotman, C.N. (1966) Inhibition of nitrification in the activated sludge process of sewage disposal. Journal of Applied Bacteriology 29 (2), 266-91.
Tse-Dinh, Y. C. (2000) Increased sensitivity to oxidative challenges associated with topA deletion in Escherichia coli. Journal of Bacteriology 182 (3), 829-32.
Vattanaviboon, P., Sriprang, R., and Mongkolsuk, S. (2001) Catalase has a novel protective role against electrophile killing of Xanthomonas. Microbiology 147 (2), 491-8.
Veith, G.D., Call, D.J., and Brook, L.T. (1983) Structure-toxicity relationships for the fathead minnow, Pimephelas promelas: Narcotic industrial chemicals. Canadian Journal of Fish and Aquatic Sciences 40, 743-748.
Vido, K., Spector, D., Lagniel, G., Lopez, S., Toledano, M.B., and Labarre, J. (2001) A proteome analysis of the cadmium response in Saccharomyces cerevisiae. The Journal of Biological Chemistry 276 (11), 8469-8474.
Vuilleumier, S. (1997) Bacterial glutathione S-transferases: what are they good for ? Journal of Bacteriology 179 (5), 1431-1441.
Wagner, M. and Loy, A. (2002) Bacterial community composition and function in sewage treatment systems. Current Opinions in Biotechnology 13, 218-227.
Watson, S.W. (1965) Characteristics of a marine nitrifying bacterium, Nitrosocystis oceanus sp.n. Limnology and Oceanography (Suppl.) 10, R274-R279.

68
Watson, S.W., Bock, E., Valois, F.W., Waterbury, J.B. , and Schlosser, U. (1986) Nitrospira marina gen.nov. sp.nov.: a chemolithotrophic nitrite-oxidizing bacterium. Archives of Microbiology 144, 1-7.
Watson, S.W., Graham, L.B., Remsen, S.C., and Valois, F.W. (1971) A lobular, ammonia-oxidizing bacterium, Nitrsolobus multiformis nov.gen. nov.sp. Archives of Microbiology 76, 183-203.
Watson, S.W. and Waterbury, J.B. (1971) Characteristics of two marine nitrite oxidizing bacteria, Nitrospina gracilis nov.gen. nov.sp. and Nitrococcus mobilis nov.gen. nov.sp. Archives of Microbiology 77, 203-230.
Weber, A.S. and Sherard, J.H. (1980) Effects of cadmium on the completely mixed activated sludge process. Journal Water Pollution Control Federation 52, 2378.
Weber, F.J. and de Bont, J.A.M. (1996) Adaptation mechanisms of microorganisms to the toxic effects of organic solvents on membranes. Biochimica et Biophysica Acta 1286[3], 225-245.
White, D. (2000) The Physiology and Biochemistry of Prokaryotes. Oxford University Press, New York, NY.
White, D.G., Goldman, J.D., Demple, B., and Levy, S.B. (1997) Role of the acrAB locus in organic solvent tolerance mediated by expression of marA, soxS, or robA in Escherichia coli. Journal of Bacteriology 179 (19), 6122-6.
Wicks, B.J., Joensen, R., Tang, Q., and Randall, D.J. (2002) Swimming and ammonia toxicity in salmonids: the effect of sub lethal ammonia exposure on the swimming performance of coho salmon and the acute toxicity of ammonia in swimming and resting rainbow trout. Aquatic Toxicology 59 (1-2), 55-69.
Winogradsky, S. (1892) Contributions a la morphologie des organismes de la nitrification. Archives of Science and Biology 1, 86-137.
Winogradsky, S. and Winogradsky, H. (1933) Etudes sur la microbiologies du sol. Nouvelles recherches sur les organismes de la nitrification. Ann. Inst. Pasteur 50, 350-432.
Woldringh, C.L. (1973) Effects of toluene and phenylethyl alcohol on the ultrastructure of Escherichia coli. Journal of Bacteriology 114, 1359-1361.
Wood, L.B., Hurley, B.J.E., and Matthews, P.J. (1981) Some observations on the biochemistry and inhibition of nitrification. Water Research 15, 543-551.
Wood, N.J. and Sorensen, J. (2001) Catalase and superoxide dismutase activity in ammonia-oxidising bacteria. FEMS Microbiology Ecology 38 (1), 53-58.
Wood, P.M. (1986) Nitrification as a bacterial energy source. In: Prosser, J.I. (ed), Nitrification, pp. 39-62, IRL Press, Oxford.

69
Wu, J. and Weiss, B. (1992) Two-stage induction of the soxRS (superoxide response) regulon of Escherichia coli. Journal of Bacteriology 174 (12), 3915-3920.
Zahn, J.A., Arciero, D.M., Hooper, A.B., and DiSpirito, A.A. (1996) Evidence for an iron center in the ammonia monooxygenase from Nitrosomonas europaea. FEBS Letters 397 (1), 35-8.
70
3 CHEMICAL INHIBITION OF NITRIFICATION IN ACTIVATED SLUDGE
The full article was published in March 2004 issue of Biotechnology and Bioengineering. Reference for this article and a web-link to the article are as follows: Kelly II, R.T., Henriques, I.D.S., and Love, N.G. (2004) Chemical inhibition of nitrification in activated sludge. Biotechnology and Bioengineering 85 (6), 683-694. http://www3.interscience.wiley.com/cgi-bin/fulltext/107599509/PDFSTART

71
4 ULTRAVIOLET SPECTROPHOTOMETRIC DETERMINATION OF NITRATE: DETECTING NITRIFICATION RATES AND INHIBITION
4.1 Abstract
Nitrification is an important process in wastewater treatment that, unfortunately, can be
easily upset by toxic industrial chemicals. Such upset events can lead to treatment facilities
exceeding discharge permits and facing fines. It is therefore important to detect nitrification
inhibition quickly so upset events can be prevented or controlled. The objective of this study
was to develop a rapid method for measuring and detecting nitrification inhibition by using
nitrate generation rates (NGRs). A method using ultraviolet spectrophotometry at wavelengths
between 225 and 240 nm without chemical manipulation was developed to measure NGRs and
was verified against ion chromatography. The method was shown to quickly and accurately
measure nitrate concentrations after correcting for nitrite interference. Additionally, cadmium,
chlorine and 1-chloro-2,4-dintrobenzene (CDNB) were tested for nitrification inhibition using
this method. Of these, CDNB was found to cause a correctable interference with the test. Only
chlorine provided an uncorrectable interference for this method.
Key Words: Nitrification Inhibition, Detection, Method Protocol, UV, Ultraviolet
Spectrophotometry, Industrial Toxin
4.2 Introduction
Ammonia toxicity to aquatic systems has been well documented (Sarma et al., 2003;
Hillaby and Randall, 1979; Wicks et al., 2002). Because of its toxicity, ammonia discharge into
receiving waters is strictly regulated and regulatory agencies throughout the world are
continually decreasing the amount of ammonia and total nitrogen that can be discharged into
receiving waters. As discharge limits are lowered, ammonia conversion and nitrogen removal
processes become increasingly important. Although new treatment processes for ammonia
removal, such as anaerobic ammonia oxidation, are gaining in popularity, the most widely used
processes for ammonia and total nitrogen removal in a broad range of wastewater applications is
still conventional aerobic, autotrophic nitrification.
Nitrification has been found to be one of the most sensitive wastewater treatment
processes prone to upset by industrial chemicals (Tomlinson et al., 1966; Kelly II et al., 2004;

72
Blum and Speece, 1991; Wood et al., 1981). As nitrification is inhibited by unexpected shock
loads of industrial influents, increases in effluent discharges of ammonia and total nitrogen can
occur and cause a treatment facility to exceed discharge limits. This can lead to heavy fines and
penalties for the facility, and leave the downstream environment susceptible to damage. Clearly,
it is very important to quickly and accurately detect nitrification inhibition in order to prevent
upset of the process before it occurs.
Currently, nitrification inhibition in wastewater treatment can be determined using
several methods. Of these, respirometry, which measures oxygen uptake rate (Hu et al., 2003;
Tomlinson et al., 1966), and nitrate generation rate (NGR) (Gernaey et al., 1997; Kelly II et al.,
2004; Neufeld et al., 1986), which determines the nitrate production rate, are most commonly
used. Another method for determining nitrification rates and inhibition uses titrimetric
techniques that examine nitrification rates based on the rate of base addition for pH stabilization
(Ficara and Rozzi, 2001). Of these, only NGR provides a direct measure of the nitrification rate
because it measures the production rate of nitrate, a unique product of nitrification.
One setback of using NGR versus respirometry or titrimetric techniques is that
measurement of nitrate in wastewater is time consuming and difficult to perform with continuous
monitoring. The most commonly accepted methods for measuring nitrate include colorimetric
methods and ion chromatography (APHA, 1998). Analysis by ion chromatography can be slow,
while colorimetry for nitrate involves its catalytic reduction to nitrite before detection, plus the
catalysts generate hazardous waste that requires costly disposal. Nitrate ion selective electrodes
show more promise because they provide quick measurements and have been applied
successfully. Unfortunately concentration drift can occur when they are used in wastewater
samples, which requires frequent re-calibration of the probes (Pedersen et al., 2002). Another
technology that can be used for nitrate detection is direct ultraviolet (UV) spectrophotometry
without chemical manipulation. This technique has been used to monitor nitrate in full-scale
wastewater treatment facilities and provides rapid readings of nitrate concentration (Neu, 1995;
Chevalier et al., 2002).
Because of strict time limitations for monitoring nitrification at full-scale facilities and
during laboratory experiments, a rapid, accurate, and sensitive test for detecting nitrification
inhibition using a direct measure of nitrification rates is needed. UV detection of nitrate has not
been directly applied to determining NGRs, but we believed this analytical approach is

73
promising for applying to NGR analyses. Therefore, the objective of this study was to adapt UV
spectrophotometric techniques for measuring nitrate into a new simple and rapid monitoring
technique for NGR analysis so that the impact of wastewaters on nitrification can be rapidly
detected.
4.3 Methodology
4.3.1 Mixed Liquor Source Description and Sample Treatment
Mixed liquor was obtained the morning of each experiment from the Blacksburg-VPI
Wastewater Treatment Facility at Stroubles Creek. The treatment process at the Stroubles Creek
facility consists of a nitrifying activated sludge treatment process with a 10-14 day solids
retention time (SRT). Mixed liquor grab samples were taken directly from the aerated mixed
liquor basins and transported to the laboratory within 20 minutes. The mixed liquor samples
were aerated, magnetically mixed, and continuously fed a synthetic wastewater solution as
previously described (Kelly et al., 2004) to mimic the average feed loading conditions at the
Stroubles Creek facility and to maintain a constant biomass composition for experiments. The
total volume of feed solution used was less than 2% of the volume of mixed liquor so suspended
solid concentrations were not significantly changed throughout the experiment (8-10 hours).
This was confirmed by measuring mixed liquor volatile suspended solids at various times during
the experiment.
4.3.2 Nitrate Generation Rate Using UV spectrophotometry
To determine the NGR of the mixed liquor nitrifying community, 200 ml of mixed liquor
was added to each of two 300 ml biochemical oxygen demand bottles to obtain duplicate
measurements. The bottles were magnetically mixed and continuously aerated for the duration
of the NGR test. These mixed liquor “reactors” were then spiked with (NH4)2SO4 so that the
ammonia concentration in each reactor was 20 mg/L-N. This was done to achieve an initial
NH4+-N concentration well above the half saturation constant (KNH) for nitrification, which is
typically around 1 mg/L-N (Grady et al., 1999), in order to ensure measurement of the maximum
NGR. Once the ammonia was added, ten ml samples were collected from each bottle every 10
minutes for 50 minutes. Samples were centrifuged for 3 minutes at 3400xg to pellet the solids.
The supernatant was then removed and filtered through a 0.45 µm nitrocellulose filter for
analysis. A Beckman DU 640 UV/Vis spectrophotometer (Beckman Coulter, Inc., Fullerton,

74
CA) was used for nitrate analysis. Absorbance readings (zeroed against distilled water) were
taken in a quartz cuvette at a single optimum wavelength between 225 and 240 nm that was
determined to be the optimum wavelength based on peak absorbance readings on the day of the
experiment. The absorbance readings were then compared to a standard curve, which was
prepared as described below.
Standard curves for nitrate were developed by making nitrate standards in mixed liquor
filtered through a 0.45 µm filter on the day of the experiment (0-20 mg/L nitrate added).
Standards were made in mixed liquor so that interferences in the matrix would be common, and
therefore negated, between standards and samples. The baseline nitrate concentration of the
mixed liquor was measured using ion chromatography as described below. The known amounts
in the standards were calculated by adding the IC measured baseline nitrate concentration to the
known amount of chemical added. Standards were then measured for UV absorbance as
described above. A plot of nitrate concentration versus absorbance yielded a linear standard
curve to which a linear regression was performed (best fit determined by least squares analysis,
Sigma Plot 8.0®) and nitrate concentrations in unknowns were calculated from absorbance
readings.
Because nitrite was found to interfere with UV determination of nitrate, nitrite
concentrations were measured and subtracted from the UV-determined nitrate readings. Nitrite
concentrations for each sample were determined colorimetrically according to method 4110 B as
described in Standard Methods (APHA, 1998) and analyzed using the Beckman DU 640 UV/Vis
spectrophotometer. These concentrations were then converted to absorbance by developing a
UV nitrite standard curve in the same manner as described for nitrate below. The UV
absorbance of nitrite was found to be linear with Sigma Plot 8.0® and independent of the nitrate
concentration. At 229 nm, every 1 mg/L-N nitrite showed an absorbance of 0.10, while at 235
nm, the absorbance per 1 mg/L-N nitrite was 0.045. The absorbance associated with the
measured nitrite concentration was calculated using this relationship and was subtracted from the
total absorbance readings for each sample in order to get a nitrate absorbance reading. The
nitrate absorbance readings were then converted to nitrate using the nitrate standard curve.
To determine the NGR, the calculated nitrate concentrations were plotted with time for a
given reactor. The linear slope of this curve (best fit determined by least squares analysis, Sigma

75
Plot 8.0®) gave the nitrate concentration generated with time. This was normalized to the
MLVSS concentration to give the NGR, in mg-N/min-g MLVSS.
4.3.3 Determining Nitrification Inhibition Using NGR
The UV spectrophotometric method was evaluated as a basis for determining nitrification
inhibition using three different chemical inhibitors: cadmium, 1-chloro-2,4-dinitrobenzene
(CDNB), and chlorine. Inhibited or “shocked” reactors were prepared by adding varying
concentrations of the chemical contaminants to yield NGRinhibited. Control reactors, to which no
contaminant was added, were run simultaneously to generate NGRcontrol, and served as a basis for
comparisons. NGR tests were then run in duplicate according to the method listed above.
Equation 1 was used to calculate the percent inhibition caused by each concentration of a given
contaminant.
Percent Inhibition = %100NGR
NGRNGR
control
inhibitedcontrol ×−
[Equation 1]
4.3.4 Analytical Procedures
Mixed liquor total (MLSS) and volatile (MLVSS) suspended solids were measured in
duplicate according to sections 2540 D and 2540 E of Standard Methods (APHA, 1998).
Samples for nitrate and nitrite were analyzed using either UV spectrophotometry, as described
above, or ion chromatography (IC). For IC analysis, samples were taken from the mixed liquor
and centrifuged at 3400xg for 2 minutes. The supernatant was then filtered through a 0.45 µm
nitrocellulose filter and stored at -20oC for no more than 28 days prior to analysis. Nitrate and
nitrite were analyzed in duplicate using a Dionex DX120 suppressed conductivity ion
chromatograph with an AS14 anion separation column and an AG14 guard column. Samples
were carried in an eluent of 3.5 mM Na3CO3 and 1.0 mM NaHCO2.
4.4 Results and Discussion
4.4.1 UV Method Precision and Bias
Precision and bias of this method were determined according to Standard Methods
section 1040 B (APHA, 1998) using 7 replicates of several different standards (Table 4.1). For
the method validation tests, standard curves were developed at 229 and 235 nm, which were the
wavelengths used for all tests. At 229 nm, the precision did not exceed 0.33 mg/L-N and the
bias did not exceed -0.3 mg/L-N for either 7.1 or 26.1 mg/L-N nitrate. For 235 nm tests, the

76
precision and bias for both concentrations did not exceed 0.10 and 0.09 mg/L-N, respectively.
The lower precision and bias noted at 235 nm may be due to a higher correlation coefficient for
the linearly fitted data. The higher correlation at 235 nm was due to the lower absorbance
response for a given nitrate concentration, which meant that the response at 229 nm was only
linear to a nitrate concentration of about 25-30 mg/L-N. Detection limits for UV determination
of nitrate in water and wastewater solutions have been previously documented to range from 0.1
to 25.0 mg/L nitrate (Melchert and Rocha, 2005; Ferree and Shannon, 2001); however, because
the wastewater matrix used as a solvent for standards in this protocol inherently contained nitrate
above 3 mg/L, the method detection levels for this protocol could not be determined in the
wastewater matrix. For the instrument used, standards made in distilled water had a linear
detection range of 0.01-50 mg/L-N for nitrate measured at 229 nm, 0.01-100 mg/L-N for nitrate
measured at 235 nm, and 0.01-50 mg/L-N for nitrite measured at both 229 and 235 nm.
Table 4.1 Precision and bias for the UV measured nitrate method for 7.1 and 26.1 mg/L-N nitrate measured at 229 and 235 nm.a,b
RESULTS AT 229 NM
Total Absorbance = 0.0502*Nitrate Concentration (mg/L-N) + 0.4885, R2=0.9981c 7.1 mg/L NO3
--N 26.1 mg/L NO3--N
Precision Bias Precision Bias 0.13 mg/L-N -0.12 mg/L-N 0.33 mg/L-N -0.30 mg/L-N
RESULTS AT 235 NM
Total Absorbance = 0.0165*Nitrate Concentration (mg/L-N) + 0.2382, R2=0.9997c 7.1 mg/L NO3
--N 26.1 mg/L NO3--N
Precision Bias Precision Bias 0.10 mg/L-N -0.09 mg/L-N 0.07 mg/L-N 0.06 mg/L-N
aAll numbers are based on statistical analysis of 7 replicate measurements. bEquations given for the standard curves were developed using a minimum of 5 different standard concentrations. cFor each standard curve, duplicate absorbance measurements were made for each standard. 4.4.2 Optimum Wavelength Determination
Using UV wavelength scans, the optimum wavelength for detecting the nitrate
concentration in most wastewater samples was found to be 229 nm. Scans were performed by
reading absorbance every 1 nm between 200 and 300 nm using filtered (0.45 µm nitrocellulose
filter) mixed liquor that was spiked with known, increasing concentrations of nitrate. Nitrate
concentrations for these standards were also measured in the filtered mixed liquor using ion

77
chromatography so that the exact concentrations could be known for the scans. After examining
the scans of several different mixed liquor samples and nitrate concentrations, it became obvious
that excessive noise was present below 225 nm and absorbance response was too low above 240
nm (Figure 4.1). Therefore, 225 to 240 nm was chosen as the wavelength range to examine the
linearity of nitrate absorbance. The standard curves developed for several wavelengths between
225 and 240 nm were compared for (i) goodness of fit, as measured with R2 values, (ii) the
ability to provide reproducible regressions over several days with freshly prepared standards, and
(iii) the ability to maintain a high absorbance response and resolution for nitrate (Figure 4.2).
229 nm was chosen as the wavelength to use for most UV nitrate analysis because of the high
goodness of fit, reproducibility, resolution, and response. All calibration curves developed for
nitrate were developed using this wavelength, and curves look like those presented in Figure 4.2.
Exceptions to using this wavelength for analysis are discussed below.
Wavelength (nm)
200 220 240 260 280 300
Tota
l Abs
orba
nce
0
1
2
3
4
9.3 mg/L N 15.3 mg/L N 25.3 mg/L N 35.3 mg/L N
Figure 4.1 Wavelength scan of nitrate absorbance in filtered mixed liquor. Nitrate concentrations are given in mg/L as nitrogen. Distilled water scan showed 0 absorbance over the wavelength range.

78
Nitrate Concentration (mg/L-N)
10 20 30 40
Tota
l Abs
orba
nce
0.0
0.5
1.0
1.5
2.0
2.5227 nm 228 nm 229 nm 230 nm 231 nm 232 nm
R2=0.978
R2=0.994
R2=0.997
R2=0.999
R2=0.999
R2=0.999
Figure 4.2 Linearity of UV absorbance with increasing nitrate concentration for wavelengths
from 227 to 232 nm. R2 values reflect the goodness of fit for the linear regressions shown.
4.4.3 Nitrite Interference
Nitrite in the mixed liquor provided an interference to UV nitrate measurements that
could be corrected. The interference was discovered when the accuracy of the UV method for
detecting nitrate was checked using ion chromatography. The check revealed that the UV
method over-predicted the nitrate concentration by as much as 40% when nitrite was present at
concentrations as low as 2 mg/L (data in Appendix B). As nitrite is also measured using UV
spectrophotometry (Thomas et al., 1996; Ferree and Shannon, 2001; Chevalier et al., 2002),
experiments were performed to determine if it was interfering with nitrate readings. Results
showed that low concentrations of nitrite provided significant absorbance within the same
wavelength range that nitrate was measured (Figure 4.3). In addition, the absorbance
measurements showed that the slope describing nitrite absorbance did not change with increasing
concentrations of nitrate; indicating nitrite absorbance is linear and additive in the same
wavelength range as nitrate. Because of the linear, additive properties of nitrite absorbance,
absorbance due to nitrite was subtracted from the total absorbance readings to give the net
absorbance indicative of only the nitrate concentration. After correcting the absorbance readings

79
for nitrite, comparisons of UV measurements to IC measurements showed very similar results
(Table 4.2), indicating that the nitrite corrected UV method provides accurate nitrate
measurements.
Nitrite Concentration (mg/L-N)
0.0 0.5 1.0 1.5 2.0 2.5 3.0
Tota
l Abs
orba
nce
0.4
0.6
0.8
1.0
1.2
1.4 MLML + 5 mg/L NO3
-
ML + 15 mg/L NO3-
Y=0.098*X+0.566R2=0.980
Y=0.105*X+0.701
Y=0.100*X+1.051
R2=0.995
R2=0.997
Figure 4.3 Linearity of nitrite UV absorbance in mixed liquor (ML) measured at 229 nm;
ML contained 7.3 mg/L inherent NO3-. Different lines correspond to increasing
concentrations of nitrate in the mixed liquor. R2 values reflect the goodness of fit for the linear regressions shown.

80
Table 4.2 Comparison of nitrite corrected UV measured nitrate concentrations to ion chromatography (IC) measured nitrate concentrations. Number given is average of 4 measurements ± (standard deviation).
UV Measured Nitrate
Concentration (mg/L-N) IC Measured Nitrate
Concentration (mg/L-N) 10.5 ± (0.3) 10.4 ± (0.3)
11.4 ± (0.5) 11.3 ± (0.4)
12.3 ± (0.6) 12.0 ± (0.4)a
12.5 ± (0.5) 12.6 ± (0.2)
13.6 ± (0.7) 13.6 ± (0.4)
14.1 ± (0.5) 14.2 ± (0.3) aAverage and standard deviation are of 3 measurements. 4.4.4 Inhibitory Compound Interference
When testing the UV NGR method using inhibitory compounds, CDNB caused a
correctable interference within the wavelength range. The measured interference for CDNB was
found when cadmium, chlorine and CDNB were each examined for absorbance in the UV range
used to measure nitrate before performing complete inhibition tests using the UV method. Of the
three compounds examined, only CDNB was found to absorb in the wavelength range for nitrate
measurements as cadmium and chlorine were not found to directly interfere with nitrate
detection. This was expected, as others have used UV spectrophotometry to analyze for the
presence, type, and concentration of aromatic compounds (Touraud et al., 1998; Dixit and Ram,
1996). Although it interfered at the measured wavelengths, nitrate readings could be corrected
by subtracting the absorbance due to the added concentration of CDNB. The only change to the
original UV method was that the optimum wavelength for a linear response of nitrate readings
was shifted from 229 to 235 nm due to the additional absorbance caused by CDNB (data in
Appendix B).
Although chlorine was not found to directly interfere with UV nitrate determination, the
IC measured results with mixed liquor did not match those found using the UV detection.
Therefore, we concluded that toxins that react readily with organic matter, like chlorine, are
problematic for the UV NGR method because the reactions/interactions affect the absorbance
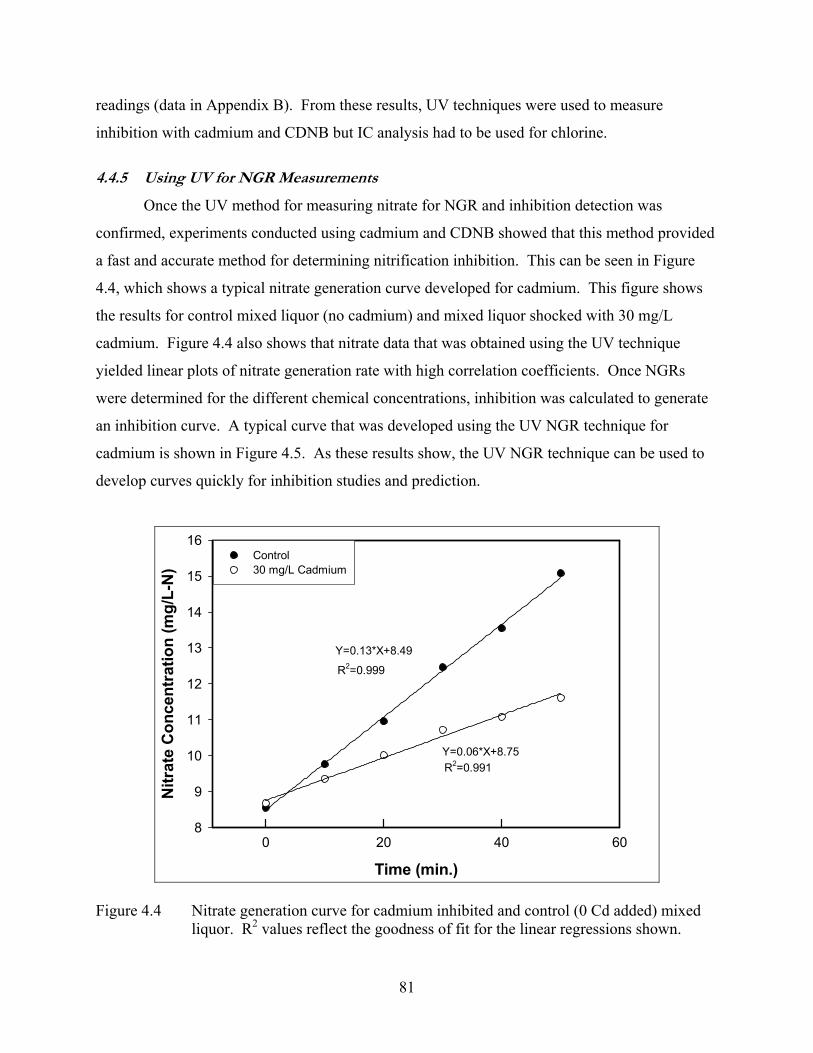
81
readings (data in Appendix B). From these results, UV techniques were used to measure
inhibition with cadmium and CDNB but IC analysis had to be used for chlorine.
4.4.5 Using UV for NGR Measurements
Once the UV method for measuring nitrate for NGR and inhibition detection was
confirmed, experiments conducted using cadmium and CDNB showed that this method provided
a fast and accurate method for determining nitrification inhibition. This can be seen in Figure
4.4, which shows a typical nitrate generation curve developed for cadmium. This figure shows
the results for control mixed liquor (no cadmium) and mixed liquor shocked with 30 mg/L
cadmium. Figure 4.4 also shows that nitrate data that was obtained using the UV technique
yielded linear plots of nitrate generation rate with high correlation coefficients. Once NGRs
were determined for the different chemical concentrations, inhibition was calculated to generate
an inhibition curve. A typical curve that was developed using the UV NGR technique for
cadmium is shown in Figure 4.5. As these results show, the UV NGR technique can be used to
develop curves quickly for inhibition studies and prediction.
Time (min.)
0 20 40 60
Nitr
ate
Con
cent
ratio
n (m
g/L-
N)
8
9
10
11
12
13
14
15
16Control 30 mg/L Cadmium
Y=0.06*X+8.75R2=0.991
R2=0.999
Y=0.13*X+8.49
Figure 4.4 Nitrate generation curve for cadmium inhibited and control (0 Cd added) mixed liquor. R2 values reflect the goodness of fit for the linear regressions shown.

82
Cl Conc.(mg/L-Cl2) vs NGR (mg-N/g MLVSS-min)
Cd Concentration (mg Cd/g MLVSS)
0 5 10 15 20 25 30
Perc
ent I
nhib
ition
0
20
40
60
80
100
Y = -3.58+4.36*X-0.065*X2
R2 = 0.964
Figure 4.5 Nitrification inhibition curve developed using UV detection of NGR for cadmium
induced inhibition. R2 values reflect the goodness of fit for the linear regressions shown.
4.4.6 Significance of Work
The initial purpose of developing this method was to reduce the time required to collect
and analyze data used to determine nitrification inhibition. However, when testing the method
we found that it was also easy to implement and required less capital outlay in instrumentation
because it used instrumentation that most wastewater analysis labs already have, which makes it
more likely to work in wastewater treatment plant labs. Initially, nitrate probes were considered
because they provide instant results, can be attached to a data acquisition unit for continuous
operation, and require little to no sample processing for laboratory scale experiments. However,
we encountered excessive drift in nitrate concentration readings when operated in mixed liquor
during our initial experiments (data in Appendix B). Drift has been seen by others (Pedersen et
al., 2002) who circumvented the problem by repeatedly re-standardizing the probes in mixed
liquor using an automated system. Although re-standardization makes use of probes an option if
one develops a re-standardization protocol, we decided to abandon this approach in favor of an
operationally simpler method because of limitations of time and difficulty for wastewater
treatment plant operators.

83
After ruling out the use of probes, we focused on demonstrating a method using UV
spectrophotometry because it is has been proven to detect nitrate in activated sludge (Thomas et
al., 1996; Ferree and Shannon, 2001; Chevalier et al., 2002) and commercially available UV
spectrophotometric units exist for monitoring nitrate in mixed liquor basins at full-scale
facilities. Although the developed method is simpler to set up at the laboratory scale, it does
require increased sample processing, as the mixed liquor must be filtered before readings are
taken. Additional disadvantages to this method include the fact that nitrate concentration results
are not instantaneous (sample processing time required) and data collection cannot be automated
or continuous. However, these setbacks can be overcome by using a robotic sample collection
system to automate sampling or an in-line filter system to remove particulates prior to the
spectrophotometric unit.
Regulations governing ammonia and nitrogen discharge clearly make it important to have
techniques that can be used to detect nitrification inhibition quickly and accurately. Ion
chromatography can take upwards of 20 minutes per nitrate sample for analysis, and
respirometry systems do not directly measure nitrification rates in wastewater treatment
facilities. Furthermore, differential respirometry, which relies on determining nitrification
oxygen uptake rates from the difference of the total oxygen uptake rate and nitrification inhibited
oxygen uptake rate, has been found to be a highly variable and unreliable means of measuring
nitrification inhibition (Kelly and Love, In Review). The UV technique discussed here provides
an accurate and rapid assessment of nitrification inhibition, as the total analysis time is less than
1.5 hours and uses simple analytical instrumentation found in most laboratories. Although this
technique requires increased sample processing for nitrite correction, the colorimetric method
used to measure nitrite is rapid and easy and does not significantly increase the analysis time. In
addition, corrections can be made for interferences caused by chemicals that do not react with
organic matter. Even though wastewater facility operators would not necessarily know what
interfering chemicals would be present in the wastewater stream, the UV measured NGR test
could be standardized using the filtered mixed liquor to be tested. By doing this, chemical
interferences would be eliminated as the interfering chemicals would be measured as part of the
matrix background.
Though the method as used here was not automated for on-line measurement of
nitrification inhibition, on-line spectrophotometric monitoring devices are commercially

84
available for monitoring nitrate and nitrite in full-scale wastewater treatment facilities (Neu,
1995; Chevalier et al., 2002). We believe that with minor modifications to these technologies,
this technique could be adapted for on-line detection of nitrification inhibition, or adapted for use
as an upstream monitoring device for nitrification upset. By using this technique to monitor for
nitrification inhibition, operators at wastewater treatment facilities can gain the ability to react to
nitrification upset events and take steps to minimize or mitigate the effect.
4.5 Conclusions
The UV spectrophotometric technique described here for measuring nitrification
inhibition is simple to perform and provides quick results. Nitrate measurements made using this
technique are accurate, as confirmed using ion chromatography. Corrections for non-reacting
chemical interferences could be made with this technique. It is the authors’ opinion that this
technique can be a powerful tool for monitoring nitrification rates and inhibition both in
laboratory studies and eventually in full-scale treatment facilities.
4.6 References
APHA (1998) Standard methods for the examination of water and wastewater. APHA, Washington, DC.
Blum, D.J.W. and Speece, R.E. (1991) A database of chemical toxicity to environmental bacteria and its use in interspecies comparisons and correlations. Research Journal Water Pollution Control Federation 63 (3), 198-207.
Chevalier, L.R., Irwin, C.N., and Craddock, J.N. (2002) Evaluation of Inspectra UV analyzer for measuring conventional water and wastewater parameters. Advances in Environmental Research 6, 369-375.
Dixit, L. and Ram, S. (1996) Development of a derivative UV spectroscopic method for the analysis of principal aromatic components in fuels. Fuel 75, 466-476.
Ferree, M.A. and Shannon, R.D. (2001) Evaluation of a second derivative UV/visible spectroscopy technique for nitrate and total nitrogen analysis of wastewater samples. Water Research 35, 327-332.
Ficara, E. and Rozzi, A. (2001) pH-stat titration to assess nitrification inhibition. Journal of Environmental Engineering-ASCE 127 (8), 698-704.
Gernaey, K., Verschuere, L., Luyten, L., and Verstraete, W. (1997) Fast and sensitive acute toxicity detection with an enrichment nitrifying culture. Water Environment Research 69 (6), 1163-1169.

85
Hillaby, B.A. and Randall, D.J. (1979) Acute ammonia toxicity and ammonia excretion in rainbow trout (Salmo gairdneri). Journal of the Fish Research Board Canada 36 (6), 621-629.
Hu, Z.Q., Chandran, K., Grasso, D., and Smets, B.F. (2003) Nitrification inhibition by ethylenediamine-based chelating agents. Environmental Engineering Science 20 (3), 219-228.
Kelly II, R.T., Henriques, I.D.S., and Love, N.G. (2004) Chemical inhibition of nitrification in activated sludge. Biotechnology and Bioengineering 85 (6), 683-694.
Kelly II, R.T. and Love, N.G. (In Review) A critical comparison of methods used to detect nitrification inhibition. Water Research.
Melchert, W.R. and Rocha, F.R.P. (2005) A green analytical procedure for flow-injection determination of nitrate in natural waters. Tantala 65, 461-465.
Neu, K. E. (1995) On-line monitoring of nutrient reduction processes using multiple wavelength reagentless ultraviolet absorbance process analyzers. Proceedings of the WEF Specialty Conference: Automating to Improve Water Quality. Minneapolis, MN, Jun 25-28; Water Environment Federation: Alexandria, VA.
Neufeld, R. , Greenfeld, J., and Rieder, B. (1986) Temperature, cyanide and phenolic nitrification inhibition. Water Research 20, (5), 633-642.
Pedersen, B., Gernay, K., and Vanrolleghem, P. A. (2002) Anoxic activated sludge monitoring with combined nitrate and titrimetric measurements. Water Science and Technology 45, 181-190.
Sarma, S.S.S., Mangas-Ramirez, E., and Nandini, S. (2003) Effect of ammonia toxicity on the competition among three species of cladocerans (Crustacea: Cladocera). Ecotoxicology and Environmental Safety 55 (2), 227-235.
Thomas, O., Theraulaz, F., Agnel, C., and Suryani, S. (1996) Advanced UV examination of wastewater. Environmental Technology 17, 251-261.
Tomlinson, T.G., Boon, A.G., and Trotman, C.N. (1966) Inhibition of nitrification in the activated sludge process of sewage disposal. Journal of Applied Bacteriology 29 (2), 266-91.
Touraud, E., Crone, M., and Thomas, O. (1998) Rapid diagnosis of polycyclic aromatic hydrocarbons (PAH) in contaminated soils with the use of ultraviolet detection. Field Analytical Chemistry and Technology 2, 221-229.
Wicks, B.J., Joensen, R., Tang, Q., and Randall, D.J. (2002) Swimming and ammonia toxicity in salmonids: the effect of sub lethal ammonia exposure on the swimming performance of coho salmon and the acute toxicity of ammonia in swimming and resting rainbow trout. Aquatic Toxicology 59 (1-2), 55-69.
Wood, L.B., Hurley, B.J.E., and Matthews, P.J. (1981) Some observations on the biochemistry and inhibition of nitrification. Water Research 15, 543-551.

86
5 A CRITICAL COMPARISON OF TWO COMMON METHODS TO DETECT
NITRIFICATION INHIBITION IN ACTIVATED SLUDGE 5.1 Abstract
Nitrifying biological treatment systems are prone to upset by industrial toxins and,
therefore, identifying inhibition is important in upset prevention. Several methods can be used to
determine nitrification inhibition in wastewater treatment. The objective of this study was to
compare two of these methods, differential respirometry and nitrate generation rate (NGR), and
to determine if a short-term (<1 hour) test adequately describes the full extent of inhibition.
Three industrially relevant toxins were used to test these objectives: cadmium, 1-chloro-2,4-
dinitrobenzene (CDNB) and chlorine. The results indicate that differential respirometry yielded
highly variable results that were different on average from NGR-based inhibition measurements,
which were much more consistent. This suggests that a direct measure of nitrification, like
NGR, provides a better measure of nitrification inhibition. In addition, cadmium and CDNB,
chemicals that are not quickly removed from the wastewater stream, were found to cause
maximum inhibition between 6 and 24 hours after the chemical shock was applied. However,
chlorine, a chemical that reacts and dissipates very quickly, caused maximum inhibition almost
immediately.
Key Words: Nitrification, Inhibition, Respirometry, Nitrate Generation, Toxin
5.2 Introduction
Regulations governing ammonia and total nitrogen discharge into receiving waters are
continually tightening throughout the world. As discharge limits are lowered, ammonia
conversion and nitrogen removal processes are growing in importance. Although new treatment
processes for ammonia removal are gaining in popularity, the most widely used processes for
ammonia and total nitrogen removal in wastewater treatment continue to rely on conventional
aerobic, autotrophic nitrification. Conventional nitrification involves the two-step biological
conversion of ammonia to nitrate. A common challenge with nitrification is the ease with which
it is inhibited by chemicals (Tomlinson et al., 1966; Blum and Speece, 1991; Wood et al., 1981,
Hockenbury and Grady, 1977). Studies using nitrifying mixed liquor have found that single
shock loads of a wide variety of industrial chemicals can inhibit the nitrification process for

87
weeks, and significant recovery times are often needed to regain nitrification (Nowak and
Svardal, 1993; Kelly II et al., 2004; Stasinakis et al., 2003). When inhibition occurs, treatment
facilities can exceed discharge limits, incur heavy fines and cause damage to the downstream
environment. Clearly, it is important to have methods or devices that quickly and accurately
detect the presence of nitrification inhibiting chemicals so that corrective actions can be taken to
minimize or prevent process upset.
Currently, nitrification inhibition in wastewater treatment can be determined using
several methods. Two prevalent methods include respirometry based on oxygen uptake rates
(Hu et al., 2003; Gernaey et al., 1997; Tomlinson et al., 1966) and nitrate generation rate (NGR)
(Grunditz and Dalhammar, 2001; Neufeld et al., 1986) based on nitrate production rates.
Respirometry is a rapid test (often < 20 minutes), however; it measures the total oxygen uptake
rate of all biomass, not just the nitrifiers. To determine the oxygen uptake rate (OUR) of only
the nitrifiers in mixed liquor, differential respirometry can be used whereby the nitrification-
inhibited OUR is subtracted from the total OUR to yield a nitrification OUR. This is accepted as
a measure of nitrification rate because the OUR of nitrifying bacteria stoichiometrically relates to
the rate of nitrate generation (White, 2000; Grady et al., 1999). Because OUR methods are rapid
and have a clear stoichiometric relationship to the nitrification rate, devices using differential
respirometry to detect nitrification inhibition are commercially available for full-scale use.
However, there are limitations in using this chemically-dependent technique, including possible
impact of the nitrification-specific inhibitor on heterotrophs and reactions between the inhibitor
and chemicals in the activated sludge matrix. These limitations would not apply to other
respirometric methods; however, they are pertinent to this study, which focuses only on
differential respirometry.
Unlike differential respirometric techniques, NGR detects a unique product of
nitrification and, therefore, provides a direct measure of the nitrification rate. It does not require
the addition of chemical inhibitors, but it does generally take longer to perform than
respirometry. NGR has been used in both laboratory (Grunditz and Dalhammar, 2001; Hooper
and Terry, 1973) and full-scale facilities (Grunditz and Dalhammar, 2001; Lee et al., 1997), but,
to the authors’ knowledge, commercially available full-scale NGR units do not exist. This could
be because nitrate is typically measured by ion chromatography or nitrate-selective electrodes.
Ion chromatography is not yet easily adapted for continuous nitrate measurement and electrodes

88
tend to show a false drift in nitrate concentrations when used in activated sludge (Pedersen et al.,
2002), making both approaches difficult to adapt to full-scale continuous monitoring. A
promising approach that has been adapted to full-scale continuous monitoring of nitrate is
ultraviolet spectrophotometry, but to the authors’ knowledge no UV spectrophotometry device
has been adapted for measuring NGR real-time or by automated means.
Previous experiments conducted in our labs examined inhibition using both total OUR
and NGR and suggested that the extent of nitrification inhibition was more accurately depicted
using NGR (Kelly II et al., 2004). However, data obtained during our previous study did not
include differential respirometry. Furthermore, our data showed that the full extent of
nitrification inhibition did not occur until hours after a shock load of industrial toxin was
introduced. The time dependence has been seen by others (Hu et al., 2003) and is a very
important factor to consider when defining protocols for determining the degree of inhibition
because the inhibition results could influence operating processes at a full-scale facility.
The objective of this study was to compare both differential respirometry and NGR as
methods for detecting nitrification inhibition in order to show that a direct measure of the
nitrification rate provides a better measure of inhibition. In addition, we examined the time
dependence of the extent of inhibition to prove that the full extent of nitrification inhibition is
time dependent. Three industrially relevant chemical toxins were chosen: cadmium, 1-chloro-
2,4-dinitrobenzene (CDNB), and chlorine. Cadmium and CDNB are found in various industrial
wastewaters (Weber and Sherard, 1980; Lee and Sax, 1987, Environmental Defense Scorecard,
2005; EPA, 2005) , and chlorine is used in biological wastewater treatment to control bulking
and foaming problems (Neethling et al., 1987; Cotteux and Duchene, 2003; Marstaller et al.,
1992). NGR was used to determine inhibition levels for several concentrations of the toxins,
starting immediately after their addition to the mixed liquor. Several of these concentrations
were also tested using differential respirometry in order to compare the two methods. To
determine the time to maximum inhibition, NGR and differential respirometry were conducted
over time after toxin addition using sequencing batch reactors (SBRs). Selected experiments
were repeated in continuous-flow stirred tank reactors (CSTRs) to compare the results between
the two reactor configurations.

89
5.3 Methods and Materials
5.3.1 Mixed Liquor Source Description and Sample Treatment
Mixed liquor was obtained the morning of each experiment from the Blacksburg-VPI
Stroubles Creek Wastewater Treatment Facility (WWTF). The WWTF process consisted of a
nitrifying activated sludge with a 10 to 14 day solids retention time (SRT). Grab samples were
taken directly from the aerated mixed liquor basins and transported to the laboratory within 20
minutes. For the short-term method comparison experiments, the mixed liquor samples were
aerated, magnetically mixed, and fed a small volume (<2% of total volume) of concentrated
synthetic wastewater solution (Kelly II et al., 2004) used to mimic the average feed loading
conditions at the WWTF. Feeding continued throughout the experimental period to maintain the
same levels of biological activity. For the sequencing batch reactor (SBR) time dependence
experiments, the mixed liquor was immediately added to the SBRs, which are described below.
5.3.2 Short-Term Inhibition Determination: Method Comparisons
Using differential respirometry or NGR for the short-term method comparison
experiments, the degree of inhibition was examined immediately after addition of one of three
chemical contaminants: cadmium (CdCl2), CDNB, or bleach (NaOCl). NGR tests were
conducted with mixed liquor exposed to varying contaminant concentrations to develop
inhibition curves for each contaminant. Once an inhibition curve was developed using NGR,
selected toxin concentrations were chosen to compare the NGR results to the specific oxygen
uptake rate (SOUR) differential respirometry method.
NGR tests were conducted and analyzed as described in Kelly and Love (In Review).
Briefly, mixed liquor was mixed, aerated, and spiked with (NH4)2SO4 to a final concentration of
20 mg/L-N so that the maximum nitrate generation rate was measured. Samples were pulled at
10 minute intervals over a 50 minute period and processed for nitrate and nitrite analysis.
Ultraviolet (UV) spectrophotometry was used to determine the nitrate concentration for
cadmium- and CDNB-inhibited experiments at wavelengths between 225 and 240 nm
(determined on the day of the test). Because nitrite interferes with UV nitrate readings, nitrite
was determined colorimetrically according to method 4110 B in Standard Methods (APHA,
1998). Through use of a standard curve that related nitrite concentration to absorbance, nitrite-
influenced absorbances could be determined and subtracted from absorbance readings for

90
nitrate+nitrite to generate a nitrate profile. To determine the specific NGR (SNGR,mg-N/min-g
MLVSS) the slope of the nitrate profile was normalized to the MLVSS concentration (method
2540 E (APHA, 1998)). The percent inhibition was calculated according to Equation 1.
SNGRcontrol refers to the response by mixed liquor to which no chemical was added.
%100×−
control
inhibitedcontrol
SNGRSNGRSNGR
equation [1]
An inhibition curve was developed using least squares regression analysis of the data
(Sigma Plot 8.0®), and the chemical concentration that caused 50% inhibition of nitrification
(nIC50) was determined from the fitted model equation. Chlorine inhibited reactors could not be
analyzed for nitrate using UV because of an interference at the test wavelengths. Samples
collected from the chlorine SNGR assay were analyzed for nitrate using ion chromatography as
described in Kelly et al. (2004).
SOURs were determined from aerated mixed liquor that was added to 300 ml BOD
bottles and spiked with selected concentrations of chemical contaminants. Synthetic wastewater
(previously described) was added to achieve an initial concentration of 100 mg/L COD so
unrestricted respiration could occur during the short test and (NH4)2SO4 was added to a
concentration of 20 mg/L-N to achieve maximum nitrification rates. The oxygen uptake rate for
the mixed liquor was determined in duplicate using Orion model 97-08 oxygen electrodes (Orion
Research, Inc., Beverly, MA) connected to a data acquisition system. A minimum dissolved
oxygen drop of 2.0 mg/L or a time of 20 minutes was required for the test. The OUR was
performed and calculated according to section 2710 B of Standard Methods (APHA, 1998).
SOUR was calculated by dividing the OUR by the MLVSS concentration. Nitrification inhibited
SOUR was measured by adding 30 mg/L of 2-chloro-6-(trichloromethyl)pyridine (TCMP), a
selective inhibitor of ammonia oxidation. We experimentally determined that this concentration
inhibited the mixed liquor SNGR by >98% but it did not inhibit respiration rates in a pure culture
of a heterotrophic activated sludge isolate, Pseudomonas aeruginosa (data in Appendix C). The
SOUR of the nitrifying community (nSOUR) was then determined through differential
respirometry by taking the difference between the total SOUR and the nitrification inhibited
SOUR. Percent inhibition was calculated using a parallel equation to that for SNGR.
All SNGR and SOUR tests were conducted at room temperature (23-25°C). To minimize
time dependent influences of data analysis and interpretation, the order of dosed toxicant
91
concentrations was randomized. All tests for SNGR and SOUR were conducted in duplicate and
short-term experiments were repeated at least once.
5.3.3 Long-Term Time Dependence Experiments
SBRs were used as the operating reactors for each contaminant. The experimental setup
consisted of four 4-L beakers maintained at a 12 day target SRT to ensure complete nitrification.
Of these, one reactor was used as a control and received no contaminant and one reactor was
shocked with the contaminant concentration that inhibited nitrification by 50% (IC50) based on
short-term SNGR measurements. One reactor was a nitrification inhibited control reactor to
which TCMP (30 mg/L) was added, and one reactor contained the contaminant plus TCMP. The
TCMP reactors were used to measure differential respirometry. Reactors were maintained with a
1 day nominal hydraulic retention time (HRT). Detailed operation of the SBRs is described in
Kelly et al. (2004). SNGR and differential SOUR assays were conducted as previously
described immediately after contaminant addition (0 hr) and after 3, 6, 12, 24 and 48 hours.
To compare the results of a completely mixed continuously fed system to a batch fed
system, Eckenfelder style 10 L continuously stirred tank reactors (CSTRs) were used and
shocked with cadmium only. These reactors used the same HRT and SRT as the batch system.
All tests for SNGR and SOUR were conducted in duplicate and experiments for both the SBR
and CSTR reactors were repeated at least once.
5.4 Results and Discussion
5.4.1 Inhibition Detection Method Comparisons
Initial results of the short-term inhibition tests for cadmium first showed that an
interaction occurred between cadmium and the biomass. This was observed when calculating the
IC50 concentrations from the two trials, which were found to be 29 and 41 mg/L. When the
concentrations were normalized to biomass concentration (mg Cd/g MLVSS), the nIC50
concentrations for both experiments were 16 mg/g MLVSS. Since the nIC50 values are the same
when normalized to the biomass concentration, it indicates a surface interaction is occurring
between cadmium and the biomass. This pattern is consistent with what has been found by
others for cadmium (Hu et al., 2003; Costley and Wallis, 2001).

92
Short-term cadmium results also indicated that the SNGR test provided a more precise
and accurate description of nitrification inhibition than the differential SOUR test, which tended
to predict lower nitrification inhibition levels than the SNGR test. For cadmium, nSOUR
measurements were performed with cadmium concentrations of 1, 5, 10 and 50 mg/L. The
actual (not model predicted) percent inhibition data for nSOUR and the SNGR tests at these
concentrations are summarized on Table 5.1. The SNGR inhibition level determined for each of
the concentrations shown on Table 5.1 was approximately the same for the two trials; therefore,
SNGR was very stable and repeatable. In contrast, the nSOUR results varied more between
trials, as seen by the increase from 4% to 17% inhibition for 10 mg/L cadmium. Also, the results
for nSOUR were less likely to follow a logical pattern; for example, negative inhibition
(indicating a lower nSOUR in the control than the cadmium shocked reactor) was observed at
low concentrations. Furthermore, the percent inhibition levels based on SNGR and nSOUR
differed for the same cadmium concentration. Assuming that SNGR provides an accurate
measure of nitrification inhibition because it measures nitrification rate directly by measuring the
rate at which a unique nitrification product is produced, these results indicate that differential
respirometry using nSOUR under-predicted nitrification inhibition for cadmium. Differences in
nitrification inhibition may be due to interactions between the nitrification specific inhibitor,
TCMP, which was used for the nSOUR assays and the activated sludge matrix.

93
Table 5.1 Comparison of SNGR to nSOUR for prediction of nitrification inhibition percentages for different concentrations of cadmium, CDNB and chlorine.a,b
Trial 1c Trial 2c Average IC50
Concentration CADMIUM Concentration (mg/L-Cd) SNGR nSOUR SNGR nSOUR
1 1% -68% --d --d 5 7% --d 6% -21%
10 8% 4% 8% 17% 50 65% 21% 61% 24%
16 (mg/g MLVSS)
CDNB Concentration (mg/L) SNGR nSOUR SNGR nSOUR
5 24% -33% 21% 32% 10 37% -34% 31% 33% 30 56% --d 83% 37% 60 100% 31% --d --d
6.8 (mg/g MLVSS)
CHLORINE Concentration (mg/L-Cl2) SNGR nSOUR SNGR nSOUR
5 45% 88% 62% 77% 10 81% 99% 73% 95% 30 82% 156% 85% 99%
1.7 (mg/g MLVSS)
aPercentages are an average of two measurements. bIC50 concentrations are the average of two trials. c Trials are independent repeats of the experiments. d--Denotes concentration was not tested during the trial.
The CDNB short-term experiments showed similar results to cadmium in that nSOUR
was more variable and measured a lower percent inhibition than SNGR, again indicating that
SNGR provides a better measure of nitrification inhibition. The nSOUR tests were performed
for 5, 10, 30 and 60 mg/L of CDNB (Table 5.1). SNGR results were again reproducible between
trials and inhibition curves predicted similar results for both CDNB trials. However, the nSOUR
results varied significantly between trials and within a given experiment, and comparisons
between SNGR and nSOUR inhibition results at each inhibitor concentration did not match. Just
as with cadmium, the nSOUR inhibition was lower than the inhibition measured by SNGR, with
a few exceptions. These results parallel the cadmium results and suggest that nSOUR does not
provide an accurate, reproducible measure of nitrification inhibition for CDNB.
The nIC50 concentrations for CDNB were found to be 20 mg/L (7.8 mg/g MLVSS) and
14 mg/L (5.7 mg/g MLVSS) during repeated experiments using SNGR, although the degree of
surface interaction that occurred during CDNB-induced inhibition is unclear. CDNB is only
moderately soluble (~400 mg/L, unpublished data), which suggests that hydrophobic interactions

94
should occur with the biomass. Other data on CDNB and nitrification in activated sludge were
not found in the literature and, therefore, this study serves as a first report on how this chemical
interacts within activated sludge.
Results observed for bleach-induced nitrification inhibition suggest that curative chlorine
dosing for filamentous bulking can inhibit nitrification. This is easily seen when examining the
inhibition data obtained for chlorine bleach. For the two chlorine trials, the nIC50 concentrations
predicted were found to be 3.6 and 2.5 mg/L as free chlorine (Cl2). These values correspond to
2.0 and 1.4 mg/g MLVSS and are well within normal chlorine doses for curative bulking, which
can range from 1 to upwards of 40 mg/g MLVSS when applied to the RAS stream (Neethling et
al., 1987; Cotteux and Duchene, 2003; Marstaller et al., 1992). Although our additions were
directly to the activated sludge mixed liquor, 2.0 mg/g is still lower than the typical chlorine
dosage and it is obvious why some facilities experience nitrification upset when chlorinating for
bulking control (Cotteux and Duchene, 2003; Marstaller et al., 1992).
Chlorine did not yield data that was as reproducible at low loads for either SNGR or
nSOUR (Table 5.1). This is consistent with rapid changes in inhibition at low concentrations,
seen in Figure 5.1. Despite the differences, the overall inhibition curves predict similar levels of
inhibition for the two trials, indicating reproducibility of the results. nSOUR results were much
more reproducible for chlorine shock than for CDNB or cadmium shock, but just like cadmium
and CDNB, nSOUR did not predict the same levels of inhibition as SNGR. However, in contrast
to the other compounds, the nSOUR test predicted higher levels of inhibition for every chlorine
concentration tested when compared to SNGR. It is unclear why this difference occurred, and
may suggest that an inhibitor with a different toxic mode of action was created by reactions
between hypochlorite and TCMP. If that is the case, SNGR again is the better predictor of the
true degree of inhibition in the presence of hypochlorite or hypochlorous acid.

95
Cl Concentration (mg Cl2/g MLVSS)
0 10 20 30 40 50 60
Perc
ent I
nhib
ition
0
20
40
60
80
100
Y = 93.58 *X/(1.25+X)R2 = 0.999
Figure 5.1 Nitrification inhibition curve developed using SNGR for chlorine bleach (concentration determined as Cl2). Equation describes the best-fit curve shown.
Reactions between the external nitrification inhibitor used for the nSOUR tests and
chemicals or components of the mixed liquor matrix may explain why differential respirometry
did not provide a reliable measure of nitrification inhibition. Initially, allylthiourea (ATU) was
used in our experiments to inhibit nitrification (Benes et al., 2002; Hooper and Terry, 1973), but
we found that purported reactions between ATU and chlorine cancelled out effects of both
chemicals (data in Appendix C). Because ATU contains a thiol group than can be easily
oxidized by chlorine, and several amine groups that can undergo chlorine substitution, the
canceling effects of these chemicals is very probable. It is thought that the thiol group in ATU
acts as a metal chelator and binds copper to inhibit ammonia oxidation (Hooper and Terry, 1973;
Wood et al., 1981) and oxidation of the thiol would prevent ATU from inhibiting nitrification.
Because of this, we switched to TCMP to circumvent these interactions. TCMP, which is a
chlorinated methyl pyridine, does not contain thiol or amine groups and is thought to inhibit
nitrification by interfering with the cytochromes necessary for ammonia oxidation (Hooper and
Terry, 1973). Switching to TCMP appeared to prevent the canceling effects observed for chorine
and ATU, but it is still possible that interactions occurred between TCMP and other compounds

96
in the mixed liquor or even the added toxicants. Any reactions that occurred could produce a
canceling, additive, or multiplicative effect on observed nitrification inhibition within the
nSOUR test similar to what we found with ATU, and would result in the type of variable results
that were observed.
In summary, the short-term method comparison experiments showed that the SNGR test
was a more reproducible method for predicting nitrification inhibition. In contrast, nSOUR was
generally found to be more variable and did not predict the same level of inhibition as SNGR.
Assuming that SNGR provides an accurate measure of nitrification inhibition because it involves
the direct measurement of a unique product of the metabolism being monitored, the comparison
results suggest that differential respirometry does not provide an accurate or reproducible
measure of nitrification inhibition in nitrifying mixed liquor. Furthermore, differential
respirometry cannot be used to examine differences in inhibition patterns between the ammonia
oxidizing bacteria (AOB) and the nitrite oxidizing bacteria (NOB), because only the total
respiration rate is measured. Because the NGR test measures nitrite and nitrate levels, a buildup
of nitrite during the inhibition tests would indicate a differential inhibition of the NOB over the
AOB. This shows that the NGR test can also be used to determine which group of nitrifying
bacteria is more severely inhibited by a given toxin, further supporting the conclusion that the
NGR test is superior to differential respirometry for determining nitrification inhibition.
5.4.2 Time Dependence of Inhibition
For all time-dependent inhibition tests, the nIC50 concentration determined by SNGR for
each of the three contaminants during the short-term assays was added as a single dose shock to
the SBRs at the beginning of each trial. These concentrations can be found on Table 5.1.
The results for the cadmium shocked SBR reactors suggest that the full extent of
nitrification inhibition is delayed beyond the time period used for the short-term nitrification
inhibition tests. This is seen for the cadmium experiment in Figure 5.2A, where the SNGR of the
control reactor (no cadmium added) remained stable for the duration of the experiment while the
cadmium inhibited reactor SNGR decreased for the first 6 hours after the cadmium shock. After
6 hours, the SNGR began to recover, suggesting the biomass was beginning to recover from the
shock event. The same results are seen when examining the calculated percent inhibition (Figure
5.2B), where the maximum percent inhibition after 6 hours was 73%. This is significantly higher

97
than the 50% that was predicted by the short-term SNGR test for the contaminant dose used.
When this experiment was repeated, the maximum inhibition measured by SNGR was again
observed after approximately 6 hours. The delayed inhibition seen for cadmium may be due to
continued exposure to the contaminant, as previous experiments conducted in our labs found that
washout of 20 mg/L of total cadmium took over 15 days, even though soluble cadmium levels
fell below 1 mg/L after 12 hours (unpublished data). These results support our hypothesis that
maximum nitrification inhibition does not occur immediately after exposure to a toxin.

98
NG
R (m
g N
O3- -
N/g
MLV
SS-m
in)
0.00
0.02
0.04
0.06
ControlCd Inhibited
Time (hours)
0 10 20 30 40 50
Perc
ent I
nhib
ition
0
20
40
60
80
100
A
B
Figure 5.2 (A) Nitrate generation rate monitored over time for the control (no cadmium) and cadmium inhibited SBR. (B) Nitrification inhibition calculated from the SNGR results for the control and cadmium inhibited reactors. Data point shows average of two measurements.
Like the cadmium shock experiment, the CDNB shock also showed that inhibition was
time dependent. This is seen in Figure 5.3, which shows that the initial inhibition increased from
42% until the maximum inhibition of 100% occurred 12 hours later. Also, the biomass did not
begin to recover its nitrification capabilities over the experimental time of 48 hours. Because we
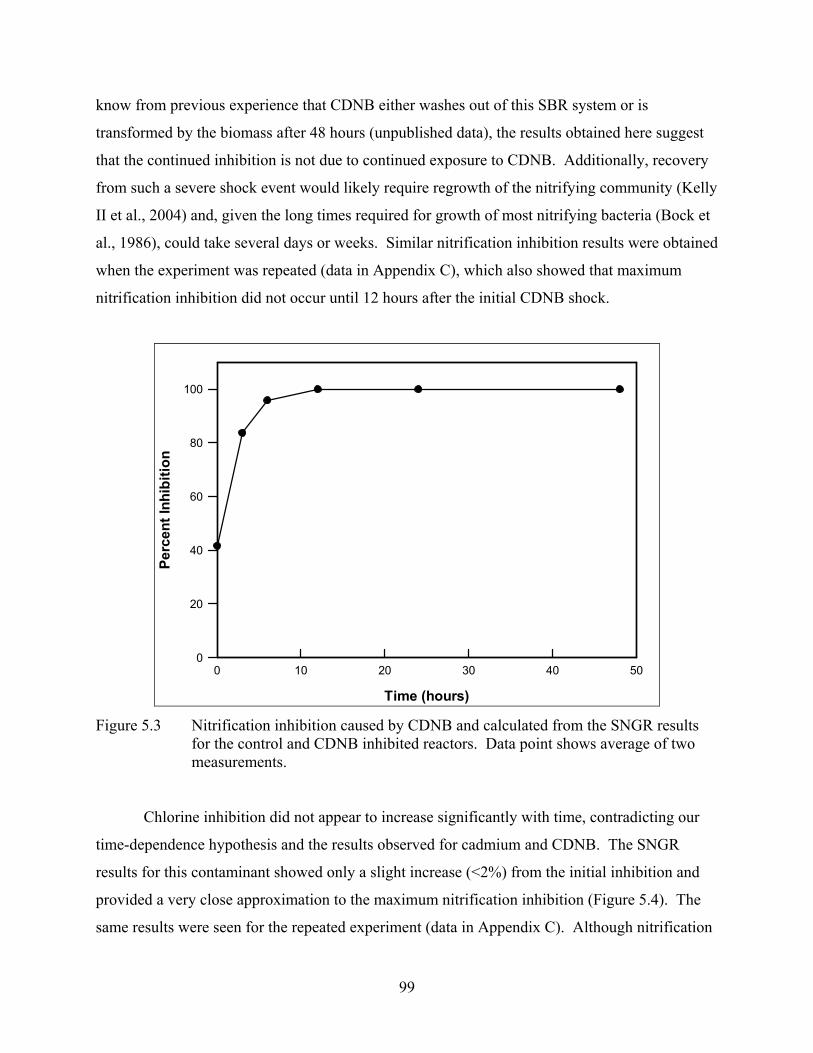
99
know from previous experience that CDNB either washes out of this SBR system or is
transformed by the biomass after 48 hours (unpublished data), the results obtained here suggest
that the continued inhibition is not due to continued exposure to CDNB. Additionally, recovery
from such a severe shock event would likely require regrowth of the nitrifying community (Kelly
II et al., 2004) and, given the long times required for growth of most nitrifying bacteria (Bock et
al., 1986), could take several days or weeks. Similar nitrification inhibition results were obtained
when the experiment was repeated (data in Appendix C), which also showed that maximum
nitrification inhibition did not occur until 12 hours after the initial CDNB shock.
Time (hours)
0 10 20 30 40 50
Perc
ent I
nhib
ition
0
20
40
60
80
100
Figure 5.3 Nitrification inhibition caused by CDNB and calculated from the SNGR results
for the control and CDNB inhibited reactors. Data point shows average of two measurements.
Chlorine inhibition did not appear to increase significantly with time, contradicting our
time-dependence hypothesis and the results observed for cadmium and CDNB. The SNGR
results for this contaminant showed only a slight increase (<2%) from the initial inhibition and
provided a very close approximation to the maximum nitrification inhibition (Figure 5.4). The
same results were seen for the repeated experiment (data in Appendix C). Although nitrification
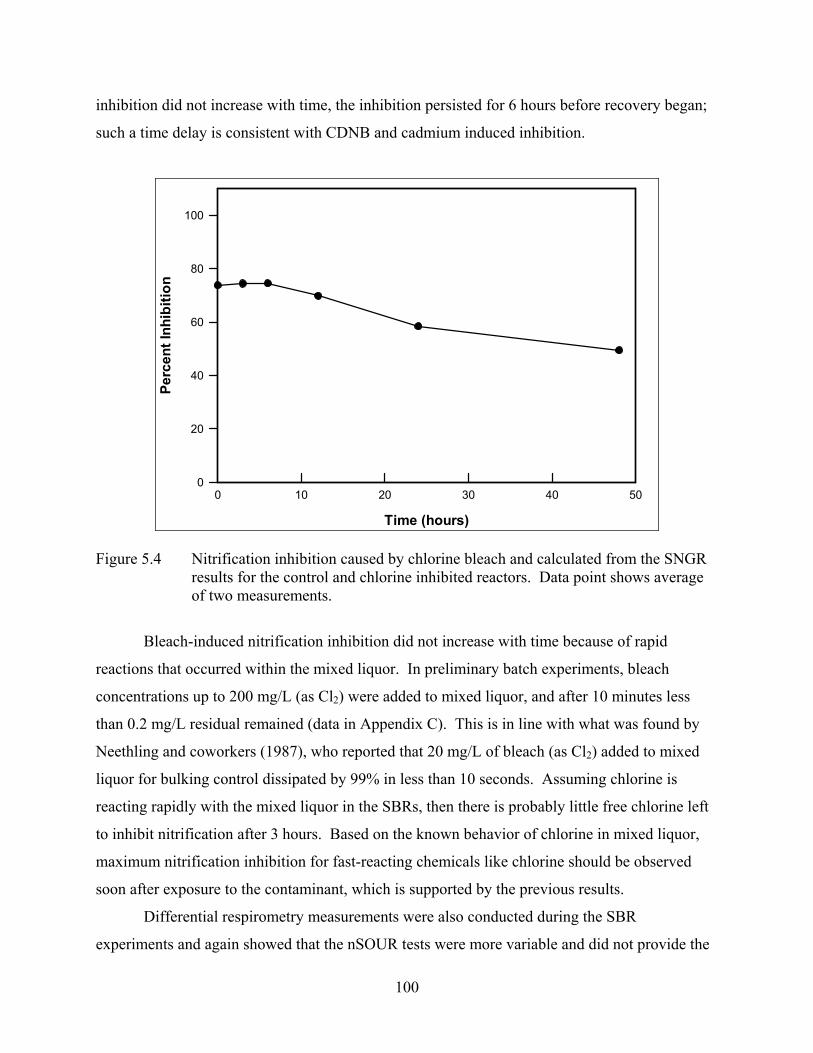
100
inhibition did not increase with time, the inhibition persisted for 6 hours before recovery began;
such a time delay is consistent with CDNB and cadmium induced inhibition.
Time (hours)
0 10 20 30 40 50
Perc
ent I
nhib
ition
0
20
40
60
80
100
Figure 5.4 Nitrification inhibition caused by chlorine bleach and calculated from the SNGR
results for the control and chlorine inhibited reactors. Data point shows average of two measurements.
Bleach-induced nitrification inhibition did not increase with time because of rapid
reactions that occurred within the mixed liquor. In preliminary batch experiments, bleach
concentrations up to 200 mg/L (as Cl2) were added to mixed liquor, and after 10 minutes less
than 0.2 mg/L residual remained (data in Appendix C). This is in line with what was found by
Neethling and coworkers (1987), who reported that 20 mg/L of bleach (as Cl2) added to mixed
liquor for bulking control dissipated by 99% in less than 10 seconds. Assuming chlorine is
reacting rapidly with the mixed liquor in the SBRs, then there is probably little free chlorine left
to inhibit nitrification after 3 hours. Based on the known behavior of chlorine in mixed liquor,
maximum nitrification inhibition for fast-reacting chemicals like chlorine should be observed
soon after exposure to the contaminant, which is supported by the previous results.
Differential respirometry measurements were also conducted during the SBR
experiments and again showed that the nSOUR tests were more variable and did not provide the

101
same measure of nitrification inhibition as the SNGR tests. This is easily seen in Figure 5.5,
which shows a comparison of the percent nitrification inhibition predicted by SNGR and nSOUR
for the cadmium shock event. In this figure, the percent nitrification inhibition that was
determined using the SNGR test increased up to 6 hours before it began to recover. In contrast,
the inhibition determined using the nSOUR test was more variable and showed a general
decreasing trend from the initial inhibition. The percent inhibition became negative at one point,
which indicated that the control nSOUR was lower than the cadmium inhibited nSOUR. These
illogical results are similar to what was observed during the short-term experiments. Erratic
results for nSOUR were also seen during the repeat of the cadmium experiments, and they did
not match the first trial pattern. Therefore, as with the short-term experiments, nSOUR
experiments for Cd in an SBR were not reproducible between trials. The differential
respirometry results for both CDNB and chlorine were also erratic and showed no distinct
patterns (data in Appendix C). The nSOUR inhibition results shown here are obviously contrary
to what was found using the SNGR test and again show that SNGR provides a better measure of
nitrification inhibition.
Time (hours)
0 10 20 30 40 50
Perc
ent I
nhib
ition
-100
-50
0
50
100
nSOURNGR
Figure 5.5 Comparison of nSOUR and SNGR nitrification percent inhibition for cadmium
inhibited SBRs. SNGR inhibition is the same as presented in Figure 5.2B. Data points show an average of 2 measurements.

102
Taken together, the results from the long-term experiments lend weight to the conclusion
from the short-term experiments that SNGR provides a better measure of nitrification inhibition
than differential respirometry. However, it is more important to realize that the long-term results
show that the maximum inhibition does not occur immediately for inhibitory chemicals that are
not quickly eliminated from the mixed liquor, like cadmium and CDNB. Rather, maximum
inhibition can occur hours after a shock load of the contaminant hits an activated sludge system.
Current exposure time standards for respiratory inhibition measurements in activated sludge
recommend a toxin exposure time of 2 hours before measuring inhibition (ASTM, 1995).
However, the results presented here suggest that using an exposure time of 2 hours may under
predict the full extent of nitrification inhibition, depending on the contaminant. The
consequence of this is large, because an operator who relies upon inhibition test measurements
taken within the first 2 hours of chemical exposure may conclude that no response is needed, but
hours later the inhibition may increase to a point that causes the facility to exceed their nitrogen
discharge limits. Once nitrification is inhibited, it can take days to regain capacity, possibly
throwing the utility into noncompliance with its monthly average effluent permit guidelines.
Thus, it is very important to realize longer inhibition monitoring times may be required to avoid
such costly mistakes.
5.4.3 Continuous Flow Reactors
The results obtained for cadmium inhibited CSTRs (used to compare a continuous and
batch system) also showed a time dependence for the maximum nitrification inhibition. Figure
5.6 shows that the nitrification inhibition, as measured by SNGR, increased with time until a
maximum inhibition was reached after 6 hours; this result was observed during a repeat
experiment (data in Appendix C). The CSTRs followed the same SNGR-derived inhibition
pattern that was observed during the cadmium inhibition studies with the SBRs, which also
achieved maximum nitrification inhibition at 6 hours (Figure 5.6). Although the extent of
inhibition did not match between the two configurations, the time when maximum inhibition
occurred and the time when nitrification recovery was initiated were the same, which suggests
that there were no significant differences in the inhibition behavior for the CSTR and SBR
systems. Interestingly, the average value of the cadmium inhibited SNGR after 6 hours was the

103
same for both the SBR and the CSTR systems (0.013 mg-N/g MLVSS-min). Unexpectedly,
there was a consistent decrease in the control reactor SNGR that began after 6 hours during both
independent experiments (data in Appendix C). Nevertheless, the percent inhibition as reported
in Figure 5.6 reflects that the degree of inhibition in the chemically shocked reactor was more
severe, and is consistent with what was expected based on the previous experiments.
Time (hours)
0 5 10 15 20
Perc
ent I
nhib
ition
0
20
40
60
80
100
CSTRSBR
Figure 5.6 Comparison of cadmium induced nitrification percent inhibition for CSTR and
SBR reactors as measured by SNGR. SBR inhibition is the same as that shown on Figure 5.2B. Data points show the average of 2 measurements.
The differential respirometry measurements taken for the CSTRs showed more stable
oxygen uptake results than were observed using the batch system. From Figure 5.7, we see that
the nSOUR measured nitrification inhibition results were more stable and had defined trends
when compared with the SBR results. The nSOUR of the inhibited CSTR (Figure 5.7) also
showed the same inhibitory trend as the SNGR for that reactor (Figure 5.6). The extreme
negative inhibition observed for this reactor after 24 hours was due to an unexpected decrease in
the control nSOUR that was similar to the decrease observed at the same time for the control
SNGR results discussed above. Although the CSTR nSOUR results are more stable than those
observed for the batch reactor experiments, the predicted inhibition still did match inhibition
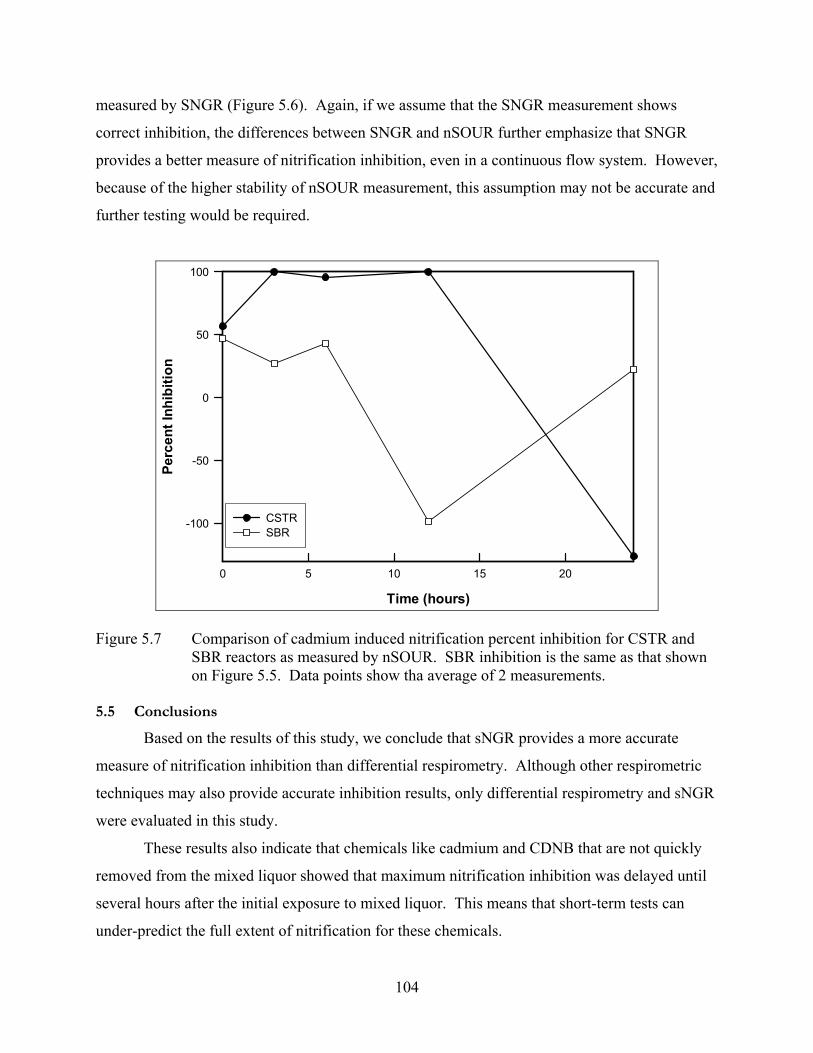
104
measured by SNGR (Figure 5.6). Again, if we assume that the SNGR measurement shows
correct inhibition, the differences between SNGR and nSOUR further emphasize that SNGR
provides a better measure of nitrification inhibition, even in a continuous flow system. However,
because of the higher stability of nSOUR measurement, this assumption may not be accurate and
further testing would be required.
Time (hours)
0 5 10 15 20
Perc
ent I
nhib
ition
-100
-50
0
50
100
CSTRSBR
Figure 5.7 Comparison of cadmium induced nitrification percent inhibition for CSTR and SBR reactors as measured by nSOUR. SBR inhibition is the same as that shown on Figure 5.5. Data points show tha average of 2 measurements.
5.5 Conclusions
Based on the results of this study, we conclude that sNGR provides a more accurate
measure of nitrification inhibition than differential respirometry. Although other respirometric
techniques may also provide accurate inhibition results, only differential respirometry and sNGR
were evaluated in this study.
These results also indicate that chemicals like cadmium and CDNB that are not quickly
removed from the mixed liquor showed that maximum nitrification inhibition was delayed until
several hours after the initial exposure to mixed liquor. This means that short-term tests can
under-predict the full extent of nitrification for these chemicals.

105
In contrast, chemicals like hypochlorite that quickly react and are removed from the
mixed liquor showed maximum nitrification inhibition almost immediately upon exposure to the
mixed liquor. In addition, chlorine concentrations that are typically used for filamentous bulking
control can inhibit nitrification in activated sludge mixed liquor. This means that by using
hypochlorite to cure one problem (bulking), an operator may be creating another (increased
effluent ammonia or total nitrogen).
5.6 References
American Society for Testing and Materials (1995) D 5120: Standard Test Method for Inhibition of Respiration in Microbial Cultures in the Activated Sludge Process. ASTM International.
APHA (1998) Standard Methods for the Examination of Water and Wastewater. APHA, Washington, DC.
Benes, O., Spangers, H., and Holba, M. (2002) Respirometry techniques and activated sludge models. Water Science and Technology 46 (4-5), 1-6.
Blum, D.J.W. and Speece, R.E. (1991) A database of chemical toxicity to environmental bacteria and its use in interspecies comparisons and correlations. Research Journal Water Pollution Control Federation 63 (3), 198-207.
Bock, E., Koops, H., and Harms, H. (1986) Cell biology of nitrifiers, In J.I. Prosser (ed.), Nitrification. IRL Press, Oxford.
Costley, S.C. and Wallis, F.M. (2001) Bioremediation of heavy metals in a synthetic wastewater using a rotating biological contactor. Water Research 35 (15), 3715-3723.
Cotteux, E. and Duchene, P. (2003) Nitrification preservation in activated sludge during curative bulking chlorination. Water Science and Technology 47 (11), 85-92.
Environmental Defense Scorecard. (2005) Chemical Profile for 1,3-DINITRO-4-CHLOROBENZENE (CAS Number: 97-00-7). http://www.scorecard.org/chemical-profiles/summary.tcl?edf_substance_id=97-00-7#use_profile. Accessed on 2/20/05.
Gernaey, K., Verschuere, L., Luyten, L., and Verstraete, W. (1997) Fast and sensitive acute toxicity detection with an enrichment nitrifying culture. Water Environment Research 69 (6), 1163-1169.
Grady Jr., C.P.L., Daigger, G.T., and Lim, H.C. (1999) Biological Wastewater Treatment, second edition. Marcel Dekker, Inc., New York, NY.
Grunditz, C. and Dalhammar, G. (2001) Development of nitrification inhibition assays using pure cultures of Nitrosomonas and Nitrobacter. Water Research 35 (2), 433-440.

106
Henriques, I.D.S., Holbrook, R.D., Kelly II, R.T. and Love, N.G. (In Press) The impact of floc size on respiration inhibition by soluble toxicants - A Comparative Investigation. Water Research.
Hockenbury, M.R. and Grady, C.P.L. (1977) Inhibition of nitrification-effects of selected organic compounds. Journal Water Pollution Control Federation 49, 768-777.
Hooper, A.B. and Terry, K.R. (1973) Specific inhibitors of ammonia oxidation in Nitrosomonas. Journal of Bacteriology 115 (2), 480-5.
Hu, Z.Q., Chandran, K., Grasso, D., and Smets, B.F. (2003) Impact of metal sorption and internalization on nitrification inhibition. Environmental Science and Technology 37 (4), 728-734.
Kelly II, R.T., Henriques, I.D.S., and Love, N.G. (2004) Chemical inhibition of nitrification in activated sludge. Biotechnology and Bioengineering 85 (6), 683-694.
Kelly II, R.T. and Love, N.G. (In Review) A new use for ultraviolet spectrophotometric determination of nitrate: Detecting nitrification rates and inhibition. Water Environment Research. Lee, Y.-W., Ong, S.-K., and Sato, C. (1997) Effects of heavy metals on nitrifying bacteria. Water Science and Technology 36 (12), 69-74.
Marstaller, T., Oleszkiewicz, J.A., and Mccartney, D.M. (1992) Effects of chlorination on nitrification. Environmental Technology 13 (11), 1077-1084.
Neethling, J.B., Chung, Y.C., and Jenkins, D. (1987) Activated sludge-chlorine reactions during bulking control. Journal of Environmental Engineering-ASCE 113 (1), 134-146.
Neufeld, R., Greenfeld, J., and Rieder, B. (1986) Temperature, cyanide and phenolic nitrification inhibition. Water Research 20 (5 ), 633-642.
Nowak, O. and Svardal, K. (1993) Observations on the kinetics of nitrification under inhibiting conditions caused by industrial wastewater compounds. Water Science and Technology 28 (2), 115-123.
Pedersen, B., Gernay, K., Vanrolleghem, P.A. (2002) Anoxic activated sludge monitoring with combined nitrate and titrimetric measurements. Water Science and Technology 45 (4-5), 181-190.
Sax, N. and Lewis, R. (1987) Hawley's Condensed Chemical Dictionary. Van Nostrand Reinhold Company, New York, NY.
Stasinakis, A., Thomaidis, N., Mamais, D., Papanikolaou, E., Tsakon, A., and Lekkas, T. (2003) Effects of chromium (VI) addition on the activated sludge process. Water Research 37 ( 9), 2140-2148.

107
Tomlinson, T.G., Boon, A.G., and Trotman, C.N. (1966) Inhibition of nitrification in the activated sludge process of sewage disposal. Journal of Applied Bacteriology 29 (2), 266-91.
United States Environmental Protection Agency. (2005) Technical factsheet on: Cadmium. http://www.epa.gov/OGWDW/dwh/t-ioc/cadmium.html. Accessed on 2/20/05.
Weber, A.S. and Sherard, J.H. (1980) Effects of cadmium on the completely mixed activated sludge process. Journal Water Pollution Control Federation 52, 2378.
White, D. (2000) The physiology and biochemistry of prokaryotes. Oxford University Press, New York, NY.
Wood, L.B., Hurley, B.J.E., and Matthews, P.J. (1981) Some observations on the biochemistry and inhibition of nitrification. Water Research 15, 543-551.

108
6 GLUTATHIONE MEDIATED OXIDATIVE STRESS RESPONSE MECHANISMS IN
NITRIFYING BACTERIA 6.1 Abstract
Nitrification in activated sludge is especially susceptible to oxidative chemical toxins.
Several oxidative stress response mechanisms exist in bacteria, and one highly conserved
biomolecule involved with antioxidant activities is glutathione. In many Gram-negative
heterotrophic bacteria, glutathione mediates the glutathione-gated potassium efflux (GGKE)
response, which activates secondary stress responses that protect important intracellular
components. A search of the genome of the Gram-negative ammonia oxidizing autotroph
Nitrosomonas europaea revealed that glutathione synthase was present, while several key
enzymes involved with glutathione reduction and GGKE are missing; however, other
mechanisms that facilitate potassium efflux for oxidative stress protection may exist.
Experiments were performed using a nitrifying enrichment culture, N. europaea, and the nitrite
oxidizing bacterium Nitrospira moscoviensis. Mixed liquor and Pseudomonas aeruginosa PAO1
were used as positive controls. Concentrations of total and oxidized glutathione were measured
in N. europaea after exposure to the oxidative chemical sodium hypochlorite. The data showed
that glutathione was present but was oxidized to a lesser degree in N. europaea compared to P.
aeruginosa. Additional batch experiments were performed and soluble potassium levels were
monitored to observe increases associated with oxidant induced potassium efflux mechanisms.
Results using N. europaea and Ni. moscoviensis suggest that neither bacteria efflux potassium in
response to the oxidants N-ethylmaleimide or sodium hypochlorite, indicating that no oxidative
stress-induced potassium efflux mechanism exists in these nitrifiers. Coupled with known
genomic information, the results of this study provide greater insight into why nitrification is one
of the most susceptible processes in biological wastewater treatment.
Key Words: Nitrification Inhibition, Glutathione, Potassium Efflux, Oxidative Chemical Shock, Stress Response 6.2 Introduction
Biological wastewater treatment systems are the most common way to treat municipal
wastewaters. Because municipal wastewater systems can receive wastewater from both domestic
and industrial sources, accidental releases of shock loads of industrial chemical toxins can

109
occasionally occur. These releases can upset critical treatment processes, like BOD removal and
nitrification, and cause wastewater treatment facilities to violate discharge permits. Previous
work completed by us (Kelly II et al, 2004) and others (Blum and Speece, 1991; Tomlinson et
al., 1966) has shown that conventional aerobic nitrification was the biological wastewater
treatment process that is most susceptible to chemical inhibition. Recently, we compared the
treatment process upset potential of six chemicals comprising different chemical classes, and all
inhibited nitrification (Love et al., in press). Among those chemicals tested, the representative
oxidative toxin, 1-chloro-2,4-dinitrobenzene (CDNB) was the most detrimental to nitrification.
From this information, we decided to investigate why oxidative chemical toxins inhibit
nitrification more severely than other chemical classes.
The process of nitrification is carried out by two distinct classes of autotrophic Gram-
negative bacteria (Matin, 1978). The ammonia oxidizing bacteria (AOB) convert ammonia to
nitrite (Hooper et al., 1997), while the nitrite oxidizing bacteria (NOB) convert nitrite to nitrate
(Sundermeyer-Klinger et al., 1984) to complete nitrification. Although oxidative chemicals are
widely used in industry, few studies have been performed that examine the effects of these
chemicals on activated sludge or nitrifying bacteria. Instead, previous work has primarily
involved the use of pure cultures of Gram-negative heterotrophic bacteria. From these studies,
two possible modes for oxidative chemical inhibition can be inferred for nitrifying bacteria. The
first mechanism is DNA damage (Ferguson et al., 1996). If the DNA of nitrifying bacteria is
damaged, cells may not be able to produce essential proteins, or may die if the damage is
extensive. The other major mechanism involves oxidizing thiol bonds and nucleophilic centers
in proteins (Ferguson et al., 1997; McLaggan et al., 2000). Two proteins essential to nitrifying
organisms are ammonia monooxygenase (AMO) and nitrite oxidoreductase (NOR). Both
contain thiol bonds and sulfur active sites (Meincke et al., 1992; Hooper et al.. 1997) that can be
oxidized, rendering such proteins inactive (Carmel-Harel and Storz, 2000). In addition, it has
been proposed that the copper cycles between its oxidized and reduced states in active AMO, and
that metal redox cycling is also important in NOR activity (Wood, 1986). Thus, if an oxidizing
agent is present, it would prevent redox cycling of the copper and proper function of AMO.
Unfortunately, only knowing how oxidative chemicals can inhibit nitrifying bacteria does
not explain why they are more susceptible to inhibition by these chemicals. Because all bacteria
have DNA that can be damaged and essential enzymes that contain oxidizable material, there

110
must be some other inhibition mechanism involved that makes them more susceptible. In order
to determine what that is, it is important to examine the known bacterial stress response
mechanisms that nitrifiers have to help protect against oxidative stress. Recently, the complete
sequence of the AOB Nitrosomonas europaea was completed (Chain et al., 2003), allowing for a
complete search of genes related to stress responses and protection within this species. The
known protein coding genes for N. europaea are located at the Protein Information Resource
NREF Database (National Biomedical Research Foundation, 2005) and the N. europaea genome
can be searched at the ORNL N. europaea genome homepage (DOE Joint Genome Institute,
2005). Using these resources, we performed a detailed examination of the genome with relation
to known oxidative stress response mechanisms in other bacteria. Results of this search are
found in Table 6.1, which lists several known oxidative stress response genes and if these genes
are present in N. europaea. Presence of a gene was indicated by an e≤0.001.
Looking at the list of stress response genes on Table 6.1, it appears that the genes
encoding a majority of the protective enzymes are present in N. europaea, even though the
protective enzymes that are present do not appear to be regulated by the same mechanisms found
in other bacteria. Among these include the OxyR and SoxRS regulatory stress response
mechanisms. For example, the genes encoding for the protective enzymes catalase and
superoxide dismutase were found, but the known regulatory genes were not. In addition, a study
by Wood and Sorenson (2001) showed both catalase and superoxide dismutase activity in
different AOB. The one oxidative stress mechanism examined that does not appear to have the
correct genes to function properly is the glutathione-gated potassium efflux (GGKE) mechanism
first described by Kroll and Booth (1981). If this mechanism is missing, it may be one reason
why nitrifying bacteria are more sensitive to oxidative chemical toxins. In this paper, we focus
on the role of glutathione and potassium efflux mechanisms in protecting nitrifying bacteria that
are exposed to oxidative chemical toxins.
The GGKE protection mechanism was first observed in pure cultures of the Gram-
negative bacterium Escherichia coli (Kroll and Booth, 1981). This mechanism, which has been
proposed to play a role in deflocculation events in activated sludge exposed to oxidative
chemicals (Bott and Love, 2002; Bott and Love, 2004), appears to be highly conserved because it
has been found in several Gram-negative heterotrophic species that have been experimentally
tested (Booth et al., 1993). As the name implies, a very important molecule for activation of this

111
stress response mechanism is glutathione. Glutathione is the major soluble non-protein thiol
found in both eukaryotic and prokaryotic cells (Apontoweil and Berends, 1975) and provides a
major cellular defense against oxidative compounds (Carmel-Harel and Storz, 2000; Ferguson et
al., 2000; Ferguson and Booth, 1998). Glutathione helps protect cells from enzyme and DNA
oxidation by acting as a sacrificial nucleophile that scavenges oxidizing chemicals and is
subsequently oxidized or conjugated with the chemical toxin (Vuilleumier, 1997). Once
glutathione is oxidized it can be rereduced by a glutathione reductase (Carmel-Harel and Storz,
2000), which allows for glutathione to be recycled and reused within cells. Glutathione also
protects cells by regulating the potassium efflux response in Gram-negative bacteria, as it
activates the GGKE mechanism when it is oxidized. In studies with E. coli, it appears that only
two potassium efflux channels, KefB and KefC, are regulated, or “gated,” by glutathione
(Ferguson et al., 2000; Ferguson and Booth, 1998). These efflux pumps are potassium-H+
antiporters, which means that as potassium is released, the cytoplasm is acidified; this
acidification response has been found to confer stress resistance to the cell (Ferguson et al.,
2000; Ferguson and Booth, 1998; Ferguson et al., 1997; Ferguson et al., 1996).
After searching the genome of N. europaea for the genes that encode the proteins
involved in the GGKE mechanism, some very interesting absences were noted. A gene coding
for glutathione reductase was not found (Chain et al., 2003), indicating that once the glutathione
is oxidized it cannot be reduced back to the GSH form and continue protection against oxidative
chemicals. No matches were found for KefB and KefC, indicating that known GGKE-linked
channels do not exist in N. europaea and the organism may not be able to acidify its cytoplasm
in response to oxidative stress. In addition, Dps, a DNA protecting protein regulated by several
systems including cytoplasmic pH (Ferguson et al., 1998), is absent from the N. europaea
genome, further lending weight to the argument that acidification of the cytoplasm may not
occur in nitrifying organisms. The absences of these mechanisms from the N. europaea genome
indicate that the organism lacks a GGKE mechanism and other essential oxidative stress
protection mechanisms related to glutathione and GGKE. The lack of these mechanisms may
explain why nitrifying bacteria are sensitive to electrophilic chemicals.

112
Table 6.1 Summary of select genes involved in oxidative stress response mechanisms and their presence in the N. europaea genome.
Gene Name Function Presence in N. europaea Genes involved in the GGKEe mechanism
gshB glutathione synthetase Yes Gst glutathione S-transferase Yes
gorA glutathione oxidoreductase No kefB GGKE protein KefB Noa kefC GGKE protein KefC Noa Dps DNA binding protein Dps No
Genes involved in the oxyR system oxyR oxyR system regulatory protein OxyR No katG hydroperoxidase/catalase Nob
aphCF alkyl hydroperoxide reductase Nob gorA glutathione oxidoreductase No grxA glutaredoxin Nob trxC thioredoxin Noc oxyS regulatory RNA No
Genes involved in the soxRS system soxR soxRS system regulatory protein SoxR No soxS soxRS system regulatory protein Soxs No sodA Manganese superoxide dismutase Nob tolC outer membrane efflux protein TolC Yesd
arcAB multidrug resistance efflux system arcAB Noh a pH adaptation potassium efflux system protein F and D found, but not glutathione regulated b homologous gene with unknown regulation mechanism found c BLAST search yielded protein with similar coding strand d arcAB not found but numerous multidrug efflux pumps located in genome eGlutathione Gated Potassium Efflux
From these genome searches, it is apparent that the known GGKE mechanism is not
present in N. europaea; however, nitrifying bacteria may have a surrogate potassium efflux
mechanism that is used to respond to oxidative compounds. Understanding why nitrification and
nitrifying bacteria are sensitive to oxidative damage, and how these bacteria respond to oxidative
stress may provide insight in determining means to detect and mediate such upset events before
they occur. Therefore, the objective of this study was to determine, first, if glutathione is present
and how it behaves during oxidative shock events in nitrifying bacteria and, second, to examine
if nitrifiers contain a unique and previously unidentified mechanism to efflux potassium in
response to oxidative chemicals. This was accomplished using both enriched and pure cultures
of nitrifying bacteria and shocking them with the oxidative chemicals N-ethylmaleimide (NEM)
and chlorine bleach (as NaOCl). NEM was used because it has previously been found to elicit
the GGKE response in pure cultures (Ferguson et al., 2000) and activated sludge (Bott and Love,
2002), while NaOCl was chosen because it is a commonly used oxidative chemical that is used
for activated sludge bulking control (Neethling et al., 1987). These cultures were monitored to

113
see if potassium was released into the solution, indicating that an alternative mechanism for
potassium efflux exists, though GGKE may be occurring. For these experiments, mixed liquor
was used as a positive control. In addition, total and oxidized glutathione levels were monitored
to determine if glutathione is present and oxidized in response to increasing concentrations of
chlorine bleach. Three pure cultures were chosen for these experiments: Nitrosomonas
europaea, Nitrospira moscoviensis, and Pseudomonas aeruginosa PAO1. N. europaea was the
AOB chosen for because it is the most commonly studied AOB (Schramm et al., 1998b) and it is
the only autotrophic bacterium with a sequenced genome (Chain et al., 2003). Ni. moscoviensis
was used as the representative NOB because several studies have found that Nitrospira species
are the dominant NOB populations in activated sludge (Schramm et al., 1998a; Burrell et al.,
1998). P. aeruginosa PAO1 was chosen for use as a positive control bacterium because it is
known to contain the GGKE mechanism (Stover et al., 2000).
6.3 Methodology
6.3.1 Bacterial Cultures and Growth Conditions
Mixed Liquor Source Description and Sample Treatment
Mixed liquor was obtained the morning of each experiment from the Blacksburg-VPI
Wastewater Treatment Facility at Stroubles Creek. The treatment process at the Stroubles Creek
facility consists of a nitrifying activated sludge treatment process with a 10-14 day solids
retention time (SRT). Mixed liquor grab samples were taken directly from the aerated mixed
liquor basins and transported to the laboratory within 20 minutes. The mixed liquor samples
were aerated, magnetically mixed, and continuously fed a synthetic wastewater solution as
previously described (Kelly et al., 2004) to mimic the average feed loading conditions at the
Stroubles Creek facility and to maintain a constant biomass composition for experiments. The
total volume of feed solution used was less than 2% of the volume of mixed liquor; therefore,
suspended solid concentrations were not significantly changed throughout the experiment (2-4
hours). This was confirmed by measuring mixed liquor volatile suspended solids (MLVSS) at
various times during the experiment. Mixed liquor suspended solids (MLSS) and MLVSS were
measured in triplicate according to sections 2540 D and 2540 E of Standard Methods (1998).

114
Nitrifying Enrichment Culture
A nitrifying enrichment culture was maintained in a 15 L chemostat operated at a 15 day
HRT/SRT. The culture was initially seeded with mixed liquor from the Blacksburg VPI
Stroubles Creek Wastewater Treatment Facility. The reactor was completely mixed using a 104
rpm paddle mixer and aerated to maintain a DO concentration above 4.0 mg/L. The reactor was
batch fed (42 ml in 30 seconds every hour) approximately 1,350 mg/L-N (about 90 mg/L in the
reactor) (NH4)2CO3 in the N. europaea medium described below (without the phenol red or
(NH4)2SO4). Routine analysis of the reactor was performed once steady state was achieved and
showed that total ammonia concentrations (measured according to methods 4500-NH3 B and
4500-NH3 C in Standard Methods (APHA, 1998) were undetectable in the effluent. Steady
state solids concentrations were approximately 500 mg/L MLSS and 450 mg/L MLVSS.
Ammonia Oxidizing Bacterium: Nitrosomonas europaea
The N. europaea cells were grown under sterile conditions using medium composed of
0.2 g/L MgSO4·7H20, 20 mg/L CaCl2·2H20, 87 mg/L K2HPO4, 2.52 g/L EPPS, 10 µg/L
Na2MoO4·2H20, 17.2 µg/L MnSO4·H20, 0.4 µg/L CoCl2·7H20, 170 µg/L CuCl2·2H20, 10 µg/L
ZnSO4·7H20, 100 µg/L chelated iron, 250 µg/L phenol red and 1.32 g/L (NH4)2SO4 at 29ºC in
the dark in 5 L batch cultures. Sterile aeration was provided and mixing was achieved with
magnetic stirrers. Growth curves were developed by measuring nitrite and performing cell
counts. Nitrite samples were stored at -20oC for no more than 28 days prior to analysis and
analyzed using a colorimetric procedure (method 4110 B) as described in Standard Methods
(APHA, 1998). Cell counts were performed using a Helber bacteria single round cell counting
chamber manufactured by Weber Scientific International (Middlesex, UK).
Nitrite Oxidizing Bacterium: Nitrospira moscoviensis
Ni. moscoviensis was cultured at 32ºC in 5 L batch flasks with sterile aeration and
magnetic mixing. The medium used was described by Ehrich et al. (1995) with one
modification; 10 mg/L EDTA was added to prevent precipitation of phosphate salts. Growth
curves for this organism were developed by examining nitrate production and cell counts. Cell
counts were performed as described for N. europaea above. Nitrate samples were stored at -
20oC for no more than 28 days prior to analysis and analyzed using ion chromatography (method
4110 C) as described in Standard Methods (APHA, 1998). Upon thawing the samples, 5 ml of
each was loaded into a vial and placed into an AS40 autosampler. Samples were injected into a

115
Dionex DX120 suppressed conductivity ion chromatograph containing an AS14 anion separation
column with an AG14 guard column for anion analysis (Dionex Corp., Sunnyvale, CA).
Samples were carried in an eluent of 3.5 mM Na3CO3 and 1.0 mM NaHCO3.
Bacterium Known to Contain GGKE Mechanism: Pseudomonas aeruginosa strain PAO1
P. aeruginosa PAO1 was grown at 20°C in the dark in 1 L batch flask with aeration and
mixing provided by shaking. It was grown in full strength mineral salts (FSMS) medium
containing 186 mg/L EDTA, 11 mg/L FeCl2·2H2O, 150 mg/L MgSO4·7H2O, 4.5 mg/L
MnSO4·4H2O, 500 µg/L NaMoO4·2H2O, 150 µg/L H3BO3, 100 mg/L NH4Cl, 1.64 g/L
NaAcetate, 20 mg/L CaCl2, 1.5 mg/L ZnCl2, 500 µg/L CuCl2·2H2O, 1.5 mg/L CoCl2·6H2O, 1.5
g/L NaH2PO4·2H2O, 3 g/L Na2HPO4·7H2O, 0.5 g/L NH4Cl, 0.25 g/L NaCl) and approximately 5
mg/L potassium (added as KH2PO4) so that the soluble potassium concentration was sufficiently
low to allow for better detection of the increase in soluble potassium associated with potassium
efflux, but not growth limiting. Growth curves for this organism were developed by performing
cell counts as described for N. europaea above.
6.3.2 Potassium Efflux Determination
Potassium efflux was determined in the enrichment culture using an experimental batch
reactor that received chemical oxidative toxins, a negative control reactor (no chemical addition)
and a positive control reactor (chemical addition to mixed liquor, which has been previously
shown to efflux K+; in response to oxidative chemical shock (Bott and Love, 2002). A minimum
suspended solids concentration of 1,600 mg/L MLVSS was required to readily detect K+ efflux.
To achieve this, the enrichment culture was washed, concentrated to 1,600 mg/L MLVSS and
resuspended in low K+ media to avoid high background K+ levels. For experiments, 100 ml of
enrichment culture or mixed liquor was mixed, aerated, and fed with each culture’s normal
growth substrate (20 mg/L-N ammonium carbonate for the enrichment culture and 100 mg/L of
COD solution for the mixed liquor (Kelly II et al., 2004)) to allow for normal aerobic respiration
of the bacteria. At least two samples for soluble, total and cell/floc-associated (biomass-
associated) K+ were analyzed according to the method presented by Bott and Love (2002). A K+
balance was performed by comparing the total K+ in the samples to the soluble + cell/floc-
associated fractions; if K+ efflux occurred, the soluble fraction of K+ increased while the
cell/floc-associated fraction decreased. Triplicate samples were taken from each reactor before

116
adding 50 mg/L N-ethylmaleimide (NEM), and 2.5, 5, 7.5, 10, 15, and 20 minutes after addition.
NEM is an oxidative chemical that has been previously found to elicit K+ efflux in mixed liquor
(Bott and Love, 2002) and Gram-negative bacteria (Ferguson et al., 2000). All experiments were
run at least twice to confirm results. Sample processing is described below.
One ml samples for total potassium were removed from the reactors at designated times
and digested according to a modified EPA method performed by Bott and Love (2002). For this,
samples were acidified using nitric acid (to a 10% nitric acid solution) and digested in a closed
reflux method by boiling at 100°C for 30 minutes. Digested samples were then diluted 1:10 and
filtered through a 0.45 µm filter for K+ analysis. Soluble and cell/floc-associated samples were
fractionated using the following procedure. Samples (1.2 ml) were removed from the reactors
and placed into a microcentrifuge tube containing 200 µl of non-toxic dimethyl-
tetrachlorophenylsiloxane copolymer (ρ=1.019 g/cm3). The samples were then centrifuged at
13,000 x g for 2 minutes to separate the cells from the liquid. The copolymer was used to
separate the solid pellet (cell/floc-associated fraction) from the liquid supernatant (soluble-
fraction). The copolymer also formed a non-permeable barrier so that potassium associated with
the cells could not diffuse into the supernatant before the fractions were removed for analysis.
After separation, 1 ml of the supernatant was removed and diluted 1:10 using 2% nitric acid, then
storaged until it could be analyzed for K+. For the cell/floc pellet, the copolymer was removed,
the pellet was resuspended in one ml of 10% nitric acid and the suspension was digested and
treated for K+ analysis as described above for the total fraction. All K+ samples were analyzed
using a Perkin-Elmer flame atomic adsorption spectrophotometer (Perkin Elmer Inc., Wellesley,
MA) according to method 3500-K B in Standard Methods (APHA, 1998).
For pure cultures, K+ efflux was determined using an experimental batch reactor (NEM
or NaOCl addition to either N. europaea or Ni. moscoviensis), a negative control reactor (no
oxidant addition) and a positive control reactor (oxidant addition to P. aeruginosa PAO1). An
additional positive control experiment was also performed using pure cultures of each organism
exposed to nigericin, an antibiotic that causes bacteria to leak cytoplasmic K+ into solution
(Hofer, 1977). Previous work done in our labs with pure cultures found that a minimum cell
concentration of 109 cells/ml was required to detect K+ efflux using the methods employed in
this study. Therefore, all pure cultures were concentrated (again in low K+ media) to at least this
concentration for experiments. Experiments were conducted when the pure cultures reached
117
late-log phase growth. All reactors were mixed, aerated, and fed with each culture’s normal
growth substrate (ammonium sulfate for N. europaea, sodium nitrite for Ni. moscoviensis, and
sodium acetate for P. aeruginosa PAO1) to allow for normal aerobic respiration of the bacteria.
As with the enrichment culture, at least two samples for soluble, total and cell-associated
(biomass-associated) K+ were analyzed according to the method presented by Bott and Love
(2002). Samples were taken from each reactor before any oxidative chemical was added, and 15,
45 and 90 minutes after addition. Sample treatment was the same as described above. To
confirm results, experiments were run at least twice. At the conclusion of pure culture
experiments, Live/Dead staining was performed using the BacLight™ Bacterial Viability Kit
available from Molecular Probes© to determine if significant bacterial death occurred in response
to the added chemicals.
6.3.3 Glutathione Determination in Pure Cultures
Glutathione concentrations were determined using experimental reactors (N. europaea), a
negative control reactor (no chemical addition) and a positive control reactor (chemical addition
to P. aeruginosa PAO1; an organism known to have glutathione). Mixed liquor was also tested,
but high variability was observed for the total and oxidized glutathione data, which prevented
use of the method within the mixed liquor matrix.
For experiments, pure cultures were concentrated in their growth media to a minimum of
1010 cells/ml, as previous work done in our labs with pure cultures found this to be adequate for
examining glutathione. Ni. moscoviensis was not used in these experiments because it was
difficult to achieve the cell concentrations that were required to detect glutathione using the
method presented below. As with the K+ efflux experiments, all experiments were conducted
when the pure cultures reached the late-log growth phase and all reactors were mixed, aerated,
and fed with each culture’s normal growth substrate.
As with the efflux experiments, at least two samples for oxidized and total glutathione
were analyzed colorimetrically using the Bioxytech® GSH/GSSG-412TM (oxidized) and GHS-
420TM (total) glutathione analysis kits manufactured by Oxis Research TM (Oxis International,
Portland, OR). For these experiments, varying concentrations of sodium hypochlorite (bleach)
were added and samples were taken after 20 minutes of exposure, because it was determined that
near maximum K+ efflux occurred after that time. In order to remove chemical interferences

118
caused by chlorine, 3 to 5 mL samples were washed by centrifugation at 3400 x g and
resuspended in phosphate buffer (3.4 g/L KH2PO4 and 4.35 g K2HPO4, pH= 6.9). Cells were
then ruptured for glutathione analysis by passing the samples through a SLM/AMINICO
French® pressure cell press and 40,000 psi AMINICO pressure cell 3 times at 15,000 psi
(AMINICO, Silver Spring, MD). Samples were then analyzed according to the method as
suggested by Oxis Research TM for the oxidized and total glutathione test kits. To confirm
results, experiments were performed at least twice. NEM was tested but generated highly
variable and inconclusive results, presumably because of a chemical interference with the
method; therefore, results based on NEM stress are not presented here.
The total glutathione concentrations measured in each of the chlorine shocked systems
were averaged. This was done after regression analysis of the data showed that there were no
statistically significant differences between the total glutathione measured in the control cells and
any of the chlorine shocked cells for either N. europaea (p=0.86) or P. aeruginosa (p=0.17)
using a 95% confidence interval (α=0.05).
6.4 Results and Discussion
6.4.1 Nitrifying Enrichment Culture Showed Low K+ Efflux
Enrichment culture potassium efflux experiments did not conclusively reveal whether or
not potassium efflux occurs in nitrifying bacteria. For the initial experiment, the enrichment
culture was concentrated to yield a suspended solids concentration of 1,699 ± 42 mg/L TSS and
1,580 ± 42 mg/L VSS. For the mixed liquor, the suspended solids concentration tested was
1,633 ± 19 mg/L MLSS and 1,356 ± 16 mg/L MLVSS. These values were within the range that
was previously determined to be sufficient to detect K+ efflux (data in Appendix D). Figure 6.1
shows the soluble K+ results for both the unshocked controls and NEM-shocked enrichment and
mixed liquor cultures. This figure shows that for both the enrichment and mixed liquor NEM-
shocked reactors, the soluble K+ levels increased with time, which suggests that K+ efflux was
occurring in both cultures. As expected, the control reactors for both cultures did not
significantly change over the duration of the experiment. Furthermore, the results show that the
maximum increase in soluble K+ for the positive control mixed liquor was about 2.2 mg/L while
the enrichment culture, which had a similar suspended solids concentration, only increased by
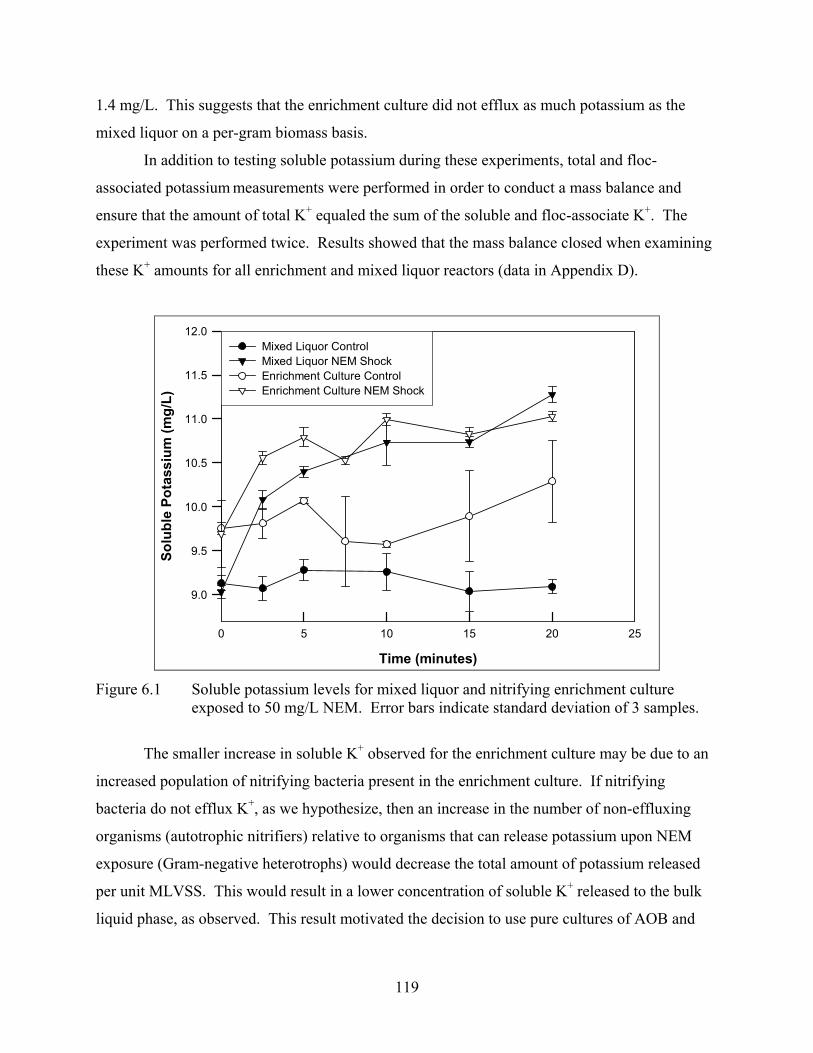
119
1.4 mg/L. This suggests that the enrichment culture did not efflux as much potassium as the
mixed liquor on a per-gram biomass basis.
In addition to testing soluble potassium during these experiments, total and floc-
associated potassium measurements were performed in order to conduct a mass balance and
ensure that the amount of total K+ equaled the sum of the soluble and floc-associate K+. The
experiment was performed twice. Results showed that the mass balance closed when examining
these K+ amounts for all enrichment and mixed liquor reactors (data in Appendix D).
Time (minutes)
0 5 10 15 20 25
Solu
ble
Pota
ssiu
m (m
g/L)
9.0
9.5
10.0
10.5
11.0
11.5
12.0Mixed Liquor ControlMixed Liquor NEM ShockEnrichment Culture ControlEnrichment Culture NEM Shock
Figure 6.1 Soluble potassium levels for mixed liquor and nitrifying enrichment culture
exposed to 50 mg/L NEM. Error bars indicate standard deviation of 3 samples.
The smaller increase in soluble K+ observed for the enrichment culture may be due to an
increased population of nitrifying bacteria present in the enrichment culture. If nitrifying
bacteria do not efflux K+, as we hypothesize, then an increase in the number of non-effluxing
organisms (autotrophic nitrifiers) relative to organisms that can release potassium upon NEM
exposure (Gram-negative heterotrophs) would decrease the total amount of potassium released
per unit MLVSS. This would result in a lower concentration of soluble K+ released to the bulk
liquid phase, as observed. This result motivated the decision to use pure cultures of AOB and

120
NOB for further K+ efflux experiments since they can be used to definitively determine if
potassium efflux does or does not occur in nitrifying bacteria.
6.4.2 Nitrifying Pure Cultures Showed No K+ Efflux
The pure culture experiments showed that potassium efflux did not occur in either N.
europaea or Ni. moscoviensis cultures in response to either NEM or chlorine, but did occur for P.
aeruginosa cultures used as a positive control. The soluble K+ levels measured during the NEM
experiments are shown in Figures 6.2, 6.3 and 6.4. When examining the results of the first
experiment, no significant increase in soluble K+ was observed in the 50 mg/L NEM shocked
cells when compared to the unshocked control N. europaea culture (Figure 6.2). The P.
aeruginosa positive control culture (Figure 6.4) shows a maximum increase of about 2.8x10⁻¹²
mg/cell soluble K+ in the NEM shocked cells when compared to the unshocked control over the
90 minute experiment. For these two cultures, control soluble K+ levels remained relatively
constant for the duration of the experiment. However, for the Ni. moscoviensis culture, control
soluble K+ levels decreased by approximately 0.8x10⁻¹² mg/cell over the course of the
experiment (Figure 6.3). For this culture, NEM shocked cells also showed a modest 0.6x10⁻¹²
mg/cell maximum increase in soluble K+ over the initial sample (Time 0) taken just prior to the
addition of NEM. This increase was much smaller than the 2.8x10⁻¹² mg/cell increase observed
for the P. aeruginosa culture that is known to contain the GGKE mechanism, which suggests
that the slight increase observed for Ni. moscoviensis was not significant. Subsequent
experiments with Ni. moscoviensis confirmed that no potassium efflux occured, as the NEM-
shocked reactors did not show elevated soluble K+ levels relative to the control reactors during
two subsequent experiments (data in Appendix D). Repeats of these experiments for the N.
europaea and P. aeruginosa cultures also showed the same trends shown in Figures 6.2 and 6.4,
respectively.
For all cultures, the potassium selective ionophore nigericin was also used as a positive
control to test if K+ was present in, and could be released from, the cytoplasm of the cells. The
soluble K+ levels in all cultures increased by 0.4, 1.3, and 0.8x10⁻¹² mg/cell for N. europaea, Ni.
moscoviensis, and P. aeruginosa, respectively (Figures 6.2, 6.3 and 6.4), which indicated that
potassium was present and released In addition, Live/Dead staining showed that significant cell
death did not occur in cells exposed to NEM or nigericin for any of the cultures (data in

121
Appendix D). This indicates that the concentrations of NEM and nigericin added did not kill the
cells and that the K+ efflux observed for P. aeruginosa was most likely due to activation of the
GGKE mechanism and not cell lysis .
Time (minutes)
0 20 40 60 80 100
Solu
ble
Pota
ssiu
m (m
g/ce
ll)
1.2e-12
1.4e-12
1.6e-12
1.8e-12
2.0e-12
2.2e-12ControlNigericin 75 mg/LNEM 50 mg/L
Figure 6.2 Soluble potassium for unshocked control, nigericin and NEM-shocked reactors of
N. europaea. Cell concentration at the beginning of the experiment was 3.72x10⁹
cells/ml. Error bars indicate the range of 2 samples.

122
Time (minutes)
0 20 40 60 80 100
Solu
ble
Pota
ssiu
m (m
g/ce
ll)
1e-12
2e-12
3e-12
4e-12
ControlNigericin 75 mg/LNEM 50 mg/L
Figure 6.3 Soluble potassium for unshocked control, nigericin and NEM-shocked reactors of
Ni. moscoviensis. Cell concentration at the beginning of the experiment was >1x10⁹
cells/ml. Error bars indicate the range of 2 samples.
Time (minutes)
0 20 40 60 80 100
Solu
ble
Pota
ssiu
m (m
g/ce
ll)
4e-12
5e-12
6e-12
7e-12
8e-12ControlNigericin 75 mg/LNEM 50 mg/L
Figure 6.4 Soluble potassium for unshocked control, nigericin, and NEM-shocked reactors of
P. aeruginosa PAO1. Cell concentration at the beginning of the experiment was 2.00x10⁹
cells/ml. Error bars indicate the range of 2 samples.

123
Chlorine bleach was also tested at concentrations of 4.72x10⁻¹⁰ and 23.6x10⁻¹⁰ mg/cell (1
and 5 mg/L as Cl2) and showed no potassium efflux for the N. europaea culture (Figure 6.5). P.
aeruginosa cultures did show efflux at both concentrations of added NaOCl (Figure 6.6). At
4.72x10⁻¹⁰ mg Cl2/cell, maximum K+ efflux was about 0.7x10⁻¹² mg K+/cell over the control
reactor. For 23.6x10⁻¹⁰ mg Cl2/cell, the efflux was 2.9x10⁻¹² mg K+/cell, which is very similar to
what was observed for 50 mg/L of NEM. As with NEM, Live/Dead staining showed that no
significant cell death occurred in cells exposed to 4.72x10⁻¹⁰ or 23.6x10⁻¹⁰ mg Cl2/cell for any of
the cultures (data in Appendix D). These results further support the previous findings that N.
europaea does not efflux potassium in response to oxidative chemical toxins.
Time (minutes)
0 20 40 60 80 100
Solu
ble
Pota
ssiu
m (m
g/ce
ll)
1.0e-12
1.5e-12
2.0e-12
2.5e-12
3.0e-12
3.5e-12Control 4.72x10⁻¹⁰ mg/cell Cl223.6x10-10 mg/cell Cl2
Figure 6.5 Average soluble potassium for unshocked control and chlorine-shocked reactors
of N. europaea. Cell concentration at the beginning of the experiment was 2.12x10⁹
cells/ml. Error bars indicate the standard deviation of 3 independent reactor samples. Control only used 2 independent reactor samples

124
Time (minutes)
0 20 40 60 80 100
Solu
ble
Pota
ssiu
m (m
g/ce
ll)
1.0e-12
1.5e-12
2.0e-12
2.5e-12
3.0e-12
3.5e-12Control3.62x10-10 mg/cell Cl218.1x10-10 mg/cell Cl2
Figure 6.6 Average soluble potassium for unshocked control and chlorine-shocked reactors
of P. aeruginosa PAO1. Cell concentration at the beginning of the experiment was 2.76x10⁹
cells/ml. Error bars indicate the standard deviation of 3 independent reactor samples. Control only used 2 independent reactor samples.
Since potassium was not released from either of the selected AOB and NOB cultures that
were exposed to NEM or chlorine bleach (NaOCl), no mechanism is present that releases
intracellular potassium in response to oxidative chemical shocks. The potassium results confirm
the genomic search results from N. europaea, which indicated that the genes coding for the
glutathione-gated potassium/proton efflux channels required for potassium efflux are not present
in the genome (Table 6.1). These results provide the first reported evidence of a Gram-negative
bacteria that does not contain a potassium efflux mechanism for responding to oxidative stress,
which was thought to be highly conserved in these bacteria (Booth et al., 1993). These are also
the first autotrophic bacteria that have been examined for oxidant-induced potassium efflux,
which may suggest that other autotrophic Gram-negative bacteria may not contain a potassium
efflux oxidative stress response mechanism either.
Although these bacteria do not release potassium, they may contain some other means of
acidifying their cytoplasm to protect against oxidative chemicals. Cytoplasmic acidification in
response to oxidants was not tested during this study, but given that potassium efflux does not
occur in response to oxidative chemicals, it seems unlikely that this type of protection

125
mechanism exists in these bacteria. Examining this protection mechanism on an evolutionary
basis further lends weight to the argument that cytoplasmic acidification does not occur in
nitrifiers. It has previously been shown that the growth substrate for AOB is NH3, not NH4+
(Suzuki et al., 1974). At lower pH, ammonia is primarily in the protonated form (NH4+), and is
not able to be used by the bacteria for generation of energy or reducing power. Therefore, any
cytoplasmic acidification, at least in AOB, would be detrimental to energy production and
production of reducing compounds that are needed to help mediate damage and control stress
responses. The same may hold true for NOB, as lower pH would keep nitrite protonated as
nitrous acid, which has been found to be highly toxic to nitrifying bacteria in activated sludge
(Anthonisen et al., 1976). Low pH conditions have also caused nitrification inhibition in
wastewater treatment facilities and pure cultures of AOB and NOB (Anthonisen et al., 1976;
Princic et al., 1998; Grunditz and Dalhammar, 2001). In addition, it has been thought that
GGKE originally evolved as a protection mechanism for methyglyoxal, which is an oxidative
byproduct of glucose metabolism (Ferguson et al., 2000; Ferguson and Booth, 1998). As
nitrifying bacteria are autotrophic and do not metabolize glucose, they would have had no need
to develop the GGKE response. Therefore, the GGKE mechanism may not have evolved in
nitrifying bacteria, or was removed from nitrifying bacteria because it may interfere with
metabolism of ammonia and nitrite.
6.4.3 Glutathione in Nitrosomonas and Pseudomonas is Oxidized by Chlorine
Experiments testing the presence and oxidized state of glutathione in response to sodium
hypochlorite shock showed that glutathione is present in both N. europaea and P. aeruginosa,
and became oxidized in response to increasing concentrations of free chlorine. The oxidized
glutathione concentrations are shown in Figure 6.7. This figure shows that the amount of
oxidized glutathione increased as the amount of free chlorine in solution increased, which is in
agreement with the results obtained by Chesney et al. (1996). An exception to this was observed
for P. aeruginosa exposed to 25 mg/L of free chlorine. If a trend line is fit to the data, then the
glutathione oxidized per mg chlorine added can be determined. For this experiment, the
glutathione in P. aeruginosa was oxidized stoichiometrially at 9.80 nmoles/mg of added free Cl2
(ignoring the 25 mg/L point). This compares to 4.48 nmoles/mg of added free Cl2 observed for
N. europaea, or stoichometric equivalent that is 2.2x higher. A repeat of the experiment yielded

126
slightly different stoichometric equivalents (6.19 and 2.58 nmoles/mg of added free Cl2 for P.
aeruginosa and N. europaea, respectively) but the equivalent for Pseudomonas was still 2.4x
higher than that of the Nitrosomonas, which is consistent with the initial experiments. Therefore,
although the stoichiometric oxidation equivalents were not the same, the overall trend observed
for glutathione oxidation during the experiments was repeatable.
Free Chlorine Concentration (mg/cell)
0.0 2.0e-13 4.0e-13 6.0e-13 8.0e-13 1.0e-12 1.2e-12 1.4e-12
Rat
io o
f O
xidi
zed
Glu
tath
ione
/Ave
rage
Tot
al G
luta
thio
ne
0.010
0.012
0.014
0.016
0.018
0.020
0.022
0.024
0.026P. aeruginosaN. europaea
Figure 6.7 Ratio of oxidized glutathione to average total glutathione concentrations for N.
europaea and P. aeruginosa cells exposed to sodium hypochlorite for 20 minutes. Cell concentrations at the beginning of the experiment were 2.02 x 10¹⁰
cells/ml for N. europaea and 1.86x10¹⁰
cells/ml for P. aeruginosa. Error bars indicate the range of 2 samples.
As stated above, the only point that did not follow an increasing trend for oxidized
glutathione was the 25 mg/L chlorine concentration for P. aeruginosa. Although the exact
reason for this decrease is unknown, it could be related to a sharp drop in total glutathione noted
for the same time point. The drop in total and oxidized glutathione observed for P. aeruginosa
may have been caused by chlorine induced cell lysis. Because all cells were washed prior to
lysis on the French® press, washing the cells would have removed any glutathione in the bulk
solution from chlorine induced lysis. Total glutathione levels during the repeats were at
approximately the same concentration; however, data was more variable and no trends were
127
observed (data in Appendix D). For both cultures, the cellular glutathione concentrations ranged
from 7x10⁻¹⁰ to 14x10-10 nmoles/cell. This is similar to a level of 7x10⁻¹⁰ nmole/cell reported by
Fahey and coworkers (1978) for P. fluorescens. In addition, several studies have shown that the
oxidized form of glutathione composes as little as 5% of the total glutathione during homeostasis
(Apontoweil and Berends, 1975; Fahey et al., 1978), which is similar to what has been shown
here for initial conditions (~2-3%). Taken together, the results obtained during this study
confirm the concentrations and behavior of glutathione that have been found by others.
The results show that glutathione behaved similarly in both P. aeruginosa and N.
europaea in that increasing concentrations of oxidized glutathione were observed when the cells
were exposed to increasing concentrations of chlorine. The presence of glutathione in N.
europaea was not surprising, knowing the highly conserved nature of glutathione and the
important role glutathione has in protecting cells. However, the lower amount of glutathione
oxidized per mg of chlorine was unexpected. Because the enzyme glutathione reductase was not
found in the genome of N. europaea, we expected to see more oxidized glutathione per cell
because it cannot be re-reduced during the oxidation event. Therefore, it appears that the lack of
glutathione reductase is not detrimental to glutathione behavior during an oxidation event.
Glutathione is not only important in the GGKE mechanism, but also as a reductant for
other important enzymatic systems. One such enzyme that has been found in both P. aeruginosa
(Stover et al., 2000) and N. europaea (Chain et al., 2003) is glutathione peroxidase, which helps
reduce toxic oxidative chemicals using glutathione as a reductant (Carmel-Harel and Storz,
2000). Thus, glutathione is important for oxidative stress response in nitrifiers, even if a
glutathione mediated potassium efflux mechanism does not exist. However, the question
remains: why are nitrifiers more susceptible to oxidative stressors? This may be explained in
part by the lack of a potassium efflux mechanism for cytoplasmic acidification. It may also be
partially explained by the lower rate of glutathione oxidation that was observed for N. europaea
when compared with P. aeruginosa. This lower rate may be caused by the inability of the
oxidant (chlorine) to penetrate the cells and make contact with the glutathione in the cytoplasm.
Since nitrifying bacteria have very large cytoplasmic membrane invaginations, oxidants may
take longer to reach the cytoplasm and have more time to react with membrane lipids and
membrane associated proteins like ammonia monooxygenase and nitrite oxidoreductase. This
would lead to a smaller amount of oxidant reaching the cytoplasm, less glutathione being
128
oxidized, and more damage to important metabolic enzymes. Therefore, the increased inhibition
that has been observed for nitrifiers in response to oxidative chemicals in wastewater treatment
processes (Kelly II et al., 2004) is likely caused not only by a lack of protection mechanisms like
GGKE, but also to large membranes that hinder oxidant movement to the cytoplasm and contain
important metabolic enzymes, like AMO and NOR, that can be easily oxidized by these
chemicals.
6.5 Conclusions
We conclude that N. europaea and Ni. moscoviensis do not contain a surrogate of the
glutathione gated potassium efflux mechanism that is found in other Gram-negative bacteria, or
any oxidant responsive potassium efflux mechanism. This work provides the first evidence of
Gram-negative bacteria that do not contain the GGKE mechanism and the first work where an
autotrophic organism was studied. The reason these bacteria lack a GGKE mechanism for
cytoplasmic acidification may be evolutionary, as acidification is detrimental to metabolic
processes within the cells.
These results also indicate that glutathione in N. aeruginosa and P. aeruginosa is
oxidized in response to chlorine bleach but the amount of glutathione oxidized per mg of
chlorine was lower in N. europaea than in P. aeruginosa. This may be due do the large
membrane invaginations in nitrifying bacteria that hinder the passage of oxidative chemicals into
the cytoplasm and allow the oxidative chemicals to react more easily with important membrane
bound enzymes like ammonia monooxygenase and nitrite oxidoreductase. Together, the lack of
a K+ efflux oxidative stress response mechanism and the possible high reactivity with membrane
bound enzymes may explain why oxidative chemicals easily inhibit nitrifiers.
6.6 References
Anthonisen, A.C., Loehr, R.C., Prakasam, T.B.S., and Srinath, E.G. (1976) Inhibition of nitrification by ammonia and nitrous acid. Journal of the Water Pollution Control Federation 48 (5), 835-852.
APHA (1998) Standard methods for the examination of water and wastewater. APHA, Washington, DC.
Apontoweil, P. and Berends, W. (1975) Isolatoin and characterisation of glutathione-deficient mutants of Escherichia coli. Biochimica et Biophysica Acta 399, 359-378.

129
Bakker, E.P., Booth, I.R., Dinnbier, U., Epstein, W., and Gajewska, A. (1987) Evidence for multiple K+ export systems in Escherichia coli. Journal of Bacteriology 169 (8), 3743-3749.
Blum, D.J.W. and Speece, R.E. (1991) A database of chemical toxicity to environmental bacteria and its use in interspecies comparisons and correlations. Research Journal Water Pollution Control Federation 63 (3), 198-207.
Booth, I.R., Douglas, R.M., Ferguson, G.P., Lamb, A.J., Munro, A.W., and Ritchie, G.Y. (1993) K+ efflux systems. In: Bakker, E.P. (ed), Alkali Cation Transport Systems in Prokaryotes, pp. 291-309, CRC Press, Boca Raton, FL.
Bott, C. and Love, N. (2002) Investigating a mechanistic cause for activated sludge deflocculation in response to shock loads of toxic electrophilic chemicals. Water Environment Research 74 (3), 306-315.
Bott, C. and Love, N. (2004) Implicating the glutathione-gated potassium efflux system as a cause of electrophile-induced activated sludge deflocculation. Applied and Environmental Microbiology 70 (9), 5569-5578.
Burrell, P.C., Keller, J., and Blackall, L.L. (1998) Microbiology of a nitrite-oxidizing bioreactor. Applied and Environmental Microbiology 64 (5), 1878-83.
Carmel-Harel, O. and Storz, G. (2000) Roles of the glutathione- and thioredoxin-dependent reduction systems in the Escherichia coli and Saccharomyces cerevisiae responses to oxidative stress. Annual Reviews in Microbiology 54, 439-61.
Chain, P., Lamerdin, J., Larimer, F., Regala, W., Lao, V., Land, M., Hauser, L., Hooper, A., Klotz, M., Norton, J., Sayavedra-Soto, L., Arciero, D., Hommes, N., Whittaker, M., and Arp, D. (2003) Complete Genome sequence of the ammonia-oxidizing bacterium and obligate chemolithoautotroph Nitrosomonas europaea. Journal of Bacteriology 185 (9), 2759-2773.
Chesney, J.A., Eaton, J.W., and Mahoney, J.R. (1996) Bacterial glutathione: a sacrificial defense against chlorine compounds. Journal of Bacteriology 178 (7), 2131-2135.
DOE Joint Genome Institute. (2005) Computational biology at ORNL: Nitrosomonas europaea complete genome sequence and annotation. http://genome.ornl.gov/microbial/neur/embl/
Ehrich, S., Behrens, D., Lebedeva, E., Ludwig, W., and Bock, E. (1995) A new obligately chemolithoautotrophic, nitrite-oxidizing bacterium, Nitrospira moscoviensis sp-nov and its phylogenetic relationship. Archives of Microbiology 164 (1), 16-23.
Fahey, R.C., Brown, W.C., Adams, W.B., and Worsham, M.B. (1978) Occurrence of glutathione in bacteria. Journal of Bacteriology 133 (3), 1126-1129.
Ferguson, G.P., Battista, J.R., Lee, A.T., and Booth, I.R. (2000) Protection of the DNA during the exposure of Escherichia coli cells to a toxic metabolite: the role of the KefB and KefC potassium channels. Molecular Microbiology 35 (1), 113-22.

130
Ferguson, G.P. and Booth, I.R. (1998) Importance of glutathione for growth and survival of Escherichia coli cells: detoxification of methylglyoxal and maintenance of intracellular K+. Journal of Bacteriology 180 (16), 4314-8.
Ferguson, G.P., Chacko, A.D., Lee, C.H., Booth, I.R., and Lee, C. (1996) The activity of the high-affinity K+ uptake system Kdp sensitizes cells of Escherichia coli to methylglyoxal. Journal of Bacteriology 178 (13), 3957-61.
Ferguson, G.P., Creighton, R.I., Nikolaev, Y., and Booth, I.R. (1998) Importance of RpoS and Dps in survival of exposure of both exponential- and stationary-phase Escherichia coli cells to the electrophile N-ethylmaleimide. Journal of Bacteriology 180 (5), 1030-6.
Ferguson, G.P., Nikolaev, Y., McLaggan, D., Maclean, M., and Booth, I.R. (1997) Survival during exposure to the electrophilic reagent N-ethylmaleimide in Escherichia coli: role of KefB and KefC potassium channels. Journal of Bacteriology 179 (4), 1007-12.
Grunditz, C. and Dalhammar, G. (2001) Development of nitrification inhibition assays using pure cultures of Nitrosomonas and Nitrobacter. Water Research 35 (2), 433-440.
Hofer, M. (1977) Transport across biological membranes. Pitman Advanced Publishing Program, Boston, MA.
Hooper, A.B., Vannelli, T., Bergmann, D.J., and Arciero, D.M. (1997) Enzymology of the oxidation of ammonia to nitrite by bacteria. Antonie Van Leeuwenhoek 71 (1-2), 59-67.
Kelly II, R.T., Henriques, I.D.S., and Love, N.G. (2004) Chemical inhibition of nitrification in activated sludge. Biotechnology and Bioengineering 85 (6), 683-694.
Kroll R. G. and Booth, I.R. (1981) The role of potassium transport in the generation of a pH gradient in Escherichia coli. Biochemistry Journal 198, 691-698.
Love, N.G., Henriques, I.D.S., and Kelly II, R.T. (In Press) Upset early warning systems for biological treatment processes - Phase II: Fundamental studies on source-cause-effect relationships. Water Environment Research Foundation. Alexandria, VA.
Matin, A. (1978) Organic nutrition of chemolithotrophic bacteria. Annual Reviews of Microbiology 32, 433-468.
McLaggan, D., Rufino, H., Jaspars, M., and Booth, I. R. (2000) Glutathione-dependent conversion of N-ethylmaleimide to the maleamic acid by Escherichia coli: an intracellular detoxification process. Applied and Environmental Microbiology 66 (4), 1393-1399.
Meincke, M., Bock, E., Kastrau, D., and Kroneck, P.M.H. (1992) Nitrite oxidoreductase from Nitrobacter hamburgensis - redox centers and their catalytic role. Archives of Microbiology 158 (2), 127-131.
National Biomedical Research Foundation. (2005) Protein information resource NREF database. http://pir.georgetown.edu/.

131
Neethling, J.B., Chung, Y.C., and Jenkins, D. (1987) Activated sludge-chlorine reactions during bulking control. Journal of Environmental Engineering-ASCE 113 (1), 134-146.
Princic, A., Mahne, I., Megusar, F., Paul, E. A., and Tiedje, J. M. (1998) Effects of pH and oxygen and ammonia concentrations on the community structure of nitrifying bacteria from wastewater. Applied and Environmental Microbiology 64 (10), 3584-3590.
Schramm, A., Beer, D.De., Wagner, M., and Amann, R. (1998a) Identification and activities in situ of Nitrosospira and Nitrospira spp. as dominant populatioons in a nitifying fluidized bed reactor. Applied and Environmental Microbiology 64 ( 9), 3480-3485.
Stover, C.K., Pham, X.Q., Erwin, A.L., Mizoguchi, S.D., Warrener, P., Hickey, M.J., Brinkman, F.S., Hufnagle, W.O., Kowalik, D.J., Lagrou, M., Garber, R.L., Goltry, L., Tolentino, E., Westbrock-Wadman, S., Yuan, Y., Brody, L.L., Coulter, S.N., Folger, K.R., Kas, A., Larbig, K., Lim, R., Smith, K., Spencer, D., Wong, G.K., Wu, Z., Paulsen, I.T., Reizer, J., Saier, M.H., Hancock, R.E., Lory, S., and Olson, M.V. (2000) Complete genome sequence of Pseudomonas aeruginosa PA01, an opportunistic pathogen. Nature 406 (6799), 959-964.
Sundermeyer-Klinger, H., MeyerW., Warninghoff, B., and Bock, E. (1984) Membrane-bound nitrite oxidoreductase of Nitrobacter: evidence for a nitrate reductase system. Archives of Microbiology 140 153-158.
Suzuki, I., Dular, U., and Kwok, S.C. (1974) Ammonia or ammonium ion as substrate for oxidation by Nitrosomonas europaea cells and extracts. Journal of Bacteriology 120 (1), 556-8.
Tomlinson, T.G., Boon, A.G., and Trotman, C.N. (1966) Inhibition of nitrification in the activated sludge process of sewage disposal. Journal of Applied Bacteriology 29 (2), 266-91.
Vuilleumier, S. (1997) Bacterial glutathione S-transferases: what are they good for ? Journal of Bacteriology 179 (5), 1431-1441.
Wood, N.J. and Sorensen, J. (2001) Catalase and superoxide dismutase activity in ammonia-oxidising bacteria. FEMS Microbiology Ecology 38 (1), 53-58.
Wood, P.M. (1986) Nitrification as a bacterial energy source. In: Prosser, J.I. (ed), Nitrification, pp. 39-62, IRL Press, Oxford.
132
7 CELL MEMBRANE MODIFICATIONS IN NITROSOMONAS EUROPAEA EXPOSED
TO THE HYDROPHOBIC CHEMICAL 1-OCTANOL 7.1 Abstract
Previous experiments have shown that nitrification in activated sludge is upset by the
hydrophobic chemical 1-octanol, but that this upset event recovered more quickly than upsets
caused by other chemical classes. Therefore, the role of membrane modification stress response
mechanisms in pure cultures of nitrifying bacteria were investigated in order to determine if they
occur and are helping to protect against inhibition by hydrophobic contaminants. Genomic
information for the ammonia oxidizing bacterium Nitrosomonas europaea indicated that the
organism has the genes that enable cell membrane modifications in response to hydrophobic
chemicals. Therefore, tests were conducted to confirm that these genes were activated in
response to hydrophobic shock. Experiments were performed using pure cultures of N. europaea
exposed to 1-octanol shocks. Pseudomonas aeruginosa was used as a positive control organism
for all tests. Results showed that changes in the membrane content of N. europaea were
different from those observed for P. aeruginosa. P. aeruginosa showed an increase in the
amount of saturated fatty acids and an increase in cis isomers of unsaturated fatty acids, while N.
europaea showed changes to the unsaturated to saturated fatty acid ratios that varied based on
the amount of octanol added. These results suggest that, although some membrane modifications
occur in N. europaea, not all of the mechanisms coded by the genome are used to respond to
octanol shock events.
Key Words: Nitrification Inhibition, Cell Membrane, Hydrophobic Chemical Shock, Stress Response, 1-Octanol 7.2 Introduction
It is well known that nitrification is easily inhibited by a wide range of industrial
chemicals (Kelly II et al., 2004; Blum and Speece, 1991; Tomlinson et al., 1966) and that
nitrification is more sensitive to chemical toxins than other processes in wastewater treatment,
like BOD removal (Kelly II et al., 2004, Blum and Speece, 1991). One chemical tested in our
previous laboratory studies that significantly inhibited nitrification while not severely affecting
other processes was the hydrophobic chemical 1-octanol (Love et al., In Press). Although 1-
octanol inhibited nitrification, recovery from this inhibition event was also found to occur more

133
rapidly than for other chemical classes tested. Based on these results, we decided to further
investigate why 1-octanol, and possibly other hydrophobic chemical toxins, inhibited
nitrification but allowed nitrifying bacteria to quickly recover from such inhibition events.
The cause of hydrophobic chemical induced inhibition in bacteria is related to the site of
action of these chemicals: the cell membrane (Ingram, 1977; Sikkema et al., 1994; Aono et al.,
1994). Since nitrifying bacteria have very large membrane surface areas, they are an ideal target
for hydrophobic chemical contaminants. When hydrophobic chemicals insert themselves into
cell membranes, several effects on the membrane can occur and vary based on the structure of
the hydrophobic solvent. First, membrane fluidity has been found to either increase (short-chain
alcohols and alkanes, cyclic and aromatic compounds) or decrease (long-chain alcohols and
alkanes) (Lohner, 1991; Sikkema et al., 1994) in response to selected chemicals. Swelling of the
membrane bilayer has also been found in Escherichia coli cells exposed to toluene (Aono et al.,
1994). Membrane swelling and membrane fluidity alterations have both been associated with
leakage of macromolecules and ions (like proteins, ATP and potassium) out of the cytoplasm and
into the environment (Jackson and de Moss, 1965; Woldringh, 1973; Aono et al., 1994;
Heipieper et al., 1991). This increased membrane permeability can disrupt the proton gradient
and membrane potential (Sikkema et al., 1994), which, given the dependence of ammonia and
nitrite oxidation on the proton motive force (Hooper et al., 1997; Wood, 1986), would result in
disruption of ammonia and nitrite oxidation and inhibition of the nitrification process. It has also
been postulated that altering the membrane structure may affect the function of membrane bound
proteins by expanding the cell membrane and preventing the individual subunits of
transmembrane proteins from interacting properly, thus inactivating them (In't Veld et al., 1991).
Though no particular studies have examined the effects of hydrophobic chemicals on nitrifying
ammonia oxidizing bacteria (AOB), ammonia monooxygenase (AMO) is an important metabolic
enzyme that catalyzes the oxidation of ammonia and is a multi-subunit transmembrane protein
(Hooper et al., 1997). Given the hypothesis proposed by In’t Veld et al., AMO would not fit
properly into a membrane expanded by lipophilic chemicals, thus inactivating the enzyme and
inhibiting nitrification.
Knowing how hydrophobic chemicals may inhibit nitrifying bacteria does not explain
why they appear to recover from hydrophobic chemical inhibition more quickly than other
chemically induced inhibition. Recently, the complete sequence of N. europaea was completed
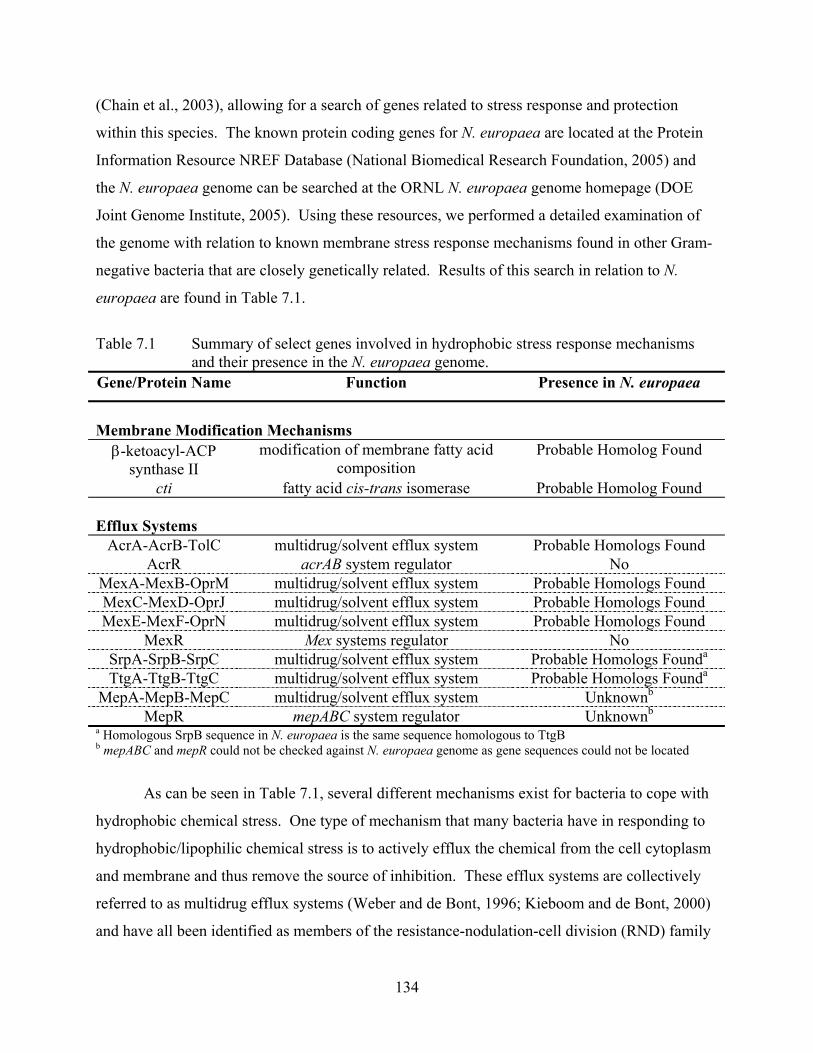
134
(Chain et al., 2003), allowing for a search of genes related to stress response and protection
within this species. The known protein coding genes for N. europaea are located at the Protein
Information Resource NREF Database (National Biomedical Research Foundation, 2005) and
the N. europaea genome can be searched at the ORNL N. europaea genome homepage (DOE
Joint Genome Institute, 2005). Using these resources, we performed a detailed examination of
the genome with relation to known membrane stress response mechanisms found in other Gram-
negative bacteria that are closely genetically related. Results of this search in relation to N.
europaea are found in Table 7.1.
Table 7.1 Summary of select genes involved in hydrophobic stress response mechanisms
and their presence in the N. europaea genome. Gene/Protein Name Function Presence in N. europaea
Membrane Modification Mechanisms
β-ketoacyl-ACP synthase II
modification of membrane fatty acid composition
Probable Homolog Found
cti fatty acid cis-trans isomerase Probable Homolog Found Efflux Systems
AcrA-AcrB-TolC multidrug/solvent efflux system Probable Homologs Found AcrR acrAB system regulator No
MexA-MexB-OprM multidrug/solvent efflux system Probable Homologs Found MexC-MexD-OprJ multidrug/solvent efflux system Probable Homologs Found MexE-MexF-OprN multidrug/solvent efflux system Probable Homologs Found
MexR Mex systems regulator No SrpA-SrpB-SrpC multidrug/solvent efflux system Probable Homologs Founda TtgA-TtgB-TtgC multidrug/solvent efflux system Probable Homologs Founda
MepA-MepB-MepC multidrug/solvent efflux system Unknownb MepR mepABC system regulator Unknownb
a Homologous SrpB sequence in N. europaea is the same sequence homologous to TtgB b mepABC and mepR could not be checked against N. europaea genome as gene sequences could not be located
As can be seen in Table 7.1, several different mechanisms exist for bacteria to cope with
hydrophobic chemical stress. One type of mechanism that many bacteria have in responding to
hydrophobic/lipophilic chemical stress is to actively efflux the chemical from the cell cytoplasm
and membrane and thus remove the source of inhibition. These efflux systems are collectively
referred to as multidrug efflux systems (Weber and de Bont, 1996; Kieboom and de Bont, 2000)
and have all been identified as members of the resistance-nodulation-cell division (RND) family

135
of transporters (Kieboom and de Bont, 2000; Paulsen et al., 1996). There are many different
protein channels that have been identified as multidrug efflux systems and all have been found to
be active transporters (Paulsen et al., 1996). Several RND systems that have been identified in
other Gram-negative organisms are listed on Table 7.1. The Acr system was first identified in E.
coli (Aono et al., 1998), the Mex systems were identified in P. aeruginosa (Li et al., 1998), and
the Srp, Ttg and Mep systems were all found in P. putida (Kieboom et al., 1998; Fukumori et al.,
1998; Kieboom and de Bont, 2000). Although exact matches for these systems were not found
in N. europaea, gene sequences encoding homologous systems were found, indicating that N.
europaea contains efflux systems for responding to hydrophobic chemicals. Interestingly,
although similar efflux systems were found in the genome, matches for the known regulatory
mechanisms of these systems were not found. This indicates that such systems are either
constitutively expressed or have some other unknown means of regulation in N. europaea and
possibly other AOB.
Another type of response mechanism that was found involves enzymes that modify the
cell membrane fatty acid composition in order to adapt to changes in the membrane fluidity.
Two of the more important enzymes that have been identified are listed on Table 7.1. One of
these is β-ketoacyl-ACP synthase II, which has been found to alter the ratio of saturated to
unsaturated fatty acids in E. coli (Magnuson et al., 1993). By changing this ratio, the membrane
can be made more (increase unsaturated fatty acids) or less (increase saturated fatty acids) fluid
in order to counteract changes in the membrane fluidity caused by lipophilic chemicals. These
modifications take several minutes to hours to occur, however, as new fatty acids need to be
synthesized.
The other enzyme that is used to respond to changes in membrane fluidity is the cis/trans
isomerase Cti, which converts cis unsaturated fatty acid isomers to a trans form during
hydrophobic chemical shock (Holtwick et al., 1997; Heipieper et al., 1992). This response is
much faster than synthesizing new fatty acids, and can occur within seconds of a cell being
exposed to a hydrophobic chemical. The modification from cis to trans works in a manner
similar to the switch from unsaturated to saturated fatty acids in that it helps to decrease the
membrane fluidity in response to lipophilic shock. When the double bond in the cis fatty acid is
rotated to a trans isomer position, the fatty acid tail becomes more straight. This structure is
more similar to that of a saturated fatty acid, and the more straight structure increases ordering
136
and decreases fluidity of the cell membrane. Again, as with the efflux proteins, no exact matches
for the genes coding the membrane modification enzymes β-ketoacyl-ACP synthase and Cti
were found in the N. europaea genome, but probable matches exist. The presence of the genes
coding these two enzymes indicates that N. europaea and likely other AOB should have the
ability to mediate membrane fluidity changes caused by hydrophobic chemical shock events.
Although the presence of the genes coding these enzymes in N. europaea may explain
why nitrification recovers from hydrophobic chemical shocks quickly, working forms of these
enzymes may not exist. Determining if these mechanisms do exist in nitrifying bacteria may
lead to the development of technologies that detect and/or mediate hydrophobic chemical upset
events before they occur. From the information found in the literature and genomic searches, we
hypothesize that the nitrification inhibition induced by 1-octanol in our previous studies was
caused by the insertion of octanol into the cell membrane and that the rapid recovery of
nitrification from the octanol shock event was due to the presence of membrane modification
stress response mechanisms. Therefore, the objective of this study was to examine changes in
the cell membrane of N. europaea in response to the hydrophobic chemical 1-octanol. Two pure
cultures were chosen for these experiments: N. europaea and Pseudomonas aeruginosa PAO1.
N. europaea was chosen because it is the most commonly studied AOB (Schramm et al., 1998)
and it is the only autotrophic nitrifying bacteria with a sequenced genome (Chain et al., 2003)
while P. aeruginosa PAO1 was chosen for use as a positive control bacterium because it is
known to contain many of the above mentioned hydrophobic stress response mechanisms (Stover
et al., 2000). Using these cultures, changes to the fatty acid content were examined in order to
determine if short-term (cis/trans isomerization) and long-term (changes to saturated and
unsaturated fatty acid composition) membrane modifications occurred in response to octanol
shock.
7.3 Methodology
7.3.1 Bacterial Cultures and Growth Conditions
Ammonia Oxidizing Bacterium: Nitrosomonas europaea
The N. europaea cells were grown using a medium composed of 0.2 g/L MgSO4·7H20,
20 mg/L CaCl2·2H2O, 87 mg/L K2HPO4, 2.52 g/L EPPS, 10 µg/L Na2MoO4·2H2O, 17.2 µg/L
MnSO4·H2O, 0.4 µg/L CoCl2·7H2O, 170 µg/L CuCl2·2H2O,10 µg/L ZnSO4·7H2O, 100 µg/L

137
chelated iron, 250 µg/L phenol red and 1.32 g/L (NH4)2SO4 at 29ºC in the dark in 5 L batch
cultures. Sterile aeration was provided and mixing was achieved with magnetic stirrers. Growth
curves were developed by measuring nitrite and performing cell counts. Nitrite samples were
stored at -20oC for no more than 28 days prior to analysis and analyzed using a colorimetric
procedure (method 4110 B) as described in Standard Methods (APHA, 1998). Cell counts were
performed using a Helber bacteria single round cell counting chamber manufactured by Weber
Scientific International (Middlesex, UK) on an Axioskop 2 plus phase contrast light microscope
with a 40X objective lens (Carl Zeiss Microimaging, Inc., Thornwood, NY).
Bacterium Known to Modify Cell Membrane: Pseudomonas aeruginosa strain PAO1
P. aeruginosa PAO1 was grown at 20°C in the dark in 1 L batch flask with aeration and
mixing provided by shaking. It was grown in full strength mineral salts (FSMS) medium
(186.12 mg/L EDTA, 11 mg/L FeCl2·2H2O, 150 mg/L MgSO4·7H2O, 4.5 mg/L MnSO4·4H2O,
500 µg/L NaMoO4·2H2O, 150 µg/L H3BO3, 100 mg/L NH4Cl, 1.64 g/L NaAcetate, 20 mg/L
CaCl2, 1.5 mg/L ZnCl2, 500 µg/L CuCl2·2H2O, 1.5 mg/L CoCl2·6H2O, 3.4 g/L KH2PO4, 4.35 g/L
K2HPO4, 0.5 g/L NH4Cl, 0.25 g/L NaCl). Growth curves for this organism were developed by
performing cell counts as described for N. europaea above.
7.3.2 Determining Membrane Fatty Acid Content Changes
The fatty acid content of the bacterial cell membranes was determined using experimental
reactors (octanol addition to N. europaea), a negative control reactor (no chemical addition) and
a positive control reactor (octanol addition to P. aeruginosa PAO1). Pure cultures were
concentrated to a minimum of 1010 cells/ml, as previous work done in our labs with pure cultures
found this to be adequate for determining the cell membrane composition (data in Appendix E).
Experiments were conducted when the pure cultures reached late-log phase growth. All reactors
were mixed, aerated, and fed with each culture’s normal growth substrate (ammonium sulfate for
N. europaea and sodium acetate for P. aeruginosa PAO1) to keep the biomass in suspension and
allow for normal aerobic respiration of the bacteria. 1-Octanol was chosen as the model
hydrophobic chemical and was dosed at three concentrations (5, 50 and 200 mg/L) to simulate
perturbation.
Duplicate samples were taken for fatty acid analysis. Samples were taken for analysis
immediately prior to addition of 1-octanol and 2, 10, 30, 60 and 240 minutes after the addition of

138
the hydrophobic chemical 1-octanol. The 1 mL liquid samples were saponified in 1 mL of 3.75
N NaOH in methanol by digesting in a boiling water bath for 30 minutes. After the samples
were saponified, 2 mL of 3.25 N HCl in methanol was added and the samples were heated to
80ºC for 30 minutes to derivatize the saponified fatty acids to fatty acid methyl esters (FAMEs).
These FAMEs were extracted into 1 mL of hexane by vortex mixing for a minimum of 30
seconds. Samples were then stored at –20°C for no longer than 96 hours before analysis.
The extracted FAMEs in hexane were analyzed on a Hewlett Packard 5890A GC-FID
(Hewlett Packard Inc., Rockville, MD) using a Supleco® S-2380 TM capillary column (Supelco
Co., Bellefonte, PA). The injector temperature was 250°C, the detector temperature was 260°C
and the oven temperature was ramped from 100°C to 205°C at 7°C/minute, held at 205°C for 2
minutes, then ramped to 250°C at 4°C/minute and held at 250°C for 15 minutes. The fatty acids
that were measured during these experiments were the saturated fatty acids C14:0, C16:0, C18:0,
and C20:0 and the unsaturated fatty acids C18:1cis, C18:1trans, C18:2cis and C18:2trans.
7.3.3 Determining Nitrite Concentrations
Nitrite concentrations were measured for the N. europaea culture from samples collected
at the same times that fatty acid samples were taken (listed above). Nitrite was measured to
determine the degree of inhibition during the experiment and to determine if membrane changes
correlated with recovery of ammonia metabolism. Nitrite was measured colorimetrically
according to method 4110 B in Standard Methods (1998). Inhibition was calculated using the
nitrite production rates (NPR) obtained from the slope of the nitrite produced over time using
equation 1.
Percent Inhibition = %100×−
control
inhibitedcontrol
NPRNPRNPR
[Equation 1]
7.4 Results and Discussion
7.4.1 N. europaea Showed Inhibition and Recovery From Octanol Shock
N. europaea was inhibited by the addition of octanol, but began to recover by the end of
the 4 hour experiment. As shown in Table 7.2, initial inhibition was observed for the first one
hour of the experiment, where the addition of 5, 50 and 200 mg/L of 1-octanol inhibited the cells
by 59, 42 and 81%, respectively. For the last 3 hours of the experiment, the 5, 50 and 200 mg/L

139
shocked cells were inhibited by -20, 46 and 46%, respectively. By the end of the experiment, the
5 mg/L shocked reactor had recovered to the same level as the control reactor, while the 200
mg/L shocked reactors had begun to recover based on nitrite production rate results. Because the
experiments were conducted with batch cultures and the added octanol was not removed from
the system, the recovery that was observed for these cells indicated that some adaptation was
occurring within N. europaea. The mechanism that N. europaea used to adapt to the presence of
octanol may be related to the membrane modification stress response mechanisms that were
discussed previously. Since only the 5 and 200 mg/L shocked reactors showed recovery of
inhibition relative to the control reactor, we focused the remaining analysis on the membrane
modifications occurring in these reactors.
Table 7.2 Nitrite production rates and inhibition relative to the control for N. europaea shocked with 1-octanol.a
Time 0-60 minutes Time 60-240 minutes Reactor Nitrite
Production Rate (mg NO2
--N/min)
Inhibition Relative to
Control
Nitrite Production Rate (mg NO2
--N/min)
Inhibition Relative to
Control
Control 1.32 3.55
5 mg/L Octanol 0.54 59.2% 4.25 -19.8%
50 mg/L Octanol 0.76 42.3% 1.90 46.4%
200 mg/L Octanol 0.25 81.4% 1.91 46.2% aError bars indicate the range of 2 samples.
7.4.2 N. europaea Alters Fatty Acid Composition in Response to Octanol
The results of the fatty acid experiments show that Nitrosomonas europaea alters the
fatty acid content of its cell membrane in response to various concentrations of 1-octanol. The P.
aeruginosa positive control cells also showed a change in the fatty acid composition in response
to octanol shock. The summary results are shown in Table 7.3. The total percent increase from
the initial time point (just prior to octanol addition) shows that, except for the C20 fatty acids,
each fatty acid increases for N. europaea cells over the 4 hour experiment. The 5 and 200 mg/L
shocked reactors did not show the same degree of change for the same fatty acids, indicating that
there might be a unique dose-response relationship with the contaminant. For example, the
unsaturated C18 fatty acid increased 49% in the control reactor, but increased only 30% in the 5

140
mg/L shocked reactor, while the 200 mg/L octanol shocked reactor increased 62%. In
comparison, the P. aeruginosa cells had a similar response for both the 5 and 200 mg/L shocked
reactors. Here, increasing trends in the fatty acid content were observed for both reactors, with a
greater change seen for the higher concentration of octanol added. How these changes relate to
the different membrane modification mechanisms is discussed in greater detail below.
Table 7.3 Percent increase in fatty acid concentration after 4 hours of exposure for N.
europaea and P. aeruginosa cells in the presence or absence of 1-octanol.a
Fatty Acid Type
N. europaea Negative Control
N. europaea5 mg/L Octanol
N. europaea 200 mg/L Octanol
P. aeruginosa Negative Control
P. aeruginosa 5 mg/L Octanol
P. aeruginosa200 mg/L Octanol
Saturated
C14:0 69.5 70.8 92.8 34.9 54.1 200.4
C16:0 82.4 41.5 66.3 -0.7 13.5 119.5
C18:0 48.8 30.0 61.6 -31.8 -18.1 62.1
C20:0 -7.7 -11.2 17.5 Not Available Not Available 48.4
Unsaturated
C18:1cis 54.9 23.6 27.3 96.3 122.3 296.1
C18:1trans 471.4 77.7 40.8 78.1 73.0 166.3
C18:2cis 45.8 19.0 15.6 7.7 33.5 149.9
C18:2trans 17.5 8.2 31.5 58.9 50.3 90.7 aValues listed are an average of duplicate samples.
7.4.3 N. europaea Does Not Use Short-Term Membrane Modifications
N. europaea cells did not change the cis-to-trans ratio of C18 unsaturated fatty acids
relative to the negative control reactor at either of the octanol concentrations tested. Even though
Table 7.3 shows that there are considerable differences in the individual C18 unsaturated fatty
acids for all of the reactors, Figure 7.1 shows that the total ratio of the unsaturated fatty acids did
not change considerably over the course of the experiment. In contrast, the positive control
culture (P. aeruginosa) increased the ratio of cis-to-trans fatty acids over the course of the
experiment. For P. aeruginosa, the negative control reactor showed a 7X increase in cis
unsaturated fatty acids over the first hour, after which the levels drop about 12X. For all of the
shocked Pseudomonas cells, the levels of measured unsaturated fatty acids increased about 15X
over the course of the experiment, with most of this increase occurring within the first 30
minutes of exposure. Alterations in the cis-to-trans ratio of unsaturated fatty acids is thought to
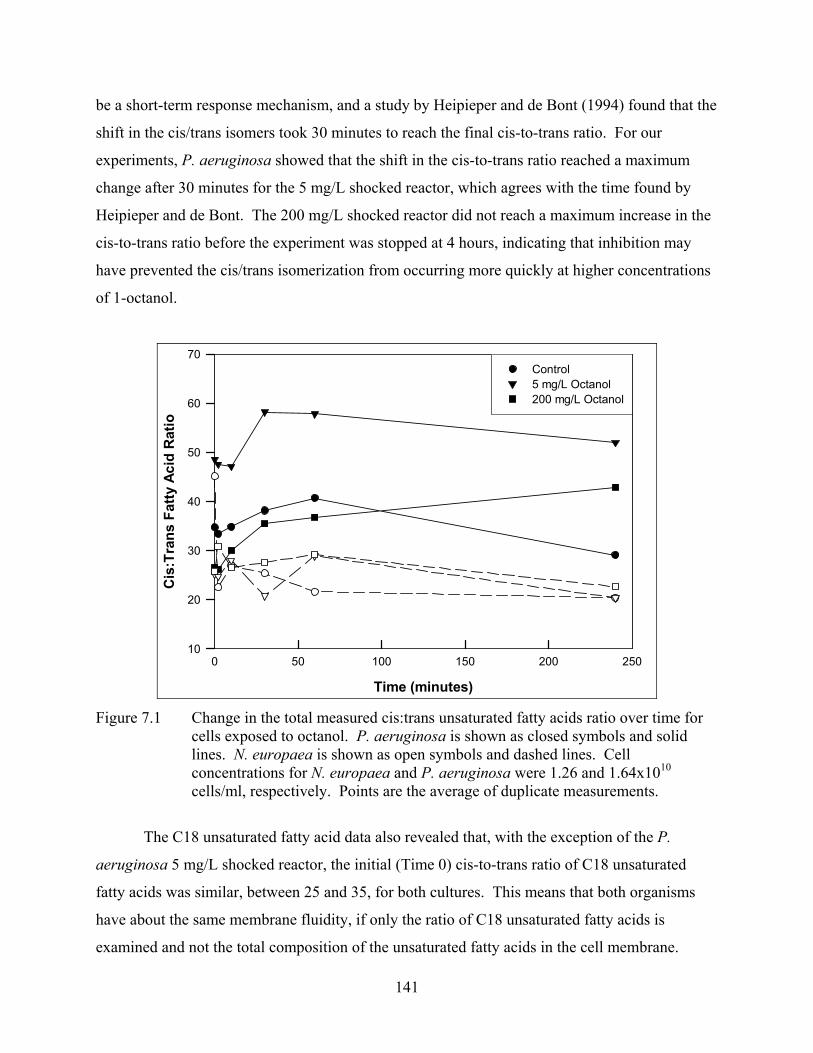
141
be a short-term response mechanism, and a study by Heipieper and de Bont (1994) found that the
shift in the cis/trans isomers took 30 minutes to reach the final cis-to-trans ratio. For our
experiments, P. aeruginosa showed that the shift in the cis-to-trans ratio reached a maximum
change after 30 minutes for the 5 mg/L shocked reactor, which agrees with the time found by
Heipieper and de Bont. The 200 mg/L shocked reactor did not reach a maximum increase in the
cis-to-trans ratio before the experiment was stopped at 4 hours, indicating that inhibition may
have prevented the cis/trans isomerization from occurring more quickly at higher concentrations
of 1-octanol.
Time (minutes)
0 50 100 150 200 250
Cis
:Tra
ns F
atty
Aci
d R
atio
10
20
30
40
50
60
70Control5 mg/L Octanol200 mg/L Octanol
Figure 7.1 Change in the total measured cis:trans unsaturated fatty acids ratio over time for
cells exposed to octanol. P. aeruginosa is shown as closed symbols and solid lines. N. europaea is shown as open symbols and dashed lines. Cell concentrations for N. europaea and P. aeruginosa were 1.26 and 1.64x10¹⁰ cells/ml, respectively. Points are the average of duplicate measurements.
The C18 unsaturated fatty acid data also revealed that, with the exception of the P.
aeruginosa 5 mg/L shocked reactor, the initial (Time 0) cis-to-trans ratio of C18 unsaturated
fatty acids was similar, between 25 and 35, for both cultures. This means that both organisms
have about the same membrane fluidity, if only the ratio of C18 unsaturated fatty acids is
examined and not the total composition of the unsaturated fatty acids in the cell membrane.

142
Several studies have shown that the relative amounts of the cis and trans isomers of C16
unsaturated fatty acids can also change significantly in response to hydrophobic chemicals and
play an important role in membrane fluidity (Pinkart et al., 1996; Heipieper et al., 1992; Weber.
and de Bont, 1996), but only the C18 unsaturated fatty acids were measured during this
experiment.
Even though both N. europaea and P. aeruginosa changed the total amount of
unsaturated C18 fatty acids in response to octanol, only P. aeruginosa showed modifications to
the cis-to-trans C18 unsaturated fatty acid ratio. This means that N. europaea likely contains a
cis/trans isomerase to alter the isomer form of unsaturated fatty acids, but it does not use it to
change the relative cis/trans ratio and alter the membrane fluidity in response to 1-octanol. For
P. aeruginosa, a shift toward cis unsaturated fatty acids indicates that the cells are trying to
increase membrane fluidity to counteract a decrease in the fluidity that was presumably caused
by octanol. There are many conflicting results in the literature examining changes in fatty acids
in response to similar hydrophobic chemicals. Our results contradict a study done by Lohner
(1991), who found that short carbon chain alcohols (chain length, C < 10) caused an increase in
membrane fluidity, and required a shift towards trans unsaturated fatty acids. However, a study
done by Heipieper and de Bont (1994) reported that the amount of cis fatty acids increased in
Pseudomonas putida exposed to the short-chained alcohol ethanol, which supports our results.
Another study from the same research group reported an increase in the relative amount of trans
fatty acids in response to ethanol for the same organism (Weber and de Bont, 1996). Further
conflicting results arose for a study involving P. putida exposed to o-xylene, which showed an
increase in the cis isomers relative to trans isomers at 75 mg/L, while 200 mg/L showed an
increase in the trans isomers relative to cis isomers (Pinkart et al., 1996). Since several studies
provide conflicting results for the effects of chemicals on cis/trans isomers of unsaturated fatty
acids, and this is the first study using octanol, the results presented here are cannot be verified
against other work.
7.4.4 N. europaea Uses Long-Term Membrane Modifications in Response to Octanol
When examining the long-term membrane response in N. europaea, the results showed
that the relative ratios of saturated to unsaturated fatty acids were unchanged for the first 60
minutes, after which significant changes occurred (Figure 7.2). The long time period observed
143
before the shift occurred is consistent with the fact that this is a long-term membrane
modification mechanism. Between 60 minutes and 4 hours, the membranes in the 5 mg/L
octanol shocked reactor decreased in saturated-to-unsaturated fatty acids relative to cells that
were not shocked while, strangely, the 200 mg/L reactor showed the opposite effect. The reason
for the different results is unknown, but seem to correspond with the previous conflicting results
for cis/trans isomerization and suggest that high versus low concentrations of octanol elicit
different responses. It is also important to note that the change in the saturated-to-unsaturated
fatty acid ratios corresponded with recovery of the nitrite generation rate, which supports our
hypothesis that membrane modifications lead to recovery of nitrification from hydrophobic
chemical inhibition.
The results for the P. aeruginosa culture, however, were contrary to what was expected
and showed no change relative to the negative control reactor. For this culture there is a slight
increase in saturated-to-unsaturated fatty acid after 10 minutes of exposure, but this increase is
small and may not be significant. The lack of any change may indicate that no long-term
response is needed for octanol shock in these cells.
The results presented in this study that indicate no change in the saturated-to-unsaturated
fatty acid ratio for P. aeruginosa and conflicting changes for the two concentrations of octanol
tested on N. europaea are contrary to what was expected for both cultures. For N. europaea, a
consistent increase or decrease would be expected. The cis/trans results for P. aeruginosa
indicate that a decrease in membrane fluidity was presumably caused by octanol. Therefore a
shift towards unsaturated fatty acids would have been expected. A decrease in membrane
fluidity caused by octanol was also indicated by the decrease in the saturated-to-unsaturated fatty
acids for N. europaea cells exposed to 5 mg/L octanol. However, the increase observed for N.
europaea cells exposed to 200 mg/L octanol contradicts the decrese in fluidity and may be due to
some inhibition mechanism that has not been characterized for N. europaea. In addition, since
P. aeruginosa is known to modify the ratio of saturated-to-unsaturated fatty acids in response to
hydrophobic chemicals, and it showed a shift in the cis-to-trans ratio in response to octanol, a
shift in the ratio from saturated to unsaturated would have been expected. The lack of response
may indicate that the modifications to the cis-to-trans ratio may have been adequate for
responding to the induced octanol stress.

144
Time (minutes)
0 50 100 150 200 250
Pseu
dom
onas
Sat
urat
ed:U
nsat
urat
ed F
atty
Aci
d R
atio
0.0
0.5
1.0
1.5
2.0
Nitr
osom
onas
Sat
urat
ed:U
nsat
urat
ed F
atty
Aci
d R
atio
18
20
22
24
26
28Control5 mg/L Octanol200 mg/L Octanol
Figure 7.2 Change in the total saturated:unsaturated fatty acids ratio over time for cells
exposed to octanol. P. aeruginosa is shown as closed symbols and solid lines. N. europaea is shown as open symbols and dashed lines. Cell concentrations for N. europaea and P. aeruginosa were 1.26 and 1.64x10¹⁰ cells/ml, respectively. Points are the average of duplicate measurements.
Interestingly, the fatty acid data also revealed that the relative amounts of saturated-to-
unsaturated C18 fatty acids present in the two cultures were significantly different. The ratio is
approximately 1.3 for P. aeruginosa while it is almost 20 times greater for N. europaea. This is
contrary to the results found for the cis-to-trans C18 unsaturated fatty acid ratios, which were
about the same for the two cultures. These differences are significant and may have something
to do with the unique membrane structure observed in nitrifying bacteria. In addition to
differences in the relative amounts of fatty acids, the actual quantity of extracted fatty acids was
significantly different between the cultures. The total amount of saturated fatty acids measured
was about 2X higher for the P. aeruginosa culture, while the C18 unsaturated fatty acids was
about 30X higher in P. aeruginosa than it is in N. europaea (data not shown). The higher ratio
of the saturated fatty acids in N. europaea implies that the membrane of this organism is more
rigid and less fluid than the membrane for P. aeruginosa. This decreased membrane fluidity
would decrease the movement of membrane bound proteins. In N. europaea, AMO is a

145
membrane bound protein used for generating energy from ammonia oxidation, and decreased
movement of this enzyme and others related to energy generation may be advantageous to the
growth of the organism.
7.4.5 Future Work
Although this study provides evidence that some membrane modification mechanisms
exist, other modes of inhibition and mechanisms of recovery may play a role in protecting
nitrifying bacteria from hydrophobic chemical shocks. Several possibilities for this exist. For
one, the genome codes for a large number of efflux systems (Table 7.1). If these efflux systems
exist and are working, then the octanol and other hydrophobic chemicals would be removed from
the membrane quickly and would help reduce the toxicity of the hydrophobic chemicals. It is
also possible that hydrophobic chemical inhibition is not only directed against the cell
membrane, but against proteins in the cells. A study performed by Franks and Lieb (1984)
indicates that some hydrophobic chemicals directly affect some enzymes and proteins by
competitively binding in the hydrophobic pocket of the enzymes. This may also be the case for
N. europaea, where ammonia, the uncharged molecule NH3, is the substrate for the enzyme
AMO (Suzuki et al., 1974). This means that the active site in AMO may be a hydrophobic
pocket, which is supported by the largely hydrophobic peptide sequence coded by the gene
sequence for the subunits of this enzyme (McTavish et al., 1993). Therefore, hydrophobic
chemicals may inhibit ammonia oxidation by competitively binding in the hydrophobic pocket of
AMO and preventing oxidation of ammonia. From this information, further studies are needed
to test the effects of other hydrophobic chemicals besides 1-octanol, and determine if other stress
response mechanisms are occurring within nitrifying organisms in response to hydrophobic
chemicals. This would provide a better understanding of hydrophobic nitrification inhibition and
the responses that nitrifying bacteria have against hydrophobic stressors may lead to the
development of systems that can predict upset events before they occur.
7.5 Conclusions
To the authors’ knowledge, this work provides the first study of the cell membrane
structure of any nitrifying bacteria and the first work examining the effects of 1-octanol on

146
bacterial cell membrane fatty acid composition. Based on the results of this study, we conclude
that N. europaea can modify the saturated-to-unsaturated fatty acid content in response to the
hydrophobic chemical 1-octanol and that the modification of this ratio was also found to
correspond with recovery of the nitrite production rate, indicating that modifying the membrane
may contribute to recovery of the ammonia oxidizing capabilities of N. europaea. The saturated-
to-unsaturated fatty acid ratio results suggest that N. europaea does modify the fatty acid content
of its cell membrane in response to the hydrophobic chemical contaminant 1-octanol, but that the
change in the ratio also depends on the concentration of octanol added. This agrees with our
hypothesis that membrane modifications occur in response to hydrophobic chemical shock that
allow for recovery of nitrification. However, the lack of any cis-to-trans ratio modifications
contradicts the genomic information that indicates this organism should be capable of modifying
the cis-to-trans ratio as a short-term response. Furthermore, the conflicting responses in the
saturated-to-unsaturated fatty acid ratios for different octanol concentrations also contradicts the
idea that the response should be uniform for a given chemical stressor.
Although this study provides evidence that some membrane modification mechanisms
exist, other stress response mechanisms may exist and more research is needed in this area to
determine exactly what mechanisms are occurring. Knowing what stress response mechanisms
are or are not present in nitrifying bacteria will lead to a better understanding of how these
organisms react to chemical inhibitors, which may lead to the development of techniques to
detect and/or mediate chemical upset events before they can occur at a full-scale treatment
facility.
7.6 References
Aono, R., Kobayashi, H., Joblin, K.N., and Horikoshi, K. (1994) Effects of organic solvents on growth of Escherichia coli K-12. Bioscience, Biotechnology and Biochemistry 58, 2009-2014.
Aono, R., Tsukagoshi, N., and Yamamoto, M. (1998) Involvement of outer membrane protein TolC, a possible member of the mar-sox regulon, in maintenance and improvement of organic solvent tolerance of Escherichia coli K-12. Journal of Bacteriology 180 (4), 938-44.
APHA (1998) Standard methods for the examination of water and wastewater. APHA, Washington, DC.

147
Blum, D.J.W. and Speece, R.E. (1991) A database of chemical toxicity to environmental bacteria and its use in interspecies comparisons and correlations. Research Journal Water Pollution Control Federation 63 (3), 198-207.
Chain, P., Lamerdin, J., Larimer, F., Regala, W., Lao, V., Land, M., Hauser, L., Hooper, A., Klotz, M., Norton, J., Sayavedra-Soto, L., Arciero, D., Hommes, N., Whittaker, M., and Arp, D. (2003) Complete genome sequence of the ammonia-oxidizing bacterium and obligate chemolithoautotroph Nitrosomonas europaea. Journal of Bacteriology 185 (9), 2759-2773.
DOE Joint Genome Institute. (2005) Computational biology at ORNL: Nitrosomonas europaea complete genome sequence and annotation. http://genome.ornl.gov/microbial/neur/embl/
Franks, N.P. and Leib, W.R. (1984) Do general anesthetics act by competitive binding to specific receptors? Nature 310 (16), 599-601.
Fukumori, F., Hirayama, H., Takami, H., Inoue, A., and Horikoshi, K. (1998) Isolation and transposition mutagenesis of a Pseudomonas putida KT2442 toluene-resistant variant: involvement of an efflux system in solvent tolerance. Extremophiles 2 (4), 395-400.
Heipieper, H. and DeBont, J. (1994) Adaptation of Pseudomonas putida S12 to ethanol and toluene at the level of fatty acid composition of membranes. Applied and Environmental Microbiology 60 (12), 4440-4444.
Heipieper, H., Diefenbach, R., and Keweloh, H. (1992) Conversionof cis unsaturated fatty acids to trans , a possible mechanism for the protection of phenol-degrading Pseudomonas putida P8 from substrate toxicity. Applied and Environmental Microbiology 58, 1847-1852.
Heipieper, H.J., Keweloh, H., and Rehm, H.J. (1991) Influence of phenols on growth and membrane permeability of free and immobilized Escherichia coli. Applied and Environmental Microbiology 57, 1213-1217.
Holtwick, R., Meinhardt, F., and Keweloh, H. (1997) Cis-trans isomerization of unsaturated fatty acids: cloning and sequencing of the cti gene from Pseudomonas putida P8. Applied and Environmental Microbiology 63 (11), 4292-4297.
Hooper, A.B., Vannelli, T., Bergmann, D.J., and Arciero, D.M. (1997) Enzymology of the oxidation of ammonia to nitrite by bacteria. Antonie Van Leeuwenhoek 71 (1-2), 59-67.
In't Veld, G., Dreissen, A.J.M., Op den Kamp, J.A.F., and Konings, W.N. (1991) Hydrophobic membrane thickness and lipid-protein interactions of the leuciine transportt system of Lactococcus lactis. Biochimica et Biophysica Acta 1065 203-212.
Ingram, L. (1977) Changes in lipid composition of Escherichia coli resulting from growth with organic solvents and with food additives. Applied and Environmental Microbiology 35 (5), 1233-1236.
Jackson, R.W. and de Moss, J.A. (1965) Effects of toluene on Escherichia coli. Journal of Bacteriology 90, 1420-1425.
148
Kelly II, R.T., Henriques, I.D.S., and Love, N.G. (2004) Chemical inhibition of nitrification in activated sludge. Biotechnology and Bioengineering 85 (6), 683-694.
Kieboom, J. and de Bont, J.A.M. (2000) Mechanisms of organic solvent tolerance in bacteria. In: Storz, G. and Hengge-Aronis, R. (eds), Bacterial Stress Responses, ASM Press, Washington, D.C.
Kieboom, J., Dennis, J., Zylstra, G., and DeBont, J. (1998) Active efflux of organic solvents by Pseudomonas putida S12 is induced by solvents. Journal of Bacteriology 180 (24), 6769-6772.
Li, X.-Z., Zhang, L., and Poole, K. (1998) Role of the multidrug efflux systems of Pseudomonas aeruginosa in organic solvent tolerance. Journal of Bacteriology 180 (11), 2987-2991.
Lohner, K. (1991) Effects of small organic molecules on phospholipid phase transitions . Chemistry and Physics of Lipids 57 341-352.
Love, N.G., Henriques, I.D.S., and Kelly II, R.T. (In Press) Upset early warning systems for biological treatment processes - Phase II: Fundamental studies on source-cause-effect relationships. Water Environment Research Foundation. Alexandria, VA.
Magnuson, K., Jackowski, S., Rock, C.O., and Cronan, J.E. Jr. (1993) Regulation of fatty acid biosynthesis in Escherichia coli. Microbiological Reviews 57 (3), 522-542.
McTavish, H., Fuchs, J.A., and Hooper, A.B. (1993) Sequence of the gene coding for ammonia monooxygenase in Nitrosomonas europaea. Journal of Bacteriology 175 (8), 2436-2444.
National Biomedical Research Foundation. (2005) Protein information resource NREF database. http://pir.georgetown.edu/.
Paulsen, I.T., Brown, M.H., and Skurray, R.A. (1996) Proton-dependent multidrug efflux systems. Microbiological Reviews 60 (4), 575-608.
Pinkart, H.C., Wolfram, J.W., Rogers, R., and White, D.C. (1996) Cell envelope changes in solvent-tolerant and solvent-sensitive Pseudomonas putida strains following exposure to o-xylene. Applied and Environmental Microbiology 62 (3), 1129-1132.
Schramm, A., de Beer, D., Wagner, M., and Amann, R. (1998) Identification and activities in situ of Nitrosospira and Nitrospira spp. as dominant populations in a nitrifying fluidized bed reactor. Applied and Environmental Microbiology 64 (9), 3480-3485.
Stover, C.K., Pham, X.Q., Erwin, A.L., Mizoguchi, S.D., Warrener, P., Hickey, M.J., Brinkman, F.S., Hufnagle, W.O., Kowalik, D.J., Lagrou, M., Garber, R.L., Goltry, L., Tolentino, E., Westbrock-Wadman, S., Yuan, Y., Brody, L.L., Coulter, S.N., Folger, K.R., Kas, A., Larbig, K., Lim, R., Smith, K., Spencer, D., Wong, G.K., Wu, Z., Paulsen, I.T., Reizer, J., Saier, M.H., Hancock, R.E., Lory, S., and Olson, M.V. (2000) Complete genome sequence of Pseudomonas aeruginosa PA01, an opportunistic pathogen. Nature 406 (6799), 959-964.

149
Suzuki, I., Dular, U., and Kwok, S.C. (1974) Ammonia or ammonium ion as substrate for oxidation by Nitrosomonas europaea cells and extracts. Journal of Bacteriology 120 (1), 556-8.
Tomlinson, T.G., Boon, A.G., and Trotman, C.N. (1966) Inhibition of nitrification in the activated sludge process of sewage disposal. Journal of Applied Bacteriology 29 (2), 266-91.
Weber, F.J. and de Bont, J.A.M. (1996) Adaptation mechanisms of microorganisms to the toxic effects of organic solvents on membranes. Biochimica et Biophysica Acta 1286 (3), 225-245.
Woldringh, C.L. (1973) Effects of toluene and phenylethyl alcohol on the ultrastructure of Escherichi coli. Journal of Bacteriology 114, 1359-1361.
Wood, P.M. (1986) Nitrification as a bacterial energy source. In: Prosser, J.I. (ed), Nitrification, pp. 39-62, IRL Press, Oxford.

150
8 ENGINEERING SIGNIFICANCE Because many municipal wastewater treatment systems have industrial sources, the accidental
release of industrial chemical toxins will occasionally occur. Such shock loads can cause
significant upset of treatment processes. In particular, nitrification is one of the most susceptible
treatment processes to chemical upset, which has been shown in this work and the work of
others. A knowledge of the molecular level causal mechanisms of inhibition and the stress
response mechanisms that nitrifying bacteria use to respond to toxicant stressors could provide
valuable information that could be used to determine methods to mediate nitrification upset once
it occurs or even detect such upset events before they can occur.
Currently, very little is known about stress responses in nitrifying bacteria, so this study
set out to examine the role of selected stress responses in N. europaea and Ni. moscoviensis. The
information gained from this study demonstrated the activation of one stress response
mechanism in nitrifiers involving long-term membrane fatty acid synthesis, which occurred in
response to hydrophobic chemicals after several hours of exposure. However, of the studied
stress response mechanisms, nitrifiers did not demonstrate an ability to activate several short-
term responses that were studied, including oxidant-activated potassium efflux and hydrophobic
shock-activated cis/trans fatty acid isomerase. Because nitrification tends to be the most
sensitive process to upset, warning devices that are based on activation of these conserved
responses, which are found in other Gram negative bacteria, could be used indicate that
nitrification upset will likely occur in addition to upset to heterotrophic-based processes.
However, the lack of these short-term responses in nitrifiers means that such devices would not
be specific to nitrification inhibition and also could not be calibrated to predict the extent of
nitrification inhibition caused by a given toxin.
The major implications of this study are that, although stress responses may exist in
nitrifying bacteria, the short-term responses studied here do not appear to be present or used.
Therefore, the conventional methods currently used to detect nitrification inhibition remain the
fastest and easiest ways to monitor the nitrification process. In this work we showed that nitrate
generation rate (NGR) provided the most consistent measure of nitrification inhibition, which
implies that commercial units using differential respirometry will not provide as accurate a
measure of inhibition from chemical sources. Although respirometric techniques are currently
easier to adapt for online monitoring, the UV method developed here for NGR shows significant

151
promise as a monitoring tool. The UV NGR technique could be easily implemented as an online
full-scale monitoring technique if a robotic sample collection system is used to automate
sampling, or an in-line filter system is used to remove particulates prior to sample entering a
spectrophotometeric unit. In addition, by monitoring nitrite during this test, we can examine
which of the different classes of nitrifiers is inhibited during an upset event, which cannot be
done using respirometric techniques. As technology progresses, a warning device that uses UV
NGR may be developed that will allow operators at wastewater treatment facilities to be more
proactive and less reactive in responding to nitrification upset events.
Even though conventional methods were shown to be the best for detecting nitrification
inhibition during this study, they may not truly be the best and cheapest nitrification upset
warning device that can be developed. It is obvious that more work is needed to examine other
possibilities for warning devices, and several potential areas for future work come from this
study. First, it is clear that nitrifying bacteria do not regulate genes and proteins in the same
manner as other bacteria. By studying regulation in nitrifying bacteria, not only can we gain a
better knowledge of the nitrification process, but the short-term regulatory responses that
nitrifiers have may be used to develop a cheap and efficient warning device. Second, nitrifying
bacteria must have some stress response mechanisms and in studying these, a unique mechanism
may be found that can be used to specifically detect nitrification inhibition. A third area of
research that does not directly come from this study is metabolic fingerprinting, or a study of the
metabolic products produced by nitrifying bacteria. It is thought that studying the metabolic
products of nitrifying bacteria, patterns in the “fingerprints” they produce in response to toxic
chemicals may be used to determine what type and possibly even what concentration of
contaminant is present, which would make a very powerful tool for predicting toxin induced
upset events.
Designing a robust wastewater treatment system that can react to or resist chemical upset
events while continuously and successfully providing a clean effluent is the goal of every
wastewater engineer. The ability to design such a robust system requires knowledge, not only of
the basics of treatment design, but also of the physiological responses of the bacteria. This study
provides a small piece of the picture of how stress responses in nitrifying bacteria affect their
susceptibility to industrial chemical contaminants. However, in order to gain a better
understanding of how these stress responses can be used to detect and/or mediate nitrification

152
upset at full-scale treatment facilities, future work should focus on how the lack of these stress
response mechanisms can be overcome to prevent nitrification inhibition and should try to
identify the stress responses that are present in nitrifying bacteria.

153
APPENDICES

154
Appendix A: Data for Chapter 3 Table A.1 MLSS data for CDNB inhibited nitrifying reactor experiments.
Control MLSS IC15 MLSS IC25 MLSS IC50 MLSS Time 1 2 3 1 2 3 1 2 3 1 2 3
days mg/L mg/L mg/L mg/L mg/L mg/L mg/L mg/L mg/L mg/L mg/L mg/L
0.5 1307 1247 1267 1447 1247 1313 1307 1240 1407 1133 1067 1347 1.25 1480 1553 1360 1253 1287 1313 1313 1393 1293 1280 1227 1207 2.25 1340 1367 1380 1333 1280 1307 1273 1347 1267 1153 1133 1153 3.25 1513 1553 1593 1600 1573 1527 1533 1527 1527 1213 1273 3247 4.25 1620 1613 1593 1733 1700 1780 1640 1680 1660 1267 1240 1240 5.25 1560 1553 1540 1820 1767 1847 1780 1747 1733 1353 1373 1360 6.25 1587 1580 1693 1847 1840 1827 1707 1760 1780 1413 1380 1353 7.25 1567 1600 1593 1900 1927 1907 1880 1833 1860 1593 1620 1640 8.25 1627 1613 1620 1960 1973 1947 1987 1993 1987 1780 1780 1780 9.25 1500 1493 1447 1913 1847 1947 1893 1827 1967 1667 1773 1700
11.25 1727 1707 1747 2100 2080 2060 2160 2187 2160 2033 2020 1927 13.25 2273 2187 2147 2820 2780 2887 2893 2940 2927 2887 2907 2880 15.25 1980 2047 1973 2413 2327 2320 2433 2387 2433 2553 2687 2673 17.25 2027 2033 2060 2213 2220 2267 2313 2400 2413 2647 2640 2587 19.25 2093 2147 2067 2253 2300 2267 2460 2500 2473 2433 2367 2413 21.25 2200 2113 2160 2320 2320 2280 2560 2613 2593 1893 1793 1787 23.25 2020 2027 2007 2187 2233 2240 2387 2380 2400 1273 1240 1227 25.25 2560 2493 2507 2993 3060 3007 3367 3340 3287 987 813 980 27.25 2220 2180 2233 2593 2687 2533 2767 2660 2733 1007 1093 1033
28.25 2333 2367 2333 2713 2740 2760 2907 2927 2873 1280 1347 1340

155
Table A.2 MLVSS data for CDNB inhibited nitrifying reactor experiments. Control MLVSS IC15 MLVSS IC25 MLVSS IC50 MLVSS Time 1 2 3 1 2 3 1 2 3 1 2 3
days mg/L mg/L mg/L mg/L mg/L mg/L mg/L mg/L mg/L mg/L mg/L mg/L
0.5 1207 1080 1100 1293 1133 1207 1233 1127 1300 1033 973 1160 1.25 1260 1320 1140 1067 1060 1093 1100 1187 1107 1033 1027 1013 2.25 1260 1260 1267 1220 1140 1140 1180 1247 1207 1033 993 1027 3.25 1387 1360 1427 1480 1440 1387 1367 1367 1367 1093 1113 1127 4.25 1433 1453 1420 1540 1553 1567 1493 1487 1467 1093 1073 1087 5.25 1340 1327 1373 1573 1540 1553 1547 1533 1493 1160 1127 6.25 1393 1400 1467 1613 1573 1580 1520 1560 1533 1167 1233 1113 7.25 1327 1347 1333 1613 1607 1600 1573 1527 1540 1293 1333 1327 8.25 1340 1373 1380 1647 1667 1620 1653 1667 1667 1480 1473 1480 9.25 1273 1307 1240 1613 1600 1720 1633 1567 1680 1380 1500 1453
11.25 1447 1440 1440 1753 1727 1720 1827 1813 1820 1693 1667 1613 13.25 2000 1920 1880 2400 2413 2500 2547 2547 2480 2500 2487 2453 15.25 1707 1747 1673 2033 1960 1967 2053 1993 2040 2133 2220 2227 17.25 1647 1673 1707 1807 1780 1867 1920 2040 1967 2220 2187 2160 19.25 1753 1767 1693 1853 1920 1867 2040 2133 2027 2007 1987 2053 21.25 1870 1813 1853 1973 1960 1907 2180 2233 2240 1547 1533 1533 23.25 1713 1707 1700 1867 1887 1893 2033 2020 2047 1073 1060 1060 25.25 2180 2093 2153 2473 2547 2553 2827 2820 2800 853 713 847 27.25 1892 1887 1933 2213 2287 2120 2393 2240 2327 887 927 907
28.25 2020 2060 2047 2353 2387 2387 2520 2533 2480 1140 1207 1213

156
Table A.3 Effluent nitrate data for CDNB inhibited nitrifying reactor experiments. Control Nitrate IC15 Nitrate IC25 Nitrate IC50 Nitrate Time 1 2 1 2 1 2 1 2 days mg/L-N mg/L-N mg/L-N mg/L-N mg/L-N mg/L-N mg/L-N mg/L-N 0.25 11.085 13.830 9.443 14.500 14.542 13.864 8.442 11.856 0.5 12.851 14.697 12.235 14.643 14.699 11.106 11.085 9.229 0.75 8.228 12.823 15.088 15.032 3.651 3.603 3.663 7.553 1.0 9.971 13.211 10.312 13.135 4.865 3.861 4.466 1.5 11.460 11.715 11.709 8.361 8.382 0.693 1.024 1.615 2.0 9.855 12.650 12.668 6.015 0.318 0.441 0.428 0.563 2.5 14.599 3.174 3.381 0.353 0.389 0.385 0.162 3 5.629 5.579 1.620 1.630 1.627 0.368 0.140 0.145 4 6.293 6.386 2.377 3.116 0.607 0.624 0.233 0.237 5 11.822 6.555 6.888 1.208 1.179 0.299 0.152 6 19.359 19.347 14.249 14.268 3.402 3.487 0.400 0.162 7 17.105 18.991 12.525 14.437 6.827 0.158 0.157 8 15.168 15.283 15.292 9.248 9.275 5.658 0.165 0.164 9 13.058 13.213 6.476 7.277 4.672 4.668 0.526 0.173 11 8.357 8.323 4.475 4.515 4.520 3.978 0.247 0.247 13 8.031 9.294 10.138 9.087 6.870 6.863 0.360 15 11.002 12.823 12.830 14.270 6.146 7.110 0.725 17 9.555 10.204 9.607 10.768 10.696 6.501 1.529 1.530 19 4.595 5.649 4.614 5.854 4.964 5.306 3.549 4.105 21 5.625 6.684 4.347 5.855 3.780 6.146 2.646 3.629 23 3.650 5.811 3.981 4.734 4.787 5.697 3.415 3.342 25 3.183 3.786 3.722 4.999 3.700 5.228 2.152 2.813 27 8.052 9.605 9.596 7.735 4.415 7.369 2.518 3.373 28 9.278 10.878 7.422 8.414 5.774 7.036 4.460 5.282

157
Table A.4 Effluent nitrite data for CDNB inhibited nitrifying reactor experiments. Control Nitrite IC15 Nitrite IC25 Nitrite IC50 Nitrite Time 1 2 1 2 1 2 1 2 days mg/L-N mg/L-N mg/L-N mg/L-N mg/L-N mg/L-N mg/L-N mg/L-N 0.25 0.000 0.000 1.104 1.687 1.622 1.445 0.000 0.000 0.5 0.000 0.000 1.563 2.192 2.183 0.432 0.362 0.000 0.75 0.000 0.000 2.222 2.242 0.459 0.405 0.417 0.000 1.0 0.000 0.000 2.040 2.498 2.576 1.154 0.000 0.000 1.5 0.000 0.000 6.231 6.294 2.056 0.000 0.000 2.0 0.000 0.000 0.000 8.002 1.133 1.685 0.000 0.000 2.5 0.000 0.000 10.927 11.695 1.443 1.584 1.637 3 0.000 0.000 6.667 6.646 6.617 1.320 0.000 0.000 4 0.000 0.000 1.182 1.491 3.302 3.467 0.000 0.000 5 0.000 0.000 1.029 1.144 4.995 5.040 0.920 0.000 6 0.000 0.000 0.000 0.000 6.389 6.377 0.800 0.000 7 0.000 0.000 0.000 0.000 0.000 1.367 0.000 0.000 8 0.000 0.000 0.000 0.000 0.000 0.000 0.507 0.498 9 0.000 0.000 0.000 0.000 0.000 0.000 0.639 0.666 11 0.000 0.000 0.000 0.000 0.000 0.000 0.963 0.957 13 0.000 0.000 0.000 0.000 0.000 0.000 1.753 15 0.000 0.000 0.000 0.000 0.000 0.000 4.788 17 0.000 0.000 0.000 0.000 0.000 0.000 4.163 4.074 19 0.000 0.000 0.000 0.000 0.000 0.000 0.760 0.961 21 0.000 0.000 0.000 0.000 0.000 0.000 0.000 0.000 23 0.000 0.000 0.000 0.000 0.000 0.000 0.000 0.000 25 0.000 0.000 0.000 0.000 0.000 0.000 0.000 0.000 27 0.000 0.000 0.000 0.000 0.000 0.000 0.937 1.116 28 0.000 0.000 0.000 0.000 0.000 0.000 0.526 0.517

158
Table A.5 Effluent ammonia data for CDNB inhibited nitrifying reactor experiments. Control Ammonia IC15 Ammonia IC25 Ammonia IC50 Ammonia Time 1 2 1 2 1 2 1 2 days mg/L-N mg/L-N mg/L-N mg/L-N mg/L-N mg/L-N mg/L-N mg/L-N 0.25 0.000 0.000 0.000 0.000 0.000 2.364 6.574 6.295 0.5 0.000 0.000 0.348 0.695 7.230 8.773 10.933 11.725 0.75 0.000 0.000 0.000 0.000 7.923 9.269 8.677 8.172 1.0 0.000 0.000 0.000 0.000 8.643 10.151 11.834 7.546 1.5 0.000 0.000 0.000 0.000 8.020 11.049 8.556 10.520 2.0 0.000 0.000 0.000 0.000 8.396 11.447 11.974 14.666 2.5 0.000 0.000 0.000 11.367 12.845 15.800 21.794 3 0.609 0.000 0.000 0.000 11.598 15.142 15.163 25.698 4 1.046 0.000 0.574 0.000 5.056 6.166 18.145 32.163 5 0.828 0.000 0.000 0.000 2.727 4.321 18.619 26.507 6 0.127 0.106 0.106 0.158 0.000 0.630 24.091 26.788 7 0.570 0.000 0.000 0.000 0.000 0.000 20.457 18.954 8 0.639 0.000 0.000 0.000 0.000 22.459 22.342 9 1.537 0.000 0.000 0.000 0.000 0.000 23.578 11 0.000 0.000 0.000 0.000 0.000 0.000 14.102 15.215 13 0.000 0.000 0.000 0.000 0.000 15.885 15 1.554 1.169 0.000 0.000 10.627 13.472 17 0.000 0.000 0.000 0.000 0.000 0.000 0.000 0.000 19 0.000 0.000 0.000 0.000 0.000 0.000 0.000 0.000 21 0.000 0.000 0.000 0.000 0.000 0.000 0.000 0.000 23 0.000 0.000 0.000 0.000 0.000 0.000 0.000 0.000 25 0.000 0.000 0.000 0.000 0.000 0.000 0.000 0.000 27 0.000 0.000 0.000 0.000 0.000 0.000 0.000 0.000 28 0.000 0.000 0.000 0.000 0.000 0.000 0.000 0.000
Table A.6 Nitrate Generation Rate (NGR) data for CDNB inhibited nitrifying reactor
experiments. Time Control NGR IC15 NGR IC25 NGR IC50 NGR days (mg N/g MLVSS-hr) (mg N/g MLVSS-hr) (mg N/g MLVSS-hr) (mg N/g MLVSS-hr) 0.5 2.646 0.000 0.848 0.000 1.25 2.444 0.715 0.059 0.133 2.25 1.604 0.656 0.240 0.394 3.25 2.017 0.372 0.054 0.059 5.25 1.246 0.857 0.204 0.096 7.5 4.134 2.213 1.445 0.383 9.25 3.115 2.060 0.354 0.001 13.25 2.657 1.517 1.267 0.025 17.25 3.053 2.881 1.583 0.127 21.25 1.387 1.730 2.245 0.472 25.25 2.586 1.689 2.137 0.961 28.25 1.173 1.565 1.864 0.833

159
Table A.7 Effluent alkalinity data for CDNB inhibited nitrifying reactor experiments. Control CaCO3 IC15 CaCO3 IC25 CaCO3 IC50 CaCO3 Time 1 2 1 2 1 2 1 2 days mg/L mg/L mg/L mg/L mg/L mg/L mg/L mg/L 0.25 144.6 143.9 142.4 140.1 154.4 151.4 176.2 177.0 0.5 151.4 154.4 150.6 149.9 195.1 195.8 203.4 201.9 1 166.5 165.7 158.9 158.2 223.7 222.2 237.3 238.0 2 167.2 168.7 169.5 165.7 249.3 252.3 271.2 272.7 3 237.3 238.0 241.0 242.5 308.8 309.6 364.5 372.1 5 165.7 178.5 186.0 186.8 204.9 206.4 312.6 313.3 7 145.4 146.9 159.7 158.9 177.8 177.8 291.5 290.7 9 166.5 184.5 198.1 198.1 207.1 205.6 293.7 346.5 11 214.7 211.6 229.7 229.7 232.7 230.5 291.5 297.5 15 165.7 170.2 168.0 167.2 192.1 193.6 226.7 230.5 19 210.1 211.6 210.9 210.9 211.6 210.9 226.0 226.0 23 199.6 200.4 198.8 199.6 195.8 197.3 214.7 215.4 27 180.8 184.5 195.8 193.6 192.8 195.8 213.9 212.4 28 180.8 185.3 196.6 197.3 199.6 199.6 206.4 207.1
Table A.8 Effluent pH data for CDNB inhibited nitrifying reactor experiments.
Time Control pH IC15 pH IC25 pH IC50 pH days 1 2 1 2 1 2 1 2 0.25 7.89 7.84 7.74 7.76 7.76 7.8 7.99 8
0.5 7.81 7.83 7.74 7.73 7.89 7.9 7.96 7.960.75 7.86 7.93 7.99 8.05
1 7.88 7.88 7.92 7.95 8.04 8.1 8.12 8.111.5 7.83 7.91 8.03 8.11
2 7.87 7.87 7.91 7.91 8.08 8.1 8.2 8.192.5 7.83 7.84 8.02 8.13
3 7.78 7.8 7.98 8 8.08 8.1 8.09 8.084 7.95 7.94 8.04 8.05 8.01 8 8.06 8.075 8.07 8 7.97 8.08 7.94 8.2 8.11 8.136 7.78 7.79 7.9 7.9 7.91 7.9 8.07 7 7.98 7.9 7.97 7.96 8.07 8.1 8.09 8.18 7.81 7.85 7.92 7.94 9 7.94 7.95 7.91 7.91 8.02 8 8.01 8.01
11 7.88 7.99 7.97 7.96 7.98 8 7.94 7.9315 7.59 7.9 7.8 7.82 7.83 7.9 7.84 7.817 7.96 7.8 7.74 7.59 19 8.11 8.12 8.07 8.11 7.98 8 7.9 7.9421 7.81 7.96 7.88 7.67 23 8.15 8.19 8 8.02 8.01 8 7.78 7.8825 7.59 7.92 7.67 7.55 27 7.96 7.99 7.96 7.89 7.68 7.7 7.68 7.728 7.95 8.11 8.08 8.09 7.94 8 7.93 7.94

160
Table A.9 Effluent CDNB concentrations for CDNB inhibited nitrifying reactor experiments.
Control IC15 IC25 IC50 Time 1 2 1 2 1 2 1 2 days mg/L mg/L mg/L mg/L mg/L mg/L mg/L mg/L
0 0 0 0.25 0 0 0 0 5.463 5.763 65.233 64.923 0.5 0 0 0 0 0 0 41.255 41.391 0.75 0 0 0 0 0 0 23.55 23.778 1 0 0 0 0 0 0 8.629 8.744 1.5 0 0 0 0 0 0 0 0 2 0 0 0 0 0 0 0 0 2.5 0 0 0 0 0 0 0 0 3 0 0 0 0 0 0 0 0 4 0 0 0 0 0 0 0 0 5 0 0 0 0 0 0 0 0 6 0 0 0 0 0 0 0 0 7 0 0 0 0 0 0 0 0 8 0 0 0 0 0 0 0 0 9 0 0 0 0 0 0 0 0 11 0 0 0 0 0 0 0 0 13 0 0 0 0 0 0 0 0 15 0 0 0 0 0 0 0 0 17 0 0 0 0 0 0 0 0 19 0 0 0 0 0 0 0 0 21 0 0 0 0 0 0 0 0 23 0 0 0 0 0 0 0 0 25 0 0 0 0 0 0 0 0 27 0 0 0 0 0 0 0 0 28 0 0 0 0 0 0 0 0
161
Table A.10 Actual calculated Solids Residence Time (SRT) for CDNB inhibited nitrifying reactor experiments.
Control IC15 IC25 IC50 Time SRT SRT SRT SRT days days days days days
1 8.7 8.0 7.7 6.4 2 9.3 8.8 8.7 7.1 3 8.5 8.5 8.4 6.4 4 4.7 9.0 9.0 6.6 5 6.5 8.8 8.7 7.2 6 8.8 9.0 9.4 8.0 7 7.9 9.1 9.1 8.7 8 8.6 9.2 9.0 9.0 10 9.0 9.4 9.5 9.0 12 8.3 8.8 8.4 8.2 14 8.7 8.6 9.6 9.5 16 8.9 9.2 9.4 9.3 18 9.3 8.9 9.3 5.6 20 8.3 8.3 9.0 2.4 22 9.2 9.4 9.4 3.4 24 8.5 8.3 9.7 2.7 26 7.8 8.4 7.9 8.8 28 9.5 9.8 6.6 10.0

162
Table A.11 MLSS data for cadmium inhibited nitrifying reactor experiments. Control MLSS IC15 MLSS IC25 MLSS IC50 MLSS Time 1 2 3 1 2 3 1 2 3 1 2 3
days mg/L mg/L mg/L mg/L mg/L mg/L mg/L mg/L mg/L mg/L mg/L mg/L
0.25 1193 1147 1367 1253 1233 1407 1473 1413 1433 1187 1233 1327 0.75 1260 1200 1333 1233 1260 1253 1107 1060 1080 987 1020 1007 1.25 1233 1200 1187 1227 1233 1253 1213 1120 1140 1047 1007 2.25 1233 1227 1193 1180 1273 1180 1020 1020 967 913 947 993 2.75 1252 1320 1324 1247 1240 1233 1220 1127 1160 1200 1153 1173 3.75 1287 1293 1247 1213 1260 1227 1153 1173 1093 933 960 940 5 1220 1220 1260 1267 1213 1227 1260 1553 1260 1140 1213 1160 5.75 1080 1053 1167 1047 1007 1027 1113 1087 1107 980 960 947 7.25 1093 1107 1133 1233 1187 1213 1160 1173 1087 1200 1133 1520 8 1160 1027 1107 1333 1173 1173 1100 1127 1080 947 980 947 8.75 1013 1020 1007 1027 1047 1040 1093 1280 1027 973 913 967 11.25 984 1036 1040 967 1020 992 987 1047 1000 1013 967 1113 13 1127 1247 1120 1093 1153 1140 1187 1347 1200 980 1027 1127 15 1100 1173 1067 1120 1133 1133 1067 1147 1207 1073 1053 1093 17 1196 1220 1156 1107 1180 1200 1227 1173 1100 1120 1087 1113 19 1307 1253 1253 1287 1313 1313 1260 1340 1253 1180 1213 1120 21 1420 1353 1360 1380 1353 1373 1347 1327 1373 1440 1287 1333 23 1580 1407 1427 1367 1447 1520 1353 1440 1320 1413 1307 1233 25 1447 1480 1453 1587 1507 1547 1547 1593 1567 1460 1307 1460 27 1507 1433 1460 1427 1427 1387 1553 1593 1487 1427 1480 1480
29.75 1567 1640 1647 1620 1560 1553 1540 1487 1487 1453 1427 1467

163
Table A.12 MLVSS data for cadmium inhibited nitrifying reactor experiments. Control MLVSS IC15 MLVSS IC25 MLVSS IC50 MLVSS Time 1 2 3 1 2 3 1 2 3 1 2 3
days mg/L mg/L mg/L mg/L mg/L mg/L mg/L mg/L mg/L mg/L mg/L mg/L
0.25 953 900 1067 980 953 1093 1173 1107 1120 907 927 1000 0.75 980 953 1087 993 1013 993 860 867 887 747 787 787 1.25 980 960 953 947 993 993 947 880 913 773 760 2.25 987 1000 980 893 953 973 800 820 747 727 747 820 2.75 1004 1072 1084 1000 1020 1027 1000 927 960 973 933 953 3.75 1047 1053 993 1007 1027 1007 960 947 900 760 753 773 5 980 987 1027 1033 953 987 1033 1273 1027 913 993 940 5.75 853 820 927 820 760 780 867 867 887 787 740 740 7.25 860 933 900 907 907 933 880 880 833 927 893 1113 8 947 827 907 1067 953 953 860 933 873 760 793 760 8.75 907 880 873 927 900 907 933 1140 907 827 760 773 11.25 824 860 860 787 820 808 807 840 793 813 793 900 13 980 1073 993 947 1000 993 993 1153 1020 840 893 993 15 947 1013 927 967 953 953 920 1007 1053 907 880 927 17 1020 1032 988 913 1007 1020 1040 1020 947 933 907 953 19 1127 1087 1093 1107 1127 1120 1107 1153 1087 1000 1027 933 21 1227 1153 1160 1173 1160 1160 1167 1100 1173 1227 1047 1093 23 1433 1273 1300 1207 1320 1353 1247 1313 1173 1280 1147 1107 25 1253 1287 1233 1360 1300 1313 1300 1367 1333 1233 1113 1247 27 1293 1193 1247 1227 1213 1173 1300 1360 1233 1200 1240 1253
29.75 1353 1400 1413 1393 1320 1333 1313 1273 1267 1240 1240 1260

164
Table A.13 Effluent nitrate data for cadmium inhibited nitrifying reactor experiments. Control Nitrate IC15 Nitrate IC25 Nitrate IC50 Nitrate Time 1 2 1 2 1 2 1 2 days mg/L-N mg/L-N mg/L-N mg/L-N mg/L-N mg/L-N mg/L-N mg/L-N 0.25 23.434 16.717 16.666 15.489 15.451 15.581 15.577 0.5 18.113 18.105 13.211 13.209 11.205 11.175 12.113 12.139 0.75 17.446 17.457 11.626 11.603 8.843 8.901 7.181 7.169 1 14.595 12.470 12.450 8.197 8.163 5.917 5.909 1.25 16.559 16.563 15.003 14.985 0.512 0.512 4.939 4.842 1.75 15.162 15.220 13.885 13.882 10.315 10.120 4.106 4.079 2.25 14.433 14.411 12.854 12.871 11.438 11.577 5.384 5.393 2.75 0.512 0.512 8.788 8.849 6.938 6.953 3.75 12.135 12.439 11.193 11.228 7.910 7.972 8.464 4.75 13.007 12.998 10.619 10.652 5.75 19.952 19.909 17.760 17.738 18.260 18.245 12.578 12.498 6.75 20.407 20.443 19.156 19.150 18.233 18.255 13.152 13.173 7.75 20.622 20.971 20.057 20.063 19.252 19.242 15.245 15.193 8.75 18.118 18.129 17.157 17.153 12.921 12.918 13.987 13.987 10.75 18.666 18.684 17.750 17.747 18.358 18.369 19.036 19.039 12.75 27.536 27.589 19.303 19.311 21.828 21.849 21.543 21.539 14.75 17.145 17.140 23.044 23.043 22.222 22.214 23.750 23.720 16.75 26.954 26.972 23.700 23.706 26.642 26.602 26.192 26.178 18.75 24.202 24.489 21.902 21.751 24.040 23.989 24.613 24.578 20.75 20.861 20.940 20.183 20.426 22.718 22.628 20.533 20.486 22.75 20.035 20.006 16.301 16.347 26.496 26.596 21.147 21.171 24.75 24.182 24.162 26.786 27.072 24.060 24.163 28.404 28.077 26.75 23.111 23.084 25.418 25.308 22.646 22.700 23.468 23.604

165
Table A.14 Effluent nitrite data for cadmium inhibited nitrifying reactor experiments. Control Nitrite IC15 Nitrite IC25 Nitrite IC50 Nitrite Time 1 2 1 2 1 2 1 2 days mg/L-N mg/L-N mg/L-N mg/L-N mg/L-N mg/L-N mg/L-N mg/L-N 0.25 5.34 0.214 0.207 0.238 0.232 0 0 0.5 0.000 0.210 0.219 0.250 0.000 0.000 0.000 0.000 0.75 0.257 0.243 0.323 0.329 0.241 0.287 0.000 0.000 1 0.000 0.220 0.590 0.584 0.269 0.285 0.000 0.000 1.25 0.259 0.255 0.438 0.428 0.000 0.000 0.233 0.216 1.75 0.299 0.292 0.000 0.000 0.432 0.414 0.229 0.230 2.25 0.305 0.241 0.000 0.000 0.437 0.458 0.330 0.370 2.75 0.000 0.000 0.000 0.000 0.460 0.497 3.75 0.223 0.204 0.000 0.000 0.000 0.000 0.000 0.398 4.75 0.319 0.332 0.631 0.733 5.75 0.313 0.283 0.237 0.280 0.238 0.297 0.639 0.611 6.75 0.301 0.299 0.239 0.274 0.275 0.275 0.727 0.760 7.75 0.261 0.273 0.234 0.216 0.254 0.262 1.130 1.085 8.75 0.206 0.200 0.170 0.171 0.185 0.189 0.220 0.219 10.75 0.180 0.189 0.158 0.157 0.166 0.169 0.203 0.202 12.75 0.223 0.224 0.000 0.168 0.163 0.163 0.207 0.204 14.75 2.583 2.584 0.000 0.000 0.000 0.000 0.000 0.000 16.75 0.000 0.000 0.000 0.000 0.000 0.000 0.000 0.000 18.75 0.000 0.000 0.000 0.000 0.000 0.000 0.000 0.000 20.75 0.000 0.000 0.000 0.000 0.000 0.000 0.000 0.000 22.75 0.000 0.000 0.000 0.000 0.000 0.000 0.000 0.000 24.75 0.000 0.000 0.000 0.000 0.000 0.000 0.000 0.000 26.75 0.000 0.000 0.000 0.000 0.000 0.000 0.000 0.000

166
Table A.15 Effluent ammonia data for cadmium inhibited nitrifying reactor experiments. Control Ammonia IC15 Ammonia IC25 Ammonia IC50 Ammonia Time 1 2 1 2 1 2 1 2 days mg/L-N mg/L-N mg/L-N mg/L-N mg/L-N mg/L-N mg/L-N mg/L-N 0.25 0.386 0.458 3.644 3.018 3.789 3.483 3.017 3.730 0.5 0.232 0.223 0.492 5.609 5.624 6.491 6.538 0.75 0.158 0.084 5.778 4.695 7.600 6.734 1 0.192 0.148 2.728 6.005 6.332 8.567 10.523 1.25 0.247 0.242 0.768 0.789 6.586 6.719 5.988 8.620 1.75 0.619 0.130 0.046 0.050 2.862 3.339 9.012 8.867 2.25 0.375 0.303 0.255 0.320 0.782 0.629 7.317 6.834 2.75 3.105 1.697 0.245 0.355 2.128 3.75 0.223 0.198 0.140 0.190 0.098 0.094 0.119 0.149 4.75 0.740 0.625 0.361 0.305 5.75 0.739 0.536 0.629 2.950 2.919 6.75 0.577 0.377 0.185 0.151 0.284 0.230 2.881 7.75 0.353 0.225 0.201 0.262 0.288 0.266 1.512 1.530 8.75 0.359 0.175 0.135 0.182 0.227 0.259 0.152 0.170 10.75 0.399 0.282 0.181 0.212 0.289 0.291 0.310 0.130 12.75 0.281 0.178 0.185 0.209 0.209 0.206 0.197 14.75 2.822 2.109 0.232 0.343 0.281 0.401 0.222 0.483 16.75 0.438 0.293 0.245 0.270 0.416 0.132 0.106 0.209 18.75 0.236 0.177 0.265 0.184 0.135 0.150 0.185 0.392 20.75 0.582 0.184 0.143 0.144 0.336 0.228 0.440 0.421 22.75 0.151 0.283 0.251 0.332 0.424 0.480 0.214 0.227 24.75 0.537 0.408 0.419 0.428 0.187 0.185 0.242 0.296 26.75 0.166 0.146 0.038 0.149 0.246 0.253 0.129 0.131 29.75 0.164 0.264 0.269 0.278 0.235 0.238 0.113 0.261

167
Table A.16 Effluent alkalinity data for cadmium inhibited nitrifying reactor experiments. Control CaCO3 IC15 CaCO3 IC25 CaCO3 IC50 CaCO3 Time 1 2 3 1 2 3 1 2 3 1 2 3
days mg/L mg/L mg/L mg/L mg/L mg/L mg/L mg/L mg/L mg/L mg/L mg/L
0.25 69.1 75.6 57.1 61.9 61.1 59.5 61.9 60.3 60.3 49.0 53.9 45.8 0.75 65.1 53.9 53.1 84.4 89.2 87.6 104.5 105.3 104.5 111.0 104.5 105.3 1.25 69.1 71.6 64.3 64.3 65.1 70.8 112.6 113.4 100.5 132.7 129.4 130.2 2.25 72.4 68.3 68.3 74.8 76.4 76.4 83.6 84.4 83.6 128.6 128.6 123.8 3.75 72.4 71.6 73.2 80.4 77.2 78.8 93.3 89.2 92.5 93.3 92.5 95.7 5.75 49.0 48.2 50.7 56.3 55.5 57.1 99.7 61.9 59.5 88.4 84.4 86.8 7.75 41.0 40.2 37.8 40.2 39.4 41.8 43.4 43.4 44.2 61.1 59.5 61.9 10.75 12.9 14.5 13.7 25.7 24.1 24.9 20.1 17.7 19.3 24.1 24.9 24.1 14.75 10.5 7.2 4.8 6.4 6.4 5.6 6.4 4.8 7.2 8.0 7.2 7.2 18.75 13.7 15.3 15.3 20.9 20.9 21.7 18.5 15.3 15.3 15.3 14.5 15.3 22.75 28.1 25.7 28.1 44.2 41.8 40.2 33.8 32.2 33.0 28.1 28.1 27.3 26.75 22.5 21.7 23.3 20.1 19.3 19.3 24.9 26.5 26.5 24.9 24.9 24.1
29.75 7.2 13.7 8.8 8.0 4.8 6.4 6.4 5.6 7.2 10.5 8.8 9.6
Table A.17 Effluent pH data for cadmium inhibited nitrifying reactor experiments. Time Control pH IC15 pH IC25 pH IC50 pH days 1 2 3 1 2 3 1 2 3 1 2 3
0.25 7.60 7.85 7.70 7.57 7.70 7.86 7.83 7.60 7.84 7.65 7.90 7.71 0.50 7.62 7.89 7.93 7.97 0.75 7.78 7.65 7.83 7.92 8.00 7.82 7.67 7.75 7.75 7.8 7.74 7.77 1 7.75 7.64 7.98 8.07 1.25 7.92 7.97 7.92 7.75 7.7 7.65 7.8 7.7 7.7 7.78 7.77 7.75 1.75 7.8 7.82 7.92 8.13 2.25 7.78 7.99 7.9 7.96 7.94 7.97 7.85 7.8 7.9 7.93 7.77 7.71 2.75 7.79 8.01 8.01 3.75 7.79 7.84 7.98 7.95 7.92 7.95 8.1 7.8 7.7 7.78 7.96 7.72 5.75 7.94 7.72 7.85 7.76 7.65 7.74 7.89 7.7 7.7 7.89 8.14 7.83 7.75 7.59 7.41 7.6 7.45 7.53 7.55 7.66 7.6 7.7 7.69 7.74 7.97 10.75 7.19 7.09 7.03 7.22 7.37 7.27 7.03 7.1 7.2 7.37 7.3 7.38 14.75 6.4 6.41 6.3 6.1 6.17 6.17 6.21 6.1 6.2 6.4 6.4 6.44 18.75 6.92 7.23 7.03 7.22 7.11 7.2 6.96 7 7 7.26 7.08 7.05 22.75 7.26 7.23 7.2 7.36 7.45 7.76 7.43 7.5 7.4 7.16 7.2 7.24 26.75 7.18 7.18 7.19 7.05 7.06 7.08 7.4 7.3 7.2 7.3 7.34 7.42 29.75 6.71 6.66 6.64 6.34 6.39 6.4 6.4 6.4 6.63 6.65 6.59
29.75 7.60 7.85 7.70 7.57 7.70 7.86 7.83 7.60 7.84 7.65 7.90 7.71

168
Table A.18 Effluent cadmium concentrations for cadmium inhibited nitrifying reactor
experiments. Control IC15 IC25 IC50 Time 1 2 3 1 2 3 1 2 3 1 2 3
days mg/L mg/L mg/L mg/L mg/L mg/L mg/L mg/L mg/L mg/L mg/L mg/L
0.25 0.01 0.01 0.00 1.61 1.62 1.61 1.90 1.90 1.91 4.51 4.18 4.18 0.5 0.00 0.00 0.00 1.07 1.07 1.07 1.43 1.43 1.43 2.86 2.75 2.75
0.75 0.01 0.01 0.01 1.04 1.04 1.05 1.65 1.67 1.67 2.75 2.64 2.64 1 0.00 0.00 0.00 0.85 0.86 0.86 1.05 1.04 1.05 1.64 1.63 1.65
1.25 0.00 0.00 0.00 0.92 0.92 0.92 1.09 1.09 1.09 1.84 1.83 1.83 1.75 0.00 0.00 0.00 0.70 0.70 0.68 0.92 0.92 0.92 1.33 1.33 1.33 2.25 0.00 0.00 0.00 0.63 0.63 0.63 0.98 0.95 0.95 1.42 1.43 1.44 2.75 0.00 0.00 0.00 0.64 0.64 0.64 0.99 0.99 0.99 3.75 0.00 0.00 0.00 0.41 0.41 0.41 0.56 0.56 0.56 0.95 0.95 0.96 4.75 0.42 0.42 0.42 0.65 0.65 0.65 5.75 0.00 0.00 0.00 0.20 0.20 0.20 0.27 0.27 0.27 0.47 0.47 0.47 6.75 0.00 0.00 0.00 0.14 0.14 0.13 0.24 0.24 0.24 0.38 0.38 0.38 7.75 0.00 0.00 0.00 0.11 0.11 0.10 0.10 0.10 0.09 0.39 0.39 0.39 8.75 0.00 0.00 0.00 0.06 0.06 0.06 0.04 0.04 0.05 0.29 0.29 0.29
10.75 0.03 0.02 0.03 0.02 0.02 0.02 0.03 0.03 0.03 0.10 0.10 0.10 12.75 0.01 0.01 0.01 0.03 0.04 0.04 0.01 0.01 0.01 0.05 0.05 0.05 14.75 0.00 0.00 0.00 0.03 0.03 0.03 0.03 0.03 0.02 0.05 0.05 0.05 16.75 0.00 0.00 0.00 0.00 0.00 0.00 0.00 0.01 0.00 0.01 0.01 0.01 18.75 0.00 0.00 0.00 0.00 0.01 0.00 0.01 0.01 0.01 0.01 0.01 0.01 20.75 0.00 0.00 0.01 0.09 0.09 0.09 0.00 0.00 0.00 0.00 0.00 0.00 22.75 0.00 0.00 0.00 0.00 0.00 0.00 0.01 0.01 0.01 0.03 0.03 0.03 24.75 0.00 0.00 0.00 0.01 0.01 0.00 0.00 0.00 0.00 0.00 0.00 0.00 26.75 0.00 0.00 0.00 0.00 0.00 0.00 0.00 0.00 0.00 0.00 0.00 0.00
27.75 0.00 0.00 0.00 0.02 0.02 0.02 0.02 0.00 0.02 0.01 0.01 0.02

169
Table A.19 Actual calculated Solids Residence Time (SRT) for cadmium inhibited nitrifying reactor experiments.
Control IC15 IC25 IC50 Time SRT SRT SRT SRT days days days days days
1 7.4 5.5 4.9 4.4 2 7.4 5.8 5.1 4.8 3 7.9 6.2 5.6 5.6 4 7.4 6.4 5.8 5.5 5 10.0 10.0 6.5 6.2 6 7.7 6.0 5.0 4.7 7 8.0 6.9 5.8 6.1 8 8.0 7.3 7.7 7.4 9 6.6 6.4 5.6 5.8 11 7.6 6.8 6.4 5.8 13 8.1 7.8 7.4 6.0 15 8.6 7.7 7.7 8.1 17 8.8 7.4 7.6 6.8 19 8.8 8.3 7.8 7.6 21 8.2 8.7 8.4 8.4 23 9.5 5.0 9.5 8.8 25 8.9 9.0 9.3 8.2 27 8.6 8.1 8.8 8.3 30 8.6 8.5 7.8 8.4

170
Table A.20 MLSS data for 1-octanol inhibited nitrifying reactor experiments. Control MLSS IC15 MLSS IC25 MLSS IC50 MLSS Time 1 2 3 1 2 3 1 2 3 1 2 3
days mg/L mg/L mg/L mg/L mg/L mg/L mg/L mg/L mg/L mg/L mg/L mg/L
0.5 1224 1113 1100 1293 1260 1200 1333 1353 1353 1300 1273 1253 1.5 1473 1380 1387 1353 1347 1380 1533 1553 1567 1427 1473 1413 2 1380 1333 1400 1407 1447 1460 1460 1520 1553 1513 1573 1500 3 1347 1540 1433 1467 1520 1533 1533 1680 1573 1647 1573 1633 4 1527 1507 1493 1520 1547 1493 1540 1527 1540 1480 1560 1580 5.5 1740 1840 1740 1710 1810 1780 1690 1780 1760 1790 1790 1840 6.25 1520 1610 1530 1640 1710 1670 1640 1660 1590 1740 1680 1650 7 1500 1540 1513 1653 1647 1560 1633 1613 1573 1567 1653 1600 8 1547 1600 1633 1667 1567 1507 1513 1540 1533 1560 1647 1580 9 1647 1667 1633 1553 1593 1567 1540 1487 1533 1593 1547 1600
11 1567 1667 1567 1647 1553 1540 1440 1147 1420 1447 1473 1467
Table A.21 MLVSS data for 1-octanol inhibited nitrifying reactor experiments. Control MLVSS IC15 MLVSS IC25 MLVSS IC50 MLVSS Time 1 2 3 1 2 3 1 2 3 1 2 3
days mg/L mg/L mg/L mg/L mg/L mg/L mg/L mg/L mg/L mg/L mg/L mg/L
0.5 1092 987 987 1160 1140 1073 1207 1213 1200 1160 1147 1107 1.5 1367 1273 1267 1253 1253 1307 1413 1467 1453 1340 1367 1307 2 1173 1140 1193 1213 1233 1260 1260 1320 1327 1307 1320 1287 3 1207 1333 1227 1273 1327 1333 1353 1367 1373 1440 1373 1427 4 1380 1327 1300 1320 1360 1287 1327 1353 1360 1320 1387 1387 5.5 1560 1620 1540 1540 1600 1590 1500 1550 1530 1560 1600 1600 6.25 1400 1470 1390 1430 1530 1480 1410 1480 1420 1530 1480 1490 7 1353 1387 1360 1473 1460 1400 1487 1447 1420 1413 1493 1453 8 1407 1433 1460 1493 1407 1367 1367 1373 1380 1393 1473 1420 9 1487 1487 1473 1400 1447 1427 1373 1340 1367 1427 1380 1440
11 1387 1493 1393 1460 1393 1387 1260 1013 1273 1320 1320 1320

171
Table A.22 Effluent nitrate data for 1-octanol inhibited nitrifying reactor experiments. Control Nitrate IC15 Nitrate IC25 Nitrate IC50 Nitrate Time 1 2 1 2 1 2 1 2 days mg/L-N mg/L-N mg/L-N mg/L-N mg/L-N mg/L-N mg/L-N mg/L-N 0.25 3.265 3.854 3.095 3.348 2.272 3.387 3.408 2.687 0.5 3.059 3.159 0.383 0.382 0.397 0.395 0.723 0.912 0.75 1.659 1.892 0.371 0.370 0.375 0.374 0.391 0.390 1 0.898 0.844 0.415 0.398 0.411 0.429 0.392 0.393 1.25 0.726 0.140 0.118 0.044 0.045 0.042 0.048 1.75 0.755 0.746 0.304 0.283 0.261 0.045 0.062 0.062 2.25 3.785 3.714 3.216 3.248 2.480 2.512 0.095 0.094 2.75 3.765 4.744 4.086 4.057 4.170 4.204 3.256 3.204 3.75 4.385 7.150 4.576 5.166 5.162 3.406 4.308 5.25 11.486 12.863 7.412 9.114 7.144 7.689 5.057 5.881 6 11.342 13.243 8.662 9.482 7.797 8.366 5.138 5.761 6.75 3.434 3.964 2.553 2.945 2.180 2.864 2.487 3.002 7.75 6.768 7.155 5.840 4.882 5.158 5.285 5.488 8.75 11.553 0.193 0.192 5.735 6.017 6.035 6.062 10.75 14.900 14.872 8.035 8.012 8.431 8.450 6.467 6.483
Table A.23 Effluent nitrite data for 1-octanol inhibited nitrifying reactor experiments.
Control Nitrite IC15 Nitrite IC25 Nitrite IC50 Nitrite Time 1 2 1 2 1 2 1 2 days mg/L-N mg/L-N mg/L-N mg/L-N mg/L-N mg/L-N mg/L-N mg/L-N 0.25 0.208 0.211 0.221 0.263 0.304 0.392 0.5 0.000 0.272 0.000 0.000 0.000 0.000 0.000 0.000 0.75 0.000 0.000 0.000 0.000 0.000 0.000 0.000 0.000 1 0.000 0.187 0.000 0.000 0.000 0.000 0.000 0.000 1.25 0.000 0.000 0.000 0.000 0.000 0.000 0.000 0.000 1.75 0.000 0.000 0.000 0.000 0.000 0.000 0.000 0.000 2.25 0.000 0.000 0.152 0.135 0.000 0.000 0.000 0.000 2.75 0.149 0.151 0.198 0.168 0.149 0.170 0.277 0.279 3.75 0.286 0.296 0.303 0.323 0.350 0.523 0.588 5.25 0.292 0.287 0.267 0.313 0.301 0.288 0.409 0.418 6 0.246 0.296 0.259 0.266 0.267 0.320 0.387 0.384 6.75 0.237 0.243 0.214 0.254 0.224 0.243 0.295 0.259 7.75 0.240 0.273 0.241 0.243 0.233 0.348 0.399 8.75 0.234 0.212 0.219 0.261 0.255 0.258 0.331 10.75 0.257 0.250 0.265 0.232 0.236 0.240 0.276 0.284

172
Table A.24 Effluent ammonia data for 1-octanol inhibited nitrifying reactor experiments. Control Ammonia IC15 Ammonia IC25 Ammonia IC50 Ammonia Time 1 2 1 2 1 2 1 2 days mg/L-N mg/L-N mg/L-N mg/L-N mg/L-N mg/L-N mg/L-N mg/L-N 0.25 0.000 0.000 0.000 0.000 0.000 0.000 3.481 3.392 0.5 0.000 0.000 0.000 0.000 0.000 0.000 0.000 0.000 0.75 0.000 0.000 0.000 0.000 0.000 0.000 0.000 0.000 1 0.000 0.000 0.000 0.000 0.000 1.25 0.000 0.000 0.000 0.000 0.000 0.000 0.000 0.000 1.75 0.000 0.000 0.000 0.000 0.000 0.000 0.000 0.000 2.25 0.000 0.000 0.000 0.000 0.000 0.000 0.000 2.75 0.000 0.000 0.000 0.000 0.000 0.000 0.000 0.000 3.75 0.000 0.000 0.000 0.000 0.000 0.000 0.000 0.000 5.25 0.000 0.000 0.000 0.000 0.000 0.000 0.000 0.000 6 0.000 0.000 0.000 0.000 0.000 0.000 0.000 0.000 6.75 0.000 0.000 0.000 0.000 0.000 0.000 0.000 0.000 7.75 0.000 0.000 0.000 0.000 0.000 0.000 0.000 0.000 8.75 0.000 0.000 8.810 9.561 0.000 0.000 0.000 0.000 10.75 0.000 0.000 0.000 0.000 0.000 0.000 0.000 0.000
Table A.25 Nitrate Generation Rate (NGR) data for 1-octanol inhibited nitrifying reactor
experiments. Time Control NGR IC15 NGR IC25 NGR IC50 NGR days (mg N/g MLVSS-hr) (mg N/g MLVSS-hr) (mg N/g MLVSS-hr) (mg N/g MLVSS-hr) 0.5 2.664 1.735 1.608 0.972 1.5 2.266 1.231 1.956 0.752 2 2.237 1.396 1.385 0.801 4 1.767 1.642 1.590 0.917 6 2.602 2.504 2.658 1.622 8 3.354 2.396 2.312 1.759 11 2.374 2.218 2.627 2.196

173
Table A.26 Effluent alkalinity data for 1-octanol inhibited nitrifying reactor experiments. Control CaCO3 IC15 CaCO3 IC25 CaCO3 IC50 CaCO3 Time 1 2 1 2 1 2 1 2 days mg/L mg/L mg/L mg/L mg/L mg/L mg/L mg/L 0.25 181.7 184.1 189.7 190.5 183.3 184.9 185.7 188.9 1 238.0 241.2 247.6 249.2 245.2 246.8 247.6 250.0 1.75 250.0 250.0 250.0 251.7 2.25 234.0 238.0 241.2 242.0 2.75 239.2 234.8 241.2 240.8 238.8 238.0 242.4 245.2 3.75 231.6 234.0 241.2 234.8 237.2 237.2 236.4 236.4 6 198.6 197.8 213.1 213.1 217.1 216.3 225.9 225.9 7.75 225.1 222.7 236.4 234.0 236.4 236.4 229.9 10.75 203.4 205.0 225.9 228.3 233.2 233.2 230.7 229.1
Table A.27 Effluent pH data for 1-octanol inhibited nitrifying reactor experiments. Time Control pH IC15 pH IC25 pH IC50 pH days 1 2 1 2 1 2 1 2 0.25 8.04 8.03 7.91 7.90 8.11 7.95 7.57 7.40 1 8.12 8.10 8.12 8.21 8.14 8.11 8.12 8.13 1.75 8.10 8.18 8.26 8.24 2.25 8.30 8.17 8.13 8.15 2.75 8.18 8.08 8.13 8.09 8.08 8.08 8.10 8.08 3.75 8.09 8.08 7.96 8.03 8.06 8.06 8.05 8.07 6 8.13 8.17 8.21 8.14 8.24 8.24 8.25 8.34 7.75 8.10 8.03 8.01 8.08 8.07 8.08 8.06 10.75 8.22 8.16 8.19 8.18 8.21 8.20 8.16 8.22

174
Table A.28 Effluent octanol concentrations for 1-octanol inhibited nitrifying reactor experiments.
Control IC15 IC25 IC50 Time 1 2 1 2 1 2 1 2 days mg/L mg/L mg/L mg/L mg/L mg/L mg/L mg/L
0 0.00 0.00 0.25 0.00 0.00 0.00 0.00 0.00 0.00 11.5251 13.41670.5 0.00 0.00 0.00 0.00 0.00 0.00 0 0.00 0.75 0.00 0.00 0.00 0.00 0.00 0.00 12.47 0.00 1 0.00 0.00 0.00 0.00 0.00 0.00 0.00 0.00 1.5 0.00 0.00 0.00 0.00 0.00 0.00 0.00 0.00 2 0.00 0.00 0.00 0.00 0.00 0.00 0.00 0.00
Table A.29 Actual calculated Solids Residence Time (SRT) for 1-octanol inhibited nitrifying reactor experiments.
Control IC15 IC25 IC50 Time SRT SRT SRT SRT days days days days days
1 7.9 7.7 8.1 7.1 2 7.1 7.4 7.9 7.7 3 8.1 7.8 7.9 8.3 4 8.1 7.1 7.8 8.4 6 8.8 8.3 8.2 8.8 7 9.6 8.7 8.4 8.9 8 7.9 8.1 7.8 8.4 9 8.9 7.9 8.6 9.2 11 9.0 9.5 9.4 9.4
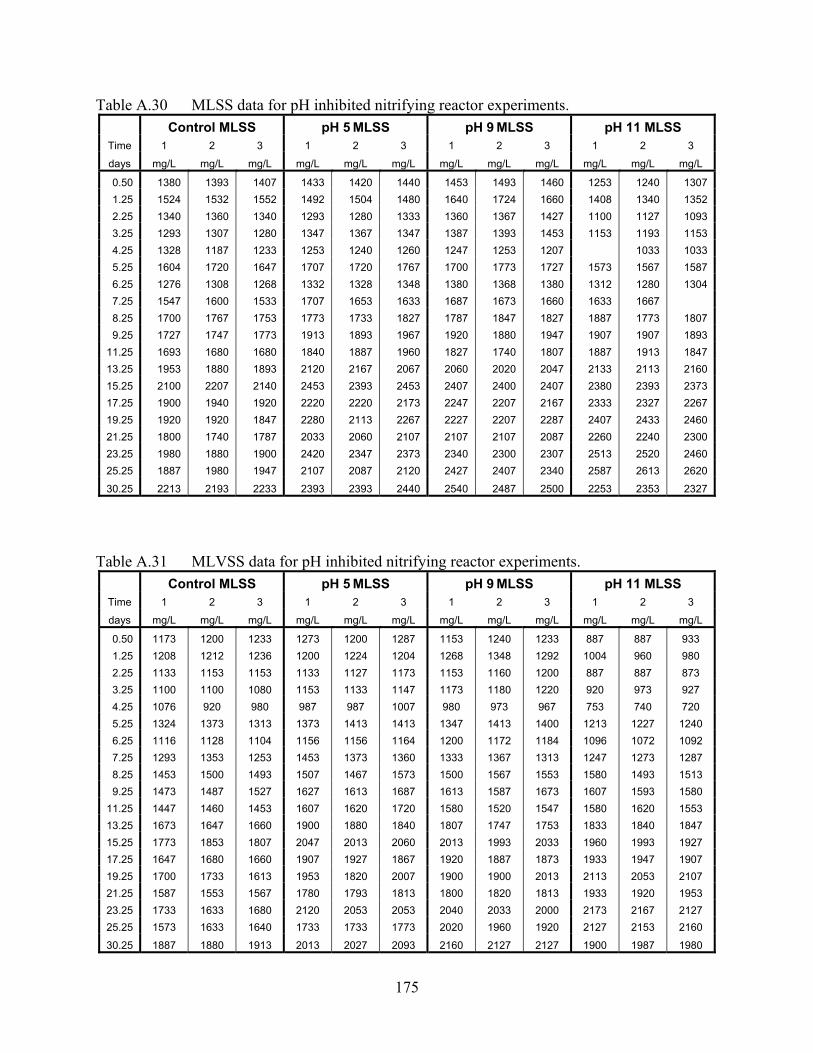
175
Table A.30 MLSS data for pH inhibited nitrifying reactor experiments. Control MLSS pH 5 MLSS pH 9 MLSS pH 11 MLSS Time 1 2 3 1 2 3 1 2 3 1 2 3
days mg/L mg/L mg/L mg/L mg/L mg/L mg/L mg/L mg/L mg/L mg/L mg/L
0.50 1380 1393 1407 1433 1420 1440 1453 1493 1460 1253 1240 1307 1.25 1524 1532 1552 1492 1504 1480 1640 1724 1660 1408 1340 1352 2.25 1340 1360 1340 1293 1280 1333 1360 1367 1427 1100 1127 1093 3.25 1293 1307 1280 1347 1367 1347 1387 1393 1453 1153 1193 1153 4.25 1328 1187 1233 1253 1240 1260 1247 1253 1207 1033 1033 5.25 1604 1720 1647 1707 1720 1767 1700 1773 1727 1573 1567 1587 6.25 1276 1308 1268 1332 1328 1348 1380 1368 1380 1312 1280 1304 7.25 1547 1600 1533 1707 1653 1633 1687 1673 1660 1633 1667 8.25 1700 1767 1753 1773 1733 1827 1787 1847 1827 1887 1773 1807 9.25 1727 1747 1773 1913 1893 1967 1920 1880 1947 1907 1907 1893
11.25 1693 1680 1680 1840 1887 1960 1827 1740 1807 1887 1913 1847 13.25 1953 1880 1893 2120 2167 2067 2060 2020 2047 2133 2113 2160 15.25 2100 2207 2140 2453 2393 2453 2407 2400 2407 2380 2393 2373 17.25 1900 1940 1920 2220 2220 2173 2247 2207 2167 2333 2327 2267 19.25 1920 1920 1847 2280 2113 2267 2227 2207 2287 2407 2433 2460 21.25 1800 1740 1787 2033 2060 2107 2107 2107 2087 2260 2240 2300 23.25 1980 1880 1900 2420 2347 2373 2340 2300 2307 2513 2520 2460 25.25 1887 1980 1947 2107 2087 2120 2427 2407 2340 2587 2613 2620
30.25 2213 2193 2233 2393 2393 2440 2540 2487 2500 2253 2353 2327
Table A.31 MLVSS data for pH inhibited nitrifying reactor experiments. Control MLSS pH 5 MLSS pH 9 MLSS pH 11 MLSS Time 1 2 3 1 2 3 1 2 3 1 2 3
days mg/L mg/L mg/L mg/L mg/L mg/L mg/L mg/L mg/L mg/L mg/L mg/L
0.50 1173 1200 1233 1273 1200 1287 1153 1240 1233 887 887 933 1.25 1208 1212 1236 1200 1224 1204 1268 1348 1292 1004 960 980 2.25 1133 1153 1153 1133 1127 1173 1153 1160 1200 887 887 873 3.25 1100 1100 1080 1153 1133 1147 1173 1180 1220 920 973 927 4.25 1076 920 980 987 987 1007 980 973 967 753 740 720 5.25 1324 1373 1313 1373 1413 1413 1347 1413 1400 1213 1227 1240 6.25 1116 1128 1104 1156 1156 1164 1200 1172 1184 1096 1072 1092 7.25 1293 1353 1253 1453 1373 1360 1333 1367 1313 1247 1273 1287 8.25 1453 1500 1493 1507 1467 1573 1500 1567 1553 1580 1493 1513 9.25 1473 1487 1527 1627 1613 1687 1613 1587 1673 1607 1593 1580
11.25 1447 1460 1453 1607 1620 1720 1580 1520 1547 1580 1620 1553 13.25 1673 1647 1660 1900 1880 1840 1807 1747 1753 1833 1840 1847 15.25 1773 1853 1807 2047 2013 2060 2013 1993 2033 1960 1993 1927 17.25 1647 1680 1660 1907 1927 1867 1920 1887 1873 1933 1947 1907 19.25 1700 1733 1613 1953 1820 2007 1900 1900 2013 2113 2053 2107 21.25 1587 1553 1567 1780 1793 1813 1800 1820 1813 1933 1920 1953 23.25 1733 1633 1680 2120 2053 2053 2040 2033 2000 2173 2167 2127 25.25 1573 1633 1640 1733 1733 1773 2020 1960 1920 2127 2153 2160
30.25 1887 1880 1913 2013 2027 2093 2160 2127 2127 1900 1987 1980

176
Table A.32 Effluent nitrate data for pH inhibited nitrifying reactor experiments. Control Nitrate pH 5 Nitrate pH 9 Nitrate pH 11 Nitrate Time 1 2 1 2 1 2 1 2 days mg/L-N mg/L-N mg/L-N mg/L-N mg/L-N mg/L-N mg/L-N mg/L-N 0.25 21.944 16.231 17.905 24.318 24.032 15.729 0.5 21.684 24.059 19.673 24.641 24.949 24.531 11.223 10.860 0.75 11.970 17.580 17.582 23.718 13.375 18.749 5.365 8.135 1 8.120 19.212 18.707 20.899 17.484 20.533 20.505 5.767 1.5 17.564 23.828 16.402 20.287 16.117 21.072 2.973 2.968 2 12.516 16.257 16.361 16.185 12.019 17.251 17.273 1.364 2.5 20.916 13.753 17.706 14.258 18.325 0.804 0.833 3 17.327 19.546 14.396 18.617 16.944 18.713 0.000 0.000 4 15.025 15.817 10.842 13.283 10.343 11.754 0.822 0.893 5 12.297 14.700 9.227 13.070 7.709 9.551 0.646 0.000 6 9.482 13.722 13.645 12.445 6.289 7.377 0.000 0.000 7 21.262 46.868 20.292 34.098 33.036 20.891 0.000 0.000 8 13.187 16.114 12.467 13.768 5.346 8.022 0.872 1.005 9 6.010 9.026 4.182 5.445 4.218 4.704 0.000 0.305 11 10.092 13.365 7.573 11.279 4.454 7.717 8.891 13 14.692 15.648 12.651 12.724 7.678 7.882 5.018 4.727 15 25.424 25.364 21.141 12.914 17.201 17.105 13.985 13.884 17 12.354 12.185 12.527 15.297 14.118 9.743 9.382 11.455 19 12.340 9.704 12.899 12.738 14.154 16.255 18.464 21 24.540 24.606 19.204 19.316 14.781 14.837 19.915 19.927 23 7.686 9.491 7.990 6.836 6.388 7.024 7.692 10.187 25 11.635 15.440 11.491 13.277 10.724 11.522 11.439 16.011 27 10.141 12.872 8.527 10.682 8.297 13.078 14.634 30 5.935 7.040 7.050 6.725 5.202 6.812 14.113 14.296

177
Table A.33 Effluent nitrite data for pH inhibited nitrifying reactor experiments. Control Nitrite pH 5 Nitrite pH 9 Nitrite pH 11 Nitrite Time 1 2 1 2 1 2 1 2 days mg/L-N mg/L-N mg/L-N mg/L-N mg/L-N mg/L-N mg/L-N mg/L-N 0.25 0.798 0.000 0.000 1.253 1.027 0.651 0.5 0.000 0.000 0.000 0.000 0.000 0.000 0.000 0.000 0.75 0.000 0.000 0.000 0.000 0.000 0.000 0.000 0.000 1 0.000 0.000 0.000 0.000 0.000 0.000 0.000 0.000 1.5 0.000 0.000 0.000 0.000 0.000 0.000 0.000 0.000 2 0.000 0.000 0.000 0.000 0.000 0.000 0.000 0.000 2.5 0.000 0.000 0.000 0.000 0.000 0.000 0.000 0.000 3 0.000 0.000 0.000 0.000 0.000 0.000 0.000 0.000 4 0.000 0.000 0.000 0.000 0.000 0.000 0.000 0.000 5 0.000 0.000 0.000 0.000 0.000 0.000 0.000 0.000 6 0.000 0.000 0.000 0.000 0.000 0.000 0.000 0.000 7 0.000 0.000 0.000 0.000 0.000 0.000 0.812 1.574 8 0.000 0.000 0.000 0.000 0.000 0.000 1.131 1.505 9 0.000 0.000 0.000 0.000 0.000 0.000 0.000 0.630 11 0.000 0.000 0.000 0.000 0.000 0.000 0.000 13 0.000 0.000 0.000 0.000 0.000 0.000 3.074 2.958 15 0.000 0.000 0.000 0.000 0.000 0.000 2.722 2.702 17 0.000 0.000 0.000 0.000 0.000 0.000 0.000 0.000 19 0.000 0.000 0.000 0.000 0.000 0.000 0.000 0.000 21 0.000 0.000 0.000 0.000 0.000 0.000 0.000 0.000 23 0.000 0.000 0.000 0.000 0.000 0.000 0.000 0.000 25 0.000 0.000 0.000 0.000 0.000 0.000 0.000 0.000 27 0.000 0.000 0.000 0.000 0.000 0.000 0.000 0.000 30 0.000 0.000 0.000 0.000 0.000 0.000 0.000 0.000

178
Table A.34 Effluent ammonia data for pH inhibited nitrifying reactor experiments. Control Ammonia pH 5 Ammonia pH 9 Ammonia pH 11 Ammonia Time 1 2 1 2 1 2 1 2 days mg/L-N mg/L-N mg/L-N mg/L-N mg/L-N mg/L-N mg/L-N mg/L-N 0.25 0.000 0.000 5.060 6.301 0.000 0.000 5.652 10.701 0.5 0.000 1.605 1.451 0.000 0.000 11.292 17.078 0.75 3.745 0.000 0.300 0.000 0.006 0.000 13.328 1 0.000 0.000 0.000 0.000 0.000 0.000 14.401 17.712 1.5 0.000 0.000 0.000 0.000 0.000 0.000 17.262 2 4.706 0.000 0.000 0.000 0.000 0.000 13.329 2.5 0.000 0.000 0.000 0.000 0.000 0.000 19.381 23.879 3 0.000 0.000 0.000 0.000 0.000 0.000 19.093 4 0.000 0.000 0.000 0.000 0.000 0.000 17.293 22.616 5 0.000 0.000 0.000 0.000 0.000 0.000 23.401 6 1.720 2.748 0.000 0.000 0.000 0.000 19.086 21.943 7 1.602 0.000 0.000 0.000 0.000 0.000 22.482 25.355 8 0.000 0.000 0.000 0.000 0.000 0.000 22.249 26.270 9 0.000 0.000 0.000 0.000 0.000 0.000 14.985 17.297 11 0.000 0.000 0.000 0.000 0.000 13 0.000 0.000 0.000 0.000 0.000 0.000 0.000 0.000 15 0.000 0.000 0.000 0.000 0.000 0.000 0.000 0.000 17 0.000 0.000 0.000 0.000 0.000 0.000 0.000 0.000 19 0.000 0.000 0.000 0.000 0.000 0.000 0.000 0.000 21 0.000 0.000 0.000 0.000 0.000 0.000 0.000 0.000 23 0.000 0.000 0.000 0.000 0.000 0.000 0.000 0.000 25 0.000 0.000 0.000 0.000 0.000 0.000 0.000 0.000 27 0.000 0.000 0.000 0.000 0.000 0.000 0.000 0.000
Table A.35 Nitrate Generation Rate (NGR) data for pH inhibited nitrifying reactor
experiments. Time Control NGR pH 5 NGR pH 9 NGR pH 11 NGR days (mg N/g MLVSS-hr) (mg N/g MLVSS-hr) (mg N/g MLVSS-hr) (mg N/g MLVSS-hr) 0.5 2.952 2.221 1.722 0.551 1.25 2.112 2.455 2.354 0.404 2.25 3.443 3.321 1.913 0.258 3.25 1.508 1.803 2.305 0.092 5.25 2.445 1.843 1.494 0.028 7.5 2.804 2.266 2.171 0.074 9.25 1.002 1.207 0.825 0.063 13.25 2.640 2.491 1.903 0.346 17.25 1.992 2.083 2.086 1.667 21.25 2.747 3.534 2.776 3.884 25.25 2.284 2.945 2.133 2.205 30.25 1.760 1.460 2.034 3.069

179
Table A.36 Effluent alkalinity data for pH inhibited nitrifying reactor experiments. Control CaCO3 pH 5 CaCO3 pH 9 CaCO3 pH 11 CaCO3 Time 1 2 1 2 1 2 1 2 days mg/L mg/L mg/L mg/L mg/L mg/L mg/L mg/L 0.25 190.6 188.3 21.8 20.7 263.6 259.9 542.3 504.6 0.5 177.8 180.8 33.9 30.9 232.0 236.5 558.1 561.1 1 179.3 175.5 82.9 80.6 203.4 205.6 438.4 436.9 2 82.1 82.1 52.7 50.5 97.2 97.2 278.7 271.9 3 110.0 109.2 106.2 106.2 125.8 126.5 299.8 298.3 5 165.7 162.7 168.7 168.0 182.3 180.0 298.3 300.5 7 161.9 163.4 166.5 166.5 185.3 184.5 323.9 321.6 9 204.9 205.6 218.4 219.2 221.4 218.4 308.8 308.8 11 195.8 195.8 207.1 207.1 213.9 211.6 199.6 200.4 15 123.5 125.0 134.1 130.3 147.6 149.1 150.6 152.1 19 138.6 131.8 149.9 149.9 167.2 166.5 146.5 168.7 23 192.1 192.1 204.1 203.4 205.6 205.6 193.6 192.8 27 150.6 154.4 169.5 173.2 175.5 177.8 180.8 169.5 30 195.1 196.6 207.1 206.4 213.2 210.9 192.8 192.1
Table A.37 Effluent pH data for pH inhibited nitrifying reactor experiments. Time Control pH pH 5 pH pH 9 pH pH 11 pH days 1 2 1 2 1 2 1 2 0.25 7.89 7.89 6.56 6.54 8.11 8.1 9.82 9.82
0.5 8.02 8.02 6.71 6.71 8.12 8.1 8.8 8.78 0.75 7.96 7.23 8.05 8.31
1 7.96 7.95 7.5 7.56 8.06 8.1 8.56 8.5 1.5 7.68 7.36 7.81 8.37
2 7.74 7.77 7.55 7.44 7.84 7.9 8.29 8.23 2.5 7.38 7.35 7.54 8.18
3 7.84 7.74 7.64 7.67 7.75 7.7 8.2 8.21 4 7.84 7.79 7.81 8.17 5 7.89 7.95 7.89 7.9 7.94 7.9 8.21 8.24 6 7.96 7.92 7.87 8.12 7 8.12 8.04 8.07 8.08 8.21 8.2 8.2 8.16 8 7.88 7.92 7.9 7.94 9 8.11 8.11 8.14 8.17 8.12 8.1 8.07 8.11
11 8.06 8.05 8.05 8.08 8.09 8.1 8.09 8.11 15 7.92 7.88 7.94 7.54 7.86 7.8 8 8.08 17 8.03 7.89 7.82 8.01 19 7.97 7.97 8 7.95 8 7.9 8 7.97 21 7.76 7.78 7.78 7.83 23 7.83 7.99 8.03 7.99 8.39 8.2 8.15 8.14 25 8 7.91 7.88 7.92 27 8.18 8.2 8.11 8.16 8.12 8.1 8.05 8.03 30 8.1 8.07 8 8.04 8.16 8.1 8.12 8.12

180
Table A.38 Actual calculated Solids Residence Time (SRT) for pH inhibited nitrifying reactor experiments.
Control pH 5 pH 9 pH 11 Time SRT SRT SRT SRT days days days days Days
1 6.0 4.9 7.0 3.1 2 7.2 7.2 7.4 5.4 3 7.3 7.1 7.4 6.0 4 9.6 9.7 9.5 9.5 5 6.7 6.9 7.6 7.5 6 5.3 5.6 6.1 5.8 7 7.1 7.4 7.8 8.5 8 8.0 8.0 8.5 8.5 10 8.2 8.5 8.6 8.5 12 8.2 8.7 9.0 9.2 14 8.0 8.4 8.5 8.9 16 8.2 8.9 8.6 9.4 18 8.5 8.8 8.6 9.5 20 8.2 8.8 8.4 9.9 22 8.6 8.8 8.6 9.6 24 9.3 9.8 9.8 9.8 26 9.2 9.0 9.3 9.1 28 9.2 8.8 9.5 10.0

181
Table A.39 MLSS data for zinc-cyanide complex inhibited nitrifying reactor experiments. Control MLSS IC15 MLSS IC25 MLSS IC50 MLSS Time 1 2 3 1 2 3 1 2 3 1 2 3
days mg/L mg/L mg/L mg/L mg/L mg/L mg/L mg/L mg/L mg/L mg/L mg/L
0.50 4950 5130 5300 5270 5270 5240 5390 5250 5280 5680 5330 5330 1.25 4650 5480 5310 5490 5530 5440 5540 5420 5520 5770 5830 5730 2.25 4510 4520 4370 4820 4570 4440 4670 4660 4620 4590 4640 4610 3.25 4260 4390 4440 4430 4360 4450 4560 4560 4550 4570 4500 4510 4.25 4040 4130 3910 4030 4150 4120 4180 4250 4260 4290 4250 4110 5.25 3720 3800 3850 3930 3950 3980 4000 4070 4030 4220 4150 4150 6.25 3790 3640 3630 3580 3280 3550 3600 3580 3590 3660 3720 3740 7.25 3430 3470 3510 3330 3250 3270 3530 3430 3500 3550 3610 3610 8.25 3940 3450 3360 3190 3230 3290 3370 3300 3330 3410 3530 3340 9.25 3380 3410 3450 3560 3530 3550 3650 3610 3680 3590 3530 3670 11.25 3240 3350 3410 3280 3220 3290 3380 3270 3400 3410 3330 3390
13.25 3220 3150 3180 2940 2880 3020 3210 3250 3060 3090 3120 3230
Table A.40 MLVSS data for zinc-cyanide complex inhibited nitrifying reactor experiments. Control MLVSS IC15 MLVSS IC25 MLVSS IC50 MLVSS Time 1 2 3 1 2 3 1 2 3 1 2 3
days mg/L mg/L mg/L mg/L mg/L mg/L mg/L mg/L mg/L mg/L mg/L mg/L
0.50 3220 3380 3510 3460 3490 3420 3520 3470 3440 3770 3460 3460 1.25 3040 3560 3380 3530 3560 3460 3500 3450 3530 3690 3710 3670 2.25 2900 2900 2790 2910 3250 2870 3020 3010 2940 2950 2990 2990 3.25 2840 2910 2950 3070 2860 2930 2990 3000 2970 3020 2960 2950 4.25 2730 2760 2630 2650 2730 2710 2760 2810 2770 2780 2750 2700 5.25 2440 2460 2520 2550 2580 2570 2570 2650 2660 2770 2730 2740 6.25 2350 2370 2340 2320 2040 2320 2360 2310 2340 2380 2420 2440 7.25 2290 2310 2380 2210 2170 2190 2340 2280 2320 2360 2390 2390 8.25 2730 2280 2190 2070 2110 2180 2220 2190 2210 2240 2290 2190 9.25 2240 2280 2280 2330 2330 2350 2400 2390 2380 2350 2320 2410 11.25 2160 2240 2290 2200 2180 2230 2290 2220 2290 2280 2240 2290
13.25 2220 2110 2050 2020 1970 2030 2130 2190 2040 2070 2080 2200

182
Table A.41 Effluent nitrate data for zinc-cyanide complex inhibited nitrifying reactor experiments.
Control Nitrate IC15 Nitrate IC25 Nitrate IC50 Nitrate Time 1 2 1 2 1 2 1 2 days mg/L-N mg/L-N mg/L-N mg/L-N mg/L-N mg/L-N mg/L-N mg/L-N 0.25 13.726 2.591 2.882 0.961 1.132 0.000 0.000 0.5 17.654 17.303 12.581 12.869 2.526 0.730 0.721 0.75 21.010 19.980 16.715 16.551 16.521 9.849 1.834 1.941 1 17.847 19.940 14.291 17.427 10.391 12.036 11.291 8.336 1.5 20.092 25.011 17.112 21.419 11.230 15.669 10.030 13.456 2 13.457 25.521 15.380 23.332 11.912 18.983 16.299 18.394 2.5 23.685 23.659 26.137 26.347 18.943 18.948 19.659 19.592 3 14.127 17.376 24.612 23.726 14.460 17.263 14.790 24.742 4 6.270 7.402 14.011 15.031 7.735 8.081 7.103 8.222 5 13.065 15.676 18.203 21.956 14.534 18.519 17.831 16.905 6 15.189 19.806 22.576 26.203 19.347 23.275 18.391 22.566 7 15.601 20.836 26.872 29.103 17.241 22.874 20.370 22.158 8 11.892 15.261 17.486 24.229 17.371 18.473 16.620 20.588 9 14.553 19.669 8.737 11.433 12.742 15.569 12.985 16.633 11 6.484 7.971 13.770 15.856 9.710 11.357 10.331 11.221 13 17.306 18.276 23.058 23.550 18.258 20.637 20.273 20.694
Table A.42 Effluent nitrite data for zinc-cyanide complex inhibited nitrifying reactor
experiments. Control Nitrite IC15 Nitrite IC25 Nitrite IC50 Nitrite Time 1 2 1 2 1 2 1 2 days mg/L-N mg/L-N mg/L-N mg/L-N mg/L-N mg/L-N mg/L-N mg/L-N 0.25 0.000 0.000 8.336 9.303 8.392 10.044 0.000 0.000 0.5 0.000 0.000 0.000 0.000 6.816 3.443 3.187 0.75 0.000 0.000 0.000 0.000 0.000 0.000 14.980 15.923 1 0.000 0.000 0.000 0.000 0.000 0.000 5.547 4.505 1.5 0.000 0.000 0.000 0.000 0.000 0.000 0.000 0.000 2 0.000 0.000 0.000 0.000 0.000 0.000 0.000 0.000 2.5 0.000 0.000 0.000 0.000 0.000 0.000 0.000 0.000 3 0.000 0.000 0.000 0.000 0.000 0.000 0.000 0.000 4 0.000 0.000 0.000 0.000 0.000 0.000 0.000 0.000 5 0.000 0.000 0.000 0.000 0.000 0.000 0.000 0.000 6 0.000 0.000 0.000 0.000 0.000 0.000 0.000 0.000 7 0.000 0.000 0.000 0.000 0.000 0.000 0.000 0.000 8 0.000 0.000 0.000 0.000 0.000 0.000 0.000 0.000 9 0.000 0.000 0.000 0.000 0.000 0.000 0.000 0.000 11 0.000 0.000 0.000 0.000 0.000 0.000 0.000 0.000 13 0.000 0.000 0.000 0.000 0.000 0.000 0.000 0.000

183
Table A.43 Effluent ammonia data for zinc-cyanide complex inhibited nitrifying reactor experiments.
Control Ammonia IC15 Ammonia IC25 Ammonia IC50 Ammonia Time 1 2 1 2 1 2 1 2 days mg/L-N mg/L-N mg/L-N mg/L-N mg/L-N mg/L-N mg/L-N mg/L-N 0.25 0.000 0.000 0.000 0.000 0.000 0.000 8.496 10.633 0.5 0.000 0.000 0.000 0.000 0.000 0.000 11.097 13.305 0.75 0.000 0.000 0.000 0.000 0.000 0.000 3.345 1 0.000 0.000 0.000 0.000 0.000 0.000 0.000 0.000 1.5 0.000 0.000 0.000 0.000 0.000 0.000 0.000 0.000 2 0.000 0.000 0.000 0.000 0.000 0.000 0.000 0.000 2.5 0.000 0.000 0.000 0.000 0.000 0.000 0.000 0.000 3 0.000 0.000 0.000 0.000 0.000 0.000 0.000 0.000 4 0.000 0.000 0.000 0.000 0.000 0.000 0.000 0.000 5 0.000 0.000 0.000 0.000 0.000 0.000 0.000 0.000 6 0.000 0.000 0.000 0.000 0.000 0.000 0.000 0.000 7 0.000 0.000 0.000 0.000 0.000 0.000 0.000 0.000 8 0.000 0.000 0.000 0.000 0.000 0.000 0.000 0.000 9 0.000 0.000 0.000 0.000 0.000 0.000 0.000 0.000 11 0.000 0.000 0.000 0.000 0.000 0.000 0.000 0.000 13 0.000 0.000 0.000 0.000 0.000 0.000 0.000 0.000
Table A.44 Nitrate Generation Rate (NGR) data for zinc-cyanide complex inhibited nitrifying
reactor experiments. Time Control NGR IC15 NGR IC25 NGR IC50 NGR days (mg N/g MLVSS-hr) (mg N/g MLVSS-hr) (mg N/g MLVSS-hr) (mg N/g MLVSS-hr) 0.5 3.526 1.073 0.166 0.005 1.25 1.866 0.000 0.088 0.043 2.25 2.026 1.665 1.689 1.389 3.25 2.480 2.103 2.129 1.946 5.25 1.953 1.347 1.512 1.141 7.25 1.205 0.993 0.934 0.548 9.25 1.592 1.759 1.499 1.193 13.25 1.424 2.075 1.455 2.630

184
Table A.45 Effluent alkalinity data for zinc-cyanide complex inhibited nitrifying reactor experiments.
Control CaCO3 IC15 CaCO3 IC25 CaCO3 IC50 CaCO3 Time 1 2 1 2 1 2 1 2 days mg/L mg/L mg/L mg/L mg/L mg/L mg/L mg/L 0.25 253.9 253.0 267.7 267.7 280.6 285.2 344.1 345.0 0.5 230.0 230.9 253.0 251.2 273.2 272.3 340.4 336.7 1 194.1 191.4 201.5 187.7 224.5 215.3 225.4 234.6 2 150.0 147.2 175.7 169.3 216.2 207.0 207.0 201.5 3 274.2 276.9 240.1 241.0 279.7 280.6 276.0 272.3 5 234.6 238.3 216.2 216.2 244.7 245.6 236.4 243.8 7 170.2 171.1 163.8 156.4 168.4 174.8 182.2 193.2 9 217.1 219.0 253.0 252.1 234.6 235.5 236.4 238.3 11 242.9 247.5 213.4 211.6 239.2 233.7 235.5 231.8
Table A.46 Effluent pH data for zinc-cyanide complex inhibited nitrifying reactor experiments.
Time Control pH IC15 pH IC25 pH IC50 pH days 1 2 1 2 1 2 1 2 0.25 7.96 7.98 8.04 8.04 8.00 7.97 8.08 8.14
0.5 7.86 7.87 7.89 7.94 7.98 7.96 7.96 7.94 0.75 7.88 7.96 7.94 7.74
1 8.23 8.23 8.31 8.26 8.25 8.30 8.20 8.28 1.5 7.84 7.94 7.92 7.89
2 8.00 8.02 8.14 8.13 8.07 8.04 8.05 8.01 2.5 8.00 8.04 8.02 8.05
3 8.17 8.16 8.13 8.15 8.14 8.12 8.11 8.18 4 8.19 8.34 8.36 8.21 5 8.04 8.01 8.08 8.04 8.05 8.13 8.07 8.06 6 7.89 7.92 7.87 7.83 7 8.22 8.25 8.14 8.14 8.23 8.22 8.19 8.15 8 7.94 8.02 7.99 7.97 9 8.11 8.13 8.19 8.19 8.10 8.15 8.08 8.18
11 8.09 8.09 8.11 8.18 8.23 8.23 8.14 8.16 13 7.81 8.04 8.16 8.07

185
Table A.47 Actual calculated Solids Residence Time (SRT) for zinc-cyanide complex inhibited nitrifying reactor experiments.
Control IC15 IC25 IC50 Time SRT SRT SRT SRT days days days days Days
1 8.8 9.0 8.7 8.9 2 9.0 9.5 9.0 9.3 3 9.2 9.3 9.1 9.2 4 9.1 9.3 9.3 9.5 5 9.0 9.5 9.0 9.1 6 9.0 9.6 9.0 9.2 7 9.2 8.8 8.9 9.0 8 9.2 9.1 9.1 9.1 10 9.1 9.0 9.0 9.0 12 9.1 9.2 9.2 9.2

186
Table A.48 MLSS data for DNP inhibited nitrifying reactor experiments. Control MLSS IC15 MLSS IC25 MLSS IC50 MLSS Time 1 2 3 1 2 3 1 2 3 1 2 3
days mg/L mg/L mg/L mg/L mg/L mg/L mg/L mg/L mg/L mg/L mg/L mg/L
0.50 2680 2727 2747 2620 2633 2600 2527 2580 2560 2567 2560 2567 0.75 2767 2780 2707 2527 2600 2453 2607 2580 2447 2447 2433 2413 1.25 2733 2760 2727 2387 2433 2440 2413 2387 2400 2387 2387 2400 1.75 2820 2840 2833 2407 2393 2380 2360 2367 2347 2207 2213 2220 2.25 2853 2853 2893 2313 2387 2353 2273 2413 2293 2253 2233 2253 2.75 2747 2760 2747 2160 2193 2133 2120 2233 2113 2007 1967 1960 3.25 2900 2773 2800 2147 2240 2140 2227 2260 2240 2140 2067 2093 4.25 2580 2653 2553 2100 2207 2167 2127 2140 2147 2073 2047 2013 5.25 2533 2460 2513 2027 2047 2053 2107 2067 2113 2067 2040 2040 6.25 2347 2367 2320 1973 1980 2020 2073 2040 2040 2027 1973 2040 7.25 2273 2227 2253 1893 1933 1913 1993 1933 1947 1940 1940 1967 8.25 1953 1900 1980 1787 1873 1787 1753 1840 1900 1880 1947 1907 9.25 1820 1940 1867 1787 1780 1847 1827 1827 1747 1840 1867 1873
11.25 1227 1200 1147 1628 1640 1593 1713 1660 1767 1733 1780 1767 13.25 727 733 720 1453 1467 1533 1633 1560 1533 1807 1740 1793 15.25 767 767 1467 1480 1660 1567 1707 1540 2027 1900 1960 17.25 1080 1313 1233 1687 1680 1647 1520 1540 1553 2213 2227 2240 19.25 672 676 688 916 924 956 924 960 956 1256 1272 1288 21.25 1067 1100 440 420 353 353 353 2120 2040 2147 23.25 1487 1460 1687 2613 2460 2653 25.25 587 860 927 1867 2140 2233 27.25 1287 1220 1253 2113 2133 2107
30.25 1964 1860 1900 2088 2020 2000

187
Table A.49 MLVSS data for DNP inhibited nitrifying reactor experiments. Control MLVSS IC15 MLVSS IC25 MLVSS IC50 MLVSS Time 1 2 3 1 2 3 1 2 3 1 2 3
days mg/L mg/L mg/L mg/L mg/L mg/L mg/L mg/L mg/L mg/L mg/L mg/L
0.50 2080 2127 2140 2053 2060 2047 2013 2020 2013 1993 2000 2007 0.75 2107 2120 2087 1907 1980 1880 2027 1973 1867 1880 1873 1860 1.25 2140 2113 2120 1853 1900 1900 1900 1893 1880 1900 1873 1887 1.75 2220 2233 2220 1887 1880 1867 1847 1860 1860 1720 1747 1740 2.25 2240 2247 2273 1800 1873 1833 1800 1900 1813 1780 1767 1800 2.75 2300 2253 2253 1807 1813 1773 1860 1867 1747 1747 1660 1613 3.25 2280 2187 2207 1693 1740 1680 1767 1807 1767 1673 1613 1640 4.25 2033 2020 2007 1660 1727 1713 1673 1700 1687 1620 1593 1560 5.25 1907 1867 1927 1607 1593 1627 1667 1640 1693 1613 1607 1580 6.25 1853 1860 1840 1613 1593 1633 1713 1653 1667 1633 1593 1640 7.25 1740 1727 1780 1500 1547 1513 1580 1527 1573 1580 1573 1587 8.25 1500 1467 1493 1387 1453 1407 1387 1447 1480 1473 1507 1507 9.25 1440 1520 1480 1447 1427 1493 1473 1453 1400 1453 1500 1487
11.25 973 933 887 1296 1300 1260 1380 1353 1387 1387 1413 1407 13.25 613 613 607 1227 1207 1247 1353 1307 1300 1513 1473 1507 15.25 573 693 773 1280 1253 1247 1340 1340 1347 1640 1660 1653 17.25 973 1140 1040 1433 1407 1413 1333 1367 1387 1907 1940 1960 19.25 580 572 596 796 792 824 820 840 840 1072 1100 1108 21.25 907 927 927 400 353 367 340 327 340 1820 1760 1867 23.25 1227 1180 1347 2147 2060 2200 25.25 533 733 787 1600 1787 1873 27.25 1027 980 1027 1713 1740 1700
30.25 1568 1492 1500 1696 1628 1480

188
Table A.50 Effluent nitrate data for DNP inhibited nitrifying reactor experiments. Control Nitrate IC15 Nitrate IC25 Nitrate IC50 Nitrate Time 1 2 1 2 1 2 1 2 days mg/L-N mg/L-N mg/L-N mg/L-N mg/L-N mg/L-N mg/L-N mg/L-N 0.25 18.217 12.079 13.629 8.696 12.545 11.694 13.658 0.5 15.433 17.875 16.872 19.381 19.354 17.017 16.717 20.166 0.75 20.252 19.483 13.597 16.103 12.822 12.613 18.127 18.260 1 15.146 21.622 13.289 18.957 9.273 14.159 13.278 17.947 1.5 11.327 11.290 10.903 13.763 6.894 9.905 20.250 2 10.343 11.978 11.895 15.262 15.233 6.094 15.979 18.135 2.5 7.897 10.142 10.750 12.831 3.299 3.887 13.780 3 8.693 9.013 9.699 11.177 2.026 2.123 10.332 11.325 4 15.864 17.591 10.295 12.924 3.575 4.356 13.610 14.862 5 25.962 26.328 20.926 21.233 4.872 5.494 18.580 6 15.634 18.107 10.650 13.773 3.427 10.314 12.676 7 16.072 20.308 19.636 13.945 7.123 9.056 9.749 11.769 8 12.566 15.937 6.666 8.916 11.489 11.597 13.172 12.938 9 9.033 13.331 12.112 15.176 12.308 13.863 18.899 25.712
Table A.51 Effluent nitrite data for DNP inhibited nitrifying reactor experiments.
Control Nitrite IC15 Nitrite IC25 Nitrite IC50 Nitrite Time 1 2 1 2 1 2 1 2 days mg/L-N mg/L-N mg/L-N mg/L-N mg/L-N mg/L-N mg/L-N mg/L-N 0.25 0.000 0.000 0.000 0.000 0.000 0.000 2.485 2.829 0.5 0.000 0.000 0.000 0.000 0.000 0.000 6.347 7.628 0.75 0.000 0.000 0.000 0.000 0.000 0.000 8.558 8.595 1 0.000 0.000 0.000 0.000 0.000 0.000 5.229 6.930 1.5 0.000 0.000 0.000 0.000 0.000 0.000 0.000 2 0.000 0.000 0.000 0.000 0.000 0.000 0.000 0.000 2.5 0.000 0.000 0.000 0.000 0.000 0.000 0.000 0.000 3 0.000 0.000 0.000 0.000 0.000 0.000 0.000 0.000 4 0.000 0.000 0.000 0.000 0.000 0.000 0.000 0.000 5 0.000 0.000 0.000 0.000 0.000 0.000 0.000 0.000 6 0.000 0.000 0.000 0.000 0.000 0.000 0.000 7 0.000 0.000 0.000 0.000 0.000 0.000 0.000 0.000 8 0.000 0.000 0.000 0.000 0.000 0.000 0.000 0.000 9 0.000 0.000 0.000 0.000 0.000 0.000 0.000 0.000

189
Table A.52 Effluent ammonia data for DNP inhibited nitrifying reactor experiments. Control Ammonia IC15 Ammonia IC25 Ammonia IC50 Ammonia Time 1 2 1 2 1 2 1 2 days mg/L-N mg/L-N mg/L-N mg/L-N mg/L-N mg/L-N mg/L-N mg/L-N 0.25 0.000 0.000 0.000 0.000 0.000 0.000 0.000 0.000 0.5 0.000 0.000 0.000 0.000 0.000 0.000 0.000 0.000 0.75 0.000 0.000 0.000 0.000 0.000 0.000 0.000 0.000 1 0.000 0.000 0.000 0.000 0.000 0.000 0.000 0.000 1.5 0.000 0.000 0.000 0.000 0.000 0.000 0.000 0.000 2 0.000 0.000 0.000 0.000 0.000 0.000 0.000 0.000 2.5 0.000 0.000 0.000 0.000 0.000 0.000 0.000 0.000 3 0.000 0.000 0.000 0.000 0.000 0.000 0.000 0.000 4 0.000 0.000 0.000 0.000 0.000 0.000 0.000 0.000 5 0.000 0.000 0.000 0.000 0.000 0.000 0.000 0.000 6 0.000 0.000 0.000 0.000 0.000 0.000 0.000 0.000 7 0.000 0.000 0.000 0.000 0.000 0.000 0.000 0.000 8 0.000 0.000 0.000 0.000 0.000 0.000 0.000 0.000 9 0.000 0.000 0.000 0.000 0.000 0.000 0.000 0.000
Table A.51 Nitrate Generation Rate (NGR) data for DNP inhibited nitrifying reactor
experiments. Time Control NGR IC15 NGR IC25 NGR IC50 NGR days (mg N/g MLVSS-hr) (mg N/g MLVSS-hr) (mg N/g MLVSS-hr) (mg N/g MLVSS-hr) 0.5 2.285 1.862 0.804 1.333 1.25 2.529 2.814 1.878 1.335 2.25 1.973 2.433 2.210 1.443 3.25 2.030 2.390 2.637 1.730 5.25 2.036 2.538 2.750 2.567 7.25 2.097 2.235 2.135 2.871 9.25 2.000 1.764 1.433 1.881

190
Table A.52 Effluent alkalinity data for DNP inhibited nitrifying reactor experiments. Control CaCO3 IC15 CaCO3 IC25 CaCO3 IC50 CaCO3 Time 1 2 1 2 1 2 1 2 days mg/L mg/L mg/L mg/L mg/L mg/L mg/L mg/L 0.25 215.0 218.1 212.0 212.7 222.7 220.4 198.9 201.2 0.5 161.3 165.1 174.3 206.6 188.2 154.4 160.5 1 155.9 160.5 156.7 155.1 175.1 178.2 145.9 143.6 2 198.1 202.8 186.6 184.3 222.7 226.6 176.6 177.4 3 188.2 195.8 192.0 193.5 226.6 227.3 192.0 192.8 5 154.4 154.4 172.8 172.0 230.4 229.6 176.6 177.4 7 177.4 180.5 207.4 206.6 217.3 212.7 203.5 205.8 9 149.8 150.5 186.6 188.9 172.8 172.8 180.5 181.2 11 135.9 136.7 174.3 173.6 150.5 152.1 169.0 169.7 15 133.6 144.4 176.6 175.9 152.8 154.4 176.6 176.6 19 107.5 107.5 188.9 190.5 169.0 169.0 177.4 182.0 23 144.4 145.9 230.4 232.7 27 235.0 217.3 226.6 234.2 30 152.8 156.7 142.8 145.9

191
Table A.53 Effluent pH data for DNP inhibited nitrifying reactor experiments. Time Control pH IC15 pH IC25 pH IC50 pH days 1 2 1 2 1 2 1 2 0.25 8.22 8.20 8.04 8.00 7.93 7.97 7.91 7.92 0.5 8.36 8.35 7.98 7.98 8.08 8.20 8.09 8.11 0.75 7.66 7.65 7.65 7.53 1 8.02 7.92 8.05 8.04 8.04 8.04 7.98 7.90 1.5 7.72 7.74 7.73 7.62 2 7.95 8.14 8.10 8.13 8.27 8.29 8.18 8.16 2.5 8.33 8.37 8.34 8.16 3 8.23 8.16 8.30 8.18 8.10 8.20 8.13 8.13 4 7.62 7.80 7.77 7.81 5 7.85 7.90 7.89 7.98 8.17 7.93 8.00 8.04 6 7.67 7.82 7.73 7.80 7 8.06 8.12 8.24 8.32 8.40 8.35 8.31 8.33 8 7.55 7.89 7.98 7.91 11 7.54 7.31 7.74 7.69 7.91 7.96 7.93 7.82 13 7.56 7.75 7.86 7.89 15 7.58 7.69 7.98 7.86 8.07 8.08 8.13 8.12 17 7.47 7.77 7.91 8.00 19 7.42 7.54 7.93 7.96 7.98 7.99 8.09 8.10 21 7.39 7.81 23 7.64 7.77 8.11 8.23 25 8.22 8.16 27 8.08 8.21 8.25 8.24 30 7.96 7.99 7.96 7.97

192
Table A.54 Effluent DNP concentrations for DNP inhibited nitrifying reactor experiments. Control IC15 IC25 IC50 Time 1 2 3 1 2 3 1 2 3 1 2 3
days mg/L mg/L mg/L mg/L mg/L mg/L mg/L mg/L mg/L mg/L mg/L mg/L
0.25 0.00 0.00 0.00 17.86 20.12 20.17 41.11 41.51 41.52 101.46 102.53 102.52 0.5 0.00 0.00 0.00 14.83 14.92 14.83 30.78 31.25 30.88 79.26 79.80 80.19 0.75 0.00 0.00 0.00 22.69 23.07 22.97 60.26 61.29 61.55 1 0.00 0.81 0.88 8.34 8.49 8.49 17.34 17.24 17.16 46.52 41.58 38.92 1.5 0.00 0.00 0.00 5.06 5.12 5.14 9.70 9.75 9.82 28.16 28.39 28.57 2 0.00 0.00 0.00 3.12 3.14 3.08 5.46 5.51 5.44 16.46 14.56 13.92 2.5 0.00 0.00 0.00 1.41 1.48 1.41 2.86 2.88 2.89 9.55 9.66 9.69 3 0.00 0.00 0.00 1.07 0.79 0.76 1.48 1.48 1.51 5.58 5.54 5.57 4 0.00 0.00 0.00 0.27 0.30 0.29 0.54 0.54 0.55 2.04 1.47 1.68 5 0.00 0.00 0.00 0.00 0.00 0.00 0.00 0.00 0.00 0.40 0.37 0.47
Table A.55 Actual calculated Solids Residence Time (SRT) for CDNB inhibited nitrifying reactor experiments.
Control IC15 IC25 IC50 Time SRT SRT SRT SRT days days days days days
1 9.0 8.7 8.7 8.1 2 9.3 8.9 8.9 8.4 3 9.7 9.5 9.7 9.3 4 9.4 8.9 9.4 9.1 5 9.6 9.2 9.6 8.9 6 9.1 8.9 9.5 9.1

193
Appendix B: Data for Chapter 4 Table B.1 Raw data for Table 4.1. Values given are the absorbance at 229 and 235 nm for
the listed nitrate concentrations. Sample Replicate
7.1 mg/L NO3
--N 7.11
NO3--N
7.15 NO3
--N 7.25
NO3--N
7.6 NO3
--N 229 nm 235 nm 229 nm 235 nm 229 nm 235 nm 229 nm 235 nm 229 nm 235 nm
1 0.8387 0.3537 0.8372 0.3531 0.8202 0.3473 0.8343 0.3513 0.8258 0.34472 0.8387 0.3539 0.8374 0.3531 0.8199 0.3472 0.8338 0.3510 0.8252 0.34473 0.8385 0.3539 0.8372 0.3530 0.8197 0.3471 0.8338 0.3511 0.8252 0.34464 0.8387 0.3539 0.8377 0.3534 0.8197 0.3471 0.8335 0.3510 0.8255 0.34475 0.8387 0.3539 0.8374 0.3529 0.8199 0.3473 0.8335 0.3508 0.8252 0.34466 0.8387 0.3539 0.8372 0.3531 0.8194 0.3471 0.8332 0.3508 0.8258 0.34477 0.8387 0.3536 0.8369 0.3531 0.8197 0.3474 0.8335 0.3508 0.8258 0.3449
Sample Replicate
26.1 mg/L NO3
--N 26.12 mg/L
NO3--N
26.14 mg/L NO3
--N 26.30 mg/L
NO3--N
26.50 mg/L NO3
--N 229 nm 235 nm 229 nm 235 nm 229 nm 235 nm 229 nm 235 nm 229 nm 235 nm
1 1.7953 0.6720 1.7676 0.6620 1.7744 0.6575 1.7790 0.6664 1.7930 0.66602 1.8001 0.6711 1.7744 0.6615 1.7654 0.6576 1.7859 0.6664 1.7906 0.66553 1.7953 0.6708 1.7767 0.6620 1.7676 0.6567 1.7930 0.6667 1.7859 0.66494 1.7906 0.6710 1.7836 0.6618 1.7699 0.6571 1.7836 0.6667 1.7882 0.66545 1.7977 0.6720 1.7767 0.6615 1.7676 0.6570 1.7906 0.6667 1.7859 0.66526 1.8026 0.6725 1.7676 0.6613 1.7721 0.6571 1.7859 0.6662 1.7836 0.66577 1.7977 0.6720 1.7836 0.6620 1.7654 0.6573 1.7882 0.6665 1.7859 0.6651

194
Table B.2 Raw data for Figures 4.1 and 4.2. Values listed are absorbance at the different wavelengths.
Wavelength Distilled H2O 9.33 mg/L 15.33 mg/L 25.33 mg/L 35.33 mg/L 55.33 mg/Lnm NO3
--N NO3--N NO3
--N NO3--N NO3
--N 200 -0.0006 3.0028 2.7018 2.8267 3.3038 2.9059 201 -0.0002 3.1822 2.6180 2.9604 2.6593 3.0573 202 -0.0010 2.8456 2.9126 2.8456 3.2136 2.9126 203 -0.0007 2.6075 3.2444 3.1194 2.9433 3.1194 204 -0.0010 2.7092 3.0516 2.9724 3.7506 3.4496 205 -0.0012 2.8765 3.0806 2.9345 2.9345 3.0014 206 -0.0006 2.9038 2.8526 2.8526 2.9038 3.2048 207 -0.0007 2.7501 2.9841 3.1303 3.2272 3.1303 208 -0.0002 3.0729 2.8511 3.0060 2.9480 2.8968 209 -0.0006 2.7916 2.8294 3.0926 3.1718 3.0926 210 -0.0001 2.8891 3.0440 2.8099 2.9348 2.8891 211 -0.0002 2.7942 2.9081 2.9081 2.8667 2.9081 212 -0.0007 2.6449 2.9694 3.2247 3.0786 3.0786 213 -0.0001 2.7343 2.9842 2.9842 3.0353 3.0353 214 -0.0006 2.7479 2.9978 2.9978 3.1739 3.1739 215 0.0001 2.8193 3.0112 2.8515 3.3634 3.0112 216 0.0001 2.7231 2.8992 2.8323 2.9370 3.0753 217 -0.0005 2.5912 2.8430 3.1440 3.1440 3.1440 218 0.0002 2.6021 2.8539 2.8539 2.8539 3.0969 219 -0.0001 2.4072 2.6870 2.8631 3.0550 3.2311 220 -0.0001 2.2328 2.7629 2.8720 3.1151 3.0639 221 0.0001 2.0546 2.5226 2.7725 2.8236 3.2496 222 -0.0004 1.8534 2.4018 2.8048 2.9560 3.0810 223 -0.0002 1.6845 2.2571 2.5953 2.8120 2.8120 224 0.0002 1.4973 2.0543 2.5448 2.7947 2.9038 225 0.0001 1.3056 1.8122 2.3764 2.6775 2.7566 226 0.0000 1.1534 1.6036 2.1724 2.4847 2.7028 227 0.0005 1.0069 1.4015 1.9351 2.3083 2.6404 228 -0.0006 0.8762 1.2178 1.7164 2.0959 2.4983 229 0.0003 0.7639 1.0575 1.4998 1.8784 2.3951 230 0.0002 0.6511 0.8942 1.2737 1.6126 2.1481 231 -0.0004 0.5633 0.7678 1.0879 1.3843 1.8891 232 0.0003 0.4892 0.6602 0.9315 1.1830 1.6423 233 -0.0004 0.4230 0.5645 0.7892 1.0020 1.3969 234 0.0003 0.3670 0.4827 0.6689 0.8456 1.1802 235 0.0002 0.3161 0.4099 0.5604 0.7032 0.9789 236 -0.0001 0.2763 0.3525 0.4756 0.5920 0.8169 237 0.0001 0.2425 0.3042 0.4045 0.4983 0.6827 238 0.0000 0.2157 0.2659 0.3473 0.4238 0.5734 239 0.0001 0.1911 0.2307 0.2946 0.3544 0.4724 240 0.0001 0.1714 0.2034 0.2549 0.3021 0.3970 241 0.0001 0.1568 0.1823 0.2233 0.2611 0.3363 242 -0.0003 0.1434 0.1646 0.1975 0.2270 0.2878 243 0.0004 0.1333 0.1501 0.1760 0.1994 0.2466 244 0.0002 0.1238 0.1370 0.1571 0.1749 0.2113 245 -0.0003 0.1166 0.1280 0.1438 0.1574 0.1864 246 0.0003 0.1114 0.1201 0.1326 0.1430 0.1657 247 -0.0001 0.1065 0.1138 0.1232 0.1317 0.1490 248 0.0001 0.1023 0.1087 0.1157 0.1218 0.1352 249 0.0004 0.0994 0.1039 0.1099 0.1141 0.1249 250 0.0001 0.0966 0.1006 0.1047 0.1082 0.1160 251 -0.0001 0.0939 0.0972 0.1011 0.1031 0.1094

195
252 0.0001 0.0926 0.0956 0.0978 0.0998 0.1042 253 0.0003 0.0907 0.0935 0.0953 0.0965 0.1000 254 -0.0002 0.0892 0.0915 0.0935 0.0933 0.0967 255 0.0003 0.0885 0.0907 0.0914 0.0921 0.0943 256 -0.0002 0.0870 0.0893 0.0900 0.0897 0.0918 257 -0.0004 0.0862 0.0880 0.0889 0.0883 0.0902 258 0.0004 0.0860 0.0877 0.0876 0.0881 0.0891 259 0.0001 0.0851 0.0868 0.0873 0.0868 0.0878 260 0.0001 0.0845 0.0862 0.0864 0.0864 0.0874 261 0.0003 0.0836 0.0852 0.0854 0.0854 0.0863 262 0.0001 0.0830 0.0848 0.0851 0.0848 0.0856 263 0.0000 0.0822 0.0839 0.0846 0.0842 0.0852 264 0.0002 0.0818 0.0837 0.0839 0.0840 0.0842 265 0.0005 0.0817 0.0832 0.0837 0.0835 0.0845 266 -0.0001 0.0801 0.0819 0.0825 0.0826 0.0837 267 0.0004 0.0802 0.0816 0.0824 0.0825 0.0833 268 -0.0005 0.0784 0.0804 0.0814 0.0813 0.0830 269 -0.0002 0.0780 0.0801 0.0810 0.0810 0.0828 270 0.0007 0.0782 0.0797 0.0810 0.0809 0.0828 271 -0.0003 0.0764 0.0787 0.0798 0.0803 0.0822 272 0.0004 0.0767 0.0784 0.0796 0.0804 0.0823 273 -0.0007 0.0752 0.0775 0.0789 0.0796 0.0817 274 0.0000 0.0743 0.0768 0.0778 0.0790 0.0816 275 0.0009 0.0744 0.0760 0.0779 0.0790 0.0815 276 -0.0001 0.0727 0.0754 0.0770 0.0783 0.0808 277 0.0001 0.0720 0.0740 0.0765 0.0774 0.0807 278 -0.0001 0.0712 0.0731 0.0758 0.0769 0.0806 279 -0.0001 0.0702 0.0725 0.0752 0.0770 0.0798 280 0.0000 0.0693 0.0713 0.0749 0.0763 0.0804 281 0.0003 0.0687 0.0714 0.0740 0.0763 0.0799 282 0.0002 0.0674 0.0703 0.0727 0.0757 0.0793 283 -0.0002 0.0667 0.0690 0.0727 0.0745 0.0793 284 0.0003 0.0661 0.0688 0.0719 0.0746 0.0794 285 0.0005 0.0654 0.0680 0.0713 0.0747 0.0791 286 0.0000 0.0641 0.0670 0.0714 0.0735 0.0793 287 0.0004 0.0632 0.0667 0.0704 0.0736 0.0791 288 -0.0003 0.0625 0.0655 0.0698 0.0727 0.0788 289 -0.0001 0.0621 0.0651 0.0696 0.0727 0.0789 290 0.0004 0.0614 0.0645 0.0690 0.0727 0.0794 291 0.0004 0.0610 0.0640 0.0684 0.0723 0.0791 292 -0.0001 0.0596 0.0630 0.0680 0.0716 0.0788 293 0.0002 0.0592 0.0621 0.0672 0.0712 0.0791 294 0.0004 0.0587 0.0617 0.0667 0.0712 0.0785 295 -0.0001 0.0573 0.0606 0.0662 0.0700 0.0780 296 0.0002 0.0574 0.0604 0.0657 0.0699 0.0782 297 0.0003 0.0564 0.0600 0.0648 0.0696 0.0778 298 -0.0002 0.0554 0.0589 0.0645 0.0687 0.0775 299 0.0006 0.0554 0.0587 0.0639 0.0683 0.0770 300 -0.0005 0.0537 0.0578 0.0631 0.0676 0.0761 301 -0.0003 0.0536 0.0570 0.0622 0.0671 0.0757 302 0.0004 0.0533 0.0567 0.0619 0.0667 0.0752 303 -0.0006 0.0522 0.0554 0.0607 0.0656 0.0742 304 -0.0001 0.0517 0.0548 0.0600 0.0647 0.0735 305 0.0004 0.0513 0.0544 0.0599 0.0642 0.0726 306 -0.0002 0.0500 0.0531 0.0583 0.0629 0.0711 307 -0.0001 0.0493 0.0522 0.0574 0.0619 0.0699 308 0.0003 0.0487 0.0517 0.0564 0.0607 0.0683

196
309 0.0004 0.0487 0.0513 0.0557 0.0596 0.0672 310 -0.0002 0.0467 0.0494 0.0543 0.0580 0.0649 311 0.0005 0.0469 0.0497 0.0535 0.0577 0.0640 312 0.0001 0.0461 0.0483 0.0523 0.0561 0.0622 313 -0.0005 0.0441 0.0471 0.0512 0.0545 0.0600 314 0.0005 0.0446 0.0469 0.0502 0.0537 0.0595 315 0.0004 0.0437 0.0456 0.0486 0.0518 0.0572 316 -0.0001 0.0426 0.0444 0.0475 0.0507 0.0550 317 0.0003 0.0423 0.0438 0.0469 0.0497 0.0540 318 -0.0001 0.0417 0.0431 0.0457 0.0481 0.0512 319 0.0004 0.0407 0.0424 0.0451 0.0473 0.0504 320 0.0001 0.0402 0.0413 0.0439 0.0456 0.0490 321 -0.0003 0.0393 0.0408 0.0429 0.0452 0.0472 322 0.0001 0.0383 0.0396 0.0413 0.0426 0.0443 323 -0.0002 0.0371 0.0387 0.0403 0.0416 0.0432 324 0.0005 0.0372 0.0377 0.0394 0.0408 0.0415 325 0.0000 0.0358 0.0374 0.0381 0.0400 0.0402 326 -0.0001 0.0356 0.0363 0.0372 0.0383 0.0392 327 0.0001 0.0353 0.0357 0.0372 0.0375 0.0381 328 0.0001 0.0341 0.0353 0.0359 0.0365 0.0367 329 0.0000 0.0339 0.0346 0.0353 0.0363 0.0357 330 0.0007 0.0341 0.0339 0.0352 0.0345 0.0348 331 0.0002 0.0334 0.0338 0.0338 0.0347 0.0339 332 0.0003 0.0327 0.0327 0.0338 0.0335 0.0333 333 -0.0001 0.0319 0.0321 0.0329 0.0335 0.0320 334 0.0003 0.0316 0.0315 0.0320 0.0326 0.0319 335 0.0000 0.0314 0.0312 0.0321 0.0317 0.0311 336 0.0004 0.0308 0.0315 0.0315 0.0318 0.0310 337 -0.0001 0.0300 0.0299 0.0303 0.0307 0.0299 338 -0.0002 0.0301 0.0304 0.0309 0.0308 0.0296 339 0.0000 0.0294 0.0294 0.0298 0.0302 0.0291 340 -0.0001 0.0290 0.0289 0.0291 0.0295 0.0277 341 -0.0002 0.0288 0.0292 0.0290 0.0296 0.0282 342 0.0000 0.0286 0.0282 0.0286 0.0290 0.0276 343 0.0002 0.0276 0.0279 0.0279 0.0279 0.0270 344 -0.0005 0.0273 0.0276 0.0279 0.0280 0.0269 345 0.0006 0.0268 0.0271 0.0274 0.0273 0.0262 346 0.0006 0.0267 0.0268 0.0274 0.0267 0.0258 347 -0.0002 0.0262 0.0259 0.0261 0.0267 0.0250 348 0.0001 0.0256 0.0256 0.0259 0.0256 0.0245 349 0.0004 0.0254 0.0254 0.0262 0.0258 0.0245 350 0.0003 0.0247 0.0245 0.0249 0.0258 0.0242 351 0.0002 0.0248 0.0251 0.0254 0.0248 0.0239 352 0.0001 0.0249 0.0246 0.0251 0.0246 0.0239 353 0.0003 0.0238 0.0240 0.0237 0.0248 0.0236 354 0.0007 0.0240 0.0240 0.0243 0.0244 0.0232 355 0.0000 0.0233 0.0235 0.0241 0.0240 0.0228 356 0.0009 0.0235 0.0233 0.0235 0.0241 0.0222 357 0.0006 0.0230 0.0236 0.0238 0.0232 0.0220 358 -0.0004 0.0217 0.0227 0.0229 0.0217 0.0223 359 0.0000 0.0211 0.0231 0.0223 0.0233 0.0209 360 0.0004 0.0218 0.0226 0.0222 0.0218 0.0216 361 -0.0002 0.0224 0.0206 0.0224 0.0228 0.0210 362 0.0004 0.0207 0.0205 0.0209 0.0229 0.0209 363 0.0006 0.0202 0.0202 0.0202 0.0205 0.0194 364 -0.0013 0.0204 0.0191 0.0196 0.0198 0.0185 365 0.0005 0.0203 0.0203 0.0205 0.0205 0.0194
197
366 -0.0003 0.0191 0.0185 0.0194 0.0198 0.0189 367 -0.0002 0.0194 0.0194 0.0199 0.0207 0.0183 368 0.0005 0.0188 0.0204 0.0205 0.0198 0.0193 369 0.0005 0.0194 0.0177 0.0191 0.0200 0.0184 370 -0.0002 0.0181 0.0184 0.0177 0.0194 0.0177 371 0.0006 0.0177 0.0189 0.0182 0.0186 0.0174 372 0.0000 0.0176 0.0164 0.0169 0.0179 0.0164 373 -0.0002 0.0168 0.0173 0.0173 0.0188 0.0163 374 -0.0005 0.0172 0.0164 0.0166 0.0174 0.0157 375 0.0003 0.0168 0.0180 0.0177 0.0185 0.0171 376 0.0000 0.0166 0.0168 0.0169 0.0169 0.0166 377 0.0003 0.0163 0.0157 0.0161 0.0174 0.0147 378 0.0000 0.0161 0.0161 0.0161 0.0171 0.0157 379 -0.0001 0.0154 0.0156 0.0157 0.0159 0.0152 380 0.0001 0.0145 0.0148 0.0153 0.0153 0.0138 381 0.0004 0.0158 0.0158 0.0153 0.0157 0.0151 382 -0.0005 0.0147 0.0142 0.0149 0.0144 0.0137 383 0.0007 0.0143 0.0152 0.0153 0.0157 0.0139 384 0.0000 0.0142 0.0148 0.0148 0.0151 0.0142 385 0.0001 0.0141 0.0136 0.0145 0.0144 0.0135 386 0.0006 0.0145 0.0140 0.0142 0.0154 0.0137 387 0.0007 0.0142 0.0134 0.0147 0.0143 0.0135 388 0.0003 0.0132 0.0127 0.0133 0.0144 0.0126 389 0.0001 0.0133 0.0133 0.0133 0.0142 0.0128 390 -0.0006 0.0125 0.0127 0.0126 0.0128 0.0123 391 0.0000 0.0122 0.0124 0.0134 0.0136 0.0114 392 0.0001 0.0127 0.0131 0.0130 0.0133 0.0126 393 0.0001 0.0126 0.0126 0.0126 0.0132 0.0118 394 0.0002 0.0116 0.0121 0.0124 0.0132 0.0112 395 -0.0004 0.0120 0.0116 0.0121 0.0122 0.0117 396 -0.0002 0.0118 0.0107 0.0119 0.0121 0.0110 397 0.0004 0.0116 0.0117 0.0115 0.0124 0.0109 398 -0.0004 0.0117 0.0109 0.0115 0.0121 0.0109 399 -0.0004 0.0113 0.0109 0.0115 0.0116 0.0104 400 0.0006 0.0112 0.0120 0.0115 0.0123 0.0111
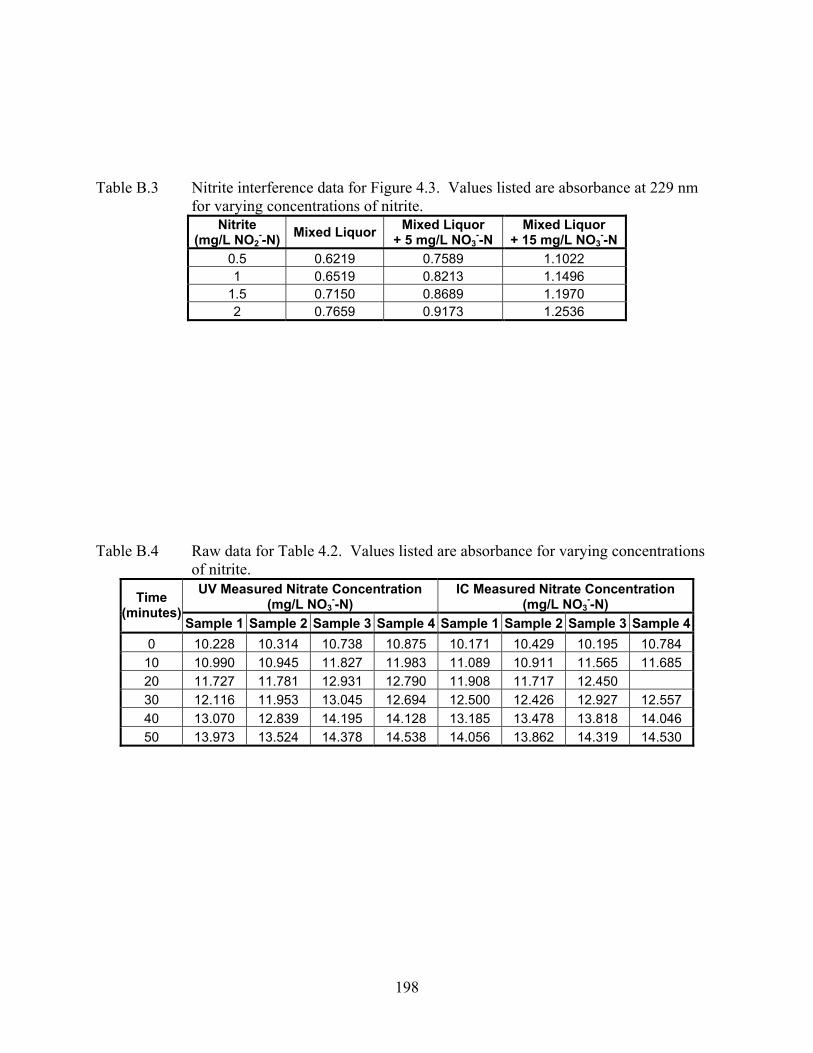
198
Table B.3 Nitrite interference data for Figure 4.3. Values listed are absorbance at 229 nm for varying concentrations of nitrite.
Nitrite (mg/L NO2
--N) Mixed Liquor Mixed Liquor + 5 mg/L NO3
--N Mixed Liquor
+ 15 mg/L NO3--N
0.5 0.6219 0.7589 1.1022 1 0.6519 0.8213 1.1496
1.5 0.7150 0.8689 1.1970 2 0.7659 0.9173 1.2536
Table B.4 Raw data for Table 4.2. Values listed are absorbance for varying concentrations of nitrite. UV Measured Nitrate Concentration
(mg/L NO3--N)
IC Measured Nitrate Concentration (mg/L NO3
--N) Time (minutes)
Sample 1 Sample 2 Sample 3 Sample 4 Sample 1 Sample 2 Sample 3 Sample 40 10.228 10.314 10.738 10.875 10.171 10.429 10.195 10.784 10 10.990 10.945 11.827 11.983 11.089 10.911 11.565 11.685 20 11.727 11.781 12.931 12.790 11.908 11.717 12.450 30 12.116 11.953 13.045 12.694 12.500 12.426 12.927 12.557 40 13.070 12.839 14.195 14.128 13.185 13.478 13.818 14.046 50 13.973 13.524 14.378 14.538 14.056 13.862 14.319 14.530

199
Table B.5 Raw data for Figure 4.4. Values listed are nitrate concentrations over time for mixed liquor.
Time (minutes)
Control Nitrate (mg/L-N)
30 mg/L Cd Nitrate (mg/L-N)
0 8.54 8.68 10 9.76 9.35 20 10.95 10.01 30 12.46 10.72 40 13.54 11.08 50 15.08 11.61
Table B.6 Raw data for Figure 4.5. Values listed are nitrate generation rates for mixed liquor.
Cadmium Concentration
(mg/L) Slope
(mg NO3--N/L-min)
NGR (mg NO3
--N/min-MLVSS)
0 0.138 0.074 0 0.136 0.073 1 0.128 0.069 1 0.143 0.077 5 5 0.128 0.069 10 0.125 0.067 10 0.126 0.068 30 0.059 0.032 30 0.060 0.032 50 0.048 0.026 50 0.048 0.026
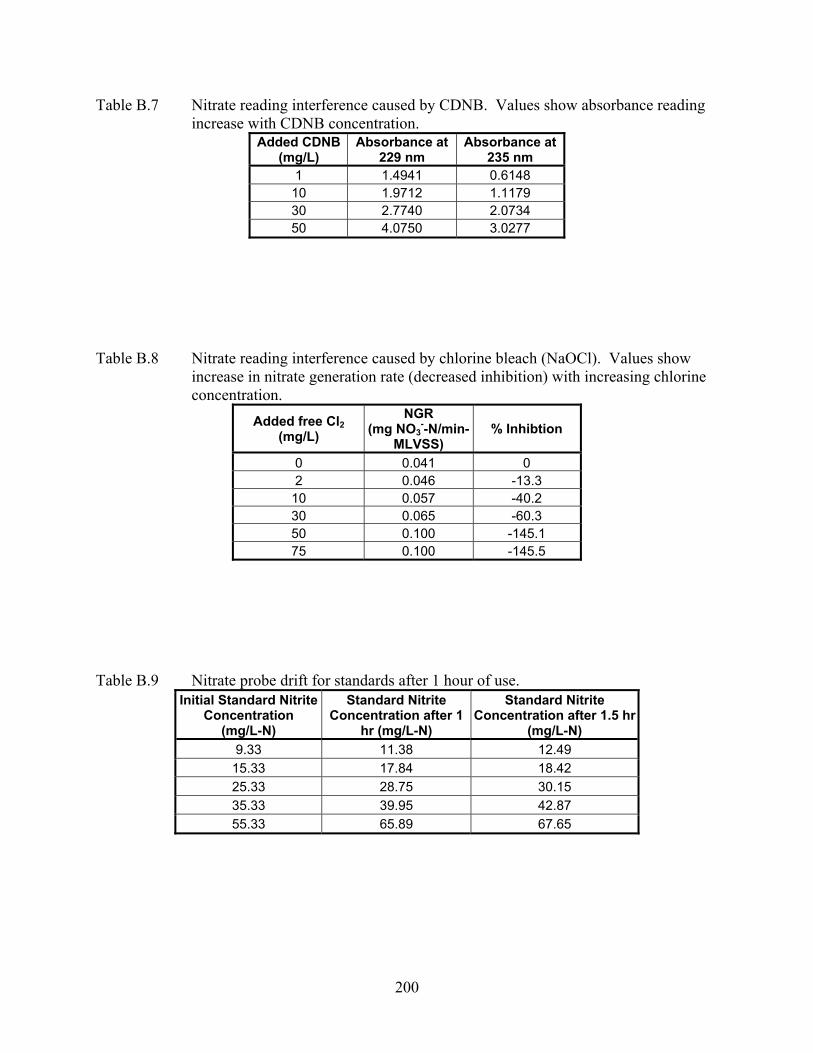
200
Table B.7 Nitrate reading interference caused by CDNB. Values show absorbance reading increase with CDNB concentration.
Added CDNB(mg/L)
Absorbance at 229 nm
Absorbance at 235 nm
1 1.4941 0.6148 10 1.9712 1.1179 30 2.7740 2.0734 50 4.0750 3.0277
Table B.8 Nitrate reading interference caused by chlorine bleach (NaOCl). Values show increase in nitrate generation rate (decreased inhibition) with increasing chlorine concentration.
Added free Cl2 (mg/L)
NGR (mg NO3
--N/min-MLVSS)
% Inhibtion
0 0.041 0 2 0.046 -13.3
10 0.057 -40.2 30 0.065 -60.3 50 0.100 -145.1 75 0.100 -145.5
Table B.9 Nitrate probe drift for standards after 1 hour of use. Initial Standard Nitrite
Concentration (mg/L-N)
Standard Nitrite Concentration after 1
hr (mg/L-N)
Standard Nitrite Concentration after 1.5 hr
(mg/L-N) 9.33 11.38 12.49 15.33 17.84 18.42 25.33 28.75 30.15 35.33 39.95 42.87 55.33 65.89 67.65

201
Table B.10 Wavelength scans for comparison of nitrate and nitrite absorbance readings at 20 mg/L-N nitrate and nitrite. Wavelength Nitrite Sample: 20 mg/L-N Nitrate Sample: 20 mg/L-N
nm Abs Abs Abs Abs 1 2 1 2
200.0 2.6130 2.4533 2.4533 2.6642
201.0 2.5431 2.6223 2.7192 2.7772 202.0 2.7513 2.6544 2.7001 2.7001 203.0 2.6850 2.7308 2.5089 2.5089 204.0 2.7606 2.7148 2.5687 2.5387 205.0 2.5968 2.5968 2.7887 2.6290 206.0 2.5661 2.7288 2.7288 2.9920 207.0 2.8894 2.5883 2.6164 2.5883 208.0 2.9112 2.7351 2.6102 2.6682 209.0 2.6879 2.9889 2.7926 2.9309 210.0 2.8979 2.7730 2.5511 2.6217 211.0 2.9682 2.6160 2.6952 2.7921 212.0 2.9328 2.8870 2.6829 2.6317 213.0 2.8223 2.9984 2.8223 2.7875 214.0 2.7113 2.7693 2.6602 2.6850 215.0 2.8870 2.7242 2.5859 2.7523 216.0 2.9867 2.6857 2.6622 2.6622 217.0 2.8385 2.9524 2.6302 2.8063 218.0 2.7866 3.0084 2.7074 2.6839 219.0 2.6300 2.7419 2.5574 2.5744 220.0 2.7768 2.6799 2.6385 2.5186 221.0 2.8443 2.8443 2.3993 2.4589 222.0 2.7430 2.8521 2.3962 2.3855 223.0 2.5739 2.7748 2.2649 2.2493 224.0 2.5503 2.5503 2.0349 2.0536 225.0 2.5153 2.5433 1.8109 1.8329 226.0 2.4475 2.4252 1.6140 1.6123 227.0 2.2631 2.3097 1.3955 1.3955 228.0 2.0772 2.1065 1.1928 1.1934 229.0 1.9400 1.9169 1.0146 1.0126 230.0 1.7200 1.7200 0.8351 0.8359 231.0 1.5282 1.5269 0.6979 0.6972 232.0 1.3493 1.3535 0.5806 0.5813 233.0 1.1818 1.1834 0.4782 0.4781 234.0 1.0293 1.0289 0.3910 0.3911 235.0 0.8721 0.8710 0.3141 0.3139 236.0 0.7383 0.7391 0.2555 0.2555 237.0 0.6207 0.6210 0.2057 0.2055 238.0 0.5230 0.5232 0.1668 0.1669 239.0 0.4288 0.4284 0.1312 0.1312 240.0 0.3536 0.3532 0.1049 0.1049 241.0 0.2901 0.2902 0.0843 0.0844 242.0 0.2349 0.2354 0.0676 0.0675

202
243.0 0.1878 0.1875 0.0536 0.0539 244.0 0.1472 0.1466 0.0419 0.0423 245.0 0.1180 0.1183 0.0342 0.0343 246.0 0.0932 0.0931 0.0268 0.0271 247.0 0.0738 0.0740 0.0220 0.0222 248.0 0.0567 0.0569 0.0174 0.0174 249.0 0.0447 0.0443 0.0135 0.0136 250.0 0.0353 0.0355 0.0116 0.0117 251.0 0.0283 0.0285 0.0095 0.0094 252.0 0.0231 0.0230 0.0076 0.0076 253.0 0.0187 0.0188 0.0064 0.0066 254.0 0.0162 0.0162 0.0054 0.0051 255.0 0.0141 0.0142 0.0050 0.0046 256.0 0.0128 0.0129 0.0045 0.0045 257.0 0.0119 0.0125 0.0043 0.0042 258.0 0.0112 0.0112 0.0035 0.0036 259.0 0.0111 0.0114 0.0039 0.0041 260.0 0.0110 0.0104 0.0036 0.0036 261.0 0.0104 0.0103 0.0033 0.0035 262.0 0.0102 0.0108 0.0038 0.0039 263.0 0.0103 0.0103 0.0030 0.0031 264.0 0.0106 0.0108 0.0037 0.0036 265.0 0.0104 0.0105 0.0035 0.0036 266.0 0.0102 0.0106 0.0034 0.0034 267.0 0.0103 0.0105 0.0033 0.0035 268.0 0.0109 0.0108 0.0039 0.0035 269.0 0.0114 0.0115 0.0039 0.0040 270.0 0.0116 0.0114 0.0046 0.0046 271.0 0.0113 0.0117 0.0045 0.0044 272.0 0.0116 0.0110 0.0042 0.0046 273.0 0.0118 0.0119 0.0051 0.0050 274.0 0.0119 0.0123 0.0055 0.0053 275.0 0.0117 0.0117 0.0051 0.0049 276.0 0.0119 0.0125 0.0060 0.0060 277.0 0.0124 0.0122 0.0054 0.0058 278.0 0.0124 0.0121 0.0052 0.0055 279.0 0.0125 0.0125 0.0064 0.0064 280.0 0.0122 0.0121 0.0066 0.0064 281.0 0.0122 0.0127 0.0069 0.0066 282.0 0.0129 0.0127 0.0068 0.0074 283.0 0.0132 0.0131 0.0078 0.0075 284.0 0.0124 0.0124 0.0075 0.0076 285.0 0.0126 0.0128 0.0081 0.0077 286.0 0.0129 0.0131 0.0080 0.0086 287.0 0.0130 0.0123 0.0079 0.0081 288.0 0.0130 0.0131 0.0089 0.0090 289.0 0.0134 0.0135 0.0098 0.0093 290.0 0.0126 0.0126 0.0091 0.0093

203
291.0 0.0128 0.0128 0.0095 0.0096 292.0 0.0131 0.0126 0.0095 0.0090 293.0 0.0134 0.0133 0.0101 0.0100 294.0 0.0133 0.0135 0.0104 0.0105 295.0 0.0129 0.0130 0.0101 0.0104 296.0 0.0133 0.0130 0.0106 0.0105 297.0 0.0132 0.0129 0.0104 0.0109 298.0 0.0135 0.0135 0.0111 0.0108 299.0 0.0130 0.0126 0.0104 0.0107 300.0 0.0131 0.0133 0.0110 0.0108 301.0 0.0129 0.0135 0.0109 0.0112 302.0 0.0134 0.0130 0.0108 0.0106 303.0 0.0133 0.0133 0.0108 0.0112 304.0 0.0136 0.0140 0.0112 0.0110 305.0 0.0134 0.0134 0.0107 0.0105 306.0 0.0135 0.0136 0.0109 0.0102 307.0 0.0135 0.0132 0.0101 0.0098 308.0 0.0136 0.0136 0.0094 0.0091 309.0 0.0134 0.0140 0.0096 0.0097 310.0 0.0137 0.0140 0.0089 0.0089 311.0 0.0140 0.0139 0.0085 0.0086 312.0 0.0148 0.0147 0.0086 0.0084 313.0 0.0147 0.0148 0.0083 0.0081 314.0 0.0143 0.0143 0.0070 0.0074 315.0 0.0151 0.0150 0.0068 0.0070 316.0 0.0152 0.0152 0.0064 0.0065 317.0 0.0159 0.0153 0.0062 0.0062 318.0 0.0161 0.0159 0.0066 0.0067 319.0 0.0163 0.0167 0.0053 0.0056 320.0 0.0164 0.0161 0.0041 0.0048 321.0 0.0166 0.0164 0.0049 0.0054 322.0 0.0173 0.0162 0.0027 0.0031 323.0 0.0172 0.0171 0.0025 0.0028 324.0 0.0179 0.0178 0.0027 0.0027 325.0 0.0181 0.0180 0.0024 0.0023 326.0 0.0191 0.0190 0.0022 0.0023 327.0 0.0191 0.0187 0.0006 0.0009 328.0 0.0198 0.0197 0.0016 0.0021 329.0 0.0202 0.0208 0.0017 0.0010 330.0 0.0210 0.0210 0.0008 0.0015 331.0 0.0215 0.0213 0.0011 0.0008 332.0 0.0223 0.0217 0.0002 0.0004 333.0 0.0223 0.0227 0.0001 -0.0004 334.0 0.0228 0.0232 -0.0001 0.0002 335.0 0.0239 0.0238 0.0005 0.0002 336.0 0.0251 0.0247 0.0006 0.0005 337.0 0.0254 0.0251 0.0001 0.0001 338.0 0.0261 0.0263 0.0003 0.0001

204
339.0 0.0270 0.0267 0.0003 0.0001 340.0 0.0273 0.0269 -0.0005 -0.0001 341.0 0.0282 0.0282 0.0000 0.0001 342.0 0.0282 0.0286 0.0001 0.0003 343.0 0.0293 0.0287 -0.0001 -0.0004 344.0 0.0299 0.0298 0.0002 0.0001 345.0 0.0300 0.0296 -0.0007 -0.0004 346.0 0.0297 0.0304 -0.0006 -0.0004 347.0 0.0306 0.0306 -0.0005 -0.0002 348.0 0.0319 0.0313 0.0001 -0.0004 349.0 0.0317 0.0314 -0.0007 -0.0007 350.0 0.0310 0.0313 -0.0007 -0.0008 351.0 0.0316 0.0316 -0.0007 -0.0005 352.0 0.0322 0.0323 -0.0004 -0.0005 353.0 0.0322 0.0319 -0.0007 -0.0011 354.0 0.0325 0.0327 0.0002 -0.0005 355.0 0.0322 0.0322 -0.0006 -0.0001 356.0 0.0322 0.0320 -0.0006 -0.0005 357.0 0.0316 0.0314 0.0012 -0.0003 358.0 0.0309 0.0306 -0.0012 -0.0013 359.0 0.0309 0.0308 0.0002 -0.0002 360.0 0.0306 0.0298 -0.0005 -0.0008 361.0 0.0304 0.0297 -0.0006 -0.0003 362.0 0.0291 0.0297 -0.0008 -0.0012 363.0 0.0284 0.0289 -0.0006 -0.0005 364.0 0.0266 0.0280 -0.0010 -0.0010 365.0 0.0260 0.0266 -0.0010 -0.0009 366.0 0.0258 0.0258 -0.0007 -0.0010 367.0 0.0255 0.0252 -0.0004 -0.0004 368.0 0.0245 0.0255 0.0001 -0.0005 369.0 0.0243 0.0245 -0.0005 0.0001 370.0 0.0229 0.0227 -0.0005 -0.0008 371.0 0.0219 0.0213 -0.0015 -0.0014 372.0 0.0210 0.0203 -0.0013 -0.0010 373.0 0.0193 0.0192 -0.0009 -0.0006 374.0 0.0182 0.0185 -0.0005 -0.0007 375.0 0.0168 0.0174 -0.0010 -0.0002 376.0 0.0160 0.0163 -0.0012 -0.0014 377.0 0.0148 0.0148 -0.0014 -0.0016 378.0 0.0134 0.0134 -0.0008 -0.0013 379.0 0.0128 0.0130 -0.0012 -0.0011 380.0 0.0122 0.0124 -0.0011 -0.0005 381.0 0.0111 0.0111 -0.0008 -0.0007 382.0 0.0094 0.0096 -0.0014 -0.0010 383.0 0.0093 0.0088 -0.0013 -0.0010 384.0 0.0087 0.0085 -0.0008 -0.0010 385.0 0.0078 0.0074 -0.0012 -0.0008 386.0 0.0067 0.0066 -0.0006 -0.0009

205
387.0 0.0058 0.0057 -0.0010 -0.0017 388.0 0.0055 0.0052 -0.0006 -0.0013 389.0 0.0045 0.0042 -0.0014 -0.0017 390.0 0.0041 0.0041 -0.0006 -0.0016 391.0 0.0032 0.0038 -0.0009 -0.0009 392.0 0.0033 0.0035 -0.0009 -0.0010 393.0 0.0028 0.0026 -0.0013 -0.0007 394.0 0.0025 0.0025 -0.0008 -0.0014 395.0 0.0018 0.0021 -0.0010 -0.0011 396.0 0.0021 0.0017 -0.0009 -0.0012 397.0 0.0010 0.0012 -0.0016 -0.0009 398.0 0.0014 0.0012 -0.0011 -0.0007 399.0 0.0006 0.0011 -0.0009 -0.0009 400.0 0.0008 0.0005 -0.0012 -0.0010
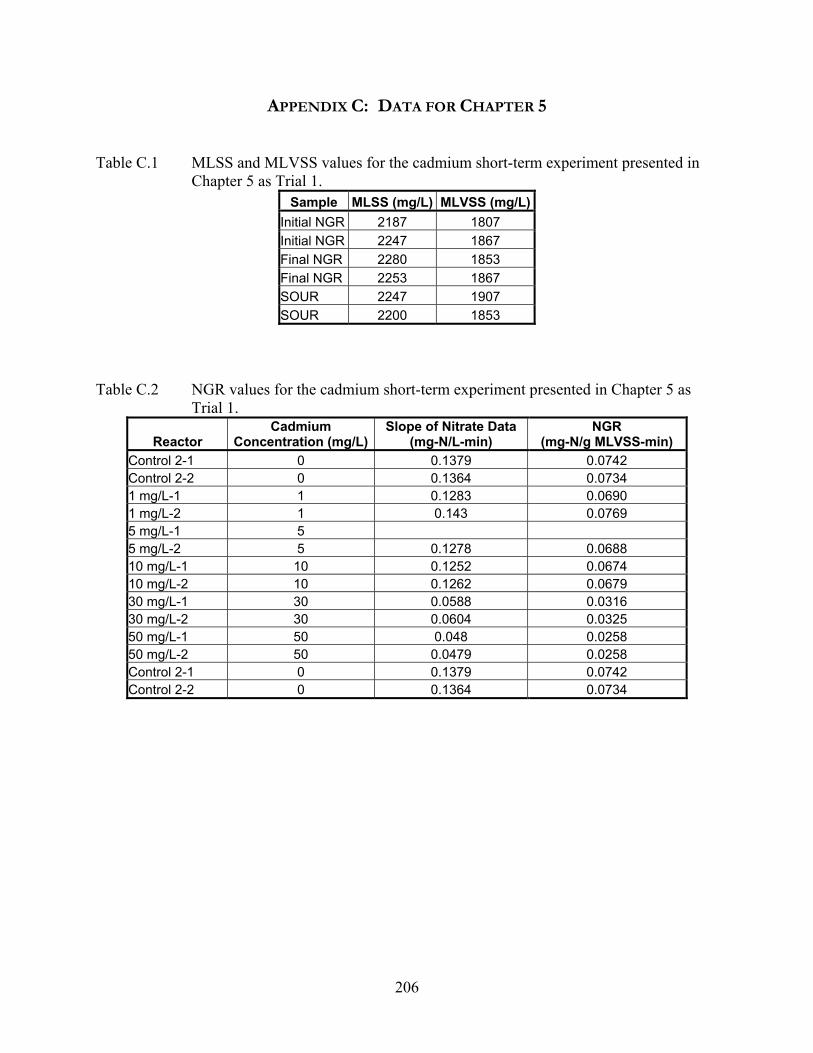
206
APPENDIX C: DATA FOR CHAPTER 5 Table C.1 MLSS and MLVSS values for the cadmium short-term experiment presented in
Chapter 5 as Trial 1. Sample MLSS (mg/L) MLVSS (mg/L)
Initial NGR 2187 1807 Initial NGR 2247 1867 Final NGR 2280 1853 Final NGR 2253 1867 SOUR 2247 1907 SOUR 2200 1853
Table C.2 NGR values for the cadmium short-term experiment presented in Chapter 5 as Trial 1.
Reactor Cadmium
Concentration (mg/L)Slope of Nitrate Data
(mg-N/L-min) NGR
(mg-N/g MLVSS-min) Control 2-1 0 0.1379 0.0742 Control 2-2 0 0.1364 0.0734 1 mg/L-1 1 0.1283 0.0690 1 mg/L-2 1 0.143 0.0769 5 mg/L-1 5 5 mg/L-2 5 0.1278 0.0688 10 mg/L-1 10 0.1252 0.0674 10 mg/L-2 10 0.1262 0.0679 30 mg/L-1 30 0.0588 0.0316 30 mg/L-2 30 0.0604 0.0325 50 mg/L-1 50 0.048 0.0258 50 mg/L-2 50 0.0479 0.0258 Control 2-1 0 0.1379 0.0742 Control 2-2 0 0.1364 0.0734

207
Table C.3 SOUR values for the cadmium short-term experiment presented in Chapter 5 as Trial 1. TCMP reactors are inhibited for nitrification.
Reactor Cadmium
Concentration (mg/L)OUR
(mg-O2/L-min) SOUR
(mg-O2/g MLVSS-min) Control 1-1 0 1.129 0.6074 Control 1-2 0 1.2755 0.6862 Control TCMP 1-1 0 0.9374 0.5043 Control TCMP 1-2 0 0.9743 0.5241 Control 2-1 0 1.2809 0.6891 Control 2-2 0 1.3142 0.7070 Control TCMP 2-1 0 1.0011 0.5385 Control TCMP 2-2 0 1.0178 0.5475 1 mg/L-1 1 1.2706 0.6835 1 mg/L-2 1 1.0918 0.5873 1 TCMP -1 1 0.8278 0.4453 1 TCMP -2 1 0.5658 0.3044 10 mg/L-1 10 1.1978 0.6444 10 mg/L-2 10 1.2953 0.6968 10 TCMP -1 10 0.9636 0.5184 10 TCMP -2 10 0.9744 0.5242 50 mg/L-1 50 1.0974 0.5904 50 mg/L-2 50 1.1043 0.5941 50 TCMP -1 50 0.8591 0.4622 50 TCMP -2 50 0.8896 0.4786
Table C.4 MLSS and MLVSS values for the cadmium short-term experiment Trial 2.
Sample MLSS (mg/L) MLVSS (mg/L)Initial NGR 3227 2653 Initial NGR 3240 2653 Final NGR 3260 2653 Final NGR 3200 2607 SOUR 3187 2607 SOUR 3253 2660

208
Table C.5 NGR values for the cadmium short-term experiment Trial 2.
Reactor Cadmium
Concentration (mg/L)Slope of Nitrate Data
(mg-N/L-min) NGR
(mg-N/g MLVSS-min) Control 1-1 0 0.2027 0.0768 Control 1-2 0 0.2055 0.0779 Control 2-1 0 0.2039 0.0773 Control 2-2 0 0.2170 0.0822 1 mg/L-1 1 0.1904 0.0722 1 mg/L-2 1 0.1960 0.0743 5 mg/L-1 5 0.1917 0.0726 5 mg/L-2 5 0.1992 0.0755 10 mg/L-1 10 0.1908 0.0723 10 mg/L-2 10 0.1927 0.0730 30 mg/L-1 30 0.1319 0.0500 30 mg/L-2 30 0.1292 0.0490 50 mg/L-1 50 0.0829 0.0314 50 mg/L-2 50 0.0774 0.0293
Table C.6 SOUR values for the cadmium short-term experiment Trial 2. TCMP reactors are
inhibited for nitrification.
Reactor Cadmium
Concentration (mg/L)OUR
(mg-O2/L-min) SOUR
(mg-O2/g MLVSS-min) Control 1-1 0 1.1006 0.4171 Control 1-2 0 1.0995 0.4167 Control TCMP 1-1 0 0.8920 0.3380 Control TCMP 1-2 0 0.8770 0.3323 5 mg/L-1 1 1.0336 0.3917 5 mg/L-2 1 1.0783 0.4086 5 TCMP -1 1 0.8665 0.3284 5 TCMP -2 1 0.9088 0.3444 10 mg/L-1 10 1.0573 0.4007 10 mg/L-2 10 1.0086 0.3822 10 TCMP -1 10 0.9517 0.3606 10 TCMP -2 10 0.8835 0.3348 50 mg/L-1 50 0.8243 0.3124 50 mg/L-2 50 0.8855 0.3356 50 TCMP -1 50 0.7771 0.2945 50 TCMP -2 50 0.7193 0.2726 Control 2-1 0 0.9890 0.3748 Control 2-2 0 1.0379 0.3933 Control TCMP 2-1 0 0.9750 0.3695 Control TCMP 2-2 0 0.9247 0.3504

209
Table C.7 MLSS and MLVSS values for the CDNB short-term experiment presented in
Chapter 5 as Trial 1. Sample MLSS (mg/L) MLVSS (mg/L)
Initial NGR 3010 2510 Initial NGR 2930 2460 Final NGR 3000 2490 Final NGR 2930 2430 SOUR 3000 2480 SOUR 2990 2470
Table C.8 NGR values for the CDNB short-term experiment presented in Chapter 5 as Trial 1.
Reactor CDNB
Concentration (mg/L)Slope of Nitrate Data
(mg-N/L-min) NGR
(mg-N/g MLVSS-min) Control 1-1 0 0.1755 0.0710 Control 1-2 0 0.1783 0.0721 1 mg/L-1 1 0.1755 0.0710 1 mg/L-2 1 0.1868 0.0755 5 mg/L-1 5 0.1402 0.0574 5 mg/L-2 5 0.1373 0.0562 10 mg/L-1 10 0.1252 0.0519 10 mg/L-2 10 0.1113 0.0462 20 mg/L-1 20 0.0523 0.0223 20 mg/L-2 20 0.0495 0.0211 30 mg/L-1 30 0.0297 0.0130 30 mg/L-2 30 0.0277 0.0121 Control 1-1 0 0.1755 0.0710 Control 1-2 0 0.1783 0.0721

210
Table C.9 SOUR values for the CDNB short-term experiment presented in Chapter 5 as Trial 1. TCMP reactors are inhibited for nitrification.
Reactor CDNB
Concentration (mg/L)OUR
(mg-O2/L-min) SOUR
(mg-O2/g MLVSS-min) Control 1-1 0 1.0521 0.4254 Control 1-2 0 1.0045 0.4061 Control TCMP 1-1 0 0.9089 0.3675 Control TCMP 1-2 0 0.8765 0.3544 5 mg/L-1 1 0.906 0.3663 5 mg/L-2 1 0.8547 0.3456 5 TCMP -1 1 0.8074 0.3264 5 TCMP -2 1 0.7646 0.3091 10 mg/L-1 10 0.8621 0.3486 10 mg/L-2 10 0.8061 0.3259 10 TCMP -1 10 0.7624 0.3082 10 TCMP -2 10 0.7179 0.2903 30 mg/L-1 30 0.6858 0.2773 30 mg/L-2 30 0.6612 0.2673 30 TCMP -1 30 0.6003 0.2427 30 TCMP -2 30 0.5709 0.2308 Control 2-1 0 1.059 0.4282 Control 2-2 0 1.0118 0.4091 Control TCMP 2-1 0 0.9421 0.3809 Control TCMP 2-2 0 0.8421 0.3405
Table C.10 MLSS and MLVSS values for the CDNB short-term experiment Trial 2.
Sample MLSS (mg/L) MLVSS (mg/L)Initial NGR 3120 2640 Initial NGR 3190 2700 Final NGR 3080 2550 Final NGR 3060 2570 SOUR 3140 2680 SOUR 3010 2650

211
Table C.11 NGR values for the CDNB short-term experiment Trial 2.
Reactor CDNB
Concentration (mg/L)Slope of Nitrate Data
(mg-N/L-min) NGR
(mg-N/g MLVSS-min) Control 1-1 0 0.1885 0.0716 Control 1-2 0 0.1815 0.0690 1 mg/L-1 1 0.1928 0.0733 1 mg/L-2 1 0.183 0.0695 4.9 mg/L-1 4.9 0.1292 0.0497 4.9 mg/L-2 4.9 0.1483 0.0571 9.8 mg/L-1 9.8 0.1153 0.0449 9.8 mg/L-2 9.8 0.1136 0.0442 27.9 mg/L-1 27.9 0.0812 0.0332 27.9 mg/L-2 27.9 0.0694 0.0283 52.2 mg/L-1 52.2 0 0.0000 52.2 mg/L-2 52.2 0 0.0000
Table C.12 SOUR values for the CDNB short-term experiment Trial 2. TCMP reactors are inhibited for nitrification.
Reactor CDNB
Concentration (mg/L)OUR
(mg-O2/L-min) SOUR
(mg-O2/g MLVSS-min) Control 1-1 0 1.144 0.4335 Control 1-2 Control TCMP 1-1 0 1.0347 0.3921 Control TCMP 1-2 0 0.9839 0.3728 5 mg/L-1 1 0.9506 0.3602 5 mg/L-2 1 0.9106 0.3451 5 TCMP -1 1 0.8356 0.3166 5 TCMP -2 1 0.7858 0.2978 10 mg/L-1 10 0.88 0.3335 10 mg/L-2 10 0.8196 0.3106 10 TCMP -1 10 0.7589 0.2876 10 TCMP -2 10 0.6996 0.2651 60 mg/L-1 60 0.6173 0.2339 60 mg/L-2 60 0.5444 0.2063 60 TCMP -1 60 0.5664 0.2146 60 TCMP -2 60 0.4704 0.1783 Control 2-1 0 1.2511 0.4741 Control 2-2 0 1.0276 0.3894 Control TCMP 2-1 0 1.1105 0.4208 Control TCMP 2-2 0 1.0737 0.4069
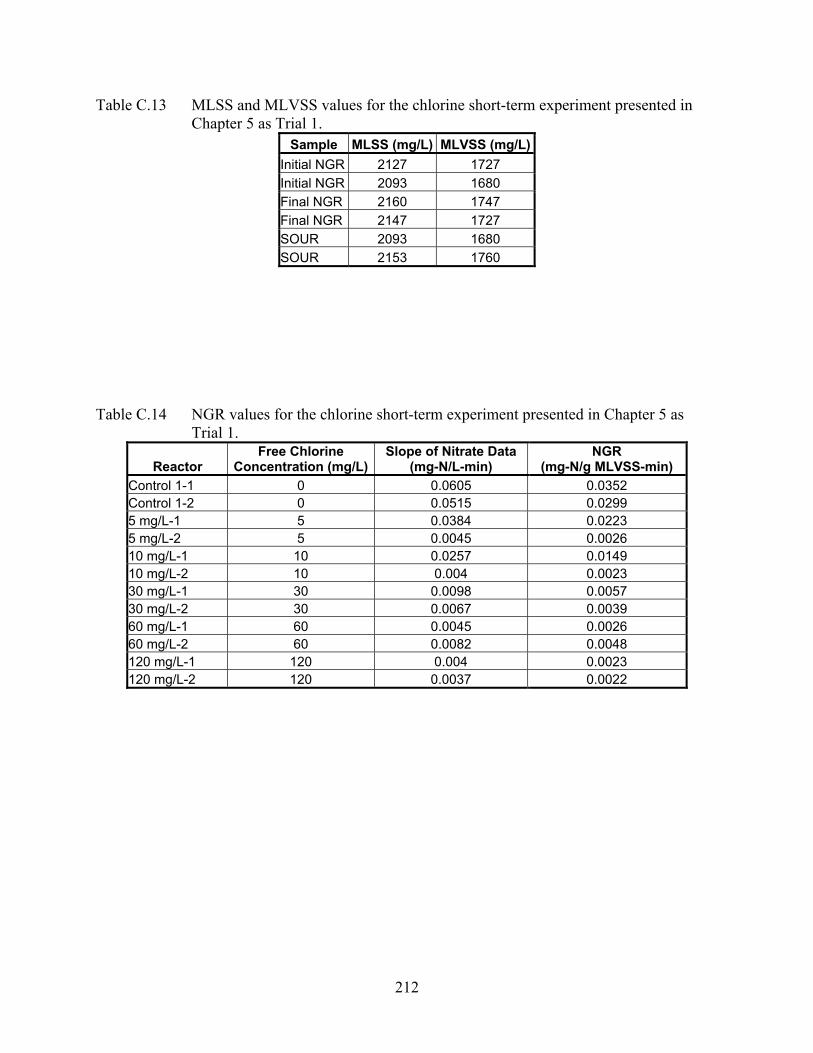
212
Table C.13 MLSS and MLVSS values for the chlorine short-term experiment presented in Chapter 5 as Trial 1.
Sample MLSS (mg/L) MLVSS (mg/L)Initial NGR 2127 1727 Initial NGR 2093 1680 Final NGR 2160 1747 Final NGR 2147 1727 SOUR 2093 1680 SOUR 2153 1760
Table C.14 NGR values for the chlorine short-term experiment presented in Chapter 5 as Trial 1.
Reactor Free Chlorine
Concentration (mg/L)Slope of Nitrate Data
(mg-N/L-min) NGR
(mg-N/g MLVSS-min) Control 1-1 0 0.0605 0.0352 Control 1-2 0 0.0515 0.0299 5 mg/L-1 5 0.0384 0.0223 5 mg/L-2 5 0.0045 0.0026 10 mg/L-1 10 0.0257 0.0149 10 mg/L-2 10 0.004 0.0023 30 mg/L-1 30 0.0098 0.0057 30 mg/L-2 30 0.0067 0.0039 60 mg/L-1 60 0.0045 0.0026 60 mg/L-2 60 0.0082 0.0048 120 mg/L-1 120 0.004 0.0023 120 mg/L-2 120 0.0037 0.0022

213
Table C.15 SOUR values for the chlorine short-term experiment presented in Chapter 5 as Trial 1. TCMP reactors are inhibited for nitrification.
Reactor Free Chlorine
Concentration (mg/L)OUR
(mg-O2/L-min) SOUR
(mg-O2/g MLVSS-min) Control 1-1 0 1.1028 0.6412 Control 1-2 0 1.0475 0.6090 Control TCMP 1-1 0 0.805 0.4680 Control TCMP 1-2 0 0.7801 0.4535 Control 2-1 0 1.0991 0.6390 Control 2-2 0 1.1021 0.6408 Control TCMP 2-1 0 0.8597 0.4998 Control TCMP 2-2 0 0.8255 0.4799 5 mg/L-1 5 0.3494 0.2031 5 mg/L-2 5 0.2909 0.1691 5 TCMP -1 5 0.2291 0.1332 5 TCMP -2 5 0.2866 0.1666 10 mg/L-1 10 0.1244 0.0723 10 mg/L-2 10 0.1486 0.0864 10 TCMP -1 10 0.1229 0.0715 10 TCMP -2 10 30 mg/L-1 30 0.0371 0.0216 30 mg/L-2 30 0.0365 0.0212 30 TCMP -1 30 0.0319 0.0185 30 TCMP -2 30 0.038 0.0221
Table C.16 MLSS and MLVSS values for the chlorine short-term experiment Trial 2.
Sample MLSS (mg/L) MLVSS (mg/L)Initial NGR 2193 1807 Initial NGR 2227 1840 Final NGR 2227 1807 Final NGR 2320 1887 SOUR 2207 1807 SOUR 2193 1793

214
Table C.17 NGR values for the chlorine short-term experiment Trial 2.
Reactor Free Chlorine
Concentration (mg/L)Slope of Nitrate Data
(mg-N/L-min) NGR
(mg-N/g MLVSS-min) Control 1-1 0 0.0796 0.0437 Control 1-2 0 0.0746 0.0409 Control 2-1 0 0.0752 0.0412 Control 2-2 0 0.0731 0.0401 5 mg/L-1 5 0.0399 0.0219 5 mg/L-2 5 0.0429 0.0235 10 mg/L-1 10 0.0131 0.0072 10 mg/L-2 10 0.0161 0.0088 30 mg/L-1 30 30 mg/L-2 30 0.0134 0.0073 60 mg/L-1 60 0.0054 0.0030 60 mg/L-2 60 0.0091 0.0050 120 mg/L-1 120 0.0039 0.0021 120 mg/L-2 120 0.0044 0.0024
Table C.18 SOUR values for the chlorine short-term experiment Trial 2. TCMP reactors are inhibited for nitrification.
Reactor Free Chlorine
Concentration (mg/L)OUR
(mg-O2/L-min) SOUR
(mg-O2/g MLVSS-min) Control 1-1 0 1.0582 0.5804 Control 1-2 0 1.1508 0.6312 Control TCMP 1-1 0 0.8661 0.4750 Control TCMP 1-2 0 0.8982 0.4926 Control 2-1 0 1.4045 0.7703 Control 2-2 0 1.3838 0.7589 Control TCMP 2-1 0 1.0794 0.5920 Control TCMP 2-2 0 1.0745 0.5893 5 mg/L-1 5 0.43 0.2358 5 mg/L-2 5 0.409 0.2243 5 TCMP -1 5 0.376 0.2062 5 TCMP -2 5 0.3608 0.1979 10 mg/L-1 10 10 mg/L-2 10 0.2067 0.1134 10 TCMP -1 10 0.3555 0.1950 10 TCMP -2 10 0.3596 0.1972 30 mg/L-1 30 0.0685 0.0376 30 mg/L-2 30 0.0526 0.0288 30 TCMP -1 30 0.0614 0.0337 30 TCMP -2 30 0.0546 0.0299

215
Table C.19 Trial 1 MLSS and MLVSS values for the control cadmium long-term experiment reactors presented in Chapter 5.
Control IC50 Control IC50 MLSS-1 MLSS-2 MLSS-1 MLSS-2 MLVSS-1 MLVSS-2 MLVSS-1 MLVSS-2
Time (hr) mg/L mg/L mg/L mg/L mg/L mg/L mg/L mg/L 0 2960 3040 3020 3120 2480 2540 2520 2600 3 3180 3240 3260 3180 2600 2680 2600 2540 6 2760 2720 2860 2820 2200 2220 2280 2320 12 2660 2760 2780 2840 2240 2300 2340 2400 24 2280 2300 2400 2440 1820 1900 1940 2020 48 2380 2280 2320 2280 1920 1900 1880 1860
Table C.20 Trial 1 MLSS and MLVSS values for the nitrification inibited cadmium long-term experiment reactors presented in Chapter 5.
Control IC50 Control IC50 MLSS-1 MLSS-2 MLSS-1 MLSS-2 MLVSS-1 MLVSS-2 MLVSS-1 MLVSS-2
Time (hr) mg/L mg/L mg/L mg/L mg/L mg/L mg/L mg/L 0 2980 2920 2740 2800 2480 2500 2340 2380 3 2940 2980 2940 2860 2440 2460 2380 2320 6 2800 2820 2740 2860 2280 2320 2200 2300 12 2720 2760 2640 2660 2280 2320 2240 2260 24 2440 2500 2380 2340 2000 2100 1960 1940 48 2400 2440 2220 2200 1960 1980 1820 1900
Table C.21 Trial 1 NGR values for the cadmium long-term experiment presented in Chapter 5. Control-1 NGR Control-2 NGR IC50-1 NGR IC50-2 NGR
Time (hr) (mg-N/g MLVSS-min) (mg-N/g MLVSS-min) (mg-N/g MLVSS-min) (mg-N/g MLVSS-min)0 0.0438 0.0518 0.0511 0.0493 3 0.0504 0.0539 0.0313 0.0332 6 0.0526 0.0570 0.0142 0.0150 12 0.0463 0.0514 0.0212 0.0202 24 0.0500 0.0530 0.0237 0.0253 48 0.0490 0.0540 0.0245 0.0303

216
Table C.22 Trial 1 Total SOUR values for the cadmium long-term experiment presented in
Chapter 5. Control-1 SOUR Control-2 SOUR IC50-1 SOUR IC50-2 SOUR
Time (hr) (mg-O2/g MLVSS-min) (mg-O2/g MLVSS-min) (mg-O2/g MLVSS-min) (mg-O2/g MLVSS-min)0 0.516 0.490 0.188 0.176 3 0.491 0.421 0.156 0.146 6 0.428 0.387 0.130 0.120
12 0.363 0.366 0.162 0.163 24 0.312 0.305 0.172 0.179 48 0.326 0.327 0.221 0.213
Table C.23 Trial 1 Nitrification Inhibited SOUR values for the cadmium long-term experiment presented in Chapter 5.
Control-1 SOUR Control-2 SOUR IC50-1 SOUR IC50-2 SOUR Time (hr) (mg-O2/g MLVSS-min) (mg-O2/g MLVSS-min) (mg-O2/g MLVSS-min) (mg-O2/g MLVSS-min)
0 0.428 0.396 0.140 0.128 3 0.397 0.342 0.095 0.081 6 0.320 0.303 0.070 0.071
12 0.327 0.327 0.085 0.091 24 0.238 0.240 0.122 0.121 48 0.231 0.229 0.138 0.137

217
Table C.24 Trial 2 MLSS and MLVSS values for the control cadmium long-term experiment reactors.
Control IC50 Control IC50 MLSS-1 MLSS-2 MLSS-1 MLSS-2 MLVSS-1 MLVSS-2 MLVSS-1 MLVSS-2
Time (hr) mg/L mg/L mg/L mg/L mg/L mg/L mg/L mg/L 0 2480 2500 2380 2440 2080 2080 2020 2020 3 2460 2980 2400 2420 2060 2580 2080 2120 6 2280 2200 2200 2200 1920 1920 1860 1840 12 2420 2320 2280 2180 2040 2000 1980 1880 24 2200 2140 2120 2160 1800 1820 1820 1860 48 1940 1960 1820 1820 1700 1760 1620 1600
Table C.25 Trial 2 MLSS and MLVSS values for the nitrification inhibited cadmium long-term experiment reactors.
Control IC50 Control IC50 MLSS-1 MLSS-2 MLSS-1 MLSS-2 MLVSS-1 MLVSS-2 MLVSS-1 MLVSS-2
Time (hr) mg/L mg/L mg/L mg/L mg/L mg/L mg/L mg/L 0 2320 2340 2400 2520 2040 2040 2040 2200 3 2320 2440 2520 2440 1980 2060 2140 2120 6 2140 2120 2040 2200 1780 1800 1740 1860 12 2140 2280 2220 2260 1860 1920 1940 1920 24 2180 2040 2080 1980 1860 1800 1860 1800 48 1820 1860 1840 1860 1660 1600 1540 1560
Table C.26 Trial 2 NGR values for the cadmium long-term experiment. Control-1 NGR Control-2 NGR IC50-1 NGR IC50-2 NGR
Time (hr) (mg-N/g MLVSS-min) (mg-N/g MLVSS-min) (mg-N/g MLVSS-min) (mg-N/g MLVSS-min)0 0.062 0.053 0.038 0.035 3 0.026 0.027 0.010 0.011 6 0.027 0.025 0.011 0.010 12 0.041 0.040 0.015 0.016 24 0.042 0.044 0.021 0.021 48 0.045 0.052 0.029 0.021

218
Table C.27 Trial 2 Total SOUR values for the cadmium long-term experiment. Control-1 SOUR Control-2 SOUR IC50-1 SOUR IC50-2 SOUR
Time (hr) (mg-O2/g MLVSS-min) (mg-O2/g MLVSS-min) (mg-O2/g MLVSS-min) (mg-O2/g MLVSS-min)0 0.555 0.552 0.290 0.287 3 0.319 0.308 0.120 0.122 6 0.458 0.423 0.154 0.159
12 0.229 0.247 0.186 0.191 24 0.237 0.210 0.213 0.213 48 0.223 0.269 0.370 0.366
Table C.28 Trial 2 Nitrification Inhibited SOUR values for the cadmium long-term experiment.
Control-1 SOUR Control-2 SOUR IC50-1 SOUR IC50-2 SOUR Time (hr) (mg-O2/g MLVSS-min) (mg-O2/g MLVSS-min) (mg-O2/g MLVSS-min) (mg-O2/g MLVSS-min)
0 0.361 0.370 0.127 0.139 3 0.395 0.394 0.075 0.077 6 0.423 0.419 0.084 0.086
12 0.401 0.417 0.086 0.089 24 0.318 0.308 0.099 0.100 48 0.329 0.366 0.135 0.137

219
Table C.29 Trial 1 MLSS and MLVSS values for the control CDNB long-term experiment reactors presented in Chapter 5.
Control IC50 Control IC50 MLSS-1 MLSS-2 MLSS-1 MLSS-2 MLVSS-1 MLVSS-2 MLVSS-1 MLVSS-2
Time (hr) mg/L mg/L mg/L mg/L mg/L mg/L mg/L mg/L 0 2660 2720 2700 2680 2200 2180 2200 2140 3 2720 2700 2760 2640 2200 2180 2180 2200 6 2200 2160 2220 2160 1780 1740 1820 1800 12 2180 2060 2120 2140 1860 1820 1800 1820 24 2040 1920 2000 2060 1780 1720 1760 1800 48 2020 12118 2060 1960 1740 1600 1740 1720
Table C.30 Trial 1 MLSS and MLVSS values for the nitrification inhibited CDNB long-term experiment reactors presented in Chapter 5.
Control IC50 Control IC50 MLSS-1 MLSS-2 MLSS-1 MLSS-2 MLVSS-1 MLVSS-2 MLVSS-1 MLVSS-2
Time (hr) mg/L mg/L mg/L mg/L mg/L mg/L mg/L mg/L 0 2800 2740 2780 2660 2240 2160 2200 2140 3 2680 2840 2740 2780 2200 2240 2140 2220 6 2340 2280 2360 2380 1840 1820 1940 1940 12 2180 2160 2200 2200 1840 1780 1820 1840 24 2000 2020 1920 2040 1800 1760 1760 1820 48 2040 2000 2080 2060 1720 1680 1820 1820
Table C.31 Trial 1 NGR values for the CDNB long-term experiment presented in Chapter 5. Control-1 NGR Control-2 NGR IC50-1 NGR IC50-2 NGR
Time (hr) (mg-N/g MLVSS-min) (mg-N/g MLVSS-min) (mg-N/g MLVSS-min) (mg-N/g MLVSS-min)0 0.050 0.044 0.028 0.027 3 0.046 0.048 0.006 0.009 6 0.044 0.042 0.004 0.000 12 0.043 0.046 0.000 0.000 24 0.051 0.046 0.000 0.000 48 0.044 0.043 0.000 0.000

220
Table C.32 Trial 1 Total SOUR values for the CDNB long-term experiment presented in Chapter 5.
Control-1 SOUR Control-2 SOUR IC50-1 SOUR IC50-2 SOUR Time (hr) (mg-O2/g MLVSS-min) (mg-O2/g MLVSS-min) (mg-O2/g MLVSS-min) (mg-O2/g MLVSS-min)
0 0.546 0.552 0.320 0.323 3 0.563 0.575 0.194 0.196 6 0.586 0.219 0.229
12 0.264 0.270 0.306 0.311 24 0.184 0.182 0.322 0.328 48 0.182 0.180 0.380 0.385
Table C.33 Trial 1 Nitrification Inhibited SOUR values for the CDNB long-term experiment presented in Chapter 5.
Control-1 SOUR Control-2 SOUR IC50-1 SOUR IC50-2 SOUR Time (hr) (mg-O2/g MLVSS-min) (mg-O2/g MLVSS-min) (mg-O2/g MLVSS-min) (mg-O2/g MLVSS-min)
0 0.387 0.390 0.246 0.245 3 0.367 0.343 0.165 0.171 6 0.415 0.414 0.176 0.182
12 0.335 0.357 0.212 0.223 24 0.272 0.282 0.202 0.211 48 0.309 0.313 0.245 0.244
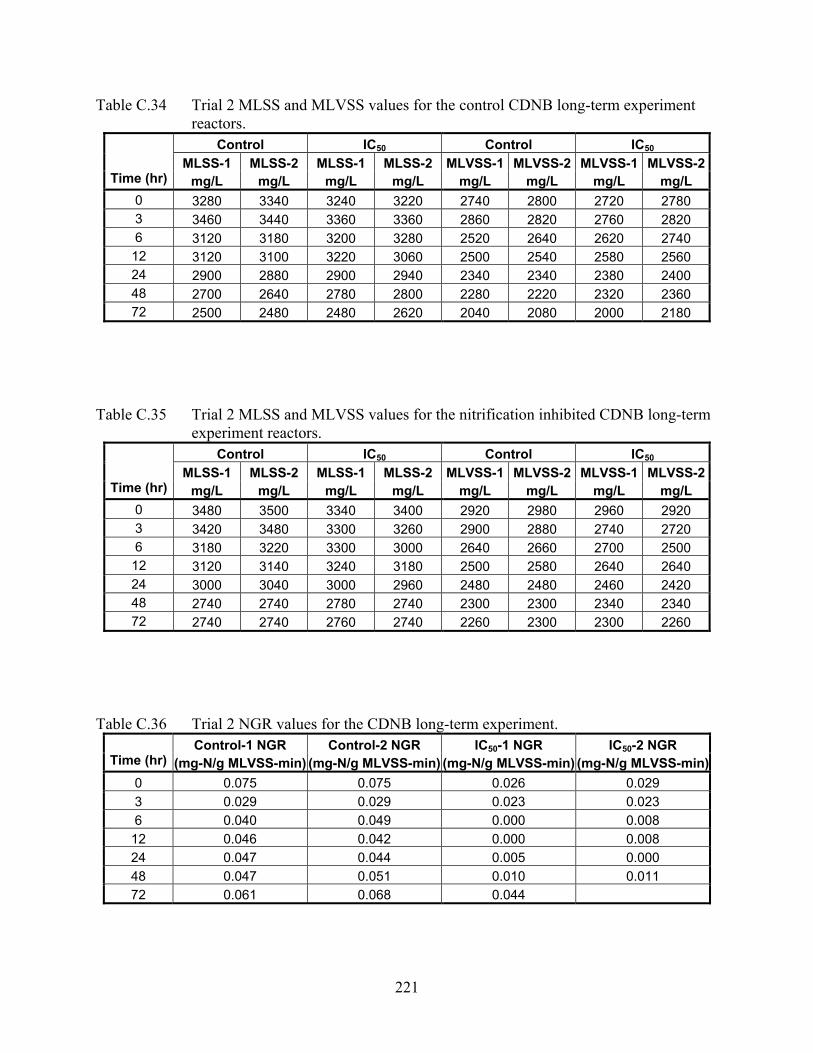
221
Table C.34 Trial 2 MLSS and MLVSS values for the control CDNB long-term experiment reactors.
Control IC50 Control IC50 MLSS-1 MLSS-2 MLSS-1 MLSS-2 MLVSS-1 MLVSS-2 MLVSS-1 MLVSS-2
Time (hr) mg/L mg/L mg/L mg/L mg/L mg/L mg/L mg/L 0 3280 3340 3240 3220 2740 2800 2720 2780 3 3460 3440 3360 3360 2860 2820 2760 2820 6 3120 3180 3200 3280 2520 2640 2620 2740 12 3120 3100 3220 3060 2500 2540 2580 2560 24 2900 2880 2900 2940 2340 2340 2380 2400 48 2700 2640 2780 2800 2280 2220 2320 2360 72 2500 2480 2480 2620 2040 2080 2000 2180
Table C.35 Trial 2 MLSS and MLVSS values for the nitrification inhibited CDNB long-term experiment reactors.
Control IC50 Control IC50 MLSS-1 MLSS-2 MLSS-1 MLSS-2 MLVSS-1 MLVSS-2 MLVSS-1 MLVSS-2
Time (hr) mg/L mg/L mg/L mg/L mg/L mg/L mg/L mg/L 0 3480 3500 3340 3400 2920 2980 2960 2920 3 3420 3480 3300 3260 2900 2880 2740 2720 6 3180 3220 3300 3000 2640 2660 2700 2500 12 3120 3140 3240 3180 2500 2580 2640 2640 24 3000 3040 3000 2960 2480 2480 2460 2420 48 2740 2740 2780 2740 2300 2300 2340 2340 72 2740 2740 2760 2740 2260 2300 2300 2260
Table C.36 Trial 2 NGR values for the CDNB long-term experiment. Control-1 NGR Control-2 NGR IC50-1 NGR IC50-2 NGR
Time (hr) (mg-N/g MLVSS-min) (mg-N/g MLVSS-min) (mg-N/g MLVSS-min) (mg-N/g MLVSS-min)0 0.075 0.075 0.026 0.029 3 0.029 0.029 0.023 0.023 6 0.040 0.049 0.000 0.008 12 0.046 0.042 0.000 0.008 24 0.047 0.044 0.005 0.000 48 0.047 0.051 0.010 0.011 72 0.061 0.068 0.044

222
Table C.37 Trial 2 Total SOUR values for the CDNB long-term experiment.
Control-1 SOUR Control-2 SOUR IC50-1 SOUR IC50-2 SOUR Time (hr) (mg-O2/g MLVSS-min) (mg-O2/g MLVSS-min) (mg-O2/g MLVSS-min) (mg-O2/g MLVSS-min)
0 0.800 0.801 0.442 0.431 3 0.262 0.260 0.179 0.178 6 0.289 0.285 0.239 0.235
12 0.383 0.380 0.305 0.307 24 0.443 0.425 0.384 0.374 48 0.571 0.542 0.417 0.407 72 0.307 0.278 0.149 0.142
Table C.38 Trial 2 Nitrification Inhibited SOUR values for the CDNB long-term experiment. Control-1 SOUR Control-2 SOUR IC50-1 SOUR IC50-2 SOUR
Time (hr) (mg-O2/g MLVSS-min) (mg-O2/g MLVSS-min) (mg-O2/g MLVSS-min) (mg-O2/g MLVSS-min)0 0.382 0.371 0.240 0.224 3 0.325 0.318 0.174 0.172 6 0.356 0.336 0.199 0.196
12 0.313 0.312 0.209 0.208 24 0.299 0.296 0.256 0.249 48 0.323 0.315 0.294 0.292 72 0.309 0.298 0.297 0.294
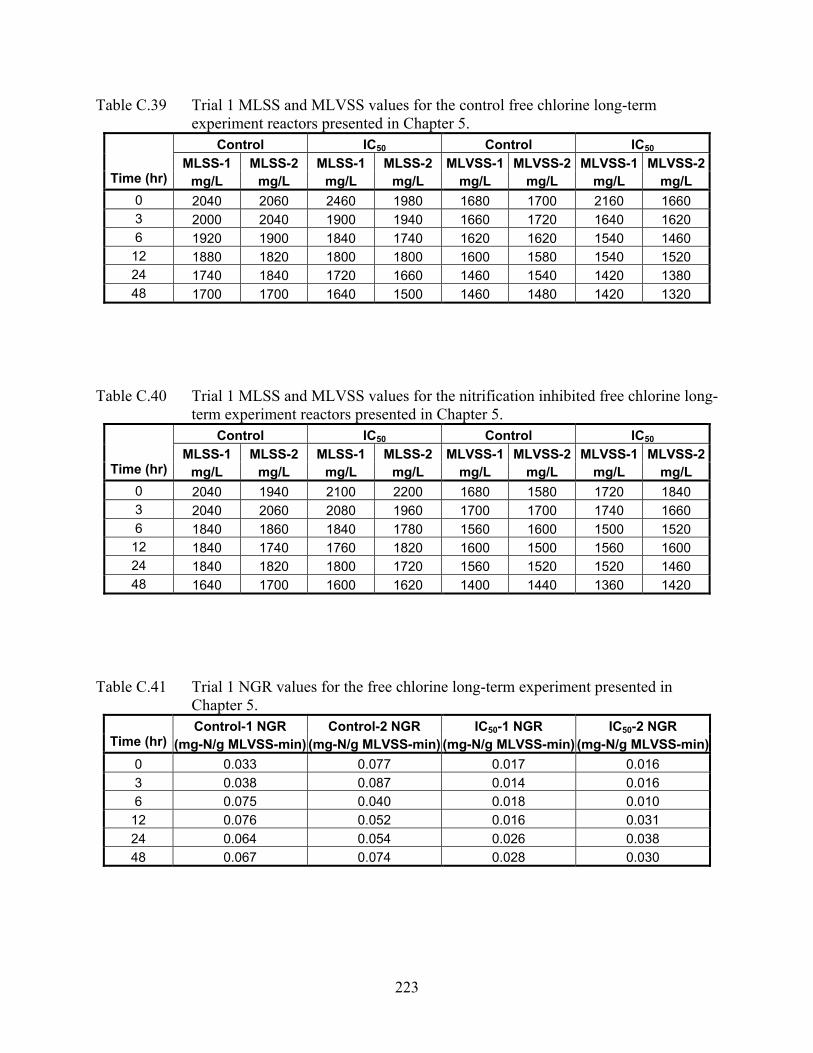
223
Table C.39 Trial 1 MLSS and MLVSS values for the control free chlorine long-term experiment reactors presented in Chapter 5.
Control IC50 Control IC50 MLSS-1 MLSS-2 MLSS-1 MLSS-2 MLVSS-1 MLVSS-2 MLVSS-1 MLVSS-2
Time (hr) mg/L mg/L mg/L mg/L mg/L mg/L mg/L mg/L 0 2040 2060 2460 1980 1680 1700 2160 1660 3 2000 2040 1900 1940 1660 1720 1640 1620 6 1920 1900 1840 1740 1620 1620 1540 1460 12 1880 1820 1800 1800 1600 1580 1540 1520 24 1740 1840 1720 1660 1460 1540 1420 1380 48 1700 1700 1640 1500 1460 1480 1420 1320
Table C.40 Trial 1 MLSS and MLVSS values for the nitrification inhibited free chlorine long-term experiment reactors presented in Chapter 5.
Control IC50 Control IC50 MLSS-1 MLSS-2 MLSS-1 MLSS-2 MLVSS-1 MLVSS-2 MLVSS-1 MLVSS-2
Time (hr) mg/L mg/L mg/L mg/L mg/L mg/L mg/L mg/L 0 2040 1940 2100 2200 1680 1580 1720 1840 3 2040 2060 2080 1960 1700 1700 1740 1660 6 1840 1860 1840 1780 1560 1600 1500 1520 12 1840 1740 1760 1820 1600 1500 1560 1600 24 1840 1820 1800 1720 1560 1520 1520 1460 48 1640 1700 1600 1620 1400 1440 1360 1420
Table C.41 Trial 1 NGR values for the free chlorine long-term experiment presented in Chapter 5. Control-1 NGR Control-2 NGR IC50-1 NGR IC50-2 NGR
Time (hr) (mg-N/g MLVSS-min) (mg-N/g MLVSS-min) (mg-N/g MLVSS-min) (mg-N/g MLVSS-min)0 0.033 0.077 0.017 0.016 3 0.038 0.087 0.014 0.016 6 0.075 0.040 0.018 0.010 12 0.076 0.052 0.016 0.031 24 0.064 0.054 0.026 0.038 48 0.067 0.074 0.028 0.030

224
Table C.42 Trial 1 Total SOUR values for the free chlorine long-term experiment presented in Chapter 5.
Control-1 SOUR Control-2 SOUR IC50-1 SOUR IC50-2 SOUR Time (hr) (mg-O2/g MLVSS-min) (mg-O2/g MLVSS-min) (mg-O2/g MLVSS-min) (mg-O2/g MLVSS-min)
0 0.517 0.321 0.072 0.075 3 0.493 0.311 0.118 0.127 6 0.558 0.327 0.138 0.146
12 0.362 0.306 0.170 0.169 24 0.379 0.318 0.239 0.250 48 0.321 0.302 0.267 0.271
Table C.43 Trial 1 Nitrification Inhibited SOUR values for the free chlorine long-term experiment presented in Chapter 5.
Control-1 SOUR Control-2 SOUR IC50-1 SOUR IC50-2 SOUR Time (hr) (mg-O2/g MLVSS-min) (mg-O2/g MLVSS-min) (mg-O2/g MLVSS-min) (mg-O2/g MLVSS-min)
0 0.320 0.072 0.065 0.067 3 0.322 0.118 0.081 0.086 6 0.339 0.138 0.093 0.096
12 0.305 0.170 0.113 0.115 24 0.326 0.239 0.175 0.184 48 0.304 0.267 0.187 0.194

225
Table C.44 Trial 2 MLSS and MLVSS values for the control free chlorine long-term experiment reactors.
Control IC50 Control IC50 MLSS-1 MLSS-2 MLSS-1 MLSS-2 MLVSS-1 MLVSS-2 MLVSS-1 MLVSS-2
Time (hr) mg/L mg/L mg/L mg/L mg/L mg/L mg/L mg/L 0 2500 2460 2640 2520 2000 1960 2120 2040 3 2340 2400 2500 2540 1960 1980 2080 2040 6 2300 2300 2380 2340 1860 1820 1960 1880 12 2100 2120 2200 2180 1820 1760 1900 1880 24 1900 1820 2080 2120 1520 1400 1660 1720 48 1740 1760 1920 1920 1520 1480 1640 1680 72 2500 2460 2640 2520 2000 1960 2120 2040
Table C.45 Trial 2 MLSS and MLVSS values for the nitrification inhibited free chlorine long-term experiment reactors.
Control IC50 Control IC50 MLSS-1 MLSS-2 MLSS-1 MLSS-2 MLVSS-1 MLVSS-2 MLVSS-1 MLVSS-2
Time (hr) mg/L mg/L mg/L mg/L mg/L mg/L mg/L mg/L 0 2420 2340 2460 2460 1980 1920 2040 2000 3 2400 2440 2480 2380 1960 1980 2020 1960 6 2380 2340 2280 2300 1900 1880 1860 1880 12 2160 2260 2200 2120 1880 1960 2000 2000 24 2020 2100 1960 1960 1620 1640 1600 1580 48 1900 1860 1720 1740 1660 1680 1600 1620 72 2420 2340 2460 2460 1980 1920 2040 2000
Table C.46 Trial 2 NGR values for the free chlorine long-term experiment. Control-1 NGR Control-2 NGR IC50-1 NGR IC50-2 NGR
Time (hr) (mg-N/g MLVSS-min) (mg-N/g MLVSS-min) (mg-N/g MLVSS-min) (mg-N/g MLVSS-min)0 0.070 0.071 0.016 0.021 3 0.100 0.095 0.023 0.027 6 0.089 0.073 0.019 0.022 12 0.070 0.092 0.025 0.024 24 0.075 0.089 0.034 0.034 48 0.070 0.072 0.035 0.037

226
Table C.47 Trial 2 Total SOUR values for the free chlorine long-term experiment. Control-1 SOUR Control-2 SOUR IC50-1 SOUR IC50-2 SOUR
Time (hr) (mg-O2/g MLVSS-min) (mg-O2/g MLVSS-min) (mg-O2/g MLVSS-min) (mg-O2/g MLVSS-min)0 0.501 0.493 0.132 0.131 3 0.463 0.459 0.160 0.163 6 0.470 0.474 0.177 0.184
12 0.311 0.283 0.217 0.222 24 0.337 0.246 0.262 48 0.260 0.280 0.195
Table C.48 Trial 2 Nitrification Inhibited SOUR values for the free chlorine long-term experiment.
Control-1 SOUR Control-2 SOUR IC50-1 SOUR IC50-2 SOUR Time (hr) (mg-O2/g MLVSS-min) (mg-O2/g MLVSS-min) (mg-O2/g MLVSS-min) (mg-O2/g MLVSS-min)
0 0.286 0.298 0.084 0.086 3 0.299 0.304 0.101 0.104 6 0.305 0.314 0.113 0.116
12 0.293 0.287 0.128 0.131 24 0.307 0.329 0.191 0.200 48 0.293 0.266 0.191 0.196

227
Table C.49 Trial 1 MLSS and MLVSS values for the cadmium long-term Eckenfelder experiment reactors presented in Chapter 5.
Control IC50 Control IC50 MLSS-1 MLSS-2 MLSS-1 MLSS-2 MLVSS-1 MLVSS-2 MLVSS-1 MLVSS-2
Time (hr) mg/L mg/L mg/L mg/L mg/L mg/L mg/L mg/L 0 2110 2180 2170 2170 1730 1770 1780 1750 3 2130 2150 2160 2170 1780 1790 1810 1790 6 2110 2060 2110 2100 1740 1710 1740 1720 12 2010 2020 2010 2030 1670 1620 1610 1610 24 1970 1950 1910 1850 1660 1610 1560 1520 48 1700 1670 1600 1610 1390 1370 1280 1300
Table C.50 Trial 1 NGR values for the cadmium long-term Eckenfelder experiment presented in Chapter 5. Control-1 NGR Control-2 NGR IC50-1 NGR IC50-2 NGR
Time (hr) (mg-N/g MLVSS-min) (mg-N/g MLVSS-min) (mg-N/g MLVSS-min) (mg-N/g MLVSS-min)0 0.079 0.073 0.030 0.028 3 0.076 0.074 0.013 0.016 6 0.063 0.062 0.012 0.011 12 0.060 0.059 0.017 0.016 24 0.028 0.031 0.015 0.017 48 0.005 0.008 0.025 0.028
Table C.51 Trial 1 Total SOUR values for the cadmium long-term Eckenfelder experiment presented in Chapter 5.
Control-1 SOUR Control-2 SOUR IC50-1 SOUR IC50-2 SOUR Time (hr) (mg-O2/g MLVSS-min) (mg-O2/g MLVSS-min) (mg-O2/g MLVSS-min) (mg-O2/g MLVSS-min)
0 0.495 0.500 0.231 0.232 3 0.479 0.478 0.083 0.086 6 0.488 0.495 0.087 0.085
12 0.410 0.393 0.098 0.096 24 0.115 0.107 0.140 0.134 48 0.054 0.056 0.176 0.179
Table C.52 Trial 1 Nitrification Inhibited SOUR values for the cadmium long-term Eckenfelder experiment presented in Chapter 5.
Control-1 SOUR Control-2 SOUR IC50-1 SOUR IC50-2 SOUR Time (hr) (mg-O2/g MLVSS-min) (mg-O2/g MLVSS-min) (mg-O2/g MLVSS-min) (mg-O2/g MLVSS-min)
0 0.322 0.332 0.156 0.159 3 0.309 0.312 0.089 0.091 6 0.321 0.344 0.082 0.076
12 0.243 0.203 0.098 0.099 24 0.094 0.104 0.109 0.112 48 0.061 0.068 0.128 0.124

228
Table C.53 Trial 2 MLSS and MLVSS values for the cadmium long-term Eckenfelder experiment reactors.
Control IC50 Control IC50 MLSS-1 MLSS-2 MLSS-1 MLSS-2 MLVSS-1 MLVSS-2 MLVSS-1 MLVSS-2
Time (hr) mg/L mg/L mg/L mg/L mg/L mg/L mg/L mg/L 0 2170 2150 2150 2160 1800 1780 1760 1770 3 2150 2150 2120 2140 1750 1760 1710 1740 6 2090 2120 2080 2070 1690 1710 1680 1710 12 1990 1980 1990 1980 1670 1630 1620 1650 24 1920 1910 1890 1830 1620 1570 1540 1490 48 1670 1680 1580 1610 1400 1410 1320 1330
Table C.54 Trial 2 NGR values for the cadmium long-term Eckenfelder experiment. Control-1 NGR Control-2 NGR IC50-1 NGR IC50-2 NGR
Time (hr) (mg-N/g MLVSS-min) (mg-N/g MLVSS-min) (mg-N/g MLVSS-min) (mg-N/g MLVSS-min)0 0.078 0.088 0.028 0.032 3 0.069 0.070 0.015 0.015 6 0.072 0.076 0.014 0.015 12 0.062 0.062 0.017 0.012 24 0.027 0.033 0.026 0.026 48 0.007 0.008 0.027 0.030
Table C.55 Trial 2 Total SOUR values for the cadmium long-term Eckenfelder experiment. Control-1 SOUR Control-2 SOUR IC50-1 SOUR IC50-2 SOUR
Time (hr) (mg-O2/g MLVSS-min) (mg-O2/g MLVSS-min) (mg-O2/g MLVSS-min) (mg-O2/g MLVSS-min)0 0.455 0.480 0.192 0.194 3 0.488 0.496 0.074 0.075 6 0.486 0.470 0.076 0.083
12 0.309 0.331 0.079 0.080 24 0.103 0.086 0.117 0.113 48 0.055 0.053 0.168 0.170
Table C.56 Trial 2 Nitrification Inhibited SOUR values for the cadmium long-term Eckenfelder experiment.
Control-1 SOUR Control-2 SOUR IC50-1 SOUR IC50-2 SOUR Time (hr) (mg-O2/g MLVSS-min) (mg-O2/g MLVSS-min) (mg-O2/g MLVSS-min) (mg-O2/g MLVSS-min)
0 0.298 0.315 0.132 0.136 3 0.365 0.380 0.085 0.087 6 0.275 0.303 0.071 0.075
12 0.173 0.262 0.073 0.078 24 0.077 0.061 0.096 0.093 48 0.052 0.065 0.123 0.137
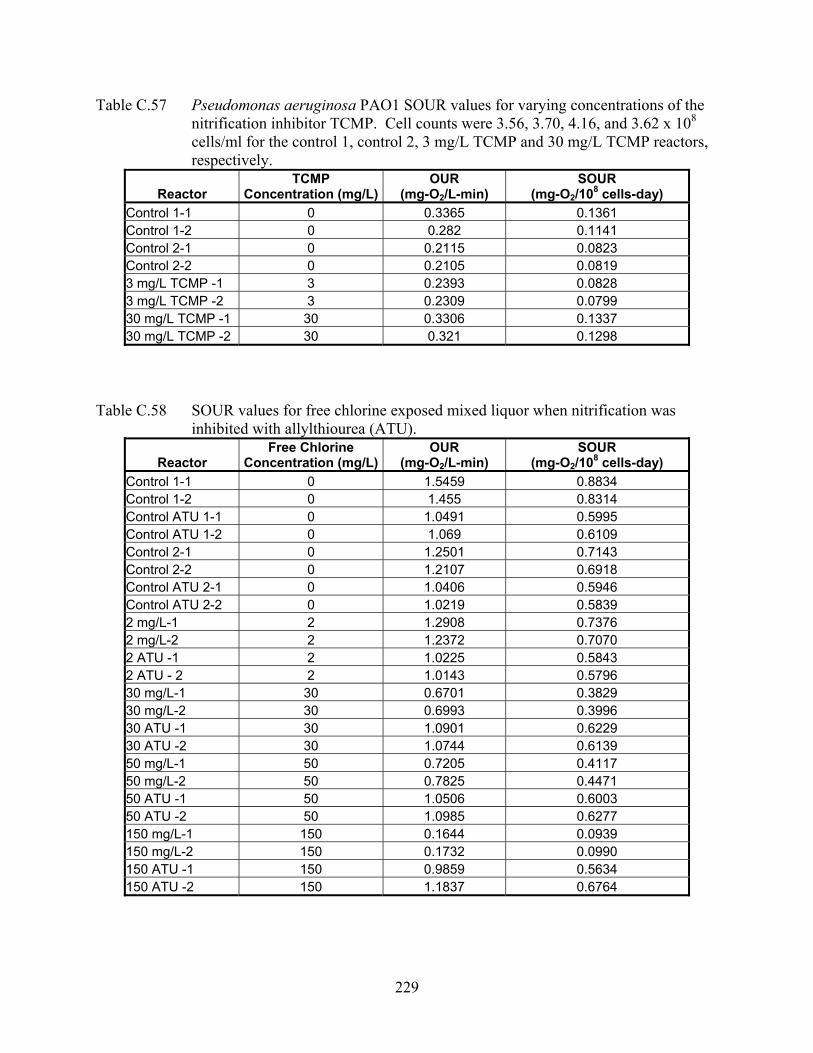
229
Table C.57 Pseudomonas aeruginosa PAO1 SOUR values for varying concentrations of the nitrification inhibitor TCMP. Cell counts were 3.56, 3.70, 4.16, and 3.62 x 10⁸ cells/ml for the control 1, control 2, 3 mg/L TCMP and 30 mg/L TCMP reactors, respectively.
Reactor TCMP
Concentration (mg/L)OUR
(mg-O2/L-min) SOUR
(mg-O2/108 cells-day) Control 1-1 0 0.3365 0.1361 Control 1-2 0 0.282 0.1141 Control 2-1 0 0.2115 0.0823 Control 2-2 0 0.2105 0.0819 3 mg/L TCMP -1 3 0.2393 0.0828 3 mg/L TCMP -2 3 0.2309 0.0799 30 mg/L TCMP -1 30 0.3306 0.1337 30 mg/L TCMP -2 30 0.321 0.1298
Table C.58 SOUR values for free chlorine exposed mixed liquor when nitrification was inhibited with allylthiourea (ATU).
Reactor Free Chlorine
Concentration (mg/L)OUR
(mg-O2/L-min) SOUR
(mg-O2/108 cells-day) Control 1-1 0 1.5459 0.8834 Control 1-2 0 1.455 0.8314 Control ATU 1-1 0 1.0491 0.5995 Control ATU 1-2 0 1.069 0.6109 Control 2-1 0 1.2501 0.7143 Control 2-2 0 1.2107 0.6918 Control ATU 2-1 0 1.0406 0.5946 Control ATU 2-2 0 1.0219 0.5839 2 mg/L-1 2 1.2908 0.7376 2 mg/L-2 2 1.2372 0.7070 2 ATU -1 2 1.0225 0.5843 2 ATU - 2 2 1.0143 0.5796 30 mg/L-1 30 0.6701 0.3829 30 mg/L-2 30 0.6993 0.3996 30 ATU -1 30 1.0901 0.6229 30 ATU -2 30 1.0744 0.6139 50 mg/L-1 50 0.7205 0.4117 50 mg/L-2 50 0.7825 0.4471 50 ATU -1 50 1.0506 0.6003 50 ATU -2 50 1.0985 0.6277 150 mg/L-1 150 0.1644 0.0939 150 mg/L-2 150 0.1732 0.0990 150 ATU -1 150 0.9859 0.5634 150 ATU -2 150 1.1837 0.6764

230
Appendix D: Data from Chapter 6
Table D.1 MLSS and MLVSS values for enrichment and mixed liquor cultures exposed to NEM. Culture MLSS (mg/L) MLVSS (mg/L)
Enrichment Culture 1744 1692 1660 1648 1596 1564 Mixed Liquor 1640 1648 1612 1356 1372 1340
Table D.2 Soluble potassium data for enrichment culture. Values are for the enrichment cultures shocked with 50 mg/L NEM. Trial 1 is shown in Figure 6.1, Trial 2 is repeat of the experiment.
TRIAL 1 Time Enrichment Control Enrichment NEM Shock
(minutes) (mg/L) (mg/L) 0 9.67 9.69 9.74 9.98 10.08 10.04
2.5 9.63 9.64 9.71 10.53 10.57 10.42 5 10.11 10.06 10.04 10.83 10.9 10.91
7.5 10.02 10.13 10.06 10.52 10.57 10.57 10 9.62 9.6 9.58 10.9 11.02 10.93 15 10.38 10.23 10.48 10.85 10.87 10.92 20 10.72 10.73 10.68 11.01 10.94 11.1
TRIAL 2 Time Enrichment Control Enrichment NEM Shock
(minutes) (mg/L) (mg/L) 0 9.78 9.83 9.83 9.28 9.37 9.4
2.5 9.92 9.99 9.98 10.58 10.59 10.65 5 11.98 11.99 12.01 10.74 10.77 10.62
7.5 9.16 9.12 9.15 10.56 10.52 10.45 10 9.55 9.57 9.52 10.99 11.07 11.06 15 9.38 9.46 9.44 10.71 10.81 10.81 20 9.9 9.79 9.92 11.04 11.07 11.03

231
Table D.3 Soluble potassium data for mixed liquor culture. Values are for the mixed liquor cultures shocked with 50 mg/L NEM. Trial 1 is shown in Figure 6.1, Trial 2 is repeat of the experiment.
TRIAL 1 Time Mixed Liquor Control Mixed Liquor NEM Shock
(minutes) (mg/L) (mg/L) 0 9.02 9.11 9.04 9.05 8.92 9.04
2.5 9.16 9.17 9.25 10.18 10.13 10.2 5 9.21 9.24 9.18 10.38 10.32 10.38
10 9.07 9.07 9.07 10.47 10.52 10.49 15 9.27 9.17 9.29 10.77 10.81 10.78 20 9.17 9.13 9.17 11.26 11.26 11.42
TRIAL 2 Time Mixed Liquor Control Mixed Liquor NEM Shock
(minutes) (mg/L) (mg/L) 0 9.22 9.19 9.21 9.15 9.03 9
2.5 8.91 8.99 8.96 10.04 9.91 10.03 5 9.52 9.31 9.23 10.39 10.44 10.5
10 9.45 9.42 9.48 11.05 10.91 10.98 15 8.83 8.79 8.89 10.68 10.64 10.75 20 8.98 9.07 9.03 11.14 11.33 11.25

232
Table D.4 Floc-associated potassium data for enrichment culture. Values are for the enrichment cultures shocked with 50 mg/L NEM.
TRIAL 1 Time Enrichment Control Enrichment NEM Shock
(minutes) (mg/g MLVSS) (mg/g MLVSS) 0 4.33 4.36 4.35 3.92 3.90 3.90
2.5 3.95 3.97 3.97 3.18 3.18 3.19 5 3.71 3.70 3.74 2.82 2.83 2.80
7.5 3.71 3.71 3.71 2.84 2.85 2.86 10 3.70 3.73 3.73 2.70 2.69 2.63 15 3.41 3.38 3.39 2.53 2.54 2.56 20 3.62 3.60 3.66 2.39 2.37 2.39
TRIAL 2 Time Enrichment Control Enrichment NEM Shock
(minutes) (mg/g MLVSS) (mg/g MLVSS) 0 3.69 3.72 3.70 3.67 3.70 3.72
2.5 4.97 4.98 4.97 2.77 2.78 2.76 5 3.76 3.77 3.83 2.23 2.23 2.24
7.5 3.93 3.96 3.93 2.82 2.83 2.84 10 3.88 3.90 3.89 2.27 2.28 2.29 15 3.71 3.70 3.70 2.59 2.59 2.58 20 1.67 1.63 1.69 2.48 2.49 2.46
Table D.5 Floc associated potassium data for mixed liquor culture. Values are for the mixed liquor cultures shocked with 50 mg/L NEM.
TRIAL 1 Time Mixed Liquor Control Mixed Liquor NEM Shock
(minutes) (mg/g MLVSS) (mg/g MLVSS) 0 7.06 6.97 7.01 6.98 6.96 6.98
2.5 7.00 7.00 7.05 6.16 6.14 6.17 5 7.09 7.15 7.09 6.16 6.06 6.06 10 7.11 7.15 7.07 5.76 5.66 5.70 15 6.70 6.71 6.72 5.72 5.71 5.67 20 7.28 7.27 7.31 7.10 7.08 7.09
TRIAL 2 Time Mixed Liquor Control Mixed Liquor NEM Shock
(minutes) (mg/g MLVSS) (mg/g MLVSS) 0 6.90 6.93 6.86 6.95 7.02 7.03
2.5 7.16 7.15 7.13 5.98 5.98 5.88 5 7.11 7.15 7.18 5.79 5.80 5.75 10 7.05 7.07 7.10 5.54 5.57 5.49 15 6.78 6.81 6.74 5.46 5.51 5.47 20 7.24 7.31 7.35 7.54 7.51 7.45

233
Table D.6 Floc-associated potassium data for enrichment culture. Values are for the
enrichment cultures shocked with 50 mg/L NEM. TRIAL 1
Time Enrichment Control Enrichment NEM Shock (minutes) (mg/L) (mg/L)
0 15.14 15.18 15.21 14.91 14.85 15 2.5 14.59 14.75 14.71 14.36 14.2 14.39 5 14.45 14.56 14.55 14.52 14.58 14.64
7.5 14.61 14.61 14.61 13.77 13.77 13.74 10 14.65 14.61 14.65 15.44 15.54 15.65 15 14.38 14.62 14.42 14.1 14.09 14.21 20 14.83 14.98 15 14.54 14.48 14.48
TRIAL 2 Time Enrichment Control Enrichment NEM Shock
(minutes) (mg/L) (mg/L) 0 14.51 14.65 14.65 14.74 14.88 14.78
2.5 14.53 14.67 14.64 15.22 15.19 15.255 14.91 14.91 15.07 14.41 14.42 14.42
7.5 15.76 15.7 16.03 14.93 14.97 14.9310 14.91 14.94 14.86 13.96 13.9 13.9115 14.89 15.11 15.13 14.9 14.85 14.8120 14.92 14.77 14.81 14.06 14.06 14.07
Table D.7 Floc associated potassium data for mixed liquor culture. Values are for the mixed liquor cultures shocked with 50 mg/L NEM.
TRIAL 1 Time Mixed Liquor Control Mixed Liquor NEM Shock
(minutes) (mg/L) (mg/L) 0 17.91 18.03 18.01 20.36 20.27 20.5
2.5 17.34 17.21 17.31 19.93 19.86 19.7 10 17.68 17.62 17.63 17.8 17.59 17.53 15 17.2 17.24 17.32 20 17.44 17.38 17.33
TRIAL 2 Time Mixed Liquor Control Mixed Liquor NEM Shock
(minutes) (mg/L) (mg/L) 0 17.98 17.86 17.8 16.52 16.73 16.61
2.5 18.87 18.76 18.69 17.36 17.37 17.53 10 17.39 17.48 17.53 17.28 17.28 17.45 15 17.46 17.33 17.36 20 17.52 17.53 17.63 17.24 17.32 17.29

234
Table D.8 Soluble potassium data for N. europaea NEM experiments presented in Figure
6.2. Time Reactor Soluble Potassium Soluble Potassium
(minutes) (mg/L) (mg/L) 0 Control 5.87 5.72
15 Control 5.82 5.98 45 Control 5.95 6.22 90 Control 5.79 6.29 180 Control 6.46 6.01
0 NEM 50 mg/L 5.92 5.83 15 NEM 50 mg/L 6.16 6.22 45 NEM 50 mg/L 5.14 6.23 90 NEM 50 mg/L 6.34 6.4 180 NEM 50 mg/L 7.95 7.45
0 Nigericin 74.7 mg/L 6.01 5.89 15 Nigericin 74.7 mg/L 6.71 7.69 45 Nigericin 74.7 mg/L 6.97 6.97 90 Nigericin 74.7 mg/L 7.22 7.01 180 Nigericin 74.7 mg/L 8.31 8.24
Table D.9 Soluble potassium data for N. europaea NEM experiment repeat. Time Reactor Soluble Potassium Soluble Potassium
(minutes) (mg/L) (mg/L) 0 Control 11.76 12.03
10 Control 11.59 11.98 30 Control 12.48 12.23 60 Control 12.36 12.38 90 Control 12.56 12.53 0 NEM 50 mg/L 11.5 11.43
10 NEM 50 mg/L 11.6 11.9 30 NEM 50 mg/L 12.02 12.16 60 NEM 50 mg/L 12.03 12.51 90 NEM 50 mg/L 12.62 12.34

235
Table D.10 Soluble potassium data for Ni. moscoviensis NEM experiments presented in Figure 6.3. Time Reactor Soluble Potassium Soluble Potassium
(minutes) (mg/L) (mg/L) 0 Control 2.33 2.21
15 Control 1.61 1.51 45 Control 1.44 1.44 90 Control 1.79 180 Control 2.2 1.94
0 NEM 50 mg/L 2.03 1.94 15 NEM 50 mg/L 2.48 2.67 45 NEM 50 mg/L 2.5 2.7 90 NEM 50 mg/L 2.62 2.6 180 NEM 50 mg/L 3.75 3.85
0 Nigericin 74.7 mg/L 2.04 2.24 15 Nigericin 74.7 mg/L 3.36 3.63 45 Nigericin 74.7 mg/L 3.44 3.34 90 Nigericin 74.7 mg/L 3.44 3.39 180 Nigericin 74.7 mg/L 4.01 4.45
Table D.11 Soluble potassium data for Ni. moscoviensis NEM experiment repeat.
Time Reactor Soluble Potassium Soluble Potassium (minutes) (mg/L) (mg/L)
0 Control 4.53 15 Control 4.59 4.58 45 Control 4.6 4.62 90 Control 4.83 180 Control 5.65 5.78
0 NEM 50 mg/L 4.55 15 NEM 50 mg/L 4.52 4.54 45 NEM 50 mg/L 4.68 4.59 90 NEM 50 mg/L 4.82 4.88 180 NEM 50 mg/L 5.93 5.99
0 Nigericin 74.7 mg/L 4.57 15 Nigericin 74.7 mg/L 4.76 4.77 45 Nigericin 74.7 mg/L 4.89 4.88 90 Nigericin 74.7 mg/L 4.95 5.01 180 Nigericin 74.7 mg/L 6.03 5.92
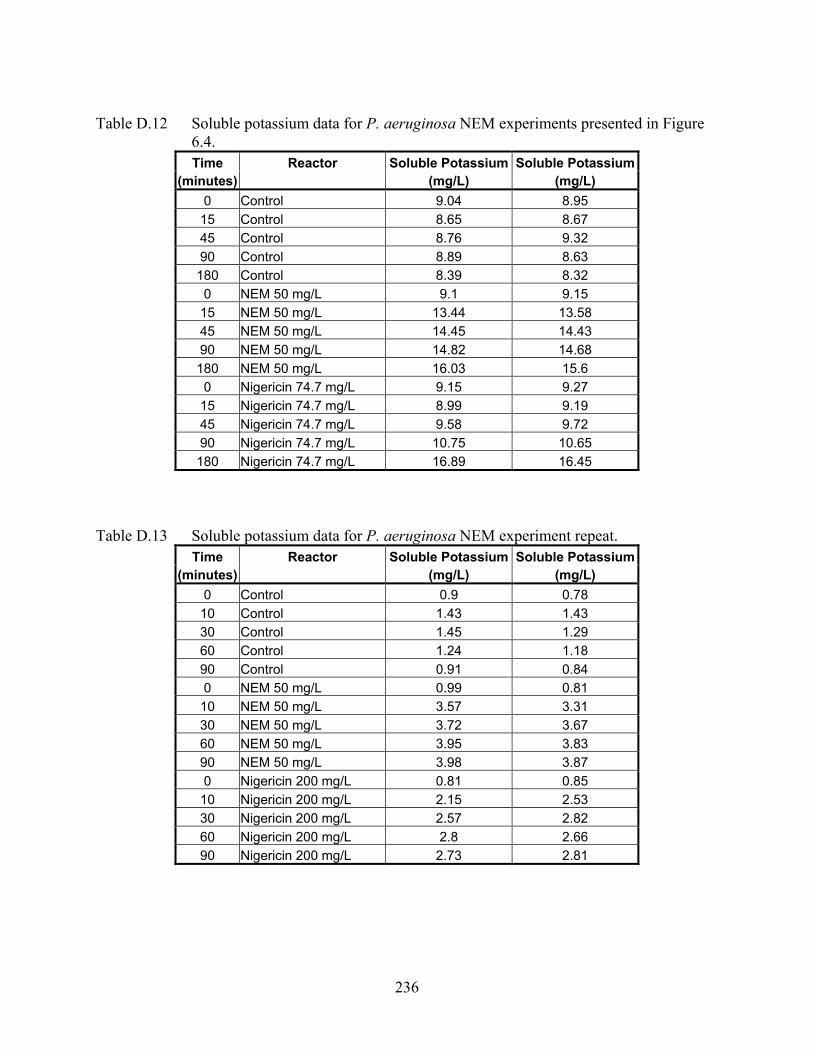
236
Table D.12 Soluble potassium data for P. aeruginosa NEM experiments presented in Figure
6.4. Time Reactor Soluble Potassium Soluble Potassium
(minutes) (mg/L) (mg/L) 0 Control 9.04 8.95
15 Control 8.65 8.67 45 Control 8.76 9.32 90 Control 8.89 8.63 180 Control 8.39 8.32
0 NEM 50 mg/L 9.1 9.15 15 NEM 50 mg/L 13.44 13.58 45 NEM 50 mg/L 14.45 14.43 90 NEM 50 mg/L 14.82 14.68 180 NEM 50 mg/L 16.03 15.6
0 Nigericin 74.7 mg/L 9.15 9.27 15 Nigericin 74.7 mg/L 8.99 9.19 45 Nigericin 74.7 mg/L 9.58 9.72 90 Nigericin 74.7 mg/L 10.75 10.65 180 Nigericin 74.7 mg/L 16.89 16.45
Table D.13 Soluble potassium data for P. aeruginosa NEM experiment repeat.
Time Reactor Soluble Potassium Soluble Potassium (minutes) (mg/L) (mg/L)
0 Control 0.9 0.78 10 Control 1.43 1.43 30 Control 1.45 1.29 60 Control 1.24 1.18 90 Control 0.91 0.84 0 NEM 50 mg/L 0.99 0.81
10 NEM 50 mg/L 3.57 3.31 30 NEM 50 mg/L 3.72 3.67 60 NEM 50 mg/L 3.95 3.83 90 NEM 50 mg/L 3.98 3.87 0 Nigericin 200 mg/L 0.81 0.85
10 Nigericin 200 mg/L 2.15 2.53 30 Nigericin 200 mg/L 2.57 2.82 60 Nigericin 200 mg/L 2.8 2.66 90 Nigericin 200 mg/L 2.73 2.81

237
Table D.14 Live/Dead stain results for N. europaea, Ni. moscoviensis, and P. aeruginosa
NEM potassium efflux experiments. Numbers indicate the number of cells. Reactor N. europaea N. moscoviensis P. aeruginosa
Live Results Control 1 35 4 201 Control 2 36 3 159 Control 3 71 16 193 NEM 1 46 6 165 NEM 2 33 5 198 NEM 3 38 6 228 Nigericin 1 60 6 153 Nigericin 2 41 7 109 Nigericin 3 51 5 77
Dead Results Control 1 8 2 1 Control 2 2 1 4 Control 3 4 4 2 NEM 1 2 2 4 NEM 2 1 2 3 NEM 3 4 3 6 Nigericin 1 0 1 5 Nigericin 2 0 2 3 Nigericin 3 1 5 3
Total Percent Live Control 91.0 76.7 98.8 NEM 94.4 70.8 97.8 Nigericin 99.3 69.2 96.9

238
Table D.15 Soluble potassium data for N. europaea chlorine experiments presented in Figure
6.5. Time Reactor 1 Reactor 2 Reactor 3
(minutes) Reactor (mg K+/L) (mg K+/L) (mg K+/L) 0 Control 3.53 3.39 15 Control 3.6 3.57 30 Control 3.57 3.52 60 Control 3.72 3.85 90 Control 3.76 3.64 0 Cl2 1 mg/L 3.48 3.45 3.5 15 Cl2 1 mg/L 3.46 3.42 3.64 30 Cl2 1 mg/L 3.47 3.54 3.54 60 Cl2 1 mg/L 3.79 3.82 3.87 90 Cl2 1 mg/L 3.68 3.69 3.68 0 Cl2 5 mg/L 3.59 3.58 3.44 15 Cl2 5 mg/L 3.58 3.51 3.42 30 Cl2 5 mg/L 3.59 3.53 3.69 60 Cl2 5 mg/L 3.84 3.77 3.83 90 Cl2 5 mg/L 3.86 3.74 3.85
Table D.16 Soluble potassium data for P. aeruginosa chlorine experiments presented in
Figure 6.6. Time Reactor 1 Reactor 2 Reactor 3
(minutes) Reactor (mg K+/L) (mg K+/L) (mg K+/L) 0 Control 4.32 4.23
15 Control 3.69 3.76 30 Control 3.41 3.44 60 Control 3.1 3.22 90 Control 3.03 3 0 Cl2 1 mg/L 4.37 4.23 4.42
15 Cl2 1 mg/L 4.71 4.62 4.73 30 Cl2 1 mg/L 5.01 4.92 5.07 60 Cl2 1 mg/L 90 Cl2 1 mg/L 5.03 5.1 5.11 0 Cl2 5 mg/L 4.46 4.42 4.38
15 Cl2 5 mg/L 7.5 7.58 7.43 30 Cl2 5 mg/L 7.88 7.76 7.75 60 Cl2 5 mg/L 8.35 8 8.19 90 Cl2 5 mg/L 8.28 8.23 8.42

239
Table D.17 Live/Dead stain results for N. europaea and P. aeruginosa potassium efflux
experiments with chlorine bleach. Numbers indicate the number of cells. Reactor N. europaea P. aeruginosa
Live Cells Control 1 20 29 Control 2 14 26 Control 3 18 22 1 mg/L Cl2 1 15 1 mg/L Cl2 2 18 28 1 mg/L Cl2 3 16 37 5 mg/L Cl2 1 24 15 5 mg/L Cl2 2 33 22 5 mg/L Cl2 3 25 23
Dead Cells Control 1 5 1 Control 2 4 1 Control 3 4 1 1 mg/L Cl2 1 2 1 mg/L Cl2 2 5 2 1 mg/L Cl2 3 3 1 5 mg/L Cl2 1 4 2 5 mg/L Cl2 2 10 1 5 mg/L Cl2 3 8 2
Total Percent Live Control 79.9 96.2 1 mg/L Cl2 83.6 95.4 5 mg/L Cl2 79.4 92.0

240
Table D.18 Glutathione results for N. europaea experiments with chlorine bleach presented in Figures 6.7 and 6.8.
Oxidized
Glutathione Oxidized
Glutathione Total Glutathione Free Chlorine Sample 1 Sample 2
(mg/L) (nmoles/1010 cells) (nmoles/1010 cells) (nmoles/1010 cells)0 0.188 0.184 7.00 1 0.163 0.198 12.55 5 0.192 0.200 13.43 10 0.203 0.212 9.82 25 0.226 0.250 6.44
200 mg/L
Chloramphenicol 0.189 0.195 8.73 Table D.19 Glutathione results for N. europaea repeat experiments with chlorine bleach.
Oxidized
Glutathione Oxidized
Glutathione Total Glutathione Total GlutathioneFree Chlorine Sample 1 Sample 2 Sample 1 Sample 2
(mg/L) (nmoles/1010 cells) (nmoles/1010 cells) (nmoles/1010 cells) (nmoles/1010 cells)0 0.100 8.42 13.44 1 0.106 0.142 7.07 7.54 5 0.106 0.152 6.11 12.74 10 0.117 0.165 5.07 13.91 25 0.138 0.174 13.38 3.92
Table D.20 Glutathione results for N. europaea experiments with NEM.
Oxidized
Glutathione Oxidized
Glutathione Total Glutathione Total GlutathioneNEM Sample 1 Sample 2 Sample 1 Sample 2
(mg/L) (nmoles/1010 cells) (nmoles/1010 cells) (nmoles/1010 cells) (nmoles/1010 cells)0 0.100 0.160 8.42 13.44 10 0.061 0.135 6.66 4.27 50 0.051 0.135 6.88
100 0.071 0.137 2.58 4.05 200 0.083 0.123 4.30 8.01

241
Table D.21 Glutathione results for P. aeruginosa experiments with chlorine bleach presented
in Figures 6.7 and 6.8.
Oxidized
Glutathione Oxidized
Glutathione Total Glutathione Free Chlorine Sample 1 Sample 2
(mg/L) (nmoles/1010 cells) (nmoles/1010 cells) (nmoles/1010 cells)0 0.143 0.140 12.15 1 0.145 0.148 10.74 5 0.153 0.164 13.02 10 0.176 0.216 13.76 25 0.170 0.165 7.23
200 mg/L
Chloramphenicol 0.170 0.178 10.14 Table D.22 Glutathione results for P. aeruginosa repeat experiments with chlorine bleach.
Oxidized
Glutathione Oxidized
Glutathione Total Glutathione Total GlutathioneFree Chlorine Sample 1 Sample 2 Sample 1 Sample 2
(mg/L) (nmoles/1010 cells) (nmoles/1010 cells) (nmoles/1010 cells) (nmoles/1010 cells)0 0.079 0.143 6.10 7.12 1 0.080 0.175 8.33 6.99 5 0.104 0.179 12.94 13.32 10 0.110 4.50 7.91 25 0.258 17.96 8.48
Table D.23 Glutathione results for P. aeruginosa experiments with NEM.
Oxidized
Glutathione Oxidized
Glutathione Total Glutathione Total GlutathioneNEM Sample 1 Sample 2 Sample 1 Sample 2
(mg/L) (nmoles/1010 cells) (nmoles/1010 cells) (nmoles/1010 cells) (nmoles/1010 cells)0 0.079 0.143 6.10 7.12 10 0.083 0.123 7.46 9.47 50 0.085 0.238 5.73 7.59
100 0.089 0.138 5.49 3.10 200 0.123 0.139 4.77 6.52

242
Appendix E: Data from Chapter 7
Table E.1 Saturated fatty acids concentrations for N. europaea cells exposed to 1-octanol (Trial 1).
Time C 14:0 C 16:0 C 18:0 C 20:0 Reactor (minutes) mg/L-1 mg/L-2 mg/L-1 mg/L-2 mg/L-1 mg/L-2 mg/L-1 mg/L-2
0 0.102 0.084 24.248 25.445 0.366 0.318 0.011 0.026 2 0.090 0.123 25.037 23.760 0.327 0.330 0.017 0.023 10 0.094 0.099 24.999 24.762 0.312 0.316 0.016 0.018 30 0.082 0.088 23.864 24.682 0.294 0.308 0.013 0.011 60 0.095 0.088 27.210 25.099 0.332 0.315 0.018 0.012
Control
240 0.156 0.160 44.518 46.096 0.520 0.498 0.017 0.018
0 0.095 0.081 24.749 25.790 0.350 0.318 0.016 0.030 2 0.088 0.090 25.248 24.040 0.343 0.309 0.024 0.024 10 0.085 0.087 26.074 25.532 0.321 0.323 0.017 0.009 30 0.081 0.092 23.160 24.657 0.296 0.315 0.013 0.010 60 0.090 0.101 24.875 26.457 0.321 0.338 0.012 0.018
5 mg/L Octanol
240 0.140 0.160 37.941 33.587 0.424 0.444 0.014 0.027
0 0.082 0.093 25.033 23.309 0.302 0.403 0.012 0.013 2 0.088 0.082 25.436 24.809 0.332 0.324 0.018 0.012 10 0.091 0.092 24.261 24.750 0.295 0.319 0.012 0.013 30 0.085 0.093 23.669 26.318 0.304 0.285 0.013 0.016 60 0.097 0.098 27.267 26.571 0.348 0.327 0.010 0.009
50 mg/L Octanol
240 0.146 0.157 34.577 37.151 0.393 0.444 0.019 0.017
0 0.085 0.086 23.001 23.874 0.294 0.296 0.012 0.022 2 0.090 0.095 23.401 24.540 0.297 0.311 0.020 0.005 10 0.087 0.076 24.892 21.957 0.325 0.270 0.008 0.006 30 0.095 0.096 26.628 26.339 0.337 0.342 0.008 0.014 60 0.110 0.090 27.479 24.140 0.347 0.314 0.010 0.008
200 mg/L Octanol
240 0.164 0.165 37.903 40.032 0.473 0.481 0.023 0.017

243
Table E.2 C18 Unsaturated fatty acids concentrations for N. europaea cells exposed to 1-octanol (Trial 1).
Time C 18:1 trans C 18:1 cis C 18:2 trans C 18:2 cis Reactor (minutes) mg/L-1 mg/L-2 mg/L-1 mg/L-2 mg/L-1 mg/L-2 mg/L-1 mg/L-2
0 0.009 0.015 0.498 0.559 0.008 0.019 0.532 0.7292 0.037 0.032 0.542 0.539 0.022 0.015 0.649 0.65610 0.036 0.034 0.589 0.548 0.012 0.013 0.710 0.69330 0.035 0.035 0.518 0.553 0.017 0.010 0.669 0.71460 0.041 0.036 0.575 0.511 0.020 0.016 0.738 0.621
Control
240 0.079 0.060 0.820 0.818 0.019 0.013 0.897 0.942
0 0.028 0.033 0.550 0.578 0.021 0.020 0.671 0.7512 0.034 0.034 0.583 0.552 0.019 0.015 0.718 0.68010 0.028 0.583 0.545 0.022 0.015 0.755 0.73630 0.041 0.034 0.533 0.538 0.020 0.021 0.658 0.70060 0.027 0.542 0.585 0.017 0.018 0.704 0.759
5 mg/L Octanol
240 0.053 0.758 0.636 0.033 0.011 0.892 0.800
0 0.026 0.043 0.561 0.638 0.013 0.005 0.718 0.7302 0.030 0.038 0.554 0.549 0.011 0.014 0.744 0.72910 0.022 0.531 0.545 0.025 0.011 0.678 0.68530 0.039 0.040 0.523 0.572 0.018 0.014 0.657 0.71760 0.033 0.031 0.573 0.563 0.018 0.011 0.764 0.725
50 mg/L Octanol
240 0.055 0.044 0.647 0.706 0.028 0.040 0.848 0.890
0 0.032 0.027 0.512 0.503 0.015 0.016 0.649 0.6372 0.025 0.031 0.533 0.546 0.008 0.015 0.654 0.67210 0.034 0.030 0.568 0.524 0.012 0.014 0.687 0.59330 0.025 0.041 0.591 0.630 0.015 0.018 0.747 0.75460 0.036 0.033 0.690 0.564 0.012 0.010 0.770 0.655
200 mg/L Octanol
240 0.037 0.046 0.611 0.682 0.013 0.028 0.700 0.786
Table E.3 Nitrite concentrations over time for N. europaea cells exposed to 1-octanol (Trial 1).
Time (min.) Control 1 Control 2
5 mg/L Octanol 1
5 mg/L Octanol 2
50 mg/L Octanol 1
50 mg/L Octanol 2
200 mg/L Octanol 1
200 mg/L Octanol 2
0 29.0 29.7 30.0 30.5 24.9 24.3 11.7 11.62 15.8 17.0 26.4 26.4 22.8 23.5 26.2 27.8
10 30.7 30.6 29.9 29.8 30.2 32.7 27.9 23.630 70.4 70.2 43.0 43.0 43.5 47.3 31.0 29.860 98.0 98.0 59.8 59.5 69.1 69.5 33.6
240 740.7 733.2 827.1 822.7 414.0 409.0 375.9 378.6
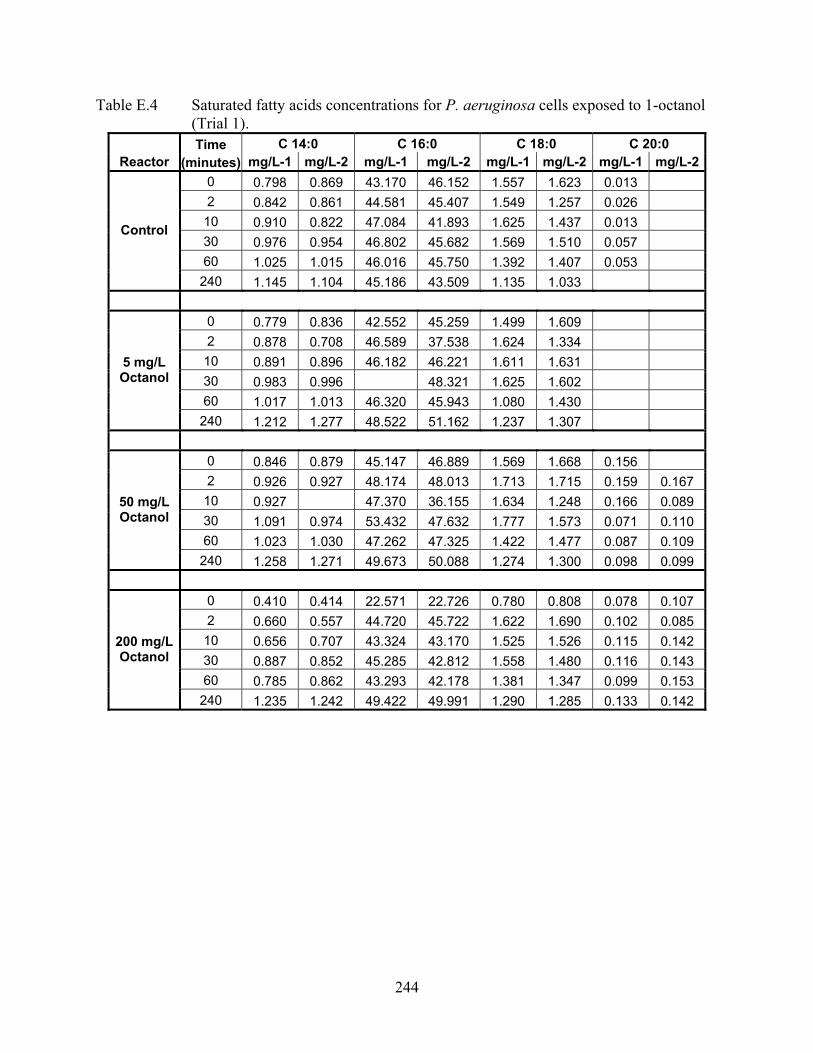
244
Table E.4 Saturated fatty acids concentrations for P. aeruginosa cells exposed to 1-octanol (Trial 1).
Time C 14:0 C 16:0 C 18:0 C 20:0 Reactor (minutes) mg/L-1 mg/L-2 mg/L-1 mg/L-2 mg/L-1 mg/L-2 mg/L-1 mg/L-2
0 0.798 0.869 43.170 46.152 1.557 1.623 0.013 2 0.842 0.861 44.581 45.407 1.549 1.257 0.026 10 0.910 0.822 47.084 41.893 1.625 1.437 0.013 30 0.976 0.954 46.802 45.682 1.569 1.510 0.057 60 1.025 1.015 46.016 45.750 1.392 1.407 0.053
Control
240 1.145 1.104 45.186 43.509 1.135 1.033
0 0.779 0.836 42.552 45.259 1.499 1.609 2 0.878 0.708 46.589 37.538 1.624 1.334 10 0.891 0.896 46.182 46.221 1.611 1.631 30 0.983 0.996 48.321 1.625 1.602 60 1.017 1.013 46.320 45.943 1.080 1.430
5 mg/L Octanol
240 1.212 1.277 48.522 51.162 1.237 1.307
0 0.846 0.879 45.147 46.889 1.569 1.668 0.156 2 0.926 0.927 48.174 48.013 1.713 1.715 0.159 0.167 10 0.927 47.370 36.155 1.634 1.248 0.166 0.089 30 1.091 0.974 53.432 47.632 1.777 1.573 0.071 0.110 60 1.023 1.030 47.262 47.325 1.422 1.477 0.087 0.109
50 mg/L Octanol
240 1.258 1.271 49.673 50.088 1.274 1.300 0.098 0.099
0 0.410 0.414 22.571 22.726 0.780 0.808 0.078 0.107 2 0.660 0.557 44.720 45.722 1.622 1.690 0.102 0.085 10 0.656 0.707 43.324 43.170 1.525 1.526 0.115 0.142 30 0.887 0.852 45.285 42.812 1.558 1.480 0.116 0.143 60 0.785 0.862 43.293 42.178 1.381 1.347 0.099 0.153
200 mg/L Octanol
240 1.235 1.242 49.422 49.991 1.290 1.285 0.133 0.142

245
Table E.5 C18 Unsaturated fatty acids concentrations for P. aeruginosa cells exposed to 1-octanol (Trial 1).
Time C 18:1 trans C 18:1 cis C 18:2 trans C 18:2 cis Reactor (minutes) mg/L-1 mg/L-2 mg/L-1 mg/L-2 mg/L-1 mg/L-2 mg/L-1 mg/L-2
0 1.058 0.725 15.135 16.485 0.087 0.175 19.898 19.4482 0.826 0.806 16.308 16.762 0.228 0.266 18.575 19.31810 0.727 0.683 18.284 16.207 0.299 0.323 20.019 16.23430 0.941 0.706 20.410 20.407 0.157 0.299 19.805 19.59660 0.904 0.732 23.402 23.262 0.262 0.207 19.622 19.336
Control
240 2.107 1.070 31.189 30.889 0.189 0.226 21.354 21.008
0 0.530 0.286 15.138 16.362 0.246 0.331 17.286 18.9222 0.542 0.174 17.035 13.830 0.305 0.368 20.119 15.13510 0.573 0.215 17.414 17.792 0.331 0.450 19.802 18.94130 0.520 0.229 20.201 20.837 0.227 0.431 20.024 20.80060 0.476 0.241 22.606 22.773 0.335 0.448 20.852 20.474
5 mg/L Octanol
240 0.891 0.521 33.842 36.198 0.376 0.491 23.368 24.962
0 0.125 0.084 17.492 17.743 0.608 0.697 16.418 19.2972 0.155 0.081 18.936 18.328 0.532 1.138 20.366 20.38710 0.102 0.069 19.265 14.482 0.507 0.651 19.807 13.84530 0.119 0.092 24.048 21.448 0.566 0.657 21.867 20.06260 0.120 0.109 24.465 24.198 0.579 0.696 19.978 21.119
50 mg/L Octanol
240 0.179 0.138 37.261 37.522 0.705 0.867 23.571 24.053
0 0.043 0.054 8.022 8.050 0.562 0.660 9.524 9.433 2 0.087 0.085 15.938 15.749 0.956 1.536 19.410 18.68010 0.084 0.075 15.515 15.476 0.962 1.071 17.896 16.95730 0.071 0.082 16.605 15.481 0.925 0.949 20.376 19.40460 0.079 0.076 17.230 16.504 0.841 0.986 19.878 19.319
200 mg/L Octanol
240 0.130 0.128 31.673 31.993 1.092 1.237 23.230 24.149

246
Table E.6 Live/Dead stain results for N. europaea and P. aeruginosa membrane experiments (Trial 1). Values indicate the number of cells.
Reactor N. europaea P. aeruginosaLive Cells
Control 1 Control 2 Control 3 5 mg/L Octanol 1 5 mg/L Octanol 2 5 mg/L Octanol 3 50 mg/L Octanol 1 50 mg/L Octanol 2 50 mg/L Octanol 3 200 mg/L Octanol 1 200 mg/L Octanol 2 200 mg/L Octanol 3
Dead Cells Control 1 Control 2 Control 3 5 mg/L Octanol 1 5 mg/L Octanol 2 5 mg/L Octanol 3 50 mg/L Octanol 1 50 mg/L Octanol 2 50 mg/L Octanol 3 200 mg/L Octanol 1 200 mg/L Octanol 2 200 mg/L Octanol 3
Total Percent Live Control 5 mg/L Octanol 50 mg/L Octanol 200 mg/L Octanol

247
Table E.7 Saturated fatty acids concentrations for N. europaea cells exposed to 1-octanol (Trial 2).
Time C 14:0 C 16:0 C 18:0 C 20:0 Reactor (minutes) mg/L-1 mg/L-2 mg/L-1 mg/L-2 mg/L-1 mg/L-2 mg/L-1 mg/L-2
0 0.030 0.034 1.076 1.258 0.168 0.114 0.050 0.038 2 0.031 0.020 1.113 0.908 0.111 0.053 0.030 0.027 10 0.022 0.023 0.809 0.952 0.049 0.085 0.024 0.021 30 0.026 0.102 1.018 2.301 0.096 0.568 0.023 0.037 60 0.024 0.031 1.042 1.167 0.105 0.115 0.014 0.019
Control
180 0.034 0.032 1.282 1.246 0.064 0.105 0.011 0.023
0 0.062 0.032 1.216 1.004 0.213 0.092 0.017 0.005 2 0.023 0.107 1.085 2.671 0.078 0.833 0.014 0.047 10 0.036 0.033 1.334 1.039 0.220 0.190 0.028 0.019 30 0.063 0.066 1.146 1.324 0.102 0.121 0.016 0.026 60 0.033 0.025 1.016 0.976 0.088 0.077 0.024 0.021
5 mg/L Octanol
180 0.026 0.027 1.211 1.477 0.105 0.164 0.019 0.021
0 0.022 0.019 1.089 0.922 0.055 0.136 0.000 0.002 2 0.022 0.022 1.087 1.236 0.146 0.120 0.001 0.002 10 0.021 0.017 1.087 0.752 0.088 0.066 0.000 0.001 30 0.026 0.023 1.089 1.009 0.058 0.076 0.001 60 0.023 0.024 1.022 0.994 0.104 0.054 0.002
50 mg/L Octanol
180 0.029 0.043 1.428 1.630 0.130 0.155 0.000 0.002
0 0.022 0.019 0.842 1.055 0.101 0.103 0.002 0.002 2 0.044 0.026 1.476 1.154 0.222 0.093 0.001 10 0.023 0.024 0.893 1.106 0.087 0.079 0.000 30 0.030 0.026 1.258 1.314 0.152 0.103 60 0.028 0.024 1.015 0.938 0.111 0.152 0.002
200 mg/L Octanol
180 0.047 0.039 1.612 1.474 0.126 0.144 0.002 0.001

248
Table E.8 C18 Unsaturated fatty acids concentrations for N. europaea cells exposed to 1-octanol (Trial 2).
Time C 18:1 trans C 18:1 cis C 18:2 trans C 18:2 cis Reactor (minutes) mg/L-1 mg/L-2 mg/L-1 mg/L-2 mg/L-1 mg/L-2 mg/L-1 mg/L-2
0 0.055 0.018 0.387 0.373 0.018 0.016 0.582 0.6732 0.059 0.023 0.371 0.283 0.016 0.012 0.596 0.52310 0.025 0.027 0.246 0.294 0.009 0.007 0.462 0.54530 0.031 0.200 0.337 0.464 0.011 0.017 0.578 0.69060 0.031 0.053 0.339 0.423 0.009 0.013 0.524 0.631
Control
180 0.050 0.043 0.541 0.537 0.007 0.011 0.727 0.658
0 0.029 0.045 0.403 0.340 0.022 0.009 0.582 0.5662 0.054 0.290 0.344 0.483 0.013 0.013 0.615 0.47410 0.046 0.015 0.435 0.333 0.015 0.011 0.659 0.50030 0.027 0.031 0.397 0.462 0.014 0.017 0.539 0.63160 0.069 0.389 0.352 0.012 0.007 0.545 0.545
5 mg/L Octanol
180 0.031 0.043 0.539 0.732 0.018 0.017 0.654 0.891
0 0.025 0.018 0.380 0.298 0.008 0.003 0.673 0.4662 0.031 0.019 0.353 0.389 0.009 0.007 0.565 0.68410 0.018 0.012 0.355 0.233 0.009 0.008 0.639 0.43130 0.045 0.364 0.342 0.013 0.006 0.583 0.59360 0.024 0.015 0.335 0.332 0.010 0.009 0.525 0.477
50 mg/L Octanol
180 0.047 0.027 0.594 0.676 0.015 0.014 0.757 0.892
0 0.019 0.021 0.267 0.354 0.004 0.463 0.6062 0.073 0.023 0.431 0.369 0.006 0.007 0.640 0.66610 0.022 0.023 0.297 0.368 0.007 0.006 0.512 0.60030 0.017 0.039 0.406 0.435 0.012 0.012 0.715 0.77060 0.016 0.013 0.347 0.397 0.009 0.013 0.541 0.528
200 mg/L Octanol
180 0.021 0.018 0.618 0.570 0.010 0.013 0.838 0.741
Table E.9 Nitrite concentrations over time for N. europaea cells exposed to 1-octanol (Trial 2).
Time (min.) Control 1 Control 2
5 mg/L Octanol 1
5 mg/L Octanol 2
50 mg/L Octanol 1
50 mg/L Octanol 2
200 mg/L Octanol 1
200 mg/L Octanol 2
0 0.23 0.22 0.20 0.21 0.20 0.22 0.20 0.22 2 0.28 0.21 0.20 0.23 0.20 0.24 0.20 0.22
10 0.25 0.20 0.20 0.23 0.20 0.23 0.20 0.22 30 0.23 0.21 0.21 0.23 0.22 0.22 0.21 0.24 60 0.30 0.22 0.20 0.24 0.21 0.25 0.23 0.25
180 0.33 0.35 0.29 0.27 0.26 0.32 0.33 0.37

249
Table E.10 Saturated fatty acids concentrations for P. aeruginosa cells exposed to 1-octanol (Trial 2).
Time C 14:0 C 16:0 C 18:0 C 20:0 Reactor (minutes) mg/L-1 mg/L-2 mg/L-1 mg/L-2 mg/L-1 mg/L-2 mg/L-1 mg/L-2
0 0.651 0.563 42.786 36.611 1.656 1.337 0.034 0.032 2 0.437 0.460 28.744 29.997 1.118 1.174 0.031 0.045 10 0.580 0.525 37.555 34.115 1.513 1.364 0.042 0.039 30 0.533 0.487 34.023 31.581 1.402 1.349 0.053 0.051 60 0.571 0.672 36.424 43.175 1.603 1.879 0.050 0.055
Control
180 0.645 0.586 39.488 36.717 1.854 1.762 0.083 0.089
0 0.620 0.588 40.491 37.556 1.822 1.767 0.096 0.066 2 0.496 0.631 32.438 41.131 1.475 1.895 0.064 0.099 10 0.609 0.632 38.903 40.941 1.932 2.043 0.125 0.180 30 0.541 0.648 34.915 41.570 1.797 2.082 0.138 0.129 60 0.575 0.647 36.609 40.510 1.958 2.233 0.181 0.169
5 mg/L Octanol
180 0.733 0.719 45.274 44.676 2.678 2.639 0.282 0.289
0 2 10 0.656 0.904 41.544 41.073 1.634 1.596 0.065 0.037 30 0.659 0.642 42.908 41.778 1.684 1.544 0.055 0.056 60 0.678 0.680 43.754 42.988 1.745 1.707 0.051
50 mg/L Octanol
180 0.774 0.758 47.298 47.306 2.176 2.094 0.089 0.088
0 2 10 0.648 0.639 42.832 41.677 1.575 1.539 0.037 0.047 30 0.638 0.637 42.700 40.954 1.782 1.695 0.057 0.118 60 0.693 0.656 45.002 42.995 1.986 2.032 0.083 0.083
200 mg/L Octanol
180 0.802 0.813 49.466 50.413 2.576 2.429 0.142 0.141

250
Table E.11 C18 Unsaturated fatty acids concentrations for P. aeruginosa cells exposed to 1-octanol (Trial 2).
Time C 18:1 trans C 18:1 cis C 18:2 trans C 18:2 cis Reactor (minutes) mg/L-1 mg/L-2 mg/L-1 mg/L-2 mg/L-1 mg/L-2 mg/L-1 mg/L-2
0 0.098 0.072 10.104 8.706 0.130 0.138 20.893 17.2462 0.089 0.066 6.915 7.129 0.115 0.105 14.182 14.65010 0.075 0.093 9.106 8.266 0.149 0.106 17.677 16.82130 0.064 0.056 8.587 7.966 0.119 0.101 16.773 16.24460 0.098 0.093 9.850 11.680 0.156 0.203 16.636 19.939
Control
180 0.066 0.065 13.340 12.546 0.136 0.244 19.640 15.131
0 0.071 0.093 9.566 8.890 0.139 0.113 20.422 19.2132 0.077 0.054 7.708 9.771 0.117 0.179 16.192 19.47510 0.088 0.074 9.363 8.769 0.156 0.173 18.497 19.81130 0.096 0.080 9.858 10.433 0.148 0.148 16.464 20.18360 0.091 0.116 9.945 10.931 0.167 0.198 17.160 17.924
5 mg/L Octanol
180 0.102 0.094 15.580 15.393 0.205 0.199 20.930 20.622
0 2 10 0.154 0.080 9.824 9.600 0.144 0.143 17.249 17.74430 0.067 0.062 10.342 10.102 0.139 0.146 19.326 18.88460 0.064 0.089 11.386 11.207 0.161 0.152 18.114 18.174
50 mg/L Octanol
180 0.101 0.105 16.333 16.456 0.204 0.233 19.983 18.558
0 2 10 0.126 0.080 9.848 9.987 0.273 0.140 14.738 20.23130 0.086 0.099 10.013 9.530 0.203 0.129 18.140 19.63660 0.093 0.091 10.736 10.266 0.194 0.206 19.690 17.926
200 mg/L Octanol
180 0.136 0.129 16.243 16.265 0.189 0.246 22.456 21.023

251
Table E.12 Live/Dead stain results for N. europaea and P. aeruginosa membrane experiments (Trial 2). Values indicate the number of cells.
Reactor N. europaea P. aeruginosaLive Cells
Control 1 22 242 Control 2 15 279 Control 3 26 212 200 mg/L Octanol 1 32 224 200 mg/L Octanol 2 44 201 200 mg/L Octanol 3 55 241
Dead Cells Control 1 6 9 Control 2 2 12 Control 3 5 7 200 mg/L Octanol 1 4 12 200 mg/L Octanol 2 8 5 200 mg/L Octanol 3 5 9
Total Percent Live Control 82.9 96.3 200 mg/L Octanol 88.5 96.2

VITA Richard T. Kelly II is the oldest son of Richard T. and Jane E. Kelly. He was born and raised in central Pennsylvania. For his undergraduate education, Richard studied civil engineering at Bucknell University in Lewisburg, PA. Richard worked for the Pennsylvania Department of Transportation as a roadway construction inspector and for Gannett Fleming, Inc. as an engineering intern during summer breaks. While completing his degree became interested in environmental engineering and after graduating with a BSCE in 2000 began attending Virginia Tech as a master’s student in the Department of Civil and Environmental Engineering. Richard received his MSCE in 2002 and remained at Virginia Tech to complete a Ph.D. in civil engineering. Richard focused on nitrification inhibition in wastewater treatment during his doctoral research and defended his dissertation on June 21, 2005.