chemical imaging - downloads.leica-microsystems.com
TRANSCRIPT


2 3
Multi-color chemical imaging in cellular model systems
With the high chemical specificity of CRS imaging at hand, you can reveal new cell phenotypes relevant to development and disease. In this model system of skin cancer, an unexpected cell phenotype enriched in fully saturated lipids (bright yellow cells) was uncovered that was missed by previous investigations with traditional methods.
Multi-color SRS image of a tri-cellular cancer spheroid showing total lipids (yellow, 2850 cm-1), unsaturated lipids (magenta, 3050 cm-1), and collagen (SHG, cyan). Scale bar is 100 µm. Sample courtesy of Rüdiger Rudolf, Julia Klicks, Hochschule Mannheim, Germany.
When you need to study structures that cannot be visualized with traditional fluorescent microscopy methods, the STELLARIS 8 Coherent Raman Scattering (CRS) microscope enables you to implement label-free chemical imaging into your workflow to answer those challenging research questions.
With STELLARIS 8 CRS, you can image a wide range of specimens at high speed and resolution using different modalities: Stimulated Raman Scattering (SRS), Coherent Anti-Stokes Raman Scattering (CARS), Second Harmonic Generation (SHG), two-photon fluorescence, and visible confocal fluorescence. Take advantage of these modalities to maximize the information you get from your sample.
STELLARIS 8 CRS provides the potential to capture the complexity of biological systems.
EXPLORE LABEL-FREE CHEMICAL IMAGING

4 5
STELLARIS 8 CRS brings you the power to image and differentiate structures and events using their chemical properties and without the need of fluorescent labels, thanks to the access to different CRS modalities:
> Coherent Anti-Stokes Raman Scattering (CARS) for the fastest, crispest label-free imaging of abundant species;
> Stimulated Raman Scattering (SRS) for quantitative, spectroscopic imaging with enhanced chemical specificity.
Benefit from built-in three-dimensional imaging for samples, such as tissues, organoids, or model organisms, thanks to the nonlinear optical nature of CRS signal generation and the use of near-infrared excitation lasers that propagate through biological materials with minimal perturbation.
Image live specimens as close to physiological conditions as possible by removing the need for labeling and associated sample preparation and having the capability to image with gentle, near-infrared laser excitation.
Label-free biochemical characterization of untreated biological specimens
The capability to image chemical bonds provides an entirely new window into the biology of your sample. The top row shows a series of representative frames of an SRS spectral scan of an untreated fresh slice of apple. Different biochemical structures are clearly visualized by their distinct chemical vibrations, but you can even go further. In the center, the full SRS spectra of a number of distinct structures are shown. These spectra can be analyzed to identify the predominant chemical species that are present. Spectral unmixing of the image data can be performed to get an even cleaner separation of the biochemical structures, resulting in a comprehensive biochemical view of the sample as shown in the bottom image.
SRS investigation of an untreated fresh slice of apple. Top: A series of images of different chemical bonds, accessed by laser tuning to the indicated vibrational frequencies. Middle: SRS spectra of the regions of interest shown on top. Bottom: result of 8-color spectral unmixing of the spectroscopic data. CP - cuticle proper made of long-chain waxy fatty acids; ECL, ICL – external and internal cuticular layers containing short-chain unsaturated fatty acids; E – endothelial cells containing polyphenolic compounds; CW – cell walls made of polysaccharides; ChrP – chloroplasts containing carotenoids; ICW – intracellular water. Scale bars are 50 µm.
IMAGE THE CHEMISTRY INSIDE NATIVE BIOLOGICAL SAMPLES WITHOUT A NEED FOR LABELS
50 µm
SRS
Sign
al (a
.u.)
Vibrational Frequency (cm-1)
1400800 900 1000 1100 1200 1300 1500 1600 1700 1800
IMAGE TARGETS INACCESSIBLE BY TRADITIONAL METHODS

6 7
DECODE BIOLOGICAL COMPLEXITY BY COMBINING BIOCHEMICAL, BIOPHYSICAL, AND FLUORESCENCE CONTRAST IN THE SAME EXPERIMENT
Whether it’s the label-free visualization of pathological structures inside healthy tissues or the study of metabolic activities in cancerous tissues, STELLARIS 8 CRS provides the tools to add this missing information to your imaging experiment.
Gain information on the biochemical composition of your sample, from tissue- to subcellular level, thanks to the capability of CRS imaging to provide highly specific chemical image contrast at unprecedented speed and resolution.
Reveal new dimensions in metabolic processes and cell phenotypes relevant to development and disease, thanks to the vast spectroscopic information content provided by SRS and the potential to combine chemical and lifetime-based information using the new synergy of CARS with TauSense.
Combine fluorescence imaging with chemical imaging in the same experiment, thanks to the compatibility and complementarity of CRS, SHG, and fluorescence contrasts.
Multi-modal optical imaging for tissue biology
When it comes to studying biological processes relevant to development or disease, the answer often lies in combining the information from multiple contrast mechanisms. Here, bone formation is studied inside an explanted mouse skullcap. In this complex tissue, fluorescence contrast pinpoints the locations of mCherry-labeled osteoblast cells. SHG contrast visualizes the collagen fibers that act as a scaffold for developing bone structures. SRS reveals the spongy structure of the bone mineral itself. Multi-color SRS imaging also uncovers additional context, for example lipid-rich structures that are only found in a subset of cells, which may point to the presence of different cell differentiation states.
Multi-modal optical imaging of a mouse embryo skullcap. mCherry-labeled osteoblasts (visible fluorescence, green), collagen (SHG, magenta), lipids (SRS 2850 cm-1, yellow), and bone mineral (SRS 950 cm-1, cyan). Scale bar is 50 µm. Sample courtesy of Jacqueline Tabler & Sebastian Bundschuh, MPI-CBG Dresden, Germany.
Osteoblasts - mCherry 514 nm vis excitation
CollagenSHG
LipidsSRS, 2850 cm-1
HydroxyapatiteSRS, 950 cm-1
50 µm
ADD MORPHO-CHEMICAL & FUNCTIONAL INFORMATION TO YOUR IMAGING EXPERIMENT

8 9
OBTAIN FAST AND RELIABLE RESULTS IN LARGE AND DIFFICULT SAMPLES
Navigate large and complex samples with ease
For exploratory imaging tasks using large samples, rapid automated imaging of the entire specimen is very important for finding regions of interest. This example highlights the effects of diet on brain physiology. High-resolution tile scans of entire brain slices from mice grown on different diets were acquired. A comparison of SRS lipid images in cortical regions from mice grown on a high-fat diet (left inset) and regular diet (right inset) shows pathological lipid accumulations in the vasculature of the high-fat diet specimen that are not found on a regular diet.
Tile scan image of an entire mouse brain slice. Lipid structures (SRS 2850 cm-1, green) and autofluorescence (blue). Insets: Corresponding cortex regions of mice grown on a high-fat diet (left) and regular diet (right). Samples courtesy of Judith Leyh, Ingo Bechmann, Universität Leipzig, Germany.
STELLARIS 8 CRS offers all the versatility and ease-of-use available with the STELLARIS platform. This integration allows you to handle a wide range of challenging samples and helps you maximize the benefits of CRS imaging.
Go from single-chemical-bond imaging to spectroscopic or multi-modal imaging in just a few clicks, thanks to the full integration of the CRS hardware into ImageCompass, the intuitive user interface of STELLARIS.
Navigate large and complex samples with ease, thanks to the full integration of CRS multi-position experiments with the LAS X Navigator, a powerful navigation tool that enables you to quickly switch from searching image by image to seeing a full overview of your sample.
Obtain inherently quantifiable information from hyperspectral CRS image datasets or ratiometric imaging. Basic quantification tools are integrated in the LAS X software.
High-fat diet Regular diet
BOOST YOUR PRODUCTIVITY WITH INHERENTLY QUANTIFIABLE DATA
10 11
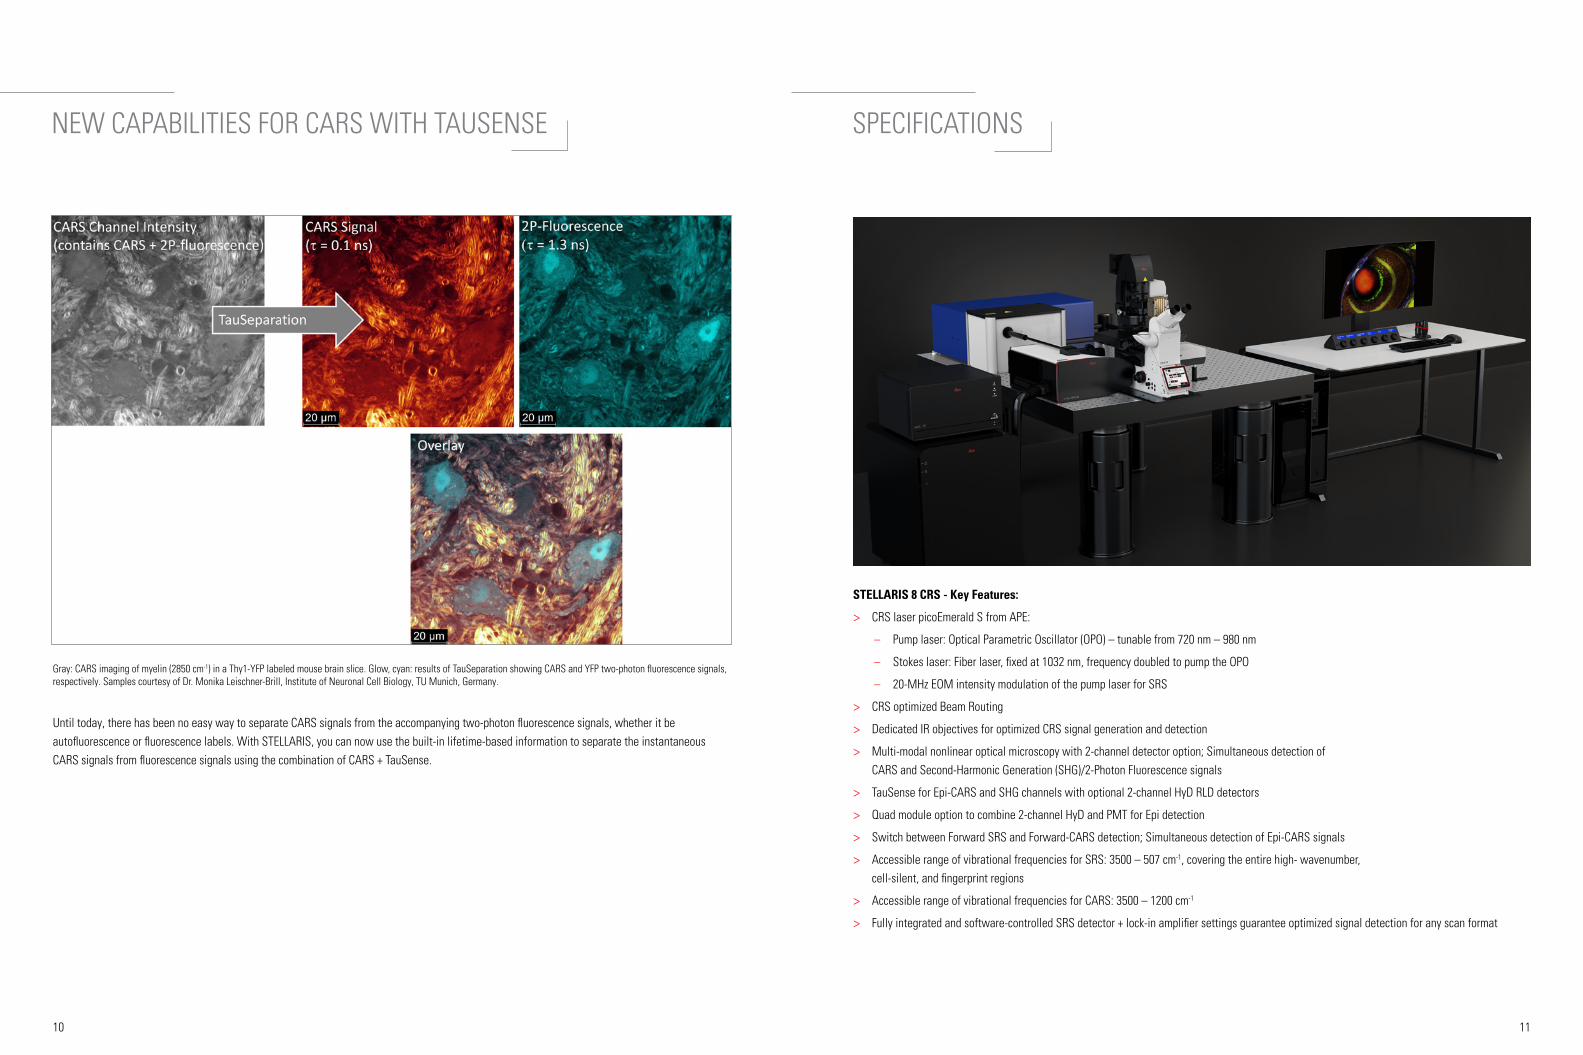
NEW CAPABILITIES FOR CARS WITH TAUSENSE SPECIFICATIONS
Until today, there has been no easy way to separate CARS signals from the accompanying two-photon fluorescence signals, whether it be autofluorescence or fluorescence labels. With STELLARIS, you can now use the built-in lifetime-based information to separate the instantaneous CARS signals from fluorescence signals using the combination of CARS + TauSense.
STELLARIS 8 CRS - Key Features:
> CRS laser picoEmerald S from APE:
– Pump laser: Optical Parametric Oscillator (OPO) – tunable from 720 nm – 980 nm
– Stokes laser: Fiber laser, fixed at 1032 nm, frequency doubled to pump the OPO
– 20-MHz EOM intensity modulation of the pump laser for SRS
> CRS optimized Beam Routing
> Dedicated IR objectives for optimized CRS signal generation and detection
> Multi-modal nonlinear optical microscopy with 2-channel detector option; Simultaneous detection of CARS and Second-Harmonic Generation (SHG)/2-Photon Fluorescence signals
> TauSense for Epi-CARS and SHG channels with optional 2-channel HyD RLD detectors
> Quad module option to combine 2-channel HyD and PMT for Epi detection
> Switch between Forward SRS and Forward-CARS detection; Simultaneous detection of Epi-CARS signals
> Accessible range of vibrational frequencies for SRS: 3500 – 507 cm-1, covering the entire high- wavenumber, cell-silent, and fingerprint regions
> Accessible range of vibrational frequencies for CARS: 3500 – 1200 cm-1
> Fully integrated and software-controlled SRS detector + lock-in amplifier settings guarantee optimized signal detection for any scan format
Gray: CARS imaging of myelin (2850 cm-1) in a Thy1-YFP labeled mouse brain slice. Glow, cyan: results of TauSeparation showing CARS and YFP two-photon fluorescence signals, respectively. Samples courtesy of Dr. Monika Leischner-Brill, Institute of Neuronal Cell Biology, TU Munich, Germany.

Leica Microsystems CMS GmbH | Am Friedensplatz 3 | 68165 Mannheim, Germany
Tel. +49 621 70280 | F +49 621 70281028
www.leica-microsystems.com/stellaris-8-crsMC-
0003
074
· 30.
08.2
021
– Co
pyrig
ht ©
202
1 Le
ica
Mic
rosy
stem
s CM
S Gm
bH, M
annh
eim
, Ger
man
y. A
ll rig
hts
rese
rved
. Sub
ject
to m
odifi
catio
ns.
LEIC
A an
d th
e Le
ica
Logo
are
regi
ster
ed tr
adem
arks
of L
eica
Mic
rosy
stem
s IR
Gm
bH.
Connect with us!
LASER RADIATIONVISIBLE AND INVISIBLE- CLASS 3BAVOID DIRECT EXPOSURE TO BEAM
P < 500 mW 350- 700nmIEC 60825-1: 2014
LASER RADIATIONVISIBLE AND INVISIBLE- CLASS 4AVOID EYE OR SKIN EXPOSURE TO
DIRECT OR SCATTERED RADIATION
Paverage < 4 W 350- 1600nm >40fsIEC 60825-1: 2014