chemical emissions from building structures
TRANSCRIPT
Chemical emissions from building structures – Emission sources and their impact on indoor air Annika Glader
Department of Public Health and Clinical Medicine Umeå 2012

Responsible publisher under swedish law: the Dean of the Medical Faculty This work is protected by the Swedish Copyright Legislation (Act 1960:729) ISBN: 978-91-7459-433-1 Omslag: Annika Glader Elektronisk version tillgänglig på http://umu.diva-portal.org/ Tryck/Printed by: Print & Media Umeå, Sverige 2012

Table of Contents
Table of Contents i Abstract ii Sammanfattning iv Original papers vi Abbreviations vii Background 1
Indoor air quality 1 Volatile organic compounds (VOC) 2 VOCs from building materials 3 Moisture-damaged buildings 4
Aims of the study 7 Materials and methods 7
Buildings 7 Adsorbent tubes 8 Pump flow rates and sample volumes 9 Analysis 10 Data pre-treatment 11 Data analysis 11
Results 13 Breakthrough field tests 13 TVOC 16 Moisture 18 Chemical groups 20 Chemical compounds 22
Discussion 26 Conclusions 29 Acknowledgements 30 References 31
i
Abstract
Chemical compounds in indoor air can adversely affect our comfort and health. However, in most cases there is only a limited amount of information available that can be used to assess their health risk. Instead the precautionary principle is often applied, i.e. efforts are made to ensure that the concentrations of pollutants are kept at a minimum when constructing new buildings or conducting renovations by using low-emitting building materials. Today, when investigating buildings in order to solve indoor air quality problems, volatile organic compounds (VOCs) are sampled in the air within rooms. The chemical composition of indoor air is complex and there are many sources for the chemicals present. The potential for emissions from sources in hidden spaces such as wall cavities is poorly understood and little information exists on the toxic potential of chemical releases resulting from moisture-related degradation of building materials. Most of the non-reactive VOCs that have been detected in indoor air in field studies and from building products are not believed to cause health problems. However, reactive compounds and chemical reaction products have the potential to negatively influence our comfort and health even at low concentrations. Even though the impact of chemical compounds on health is unclear in many cases, they can be used to identify technical problems in buildings. When a building is investigated, the air inside building structures could be sampled. This method would eliminate emissions from sources other than the construction materials and the samples would contain higher levels of individual compounds.
The aims of this work was to identify emissions profiles for different types of building structures, to see if the emissions profiles for moisture damaged and undamaged structures differed, and to determine whether any of the emissions profiles for specific structures also could be found in indoor air.
Technical investigations and VOC sampling were performed in 21 different buildings with and without previous moisture damage. Seven of the buildings were investigated in the years 2005-2006 (study 1) and fourteen in the years 2009-2010 (study 2). In study 1, sixty samples were analyzed by PCA at the chemical group level (18 chemical groups, i.e. aldehydes, ketones etc). 41 % of all identified chemical compounds belonged to the hydrocarbon chemical group. The second largest chemical groups, each of which accounted for 5-10 % of all identified compounds, were alcohols, aldehydes, ketones, polyaromatic hydrocarbons (PAHs) and terpenes. The results indicated that one of the main factors that determined the emissions profile of a building structure was the materials used in its construction. Notably, concrete and wooden structures were found to have different emissions profiles.
ii
The sum of VOC (TVOC) concentrations for all 241 samples from both study 1 and study 2 was used to compare total emissions between different building elements (ground and higher floors, external walls and roof spaces). Most building elements exhibited relatively low emissions compared to concrete ground floors, which generally had higher TVOC emissions. Emissions from both polystyrene insulation and PVC flooring could be identified in concrete ground floors and were the main cause for the higher emissions found in these structures. Profiles for wood preservatives such as creosote and pentachlorophenol were also identified in external walls. The emission profiles found in the structures could not be identified in the indoor air in the adjacent rooms, although individual compounds were sometimes detected at low concentrations.
Our results showed that the main factors influencing emissions in building structures were the construction materials and the nature of the building element in question. Because of difficulties with finding active water damage at the times of sampling and because of sampling inside closed building structures with old dried-out moisture damages, the field method used in this work was unsuitable for identifying differences in emission profiles between moisture damaged and undamaged structures. It will thus be necessary to investigate this difference in a laboratory where the precise composition of all tested structures is known, a range of RH values can be tested and the accumulation of emissions can be followed.
iii
Sammanfattning
Kemiska föroreningar i inomhusmiljön har möjlighet att påverka vår hälsa och välbefinnande men det finns fortfarande begränsat med information för att fastställa deras hälsorisker. Istället används försiktighetsprincipen, vilket innebär att man strävar efter så låga koncentrationer av föroreningar som möjligt då man bygger nytt eller renoverar. Ett vanligt sätt att utreda problem med inomhusluften är att analysera luftens innehåll av lättflyktiga organiska föreningar, alltså VOC (Volatile Organic Compounds). Inomhusluftens kemiska sammansättning är komplex och föreningarna härstammar från ett flertal källor. Man vet mycket lite om emissioner från gömda källor inuti konstruktioner och hur emissioner från fuktskadade byggnadsmaterial kan påverka hälsan. Man har inte kunnat påvisa några direkta hälsoeffekter av de stabila, icke-reaktiva VOC som man vanligen mäter i inomhusluften och från byggnadsmaterial. Däremot verkar reaktiva kemiska föreningar och nedbrytningsprodukter kunna påverka vår hälsa och välbefinnande även vid låga koncentrationer. Även om det i många fall är oklart hur VOC påverkar vår hälsa kan de användas för att indikera byggnadstekniska problem. Då man utreder byggnaders kondition kan man analysera prov av luften inuti konstruktionerna istället för rumsluften. Metoden skulle eliminera andra källor än byggnadsmaterialen och ge högre koncentrationer av individuella VOC.
Vårt mål med detta arbete var att se om vi kunde identifiera specifika emissionsprofiler för olika konstruktionstyper och om det fanns en skillnad i profilerna mellan fuktskadade och icke fuktskadade konstruktioner. Vi ville också se om vi kunde identifiera samma profil i rumsluften, d.v.s. om dessa kemiska föreningar läckte ut ur konstruktionen.
Fastighetsgranskning och provtagning av VOC utfördes i 21 olika byggnader, både med och utan tidigare fuktskador. Sju av byggnaderna undersöktes åren 2005-2006 (studie 1) och fjorton under åren 2009-2010 (studie 2). I studie 1 analyserades 60 konstruktionsprov med hjälp av principalkomponentanalys, PCA, på kemisk gruppnivå. De kemiska föreningarna i proven kunde hänföras till 18 större kemiska grupper. Den allra största gruppen var kolväten, 41 % av alla föreningar hörde hit. De näst största grupperna, dit 5-10 % av alla föreningar hörde, var alkoholer, aldehyder, ketoner, polyaromatiska kolväten (PAH) och terpener. Resultaten visade att den största skillnaden i emissioner mellan olika konstruktionstyper beror på byggnadsmaterialet och att konstruktioner byggda av trä och betong har olika emissionsprofiler.
För alla 241 konstruktionsprov som samlades in under studie 1 och 2 beräknades TVOC (summan av alla VOC i ett prov) för att jämföra totalemissionerna för olika byggnadsdelar (bottenbjälklag, mellanbjälklag,
iv

yttervägg och övre bjälklag) och konstruktionstyper. Låga emissioner var mera vanliga förutom i bottenbjälklag av betong som ofta hade högre emissioner än andra byggnadsdelar. Orsaken till att bottenbjälklag av betong överlag hade högre emissioner kunde härledas till att man använt PVC golvmattor som ytmaterial och polystyren som isolering. Förutom specifika emissionsprofiler för PVC golvmattor och polystyren isolering kunde vi även identifiera emissionsprofiler typiska för träimpregneringar, såsom kreosot och pentaklorfenol. De emissionsprofiler som kunde identifieras i olika konstruktioner kunde för det mesta inte återfinnas i rumsluften, även om enskilda kemiska föreningar ibland kunde förekomma i mycket lägre koncentrationer.
Våra resultat visar att den största skillnaden i emissioner mellan olika konstruktionstyper beror på byggnadsmaterialen och den undersökta byggnadsdelen. Den använda metoden kunde inte användas för att se profilskillnader mellan fuktskadat och icke fuktskadat byggnadsmaterial eftersom endast ett fåtal aktiva skador påträffades vid provtagningarna och emissionerna från gamla, uttorkade skador accumulerats och fanns kvar i konstruktionerna. Profilskillnader mellan fuktskadat och icke fuktskadat byggnadsmaterial bör undersökas under mera kontrollerade förhållanden i laboratorium där alla använda byggnadsmaterial är kända, fukthalten kan kontrolleras och accumuleringen av emissioner kan följas.
v
Original papers
This thesis is based on the following papers:
I. Glader A, Liljelind I. 2011. Patterns of VOC emissions in building structures. Indoor and Built Environment, published online 5 December 2011.
http://ibe.sagepub.com/content/early/2011/11/29/1420326X11429835
II. Glader A, Liljelind I. 2012. Volatile organic compounds in building structures and their impact on indoor air. (Manuscript)
The published article is reprinted with permission from SAGE Publications Ltd.
vi

Abbreviations
ATD Automated Thermal Desorption
BV Breakthrough Volume
CAS Chemical Abstract Service
IAQ Indoor Air Quality
GC Gas Chromatography
MCS Multiple Chemical Sensitivity
MS Mass Spectrometry
MVOC Microbial Volatile Organic Compounds
OPLS Orthogonal PLS
PCA Principal Component Analysis
PCP Pentachlorophenol
PAH Polycyclic Aromatic Hydrocarbons
PLS Partial Least Squares Projections to Latent Structures
PVC Polyvinylchloride
RT Retention Time
SBS Sick Building Syndrome
SSV Safe Sampling Volume
TVOC Total Volatile Organic Compounds
VOC Volatile Organic Compounds
vii

viii

Background
Indoor air quality On average, people spend 80-90% of their time indoors. This means that our main exposure to air pollutants occurs indoors and that indoor air can significantly affect human comfort, health, and workplace productivity (ECA, 2006). Indoor air contains a complex mixture of pollutants including organic (e.g. volatile organic compounds) and inorganic gases (e.g. carbon dioxide, radon), biological particles (e.g. bacterial and fungal spores), and non-biological particles (e.g. dust and fibres). The main sources of indoor air pollution are building materials and furniture, humans and their activities, and outdoor air. Our exposure to air pollutants will depend upon the total strength of its indoor sources, ventilation and exposure time. Each of these will vary in time and so the indoor environment should be considered dynamic. Results from a number of exposure studies (i.e. EXPOLIS, GerES II, and TEAM) indicate that pollutant sources situated in close proximity to the individual are major contributors to personal exposure levels (Edwards et al., 2001; Hoffmann et al., 2000; Wallace et al., 1986).
Indoor air pollution has a broad range of health effects in humans, ranging from sensory annoyance to cancer. There is strong evidence for an association between indoor air quality (IAQ) and lung cancer, allergies, respiratory infections and hypersensitivity reactions such as SBS (Sick Building Syndrome) and MCS (Multiple Chemical Sensitivity) (Sundell, 2004; WHO, 2009; ECA, 1991). SBS is a term used for health symptoms described by occupants in a building with poor indoor air quality. Common symptoms include sensory irritation of the mucus membranes (eyes, nose and throat) and skin as well as general symptoms of the central nervous system such as headaches, tiredness and malaise. SBS is indicated if the early symptoms improve on days away from the problem building and re-occur on returning to it (ECA, 2006).
IAQ has been studied much less extensively in schools than in other buildings. A review of IAQ in European schools concluded that schools frequently have serious indoor problems because of poor building construction, maintenance, cleaning and ventilation (Carrer et al., 2002). In another review, Daisey et al. (2003) concluded that the information on IAQ in US schools is very limited but the available measurements of ventilation rates and CO2 concentrations indicate that many classrooms are not adequately ventilated. The poor indoor air quality in school buildings may affect the health of students and teachers and indirectly affect students’ learning performance (Mendell and Heath, 2005). Asthma and SBS were the most commonly reported health symptoms investigated in schools (Daisey et al., 2003) but poor IAQ can cause various short- and long-term negative
1

health effects and discomfort in students and school staff (Carrer et al., 2002).
Volatile organic compounds (VOC) Several hundred organic compounds have been detected in indoor air, most of which belong to a class called volatile organic compounds (VOC). According to the U.S. Environmental Protection Agency (EPA), the general definition of VOCs that is used in the scientific literature is: “VOCs are organic chemical compounds whose composition makes it possible for them to evaporate under normal indoor atmospheric conditions of temperature and pressure”. The volatility of a compound is generally higher the lower its boiling point temperature and the volatility of organic compounds are sometimes defined and classified by their boiling points. An internationally recognized definition of VOC was adopted in 1989 by the World Health Organisation (WHO). Organic indoor air pollutants are classified into four broad categories according to their boiling point ranges: Very Volatile Organic Compounds (VVOCs), Volatile Organic Compounds (VOCs), Semivolatile Organic Compounds (SVOCs) and Particulate Organic Matter (POMs) (ECA, 1994). The VOC class includes compounds with boiling points between 50 °C and 260 °C. This division into categories does not relate to toxicity or occurrence, but rather reflects the measurements obtained by different analytical methods. Knowledge about the VOCs that are present at low concentrations normally found in indoor air in any given situation is highly dependent on how they are measured. All available measurement methods are selective in what they can measure and quantify accurately, and none are capable of measuring all VOCs that are present.
TVOC (Total Volatile Organic Compounds) is the sum of all the VOCs measured in indoor air. Numerous different ways of measuring and calculating TVOC have been used, making comparisons between studies difficult (Mölhave et al., 1997). A technical definition of TVOC was proposed by a European working group (ECA, 1997) and they recommended that TVOC should be determined by using Tenax TA as the adsorbent and a chromatographic window ranging hexane to hexadecane. No consistent associations have been shown between TVOC and health effects and so TVOC values should be interpreted with caution. TVOCs can be used for purposes other than evaluating health risks, including testing of material emissions, determining whether a building is adequately ventilated, and identifying highly polluting activities (Mölhave et al., 1997). A more compound-focused approach for evaluating the health-related effects of VOCs has become more common in recent years (Wolkoff, 2003).
Toxicology-based indoor air guideline values were introduced to answer health-related questions (AGÖF, 2008). Because of the high costs of generating toxicological data, it is not possible to set indoor air quality
2
guidelines for all of the several hundred identified VOCs in indoor air. An alternative approach is based on observations from occupational studies. Although it is known from occupational hygiene that a considerable number of VOCs may cause irritation or other acute effects, these effects have usually been observed at concentrations which are several orders of magnitude higher than those measured in indoor air (Jantunen et al., 1997). In addition, very little information is available on effects of mixtures of VOCs usually observed indoors. The most commonly-mentioned health problems in relation to indoor air quality issues include SBS symptoms, which are hard to address in toxicological and occupational studies. Instead, concentrations of VOCs have been compared in complaint and control houses in order to determine whether there is any correlation between the concentrations of specific VOCs and the incidence of complaints (ECA, 1994). New guidelines for VOC concentrations in indoor air have been developed using statistical analyses (AGÖF, 2008). VOC concentrations in the 90th percentile were defined as indicating unusually high exposure. However, these statistical reference values cannot be used for health assessments. The German AGÖF Guidance Values therefore also include toxicologically relevant guideline values and odour threshold values.
Based on their generally high estimated airway irritation thresholds for humans, most VOCs that have been measured in field studies and from building products are not believed to cause eye and airway irritation directly (Wolkoff, 1999; Wolkoff and Nielsen, 2001). However, reactive compounds and chemical reaction products can have a negative influence on comfort and health because of their intense odour and irritating effects even at low concentrations. It is therefore important to consider indoor chemistry when characterizing indoor air (Uhde and Salthammer, 2007; Wolkoff, 1997; Weschler, 2004). One of the major challenges when evaluating the impact of indoor chemistry is the difficulty of measuring many of these reaction products.
VOCs from building materials Primary emissions from building materials and furniture are the dominant sources of VOCs in new or renovated buildings. Primary emissions are compounds released from new materials (free non-bound VOCs from building products, such as solvent residues, additives and non-reacted raw products) and are usually emitted during the first year after building or renovation. When primary emissions decrease, the relative importance of secondary emissions and emissions related to human activity increases. Secondary emissions are compounds produced by chemical reactions in the material or in the indoor environment, for example the chemical degradation of phthalates in PVC flooring, the thermal degradation of polymer constituents, and oxidation processes. The formation of secondary emissions
3
may also occur due to water damage, incorrect maintenance, or mechanical wear of indoor surfaces (Wolkoff, 1999). It appears that in the long term, secondary emissions have a much more significant effect on perceived air quality than do primary emissions (Knudsen et al., 1999).
The goal of emissions testing is to promote the development and use of building materials with low emissions in order to create building products that do not negatively impact the indoor environment. Several national and international methods for emissions testing and labelling schemes are available for building products (Wolkoff, 2003). The voluntary Finnish emission classification scheme for building materials defines three classes of materials (M1, M2 and M3). Materials in the M1 class are of the highest quality; the standard requires that these materials be odour-free in addition to generating low emissions. The classification presents requirements for materials used in ordinary work spaces and residences (RTS, 2012).
Emission rates are specific for each compound and source, and are influenced by factors such as relative humidity, temperature, air exchange rates, occupant activity and the age of the materials. Testing for primary VOC emissions is necessary but insufficient by itself when characterising the impact of building products over their entire life span. As an example, both adhesives and floor coverings would be considered low emitting materials on the basis of separate chamber tests alone. However, their emissions profiles and rates under field conditions differ from those observed in the laboratory due to interactions between the flooring materials, adhesive, and concrete (Uhde and Salthammer, 2007).
Moisture-damaged buildings There is no generally accepted definition of dampness or what constitutes moisture damage in buildings. Moisture damage can be identified by visual observation of dampness or mould, readings of moisture measurements, condensation and other signs that can be associated with excess moisture in building structures (IOM, 2004). Moisture problems begin when materials stay wet long enough for microbial growth or physical deterioration to occur and can be caused by various factors, including leaks in the roof or the plumbing, condensation in cases of poor ventilation or insufficient insulation, moisture incorporated during construction, or capillary movement of soil water. The nature of moisture problems shows that what is known about their causes and prevention is not consistently applied in building construction, maintenance and use.
Working and living in moisture-damaged buildings increases the risk of poor health (Bornehag et al., 2001, 2004; IOM, 2004; WHO, 2009). Most of the resulting health effects relate to the respiratory system and range from irritation of the mucous membranes and respiratory infections to allergies and asthma. The causative agents have not been identified conclusively but
4
excessive levels of any microbial agent in the indoor environment pose a potential health hazard. Microbial interactions and chemical emissions from building materials may also influence health effects. Microbes can produce volatile organic compounds, known as microbial VOC (MVOC), as final products of their metabolism. MVOCs are responsible for the smell of mould that is often associated with microbial growth but are usually found at very low levels in indoor air. Several compounds such as 1-octen-3-ol, geosmin, 3-methylfuran, 3-methyl-2-butanol, 2-pentanol, 2-hexanone, 3-octanone, 2-octen-1-ol, 2-methyl-isoborneol, 2-isopropyl-3-methoxypyrazine, 3-methyl-1-butanol, 2-heptanone and 3-octanol, have been suggested as indicators of microbial contamination in buildings (Hyvärinen, 2002; Korpi et al., 2006). However, none of the commonly reported MVOCs are considered to be specific for microbial metabolism and many are also released from moist building materials.
Moisture in buildings initiates the chemical degradation of building materials, which also pollutes indoor air. Moisture damaged concrete floors are known to cause chemical degradation of plasticizers in PVC flooring and adhesives (Sjöberg, 2001). A common source of problems is concrete that was not given sufficient time to dry before the flooring was installed. The chemical reactions that cause degradation are irreversible and the breakdown of PVC and adhesives may continue even if the concrete dries out later on. Asthma and SBS symptoms have been shown to be related to the degradation of plasticizers and adhesives (Wieslander et al., 2010; Norbäck et al., 2000) and their incidence has been shown to decrease after renovation (Tuomainen et al, 2004; Åhman et al, 2000).
Measurements of emissions from building materials are commonly collected only from surface materials when estimating the effects of building structures on indoor air quality. The potential for exposure from sources in hidden spaces such as wall cavities is poorly understood and little information exists on the toxic potential of chemical releases resulting from moisture-related degradation of building materials (IOM, 2004). The few studies that have been conducted on the infiltration of pollutants from concealed spaces indicate that there is a transport of VOCs from the building envelope to indoor air (Hayashi and Osawa, 2008; Hachem et al., 2009, 2010). One group of compounds that may be linked to sources in hidden spaces are the chloroanisoles. 2, 3, 4, 6 -tetrachloroanisole was found to be associated with complaints about musty odours in German frame houses (Gunschera et al., 2004, 2005). In the 1960s and 1970s, pentachlorophenol (PCP) was commonly used to protect building products made of wood against decomposition by fungi. Localized dampness probably favoured microbial growth with metabolic conversion of chlorophenols to the corresponding chloroanisoles as a result. Tetrachloroanisoles were assumed to have diffused throughout the buildings, resulting in the observed odours.
5
Creosote is another widely used wood preserving product that is derived from the distillation of coal tar. In Finnish buildings built before the 1980s, creosote was used as a wood preservative and for waterproofing building structures (Järnström et al., 2009). Volatilized polyaromatic hydrocarbons (PAHs) and other constituents from creosote treated wood could potentially affect indoor air quality. In a study by Gevao and Jones (1998), it was noticed that the emissions profiles for creosote-treated wood were dominated by lighter compounds, which are generally believed to be of less toxicological concern than the higher molecular weight PAHs. Building products containing coal tar can emit VOCs such as naphthalene, acenaphthene and biphenyl that can penetrate into the indoor environment and pose a health risk as well as having annoying odours (Yu and Crump, 1998; Brown et al., 1990).
6
Aims of the study
The overall aim of the work described in this thesis was to compare the traditional method for measuring VOCs in indoor air with a method for measuring VOCs inside building structures. When sampling the air inside building structures, emissions from sources other than the construction materials would be eliminated. We also assumed that the samples would contain higher levels of individual compounds emitted from building materials. Our hypothesis was that more information could be obtained from building structures than from indoor air. This would facilitate technical investigations in problem buildings.
More specifically, we wanted to:
o compare the emissions of specific groups of chemicals in different types of building structures (Paper I)
o identify common emissions profiles in different types of building structures (Paper I, II)
o determine whether emissions differ between structures with and without known moisture damage (Paper I, II)
o determine the emission profile of individual chemical compounds in different building structures and investigate whether the same profile could be found in room air (Paper II)
Materials and methods
Buildings The data used for this thesis were collected in two studies. Seven buildings were investigated in the years 2005 and 2006 (study 1). Three of the buildings were schools, three were offices and one was a day-care centre. Some of the structures studied had had extensive moisture damage and were chosen in order to obtain the highest possible levels of individual chemical compounds. For comparative purposes, sampling was also conducted in structures without any known damage. Five of the buildings were known to be “problem buildings” with a long history of moisture damage (Vasa, Finland), one building had previously had moisture problems but had undergone a thorough renovation and one had no history of moisture
7
damage (Umeå, Sweden). The problems with dampness were caused by leaking plumbing, leaking roof structures, rising damp from the ground and moisture incorporated during construction (Paper I).
Fourteen schools in the west of Finland were investigated in the years 2009 and 2010 (study 2). To facilitate the identification of common emissions profiles for both wooden and concrete structures and for both moisture damaged and undamaged structures, we focused on collecting samples from buildings made from a small number of well-defined materials. The buildings were therefore selected on the basis of the materials used in their construction; they generally had ground floors made of concrete with mineral wool insulation or wood with organic insulation, and external walls made of concrete or brick with mineral wool insulation or wood with mineral wool insulation. Some of the chosen structures were known to have previously sustained moisture damage but most were without known damage (Paper II, combined data from study 1 and 2).
Both building-related questionnaires (i.e. open questions about knowledge of previous damage and visible signs) and visual and technical surveys of the buildings were used in the search for structures with and without moisture damage. All surveys were performed by the same trained building engineer. Only structures with cavities (for insulation etc) were suitable for sampling. Samples were taken from different elements of the buildings, i.e. external walls, floors (ground and higher floors) and roof spaces. Sampling was performed in the same way in both studies and started with VOC sampling of indoor air in the middle of the room at approximately 1 m above the floor. A hole, about 6 mm in diameter, was then drilled in the chosen structure and air samples were collected from inside the structure. Temperature and relative humidity (RH) were measured via the same hole immediately after sampling, using a Vaisala HMI41 meter.
Adsorbent tubes Sampling was conducted using standard stainless steel tubes packed with 200 mg Tenax TA. Several authors have reported that Tenax TA is the adsorbent that offers the best overall performance for sampling complex mixtures of volatiles (Sunesson et al., 1995; Glas et al., 2008). Due to its low specific surface area (35 m2/g), it is not suitable for sampling highly volatile compounds (Dettmer et al., 2002; NKB, 1995). The safe sampling volumes (SSV) of VOCs on hydrophobic adsorbents such as Tenax are relatively unaffected by air humidity (Woolfenden, 1998).
In order to minimize artefact interference, the tubes were reconditioned between uses at 335°C for 15 minutes with a helium carrier gas flow of 100 ml/min and, when possible, analysed for blank profiles. The objective was to reduce artefact levels to < 10% of analyte masses from sampling. Clean, blank tubes and sampled tubes were stored using brass screw caps and PTFE
8
ferrules and wrapped in aluminium foil in batches. The tubes were stored in the laboratory in a sealed glass jar and transported to the sampling sites in metal cans.
Tubes should be protected from the ingress of particles when appropriate. When sampling inside building structures, a stainless steel pipe (about 30 cm long) was coupled to the Tenax tube in order to reach through the thick concrete structures into the insulation layer. The pipes were washed with methanol between uses and a clean plug of silanized glass wool was placed in the pipe opening to prevent particles entering the adsorbent tube.
Pump flow rates and sample volumes VOCs were collected by active sampling on FLEC constant flow air pumps and Universal constant pressure air pumps. When sampling within different building structures, constant flow pumps were preferred. These pumps deliver a constant flow rate, compensating for moderate impedance variations. In indoor air investigations, 0.3-20 L of air is usually sampled at pump flow rates of 10-200 ml/min with 50 ml/min being regarded as the optimum (EPA, 1999). The pump flow rate and air sample volume are selected so as to offer a good compromise between safe sampling volumes (SSV) and collecting the largest possible analyte masses in the shortest time possible.
Breakthrough volume (BV) is the volume of air that can be passed through a sorbent tube before the analyte begins to elute from the non-sampling end, either because of saturation within the bed or displacement by another chemical. The BV for a given analyte is usually considered to be the sample volume at which there is 5% breakthrough onto a back-up tube. Breakthrough can be influenced by temperature and relative humidity and should be measured in the air to be monitored under worst-case conditions, i.e. at the highest natural humidity and highest typical VOC concentrations (Woolfenden, 1998).
Field tests of breakthrough were performed in one building in study 1. One test was set up to sample room air, one to sample the air within a floor and one to sample the air within a wall. Two tubes were linked together in series, i.e. the back end of the front (sample) tube was connected to a back-up tube. Tube pairs were then connected to calibrated pumps and used to simultaneously sample 3 different air volumes (3, 6 and 12L) with 2 replicates at each volume (Figure 1). The pump flow rates were set at 50 ml/min, 100 ml/min and 200 ml/min and were run for one hour in each case.
On the basis of the test results (which are described in more detail in the following sections) we decided to use pump flow rates of 200 ml/min (12 L air samples) in both study 1 and study 2. However, a flow rate of 100 ml/min (6 L air samples) was used when sampling in the first two buildings. The use
9
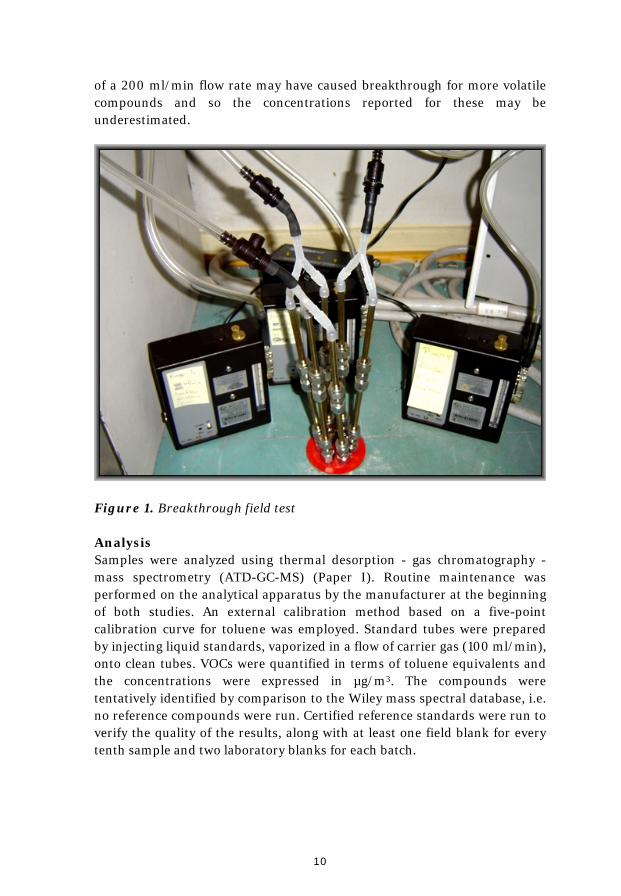
of a 200 ml/min flow rate may have caused breakthrough for more volatile compounds and so the concentrations reported for these may be underestimated.
Figure 1. Breakthrough field test
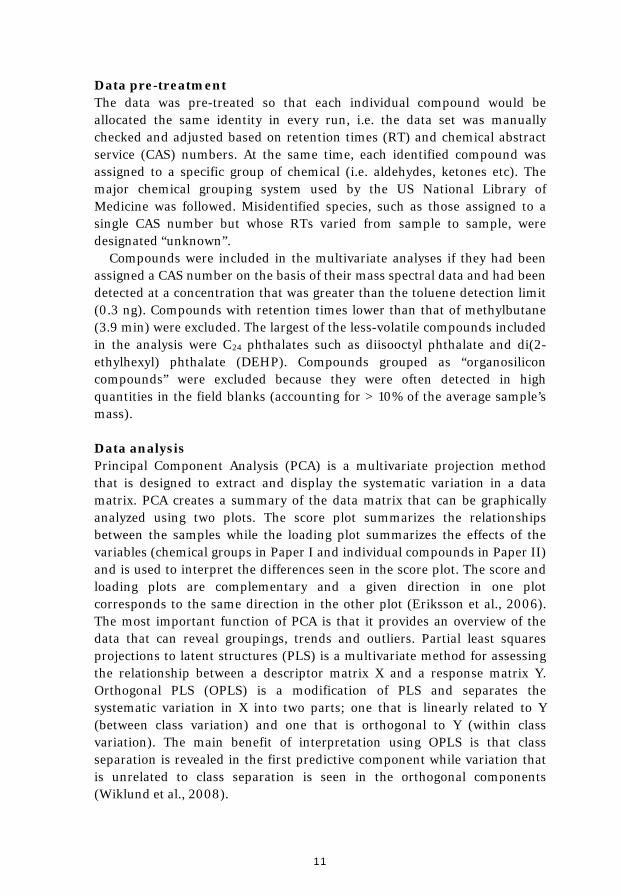
Analysis Samples were analyzed using thermal desorption - gas chromatography - mass spectrometry (ATD-GC-MS) (Paper I). Routine maintenance was performed on the analytical apparatus by the manufacturer at the beginning of both studies. An external calibration method based on a five-point calibration curve for toluene was employed. Standard tubes were prepared by injecting liquid standards, vaporized in a flow of carrier gas (100 ml/min), onto clean tubes. VOCs were quantified in terms of toluene equivalents and the concentrations were expressed in µg/m3. The compounds were tentatively identified by comparison to the Wiley mass spectral database, i.e. no reference compounds were run. Certified reference standards were run to verify the quality of the results, along with at least one field blank for every tenth sample and two laboratory blanks for each batch.
10
Data pre-treatment The data was pre-treated so that each individual compound would be allocated the same identity in every run, i.e. the data set was manually checked and adjusted based on retention times (RT) and chemical abstract service (CAS) numbers. At the same time, each identified compound was assigned to a specific group of chemical (i.e. aldehydes, ketones etc). The major chemical grouping system used by the US National Library of Medicine was followed. Misidentified species, such as those assigned to a single CAS number but whose RTs varied from sample to sample, were designated “unknown”.
Compounds were included in the multivariate analyses if they had been assigned a CAS number on the basis of their mass spectral data and had been detected at a concentration that was greater than the toluene detection limit (0.3 ng). Compounds with retention times lower than that of methylbutane (3.9 min) were excluded. The largest of the less-volatile compounds included in the analysis were C24 phthalates such as diisooctyl phthalate and di(2-ethylhexyl) phthalate (DEHP). Compounds grouped as “organosilicon compounds” were excluded because they were often detected in high quantities in the field blanks (accounting for > 10% of the average sample’s mass).
Data analysis Principal Component Analysis (PCA) is a multivariate projection method that is designed to extract and display the systematic variation in a data matrix. PCA creates a summary of the data matrix that can be graphically analyzed using two plots. The score plot summarizes the relationships between the samples while the loading plot summarizes the effects of the variables (chemical groups in Paper I and individual compounds in Paper II) and is used to interpret the differences seen in the score plot. The score and loading plots are complementary and a given direction in one plot corresponds to the same direction in the other plot (Eriksson et al., 2006). The most important function of PCA is that it provides an overview of the data that can reveal groupings, trends and outliers. Partial least squares projections to latent structures (PLS) is a multivariate method for assessing the relationship between a descriptor matrix X and a response matrix Y. Orthogonal PLS (OPLS) is a modification of PLS and separates the systematic variation in X into two parts; one that is linearly related to Y (between class variation) and one that is orthogonal to Y (within class variation). The main benefit of interpretation using OPLS is that class separation is revealed in the first predictive component while variation that is unrelated to class separation is seen in the orthogonal components (Wiklund et al., 2008).
11
Skewness describes the asymmetry of a statistical dataset relative to the normal distribution. Log-transformation is used to normalize positively skewed data but can only be applied to numbers above zero. In cases where the data has a natural zero value, this limitation can be worked around by adding a constant to ensure that all values in the dataset will be above zero. In this work, a constant value of 0.1 was added prior to log-transformation of the data.
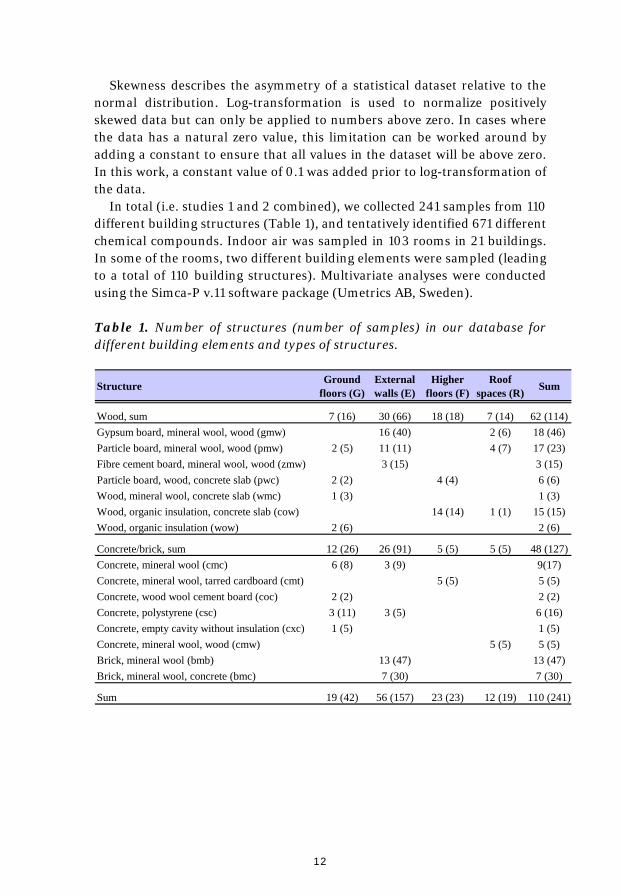
In total (i.e. studies 1 and 2 combined), we collected 241 samples from 110 different building structures (Table 1), and tentatively identified 671 different chemical compounds. Indoor air was sampled in 103 rooms in 21 buildings. In some of the rooms, two different building elements were sampled (leading to a total of 110 building structures). Multivariate analyses were conducted using the Simca-P v.11 software package (Umetrics AB, Sweden).
Table 1. Number of structures (number of samples) in our database for different building elements and types of structures.
StructureGround
floors (G)External walls (E)
Higher floors (F)
Roof spaces (R)
Sum
Wood, sum 7 (16) 30 (66) 18 (18) 7 (14) 62 (114)
Gypsum board, mineral wool, wood (gmw) 16 (40) 2 (6) 18 (46)
Particle board, mineral wool, wood (pmw) 2 (5) 11 (11) 4 (7) 17 (23)
Fibre cement board, mineral wool, wood (zmw) 3 (15) 3 (15)
Particle board, wood, concrete slab (pwc) 2 (2) 4 (4) 6 (6)
Wood, mineral wool, concrete slab (wmc) 1 (3) 1 (3)
Wood, organic insulation, concrete slab (cow) 14 (14) 1 (1) 15 (15)
Wood, organic insulation (wow) 2 (6) 2 (6)
Concrete/brick, sum 12 (26) 26 (91) 5 (5) 5 (5) 48 (127)
Concrete, mineral wool (cmc) 6 (8) 3 (9) 9(17)
Concrete, mineral wool, tarred cardboard (cmt) 5 (5) 5 (5)
Concrete, wood wool cement board (coc) 2 (2) 2 (2)
Concrete, polystyrene (csc) 3 (11) 3 (5) 6 (16)
Concrete, empty cavity without insulation (cxc) 1 (5) 1 (5)
Concrete, mineral wool, wood (cmw) 5 (5) 5 (5)
Brick, mineral wool (bmb) 13 (47) 13 (47)
Brick, mineral wool, concrete (bmc) 7 (30) 7 (30)
Sum 19 (42) 56 (157) 23 (23) 12 (19) 110 (241)
12

13
Results
Breakthrough field tests Breakthrough field tests were performed in a single building in study 1. Breakthrough values for selected representative compounds were calculated as the percentage of the average concentration of the VOC in the back-up tube relative to the average in the front tube, with two replicates being measured in both cases (Table 2). The masses for heptane and toluene were corrected with the average masses found in field blanks.
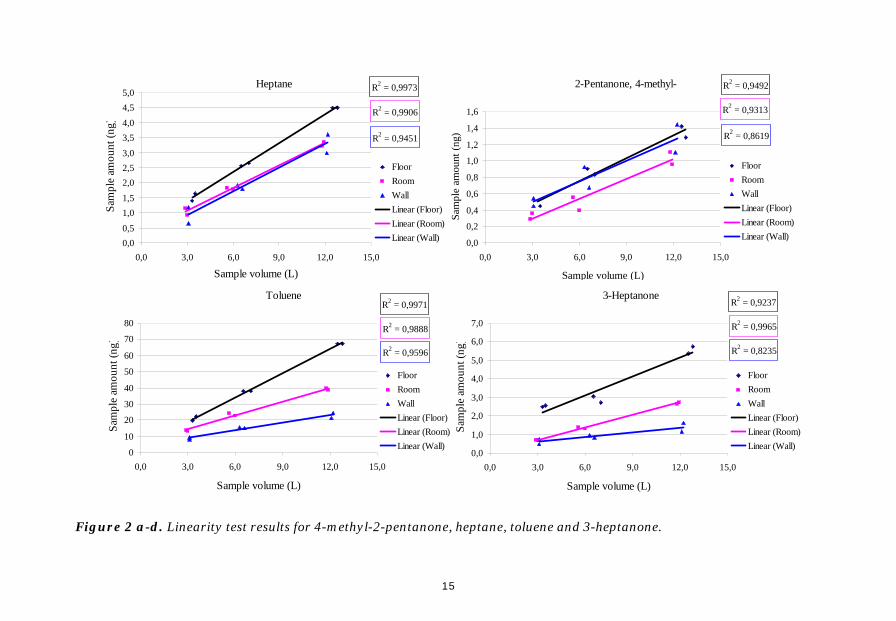
Only a few of the most volatile compounds (i.e. 2-methylbutane and acetone) included in our analysis broke through at pump flow rates of 50 ml/min. Most of the compounds that broke through at 200 ml/min also broke through at 100 ml/min, but to a lesser extent. 4-Methyl-2-pentanone, heptane, toluene and 3-heptanone all had breakthrough values of < 5 % and were checked for linearity (Figures 2a-d). The precision of the two replicate measurements, expressed as the relative percent difference between replicates, were sometimes over the 25 % limit specified in the TO-17 standard (EPA, 1999). This explains why some of the compounds did not satisfy the performance criterion requiring a linear regression coefficient (R2) of 0.96 or better (Figures 2a-d).

Table 2. Average concentrations (in µg/m3) and standard deviations (SD) for some representative compounds detected in the front (sample) and back-up tubes after sampling floor and wall structures and indoor air. The average values and SD were calculated for the two replicates at each volume. BT % was calculated as the percentage of the average concentration found in the back-up tube relative to the average concentration found in the front tube.
Sample Average (SD)
Backup Average (SD)
BT %Sample Average (SD)
BackAver
3.97 78-78-4 Butane, 2-methyl- Floor 0.16 (0.042) 0.15 (0.019) 90 0.09 (0.007) 0.07 Room 0.21 (0.009) 0.20 (0.002) 93 0.10 (0.003) 0.11 Wall 0.28 (0.046) 0.24 (0.002) 84 0.13 (0.028) 0.13
6.64 78-83-1 1-Propanol, 2-methyl- Floor 0.14 (0.014) 0 0 0.13 (0.008) 0.04 (0Room 0.18 (0.021) 0 0 0.14 (0.001) 0.02 Wall 0.35 (0.135) 0.05 (0.064) 13 0.27 (0.084) 0.12
6.67 96-37-7 Cyclopentane, methyl- Floor 0.13 (0.030) 0 0 0.09 (0.005) 0.05 Room 0.17 (0.239) 0 0 0.22 (0.029) 0.09
7.71 71-36-3 1-Butanol Floor 2.07 (2.931) 0 0 3.21 (0.131)Room 12.95 (0.620) 0 0 9.78 (2.029) 0.97 Wall 62.90 (22.491) 3.61 (5.103) 6 46.65 (15.907) 11.38
9.45 108-87-2 Cyclohexane, methyl- Floor 0.27 (0.012) 0.08 (0.015) 31 0.15 (0.006) 0.08 Room 0.18 (0.001) 0 0 0.11 (0.047) 0.02 Wall 0.40 (0.030) 0.04 (0.050) 9 0.26 (0.125) 0.08
8.68 142-82-5 Heptane Floor 0.44 (0.033) 0 0 0.39 (0.009) 0.01 Room 0.35 (0.061) 0 0 0.31 (0.021)Wall 0.30 (0.123) 0 0 0.29 (0.021) 0.01
9.93 108-10-1 2-Pentanone, 4-methyl- Floor 0.06 (0.091) 0 0 0.13 (0.014)Room 0.11 (0.012) 0 0 0.08 (0.023)Wall 0.16 (0.021) 0 0 0.12 (0.031)
10.77 108-88-3 Toluene Floor 6.14 (0.279) 0 0 5.64 (0.328)Room 4.53 (0.147) 0.06 (0.054) 1 4.03 (0.348) 0.02 Wall 2.77 (0.324) 0 0 2.35 (0.106) 0.02
13.91 106-35-4 3-Heptanone Floor 0.66 (0.013) 0 0 0.39 (0.058)Room 0.24 (0.003) 0 0 0.23 (0.020)Wall 0.19 (0.055) 0 0 0,14 (0.017)
Chemical compoundCASRT Location
50 ml/min 100 ml/min
up age (SD)
BT %Sample Average (SD)
Backup Average (SD)
BT %
(0.006) 79 0.04 (0.005) 0.04 (0.001) 102(0.008) 102 0.06 (0.003) 0.05 (0.004) 85(0.033) 99 0.07 (0.007) 0.07 (0.001) 95
.003) 27 0.09 (0.002) 0.05 (0.001) 59(0.026) 13 0.09 (0.001) 0.05 (0.004) 55(0.037) 45 0.18 (0,086) 0.14 (0.057) 76(0.007) 54 0.06 (0.008) 0.04 (0.003) 77(0.009) 38 0.10 (0.008) 0.06 (0.006) 63
0 0 2.41 (0.039) 0 0(0.384) 10 4.24 (0.235) 1.52 (0.167) 36(2.021) 24 40.60 (16.153) 13.6 (4.955) 33(0.009) 55 0.08 (0.001) 0.06 (0.001) 69(0.030) 20 0.09 (0.033) 0.03 (0.002) 37(0.020) 31 0.23 (0.068) 0.08 (0.029) 33(0.004) 1 0.35 (0.007) 0.03 (0.003) 8
0 0 0.28 (0.006) 0.01 (0.018) 5(0.003) 1 0.27 (0.034) 0.01 (0.016) 5
0 0 0.11 (0.010) 0 00 0 0.09 (0.009) 0 00 0 0.10 (0.019) 0 00 0 5.32 (0.089) 0.11 (0.014) 2
(0.026) 0 3.30 (0.081) 0.04 (0.023) 1(0.008) 1 1.88 (0.186) 0.02 (0.001) 1
0 0 0.42 (0.015) 0 00 0 0.23 (0.003) 0 00 0 0.11 (0.026) 0 0
200 ml/min
14
15
Heptane R2 = 0,9973
R2 = 0,9906
R2 = 0,9451
0,0
0,5
1,0
1,5
2,0
2,5
3,0
3,5
4,0
4,5
5,0
0,0 3,0 6,0 9,0 12,0 15,0
Sample volume (L)
Sam
ple
amou
nt (
ng)
Floor
Room
Wall
Linear (Floor)
Linear (Room)
Linear (Wall)
2-Pentanone, 4-methyl- R2 = 0,9492
R2 = 0,9313
R2 = 0,8619
0,0
0,2
0,4
0,6
0,8
1,0
1,2
1,4
1,6
0,0 3,0 6,0 9,0 12,0 15,0
Sample volume (L)
Sam
ple
amou
nt (
ng)
Floor
Room
Wall
Linear (Floor)
Linear (Room)
Linear (Wall)
TolueneR2 = 0,9971
R2 = 0,9888
R2 = 0,9596
0
10
20
30
40
50
60
70
80
0,0 3,0 6,0 9,0 12,0 15,0
Sample volume (L)
Sam
ple
amou
nt (
ng)
Floor
Room
Wall
Linear (Floor)
Linear (Room)
Linear (Wall)
3-HeptanoneR2 = 0,9237
R2 = 0,9965
R2 = 0,8235
0,0
1,0
2,0
3,0
4,0
5,0
6,0
7,0
0,0 3,0 6,0 9,0 12,0 15,0
Sample volume (L)
Sam
ple
amou
nt (
ng)
Floor
Room
Wall
Linear (Floor)
Linear (Room)
Linear (Wall)
Figure 2 a-d. Linearity test results for 4-methyl-2-pentanone, heptane, toluene and 3-heptanone.

TVOC TVOC values were used to compare the overall levels of emissions from different building elements and structures (Table 3). The samples with the highest TVOC values (those in the 90th percentile) had concentrations ranging from 730-5667 µg/m3. Most building elements exhibited relatively low emissions compared to concrete ground floors, which generally had higher TVOC emissions (Figure 3). The structure types with the highest TVOC values were concrete structures with wood wool cement board insulation (coc, ground floors), concrete structures with polystyrene insulation (csc, both ground floors and external walls) and concrete structures with mineral wool insulation (cmc), either as such or in combination with tarred cardboard as a damp proof membrane (cmt, higher floors) or wooden joists (wmc, ground floors).
Table 3. Approximate TVOC concentrations in µg/m3 corresponding to the 50th (median) and 90th TVOC percentiles for samples collected in different types of building elements and structures.
Ground floors (G)
External walls (E)
Higher floors (F)
Roof spaces (R)
Wood
Gypsum board, mineral wool, wood (gmw) 25.9 (53.9) 4.8 (42.7)
Particle board, mineral wool, wood (pmw) 26.3 (116.1) 40.2 (126.0) 33.2 (66.5)
Fibre cement board, mineral wool, wood (zmw) 15.1 (52.4)
Particle board, wood, concrete slab (pwc) 292.4 (439.7) 223.6 (304.5)
Wood, mineral wool, concrete slab (wmc) 645.5 (2204.9)
Wood, organic insulation, concrete slab (cow) 62.6 (208.2) 3065.6
Wood, organic insulation (wow) 69.8 (541.3)
Concrete/brick
Concrete, mineral wool (cmc) 1012.6 (2112.4) 24.4 (102.6)
Concrete, mineral wool, tarred cardboard (cmt) 643.9 (5647.3)
Concrete, wood wool cement board (coc) 4312.7 (4743.3)
Concrete, polystyrene (csc) 1130.9 (1716.1) 635.2 (1135.8)
Concrete, empty cavity without insulation (cxc) 72.3 (81.4)
Concrete, mineral wool, wood (cmw) 65.6 (84.3)
Brick, mineral wool (bmb) 8.7 (27.6)
Brick, mineral wool, concrete (bmc) 10.3 (49.9)
Type of structure / building elementTVOC 50th %-tile (90th %-tile) µg/m3
16
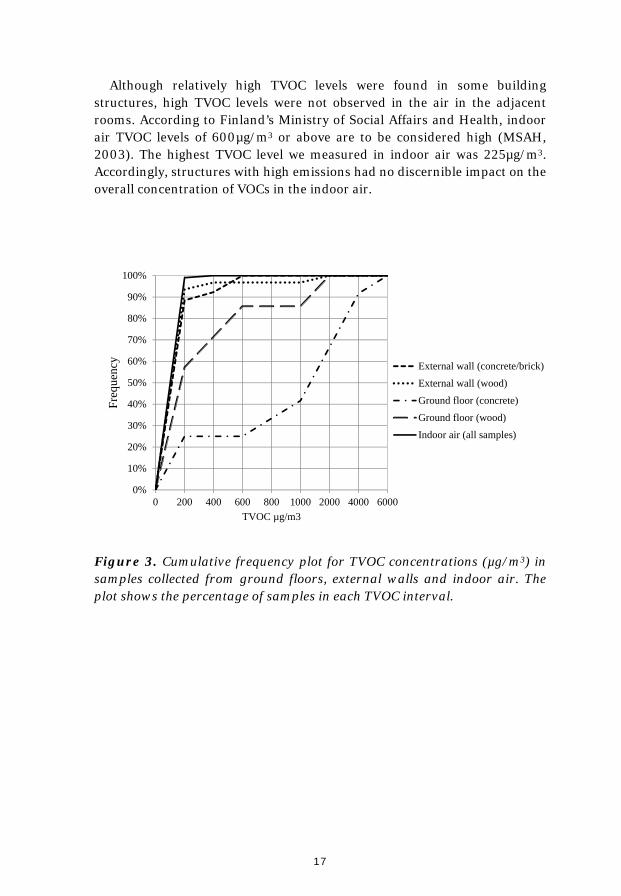
Although relatively high TVOC levels were found in some building structures, high TVOC levels were not observed in the air in the adjacent rooms. According to Finland’s Ministry of Social Affairs and Health, indoor air TVOC levels of 600µg/m3 or above are to be considered high (MSAH, 2003). The highest TVOC level we measured in indoor air was 225µg/m3. Accordingly, structures with high emissions had no discernible impact on the overall concentration of VOCs in the indoor air.
0%
10%
20%
30%
40%
50%
60%
70%
80%
90%
100%
0 200 400 600 800 1000 2000 4000 6000
Fre
quen
cy
TVOC µg/m3
External wall (concrete/brick)
External wall (wood)
Ground floor (concrete)
Ground floor (wood)
Indoor air (all samples)
Figure 3. Cumulative frequency plot for TVOC concentrations (µg/m3) in samples collected from ground floors, external walls and indoor air. The plot shows the percentage of samples in each TVOC interval.
17
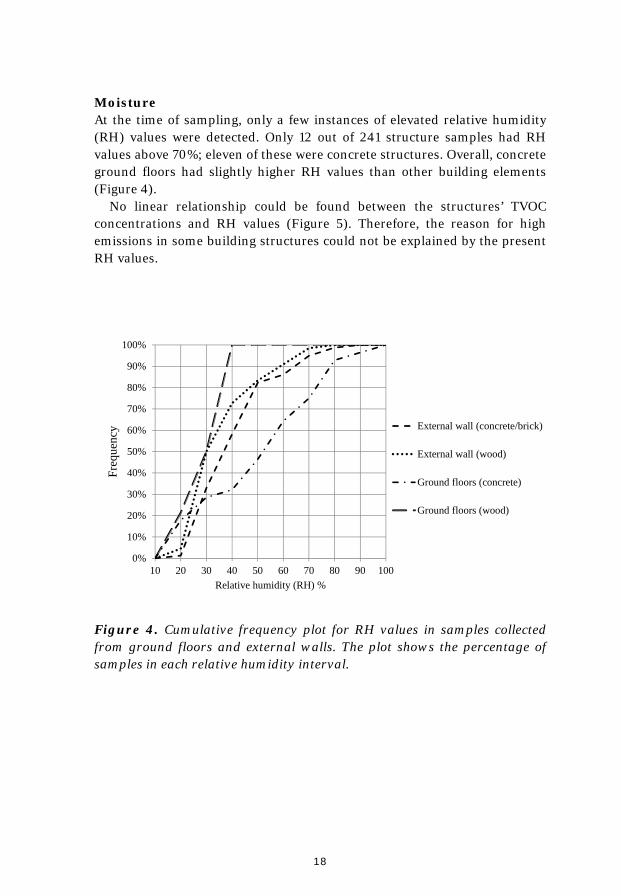
Moisture At the time of sampling, only a few instances of elevated relative humidity (RH) values were detected. Only 12 out of 241 structure samples had RH values above 70%; eleven of these were concrete structures. Overall, concrete ground floors had slightly higher RH values than other building elements (Figure 4).
No linear relationship could be found between the structures’ TVOC concentrations and RH values (Figure 5). Therefore, the reason for high emissions in some building structures could not be explained by the present RH values.
0%
10%
20%
30%
40%
50%
60%
70%
80%
90%
100%
10 20 30 40 50 60 70 80 90 100
Fre
quen
cy
Relative humidity (RH) %
External wall (concrete/brick)
External wall (wood)
Ground floors (concrete)
Ground floors (wood)
Figure 4. Cumulative frequency plot for RH values in samples collected from ground floors and external walls. The plot shows the percentage of samples in each relative humidity interval.
18

0
10
20
30
40
50
60
70
80
90
100
1-7 8-910-1
213-2
021-2
728-3
940-6
5
66-131
132-68
1
682-56
67
TVOC µg/m3 (percentile intervals)
RH
%
Max
Mean
Min
Figure 5. The relative humidity (RH %) in building structures in relation to measured TVOC levels expressed as percentile intervals.
19
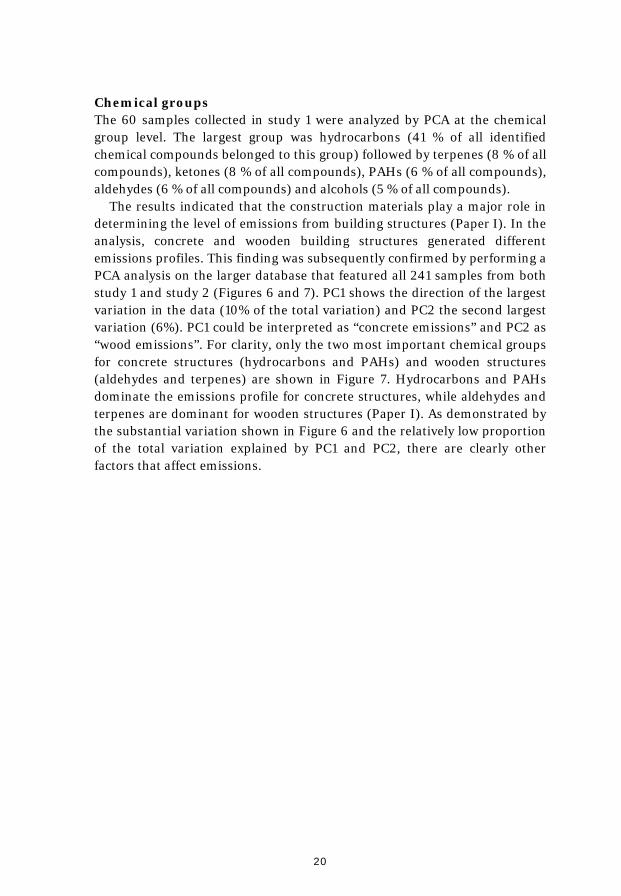
Chemical groups The 60 samples collected in study 1 were analyzed by PCA at the chemical group level. The largest group was hydrocarbons (41 % of all identified chemical compounds belonged to this group) followed by terpenes (8 % of all compounds), ketones (8 % of all compounds), PAHs (6 % of all compounds), aldehydes (6 % of all compounds) and alcohols (5 % of all compounds).
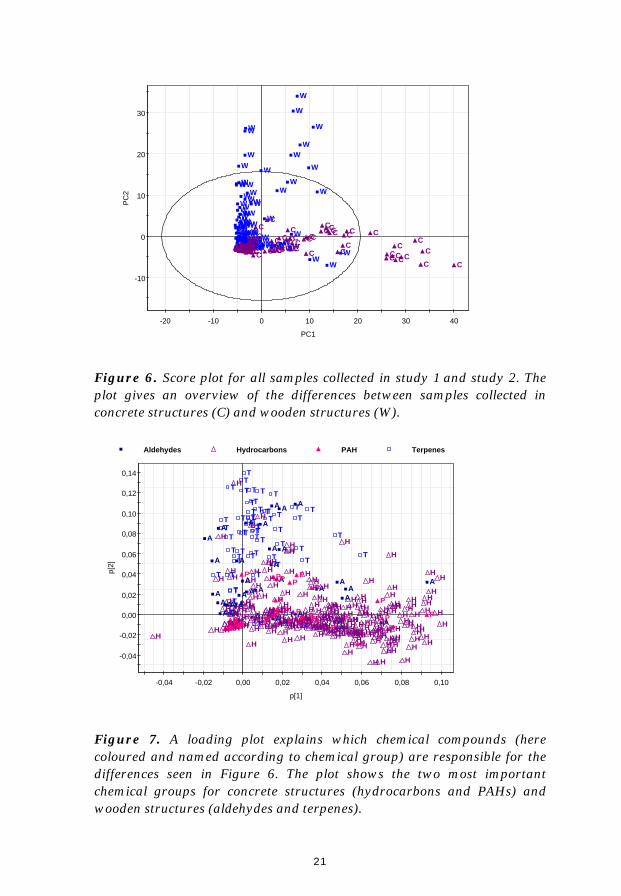
The results indicated that the construction materials play a major role in determining the level of emissions from building structures (Paper I). In the analysis, concrete and wooden building structures generated different emissions profiles. This finding was subsequently confirmed by performing a PCA analysis on the larger database that featured all 241 samples from both study 1 and study 2 (Figures 6 and 7). PC1 shows the direction of the largest variation in the data (10% of the total variation) and PC2 the second largest variation (6%). PC1 could be interpreted as “concrete emissions” and PC2 as “wood emissions”. For clarity, only the two most important chemical groups for concrete structures (hydrocarbons and PAHs) and wooden structures (aldehydes and terpenes) are shown in Figure 7. Hydrocarbons and PAHs dominate the emissions profile for concrete structures, while aldehydes and terpenes are dominant for wooden structures (Paper I). As demonstrated by the substantial variation shown in Figure 6 and the relatively low proportion of the total variation explained by PC1 and PC2, there are clearly other factors that affect emissions.
20
-10
0
10
20
30
-20 -10 0 10 20 30 40
PC
2
PC1
W
W
W
W
WW
W
WW
W
W
WWWW
WWWWWWWW
W
W
W
W
WWWWWWWWWW
W
WWWWW
W
W
W
W
WWWWW WW
W WWWWWWWWWWW
W
W
WW
W
W
W
WWW
W
W
WW
WW
W
WW
WWWW
W
WWW WWWW
WW
W
WW
W
W
W
W
W
WWW
W
WW
W
C
C
CC
CCCCCCCCCCCCC
C CCC
CCCCC
CCCC
CC
C
CC
C
CCCCC
C CCC C
C
CC
C CC CCCC
C CCCCCCCC
CCCCCC CCCCCCCCCCCCC C
CCCC
CCCCCCCCCCCCCCCC
C
C
CCCCCCCCC
C
C CC
C CCCCCC
Figure 6. Score plot for all samples collected in study 1 and study 2. The plot gives an overview of the differences between samples collected in concrete structures (C) and wooden structures (W).
-0,04
-0,02
0,00
0,02
0,04
0,06
0,08
0,10
0,12
0,14
-0,04 -0,02 0,00 0,02 0,04 0,06 0,08 0,10
p[2]
p[1]
Aldehydes Hydrocarbons PAH Terpenes
A
A
A
A AA A
A
A
A
A
A
A
A
A
A
A
A
A
AA
A
A
A
A
AA
A
A
AA
A
A
AA
AA
A
HHHH
H H
HH
HH
H
H
H
H H
HH
H
H
H
HH
HHH
H H
H
H
H
H
H
HH
H
H
H
H
HH
H
H
H HHH
H
HH
H
H
H
H
HH H
HH
HH
H
H
H
H H
H
H
H
H
HH
H
H
HH
HHH
H
H
HH
H
H
H H H H
H HHH
H
H H HH
HH H
HH
H
H
H
H
H
HH
HH
H HHH
HH
HHH
HH
HH H
H
H
HH
HH
H
H
H HH
H
H
HH
H
H
H
H
HH
H
H
H HH
H
HH
H
HH HH
H
HH
H
H
H
H
H
H
H
H
H
H
HH
H HH
HHH
H H
H
H
H
HH
H
H
H
H
H
H
HH
HH
HH
H
H
H
HH
H H
H
H
H HHH
H
H
H
HH
H
H
HHH
HH
HHH
H
H
HH
H
HH
HHH
H
H
HH
H
H H
H
HH
H
H
H H
HH
H
HHH
H
H
H
HHH H
HH
HH
HHH
H
H
H
H
H HH
PPP P PPP
P P
PP
PP
P
PPP PPPP PP
P
P
P
P
P
PPPP
P
P
PP P
P
T
T
T
T
T
T
T
T
T
T T
T
T
T
TT
T
T
T T
T
T
T
T
T
TT
T
T
TT
T
T
T
T
T
T
T
T
T
TT
T
T
TT
T
T
TT
T
T
T
T
T
T
T
Figure 7. A loading plot explains which chemical compounds (here coloured and named according to chemical group) are responsible for the differences seen in Figure 6. The plot shows the two most important chemical groups for concrete structures (hydrocarbons and PAHs) and wooden structures (aldehydes and terpenes).
21
Chemical compounds OPLS was used to identify emissions profiles for several types of structures. Because of the different profiles observed for wooden and concrete structures (Paper I), these samples were analysed separately. Concrete ground floors were observed to generate substantially higher emissions than other building elements (Figure 3). In order to identify the sources of these emissions, the first OPLS analysis focused on comparing concrete ground floors to concrete/brick external walls (Table 4). It was found that the relatively high emissions from concrete floors were partially due to emissions from PVC flooring. The emissions profile for PVC flooring was dominated by alcohols and ketones such as 2-ethyl-1-hexanol, 3-heptanone, 3-hexanone and 2-pentanone. All of the studied concrete ground floors were covered by a PVC surface. These emissions were higher in all types of ground floor structures than in external walls, except in structures without insulation (denoted cxc in Table 5).
Concrete structures with polystyrene insulation consistently exhibited relatively high emissions (both ground floors and external walls in Table 3). A second OPLS analysis compared these structures to structures containing other types of insulation. Both PVC flooring and polystyrene insulation emissions can be distinguished in Table 5 and some of the most important compounds identified in the PVC emission profile (Table 4) are highlighted in bold. The profile for polystyrene insulation was dominated by hydrocarbons like styrene, ethylbenzene, isopropylbenzene and propylbenzene. These compounds were present at much higher concentrations in structures with polystyrene insulation than in structures with other insulating materials, but they were not unique to such structures and were found in smaller amounts in the other structure types (explanation of abbreviations used in Table 5 can be found in Table 3).
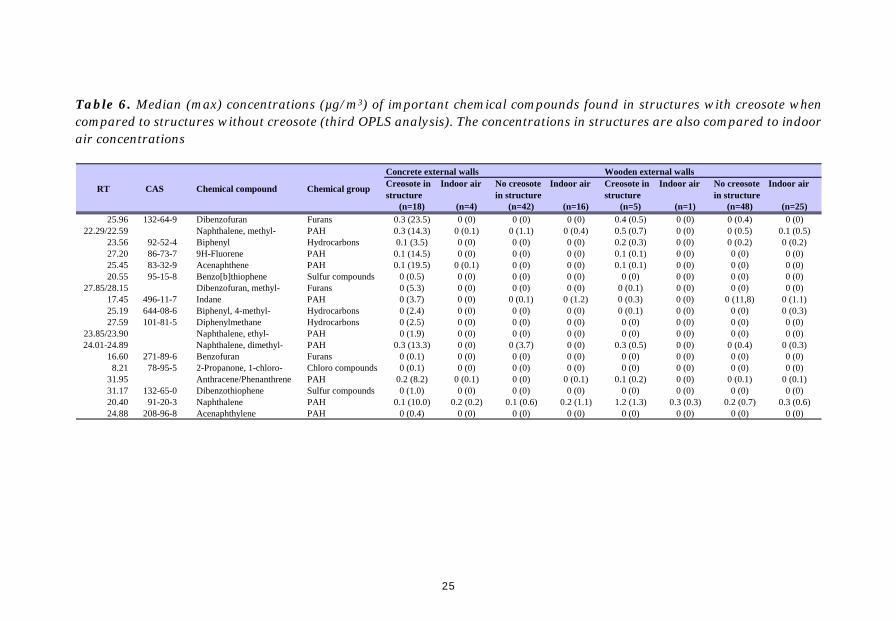
Samples collected in external walls exhibited also another distinctive profile, although at low VOC concentrations. Apparently, creosote had been used as a wood preservative or to provide damp proofing in three of the buildings, two of which were made of concrete/brick and one of wood. A third OPLS analysis was conducted to identify an emissions profile for creosote-treated materials. Samples collected in the two concrete/brick buildings where creosote had been used were compared to the other concrete/ brick external wall samples where no creosote had been used. The most important compounds in the creosote profile are listed in Table 6, which also include the building made of wood for comparative purposes. Most of the identified chemicals belonged to the PAH chemical group and their concentrations varied between samples, i.e. different samples from a single structure often contained different levels of PAHs (data not shown). Many of the identified PAHs are specific to this type of (old) building material, with the exception of naphthalene and alkylnaphthalenes.
22

23
Other specific chemical compounds found, mostly in external walls, were trichloroanisole and tetrachloroanisole. Chloroanisoles are formed by microbial methylation of chlorophenols, which are found in PCP-treated wood.
Table 4. Median (max) concentrations (µg/m3) of important chemical compounds found in concrete ground floors and concrete external walls (first OPLS analysis). The concentrations in structures are also compared to indoor air concentrations.
RT CAS Chemical compound Chemical group Structure Indoor air Structure Indoor air (n=25) (n=11) (n=91) (n=26)
17.32 104-76-7 1-Hexanol, 2-ethyl- Alcohols 83.8 (396.4) 0 (1.9) 0.1 (5.0) 0.9 (14.7)13.91 106-35-4 3-Heptanone Ketones 33.6 (211.7) 0 (0.3) 0 (2.8) 0.1 (0.3)11.23 589-38-8 3-Hexanone Ketones 0.6 (7.0) 0 (0) 0 (0.1) 0 (0)
8.36 107-87-9 2-Pentanone Ketones 1.2 (15.9) 0 (0.1) 0 (0.4) 0 (0.1)9.93 108-10-1 2-Pentanone, 4-methyl- Ketones 0.6 (36.3) 0 (0) 0 (0.2) 0 (0.4)
23.35 629-59-4 Tetradecane Hydrocarbons 0.8 (81.4) 0.2 (0.4) 0 (49.1) 0.3 (1.5)21.81 629-50-5 Tridecane Hydrocarbons 1.8 (118.5) 0.1 (0.2) 0 (12.0) 0.2 (1.1)
9.45 108-87-2 Cyclohexane, methyl- Hydrocarbons 0.8 (27.1) 0 (0.3) 0 (0.3) 0 (0.5)5.78 123-72-8 Butanal Aldehydes 0.4 (1.2) 0 (0.1) 0 (0.8) 0.1 (0.1)
18.38 1120-21-4 Undecane Hydrocarbons 1.8 (123.7) 0.3 (0.6) 0 (18.2) 0.3 (4.8)10.33 565-61-7 2-Pentanone, 3-methyl- Ketones 0.1 (6.5) 0 (0) 0 (0) 0 (0)12.93 105-42-0 2-Hexanone, 4-methyl- Ketones 0.9 (11.3) 0 (0) 0.1 (0.1) 0 (0)
8.68 142-82-5 Heptane Hydrocarbons 0.4 (20.3) 0.1 (1.9) 0.1 (1.7) 0.1 (1.9)20.16 112-40-3 Dodecane Hydrocarbons 0.7 (109.0) 0.2 (0.3) 0 (24.0) 0.2 (1.2)15.50 123-05-7 Hexanal, 2-ethyl- Aldehydes 2.2 (42.1) 0 (0.1) 0 (0.3) 0 (0.3)10.26 565-69-5 3-Pentanone, 2-methyl- Ketones 0.1 (14.8) 0 (0) 0 (0) 0 (0)20.93 54676-39-0 Cyclohexane, 2-butyl-
1,1,3-trimethyl-Hydrocarbons 2.4 (63.9) 0 (0) 0 (3.1) 0 (0)
11.36 591-78-6 2-Hexanone Ketones 1.6 (16.1) 0 (0) 0 (0.2) 0 (0.1)10.65 592-27-8 Heptane, 2-methyl- Hydrocarbons 0.1 (4.6) 0 (0.6) 0 (0.2) 0 (0.6)
6.64 78-83-1 1-Propanol, 2-methyl- Alcohols 0.9 (11.0) 0 (0) 0 (15.5) 0 (0.4)24.20 1135-66-6 Isolongifolene Terpenes 0 (112.6) 0 (0.1) 0 (0) 0 (0.6)10.87 589-81-1 Heptane, 3-methyl- Hydrocarbons 0.1 (2.7) 0 (0.6) 0 (0.3) 0 (0.6)13.19 110-12-3 2-Hexanone, 5-methyl- Ketones 0 (3.8) 0 (0) 0 (0) 0 (0)12.60 623-56-3 3-Hexanone, 5-methyl- Ketones 0.2 (8.8) 0 (0) 0 (0) 0 (0)
5.88 78-93-3 2-Butanone Ketones 1.6 (17.6) 0 (0.1) 0 (0.4) 0 (0.3)14.19 Xylene Hydrocarbons 1.9 (32.9) 0 (2.6) 0.1 (6.8) 0 (4.9)16.49 Benzene, trimethyl- Hydrocarbons 3.3 (33.1) 0 (2.3) 0.3 (5.0) 0 (6.3)14.38 111-76-2 Ethanol, 2-butoxy- Glycol ethers 1.2 (20.7) 0 (0.1) 0 (14.7) 0.1 (0.5)11.62 111-65-9 Octane Hydrocarbons 0.4 (13.7) 0 (0) 0 (0.6) 0 (1.6)
Ground floors External walls
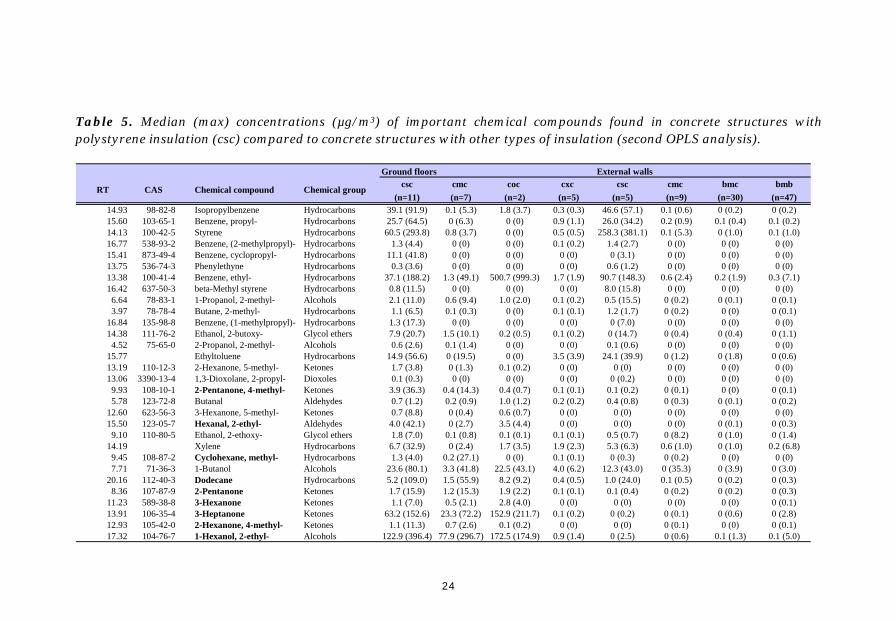
Table 5. Median (max) concentrations (µg/m3) of important chemical compounds found in concrete structures with polystyrene insulation (csc) compared to concrete structures with other types of insulation (second OPLS analysis).
csc cmc coc cx
(n=11) (n=7) (n=2) (n14.93 98-82-8 Isopropylbenzene Hydrocarbons 39.1 (91.9) 0.1 (5.3) 1.8 (3.7) 0.315.60 103-65-1 Benzene, propyl- Hydrocarbons 25.7 (64.5) 0 (6.3) 0 (0) 0.914.13 100-42-5 Styrene Hydrocarbons 60.5 (293.8) 0.8 (3.7) 0 (0) 0.516.77 538-93-2 Benzene, (2-methylpropyl)- Hydrocarbons 1.3 (4.4) 0 (0) 0 (0) 0.115.41 873-49-4 Benzene, cyclopropyl- Hydrocarbons 11.1 (41.8) 0 (0) 0 (0) 013.75 536-74-3 Phenylethyne Hydrocarbons 0.3 (3.6) 0 (0) 0 (0) 013.38 100-41-4 Benzene, ethyl- Hydrocarbons 37.1 (188.2) 1.3 (49.1) 500.7 (999.3) 1.716.42 637-50-3 beta-Methyl styrene Hydrocarbons 0.8 (11.5) 0 (0) 0 (0) 0
6.64 78-83-1 1-Propanol, 2-methyl- Alcohols 2.1 (11.0) 0.6 (9.4) 1.0 (2.0) 0.13.97 78-78-4 Butane, 2-methyl- Hydrocarbons 1.1 (6.5) 0.1 (0.3) 0 (0) 0.1
16.84 135-98-8 Benzene, (1-methylpropyl)- Hydrocarbons 1.3 (17.3) 0 (0) 0 (0) 014.38 111-76-2 Ethanol, 2-butoxy- Glycol ethers 7.9 (20.7) 1.5 (10.1) 0.2 (0.5) 0.1
4.52 75-65-0 2-Propanol, 2-methyl- Alcohols 0.6 (2.6) 0.1 (1.4) 0 (0) 015.77 Ethyltoluene Hydrocarbons 14.9 (56.6) 0 (19.5) 0 (0) 3.513.19 110-12-3 2-Hexanone, 5-methyl- Ketones 1.7 (3.8) 0 (1.3) 0.1 (0.2) 013.06 3390-13-4 1,3-Dioxolane, 2-propyl- Dioxoles 0.1 (0.3) 0 (0) 0 (0) 0
9.93 108-10-1 2-Pentanone, 4-methyl- Ketones 3.9 (36.3) 0.4 (14.3) 0.4 (0.7) 0.15.78 123-72-8 Butanal Aldehydes 0.7 (1.2) 0.2 (0.9) 1.0 (1.2) 0.2
12.60 623-56-3 3-Hexanone, 5-methyl- Ketones 0.7 (8.8) 0 (0.4) 0.6 (0.7) 015.50 123-05-7 Hexanal, 2-ethyl- Aldehydes 4.0 (42.1) 0 (2.7) 3.5 (4.4) 0
9.10 110-80-5 Ethanol, 2-ethoxy- Glycol ethers 1.8 (7.0) 0.1 (0.8) 0.1 (0.1) 0.114.19 Xylene Hydrocarbons 6.7 (32.9) 0 (2.4) 1.7 (3.5) 1.9
9.45 108-87-2 Cyclohexane, methyl- Hydrocarbons 1.3 (4.0) 0.2 (27.1) 0 (0) 0.17.71 71-36-3 1-Butanol Alcohols 23.6 (80.1) 3.3 (41.8) 22.5 (43.1) 4.0
20.16 112-40-3 Dodecane Hydrocarbons 5.2 (109.0) 1.5 (55.9) 8.2 (9.2) 0.48.36 107-87-9 2-Pentanone Ketones 1.7 (15.9) 1.2 (15.3) 1.9 (2.2) 0.1
11.23 589-38-8 3-Hexanone Ketones 1.1 (7.0) 0.5 (2.1) 2.8 (4.0) 013.91 106-35-4 3-Heptanone Ketones 63.2 (152.6) 23.3 (72.2) 152.9 (211.7) 0.112.93 105-42-0 2-Hexanone, 4-methyl- Ketones 1.1 (11.3) 0.7 (2.6) 0.1 (0.2) 017.32 104-76-7 1-Hexanol, 2-ethyl- Alcohols 122.9 (396.4) 77.9 (296.7) 172.5 (174.9) 0.9
Chemical groupChemical compoundCASRT
Ground floorsc csc cmc bmc bmb
=5) (n=5) (n=9) (n=30) (n=47) (0.3) 46.6 (57.1) 0.1 (0.6) 0 (0.2) 0 (0.2) (1.1) 26.0 (34.2) 0.2 (0.9) 0.1 (0.4) 0.1 (0.2) (0.5) 258.3 (381.1) 0.1 (5.3) 0 (1.0) 0.1 (1.0) (0.2) 1.4 (2.7) 0 (0) 0 (0) 0 (0) (0) 0 (3.1) 0 (0) 0 (0) 0 (0) (0) 0.6 (1.2) 0 (0) 0 (0) 0 (0) (1.9) 90.7 (148.3) 0.6 (2.4) 0.2 (1.9) 0.3 (7.1) (0) 8.0 (15.8) 0 (0) 0 (0) 0 (0) (0.2) 0.5 (15.5) 0 (0.2) 0 (0.1) 0 (0.1) (0.1) 1.2 (1.7) 0 (0.2) 0 (0) 0 (0.1) (0) 0 (7.0) 0 (0) 0 (0) 0 (0) (0.2) 0 (14.7) 0 (0.4) 0 (0.4) 0 (1.1) (0) 0.1 (0.6) 0 (0) 0 (0) 0 (0) (3.9) 24.1 (39.9) 0 (1.2) 0 (1.8) 0 (0.6) (0) 0 (0) 0 (0) 0 (0) 0 (0) (0) 0 (0.2) 0 (0) 0 (0) 0 (0) (0.1) 0.1 (0.2) 0 (0.1) 0 (0) 0 (0.1) (0.2) 0.4 (0.8) 0 (0.3) 0 (0.1) 0 (0.2) (0) 0 (0) 0 (0) 0 (0) 0 (0) (0) 0 (0) 0 (0) 0 (0.1) 0 (0.3) (0.1) 0.5 (0.7) 0 (8.2) 0 (1.0) 0 (1.4) (2.3) 5.3 (6.3) 0.6 (1.0) 0 (1.0) 0.2 (6.8) (0.1) 0 (0.3) 0 (0.2) 0 (0) 0 (0)(6.2) 12.3 (43.0) 0 (35.3) 0 (3.9) 0 (3.0) (0.5) 1.0 (24.0) 0.1 (0.5) 0 (0.2) 0 (0.3) (0.1) 0.1 (0.4) 0 (0.2) 0 (0.2) 0 (0.3) (0) 0 (0) 0 (0) 0 (0) 0 (0.1) (0.2) 0 (0.2) 0 (0.1) 0 (0.6) 0 (2.8) (0) 0 (0) 0 (0.1) 0 (0) 0 (0.1) (1.4) 0 (2.5) 0 (0.6) 0.1 (1.3) 0.1 (5.0)
External walls
24
25
Table 6. Median (max) concentrations (µg/m3) of important chemical compounds found in structures with creosote when compared to structures without creosote (third OPLS analysis). The concentrations in structures are also compared to indoor air concentrations
RT CAS Chemical compound Chemical groupCreosote in structure
Indoor air No creosote in structure
Indoor air Creosote in structure
Indoor air No creosote in structure
Indoor air
(n=18) (n=4) (n=42) (n=16) (n=5) (n=1) (n=48) (n=25)
25.96 132-64-9 Dibenzofuran Furans 0.3 (23.5) 0 (0) 0 (0) 0 (0) 0.4 (0.5) 0 (0) 0 (0.4) 0 (0)22.29/22.59 Naphthalene, methyl- PAH 0.3 (14.3) 0 (0.1) 0 (1.1) 0 (0.4) 0.5 (0.7) 0 (0) 0 (0.5) 0.1 (0.5)
23.56 92-52-4 Biphenyl Hydrocarbons 0.1 (3.5) 0 (0) 0 (0) 0 (0) 0.2 (0.3) 0 (0) 0 (0.2) 0 (0.2)27.20 86-73-7 9H-Fluorene PAH 0.1 (14.5) 0 (0) 0 (0) 0 (0) 0.1 (0.1) 0 (0) 0 (0) 0 (0)25.45 83-32-9 Acenaphthene PAH 0.1 (19.5) 0 (0.1) 0 (0) 0 (0) 0.1 (0.1) 0 (0) 0 (0) 0 (0)20.55 95-15-8 Benzo[b]thiophene Sulfur compounds 0 (0.5) 0 (0) 0 (0) 0 (0) 0 (0) 0 (0) 0 (0) 0 (0)
27.85/28.15 Dibenzofuran, methyl- Furans 0 (5.3) 0 (0) 0 (0) 0 (0) 0 (0.1) 0 (0) 0 (0) 0 (0)17.45 496-11-7 Indane PAH 0 (3.7) 0 (0) 0 (0.1) 0 (1.2) 0 (0.3) 0 (0) 0 (11,8) 0 (1.1)25.19 644-08-6 Biphenyl, 4-methyl- Hydrocarbons 0 (2.4) 0 (0) 0 (0) 0 (0) 0 (0.1) 0 (0) 0 (0) 0 (0.3)27.59 101-81-5 Diphenylmethane Hydrocarbons 0 (2.5) 0 (0) 0 (0) 0 (0) 0 (0) 0 (0) 0 (0) 0 (0)
23.85/23.90 Naphthalene, ethyl- PAH 0 (1.9) 0 (0) 0 (0) 0 (0) 0 (0) 0 (0) 0 (0) 0 (0)24.01-24.89 Naphthalene, dimethyl- PAH 0.3 (13.3) 0 (0) 0 (3.7) 0 (0) 0.3 (0.5) 0 (0) 0 (0.4) 0 (0.3)
16.60 271-89-6 Benzofuran Furans 0 (0.1) 0 (0) 0 (0) 0 (0) 0 (0) 0 (0) 0 (0) 0 (0)8.21 78-95-5 2-Propanone, 1-chloro- Chloro compounds 0 (0.1) 0 (0) 0 (0) 0 (0) 0 (0) 0 (0) 0 (0) 0 (0)
31.95 Anthracene/Phenanthrene PAH 0.2 (8.2) 0 (0.1) 0 (0) 0 (0.1) 0.1 (0.2) 0 (0) 0 (0.1) 0 (0.1)31.17 132-65-0 Dibenzothiophene Sulfur compounds 0 (1.0) 0 (0) 0 (0) 0 (0) 0 (0) 0 (0) 0 (0) 0 (0)20.40 91-20-3 Naphthalene PAH 0.1 (10.0) 0.2 (0.2) 0.1 (0.6) 0.2 (1.1) 1.2 (1.3) 0.3 (0.3) 0.2 (0.7) 0.3 (0.6)24.88 208-96-8 Acenaphthylene PAH 0 (0.4) 0 (0) 0 (0) 0 (0) 0 (0) 0 (0) 0 (0) 0 (0)
Concrete external walls Wooden external walls
Discussion Our results show that the main factors influencing emissions in building structures are the materials from which they are constructed and the type of building element considered. The indoor concentrations of many air pollutants have a skewed non-normal distribution and the extreme values in the tail of the distribution may be the most interesting and important in terms of their health effects. Since only a few houses will have these extreme indoor levels, a large sample size may be required to get accurate data on this part of the distribution (ECA, 1994). Previous knowledge of important factors influencing indoor VOC levels could be exploited to overcome this problem. Moisture in buildings has been shown to cause chemical degradation of building materials and increase the concentration of VOCs in the air. When selecting buildings for study 1, structures with extensive moisture damage were therefore sought out in order to obtain the highest possible levels of individual chemical compounds. Although relatively high TVOC levels were found in some building structures, high TVOC levels were not observed in indoor air.
Even though we collected samples from 60 different structures (and also 60 room air samples), the data set in study 1 was too small and diverse to be able to answer all our questions. We therefore focused on collecting more samples from a smaller number of well-defined types of structures in study 2. The buildings were selected based on the materials used in their structures, and a greater number of structures that had not sustained any known damage were included. Because of difficulties with finding active water damage at the times of sampling and because of sampling inside closed building structures with old dried-out moisture damages, this field method was unsuitable for identifying differences in the emissions profiles of moisture damaged and undamaged structures. Therefore, this issue will have to be investigated in a laboratory where all of the materials in each tested structure are known, a range of RH values can be tested and the accumulation of emissions can be followed. Nevertheless, our results clearly demonstrated that old dried-out water-damaged building structures can retain high levels of VOCs, even though they are no longer being produced. The primary and secondary emissions from the materials present in the structures could be used to identify profiles and probable sources.
Some of the samples collected in concrete ground floors had higher emissions than other building elements due to compounds originating from PVC flooring, polystyrene insulation or both. As shown in Table 5, not all types of ground floors with PVC flooring had a dominant profile. The samples denoted cxc (five samples) were all from the same concrete structure, which had a PVC floor but was (to our knowledge) uninsulated. It is possible that this structure had never previously experienced dampness
26
problems or that in the absence of insulation there was no sink that could store old emissions and release them during sampling. The profile for polystyrene insulation was dominated by hydrocarbons such as styrene, ethylbenzene, isopropylbenzene and propylbenzene, which is consistent with previous studies of VOCs released from polystyrene (Kusch and Knupp, 2004; Vilaplana, 2007; Hodgson, 2003).
All VOC concentrations reported in this thesis are approximate. The use of toluene equivalents may lead to underestimates because the response factors of specific chemicals can differ substantially from that for toluene. However, this should not affect multivariate comparisons between samples because they were all treated in the same way. The use of Tenax as the adsorbent and the selected sampling volume could also result in underestimation of the concentrations of the more volatile target compounds. It should be noted that the building used for the breakthrough test was not optimal. Specifically, while the structures it contained and the nature of its previous moisture damage both suggested that it should have high VOC levels, this did not prove to be the case (as shown in Table 2). Only trace levels of VOCs were found and the building’s RH values were low. A pump flow rate of 50 ml/min is considered optimal (EPA, 1999) and our results also suggest that this flow rate would have ensured a better quantification of the most volatile compounds. However, because we anticipated that many of the VOCs (e.g. MVOCs) we were interested in would be present at trace levels, we decided to collect 12 L samples using pump flow rates of 200 ml/min and a one hour sampling time. This means that the concentrations for compounds eluting before methylcyclohexane (RT 9.46) are at risk of being underestimated. For example, methylbutane and pentane are used as blowing agents in the manufacture of polystyrene and could therefore have had a larger impact in our polystyrene profile if they had been quantitatively retained when sampling. This does, however, not change the results because a profile does not rely entirely on the presence of any individual compound.
One of our goals was to compare the emissions profiles for building structures to indoor air measurements collected in the centre of the adjacent room. Building materials continuously emit VOCs into the indoor air, but there are a number of other intermittent factors that affect indoor VOC concentrations, including the occupants and their activities. For practical reasons and to reduce the impact of occupants’ activities, most measurements were conducted in the afternoons and evenings outside school hours. It is to be assumed that the concentrations of chemicals emitted from building materials in the indoor air would have been higher if there had been no mechanical ventilation during sampling. Unfortunately, it was not possible to wait several hours for equilibration after turning off the ventilation and so the school janitor was instructed to keep the ventilation system operating as usual.
27

Most of the individual compounds we found inside building structures are also common in indoor air. However, the specific emissions profiles found in the structures could not be found in indoor air. This makes it difficult to determine whether the chemicals present in room air originated from building structures. A few specific compounds have been used as indicators for wood preservatives like PCP (indicated by trichloroanisole and tetrachloroanisole) and creosote (indicated by fluorene, acenaphthene, anthracene and phenanthrene). These compounds were typically identified in external walls, probably because wooden sills impregnated with PCP or creosote had been used. Not all of the chloroanisoles and creosote compounds found in structures were observed in the indoor air, but some were present in small quantities. Because these compounds are specific and typical for PCP or creosote-treated wood, it can be concluded that their presence in indoor air is due to emissions from the building structures. Table 6 shows that traces of creosote emissions were also detected in wooden external walls of buildings whose structures were classified as containing no creosote. The concentrations above zero are from a single structure whose emissions profile was not entirely consistent with that of creosote - only some of the creosote markers were present. Trace amounts of anthracene/phenanthrene, biphenyl, naphthalene and alkylnaphthalenes were also found in the indoor air samples collected in this school building. The problems with air quality in this building were suspected to originate from the crawl space. Air leakage from the crawl space to wall cavities and indoor air could explain the unclear creosote emission profile found.
To our knowledge, there have not been many studies investigating the leakage of chemicals from building structures to indoor air. Those that have been conducted (Hayashi and Osawa, 2008; Hachem et al., 2009, 2010) indicate that VOCs are transported from the building envelope to the indoor air. This would explain the presence of indicator compounds in indoor air in our study and indicates that ventilation systems are usually capable of removing most emissions from building materials. When the building itself is under investigation, the air inside building structures can be sampled. Much more information about possible primary and secondary emission sources can be obtained from samples of this kind, which would facilitate technical investigations in problem buildings. Nevertheless, more research is needed to determine ‘normal’ levels for VOCs inside different types of building structures.
28

Conclusions Sampling inside building structures gave us more information about both primary and secondary emissions from materials present in the structures than could have been obtained using only traditional indoor air VOC measurements. In addition, data analysis using multivariate methods enabled us to identify unique emissions profiles for individual building materials and material combinations. Sampling of VOCs in indoor air may not be sufficient to detect hidden emission sources, possibly because ventilation systems are capable of removing some of the pollutants. Several studies show the limitations of VOC sampling in indoor air where health symptoms exists but only low levels of pollutants can be measured. One possible explanation could be that we are not able to measure the compounds that negatively influence our health. Even if the impact of VOCs on health in many cases is unclear they can be used to indicate technical problems in buildings and for finding secondary emission sources. Sampling the air inside building structures has the advantage of eliminating emissions from sources other than the construction materials and can give higher levels of individual compounds compared to indoor air. This method therefore facilitates technical investigations in problem buildings and can be used to identify sources of emissions that are suspected to adversely affect occupant health.
29

Acknowledgements
This work was funded by the European Regional Development Fund Botnia-Atlantica (EU), the Regional Council of Ostrobothnia (Finland) and the County Administrative Board of Västerbotten (Sweden). I would like to thank my supervisors Ingrid Liljelind, Anna-Lena Sunesson and Berndt Stenberg for their invaluable help and guidance during my studies and research work and all my project co-workers at Novia University of Applied Sciences and Umeå University for their support in performing this project.
30

References
AGÖF (Arbeitsgemeinschaft Ökologischer Forschungsinstitute). 2008. Guidance Values for Volatile Organic Compounds in Indoor Air http://agoef.de/agoef/oewerte/orientierungswerte_englisch.html
Bornehag CG, Blomqvist G, Gyntelberg F, Järvholm B, Malmberg P, Nordvall L, Nielsen A, Pershagen G and Sundell J. 2001. Dampness in buildings and health. Nordic interdisciplinary review of the scientific evidence on associations between exposure to ”dampness” in buildings and health effects (NORDDAMP). Indoor Air, 11, 72-86.
Bornehag CG, Sundell J, Conini S, Custovic A, Malmberg P, Skerfving S, Sigsgaard T and Verhoeff A. 2004. Dampness in buildings as a risk factor for health effects, EUROEXPO: a multidisciplinary review of the literature (1998-2000) on dampness and mite exposure in buildings and health effects. Indoor Air, 14, 243-257.
Brown VM, Cockram AH, Crump DR and Gardiner D. 1990. Investigations of the volatile organic compound content of indoor air in homes with an odorous damp proof membrane. In: Proceedings of the 5th International Conference on Indoor Air Quality and Climate, Toronto.
Carrer P, Bruinen de Bruin Y, Franchi M and Valovirta E. 2002. The EFA project: Indoor air quality in European schools. In: Proceedings of the 9th International Conference on Indoor Air Quality and Climate, Monterey.
Claeson AS, Sandström M and Sunesson AL. 2007. Volatile organic compounds (VOCs) emitted from materials collected from buildings affected by microorganisms. Journal of Environmental Monitoring, 9, 240-245.
Daisey JM, Angell WJ and Apte MG. 2003. Indoor air quality, ventilation and health symptoms in schools: an analysis of existing information. Indoor Air, 13, 53-64.
Dettmer K and Engewald W. 2002. Adsorbent materials commonly used in air analysis for adsorptive enrichment and thermal desorption of volatile organic compounds. Analytical and Bioanalytical Chemistry, 373, 490-500.
ECA (European Concerted Action “Indoor Air Quality and Its Impact on Man”). 1991. Effects of indoor air pollution on human health. Report No 10,
31
EUR 14086 EN. Office for Official Publications of the European Communities, Luxembourg.
ECA (European Collaborative Action “Indoor Air Quality and Its Impact on Man”). 1994. Sampling strategies for volatile organic compounds (VOCs) in indoor air. Report No 14, EUR 16051 EN. Office for Official Publications of the European Communities, Luxembourg.
ECA (European Collaborative Action “Indoor Air Quality and Its Impact on Man”). 1997. Total volatile organic compounds (TVOC) in indoor air quality investigations. Report No 19, EUR 17675 EN. Office for Official Publications of the European Communities, Luxembourg.
ECA (European Collaborative Action “Urban Air, Indoor Environment and Human Exposure”). 2006. Strategies to determine and control the contributions of indoor air pollution to total inhalation exposure (STRATEX). Report No 25, EUR 22503 EN. Office for Official Publications of the European Communities, Luxembourg.
Edwards RD, Jurvelin J, Koistinen K, Saarela K and Jantunen M. 2001. VOC source identification from personal and residential indoor, outdoor and workplace microenvironment samples in EXPOLIS-Helsinki, Finland. Atmospheric Environment, 35, 4829-4841.
EPA (U.S. Environmental Protection Agency). 1999. Determination of volatile organic compounds in ambient air using active sampling onto sorbent tubes. Compendium Method TO-17. Center for Environmental Research Information, Office of Research and Development, Cincinnati.
Eriksson L, Johansson E, Kettaneh-Wold N, Trygg J, Wikström C and Wold S. 2006. Multi- and Megavariate Data Analysis. Basic Principles and Applications, 2nd edn. Umetrics Academy, Umeå.
Gevao B and Jones KC. 1998. Kinetics and potential significance of polycyclic aromatic hydrocarbon desorption from creosote-treated wood. Environmental Science & Technology, 32, 640-646.
Gunschera J, Fuhrmann F, Salthammer T, Schulze A and Uhde E. 2004. Formation and emission of chloroanisoles as indoor pollutants. Environmental Science & Pollution Research, 11, 147-151.
Gunschera J, Schulze A, Fuhrmann F, Uhde M, Uhde E and Salthammer T. 2005. Chloroanisols as indoor pollutants originating from PCP metabolism.
32

In: Proceedings of the 10th International Conference on Indoor Air Quality and Climate, Beijing.
Glas B, Stenberg B, Stenlund H and Sunesson AL. 2008. A novel approach to evaluation of adsorbents for sampling indoor volatile organic compounds associated with symptom reports. Journal of Environmental Monitoring, 10, 1297-1303.
Hayashi M and Osawa H. 2008. The influence of the concealed pollution sources upon the indoor air quality in houses. Building and Environment, 43, 329-336.
Hachem C, Fazio P, Rao J, Bartlett K and Chaubey Y. 2009. Identification and transport investigation of microbial volatile organic compounds in full-scale stud cavities. Building and Environment, 44, 1691-1698.
Hachem C, Chaubey Y, Fazio P, Rao J and Bartlett K. 2010. Statistical analysis of microbial volatile organic compounds in an experimental project: Identification and transport analysis. Indoor and Built Environment, 19, 275-285.
Haverinen U. 2002. Modeling moisture damage observations and their association with health symptoms. PhD Thesis, University of Kuopio, Finland.
Hodgson AT. 2003. Volatile organic chemical emissions from structural insulated panel (SIP) materials and implications for indoor air quality. Report LBNL-53768. Lawrence Berkeley National Laboratory, Berkeley.
Hoffmann K, Krause C, Seifert B and Ullrich D. 2000. The German environmental survey 1990/1992 (GerES II): sources of personal exposure to volatile organic compounds. Journal of Exposure Analysis and Environmental Epidemiology, 10, 115-125.
Hyvärinen A. 2002. Characterizing moisture damaged buildings – Environmental and biological monitoring. PhD Thesis, University of Kuopio, Finland.
IOM (Institute of Medicine). 2004. Damp Indoor Spaces and Health. The National Academies Press, Washington, D.C.
Jantunen M, Jaakkola JJK and Krztzanowski M (eds.). 1997. Assessment of exposure to indoor air pollutants. WHO regional publications, European
33
series No 78. World Health Organization, Regional Office for Europe, Copenhagen.
Järnström H, Vares S and Airaksinen M. 2009. Semi volatile organic compounds and flame retardants. Occurrence in indoor environments and risk assessment for indoor exposure. VTT Research Notes 2486. VTT Technical Research Centre of Finland, Helsinki.
Knudsen HN, Kjaer UD, Nielsen PA and Wolkoff P. 1999. Sensory and chemical characterization of VOC emissions from building products: impact of concentration and air velocity. Atmospheric Environment, 33, 1217-1230.
Korpi A, Järnberg J and Pasanen AL. 2006. Microbial volatile organic compounds (MVOCs). The Nordic Expert Group for Criteria Documentation of Health Risks from Chemicals, Work and Health report No 2006:13. Swedish National Institute for Working Life, Stockholm.
Kusch P and Knupp G. 2004. Headspace-SPME-GC-MS identification of volatile organic compounds released from expanded polystyrene. Journal of Polymers and the Environment, 12, 83-87.
Mendell MJ and Heath GA. 2005. Do indoor pollutants and thermal conditions in schools influence student performance? A critical review of the literature. Indoor Air, 15, 27-52.
MSAH (Finland’s Ministry of Social Affairs and Health). 2003. Anvisning om boendehälsa. Finland’s Ministry of Social Affairs and Health handbooks 2003:2. MSAH, Helsinki.
Mölhave L, Clausen G, Berglund B, De Ceaurriz J, Kettrup A, Lindvall T, Maroni M, Pickering AC, Risse U, Rothweiler H, Seifert B and Younes M. 1997. Total volatile organic compounds (TVOC) in indoor air quality investigations. Indoor Air, 7, 225-240.
NKB (The Nordic Committee on Building Regulations). 1995. Tenax as a collection medium for volatile organic compounds. NKB Committee and Work Reports 1995:06 E. NKB, Helsinki.
RTS (The Building Information Foundation in Finland). 2012. http://www.rakennustieto.fi/index/english/emissionclassificationofbuildingmaterials.html
34

Sjöberg A. 2001. Secondary emissions from concrete floors with bonded flooring materials – effects of alkaline hydrolysis and stored decomposition products. PhD Thesis, Chalmers University of Technology, Sweden.
Sunesson AL, Nilsson CA and Andersson B. 1995. Evaluation of adsorbents for sampling and quantitative analysis of microbial volatiles using thermal desorption-gas chromatography. Journal of Chromatography A, 699, 203-214.
Tuomainen A, Seuri M and Sieppi A. 2004. Indoor air quality and health problems associated with damp floor coverings. International Archives of Occupational and Environmental health, 77, 222-226.
Uhde E and Salthammer T. 2007. Impact of reaction products from building materials and furnishings on indoor air quality – A review of recent advances in indoor chemistry. Atmospheric Environment, 41, 3111-3128.
Wallace LA, Pellizzari ED, Hartwell TD, Whitmore R, Sparacino C and Zelon H. 1986. Total exposure assessment methodology (TEAM) study: personal exposures, indoor-outdoor relationships, and breath levels of volatile organic compounds in New Jersey. Environment International, 12, 369-387.
Weschler CJ. 2004. Chemical reactions among indoor pollutants: what we’ve learned in the new millennium. Indoor Air, 14, 184-194.
WHO (World Health Organization). 2009. WHO guidelines for indoor air quality: Dampness and mould. WHO Regional Office for Europe, Copenhagen.
Vilaplana F. 2007. Modelling the degradation process in high-impact polystyrene during the first use and subsequent recycling. PhLic Thesis, Royal Institute of Technology, Stockholm.
Wieslander G, Kumlin A and Norbäck D. 2010. Dampness and 2-ethyl-1-hexanol in floor construction of rehabilitation center: Health effects in staff. Archives of Environmental & Occupational Health, 65, 3-11.
Wiklund S, Johansson E, Sjöström L, Mellerowicz E.J, Edlund U, Shockor J.P, Gottfries J, Moritz T and Trygg J. 2008. Visualization of GC/TOF-MS-based metabolomics data for identification of biochemically interesting compounds using OPLS class models. Analytical Chemistry, 80, 115-122.
35
36
Wolkoff P, Clausen PA, Jensen B, Nielsen GD and Wilkins CK. 1997. Are we measuring the relevant indoor pollutants? Indoor Air, 7, 92-106.
Wolkoff P. 1999. How to measure and evaluate volatile organic compound emissions from building products. A perspective. The Science of the Total Environment, 227, 197-213.
Wolkoff P and Nielsen GD. 2001. Organic compounds in the indoor air – their relevance for perceived indoor air quality? Atmospheric Environment, 35, 4407-4417.
Wolkoff P. 2003. Trends in Europe to reduce the indoor air pollution of VOCs. Indoor Air, 13 (Suppl. 6), 5-11.
Woolfenden EA. 1998. Technical support document for US EPA Method TO-17. Markes International, United Kingdom.
Yu C and Crump D. 1998. A review of the emission of VOCs from polymeric materials used in buildings. Building and Environment, 33, 357-374.
Åhman M, Lundin A, Musabasic V and Söderman E. 2000. Improved health after intervention in a school with moisture problems. Indoor Air, 10, 57-62.