chemical earnings climb continues
TRANSCRIPT
BUSINESS
CHEMICAL EARNINGS CLIMB CONTINUES Prices for some products surge, yielding a stellar first quarter for companies WILLIAM J. STORCK, C&EN NORTHEAST NEWS BUREAU
THE U.S. CHEMICAL INDUSTRY
chalked up another fine earnings period in the first quarter of 2005 as production of chemicals increased and chemical prices,
especially for hydrocarbon-dependent products, skyrocketed.
The result was a 55.0% increase in earnings from continuing operations, excluding unusual items, from first-quarter 2004 to a combined $4.00 billion for C&EN's
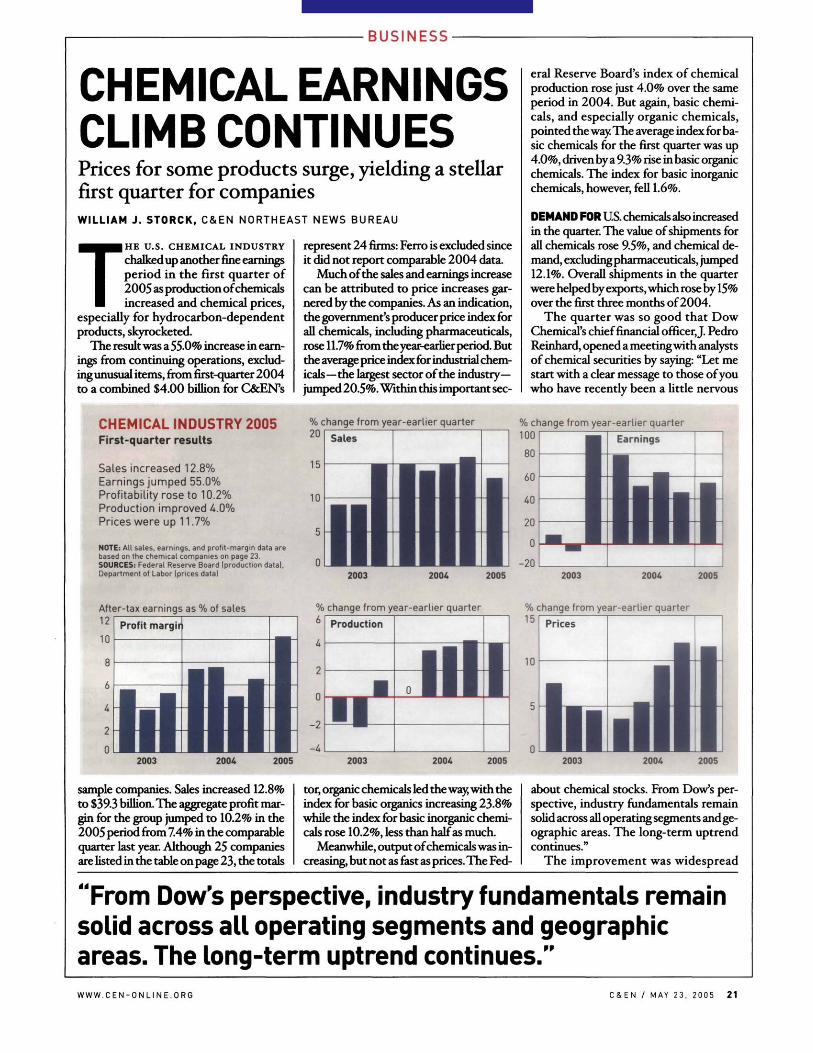
CHEMICAL INDUSTRY 2005 First-quarter results
Sales increased 12.8% Earnings jumped 55.0% Profitability rose to 10.2% Production improved 4.0% Prices were up 11.7%
NOTE: All sales, earnings, and profit-margin data are based on the chemical companies on page 23. SOURCES: Federal Reserve Board (production data). Department of Labor (prices data)
represent 24 firms: Ferro is excluded since it did not report comparable 2004 data.
Much of the sales and earnings increase can be attributed to price increases garnered by the companies. As an indication, the government's producer price index for all chemicals, including pharmaceuticals, rose 11.7% from the year-earlierperiod. But the average price index for industrial chemicals—the largest sector of the industry— jumped 20.5%. Within this important sec-
% change from year-earlier quarter 20
15
10
Sales
m n III llll I
eral Reserve Board's index of chemical production rose just 4.0% over the same period in 2004. But again, basic chemicals, and especially organic chemicals, pointed the way The average index for basic chemicals for the first quarter was up 4.0%, driven by a 9.3% rise in basic organic chemicals. The index for basic inorganic chemicals, however, fell 1.6%.
DEMAND FOR US. chemicals also increased in the quarter. The value of shipments for all chemicals rose 9.5%, and chemical demand, excluding pharmaceuticals, jumped 12.1%. Overall shipments in the quarter were helped by exports, which rose by 15% over the first three months of 2004.
The quarter was so good that Dow Chemical's chief financial officer, J. Pedro Reinhard, opened a meeting with analysts of chemical securities by saying: "Let me start with a clear message to those of you who have recently been a little nervous
% change from year-earlier quarter 100
80
60
40
20
0
-20
Earnings
n m
2003 2004 2005 2003 2004 2005
After-tax earnings as % of sales 12
10
% change from year-earlier quarter
Profit margir
1 • • .1 iii n iii iii11 ii 11
2003 2004 2005
sample companies. Sales increased 12.8% to $39.3 billion. The aggregate profit margin for the group jumped to 10.2% in the 2005 period from 7.4% in the comparable quarter last year. Although 25 companies are listed in the table on page 23, the totals
-4
Production
• • i i • H
\U 2003 2004 2005
tor, organic chemicals led the way, with the index for basic organics increasing 23.8% while the index for basic inorganic chemicals rose 10.2%, less than half as much.
Meanwhile, output of chemicals was increasing, but not as fast as prices. The Fed-
% change from year-earlier quarter 15
10
Prices
In iill I 2003 2004 2005
about chemical stocks. From Bow's perspective, industry fundamentals remain solid across all operating segments and geographic areas. The long-term uptrend continues."
The improvement was widespread
From Dow's perspective, industry fundamentals remain solid across all operating segments and geographic areas. The long-term uptrend continues." W W W . C E N - 0 N L I N E . O R G C&EN / MAY 23, 2005 21

BUSINESS
TOP 10 RANKINGS Chemical industry leaders for first-quarter 2005
RANK 2005 $ MILLIONS
RANK 2004
1 Dow Chemical $11,679.0 1 2 DuPont 7,-431.0 2 3 PPG Industries 2,493.0 3 4 Rohm and Haas 2,022.0 5 5 Air Products 2,003.3 4 6 Monsanto 1,909.0 8 7 Praxair 1,827.0 7 8 Eastman Chemical 1,762.0 6 9 Engelhard 1,026.7 9
10 Lubrizol 970.1 10
NOTE: Based on the companies listed on page 23.
EARNINGS
$ MILLIONS RANK 2004
Dow Chemical $1,353.0 2 DuPont 967.0 1 Monsanto 373.0 3 Praxair 195.0 4 PPG Industries 186.0 6 Air Products 175.3 5 Rohm and Haas 159.0 7 Eastman Chemical 155.0 10 Sigma Aldrich 64.4 8 Engelhard 58.0 9
PROFITABILITY EARNINGS AS % OF SALES
RANK 2004
Monsanto 19.5% 1 Sigma Aldrich 16.1 2 DuPont 13.0 3 Dow Chemical 11.6 13 Praxair 10.7 4 Air Products 8.8 6 Eastman Chemical 8.8 18 Cabot 8.2 6 Rohm and Haas 7.9 9 FMC Corp. 7.7 17
across the companies. Of the 24 companies that reported earnings for both quarters, 18 had double-digit or better increases. Another firm, PolyOne, came out of a $1.6 million deficit in the 2004 period to post $19.1 million in earnings in the 2005 quarter. Only the two smallest companies —Cambrex and Stepan—had earnings declines from the year-earlier period.
Earnings at Cambrex were down 47.4% to $4.1 million on a 2.6% sales decline to
$111 million, primarily because of lower volumes in the company's human health and biopharma segments. Chief Executive Officer John R. Leone says: "In order to improve the results of the human health and biopharma segments during the second half of the year, we are aggressively adding new customer opportunities, implementing further cost reductions, and making appropriate changes to management and business processes."
O I L C O M P A N I E S
Earnings From Chemicals Sparkle
While earnings at chemical companies rose at a very respectable rate in the first quar
ter, chemical results at oil companies were outstanding, with four of the five firms surveyed by C&EN posting gains of more than 100%. Thus, chemical earnings for the five firms rose a combined U7.5% to almost $1.80 billion.
As with the chemical firms, the earnings increase at the oil companies can be attributed mostly to prices. For instance, at ExxonMobil, the largest of the five firms, earnings from chemicals jumped 134.8% to $1.28 billion. Sales volumes at the company were up just 2.1% to 6.94 million metric tons. (Most oil companies do not give dollar sales data for chemicals.)
The largest chemical earnings increase came at Occidental Petroleum— 282.1% to $2U million, due, according to the company, to higher margins in all major products, partially offset by energy and feedstock costs.
Even though they are partners in chemical producer Chevron Phillips, the difference in growth at Chevron and ConocoTexaco was striking. Chemical
earnings at ConocoTexaco, where the joint venture represents its only chemical income, rose 241.0% to $133 million be-
FIRST QUARTER $ MILLIONS 2005 2004 CHANGE
Chevron $137.0 $74.0 85.1% ConocoTexaco 133.0 39.0 241.0 ExxonMobil 1,282.0 546.0 134.8 Occidental Petroleum
214.0 56.0 282.1
Sunoco 33.0 12.0 175.0 TOTAL3 $1,799.0 $727.0 147.5%
a Percentage calculated from combined earnings.
cause of improved margins in olefins, polyolefins, aromatics, and styrenics. Earnings at Chevron, which changed its name from ChevronTexaco earlier this month, rose 85.1% to $137 million, moderated by the company's Oronite division.
At Sunoco, which has the smallest chemical operations of the five companies, earnings from those operations rose 175.0% to $33.0 million. The increase came from higher margins for phenol and polypropylene, but the company says sales volumes are largely unchanged from the year-earlier period.
Stepan says its surfactant earnings declined because of higher research expenses, coupled with a weaker sales mix in North America and lower margins in Europe. Polymer earnings rose significantly, the company says, but the benefit was largely offset by lower earnings on specialty products. Stepan saw its earnings decline 20.0% to $3.2 million, despite a 19.4% increase in sales to $264 million.
But the quarter was all about earnings improvement—and there were some big numbers posted by chemical companies. The largest dollar increase came at industry leader Dow, where earnings increased by $884 million, or 188.5%, to $1.35 billion. This improved the company's profit margin to 11.6% from just 5.0% in the first quarter last year. According to Reinhard, "Significant price improvements, supported by solid volumes, enabled further margin recovery across virtually all of DoVs businesses, despite an increase of more than $1 billion, or 30%, in purchased feedstock and energy costs."
Eastman had the largest percentage gain for the quarter, with earnings rising 2875% as sales increased 10.3% to $1.76 billion. "Improvement in operating performance throughout the company led to the best quarter of earnings and revenue in Eastman's history," CEO J. Brian Ferguson says.
According to Eastman, the significant year-over-year improvement was due principally to higher selling prices throughout the company higher sales volume from continuing product lines, improved capacity utilization, and cost reduction efforts. Like other companies, Eastman's performance was attained despite increases in raw material and energy costs of about $160 million compared with first-quarter 2004.
FMC Corp. also more than tripled its earnings in the quarter with a 2079% increase to $42.8 million. Sales at the com-
22 C&EN / MAY 23. 2005 W W W . C E N - 0 N L I N E . O R G

pany improved 9.2% to $552 million. The earnings growth raised the company's profitability to 7.7% in the first quarter from just 2.7% in the same period a year ago.
Like other CEOs, FMCs William G. Walter sees good overall performance at his company The industrial chemical business "is enjoying significant leverage from one of the best pricing environments since the mid-1990s, particularly in soda ash," he says. "In agricultural chemicals, the benefits of our focused strategy, coupled with increases in planted acreage and strong pest pressures in Brazil, resulted in another outstanding quarter. Our specialty chemicals business generated solid earnings growth driven by higher selling prices and improved productivity in the face of continued high raw material costs."
With six quarters of aggregate double-digit earnings increases now behind the chemical industry, executives are still optimistic about the future. At Dow, Reinhard says the company "continues to expect that global gross domestic product will remain solid at around 3.5%. Although this is slightly lower than we've seen in the recent past, this rate is more sustainable—and will drive continued growth in the chemical industry For Dow, the second-quarter demand is expected to increase moderately from first-quarter levels, with strong growth in seasonal industries such as building and construction and agricultural products." Dow expects volume growth for the full year of between 2 and 5%.
At Rohm and Haas, which posted a 39.5% increase in earnings to $159 million in the first quarter on 10.4% sales growth to $2.0 billion, CEO Raj L. Gupta says the company expects modest volume growth for the year, despite an uncertain outlook for overall demand.
"Rohm and Haas," Gupta says, "remains focused on improving its sales mix through the introduction of new and improved
RESULTS Double-digit earnings increases were common in first quarter
SALES EARNINGS3 CHANGE FROM 200A PROFIT MARGIN6
($ MILLIONS) SALES EARNINGS 2005 2004
Air Products $2,003.3 $175.3 7.9% 24.2% 8.8% 7.6% Albemarle 510.0 25.2 58.4 52.7 4.9 5.1 Arch Chemicals 301.3 3.6 25.4 56.5 1.2 1.0 Cabot 527.0 43.0 5.4 13.2 8.2 7.6 Cambrex 110.5 4.1 -2.6 -47.4 3.7 6.9
Cytec Industries 563.9 38.9 35.8 17.2 6.9 8.0 Dow Chemical 11,679.0 1,353.0 25.5 188.5 11.6 5.0 DuPont 7,431.0 967.0 -8.0 0.3 13.0 11.9 Eastman Chemical 1,762.0 155.0 10.3 287.5 8.8 2.5 Engelhard 1,026.7 58.0 -1.3 15.3 5.6 4.8
Ferro 452.5 5.9 na na 1.3 na FMC Corp. 552.4 42.8 9.2 207.9 7.7 2.7 H.B. Fuller 353.0 5.8 10.8 26.1 1.6 1.4 Georgia Gulf 645.4 38.7 29.9 107.0 6.0 3.8 Great Lakes Chemical 420.4 9.3 17.4 78.8 2.2 1.5
Hercules 505.1 20.5 6.4 30.6 4.1 3.3 Lubrizol 970.1 52.5 67.9 57.7 5.4 5.8 Monsanto 1,909.0 373.0 27.4 44.6 19.5 17.2 PolyOne 576.7 19.1 2.5 nm 3.3 def PPG Industries 2,493.0 186.0 10.1 56.3 7.5 5.3
Praxair 1,827.0 195.0 19.3 18.9 10.7 10.7 Rohm and Haas 2,022.0 159.0 10.4 39.5 7.9 6.2 Sigma Aldrich 399.8 64.4 8.6 3.4 16.1 16.9 Stepan 264.3 3.2 19.4 -20.0 1.2 1.8 Terra Industries 450.0 8.1 24.7 3.8 1.8 2.2
TOTAL0 $39,302.9 $4,000.5 12.8% 55.0% 10.2% 7.4%
a After-tax earnings from continuing operations, excluding significant extraordinary and nonrecurring items. b After-tax earnings as a percentage of sales, c Excludes Ferro, for which first-quarter 2004 data were not supplied. Percentages calculated from combined sales and earnings, na = not available, nm = not meaningful, def« deficit.
products, implementing selective price increases to offset continuing escalations in raw material and energy costs, improving the efficiency of manufacturing, and streamlining its processes. As a result, we expect full-year sales growth in the 10 to 12% range, yielding annual sales of over $8 billion and full-year earnings in the $2.56-
CRITERIA FOR C&EN EARNINGS ANALYSIS
C&EN's quarterly report on financial
performance of the U.S. chemical indus
try contains data from 25 major U.S. ba
sic chemical companies and from five
petroleum companies, each of which has
more than $200 million in annual chemi
cal sales.
To be included in the table of basic
chemical producers, a company must have
at least 50% of its sales in chemicals.
In referring to chemical sales, C&EN
means sales of chemicals whose
molecular composition has been
changed during manufacture. Hence,
these include traditional categories of
basic petrochemicals and inorganics,
organic intermediates and inorganic
compounds, polymers such as plastics
and fibers, and agricultural chemicals
and specialty derivatives.
In listing earnings, the report gives
after-tax income for continuing opera
tions, excluding significant nonrecurring
and extraordinary items.
to $2.90-per-share range." In 2004, the company earned $2.22 per share.
Hercules, which has had its share of troubles over the past few years, now sees continued improvement. "We expect improved volumes, lower general and administrative costs, and improved margins going forward in 2005," CEO Craig A. Rogerson says. 'We remain committed to our targets of double-digit ongoing earnings-per-share growth and significantly higher cash flows in 2005 compared to 2004."
Rogers warns, though, of further restructuring charges in the second quarter, primarily from severance costs related to improvement and productivity efforts. In the first quarter, Hercules' earnings rose 30.6% to $20.5 million on a 6.4% sales improvement to $505 million.
Eastman's Ferguson sees a future wished for by other chemical company executives. He foresees "second-quarter 2005 earnings per share to be similar to first-quarter 2005 ($1.92) and expect{s} that 2005 will be a great year throughout the company" •
W W W . C E N - 0 N L I N E . O R G C&EN / MAY 23, 2005 23