chemical and physical properties of paleozoic potassium bentonites from kinnekulle, sweden
TRANSCRIPT

Clays and Clay Minerals, Vol. 34, No. 4, 442-454, 1986.
CHEMICAL AND PHYSICAL PROPERTIES OF PALEOZOIC POTASSIUM BENTONITES FROM KINNEKULLE, SWEDEN
ANN MARIE BRUSEWITZ
Geological Survey of Sweden, Box 670, S-751 28 Uppsala, Sweden
Abstract - -The < 1-~m fraction of 17 bentonite samples from KinnekuUe, southwest Sweden, were studied by chemical analysis, X-ray powder diffraction, and cation-exchange capacity. The bentonites are in- terbedded with undeformed, flat-laying Ordovician and Silurian sediments and were formed by the transformation of volcanic ash (dated at about 450 Ma) into smectite, which later converted to mixed- layer illite/smectite (I/S). The reaction, possibly driven by heat from an overlaying diabase intrusion (about 300 Ma), stopped at different stages of conversion, as evidenced by the I/S which ranges in composition from 60 to 10% smectite layers. A 2-m-thick bed shows zonation, with decreasing smectite proportions towards the upper contact. The zonation is not symmetrical towards the lower contact. In thin beds the illite proportion is higher and the regularity of ordering is inversely proportional to the thickness of the bed. K:Sr and K:Rb ratios follow the illite pattern; the ratios are highest at the contact and in thin beds. The inhibiting effect of Ca and Mg on the smectite-to-illite conversion probably was the cause of less-reacted smectite in the center of the thick bed.
Key Words--Bentonite, Igneous intrusion, Illite, Interstratification, Potassium, Smectite, X-ray powder diffraction.
I N T R O D U C T I O N
Middle Ordovician and Silurian sedimentary rocks in the Kinnekulle region, southwest Sweden, are in- terbedded with K-bentonites that contain a series of mixed-layer illite/smectites (I/S) which show a wide range of systematic changes in the proportion of smec- rite layers. The bentonites occur in flat-laying sedi- mentary rocks shielded from erosion by a cap rock of Permian-Carboniferous diabase. The first comprehen- sive description of the bentonites was reported from a drill core through the Paleozoic sediments at Kullatorp, on the western slope of Kinnekulle, and from outcrops at Stora Mossen, on the eastern slope (Waern et al., 1948). Bystr/im (1954, 1956) showed the bentonites to be of two types: that from the two thinner beds (A-beds) contained 5% KzO and about 60% illite layers in the I/S; the other from a 2-m-thick bed (B-bed) just below the A-beds contained 2.5% K20 and about 20% illite layers in the I/S. The samples then available gave no information on I/S variations within the thick bed. Thinner beds (C-beds) below the B-bed also were re- ported to contain high percentages ofil l i te layers in the I/S.
Bystr6m (1954, 1956) reported that the bentonites were derived from volcanic ash falls, but for the suc- cessive change to K-bentonites, the source of K re- mained a problem--sea water, volcanic glass, or some other source. It was not initially determined whether the I/S minerals were present only in a few rational proportions of smectite and illite layers, or as a con- tinuous range. In addition to the I/S proportions men- tioned above, Weaver (1953), in his study of Ordo- vician K-bentonites from North America, found 80%
illite layers in the I/S. A detailed study of the thick bentonite bed was initiated to il luminate these prob- lems, and a systematic sampling was made by the pres- ent author in 1955. Some of these samples were also used by Hower and Mowatt (1966), Reynolds and Hower (1970), and Velde and Brusewitz (1982). Since the initial Kinnekulle study, many publications on I/S in bentonites of different ages have been made (e.g., Srod6n, 1976; Sn/ill, 1977; Schultz, 1978; Inoue et al., 1978; Pevear et al., 1980; Huffand Tiirkmen6glfi, 1981; Nadeau and Reynolds, 1981; Altaner et al., 1984). In relation to many of the above bentonites, the Kinne- kulle materials are unique in that no thrusting or re- deposition has occurred and samples with a wide range of I/S compositions can be collected from a single lo- cality.
The aim of the present study is to document the I/S minerals from several levels in a 2-m-thick B-bed and from the thinner beds and to draw conclusions regard- ing the smectite-to-illite conversion process. The meth- ods employed were X-ray powder diffraction, chemical analysis, and cation-exchange capacity. K/Ar age de- terminations were also made, but for the most part will be reported elsewhere.
GEOLOGIC SETTING
The sedimentary rocks at Kinnekulle were not sub- jected to major tectonic activity and are flat-laying. The Kinnekulle diabase cap today covers an area of 0.4 km 2 and is about 30 m thick. According to Sundius it had a wider extension (see Johansson et al., 1943), possibly being connected to the diabase intrusives in the Billingen area, 30 km to the southeast. The latter
Copyright �9 1986, The Clay Minerals Society 442

Vol. 34, No. 4, 1986 Potassium bentonites from Kinnekulle, Sweden 443
Table 1. Samples studied from Kinnekulle, southwestern m Sweden. l above
sea lever
280 - - Depth in core Bed thickness
Sample (m) (cm) C o m m e n t s
Kullatorp core Silurian samples
K6 6.35 1 K13 13.23 1 K15 15.68 6 KI7 17.70 1-2
Ordovician samples K71 71.52 30 K72 72.75 90 K74 74.52 15 K78 78.61 3 B-bed 67.35-69.05 170-180
StoraMossen B-bed B31 B32 B33
B34
B35 B36 B37 B38 B39
180
2 5 7 1 2 - -
250 - -
Top of bed Middle of bed z2z Middle of bed
Not sampled in core
Interval from top of bed (cm)
0-5 0-5 9-30 (finer
parts) 9-30 (coarser
parts) 30-37 45-60 60-70 75-80
110
J The Kullatorp core was drilled on the western slope of Kinnekulle. The levels of sampling were taken from the de- scription of the core (Waern et al., 1948), the exact position not being possible to define in the present state of the core. The B-bed was sampled at Stora Mossen on the eastem slope, where the bentonite was mined by Sk/~nska Cement Co. in the 1940s.
in t rusives were dated by Pr iem et al. (1968) by the K / A r m e t h o d at 287 _+ 15 Ma.
Bentoni tes occur in both Silurian and Midd le Or- dov ic ian mar ine rocks. Thors lund placed the lat ter in the Caradocian, lower Chasmops series (see Waern et al., 1948). In a more recent s trat igraphic de te rmina- tion, the bentoni tes were placed wi th in the Skagen and Dalby format ions (l imestone), wi th the boundary be- tween these units at the top o f the B-bed (Skoglund, 1963; Jaanusson, 1964). The volcanic ash fall that was the precursor o f this bed was dated by the K / A t tech- n ique on sanidine phenocrysts at 444 + 20 M a (By- s t r r m - A s k l u n d et al., 1961). Recent ly , b iot i tes f rom the same fract ionated mater ia l were da ted by the 4~ 39Ar m e t h o d at 455 M a (Kunk et al., 1984).
Figure 1 shows a schemat ic sect ion o f the Kinnekul le strata. The Ordov ic ian bentoni tes occur wi th grey and black shale, calcareous muds tone , and l imes tone con- taining glauconite in the upper part. Strata adjacent to the ben ton i te beds are typically cherty. Bentoni tes are
200 - -
112
K u t t a t o r
_si3_ _ . OnJ.
m
g i
Ord. I I - c ~ g ~ - T - - i
I I
CO('e (0)
K6 {635}
K 13 (13,23) K ~S { 15.68) K g t 17 701
3515)
m b e n t o n i t e
B - -
c W c i t e foyer
c h e r t y beds
f 'rom top
~'- beds (66,5-67,0) B-bed (67, 3 -69,0] f = finer
XKT1 (71,521 c = coarser K72\172;75) K?~. 17tt.52)
\ KTB (7B,61)
\ (~,56)
Figure 1. Schematic section of Kinnekulle, showing position of samples investigated in the study. Stora Mossen profile enlarged (modified after Thorslund in Waern et al., 1948).
abundant , but the mos t interest ing one is the 2 -m- th i ck B-bed. A b o v e this bed, separated by a 20-cm- th ick calcite layer, are two th inner A-beds , A1 and A2, each about 15 cm thick. Below the B-bed are near ly 20 C-beds, o f var iable thicknesses, some as thick as 90 cm. The bentoni tes consist main ly o f I/S, but pheno- crysts are present in varying amounts . In the B-bed quar tz var ies f rom 5 to 20%, b io t i te and sanid ine f r o m 2 to 5%, and plagioclase phenocrys ts (strongly kaol in- ized) f rom 5 to 10%. In addi t ion, pyri te and o ther phenocrysts are present in subordina te amoun t s (By- s t r6m, 1956).
The Silurian bentoni tes are in te rbedded with grey and red muds tone interbedded with black shales (Waern et al., 1948). All Silurian bentoni tes are thin, mos t ly less than 2 cm thick.
E X P E R I M E N T A L
S a m p l i n g
The samples s tudied are l is ted in Table 1 and m a r k e d in Figure 1. F r o m the Kul la torp core four samples were selected f rom Silurian bentoni tes and four f rom the

444 Brusewitz Clays and Clay Minerals
0
o
0
0
kO
~ 0 ~ 0
c 5 o
e~
r162 e ~ O
0 0 0 0
aO O 0 ~ ' ~ k l D
oO
p,.
r r
r162
o 0 0 0
o6o~5
oor
o o t " q e q e q O ,~.
r .=~
0
0
Vol. 34, No. 4, 1986 Potassium bentonites from Kinnekulle, Sweden 445
Ordovician C-beds. The B-bed could not be sampled in the core because of core loss. Instead, this bed was sampled at Stora Mossen in an abandoned mine. In 1955, it was still possible to reach a fresh wall of the upper part of the B-bed, the lower part being below water. Nine samples were collected, B31-B39, from 200 the top to slightly below the middle of the bed. For a complete section of the B-bed, drilling was carried out at Stora Mossen (by the Nuclear Safety Company, KBS). Only a preliminary study has been made of this ma- terial (Brusewitz, 1984). t~
Sample preparation
Twenty grams of each sample was dispersed in dis- tilled water by gentle crushing and ultrasonic vibration. The suspensions were centrifuged to obtain the < 1- gin fraction. No chemicals were used for dispersion, and no extractions were made in order to keep the samples in their natural state as much as possible. The collected suspensions were dried on stainless steel trays. Finally, the dried material was homogenized by gentle grinding in an agate mortar. Inasmuch as no chemicals were used, dispersion was not complete, and the > 1- urn fractions consisted chiefly of aggregates of I/S par- ticles.
Chemical analysis
Major elements were determined on the < 1-gin frac- tions at the Geochemical Division of the Geological Survey of Sweden. Samples were fused in li thium bo- rate to which cobalt and beryllium were added as ref- erence elements. The cooled melt was ground to a fine powder, and a portion was removed for the determi- nation of alkalies by atomic absorption, after disso- lution in dilute HNO3. Most of the powder was mixed with paper pulp and transported by a moving tape into the light arc of a direct-reading emission spectrograph (Hilger, Jumbo Model). The signals from the samples were compared to those from a set of synthetic stan- dards. The data were evaluated by a computer program that contained corrections for overlapping and inter- element interferences and reported as wt. % oxides. International standards were run concurrently to check the equipment. A summary of the method is given by Danielsson (1968). Si and A1 were also analyzed by spectrophotometric methods (Shapiro and Brannock, 1956). Potassium was analyzed in connection with K-Ar age determination by the method of Cooper (1963), but using specpure Cs2SO4 as buffering agent. The pre- cision of the K20 determinations was _+ 1.3%. Ferrous iron, CO2, water, and moisture were determined by classical methods. The precision of the reported values (except for KzO) has been estimated to be _+2 relative percent. Sr and Rb were analyzed by X-ray fluores- cence, with an estimated precision of _+5 ppm. The results are listed in Table 2.
100
# O
O/ 0B33
I | | I I
20 /+0 60 80 100 cation-exchonge capctcity (meq/1OOg)
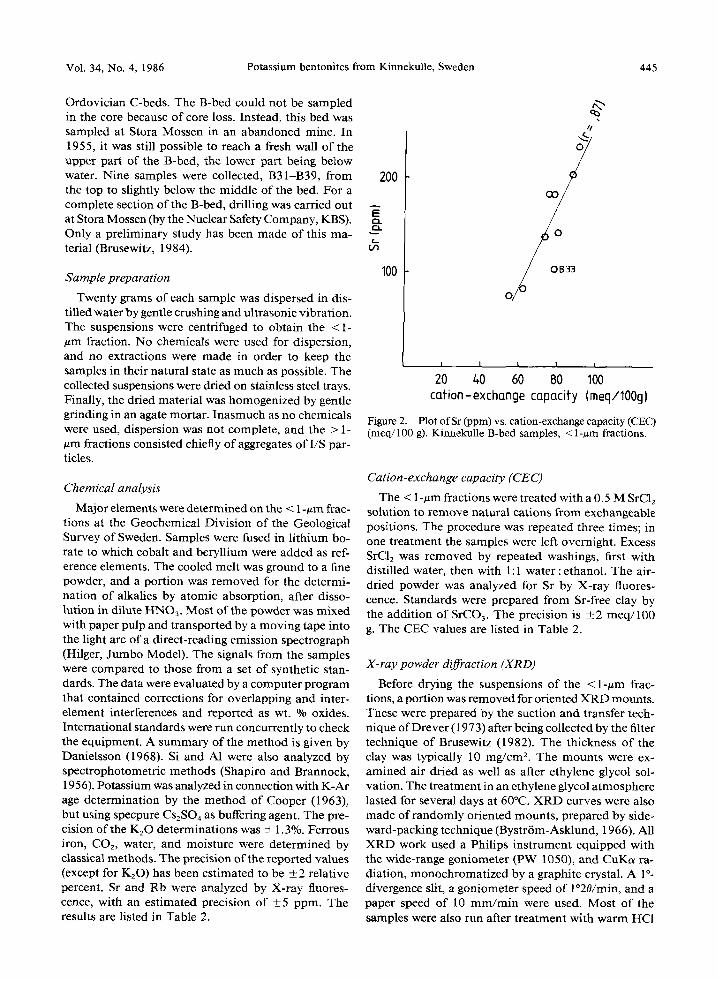
Figure 2. Plot ofSr (ppm) vs. cation-exchange capacity (CEC) (meq/100 g). Kinnekulle B-bed samples, < 1-#m fractions.
Cation-exchange capacity (CEC)
The < 1-gm fractions were treated with a 0.5 M SrC12 solution to remove natural cations from exchangeable positions. The procedure was repeated three times; in one treatment the samples were left overnight. Excess SrC12 was removed by repeated washings, first with distilled water, then with 1:1 water : ethanol. The air- dried powder was analyzed for Sr by X-ray fluores- cence. Standards were prepared from Sr-free clay by the addition of SrCO3. The precision is _+ 2 meq/100 g. The CEC values are listed in Table 2.
X-ray powder diffraction (XRD)
Before drying the suspensions of the < 1-gm frac- tions, a portion was removed for oriented XRD mounts. These were prepared by the suction and transfer tech- nique of Drever (1973) after being collected by the filter technique of Brusewitz (1982). The thickness of the clay was typically 10 mg/cm< The mounts were ex- amined air dried as well as after ethylene glycol sol- vation. The treatment in an ethylene glycol atmosphere lasted for several days at 60~ XRD curves were also made of randomly oriented mounts, prepared by side- ward-packing technique (Bystr6m-Asklund, 1966). All XRD work used a Philips instrument equipped with the wide-range goniometer (PW 1050), and CuKa ra- diation, monochromatized by a graphite crystal. A 1 ~ divergence slit, a goniometer speed of l~ and a paper speed of 10 m m / m i n were used. Most of the samples were also run after treatment with warm I-IC1

446 Brusewitz Clays and Clay Minerals
Table 3. Structural formulae per Ore(OH)2 and smectite layers (%) in I/S. l
Sample
K6 K I 3 K I 5 K17 B31 B32 B33 B34
Tetrahedral Si 3.38 3.41 3.34 3.45 3.67 3.64 3.70 3.72 AI 0.62 0.59 0.66 0.55 0.33 0.36 0.30 0.28
Octahedral A1 1.58 1.57 1.66 1.60 1.49 1.44 1.43 1.44 Fe 3+ 0.18 0.13 0.13 0.13 0.09 0.09 0.10 0.12 Fe 2§ 0.06 0.06 0.04 0.05 0.04 0.04 0.05 0.04 Mg 0.25 0.31 0.23 0.27 0.42 0.44 0.42 0.44 Sum 2.07 2.07 2.06 2.05 2.04 2.06 2.01 2.03 Charge - 0 . 1 0 -0 .16 -0 .13 -0 .17 - 0 . 3 4 -0 .30 -0 .44 -0 .39
Total layer charge -0 .72 -0 .75 -0 .79 -0 .72 -0 .67 -0 .66 -0 .74 -0 .67
Interlayer K~x 0.70 0.67 0.66 0.64 0.38 0.36 0.32 0.29 M § = sum ex-
changeables 0.06 0.06 0.07 0.08 0.27 0.28 0.39 0.37 Charge 0.76 0.73 0.73 0.72 0.65 0.64 0.71 0.66
Smectite (%) XRD ~ 8 10 10 12 35 38 41 44
Type of ordering R=3 R=3 R=3 R=3 R = 0 / R = 1 R = 0 / R = 1 R=0 R=0
Smectite (%) from K,x/K~x/~x 2 4 8 10 12 48 51 56 60
Corrected for Quartz (%) 5 5 5 2 Kaolinite (%) 2 2 2 2
% smectite layers has been derived from X RD data of Srodofi (1980, 1984) and from K,x/K,x/ . . . . where Knx/~,~ = 0.73. 2 See text for meaning of Knx and Knx/~ax.
to d i f ferent ia te b e t w e e n kao l in i t e a n d poss ib le chlor i te . X R D curves are s h o w n in F igure 6.
R E S U L T S
Zonation of the B-bed
The analyses (see Tab le 2) show a c lear z o n a t i o n o f the B-bed . F r o m the cen te r upwards , K 2 0 inc reases
top c~ �9 B31 B 32
�9 B33 ,B3t,
'
50 " B ~ -5
" B37
centre too 110 �9 B39
/_ 1BO
K/Sr K/Rb
100 200 300 t~00 K/Rb K/Sr
Figure 3. Plot of K:Sr and K:Rb ratios in relation to depth in B-bed. Scale at left shows distance from upper contact in centimeters. Open bars = K:Sr, filled bars = K:Rb ratios. Length of bar indicates sampling interval.
a n d CEC decreases . K 2 0 vs. CEC shows a l inea r regres- s ion h a v i n g a co r re l a t ion coefficient o f r = - . 9 1 . W i t h the increase in K a n d the f o r m a t i o n o f i l l i te layers, exchangeab le ions, chiefly Ca, a p p a r e n t l y m o v e d ou t o f the s t ruc tu re a n d m o s t l ikely p r e c i p i t a t e d as car- bona te . T h i n selvages o f calci te are i r regular ly d i s t r ib - u t e d in the b e n t o n i t e s a n d m a y h a v e f o r m e d f r o m such expel led Ca. These selvages were a v o i d e d w h e n the s amples were col lected. Sr appea r s to h a v e b e e n exclu- s ively b o u n d in smec t i t e layers. A s s u m i n g t h a t CEC is a m e a s u r e o f the smec t i t e p r o p o r t i o n o f I /S (Figure 2), as ill i te layers fo rmed , Sr was also expe l l ed . It m o s t l ikely p rec ip i t a t ed w i th Ca a n d is n o longer pa r t o f the b u l k b e n t o n i t e .
The z o n a t i o n o f the B - b e d is also o b v i o u s f r o m the K:Sr rat ios , r e p r e s e n t a t i v e o f the I /S ra t io (Figure 3). F r o m the center upwards , K:Sr gradual ly increases f rom 100 to 200. A t a b o u t 20 c m f r o m the t op o f the bed, the ra t io changes ab rup t ly to > 4 0 0 , i n d i c a t i n g special b o u n d a r y cond i t i ons .
T h e K : R b ra t io is also s h o w n in F igure 3. B o t h ele- m e n t s , a s soc ia ted on ly w i t h i l l i te layers, h a v e a con- s t an t ra t io f r o m the cen te r u p w a r d s to a b o u t 20 c m f r o m the top, a t w h i c h p o i n t K : R b inc reases b u t n o t as ab rup t ly as K:Sr. Samples B 3 3 - B 3 9 show a m e a n

Vol. 34, No. 4, 1986 Potassium bentonites from Kinnekulle, Sweden 447
Table 3. Continued.
Sample
B35 B36 B37 B38 B39 K71 K72 K74 K78
3.71 3.67 3.71 3.72 3.75 3.67 3.70 3.65 3.59 0.29 0.33 0.29 0.28 0.25 0.33 0.30 0.35 0.41
1.40 1.40 1.42 1.42 1.42 1.52 1.53 1.49 1.59 0.11 0.12 0.12 0.12 0.12 0.10 0.11 0.13 0.09 0.06 0.07 0.06 0.06 0.05 0.04 0.05 0.05 0.05 0.41 0.48 0.45 0.42 0.44 0.36 0.33 0.35 0.30 2.02 2.07 2.03 2.02 2.03 2.02 2.02 2.02 2.03
-0.41 -0.34 -0.34 -0.42 -0.40 -0.34 -0.32 -0.34 -0.26
-0.70 -0.67 -0.71 -0.70 -0.65 -0.67 -0.62 -0.69 -0.67
0.30 0.27 0.28 0.26 0.23 0.43 0.37 0.40 0.52
0.40 0.41 0.40 0.43 0.43 0.23 0.26 0.29 0.16 0.70 0.68 0.68 0.69 0.66 0.66 0.63 0.69 0.68
46 46 49 51 54 30 35 30 25
R=0 R=0 R=0 R=0 R=0 R = 0 / R = I R = 0 / R = I R = 0 / R = I R = I
59 63 62 64 68 41 49 45 29
8 5 5 3 2 4 5 2 3 2
K:Rb value of 247 + 11, which is similar to earlier reported values of 240 for post-Precambrian illitic and mixed-layer clays (Horstman, 1957) and 252 for Pre- cambrian illites, rich in the 1Md polytype, reported by Reynolds (1963). At the top of the B-bed, K:Rb is nearly 300, similar to values found for the thicker C-beds. One thin C-bed, sample K78, and the Silurian samples show values as great as 373 (Table 2).
Structural formulae were calculated from the chem- ical analyses in Table 2 on the basis of Olo(OH)2 (Table 3). The B-bed samples were corrected for quartz and kaolinite as estimated from XRD. CEC values were similarly corrected. HCl-extractions were used to check any change in the 7-~ reflection due, perhaps, to the dissolution of chlorite. The Silurian samples, which contained minor amounts of impurities (chiefly chlo- rite), were not corrected, because estimation of the amount of impurities was difficult. For sample K17 the CaO value was not used and exchangeable ions were based on CEC only. Ti was not included in the formulae because X R D showed anatase to be present in many of the samples. M+/O~o(OH)2 was calculated from the CEC values; M + is the sum of exchangeable ions (chiefly Ca 2+ and Mg 2+) as equivalents (Bystrrm, 1956). In the calculations all CaO and Na20 (the latter
being present in subordinate amounts) were regarded as exchangeable, and all K20 as fixed. Exchangeable Mg 2§ was obtained by subtracting the sum of Ca and Na equivalents from M § and the remaining part was assigned to the octahedral sheet (Foster, 19 51).
The structural formulae show Silurian samples to have high octahedral occupancy and unbalanced charge, because no corrections were made for impurities. The formulae do, however, show the highly illitic character of these samples. Two samples in the B-bed series, B32 and B36, also show high octahedral occupancy, pos- sibly due to poorly estimated impurities, but the trend of the series is still clear.
Figure 4 is a plot of Si vs. fixed K per O~0(OH)2 (see Table 3). The line extrapolated to Kfix = 0 intersects the Si-axis at 3.95. This value suggests that the original smectite was montmoril lonit ic (Si4) rather than bei- dellitic (Si4_xAlx) and that A1 substitution in this sheet took place during the formation of the illite layers. Figure 5 is a plot o f M § (exchangeable cations) vs. K ~ per O~0(OH)2. Extrapolation of the line to M § = 0 gives a Kf ix /max ~ 0.73, a value similar to that obtained by Inoue and Utada (1983) in a plot of five different I/S series. The Kfix/m~x value obtained in the present study was used to calcuiate the percentage of illite layers

448 Brusewitz Clays and Clay Minerals
L
O2 0.(, 0.6 O~ g) Kfix/I~(0H)2
Figure 4. Plot of Si vs. K,~ per Ol0(OH)2; data from Table 3. ((3) = B-bed, (A) = C-beds, (x) = Silurian bentonites.
(from K~J0.73). Postulating only illite and smectite layers, the result given in Table 3 is expressed as % smectite layers. These data imply a constant Knx for all illite layers, a conclusion questioned by Srodofi et al. (1986) and which will be discussed below.
Extrapolation of the line in Figure 5 in the other direction to Knx = 0 gives M+m,x = 0.62, a high value compared to 0.4, the average charge of the "pure" smectite layer (Weaver and Pollard, 1973). These au- thors, however, also stated that values as large as 0 .60- 0.65 are legitimate max imum values. In addi t ion the relation of total layer charge to K~,~ does not correspond to published observations which show that layer charge decreases with decreasing Knx (Eslinger et al., 1979). For the Kinnekulle Ordovician samples, the total layer charge is constant at 0.68 _+ 0.03, although Knx changes from 0.23 to 0.52.
Comparisons of M+max and K~x/max with those of pub- lished I/S series (Table 4) show the M+ma~ values, ex- cept for the Kinnekulle series, to have fairly concordant values of about 0.4. The Knv . . . . shows a greater spread, being highest (0.90) for the Polish clays. Thus, these discrepancies probably do not reflect different I/S com- positions; more likely, they result from different sample pretreatments, in particular, citrate extraction (Mehra and Jackson, 1960).
X-ray powder diffkaction
X R D curves of randomly oriented samples show only hk reflections at about 4.48, 2.57, and 1.50 ~ as distinct peaks. Even the most illitic sample (sample K6) shows no sharp hkl reflections, suggesting thin crystallites and poor crystallinity. The 060 peak at 1.50 ~, suggests a dioctahedral structure.
The percentages of smectite layers in I/S est imated from the XRD patterns shown in Figure 6 by using the methods of Srodofi (1980, 1984) are given in Table 3. Within the B-bed samples, the posit ion of the 17-~ reflection is essentially constant, although Knx/Ol0(OH)2 ranges from 0.23 to 0.38. Samples B31 and B32, from the upper contact, display what appears to be a super- lattice peak at 30 ~ before the 17-~ peak disappears. Concerning the transit ion from random (R=O) to reg-
0.7
0.5
~o 0.t~ O >
0.3
0.2 ~ x
I i i
o.1 0.2 d.3 & o'.6 0.7 o.s Kfix/01010H)2
Figure 5. Plot o fM + vs. K,x per O~o(OH)2, data from Table 3. Extrapolation to M + = 0 gives K.x/max = 0.73. Symbols as in Figure 4.
ular (R = 1) alternation of layers, a zone seems to be present in which at the same K~x both types of ordering exist; e.g., the I/S ordering of sample B31 is nearly random and that of samples K72 and K74 is ordered. A higher AI:Mg ratio in the octahedral sheet of the more ordered samples may explain these structural dif- ferences.
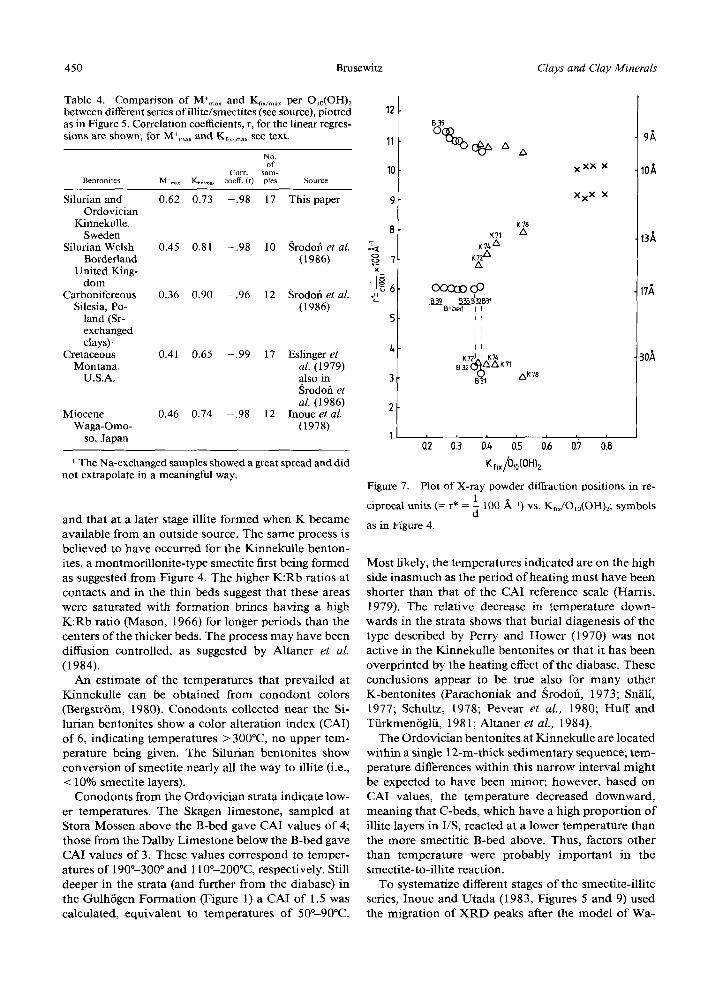
As the proport ion of illite layers increases (i.e., an increase in Kn~), no obvious change was observed in the posit ion of the 17-]k peak of B-bed samples (see Figure 7), only the shape of the peak changes (see Figure 6a). As the number of illite layers in the I/S increases, the peak becomes weaker and broader, and the back- ground on the low-angle side of the peak increases. This saddle-to-peak ratio has been used to est imate I/S proportions (Weir et al., 1975; Eslinger and Savin, 1976; Hoffman, 1976). Because of the many parameters in- volved (Srodofi, 1981) the method cannot be generally applied; however, in the present study of samples that had been uniformly treated with regard to sample prep- aration, chemical analysis, and X R D examination, a close relation between peak shape and chemistry is apparent. In Figure 8 saddle : peak intensity ratios are plotted against KUO~0(OH)z. Heights of saddle (h0 and peak (h2) were measured from the lowest point of the background near 8~ For ordered samples, the intensity of the superlattice peak at about 3~ was taken as hi. B-bed samples having random ordering (R=0) plot on a straight line (r = - .94) . Samples hav- ing R > 0 ordering are also linearly related (r = - . 98 ) ,

Vol. 34, No. 4, 1986 Potassium bentonites from Kinnekulle, Sweden 449
KINNEKULLE B bed
e Cull
d-volues of peaks of I/S minerots,~
3,3~ 5.32 9,33 16,2 31,6
334 5,36 9,21 16.7 29,5
3.34 5,39 9.21 16.6
3,34 5,38 9,12 16,6
3,34 5,40 9,0/+ 16,5 27
3,34 5,~ 9.03 16.6
3.34 5.41 8.95 16.6
3.3L~ 5.46 8,89 16.6
3.3/*
K15 9.82
1089 j 5.08 I1"~ I
i
29.5 i
~3.3G 1 3 , 3 ~ KTI /*,9
:1.95 / / /t / "
28.5~
3.33 %.0 29,5~
i i 5,1 L /
334 A~ K'/8 ~ 9~,112'B / ' I 5,7
. . . . . . . . " ~ ~ ] 20 Cu Ko~
K20%
7,/*
3.3/,, 5,~ B.84 16./
aK~ b S0 ~ ~5" /*0" 35" 30" 25" 20" 15" 10" 5 ~
Figure 6. (a) X-ray powder diffraction curves of Kinnekulle B-bed samples, < 1 -~m fraction; ethylene-glycol solvated, oriented mounts. Peaks of kaolinite (K) and quartz (Q) are marked on curves. To the right of the curves, d-values of peaks from I/S minerals are listed. CuKa radiation. (b) X-ray powder diffraction curves of Silurian bentonite, K15, and C-bed samples (K71, K72, K74, and K?8), < 1-#m fraction; ethylene-glycol solvated, oriented mounts, d-values in/~ are marked on the curves. A20~ is measured according to Srodofi (1980) from curves of higher sensitivity; CuKa radiation.
but the line has a slightly different slope from that of the R=0 samples.
The difference between the d-values of two variable peaks (A = 11 -- 12) is related to K20 content (Figure 9), 11 and 12 being the peaks that range from 5.3 ~ to 8.1 ~ and 8.7 ~ to 10.0~ respectively. In a mineral assem- blage containing no other K minerals or containing K minerals in only subordinate amounts (e.g., assem- blages of quartz, chlorite, and kaolinite), the amount of I/S present can be estimated from the K 2 O t o t a l /
K2Oi/s ratio. The method is not precise, however, for smectite-rich I/S and random interstratifications.
DISCUSSION
Estimation of proportion of smectite layers in I /S
The proportion of smectite layers in I/S (Table 3) was estimated in two ways: (1) from X R D by the meth- ods of Srodofl (1980, 1984), and (2) from K~x in the
structural formulae. The XRD-der ived values were lower. A comparison between the methods was made by plotting the percentage o f smectite layers vs. CEC and extrapolating to 100% smectite layers. The X R D method gave a CEC value of 194 meq/100 g; and the Kfix method, a value of 147 meq/100 g. The lower value is more in accord with the CEC of pure smectites.
Conversion of smectite to illite
Effects from the diabase intrusion could have masked previous diagenetic reactions in the Kinnekulle ben- tonites. A time span of 150 m.y. exists between the volcanic ash fall at about 450 Ma and the intrusion of the diabase at about 300 Ma. The volcanic ash was deposited in a marine environment in the Iapetus Ocean. Other studies on K-bentonites, e.g., Srodofi (1976) and Huf fand Tfirkmenrglfi (1981), considered that initially smectite formed from the volcanic glass,
450 Brusewitz Clays and Clay Minerals
Table 4. Comparison of M+max and Kfix/max per Ore(OH)2 between different series ofillite/smectites (see source), plotted as in Figure 5. Correlation coefficients, r, for the linear regres- sions are shown; for M+max and K~x/~n,x see text. 11
NO. of
Corr. sam- 10 Bentonites M+~.~ Ka,/~.~ coetl2 (r) pies Source
Silurian and 0.62 0.73 -.98 17 This paper 9 Ordovician
Kinnekulle, 8 Sweden
Silurian Welsh 0.45 0 .81 -,98 10 Srodofi et al. "J< Borderland (1986) ~ 7
United King- dom
Carbonifereous 0.36 0.90 -.96 12 Srodofi et al. 6 Silesia, Po- (1986)
land (Sr- 5 exchanged clays)t 4
Cretaceous 0.41 0.65 - .99 17 Eslinger et Montana, al. (1979)
U.S.A. also in 3 Srodofi et al. (1986) 2
Miocene 0.46 0.74 -.98 12 Inoue et al. Waga-Omo- (1978)
so, Japan 1
The Na-exchanged samples showed a great spread and did not extrapolate in a meaningful way.
and that at a later stage illite formed when K became available from an outside source. The same process is believed to have occurred for the Kinnekulle benton- ires, a montmorillonite-type smectite first being formed as suggested from Figure 4. The higher K:Rb ratios at contacts and in the thin beds suggest that these areas were saturated with formation brines having a high K:Rb ratio (Mason, 1966) for longer periods than the centers of the thicker beds. The process may have been diffusion controlled, as suggested by Altaner et al.
(1984). An estimate of the temperatures that prevailed at
Kinnekulle can be obtained from conodont colors (Bergstr6m, 1980). Conodonts collected near the Si- lurian bentonites show a color alteration index (CAI) of 6, indicating temperatures >300~ no upper tem- perature being given. The Silurian bentonites show conversion of smectite nearly all the way to illite (i.e., < 10% smectite layers).
Conodonts from the Ordovician strata indicate low- er temperatures. The Skagen limestone, sampled at Stora Mossen above the B-bed gave CAI values of 4; those from the Dalby Limestone below the B-bed gave CAI values of 3. These values correspond to temper- atures of 190*--300 ~ and 110~200~ respectively. Still deeper in the strata (and further from the diabase) in the Gulh6gen Formation (Figure 1) a CAI of 1.5 was calculated, equivalent to temperatures of 50~90~
12 B ]g
K 78 1(71 /k
K7Z,/x KnZ~ A
ooa B ~ ~55 ~'~B51
B-bed I I I I I I I I I I
K72J^ I K~ B 3 2 % / k / k " K 71
B 31 A K 78
9k
x x x x 10/~
XxX X
13k
17k
3oA
i i
03 0.8 i i
o.2 oi+ o.s 0'+ K ~/'b~0(0H b
Figure 7. Plot of X-ray powder diffraction positions in re-
ciprocal units (= r* = 1 100/~ ~) vs. Knx/O,0(OH)2; symbols d
as in Figure 4.
Most likely, the temperatures indicated are on the high side inasmuch as the period of heating must have been shorter than that of the CAI reference scale (Harris, 1979). The relative decrease in temperature down- wards in the strata shows that burial diagenesis of the type described by Perry and Hower (1970) was not active in the Kinnekulle bentonites or that it has been overprinted by the heating effect of the diabase. These conclusions appear to be true also for many other K-bentonites (Parachoniak and Srodofi, 1973; Sn/ill, 1977; Schultz, 1978; Pevear et al., 1980; Huff and Tiirkmen6glfi, 1981; Altaner et al., 1984).
The Ordovician bentonites at Kinnekulle are located within a single 12-m-thick sedimentary sequence; tem- perature differences within this narrow interval might be expected to have been minor; however, based on CAI values, the temperature decreased downward, meaning that C-beds, which have a high proportion of illite layers in I/S, reacted at a lower temperature than the more smectitic B-bed above. Thus, factors other than temperature were probably important in the smectite-to-illite reaction.
To systematize different stages of the smectite-illite series, Inoue and Utada (1983, Figures 5 and 9) used the migration of XRD peaks after the model of Wa-

Vol. 34, No. 4, 1986 Potassium bentonites from Kinnekulle, Sweden 451
2,O
1,8
1.6
1./,
~12 t -
=~ 19
0.t~
0,2
/
4 h 1
h 2
8" - 6"--3" 20
b a c k g r o u n d a t 2 0 ~ 3 ~
peak a t 20=5.3"
B' 53" ~3" 20
. . . . . . 0.8 0.2 0.3 O.t, 0.5 0.6 0.7 K fix/010 (OH)z
Figure 8. Plot of saddle-to-peak relation, hi/hE, vs. K,./ O~o(OH)2. Small sketches in right-hand side of figure indicate how h~ and h 2 were measured; symbols as in Figure 4.
tanabe (1981). In Figure 10 their diagram is modified to include Kinnekulle samples. These samples fill the gap in the Inoue and Utada (1983) plot. Inoue and Utada (1983) indicated a "diagenetic" field and arrows showing the hydrothermal trend, the latter along the g = 1 line (R=I of Reynolds, 1980). The B-samples all fall in the diagenetic field, whereas two of the C-bed samples are in the diagenetic field and two are close to the g = 1 line. Nothing suggests that the reaction mech- anism was different for the C-bed samples. The ex- trapolated path of the g = 1 line, proposed for hydro- thermally reacted samples, apparently suits samples with a different chemistry, such as the Roseki samples which have Na in the interlayer position instead of K. Thus, crystal-chemical criteria rather than reaction mechanisms decide where samples will fall in the scheme.
Zonat ion
It is obvious that the thickness of a bentonite bed had a major influence on the degree of illite formation, as has been found for "whole rock" samples from Kin- nekulle studied by Velde and Brusewitz (1982). Re- cently, Altaner et al. (1984) described beds similar to, but younger than, those at Kinnekulle, in K-bentonites
6
5
I
=73
2
O• O o
K20 (%) in I/S minerats
Figure 9. Plot of A(12 -- 11) VS. K20 (%) in I/S minerals; 11 = peak varying between 5.3~176 and 12 = peak varying be- tween 8.7~ CuKa radiation. K 2 0 (%) from Table 2 and corrected for impurities as shown in Table 3. Curve for a rough estimate of K20 in illite/smectite (I/S) minerals. If K20 in the total sample is known, the amount of I/S can be obtained, provided only minor quantities of other potassium- bearing minerals are present; symbols as in Figure 4.
from the disturbed belt, Montana. One 2.5-m-thick bed showed clear zonation, with greater proportions of illite layers in I/S at the contacts. Thinner beds, if > 90 cm thick, also showed zonation. I/S minerals in the thinner beds contained the same proportion ofillite and smectite layers as those at the contact of the thick bed. At Kinnekulle, a distinct zonation is apparent from the center of the B-bed towards its upper bound- ary; I/S at the boundary contained about 20% less smectite layers than I/S at the center of the bed. Pre- l iminary data on the lower half of the bed failed to show such a zonation downwards (Brusewitz, 1984). Instead, according to XRD data, the smectite propor- tion in the I/S was constant at about 50% smectite layers.
Variations in geologic setting of the two areas de- scribed above may explain why the reactions differed. The Kinnekulle bentonite is flat-lying, and the lower contact shows silicification, probably a side effect of the alteration of volcanic glass to smectite, which slowed or hindered diffusion. The Montana bed, on the other hand, is tilted because of thrusting (Mudge, 1972; S. J. Altaner, Department of Geology, University of Il- l inois, Urbana , I l l inois, personal c o m m u n i c a t i o n , 1985), which made diffusion from both contacts equal- ly possible. K/Ar age determinations of the Montana beds gave ages of 54-56 Ma at the contacts and ages 3-4 m.y. younger at the center. Similar K/Ar age de- terminations of the Kinnekulle B-bed gave 336 Ma for the upper contact and about 300 Ma for samples col- lected at the center, a difference of 36 m.y. within a

452 Brusewitz Clays and Clay Minerals
9,O
~ 8,0
(._ C n o J
7,0 c-,I
6,0
5,0
E}SEKI ( N ( : I ~
g=l ~ ~
g=0 I l I i I
1,0 2,0 3,0 4,0 5,0 /X 201 {degree)
Figure 10. Plot of A202 vs. A20. modified after ]noue and Utada (1983, Figures 5 and 9); &20~ = 12 - 11 and A 2 0 2 = 13 - -
lz, where 11 is the reflection that varies between 5.1" and 7.6 ~ 12 between 8.9* and 10.2 ~ , and 13 between 16.1 ~ and 17.5~ CuKa radiation, g = 0, g = 1, and g = 2 correspond to R=0, R= 1, and R=2 of Reynolds (1980). Kinnekulle samples are added. The random B-bed samples (O) continue the g = 0 line beyond the marked extrapolation (from the original fig- ure). The ordered C-bed samples (A) link up with the random samples but break into a new direction towards the g = 1 line, the most ordered sample, K78, falling on this line. The B-bed sample, B31, from the top boundary has an interme- diate position, belonging to both series. The Roseki samples (A) with Na instead of K in the illite interlayer fall in a different field. The shaded area corresponds to the diagenetic field in the original figure. Arrows show hydrothermal trends. The Silurian samples (x) plot in the same region as the illitic samples of the paper cited.
thickness of only about 1 m, 10 times greater than for a similar distance in the Montana bed.
The availability of K in the surrounding rocks (shale vs. carbonate) is important to the smectite-to-illite re- action (Altaner et aL, 1984). Nadeau and Reynolds (1981) found that the percentage of illite layers in I/S was lower in calcareous environments than in non- calcareous environments. These findings are supported by hydrothermal experiments which show that the ra- tio of K + to Ca 2+ to Mg 2+ is particularly important, the divalent ions inhibiting the smectite-to-illite re- action (Eberl, 1978; Roberson and Lahann, 1981; In- oue, 1983). A plausible mechanism for the smectite- to-illite reaction can he deduced from the experiments of Lahann and Roberson (1980) (time and temperature necessarily being different), in which a mildly alkaline bicarbonate buffer (pH = 9) was used to study the dis- solution of silica from montmori l loni te--a reaction that is strongly dependent on the ratios of K+:Ca 2+, K+: Mg 2+, and K+:Na +. A low ratio of mono- to divalent ions retards the reaction. A mildly alkaline environ- ment may have prevailed at Kinnekulle in which silica, alkalies, and most of the other reacting elements, such as A1, Ca, Sr, and Mg, probably entered solution as
ions or ion complexes. As the proport ion of smectite layers in I/S decreased, Sr was removed from the sys- tem, most likely precipitated with Ca as carbonate. A1 was apparently abundant, but did not limit the srnec- tite-to-illite reaction, as evidenced by the presence of kaolinite.
C O N C L U S I O N S
The Kinnekulle bentonites contain I/S ranging from random (R=0) and containing 50-60% smectite layers to those having greater order (R=I , R=3) and con- taining as much as 90% illite layers. Data derived from chemical analyses do not support earlier data based on X R D determinations. Thus, the charge o f M +, extrap- olated to K~x = 0, is 0.62/O~0(OH)2, which is high com- pared with reported value for montmori l loni te of about 0.3--0.4 (Weaver and Pollard, 1973; Eslinger et al., 1979; Srodofi et al., 1986). The nearly constant value of total layer charge (0.68 _+ 0.03) for a variation of K~x of 0.23 to 0.52 per O~o(OH)2 has not been previously docu- mented. Differences in the pretreatment o f the samples or the analytical techniques may have influenced the results.
All the R=0 I/S samples were collected from the 2-m-thick B-bed, which showed an increasing per- centage of illite layers towards the upper contact. Pre- liminary values from the lower half of the bed did not show the same systematic change of K content and proportion of illite layers in I/S that was found by Altaner et aL (1984), probably due to the difference in the two geologic environments. The age difference be- tween the top and the center of the bed (36 m.y.) is not clearly understood, Illite layers may have started to form at about 336 Ma, and then, during the intrusion of the diabase at about 300 Ma, the reaction went to completion with the formation of the K-bentonite that is present today.
The thinner C-beds show a higher regularity in I/S ordering than the B-bed; in the former beds a zonation can be seen too, in which higher proportions ofsmect i te layers in I/S are found in the middle of a given bed. The thin Silurian beds nearest the diabase have reacted to nearly pure illite.
The extent to which the conversion of smectite-to- illite took place appears to have been partly dependent on temperature, mainly provided by the diabase in- trusive. If the temperature was the same for all beds, diffusion and chemical environment must have gov- erned the extent of the reaction. The removal of Ca and Mg was apparently important, as was a source of K, both of which led to faster reaction (more complete conversion) in the thin beds than in thick beds at a given temperature. Reaction was slowest at the center of the thick beds.

Vol. 34, No. 4, 1986 Potassium bentonites from Kinnekulle, Sweden 453
A C K N O W L E D G M E N T S
I thank m a n y o f the staff o f the Geologica l Survey of Sweden for var ious assistance dur ing this work, in particular, S. Sn~ill and G. N o r d m a r k . I a m grateful to Bruce Velde and to T. Alexandersson (Uppsala U n i - versity) for c o m m e n t s and cons t ruc t ive cr i t icism. I also acknowledge contr ibut ions f rom the Swedish Scientific Research Council .
R E F E R E N C E S
Altaner, S. P., Hower, J., Whitney, G., and Aronson, J. L. (1984) Model for K-bentonite formation: evidence from zoned K-bentonites in the disturbed belt, Montana: Geol- ogy 12, 412-415.
Bergstrrm, S. M. (1980) Conodonts as paleotemperature tools in Ordovician rocks of the Caledonides and adjacent areas in Scandinavia and the British Isles: Geol. Fi~ren. Stockholm FiSrh. 102, 377-392.
Brusewitz, A. M. (1982) A filtering device for oriented XRD mounts: Clay Miner. 17, 263-264.
Brusewitz, A. M. (1984) Preliminary report on potassium bentonites in Sweden. A study of illite-smectite minerals: in SmectiteAIteration, D. M. Andersson, compiler, Swedish Nuclear Fuel and Waste Management Co. Tech. Rept. 84- 11, 105-121.
Bystrrm, A. M. (1954) 'Mixed layer' minerals from Or- dovician bentonite beds at Kinnekulle, Sweden: Nature 173, 783.
Bystrrm, A. M. (1956) Mineralogy of the Ordovician ben- tonite beds at Kinnekulle, Sweden: Sver. Geol. Unders. Se- rie C, No. 540, 62 pp.
Bystr6m-Asklund, A. M. (1966) Sample cups and a tech- nique for sideward packing of X-ray diffractometer speci- mens: Amer. Mineral. 51, 1234-1237.
Bystr/Sm-Asklund, A. M., Baadsgaard, H., and Folinsbee, R. E. (1961) K/Ar age of biotite, sanidine and illite from Middle Ordovician bentonites at Kinnekulle, Sweden: Geol. Fiiren. Stockholm Fi~rh. 83, 92--96.
Cooper, J. A. (1963) The flame photometric determination of potassium in geological materials used for potassium- argon dating: Geochim. Cosmochim. Acta 27, 525-546.
Danielsson, A. (1968) Spectrochemical analysis for geo- chemical purposes: in Proc. 13th Colloquium Spectrosco- plum Internationale, Neville Goodman, ed., Adam Hilger Ltd., London, 311-323.
Drever, J.J. (1973) The preparation oforiented clay mineral specimens for X-ray diffraction of analysis by a filter mem- brane peel technique: Amer. Mineral. 58, 553-554.
Eberl, D. D. (1978) The reaction of montmorillonite to mixed-layer clay: the effect of interlayer alkali and alkaline cations: Geochim. Cosmochim. Acta 42, 1-7.
Eslinger, E., Highsmith, P., Albers, D., and De Mayo, B. (1979) Role of iron in the conversion of smectite to illite in bentonites in the disturbed belt, Montana: Clays & Clay Minerals 27, 327-338.
Eslinger, E. V. and Savin, S. M. (1976) Mineralogy and O~S/ O 16 ratios of fine-grained quartz and clay from site 323: in Init. Reports on the Deep Sea Project 35, Paula Worstell, ed., U.S. Government Printing Office, Washington, D.C., 489-496.
Foster, M.D. (1951) The importance of exchangeable mag- nesium and cation-exchange capacity in the study of mont- morillonitic clay: Amer. Mineral 36, 717-730.
Harris, A. G. (1979) Conodont color alteration, an organo- mineral metamorphic index, and its application to Appa-
lachian basin geology: Soc. Econ. Paleon. Mineral., Spec. Pub. 26, 3-16.
Hoffman, J. (1976) Regional metamorphism and K/Ar dat- ing of clay minerals in Cretaceous sediments of the dis- turbed belt of Montana: Ph.D. thesis, Case Western Reserve University, Cleveland, Ohio, 266 pp.
Horstman, E. L. (1957) The distribution of lithium, rubid- ium, and cesium in igneous and sedimentary rocks: Geo- chim. Cosmochim. Acta 12, 1-28.
Hower, J. and Mowatt, T. C. (1966) The mineralogy ofillite and mixed-layer illite/montmorillonites: Amer. Mineral 51, 825-854.
Huff, W. D. and Tiirkmenrglii, A.G. (1981) Chemical char- acteristic and origin of Ordovician K-bentonites along the Cincinnati arch: Clays & Clay Minerals 29, 113-123.
Inoue, A. (1983) Potassium fixation by clay minerals during hydrothermal treatment: Clays & Clay Minerals 31, 81- 91.
Inoue, A., Minato, H., and Utada, M. (1978) Mineralogical properties and occurrence of illite/montmorillonite mixed- layer minerals formed from Miocene volcanic glass in Waga- Omono district: Clay Sci. 5, 123-136.
Inoue, A. and Utada, M. (1983) Further investigations of a conversion series of dioctahedral mica/smectites in the Shinzan hydrothermal alteration area, northeast Japan: Clays & Clay Minerals 31, 400-412.
Jaanusson, V. (1964) The Viruan (Middle Ordovician) of Kinnekulle and northern Billingen, Viistergrtland: Bull. Geol. Inst. Univ. Uppsala 43, 73 pp.
Johansson, S., Sundius, N., and Westerg~rd, A. H. (1943) Description of the mapsheet "Lidkrping": Sver. Geol. Un- ders. Set. Aa No. 182, 197 pp. (in Swedish).
Kunk, M. D., Sutter, J., and Bergstrrm, S. H. (1984) 4~ 39Ar age spectrum dating of biotite and sanidine from Mid- dle Ordovician bentonites of Sweden: a comparison with results from eastern North America: in Abstracts with Prog., Geol. Soc. Amer. 16, p. 566.
Lahann R. W. and Roberson, H. E. (1980) Dissolution of silica from montmorillonite: effect of solution chemistry: Geochim. Cosmochim. Acta 44, 1937-1943.
Mason, B. (1966) Principles of Geochemistry: 3rd ed., Wiley, New York, 329 pp.
Mehra, O. P. and Jackson, M. L. (1960) Iron oxide removal from soils and clays by a dithionite-citrate system buffered with sodium bicarbonate: in Clay and Clay Minerals, Proc. 7th Natl. Conf., Washington, D.C., 1958, Ada Swineford, ed., Pergamon Press, New York, 317-327.
Mudge, M.R. (1972) Pre-Quarternary rocks in the Sun Riv- er Canyon area, northwestern Montana: U.S. GeoL Surv. Prof. Pap. 663-A, 142 pp.
Nadeau, P. H. and Reynolds, R. C., Jr. (1981) Burial and contact metamorphism in the Mancos Shale: Clays & Clay Minerals 29, 249-259.
Parachoniak, W. and Srodofi, J. (1973) The formation of kaolinite, montmorillonite and mixed-layer montmorillon- ite-illites during the alteration of Carboniferous tuff (the Upper Silesian coal basin): Mineral. PoL 4, 37-52.
Perry, E. A. and Hower, J. (1970) Burial diagenesis in Gulf Coast pelitic sediments: Clays & Clay Minerals 18, 165- 178.
Pevear, D. R., Williams, V. E., and Mustoe, G. E. (1980) Kaolinite, smectite, and K-rectorite in bentonites: relation to coal rank at Tulameen, British Columbia: Clays & Clay Minerals 28, 241-254.
Priem, H. N. A., Mulder, F. G., Boelrijk, N. A. I. M., Hebeda, E. H., Verschure, R. H., and Verdurmen, E. A. Th. (1968) Geochronological and paleomagnetic reconnaissance sur-

454 Brusewitz Clays and Clay Minerals
vey in parts of central and southern Sweden: Phys. Earth Planet. Interiors 1, 373-380.
Reynolds, R. C., Jr. (1963) Potassium-rubidium ratios and polymorphism in illites and microclines from clay size frac- tions of Proterozoic carbonate rocks: Geochim. Cosmo- chim. Acta 27, 1097-1112.
Reynolds, R. C. (1980) Interstratified minerals: in Crystal Structures of Clay Minerals and their X-ray Identification, G. W. Brindley and G. Brown, eds., Mineralogical Society, London, p. 255.
Reynolds, R. C., Jr. and Hower, J. (1970) The nature of interlayering in mixed-layer illite-montmorillonites: Clays & Clay Minerals 18, 25-36.
Roberson, H. E. and Lahann, R.W. (1981) Smectite to illite conversion rates: effects of solution ct~emistry: Clays & Clay Minerals 29, 129-135.
Schultz, L. G. (1978) Mixed-layer clay in the Pierre Shale and equivalent rocks, northern Great Plains region: U.S. Geol. Surv. Prof. Pap. 1064-A, 28 pp.
Shapiro, L. and Brannock, W. W. (1956) Rapid analysis of silicate rocks: U.S. Geol. Surv. Bull. 1036C, 56 pp.
Skoglund, R. (1963) Uppermost Viruan and lower Harjuan (Ordovician) stratigraphy of V~istergiStland, and lower Har- juan Graptolite Faunas of central Sweden: Bull. Geol. Inst. Univ. Uppsala 42, 55 pp.
Sn/iU, S. (1977) Silurian and Ordovician bentonites of Got- land (Sweden): Acta Univ. Stockholm, Contrib. Geol. 31, 80 pp.
Srodofi, J. (1976) Mixed-layersmectites/illitesinbentonites and tonsteins of Upper Silesian coal basin: Pol. Akad. Nauk. Pr. Mineral. 49, 84 pp.
Srodofi, J. (1980) Preciseidentificationofillite/smectitein-
terstratification by X-ray powder diffraction: Clays & Clay Minerals 28, 401-411.
Srodofi, J. (1981) X-ray identifcation of randomly inter- stratified illite-smectites in mixtures with discrete illite: Clay Miner. 16, 297-304.
Srodofl, J. (1984) X-ray powder diffraction identification of illitic materials: Clays & Clay Minerals 32, 337-349.
Srodofi, J., Morgan, D. J., Eslinger, E. V., Eberl, D. D., and Karlinger, M. R. (1986) Chemistry of illite/smectite and end-member illite: Clays & Clay Minerals 34, 368-378.
Velde, B. and Brusewitz, A. M. (1982) Metasomatic and non-metasomatic low-grade metamorphism of Ordovician meta-bentonites in Sweden: Geochim. Cosmochim. Acta 46, 447-452.
Waern, B., Thorslund, P., and Henningsmoen, G. (1948) Deep boring through Ordovician and Silurian strata at Kin- nekulle, Vesterg6tland: Bull. Geol. Inst. Univ. Uppsala 32, 337-474.
Watanabe, T. (1981) Identificationofillite/montmorillonite interstratifications by X-ray powder diffraction: J. Miner. Soc. Japan, Spec. Issue 15, 32-41 (in Japanese).
Weaver, C. E. (1953) Mineralogy and petrology of some Ordovician K-bentonites and related limestones: Geol. Soc. America Bull. 64, 921-964.
Weaver, C. E. and Pollard, L. D. (1973) The Chemistry of Clay Minerals, Elsevier, Amsterdam, 250 pp.
Weir, A. H., Ormerod, E. C., and E1Mansey, I. M.I . (1975) Clay mineralogy of sediments of the western Nile delta: Clay Miner. 10, 369-386.
(Received 27 June 1985; accepted 29 March 1986; Ms. 1497)