chem 108b lab chemical reactivity in the marine environmentabacus.bates.edu/~raustin/fluxflow/108b...
TRANSCRIPT

1
CHEM 108b lab Chemical Reactivity in the Marine
Environment
Professor Rachel Narehood Austin Winter 2007

2
Introduction Students enrolled in CHEM 108b, Chemical Reactivity in the Environment, are also enrolled in the accompanying lab. Be certain that you know the precise time that your lab starts and that you arrive promptly each week. The practical goal of this laboratory is to construct, study, and maintain an ecosystem: a salt-water aquarium. This lab is based on a similar lab developed for advanced chemistry students by Professor K. Hughes when he was at Georgia Tech.
This ecosystem is isolated and incomplete - not part of a balanced, complete, self-sustaining system like those that exist in nature, having evolved over millions of years. Consequently its health will depend on our ability to manage it. With the exception of certain gases that the aquarium’s water can exchange with the atmosphere, the only things added to or taken out of this ecosystem (the aquarium) will be those things that we add or take out, whether intentionally or unintentionally. In other words, this ecosystem is ours to manage, and if we fail to manage it properly the ecosystem will fail. To do this effectively, we must understand the variables (salinity, nitrate, phosphate, temperature, light, alkalinity, flora and fauna, dissolved oxygen, etc.), know how to sample and measure these variables, and how to adjust them if they are out of balance.
In the process of studying our aquarium we will observe how certain elements (C, N, P, S) cycle in the environment, which is the dominant theme in the course. I hope that by spending the entire semester on a single project you will have lots of opportunity to appreciate the connections between chemistry and the world. And I hope that you will learn a range of standard laboratory techniques that will be useful to you if you continue study in chemistry or a related science – in a context where the results of your work really matter. Finally, whether or not you choose to continue in science, you will learn problem-solving techniques that will be useful in whatever field you choose, and in other aspects of your life.
Lab structure There are many different measurements and tasks, which have been broken down into three sets (shown below). Through the course of the semester, your group (3) students will have the chance to do each of these analyses. Each group will be assigned one set of analyses for a three-week period. Each member of the group will be responsible for one part of the set of analyses on the first week (you can decide who starts with which task). After the first week, however, you must rotate through all the different analyses within your group. You may use the stock solutions of your lab partners but you must carry out your own analysis on subsequent weeks. As a group you will submit one lab report and receive one grade.
At a minimum, measurements should be taken once a week (during your assigned lab time). During times of rapid change, more frequent monitoring may be useful.
You must complete all required calculations in order to determine the answer to the analysis you have performed BEFORE YOU LEAVE LAB FOR THE WEEK. The results of your analyses, maintenance information, observations, etc. will be kept in the lab room. This will make it easy to summarize our results and monitor our ecosystem.
All measurements must be recorded in a lab notebook. Each member of the group must have his or her own notebook (permanently bound, no spiral bindings or removable pages). Data entries should be made directly in this notebook, in ink.

3
The three tasks are listed below:
Set A: Nitrogen cycle - ammonia, nitrite, nitrate
Set B: Minerals (SO42-, PO4
3-, Ca2+, Mg2+)
Set C: Alkalinity, Salinity, Dissolved Oxygen
Calendar: Week 1-2: introduction, excel training course, overview of tank, technical training, safety, preparation for first rotation
Week 3-5: first rotation
Week 6: first written report due Weeks 6-8: second rotation
Week 9: second written report due Weeks 9 -11: third rotation
Week 12: third written report due, final reports
The best source of information for developing appropriate analytical procedures is the book Standard Methods for the Examination of Water and Wastewater. A copy is on reserve in the library.
In addition, there are specific analytical procedures that have been adapted for CHEM 108b lab. They are available on the CHEM108b laboratory web page. There are additional resources on that page as well.

4
General Experimental Information: Chemistry 108B lab locker contents 3 – 50 mL beakers 1 – buchner funner 2 – 100 mL beakers 1 – 250 mL filtering flask 1 – 250 mL beaker 1 – rubber policeman 1 – 400 mL beaker 6 – test tubes with rack 2 – 125 mL erlenmeyers 1 – vacuum tubing 2 – 250 mL erlenmeyers 1 – water bottle 1 – 10 mL graduated cylinder 2 – watch glasses 1 – 50 mL graduated cylinder 1 - towel 3 – medicine droppers 2 – utility clamps 2 – glass stirring rods 1 – test tube brush 1 – glass funnel 3” 1 - scoopula Equipment available to check out from the common stock in the laboratory Beakers: 400 mL, 1 L Erlenmeyer flasks: 125 mL, 250 mL, 500 mL, 1 L Filter flasks: 125 mL, 250 mL, 500 mL Graduated cylinders: 10 mL, 25 mL, 50 mL, 100 mL, 250 mL, 500 mL, 1L Volumetric flasks: 10 mL, 25 mL, 50 mL, 100 mL, 250 mL, 500 mL, 1 L Mohr(graduated) pipets: 1 mL, 2 mL, 5 mL, 10 mL, 25 mL Transfer pipets(to deliver total volume): 1 mL, 2 mL, 3 mL, 4 mL, 5 mL, 10 mL, 15 mL, 20 mL, 25 mL, 50 mL, 100 mL PET storage bottles: 100 mL, 1 L, all stock solutions should be transferred to PET bottles for week to week storage Burets: 25 mL, 50 mL Funnels: 3” Buchner funnels Gooch crucibles Magnetic stirrers Hot plates
Blue bulbs and pipet assisters Watch glasses Dropper bottles Dissolved oxygen bottles UV/Vis cuvettes Spectronic 21 tubes
Please note: The term “stock solution” or “standard solution” means something quite specific in chemistry. These solutions should be made as precisely as possible so that the actually concentration in the solution matches the intended concentration. For different types of analyzes the available precision will vary. In this course, “stock” or “standard” solutions should always be made with the analytic techniques introduced – analytical balances, pipets, and volumetric flasks. In contrast, chemical reagents – solutions that react to form other molecules – generally do not have to be prepared with the same sort of precision. Often graduated cylinder will be sufficient for measuring volumes. As you gain more experience in chemistry, you will develop a better sense for what corners can and cannot be cut. In this manual, we have made it clear when you are making up stock and standard solutions. When uncertain, ask your instructor or your teaching assistant.
Also, read the manual carefully and follow instructions precisely. Developing technical skills is an important component of becoming a scientist (or doing good science).

5
Lab Report Format:
Lab reports are required the week after your rotation through an assignment ends. These reports are a major component of your grade (90% of the lab grade). [The remaining 10% of your grade will be based on effort, including the effort you put into your peer review responsibilities.] The lab reports should reflect the effort and input of all of the members. Each person will be assigned primary responsibility for one of the sections of the lab report and the assigned sections will rotate through the semester. On the second week of lab, you must come to lab with a copy of all calculations you have done to determine the concentration of whatever chemical you were measuring during the following week. These calculations must be sufficiently detailed to allow them to be checked. On the third week of lab you must make up a quality control standard.
A rough draft of the entire lab is due at 5:00 pm on the first Thursday AFTER a three-week lab rotation has ended. This rough draft must contain the signatures of all group members showing that they have read it and believe it to be a reasonable draft. It will then be given to another class member to evaluate and comment on. Peer reviews will be done anonomously. The evaluated report will be returned to the group by noon on Monday and the final draft of the report is due at 5:00 pm on the following Wednesday (i.e. 8-9 days after the rotation finished). Again, all group members must sign the completed report, acknowledging that he or she has contributed to collecting the data and writing the report. Your signature is also a confirmation that you are satisfied with the final report. These reports will be graded on completeness, demonstrated chemical knowledge, and the clarity and precision of the writing. Your report should be a convincing professional assessment of your completed tasks.
The professor or lab instructor must get a copy. Peer review guidelines and forms are available in the appendix. It is strongly suggested that people work with The Writing Workshop.
Final draft due Wednesday at 5:00 pm.
Lab reports should contain
1. Abstract- brief statement that succinctly states what was measured, how it was measured, and what the results were (concentration, variability, observations, etc.) This should always be the first page of your report. It must fit on that first page (along with the title of the report, group members, dates, etc.)
2. Introduction- provides some background information on the roles of the species reported (NO3-
for example) in the marine ecosystem. Potential sources are included on the web page; these sources should be acknowledged with footnotes or endnotes. Depending on how many species your group is analyzing, this section will be 1.5-3 pages.
3. Experimental Section- provides detailed information on how all the analyses were done.
4. Results- presents your results clearly. May include graphs ([Cl-] vs. time, for example) or summary tables. If you averaged data points or did other statistical manipulations (Q-tests), that should also be stated. An estimation of the experimental error of your results is also helpful.
5. Discussion and Conclusion- summarizes what was learned from the experiments and speculates about the chemistry. This section (and only this section) can include hypotheses about the relationships between your data and other chemical or physical processes occurring in the

6
aquarium. For example, you could include a statement like "The decrease in dissolved oxygen from January 21 to January 28 is coincident with the appearance of a green algae bloom in the top of the tank" and go on to further develop the relationship between dissolved oxygen and algae. But be careful not to overstate your conclusions. Don't say "On February 3, a large increase in nitrate concentration killed four fish" but rather "the large increase in nitrate concentration coincided with the death of four fish". After all, you don't know the causality: Did the increase in nitrate cause the fish to die? Or did the fish die from some other reason and their death caused the nitrate levels to go up? Be careful and examine your logic.
Finally, the nitty-gritty details…
a. These reports will vary in length from 10-15 pages (double spaced, 10-12 pt type). That sounds like a lot, but you will find that this is reasonable. I'm not counting pages, but looking for completeness. A complete nine-page report is much better than a sloppy, incomplete 14-page report.
b. The report should be written in the past tense and describe exactly what you did. Don't simply copy the experimental guidelines.
c. Figures, graphs and tables should be incorporated into the text of the report. If your word processing program does not allow this, you can attach the figures and tables in an appendix. Just be sure to number the figures and tables and refer to them by number in the text so I can find what you are referring to.
d. Chemical equations are required. You can write them in by hand, if necessary, but many word processing programs can handle simple equations. Use subscripts, superscripts, and Greek characters properly in your text, spreadsheets, tables, and graphs: SO4
2- is much more readable than SO42-.
e. Attend to the writing. Make sure that the meanings you want to convey are clear. The Writing Workshop has staff proficient in scientific writing. Take advantage of their expertise! If different group members are writing different parts of the report, be careful to integrate them so that they read well and don't unnecessarily repeat or omit information.
f. Proofread, spellcheck, proofread, and proofread again. Spelling, grammar and punctuation do count.
The following books are on reserve to help you with your introduction: Natural Reef Aquariums , by Tullock, ISBN 1-890087-01-7 The Conscientious Marine Aquarist, by Fenner, ISBN 1-890087-02-5 The New Marine Aquarium, by Paletta, ISBN 1-890087-52-1

7
Grading rubric: Each section is worth a maximum of ten points (1) Title: concise title, all lab members signatures (-2 points for each signature missing) (2) Abstract: concise, clearly written, statement of all significant results and experiments, written in third person (-2 points not written in third person, -4 points if all key results are not stated) (3) Intro: concise, clearly written, describes significance of experiments done in lab. (-5 points if intro is not written about experiments that were actually done) (4) Exp: all experiments written AS done. Nothing is included in report that was not actually done in lab, all amounts are given in moles and grams. (-1 point for each solution used whose concentration is not stated, -1 point for anything skipped that was done or for anything written about that was not actually done) MUST CONTAIN QUALITY CONTROL EXP. (5) Results: all results are clearly stated, no mistakes in calculations (-3 points for each significant mistake in determining results) MUST CONTAIN QUALITY CONTROL EXP. (6) Discussion: clear discussion of what was observed and its significance to marine ecosystem (-3 points for any result not discussed) (7) Tables and graphs: all tables, figures, and graphs must have number and a title (-2 points for any figures or graphs or tables without numbers and titles and -1 for any useless titles, like “Signal Vs. Concentration”); all graphs must have both axes labeled (-2 points for any graphs without axes labeled); calibration curves must have a best-fit trendline and with the equation of the fit and R2 value printed on the graph (8) Writing: Writing must be concise, without typographical errors or subscript/superscript errors (-1 point for each typographical error and each subscript/superscript errors – chemical formulas must be written correctly). Sentences must be unambiguous (-1 point for each ambiguous sentence) (9) Effort: Lab instructor will assess effort of group and individuals. Being late for lab will cause effort grade to diminish for individual. Coming to lab unprepared will cause effort grade to diminish as well. If results are not posted by end of week for first week of lab and end of class for second and third weeks of each rotation weeks, five points will be deducted for effort (per incident) (10) Data: Data must make sense and be consistent with class average. Failure to obtain reasonable results will lead to three points being deducted per unreasonable data point with an additional two points deducted if no attempt is made to explain unreasonable result. MUST CONTAIN QUALITY CONTROL EXP. Also, your calibration curve data should be made precisely. Your calibration curve standards must produce a curve with an R2 that is ≥ 0.95. You may need to re-make or re-measure your calibration curve in order to achieve this. Failure to do so will result in a loss of 2 points.

8
Quality Control
On the final week of each rotation, each group must perform a quality control experiment for all
analyses where one is possible (every analysis except dissolved oxygen). The idea behind a quality
control experiment is that a sample whose concentration is known is tested as though the
concentration was not known. Ideally, the concentration obtained from the analytical method will
match the known concentration – e.g. the concentration that was deliberately made by the analyst. If
it does, one can have confidence in the analytical method. If it does not, it is clear evidence that
there is an error someplace, which must be tracked down before the data can be used (or in this case,
reported). For some of the analyses, especially the titrations with a colormetric endpoint that is a bit
subjective (salinity if the best example of this), it might be helpful to make a quality control standard
at the very beginning of the analyses in the first week in order to determine what the appropriate end
point looks like. The quality control sample must be made up using analytic methods. Its
concentration must be known precisely. Once it is made, however, it is treated as though it was a
tank sample and all procedures described for tank samples apply to its handling and disposal.
CHEMICALS FOR QUALITY CONTROL SAMPLES
Waste: Reaction mixtures are disposed in the same manner as those listed in lab manual. Leftover sample may go down the drain.
AMMONIA NH4Cl (Ammonium Chloride) NITRITE NaNO2 (Sodium Nitrite) NITRATE KNO3 (Potassium Nitrate) PHOSPHATE K2HPO4 (Potassium Phosphate) SULFATE MnSO4
.H2O (Manganous Sulfate) CALCIUM CaCl2 (Calcium Chloride) MAGNESIUM MgCl2 (Magnesium Chloride) DISSOLVED OXYGEN None ALKALINITY Na2CO3(Sodium Carbonate) SALINITY NaCl (Sodium Chloride)

9
I. Nitrogen Cycle
Nitrogen, an essential part of proteins, has a complex cycle in the marine environment. The majority of nitrogen exists as nitrogen gas (N2), which is inert. Certain bacteria and blue-green algae can "fix" the nitrogen (put it into a useful form) and these fixed forms of nitrogen end up in plant proteins. Fish and other marine organisms consume these plants and convert the plant proteins into animal proteins. The proteins are then digested in the organism. The digested nitrogen is excreted in the form of ammonia (NH3) which is in equilibrium with its ion ammonium (NH4
+).
Unfortunately, ammonia is highly toxic to organisms even at very low concentrations (0.1-1 ppm) in the marine environment and can increase in concentration as pH changes. In order to rid the water of the ammonia, beneficial bacteria change the highly toxic ammonia into less toxic forms. Nitrosomona bacteria take the ammonia and break it down into nitrite (NO2
-) by the following reaction:
NH3 + 2 O2 +NADH NO2- + 2 H2O + NAD+
The nitrite (desirable levels are less than 1 ppm) is then broken down by bacteria called Nitrobacter into a much less toxic and actually useful ion called nitrate (NO3
-) by:
2 NO2- + O2 2 NO3
-
Nitrate can then be used as a plant nutrient or can be directly reduced, by bacteria, into nitrogen gas and reenter the atmosphere. Nitrate levels less than 20 ppm are usually acceptable, less than 10 ppm is better for the fish and invertebrates living in the aquarium (in general, the lower the better!).
Ammonia (NH3) Determination Chemistry The concentration of the highly toxic ammonia can be detected and measured by a color change when in the presence of sodium hypochlorate (NaOCl) from household bleach and phenol (C6H5OH).
The concentration of ammonia is calculated by measuring the absorbance of the solution at 630 nm. Indophenol (product of the reaction between ammonia, hypochlorite, and phenol) absorbs light at 630 nm and the amount of light absorbed is proportional to its concentration by Beer's Law: You can review the background on Beer’s Law in the General Techniques portion of the lab manual.
We strongly recommend that you carefully read the method in the handbook on reserve (Standard Methods for the Examination of Water and Wastewater). Students have had problems with this assay!!
OH
NH3 + HOCl +MnSO4 N OHO
Indophenol

10
Reagents Manganous sulfate catalyst: dissolve 25 mg MnSO4•H2O in 50 mL of Milli-Q water. Store in a small bottle or indicator bottle.
NaOCl solution: to 10 mL of Milli-Q water, add 2.5 mL of commercial bleach (NaOCl). Prepare this reagent in the fume hood! Adjust the pH by adding 45 drops of 1 M HCl, Make this solution fresh each week.
Phenol solution: dissolve 0.25 g of NaOH and 1 g of phenol in 10 mL of Milli-Q water. Handle phenol with extreme caution and prepare in the fume hood! Make this reagent fresh each week.
Keep all ammonia stock and standard solutions tightly stoppered. Stock1 ammonia solution: dissolve 0.0955 g ammonium chloride (NH4Cl) in 500-mL volumetric flask filled with Milli-Q water. This solution is 61.0 ppm NH3. Store in a tightly capped bottle. (Remember, you don’t need to measure out exactly 0.0955 g. You just need to get close and know exactly what the mass was. A mass of 0.0942 g is okay.)
Use Milli-Q water to zero the spectrophotometer.
Procedure 1. Standard
Before employing any analytical method to determine the concentration of an unknown sample, one should always try the method with solutions or standards of known concentrations. Using the procedure outlined below, determine the accuracy and precision of the assay using standard ammonia solutions of several known concentrations. These will constitute your Beer's Law plot.
Example of a standard ammonia solution: dilute 1 mL (using a transfer pipet or pipetter) of the stock solution (61.0 ppm NH3) to 100 mL in a volumetric flask with Milli-Q water to get a 0.610 ppm solution. A set of standard solutions can be made in this way with concentrations ranging from 0.1 to 0.61 ppm NH3.
To a 10-mL sample of an ammonia standard, using an eyedropper (not a Pasteur pipet) add 1 drop of the MnSO4 catalyst and place on a magnetic stirrer. Turn the stirrer on a slow stir setting. Once stirring, add 0.5 mL of NaOCl solution and then add 0.6 mL of phenol solution dropwise. Let the solution stir for ten minutes to get the most intense color. Transfer the solution to a clean cuvette and measure the absorbance at 630 nm. (Do not forget to blank the instrument with a solution containing Milli-Q water and all reagents beforehand.) It is important to remember that readings over 1 for absorbance are not reliable; thus solutions must be diluted until the readings are between 0 and 1. It is a good idea to do a quick plot of your standards (absorbance on the y-axis, concentration on the x-axis). The data points should be linear. The slope of the line equals εb.
2. Sample
Obtain a 10 mL sample of aquarium water. Treat as above. Calculate the concentration of ammonia in the sample by using Beer's law. Report the concentration in ppm NH3.
11
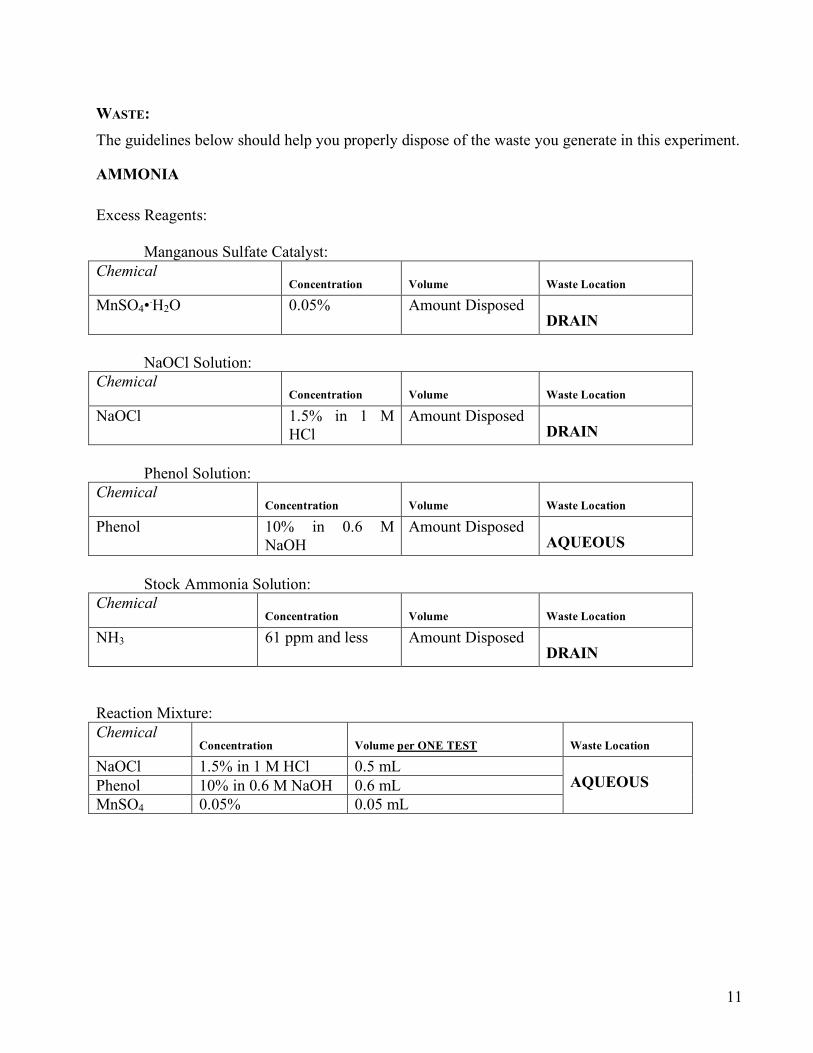
WASTE: The guidelines below should help you properly dispose of the waste you generate in this experiment.
AMMONIA Excess Reagents: Manganous Sulfate Catalyst: Chemical
Concentration Volume Waste Location
MnSO4•.H2O 0.05% Amount Disposed DRAIN
NaOCl Solution: Chemical
Concentration Volume Waste Location
NaOCl 1.5% in 1 M HCl
Amount Disposed DRAIN
Phenol Solution: Chemical
Concentration Volume Waste Location
Phenol 10% in 0.6 M NaOH
Amount Disposed AQUEOUS
Stock Ammonia Solution: Chemical
Concentration Volume Waste Location
NH3 61 ppm and less Amount Disposed DRAIN
Reaction Mixture: Chemical
Concentration Volume per ONE TEST Waste Location
NaOCl 1.5% in 1 M HCl 0.5 mL Phenol 10% in 0.6 M NaOH 0.6 mL MnSO4 0.05% 0.05 mL
AQUEOUS

12
Nitrite Determination Chemistry
The concentration of nitrite can be determined through the formation of a reddish purple azo dye produced at a low pH. An azo dye is a chromophore (colored compound) that has a nitrogen-nitrogen triple bond. The azo dye used in this assay is formed by combining sulfanilamide and nitrite in the water. This diazoated sulfanilamide then reacts with N-(1-naphthyl)-ethylenediamine dihydrochloride (NED-dihydrochloride) to form the azo dye.
NO2- + sulfanilamide + N-(1-napthyl)-ethyelendiamine dihydrochloride (NED dihydrochloride) azo dye
Once the dye has been formed, its absorbance can be measured at 543 nm and compared to the absorbances of standard nitrite solutions. Again, the success of this assay depends on the meticulous preparation of standard solutions. See the instructor for help with volumetric glassware.
Reagents Color reagent: to 80 mL of Milli-Q water, add 1.5 mL of 85% phosphoric acid and 1 g of sulfanilamide. Mix on a magnetic stirrer. After dissolving the sulfanilamide, add 0.1 g of NED dih.drochloride. Mix on a magnetic stirrer until completely dissolved. Dilute to 100 mL with Milli-Q water (stable for 1 month, store in a small bottle). NOTE: Both compounds dissolve slowly. Prepare this reagent on a stirplate with a magnetic stirrer and make sure each compound is dissolved before proceeding.
Stock nitrite solution: add 0.1875 g of NaNO2 to a small amount of Milli-Q water in a 500-mL volumetric flask. Dilute to the mark, mix well. This solution will be 250. ppm nitrite).
Intermediate nitrite solution: dilute 5.00 mL of the stock nitrite solution to 100 mL in a volumetric flask with Milli-Q water. Mix thoroughly. This solution will be 12.5 ppm nitrite.
Standard nitrite solution: use intermediate nitrite solution to make 4-6 standard solutions between 0.100 and 1.00 ppm that are 50 mL in volume using volumetric glassware.
MilliQ water plus all reagents as blank for spectrophotometer.
Procedure
1. Standards
Dilute 25 mL of a standard solution to 100 mL with Milli-Q water. Transfer 50 mL of the sample to an Erlenmeyer flask and add 2.0 mL of the color reagent. Mix the solution for 10 minutes. Meanwhile, set a spectrophotometer to 543 nm and blank (set to 0.00 absorbance) with Milli-Q water to which all reagents have been added.
Measure the absorbances of your 0.1, 0.2, 0.5, and 1.0 ppm standard solutions (don't forget to blank each one!) Make a plot of absorbance versus the concentration (Beer's Law plot, A = εbc). The slope of the plot should be the extinction coefficient.

13
2. Sample
Withdraw a sample of aquarium water. Treat as above. Use the extinction coefficient determined by the standard solutions to calculate the concentration of nitrite in the aquarium water. Report the concentration in ppm nitrite.
WASTE: NITRITES: Excess Reagents: Color Reagent: Chemical
Concentration Volume Waste Location
Phosphoric Acid 1.3% Sulfanilamide 1% NED 0.1%
Amount Disposed Neutralize with baking soda, then pour down the drain.
Stock Nitrite Solution: Chemical
Concentration Volume Waste Location
Nitrite 250 ppm and less Amount Disposed DRAIN
Reaction Mixture: Chemical
Concentration Volume per ONE TEST Waste Location
Phosphoric Acid 0.05% Sulfanilamide 0.04% NED 0.004%
2 mL Neutralize with baking soda, then pour down the drain

14
Nitrate Determination Chemistry
Solutions containing nitrates absorb UV light at 220 nm. Thus, the concentration of nitrates in a water sample can be calculated by comparing the sample's absorption to that of a known nitrate concentration. However, dissolved organic materials can also absorb at 220 nm (thus skewing the nitrate value.) A correction can be calculated by using a second absorption value at 275 nm. At this wavelength, nitrates do not absorb, but dissolved organics do. In marine samples, however, organic nitro containing compounds are generally not significant, and we will not bother to try to correct for their presence.
The nitrate levels in our aquarium can vary significantly, from 1 ppm to over 20 ppm. You may want to check the aquarium log or do an initial test with the nitrate "test kit" to determine the approximate nitrate level before constructing your calibration curve. For example, if the approximate nitrate concentration is 15 ppm, the calibration curve should be in the range of 5-25 ppm. If the nitrate level is around 5 ppm, a calibration curve of 1-10 ppm will give you more accurate results.
If the nitrate level in the tank is extremely high (more than 40 ppm) you may need to dilute the tank water sample to get an accurate analysis. Consult with an instructor about your strategy.
Reagents:
Stock nitrate solution: Potassium nitrate (KNO3) has been dried in an oven at 105°C for 24 hours. It is stored in a small dessicator. Dissolve 0.0408 g in 250 mL of Milli-Q water in a volumetric flask (use the analytical balance to mass out the potassium nitrate). This solution is 100 ppm NO3
-. Don't forget to return the KNO3 to the dessicator when you are done! Use Milli-Q water with all reagents for spectrophotometer blank.
Procedure
1. Standards
Prepare nitrate calibration standards (using volumetric methods) (50 mL each) in the appropriate range. Use Milli-Q water to dilute. Treat each standard with 1 mL of 1 M (or 1 N) HCl. Continue with spectrometry as below.
2. Sample
Draw a water sample from the tank and filter to remove particulates. (if you need to dilute your aquarium water sample, use Milli-Q water and do it here.) Pipet 50 mL into a beaker, add 1 mL of 1 M HCl. Mix well, transfer your sample to a square UV-Vis cuvette.
You will need to measure the absorbance at 220 nanometers (using UV-Vis in Dana 306). Set the spectrometer to 220 nm and blank with Milli-Q water to which all reagents have been added. Measure the absorbance of your standards and the sample. (If the absorbance is about 1.0, re-blank and measure again to be sure you have a reliable number.)
Construct a standard curve by plotting the absorbance due to NO3- against the NO3
- concentration of the standard. Using Beer's law, determine the NO3
- concentration of the sample from the standard curve. Report the concentration of nitrate in the aquarium water in ppm.

15
3. After the first week, in addition to doing the spectrophotometric analysis of nitrate, you will also use the Ion Chromatograph (IC) (an instrument that measures the concentration of selected ions) to measure nitrate concentration in seawater. You will report numbers from both experiments.

16
WASTE NITRATES Excess Reagents: Stock Nitrate Solution: Chemical
Concentration Volume Waste Location
Nitrate 100 ppm and less Amount Disposed DRAIN
Reaction Mixture: Chemical
Concentration Volume Per ONE TEST Waste Location
HCl 1 M 1 mL Neutralize with baking soda, then pour down the drain
II. Minerals
Minerals are critical trace elements for marine life. These minerals are slightly soluble ionic compounds containing many different cations and anions. They enter the seawater by the erosion and weathering of rocks, dirt, and shells. We will be talking about only four of these ions: phosphate, sulfate, calcium and magnesium.
Phosphorus is a very important element for the marine environment. Phosphorous (as phosphate) is used to make bones, teeth, and shells. The primary molecule that organisms use to store energy, ATP, is made of an adenosine molecule and three phosphate (PO4
3-) groups (hence Adenosine TriPhosphate.) In deoxyribonucleic acid, DNA, the backbones of the double helix are alternating deoxyribose sugars and phosphate groups. Phosphate must be tightly controlled, however, because levels that are too high can cause uncontrolled algae growth (alga blooms). Very high levels of phosphate also interfere with shell growth of live corals and other invertebrates. Acceptable levels of phosphate are between 1.0 and 3.0 ppm.
Sulfates (SO42-) are major parts of seawater and change concentrations with salinity. Sulfate helps to
buffer seawater from abrupt changes in pH. Sulfate is also used as a source of biological sulfur compounds like thiols and some amino acids. Sulfur is also important in the active sites of many enzymes such as the nitrogen-fixing nitrogenase enzyme that contains a Mo6S8 core. However, some sulfur-containing compounds are toxic to the marine environment. In particular hydrogen sulfide (H2S, characteristic smell of rotten eggs) is toxic even at low concentrations. A healthy aquarium (or seawater) typically has sulfate levels of about 2700 ppm sulfate, or 2.7 parts per thousand. The cations Mg2+ and Ca2+ are present along with sulfate and phosphate. Most magnesium and calcium salts (calcium carbonate, magnesium phosphate, etc.) are only slightly soluble in water. The "sand" at the bottom of our aquarium is actually crushed coral, composed primarily of calcium

17
carbonate. This provides a very low, but steady, concentration of calcium to the aquarium. Calcium is essential for invertebrate growth. Calcium concentrations of 400 - 450 ppm are desirable. Magnesium concentrations are usually around 1350 ppm (1.35 parts per thousand).
Several different methods will be used to determine the concentrations of sulfate, phosphate, calcium, and magnesium in the marine aquarium. A colorimetric approach will be used to determine the concentration of phosphates. In it, phosphates will react with ammonium molybdate and stannous chloride to form an intense blue color. Its absorbance will be measured on a spectrophotometer and compared to standard phosphate solutions. Sulfate will be determined gravimetrically by precipitating barium sulfate. This precipitate can then be dried and weighed to determine the amount of sulfates contained in seawater. Calcium and magnesium determinations are by titration with EDTA, a complexing agent.
Phosphate Determination Chemistry Phosphate and ammonium molybdate will react under acidic conditions to form phosphomolybdate:
PO43- + (NH4)6Mo7O24 [Mo12O36(PO4)]3- + 3 NH4
+ (unbalanced) [Mo12O36(PO4)]3- + SnCl2Molybdenum Blue
In phosphomolybdate, the molybdenum is present as Mo(VI). When it is reacted with stannous chloride (SnCl2), some of the molybdenum atoms are reduced to Mo(V). This molecule has a distinct blue color. When its absorbance is measured with a spectrophotometer, it can be compared to absorbances of known phosphate concentrations and the sample's concentration can be calculated using Beer's law. Molybdenum Blue clearly contains molybdenum in two valencey states, one of which is (VI) and one of which is (V). Such compounds are known as “mixed valence compounds”. The exact structure of Molybdenum blue is not known. It seems to have the general formula Mo3O8•xH2O but in aqueous solution is likely to be colloidal. Reagents Ammonium molybdate solution: dissolve 2.5 g of (NH4)6Mo7O24 in 17.5 mL Milli-Q water. Meanwhile, dilute 28 mL of concentrated H2SO4 in 40 mL of Milli-Q water. When the acid mixture has cooled down, combine it with the molybdate and dilute the entire solution to 100 mL with Milli-Q water. Use extreme caution when using concentrated H2SO4. Store in a small bottle.
Stannous chloride solution: dissolve 0.50 g of SnCl2•2H2O in 20 mL of glycerol. Warm the glycerol on a hot plate to speed up the process. Store in a small dropper bottle.
Stock phosphate solution: dissolve 23 mg K2HPO4 in a 250 mL volumetric flask with Milli-Q water. Use the analytical balance to mass out this small amount. Use your best technique to get an accurate mass. This solution is 50 ppm PO4
3-. How many grams is 23mg? Use Milli-Q water plus all reagents to zero the spectrophotometer.

18
Procedure 1. Standards
Prepare a series of standards (100 mL – use volumetric flasks) with concentrations between 0.5 and 5 ppm PO4
3- by dilution of the stock solution. Mix well, then pour the entire volume into an Erlenmeyer. Add 4.0 mL of molybdate reagent and, after a thorough mixing, add 15-17 drops of the stannous chloride reagent (to measure 4.0 mL, is it better to use a 1 mL piston pipet 4 times or to use a mohr pipet?). Start timing and mix well. Set the spectrophotometer at 690 nm and blank it (set to 0.00 absorbance) with Milli-Q to which all reagents have been added. Exactly ten minutes after adding the stannous chloride solution, measure the absorbance reading for the sample. Construct a calibration curve by plotting absorbance against the PO4
3- concentration of the standards. It is very important that your timing be consistent for all of your standards and your sample. 2. Sample
Pipet 100.0 mL of aquarium water into an Erlenmeyer flask. Add the reagents and carry out the spectrometry as above. During weeks two and three of your rotation, repeat one of the standards as well as your aquarium water sample. Using Beer's law, determine the PO4
3- concentration of the sample from the standard curve.
WASTE:
PHOSPHATES Excess Reagents: Ammonium Molybdate Reagent Chemical
Concentration Volume Waste Location
(NH4)6Mo7O24 2.5% in 5 M H2SO4 Amount Disposed Neutralize with baking soda, then pour down the drain
Stannous Chloride Solution: Chemical
Concentration Volume Waste Location
SnCl2•2H2O 2.5% in 20 mL glycerol Amount Disposed AQUEOUS
Stock Phosphate Solution: Chemical
Concentration Volume Waste Location
Phosphate 50 ppm Amount Disposed AQUEOUS
Phosphate 19 ppm and less Amount Disposed DRAIN
Reaction Mixture:

19
Chemical Concentration Volume per ONE TEST
Waste Location
(NH4)6Mo7O24 2.5% in 5 M H2SO4
4 mL
SnCl2•2H2O 2.5% in glycerol 1 mL Neutralize with baking soda, then pour down the drain
Sulfate Determination Chemistry In the presence of hydrochloric acid (HCl) and barium chloride (BaCl2), sulfate (SO4
2-) precipitates to form barium sulfate (BaSO4):
SO42- (aq) + Ba2+ (aq) BaSO4 (s)
This process is carried out near the boiling point of water and "digested" by heating to create large particles of BaSO4. The solution is filtered and the precipitate is rinsed with water to rid the precipitate of chloride ions. (Chloride has the tendency to react with barium and reform BaCl2. Therefore residual chloride must be removed from the precipitate to give an accurate determination of sulfate in the seawater. Silver ions are used to test for chloride ions in the filtrate.) Once all of the chloride ions are flushed out, the precipitate is dried and weighed and used to calculate the amount of sulfate in the water.

20
Reagents Barium chloride solution: dissolve 2 g of BaCl2•2H2O in 20 mL of Milli-Q water. Filter through filter paper before use. Store in a small bottle. Silver nitrate-nitric acid solution: dissolve 0.85 g AgNO3 and 0.5 mL of concentrated HNO3 in 50 mL of Milli-Q water. Wear gloves when working with any silver solution. The silver ion is photoactive. Any silver that gets on your hands will turn brown when exposed to sunlight. This is harmless, but unsightly. Procedure Draw 20.0 mL of water from the aquarium. Adjust the pH to 4.5-5 with 0.5 M HCl and then add an additional 2 mL of 0.5 M HCl. Heat this solution to just below boiling while warming the barium chloride solution. While stirring the sample on the hotplate, add (dropwise) warm barium chloride solution to your warm sample. A white precipitate of BaSO4 will form. Add barium chloride until no additional precipitate forms, then add 2 mL more. Rinse the walls of the beaker with Milli-Q water and cover with a watch glass.
Warm on a hot plate for 30 minutes. You don't want the solution to boil, so keep the hot plate set on low and remove the solution from the hot plate if it gets too hot. After 30 min, remove from heat and let the precipitate settle. (During this time you can mass the fritted funnel and warm some Milli-Q water.)
Collect the precipitate in a fritted glass funnel using vacuum filtration. Wash the precipitate with several small portions (5-10 mL each) of hot Milli-Q water. Stop the vacuum and empty your filter flask into the Ba/Ag waste. Reassemble your filtration setup with a clean filter flask.
We use the simple precipitation reaction shown below to test for chloride. When silver ions are added to a solution with chloride ions, silver chloride immediately forms as a white cloud.
Ag+ (aq) + Cl- (aq) AgCl (s)
Use a clean filter flask to collect the filtrate. A few mL of filtrate are transferred to a small test tube with a Pasteur pipet and tested by adding 1-3 drops of silver nitrate. If the solution is cloudy, chloride is still present. The precipitate should be washed 2-3 times with small amounts of warm Milli-Q water. The filter flask is then rinsed out and the operation repeated. If the solution does not turn cloudy, you can proceed with the drying operation.
Place the fritted funnel containing your sample in a small beaker, label it with your name and lab section, and place it in the oven to dry (at least overnight).
Let the dried sample cool, then mass the funnel + barium sulfate. The mass of barium sulfate can be related to the concentration of sulfate in the original water sample through simple stoichiometry calculations.
To clean the fritted funnel, use a small spatula or rubber policeman to gently scrape the white precipitate out into the solid waste container. The fritted glass funnel is fragile, so be careful! Return the funnel to the stockroom.
21
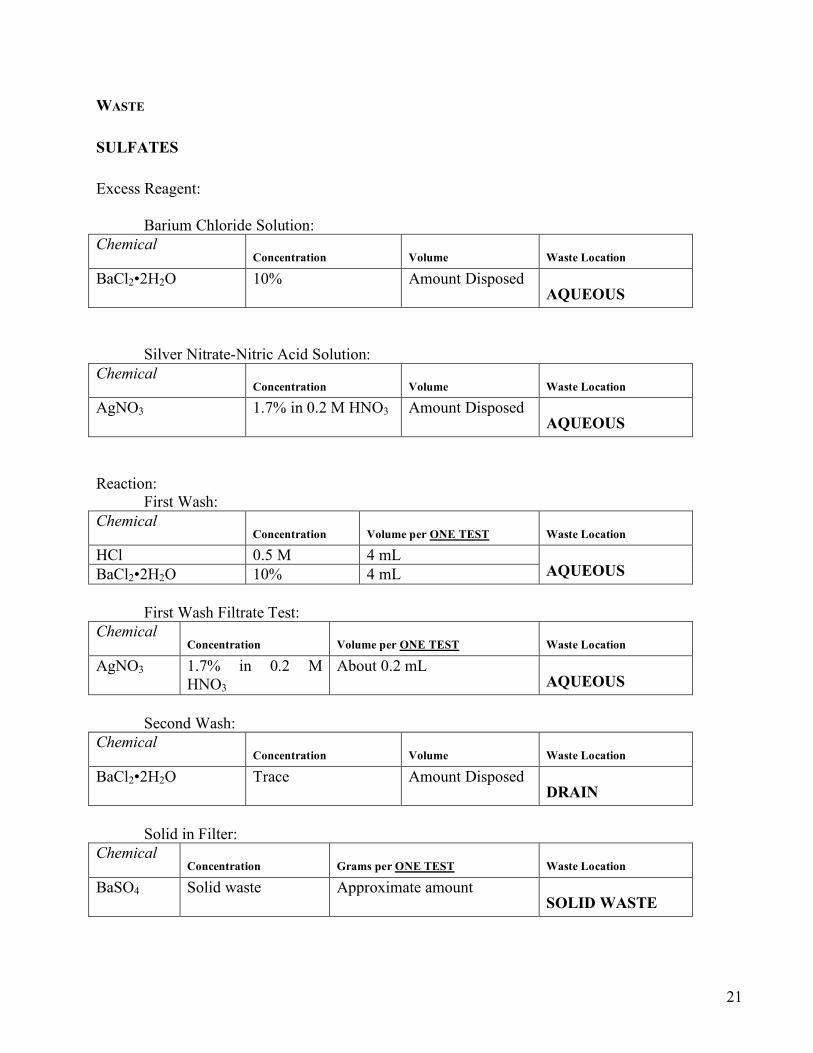
WASTE
SULFATES Excess Reagent: Barium Chloride Solution: Chemical
Concentration Volume Waste Location
BaCl2•2H2O 10% Amount Disposed AQUEOUS
Silver Nitrate-Nitric Acid Solution: Chemical
Concentration Volume Waste Location
AgNO3 1.7% in 0.2 M HNO3 Amount Disposed AQUEOUS
Reaction: First Wash: Chemical
Concentration Volume per ONE TEST Waste Location
HCl 0.5 M 4 mL BaCl2•2H2O 10% 4 mL AQUEOUS First Wash Filtrate Test: Chemical
Concentration Volume per ONE TEST Waste Location
AgNO3 1.7% in 0.2 M HNO3
About 0.2 mL AQUEOUS
Second Wash: Chemical
Concentration Volume Waste Location
BaCl2•2H2O Trace Amount Disposed DRAIN
Solid in Filter: Chemical
Concentration Grams per ONE TEST Waste Location
BaSO4 Solid waste Approximate amount SOLID WASTE

22
Calcium and Magnesium Determinations
Chemistry Water hardness is caused by dissolved cations, notably Ca2+ and Mg2+. Most analyses for water hardness assume that all of the cations are calcium. In the case of seawater, most of the hardness is actually magnesium. So we'll have to do two titrations to determine both calcium and magnesium in our aquarium water.
Your titrant for these analyses is EDTA (ethylenediaminetetraacetate). This remarkable ligand uses the two nitrogens and four oxygens to wrap around metal ions. (This process is so effective that "chelate therapy" is often used for metal overdoses and metal poisoning.)
EDTA chelates both Mg2+ and Ca2+, as well as many other metals. In the first titration below, the solution is buffered to keep both the magnesium and calcium ions in solution. You get the total hardness (Ca + Mg) from this titration. For the second titration, the solution is made strongly basic. Under these conditions, all the magnesium ions will react with hydroxide and form a white precipitate of Mg(OH)2.
Mg2+ (aq) + 2OH- (aq) Mg(OH)2 (s)
The calcium remains in solution and is titrated as before. A slightly different indicator is used. The "Calcon" indicator is specific for the Ca2+-EDTA complex.
Reagents 0.0100 M EDTA solution: place 0.931 g of reagent grade EDTA in a 250-mL volumetric flask. Add about 200 mL Milli-Q water and 2-3 mL 6 M NaOH. Shake until all the solid is dissolved, then add more Milli-Q water to the 250.00 mL mark. Store in PET bottles, good for about a month. 1 mL = 400.8 µg Ca.
Ammoniacal buffer: Working in the hood, dissolve 1.69 g NH4Cl in 14.3 mL conc. NH4OH. Dilute to 25.0 mL with Milli-Q water. Store in a tightly capped bottle.
NaOH, 2 M: already prepared
0.1% Eriochrome Black T indicator: This will need to be prepared by the first lab group for use that week. The indicators deteriorate over time so they should be tested in the second week of lab two, preferably with a known standard, before being used. If it fails to show the characteristic color
-O C
O
Rxn
N
C
ORxn
-O
NC
C
ORxn
O-
ORxn
O-
M2+
+
MN
N O
O
O
OC
O
O
O
C
O
2-
EDTA
M2+
-EDTA complex

23
change, throw it out and remake a fresh solution. Dissolve 0.025 g of Erichrome Black T in 0.25 mL of ammonical buffer and dilute to 25 mL with Milli-Q water. Store in a small dropper bottle.
0.1% Calcon indicator : This will need to be prepared by the first lab group for use that week. The indicators deteriorate over time so they should be tested in the second week of lab two, preferably with a known standard, before being used. If it fails to show the characteristic color change, throw it out and remake a fresh solution. Dissolve 0.025 g of the calcon indicator in 25 mL of methanol. Store in a small dropper bottle.
Procedure 1. Total Hardness (Ca + Mg) titration
Obtain a water sample from the aquarium. Pipet 2.00 mL seawater into a 250-mL Erlenmeyer and add approximately 50 mL of Milli-Q water. Add 2 mL of ammoniacal buffer. Add Eriochrome Black T solution indicator until the solution is a light pink (5-6 drops). Titrate with the EDTA solution until the solution changes from pink to light gray -blue (You may need to practice this endpoint). Record the volume used. Repeat two to three times to get at least two consistent readings. Calculate the "total hardness" by multiplying the volume EDTA x 400.8 µg Ca/mL EDTA. Divide by the volume of your water sample to get "total hardness as Ca" in ppm.
2. Calcium-only titration
Pipet a 10.00 mL sample into a 250 mL Erlenmeyer and add 50 mL Milli-Q water. While stirring, add 5 mL of the 2M NaOH. Add 3-5 drops Calcon indicator until the solution is light pink (3-5 drops). Titrate the solution with EDTA until the pink disappears (use a piece of white paper under the flask) and record the volume. Repeat two to three times to get at least two consistent readings.
Calculate the "Ca" by multiplying the volume EDTA x 400.8 µg Ca/mL EDTA. Divide by the 10.00 mL of your water sample to get Ca in ppm.
Calculate the Mg by subtracting the Ca in ppm from total hardness in ppm and multiply by the ratio of atomic masses to determine the concentration of Mg present.
ppm Mg = (ppm total hardness as Ca – ppm Ca) • (24.31 g Mg/40.08 g Ca)

24
WASTE CALCIUM AND MAGNESIUM Excess Reagents EDTA Solution: Chemical
Concentration Volume Waste Location
EDTA 0.01 M in 0.07 M NaOH Amount Disposed Adjust pH to between 5 and 12 with appropriate concentration of acid or base, then pour down the drain
Ammoniacal Buffer: Chemical
Concentration Volume Waste Location
NH4Cl 6.8% in 8.6 M NH4OH
Amount Disposed DRAIN
Eriochrome Black T Indicator: Chemical
Concentration Volume Waste Location
Eriochrome Black T 0.1% in 0.07% NH4Cl
Amount Disposed Adjust pH to between 5 and 12 with appropriate concentration of acid or base, then pour down the drain
Calcon Indicator: Chemical
Concentration Volume Waste Location
Calcon 0.1% in Methanol Amount Disposed ORGANIC
Reaction Mixture: Hardness Test (Calcium + Magnesium): Chemical
Concentration Volume per ONE TEST Waste Location
NH4Cl 6.8% in 8.6 M NH4OH 2 mL Eriochrome Black T
0.1% in 0.07%NH4Cl 0.2 mL
EDTA 0.01M in 0.07 M NaOH
@10 mL (or volume titrated)
DRAIN
Calcium Only Test: Chemical
Concentration Volume per ONE TEST Waste Location
NaOH 2 M 5 mL

25
Calcon 0.1% in Methanol 0.2 mL EDTA 0.01 M in 0.07 M NaOH @10 mL(or volume titrated) DRAIN

26
III. Salinity, Alkalinity, Dissolved Oxygen concentration
Dissolved Oxygen Determination Reactions between oxygen and biotic and abiotic chemicals have large negative Gibb's Free energies (ΔG's). It is hard to chart one all-telling cycle for this essential element. Oxygen represents 21% of the gases in the atmosphere but in the marine environment, its concentration is only 4-8 ppm. Like nitrogen, oxygen can be exchanged between the atmosphere and the seawater at the surface. As you may have guessed, oxygen is essential for many biological processes. Aerobic organisms (like fish, snails and algae) all need a supply of oxygen for respiration, metabolism, and oxidation; thus oxygen concentration can effect the marine environment dramatically. Oxygen concentration depends on many factors; including the salinity of the water, its temperature, and its depth.
Chemistry – Winkler Method
The iodometric determination of dissolved oxygen depends on a color change during a titration. First, a manganese solution is added to the water. The dissolved oxygen (DO) quickly oxidizes Mn2+ to Mn3+.
4 Mn(OH)2 + O2 + 2 H2O 4 Mn(OH)3
Next, iodide (I-) is added and the solution is made acidic. Mn(III) is reduced to Mn(II) while iodide is oxidized to iodine (I2).
4 Mn(OH)3 + 4 I- + 12 H+ 4 Mn2+ + 2 I2 + 12 H2O
The iodine combines with starch to form a dark blue complex. This complex is then titrated with sodium thiosulfate. The thiosulfate converts the iodine back into iodide. Thus, the starch-iodine complex breaks down and the solution turns clear.
2 Starch-I2 + 4 S2O32- 4 I- + 2 S4O6
2- (blue color) (colorless)
The point at which the solution turns from dark blue to clear will tell you how much thiosulfate is used. The volume of thiosulfate is then used to calculate the DO concentration in the water. You will use the stoichiometry of each of the three reactions above to calculate the DO.
Reagents (Use volumetric glassware) MnSO4 solution: make a 2.15 M MnSO4•H2O solution in 10 mL of Milli-Q water. Filter to rid solution of particulates. The solution will be slightly pink in color. Store in a small bottle.
Alkali-iodide-Azide solution: dissolve 5 g of NaOH and 1.3 g NaI in 5 mL of Milli-Q water. Add 0.1 g of NaN3 and dilute to 10 mL. Store in a small bottle.
Starch indicator: prepared for you.
Standard sodium thiosulfate solution: dissolve 0.62 g of Na2S2O3• 5 H2O in Milli-Q water; add 0.12 mL of 6 M NaOH and dilute to 100 mL in a volumetric flask. Store in a tightly capped bottle.

27
Procedure In this lab, we will be using special dissolved oxygen bottles. These bottles are designed to minimize the amount of atmospheric oxygen introduced into a water sample. The bottles can be checked out of the chemistry stockroom. When you are adding reagents, use a pipet and make sure the pipet tip is below the surface of the water so no air bubbles are introduced. (Check out several 1 mL pipets so you’ll have a clean pipet for each reagent.) The bottle will overflow, so you will want to have a large beaker or dish around the DO bottle to catch the drips. Minimize the time the solution is exposed to the atmosphere by planning ahead and having all of your reagents ready to add to the bottle.
To obtain a sample of aquarium water, start a siphon and place the tube in the dissolved oxygen bottle. Let the bottle fill and overflow for a minute. With the bottle absolutely full, place the ground glass stopper in the bottle. The bottle should then have a bead of water sealing the sample water from the atmosphere.
Back at your bench, add 1 mL of the MnSO4 solution and 1 mL of alkali-iodide-azide solution. Stopper tightly and mix by inverting the bottle several times. Let the bottle sit for 2-3 minutes, then add 1.0 mL of concentrated sulfuric acid. Re-stopper the flask and invert many times.
With a large pipet, transfer 200 mL from the dissolved oxygen bottle into a 500-mL Erlenmeyer flask. Add a stir bar and stir slowly with a mechanical stirrer. Add starch solution until the solution turns a deep blue (typically, 3-4 drops). Fill a 25-mL buret with the thiosulfate solution and carefully read the initial volume. Add thiosulfate solution dropwise until the sample turns clear. Record the amount of thiosulfate used.
WASTE: DISSOLVED OXYGEN Excess Reagents: MnSO4 Solution: Chemical
Concentration Volume Waste Location
MnSO4•H2O 2.15 M Amount Disposed DRAIN
Alkali-Iodide-Azide Solution: Chemical
Concentration Volume Waste Location
NaOH 12.5 M NaI 13% NaN3 1%
Amount Disposed AQUEOUS
Standard Sodium Thiosulfate Solution: Chemical
Concentration Volume Waste Location
Na2S2O3•5H2O 0.62% in 0.007 M NaOH Amount Disposed DRAIN

28
Reaction Mixture (includes one test and left over in one D.O. bottle): Chemical
Concentration Volume per ONE TEST Waste Location
MnSO4•H2O 2.15 M 1 mL NaOH 12.5 M NaI 13% NaN3 1%
1 mL
H2SO4 18 M in Starch Solution 1.2 mL Na2S2O3•5H2O 0.62% in 0.007 M
NaOH @6 mL (or volume titrated)
AQUEOUS
Alkalinity Determination Alkalinity is determined as the amount of acid required to neutralize all of the base in one liter of water. The most important bases in seawater are carbonate (CO3
2-) and bicarbonate (HCO3-) ions.
Alkalinity is a measure of the water's ability to buffer itself from the harmful effects of acids in the water. The carbonate and bicarbonate ions in the water act as "banks" which can take up excess acids (CO2 from respiration, organic acids from metabolism and decay) and maintains the pH at about 8.5 for seawater.
Chemistry
For this module, potentiometric titration will be used. In it, an acid will be titrated into a sample of the aquarium water. As long as appreciable amounts of carbonate and bicarbonate are present, the pH will remain around 7.5 to 8.5. When the carbonate and bicarbonate ions are "used up" the pH will change quickly and dramatically. The end point of the titration is reached when the pH reaches 4.0. Thus, the amount of acid used in the titration can be used to calculate the alkalinity of the water. (We are going to assume that all of the "alkalinity" (CO3
2-, HCO3-, OH-, H2PO4
2-, etc.) is actually present just as CO3
2-. By convention, the total alkalinity is reported as ppm CaCO3)
CO32- (aq) + 2 H+ (aq) [H2CO3] (aq) H2O + CO2 (aq)
Reagents Standard hydrochloric acid solution (0.1 M HCl). To make it, dilute 2.1 mL (measure with a pipet) of concentrated HCl to 250 mL (volumetric flask) with Milli-Q water.
Procedure First, set the pH meter to 7.00 (neutral) with a standard pH 7 buffer. Draw off a sample of aquarium water, and carefully pipet 200 mL into a large Erlenmeyer flask. Record its pH. Fill a buret with the standard acid solution and titrate, with the electrode in the water, until the pH reaches 4. Record the volume titrant added and the pH for several data points during the titration. Record the amount of acid used. Use the stoichiometry of the titration to determine the total alkalinity (expressed as ppm CaCO3) in the aquarium water. Repeat to get 2-3 consistent readings.

29
WASTE:
ALKALINITY Excess Reagent: Standard Hydrochloric Acid Solution: Chemical
Concentration Volume Waste Location
HCl 0.1 M Amount Disposed Neutralize with baking soda, then pour down the drain
Reaction Mixture: Chemical
Concentration Volume per ONE TEST Waste Location
HCl 0.1 M @ 4 mL (or volume titrated) Neutralize with baking soda, then pour down the drain
Salinity/Chloride Determination
Salinity refers to the amount of dissolved solids in water. In seawater, about 98-99% of these solids are salts. Of the anions, chloride makes up the highest percentage, 55%, an approximate concentration of 19000 ppm, 19.0 parts per thousand. The salinity of the sea is essentially constant due to the continual leaching of salts from rocks and soil. Changes in salinity of the sea can stress organisms; thus, a stable salinity is needed for ocean organisms. To determine the concentration of chloride, we will do a titration with the Ag+ solution.
Chemistry By titrating with a silver nitrate solution (AgNO3), chloride will precipitate from the solution as silver chloride:
Ag+ (aq) + Cl- (aq) AgCl (s) white solid
Once all of the chloride has precipitated, the silver nitrate will start to react with the potassium chromate and form the orange precipitate silver chromate:
2 Ag+ (aq) + CrO42- (aq) Ag2CrO4 (s)
red solid
The silver chromate (orange) will only persist when all of the silver chloride has been precipitated. Thus, we will know when the endpoint of the titration occurs because the solution will turn red, indicating that all of the chloride is out of solution. With the volume of silver nitrate used to precipitate all of the chloride, one can determine the concentration of chloride (salinity) of the original water.

30
Reagents
Potassium chromate indicator solution: dissolve 0.5 g K2CrO4 in 10 mL of Milli-Q water. Store in an indicator bottle.
Silver nitrate titrant: dissolve 1.20 g of AgNO3 in 500 mL of Milli-Q water (use the analytical balance and a volumetric flask). Store in a brown bottle to prevent photoreduction. This solution is 1524 ppm Ag+, 0.0141 M Ag+
Procedure
Draw off a sample of aquarium water. Pipet a small sample (between 1.00 and 2.00 mL, you can see what volume works best for you) into a 125 mL Erlenmeyer flask. Add 10 mL Milli-Q water. Add 1.0 mL (20 drops) of potassium chromate indicator to the water. Place on a magnetic stirrer and stir slowly. Pre-rinse a 50 mL buret with about 5 mL of silver nitrate solution. Dispose in aqueous waste. Fill the buret with the silver nitrate solution. Titrate with the silver nitrate (dropwise) until an orangish-red endpoint is observed. The initial solution will be yellow; the end point is orange. Record the amount of silver nitrate used. Repeat the titration to get at least two runs that give consistent results (try to be consistent about the color of the solution at the endpoint). Report your result in ppm chloride.
WASTE:
SALINITY/CHLORIDE DETERMINATION Excess Reagents: Potassium Chromate Indicator Solution: Chemical
Concentration Volume Waste Location
K2CrO4 5% Amount Disposed AQUEOUS
Silver Nitrate Titrant: Chemical
Concentration Volume Waste Location
AgNO3 0.014 M Amount Disposed AQUEOUS
Reaction Mixture: Chemical
Concentration Volume per ONE TEST Waste Location
K2CrO4 5% 1 mL AgNO3 0.014 M @ 40 mL (or volume titrated) AQUEOUS

31
General Technical Comments Units of Concentration Molarity (moles per liter) is commonly used for a unit of concentration. But molarity is not that useful for the low concentrations of ions present in seawater. A more useful concentration unit is parts per million (ppm).
Parts per million is a weight/weight ratio. A concentration of 1 ppm is 1 g/106 g or 1 mg/1000 g. A convenient approximation is mg solute/1 L solution. This is a good approximation as long as the density of the solution is very close to the density of pure water. Conversions use the molar mass of the molecule or ion. For example, a solution that is 0.00046 M acetic acid (or 0.46 mM) can be converted to ppm using the following strategy:
0.00046 mol
1 L solution!
60.05 g
mol!
1000 mg
g=
27.6 mg
L solution= 27.6 ppm acetic acid
Occasionally you might need to consider the formula of a salt. For example, what is the ppm NO3- in
0.0012 M Ca(NO3)2?
0.0012 mole Ca(NO3)2
L solution!
2 mol NO3"
mol Ca(NO3 )2
!62.01 g
mol NO3"!
1000 mg
g=
149 mg NO3"
L= 149 ppm nitrate
Dilutions To calculate dilutions, use the following
dilution formula : c1V1 = c2V2, or c2 =c1V1
V2
For example, what is the concentration of a solution made by diluting 5.0 mL of 87.3-ppm Cl- to a total volume of 25 mL?
c2 =87.3 ppm ! 5.00 mL
25.0 mL= 17.5 ppm Cl
"
Sample dilution problem: You need to make up a 2.5 ppm phosphate standard using a stock standard of 50 ppm phosphate. Let’s say you use a 100-mL volumetric flask to make up your standard. Explain how this is done and show all calculations.
Colorimetric Techniques (Beer’s Law Plots) Several of these analyses use a colorimetric analysis. Often these involve making a colored derivative and using a spectrometer (like a Spec-20) to measure the intensity of the color. Most compounds obey Beer’s Law:
A = εbc
where A is the absorbance, b is the path length (cm) and ε (the Greek letter epsilon) is the extinction coefficient (in ppm-1cm-1). The concentration (c) will be in units of ppm. Simply put, since b and ε
32
are constants, the intensity of the color (absorbance) is proportional to the concentration of the analyte.
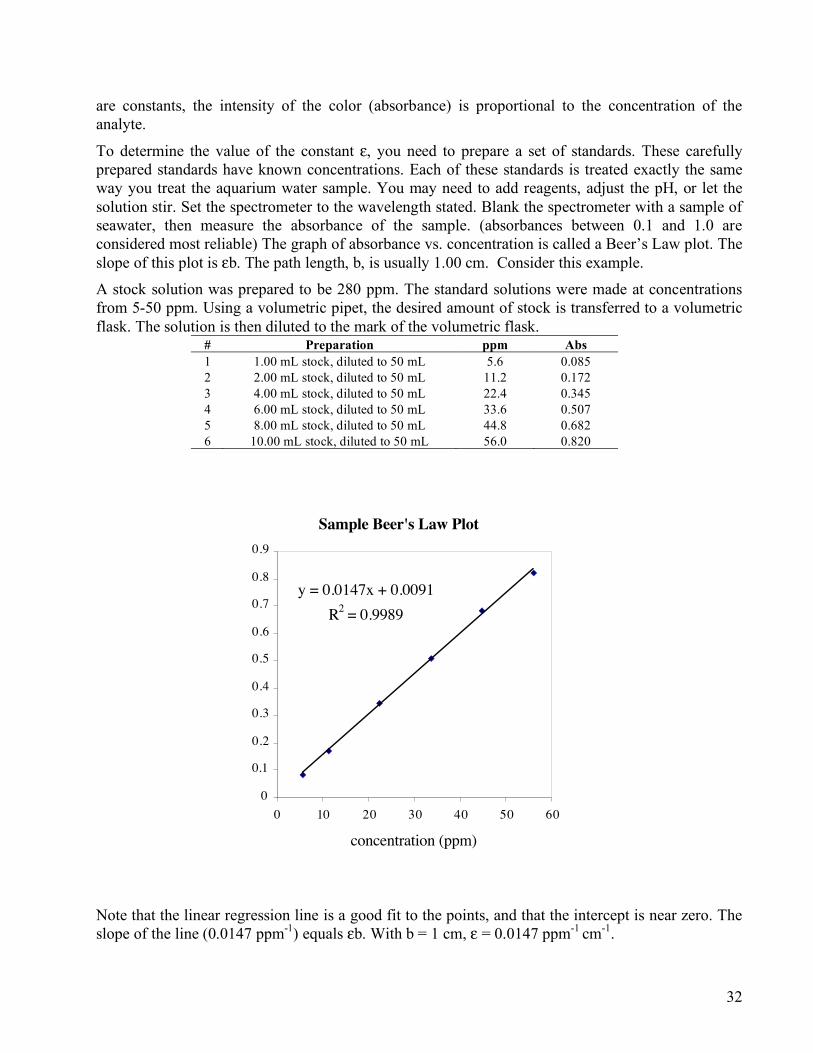
To determine the value of the constant ε, you need to prepare a set of standards. These carefully prepared standards have known concentrations. Each of these standards is treated exactly the same way you treat the aquarium water sample. You may need to add reagents, adjust the pH, or let the solution stir. Set the spectrometer to the wavelength stated. Blank the spectrometer with a sample of seawater, then measure the absorbance of the sample. (absorbances between 0.1 and 1.0 are considered most reliable) The graph of absorbance vs. concentration is called a Beer’s Law plot. The slope of this plot is εb. The path length, b, is usually 1.00 cm. Consider this example.
A stock solution was prepared to be 280 ppm. The standard solutions were made at concentrations from 5-50 ppm. Using a volumetric pipet, the desired amount of stock is transferred to a volumetric flask. The solution is then diluted to the mark of the volumetric flask.
# Preparation ppm Abs 1 1.00 mL stock, diluted to 50 mL 5.6 0.085 2 2.00 mL stock, diluted to 50 mL 11.2 0.172 3 4.00 mL stock, diluted to 50 mL 22.4 0.345 4 6.00 mL stock, diluted to 50 mL 33.6 0.507 5 8.00 mL stock, diluted to 50 mL 44.8 0.682 6 10.00 mL stock, diluted to 50 mL 56.0 0.820
Sample Beer's Law Plot
y = 0.0147x + 0.0091R2 = 0.9989
0
0.1
0.2
0.3
0.4
0.5
0.6
0.7
0.8
0.9
0 10 20 30 40 50 60
concentration (ppm)
Note that the linear regression line is a good fit to the points, and that the intercept is near zero. The slope of the line (0.0147 ppm-1) equals εb. With b = 1 cm, ε = 0.0147 ppm-1 cm-1.

33
Use the standard Beer’s Law plot to determine the concentration for any absorbance in this range. So if the absorbance of the seawater sample is 0.426, the calculated concentration is
C = (0.426 - 0.0091 ppm)/0.0147 ppm= 28.4 ppm
Titrations Titrations are a general technique for determining the concentration of a sample. Success with a titration depends on meticulous technique and care. Keep in mind that even the best lab results need to be interpreted correctly. You may find it easiest to do a quick titration just to get a rough estimate of how the titration will proceed.
Preparing the buret • Checkout a clean buret. (Burets are expensive. Handle them with care.)
• Check to make sure the stopcock is seated tightly. Close the stopcock.
• Rinse the walls of the buret with a small amount of the titrant. Discard this in a waste beaker.
• Place the buret into a sable buret clamp. You may need to add a paper shim so the clamp holds the buret tightly.
• Using a funnel, fill up the buret with the titrant. Open the stopcock and let several milliliters of the titrant drain out of the buret into a waste beaker. Examine the tip carefully to make sure that any bubbles have been expelled.
• Refill the buret, if necessary. The initial volume should be somewhere near 0.00, but it doesn’t have to be exactly on zero. Write the initial volume in your lab notebook.
Preparing the Analyte Solution (Unknown) • Pipet a known amount of your analyte solution into an Erlenmeyer flask. The flask must be
rigorously clean. As a general rule, choose an Erlenmeyer flask that will be no more than half-full after the titration.
• Add a stir bar (if you are using a mechanical stir plate). A piece of white paper under the flask may help you see a faint color change at the end point.
• Add the indicator and begin stirring slowly on the stir plate. You don’t want to spatter solution outside the flask.
• Place the analyte flask under the buret tip so the drops of titrant fall directly into the solution.
Titrating • Double-check the initial volume. Make sure this is written in your lab notebook. • Begin adding the titrant. It helps if you know approximately the volume required to reach
the endpoint (See below). If you estimate your required volume to be 20 mL, you can add the titrant quite quickly at first, then slow down as the estimated volume is approached. In this example, I’d add the first 15 mL quickly, then next 3-4 mL several drops at a time, and the last 1-2 mL dropwise.
• As you near the endpoint, rinse the sides of the flask with a small amount of Milli-Q water. This should wash down any titrant or analyte that may have splashed up.

34
• With many indicators, there will be a color change near where the titrant drops are entering the solution. This usually indicates that the endpoint is approaching. As you get very close, you may see a color change that then fades. Your endpoint occurs when the color change is permanent (lasts for at least a minute before fading).
• If in doubt about an endpoint, take a volume reading. Write it in your notebook. Then add another drop. Decide which is the better endpoint, then write your final volume in your notebook.
Strategy
• Usually you want three to four good titrations in an analysis. Calculate the result for each run individually, then average the results.
• As mentioned above, your titrations will go faster if you know approximately the volume required. It often helps to do a “quick and dirty” run as your first titration. No attempt is made to reach a perfect endpoint. You just want a rough idea of the required volume. Label this run in your notebook and don’t include it in your averages.
• See the examples at the end of the manual for more help with titrations. Waste Handling Bates College Department of Chemistry has recently implemented new waste handling policies designed to bring us into full compliance with all EPA and OSHA guidelines. It is essential that these policies are followed. If you have any questions about them, please ask. This manual has been written to guide you through all proper disposal procedures. Below are a few additional comments. All hazardous waste must be stored in appropriate, sealed containers. Each container must be labeled with the words “Hazardous waste” and must be stored in a secondary waste containment vessel. Because much of the hazardous wastes we generate are volatile, waste accumulation areas are located in the fume hoods in each research and teaching lab. Generally, hazardous waste is separated into three types. These are: organic halogenated waste (any organic waste with any halogenated solvent. If you generate waste that has both methylene chloride and hexanes, for example, it must be placed in this container); organic non-halogenated waste; aqueous waste. Incompatible wastes such as strong acids and bases or strong oxidizing and reducing agents may not be stored together. Please ask if you have any questions about whether two wastes are incompatible or not. A record must be kept of everything that is placed in the hazardous waste container. These logs must be quite specific as to what is being placed in the container. Simply saying “aqueous waste” is not sufficient. Here are a couple of common violations to be aware of. Liquid wastes must be kept capped. The fines for failure to cap wastes are quite high so remember to put the top back on the waste container after you use it. Liquid wastes need to be in the primary waste container and not spilled into the secondary container. Records need to be well maintained. Secondary containment needs to be in place at all times. Acetone is considered a hazardous waste and must be disposed of in hazardous waste containers.

35
Use of Adjustable Pipettes (guidelines modified from Professor Lawson, CHEM 321 lab manual) Adjustable pipets are ideal for repetitively pipetting small volumes. They are generally less accurate than a high quality glass syringe, but they deliver small volumes with great reliability (if they are properly handled and maintained). On the surface there may not appear to be any tricks for successful pipetting. In this laboratory, three commonly employed sizes, as determined by volume range, are available to you: 0 to 20 microliter (P-20), 20 to 200 microliter (P-200), and 200 to 1000 microliter (P-1000). These pipettes are used with disposable plastic tips. Each pipette should only be used to pipette the volumes that exist in the range for which they are calibrated. The volume to be pipetted is set by adjusting the dial in the handle of each pipette. To insure reproducibility, the desired volume setting should be approached by dialing down to the setting rather than dialing up. The last number in the P-20 setting is red and represents tenths of a microliter. The last number in the P-200 setting represents single microliter. The last number in the P-1000 setting represents ten microliter units. The first number in the P-1000 setting is red and represents milliliter units. The plunger of each adjustable pipette is thumb operated and has two positions that can be felt as the plunger is depressed. The first position is used to draw the set volume of liquid into the pipette tip. Depressing the plunger all the way to the second position forces the liquid out of the tip with a slug of air. The used pipette tip can be ejected with the ejector button, which is also present in the handle. The procedure for accurate pipetting is as follows. A tip is placed on the pipette by inserting the end of the pipette firmly into the tip. The plunger is then depressed to the first position, and the tip is inserted into the liquid to be transferred. The plunger is then released with a smooth, even motion to draw the liquid up into the tip. For non-viscous aqueous solutions or solutions which do not contain protein, lipids, or detergents, the liquid should be forced back out of the tip (back into the stock liquid) by depressing the plunger to the second position while holding the tip against the wall of the container. This procedure wets the inside of the tip. (Note: viscous solutions or solutions containing the molecules mentioned above should not be pipetted with a wetted pipette tip.) The plunger is then again depressed to the first position, the tip inserted into the liquid, and the solution is drawn back into the tip. The tip is then placed in the tube or container into which the liquid is to be transferred. It is best to place the tip near the bottom of the container, against a wall. The contents of the tip can then be smoothly ejected down the wall of the container. The used tip should then be disposed of. A fresh tip should be used for each pipetting operation. This prevents cross-contamination of the stock solutions and the individual sample solutions. The only time it is allowable to reuse a tip is when the same aqueous, non-viscous solution is being transferred to clean, dry tubes or containers. This may seem wasteful, but it is actually much more economical than having to repeat entire experiments because of cross-contamination.

36
Solving Quadratic (and Cubic) Equations In the next several weeks, we will often have to solve mathematical problems like this
There are two major strategies for solving problems like this. a. Use the quadratic formula b. Use the method of successive approximations
Quadratic Formula- this method is exact and mathematically rigorous. The algebra is straightforward, although it is easy to make a careless mistake. Always check your answers when you are done! First you rearrange your problem so that it is in the form
ax2 + bx + c = 0 Then you apply the quadratic formula
Notice that the quadratic formula will always give you two "roots"—two values of x. In our chemistry problems, one of these roots will be clearly spurious and not make any sense in the context of the problem. For example, you can't have a negative concentration, or a concentration of 20000 M! Let's solve the problem above using the quadratic formula.
And check the results to make sure they are correct. Approximation- this method is not exact, but it is often "good enough" for chemistry problems. We will usually be assuming that the value of x is small. First you guess at a value for x (often relative to some constant), then solve for x. Once you get a value, you have to check your assumptions. You may have to repeat this approximation (successive approximations) until you get a value for x consistent with your approximation.
x =!b ± b
2! 4ac
2a
4x2
0.20 ! x= 3.6 •10
!8
4x2
0.20 ! x= 3.6 •10
!8
4x 2 = 3.6 •10!8 0.20 ! x( )
4x2= 7.2 •10
!9! 3.6 •10
!8x
4x2+ 3.6 •10
!8x ! 7.2 •10
!9= 0 a = 4, b = 3.6 •10
!8,c = 7.2 •10
!9
x =!3.6 •10
!8± 3.6 •10
!8( )2
! 4 4( ) 7.2 •10!9( )
2(4)
x =!3.6 •10
!8± 3.39 •10
!4
8
x = 4.24 •10!5 or x = !4.24 •10!5

37
For this example, our first approximation worked, so we are done. Solve the following quadratics (use either method, or both!)
4x2
0.20 ! x= 3.6 •10
!8 first approximation : x is much smaller than 0.20. So 0.20 - x " 0.20
4x2
0.20= 3.6 •10!8
x2 =
3.6 •10!8 0.20( )
4
x = 1.8 •10!9
x = 4.24 •10!5 Check the approximation : 0.20 - 0.0000424 " 0.20 (yes!)
x2
0.10 ! x= 4.9 •10!10
x2
0.050 ! x= 3.5•10!4
Just for kicks, let' s try a cubic equation as well (use approximation method)
x 0.10 + 2x( )2= 7.4 •10
!11

38
Sample Titration Calculations A titration calculation is one example of a stoichiometry calculation. Instead of grams and molar masses, we have volumes and molarities.
a. Jill titrated an HCL solution (unknown concentration) with NaOH. It took 14.73 mL of a 0.107 M NaOH solution to titrate a 15.00 mL sample. What is the concentration of HCl?
b. Suppose Nate was titrating a sample of H3PO4 with the same NaOH solution. In his case, it took 42.07 mL of 0.107 M NaOH to titrate 15.00 mL of H3PO4. What is the concentration of H3PO4?
H3PO4 + 3 NaOH → 3 H2O + Na3PO4 (note the 1:3 stoichiometry.)
c. You are titrating a sample of acetic acid (HCH3CO2, a monoprotic acid). It takes you 12.88 mL of 0.107 M NaOH to titrate 15.00 mL of your sample. What is the concentration of acid?
d. Janice is doing a salinity titration for Cl-. The balanced equation is shown below. It took
23.66 mL of 500 ppm Ag+ to titrate a 10.00 mL sample. What is the concentration of Cl- in the solution in M and ppm?
Ag+ + Cl- → AgCl(s)
Parts per million is a weight ratio, not a mole ratio. To correctly calculate the concentration, we have to convert the ppm Ag+ to mole Ag+/L, do the titration calculation, and then convert back. We cannot simply use ppm! e. You are doing another salinity titration with the same Ag+ reagent. It took 14.72 mL of 500 ppm Ag+ to titrate a 10.00 mL sample. What is the concentration of Cl- (M and ppm) in your sample?