charts on 1st quarter 2014/15 - thyssenkrupp
TRANSCRIPT

Developing the future.
Charts on 1st Quarter 2014/15February 13, 2015
Dr. Heinrich Hiesinger, CEOGuido Kerkhoff, CFO

Developing the future.
Charts on 1st Quarter 2014/15February 13, 2015
1
NFD yoy down by ~€400 m; qoq up by ~€500 m due to aperiodic NWC items
Solid order intake with book-to-bill >1
CapGoods BAs ex IS increased yoy
• ET - new record
• IS - increase yoy ex MS big ticket (in Q1 13/14)
Materials decreased slightly qoq (production constraints, declining prices, strike at AST)
High order backlog with €18 bn at ET and IS secures solid basis for profitable growth
Significant increase in EBIT adj. yoy
All BAs* with improvements yoy:
• ET - 9 seq. quarters with earnings & margins up yoy
• SE - significantly increased earnings & margins
• AM - improved to break-even
~30% of targeted FY cost savings in Q1
SWF with Further Progress – All Targets for Q1 Achieved
*MX ex VDM/AST
2011/12 2012/13 2013/14 2014/15
€245 m
€317 m
+29%
SWF
Q1
FY Guidance: EBIT adj. at least €1.5 bn;
FCF bef. divest at least break-evenconfirmed
now incl. proportionate consolidation HKM

Developing the future.
Charts on 1st Quarter 2014/15February 13, 2015
2
40
50
60
70
80
90
100
110
Jun-14 Jul-14 Aug-14 Sep-14 Oct-14 Nov-14 Dec-14 Jan-15
EUR
BRL
RUB
CNY
CHF
Considerations on Recent F/X and Oil Price Movements
Sustainability, Duration and Intensity Not Yet Reliably Predictable
Source: F/X rates ThyssenKrupp internal database;Oil, average of UK Brent, Dubai and WTI
F/X rate developments vs USD (indexed Jun 30, 2014);
Oil price development (in $/barrel)
Net positive translation effect on TKA
Increased competitiveness of
• TKA’s export-oriented businesses
• Most important customer groups
Steel-imports from Russia have to be monitored; however weak EUR makes imports from other countries less attractive
Sales exposure to Russia <<1%
Low energy prices and interest rates should stimulate private consumption and investment decisions
Oil

Developing the future.
Charts on 1st Quarter 2014/15February 13, 2015
3
Higher sales with slightly increased earnings by ramp-up new plants and efficiency/restructuring
CT
Higher sales with increased earnings & margin improvement by 0.5-0.7%-pts from efficiency/restructuring
ET
Higher sales with slightly increased earnings and stable margin at 6-7%**
IS
MX
Significant increase in earnings by BiC Reloaded: differentiation & efficiency
SE
Significant improvement towards EBIT break-even driven by continued ramp-up
AM
Slight cost increase due to IT projects and efficiency programs
Corp.
** excl. notional interest credit from net prepayment surplus Net Income/Loss (Full Group)
12/13 14/15E
€195 m
13/14
EBIT adj.
12/13 14/15E
€1.3 bn
13/14
FCF before divest(Full Group)
12/13 14/15E
€(356) m
13/14
* adjusted for F/X and portfolio changes
Slightly increased earnings by efficiency/ restructuring and marketing initiatives
FY 2014/15E: EBIT adj. at least €1.5 bn, Sales Growing at 1-Digit % Rate*
12/13 13/14 14/15E
~0.6
~0.85
>1.0
∑~2.5
(€bn)
14/15E?
14/15E?
Order Backlog
Growth / Markets
at least€1.5 bn
at least break-even
furtherimprovement

Developing the future.
Charts on 1st Quarter 2014/15February 13, 2015
4
10,094
Solid Order Intake in Still Challenging Environment
10,661
Group cont. ops.
Order intake – continuing operations (million €)
1,439 1,534 1,621
1,801 1,745 1,868
2,2951,214 1,075
2,8423,726 3,546
2,272
2,034 2,095
609
620 475
• CT: recovery of auto markets and wind industry continues
• ET: again record order intake mainly driven by NI in Asia and North America
• IS: yoy up ex big ticket Marine Systems
• MX: qoq seasonality and strike at AST
• SE: qoq lower prices and production constraints
• AM: qoq lower prices and converter repair
Q12014/15
Q12013/14
Q42013/14
Book-to-bill:>1.0
IndustrialSolutions
SteelAmericas
ElevatorTechn.
Comp Techn.
MaterialsServices
SteelEurope
-5%yoy
-10%*
* adjusted for F/X and portfolio changes
-2%qoq
big ticket order
10,352
~€1.2 bn
now incl. proportionate consolidation HKM

Developing the future.
Charts on 1st Quarter 2014/15February 13, 2015
5
10,044
Capital Goods Driving Organic Growth
9,088
Group cont. ops.
Sales – continuing operations (million €)
1,428 1,586 1,597
1,5441,783 1,712
1,288
1,8051,377
2,7393,821 3,421
2,066
2,1581,985
538
546
502
• CT: +8%* yoyrecovery of auto markets and wind industry continues
• ET: +7%* yoystrong sales driven by NI in China and North America
• IS: +8%* yoystrong sales confirming sustaining growth strategy
• Materials: qoq weaker volumes (strike at AST, seasonality, production constraints)
Q12014/15
Q12013/14
Q42013/14
IndustrialSolutions
SteelAmericas
ElevatorTechn.
Comp Techn.
MaterialsServices
SteelEurope
+11%yoy
+5%*
* adjusted for F/X and portfolio changes
-10%qoq
11,135
now incl. proportionate consolidation HKM
Developing the future.
Charts on 1st Quarter 2014/15February 13, 2015
6
Q4
SteelEurope
MaterialsServices
ElevatorTechn.
Comp.Techn.
EBIT adjusted (million €); EBIT adjusted margin (%)*
SteelAmericas(excl. D&A for TK Steel USA
until Q2 13/14)
IndustrialSolutions
Q1
67
Q3 Q1
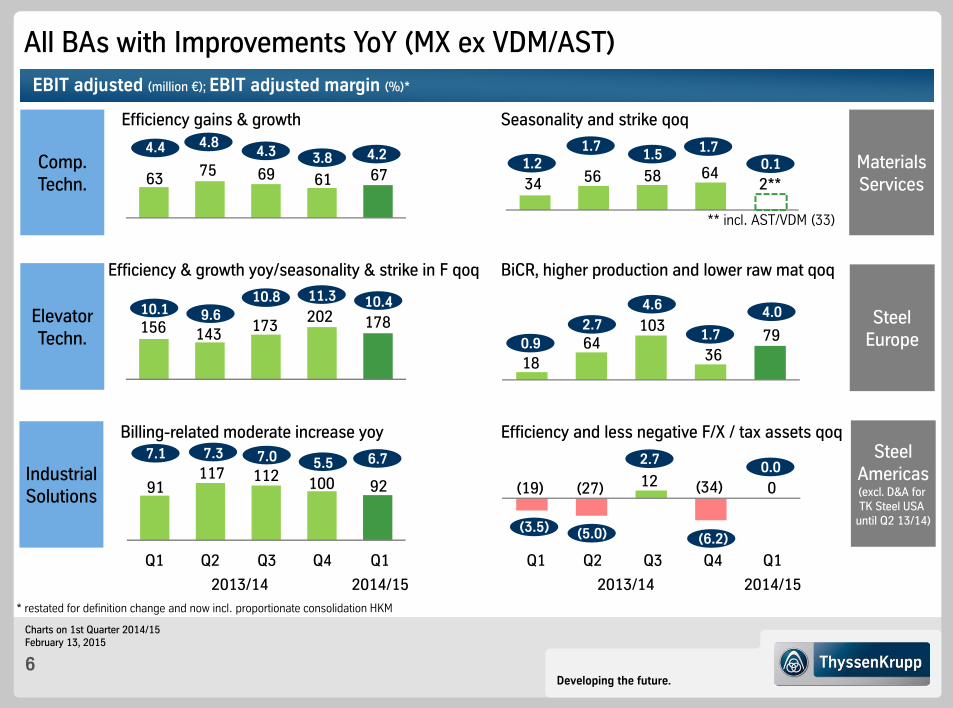
All BAs with Improvements YoY (MX ex VDM/AST)
Seasonality and strike qoq
BiCR, higher production and lower raw mat qoq
Efficiency and less negative F/X / tax assets qoq
Efficiency gains & growth
Efficiency & growth yoy/seasonality & strike in F qoq
Billing-related moderate increase yoy
** incl. AST/VDM (33)
4.2
63
4.4
17810.4
156
92
6.7
91
2**0.1
34
79
4.0
18
0(19)0.0
75 69 61
143 173202
117 112 100
56 58 64
64103
36
4.84.3 3.8
9.610.8 11.3
7.3 7.0 5.5
1.71.5 1.7
2.74.6
1.7
(5.0)
2.7
(6.2)
(27) 12 (34)
Q2
2013/14 2014/15
10.1
7.1
1.2
0.9
(3.5)
Q4 Q1 Q3 Q1 Q2
2013/14 2014/15* restated for definition change and now incl. proportionate consolidation HKM

Developing the future.
Charts on 1st Quarter 2014/15February 13, 2015
7
Net income reconciliation Q1 2014/15 (million €)
Positive Start Bottom-Line into the New Fiscal Year
EBIT adj.cont. ops.
317285
Incomecont. ops.
47(104)
Taxes
Special items
(32)(134)
Financial line
EBIT rep.cont. ops.
Net income
mainly:
• MX: restructuring- and disposal-related €(16) m
• AM: freight contract valuation €(11) m
thereof:ThyssenKrupp AG’s stockholders: €54 m
EPS* 0.10 €/sh
* attributable to ThyssenKrupp AG‘s stockholders
Net Income/Loss (Full Group)
12/13 14/15E
€195 m
13/14
furtherimprovement
43
EPS* €0.09/sh
thereof:ThyssenKrupp AG’s stockholders: €50 m
• High tax rate explained by country mix and not capitalizing tax loss carry forwards (e.g. CSA)
• Full year tax rate estimated at more normalized but still elevated level of ~50%

Developing the future.
Charts on 1st Quarter 2014/15February 13, 2015
8
DivestmentsNFD
Dec 2014
110
Capex
Q1 2014/15 – full group (million €)
Capex for property, plant & equipment, financial & intangible assets & financial investments
OCF
(386)
(265)
Gearing144.9%
FCF before divest (651)
FCF (541)
(4,212)*
NFDSep 2014
(3,677)
Gearing114.9% Expected aperiodic NWC items:
• CT: higher inventory due to major repair
• IS: billing-related payment deferrals
• MX: major new contract for VDM and strike at AST
• SE: normalization of inventories after BF#2 reline
Aperiodic and Accounting Effects Impacting Gearing TemporarilyFCF before divest
12/13 14/15E
€(356) m
13/14
at least break-even
FCF before divest(Full Group)
Temporary/accounting impact:
• Neg. FCF in Q1 <<0; FYE at least b/e
• Non-cash expansion of pension book value
due to decline in discount rate to 2.1% (from 2.6%, Germany)
* incl. €6 m others
now incl. proportionate consolidation HKM

Developing the future.
Charts on 1st Quarter 2014/15February 13, 2015
9
Outlook Q2
Q2 14/15E
€306 m
Q2 13/14
EBIT adj.
yoy/qoqimprovement
€(653) m
FCF before divest*
Low 3-digit €m negative(incl. ~€200 m interest payments)
€317 m
Q1 14/15
Q2 14/15E
Q2 13/14
Q1 14/15
€(651) m
Q1
SteelEurope
MaterialsServices
Industrial Solutions
ComponentsTechnology
Q2E
EBIT adjusted (million €); EBIT adjusted margin (%)
ElevatorTechnology
674.2
17810.4
20.1
79
4.0
926.7
yoyup
SteelAmericas
0
Q2
75
4.8
143
9.6
117
7.3
2013/14
56
1.7
642.7
(27)yoybroadly stable
qoqslighty up
qoq stable
qoqup
yoybroadly stable
(5.0)
0.0
2014/15Q1 Q2EQ2
2013/14 2014/15
yoy/qoqimprovement
* Full Group

Developing the future.
Charts on 1st Quarter 2014/15February 13, 2015
10
Financial Calendar – FY 2014/15
February Roadshows
Edinburgh (27th)
March Conferences
Citi West Coast Symposium, San Francisco (11th-12th)
Citi Global Resources Conference, London (11th)
BoAML Global Industrials & EU Autos Conference, London (18th)
Exane Basic Materials Seminar, London (24th)
Deutsche Bank Virtual ADR Conference (26th)
April Conferences
Bankhaus Lampe Deutschlandkonferenz, Baden-Baden (16th)
May Conference Call Q2 2014/15 (12th)

Developing the future.
Charts on 1st Quarter 2014/15February 13, 2015
11
Contact Details ThyssenKrupp Investor Relations
Phone numbers +49 201-844-
Dr. Claus Ehrenbeck -536464Head of Investor Relations
Christian Schulte -536966IR Manager (Deputy Head)
Rainer Hecker -538830IR Manager
Sabine Sawazki -536420IR Manager
Klaudia Kelch -538371IR Manager
To be added to the IR mailing list,
send us a brief e-mail with your details!
E-mail: [email protected]

Developing the future.
Charts on 1st Quarter 2014/15February 13, 2015
12
Share and ADR Data
Ticker Symbol TKAGerman Security Identification Number (WKN) 750 000ISIN Number DE0007500001Exchange Frankfurt, Dusseldorf
Share Data
ADR Data
Ratio (ordinary share: ADR) 1:1ADR Structure Sponsored-Level-ITicker Symbol TKAMYCusip 88629Q 207ISIN Number US88629Q2075Exchange Over-the-Counter (OTC)
Shares outstanding 565,937,947Type of share No-par-value bearer sharesVoting One share, one vote

Developing the future.
Charts on 1st Quarter 2014/15February 13, 2015
13
Appendix
Agenda

Developing the future.
Charts on 1st Quarter 2014/15February 13, 2015
14
Cultural change and leadership
Performance and benchmarking ambition
Rational capital allocation
Value Upside
Mid- to Long-Term Perspective From Strategic Way Forward return to previous margin levels (6-8%)
• performance measures • ramp-up new plants
CT
efficient corporate structure central projects and initiatives
preparing next level of efficiency gains
close margin gap to peers• while leverage growth opportunities• target: 15%* I €1 bn (EBIT adj.)
ET
sales growth by Ø 5% to €8 bn• while maintain
stable EBIT margin* of 6-7%
IS
return to previous margin levels• performance measures• specialization & processing
VDM/AST: perform./attract. concept
MX
return to > wacc across the cycle• BiC Reloaded:
efficiency & differentiation
SE
AM
* excl. notional interest credit from net prepayment surplus
continuous EBIT improvement BCF ~break-even during FY 14/15 sustainable slab marketing concept
Corp.
Profitability
Profitability
Profitability
Profitability before growth
Profitability before growth
Growthbefore profitability

Developing the future.
Charts on 1st Quarter 2014/15February 13, 2015
15
KPI(in million €)
FY 2013/14 without HKM
Δ proportionate consolidation HKM
FY 2013/14 with HKM
Sales
GroupSE
41,3048,857
-92-38
41,2128,819
EBITDA adjusted
GroupSE
2,409620
+57+57
2,466677
EBIT adjusted
GroupSE
1,314206
+15+15
1,329221
Net Income* 195 - 195
NFD* 3,488 +189 3,677
FCF* before divest (254) -102 (356)
Pension and similar obligations 7,354 +136 7,490
Impact on KPIs from Proportionate Consolidation HKM (as of Oct 1st, 2013)
* Full Group

Developing the future.
Charts on 1st Quarter 2014/15February 13, 2015
16
Key Financials (I)
** attributable to ThyssenKrupp AG’s stockholders
Cont. Ops.(incl. Steel Americas with
Steel USA until Feb 26, 2014)
* definition change KPIs restated due to proportionate consolidation of HKM
2014/15
Q1 Q2 Q3 Q4 FY Q1
Order intake €m 10,661 10,210 10,153 10,352 41,376 10,094
Sales €m 9,088 10,269 10,720 11,135 41,212 10,044
EBITDA €m 482 610 644 409 2,145 590
EBITDA adjusted €m 518 593 693 661 2,466 623
EBIT* €m 209 325 345 81 959 285
EBIT adjusted* €m 245 306 394 384 1,329 317
EBT €m (230) 369 161 (59) 242 151
EBT adjusted €m (194) 351 210 243 610 183
Income from cont. ops. €m (257) 272 43 (49) 9 47
attrib. to TK AG stockh. €m (252) 271 40 (35) 24 54
Earnings per share** € (0.47) 0.48 0.07 (0.06) 0.04 0.10
2013/14

Developing the future.
Charts on 1st Quarter 2014/15February 13, 2015
17
Key Financials (II)
*** incl. financial investments** referring to Full Group
Cont. Ops.(incl. Steel Americas with
Steel USA until Feb 26, 2014)
* definition change
KPIs restated due to proportionate consolidation of HKM
2014/15
Q1 Q2 Q3 Q4 FY Q1
TK Value Added* €m (185)
Goodwill** €m 3,574
Depreciation/amort. €m 273 276 286 308 1,143 305
Business cash flow €m (98) (357) 111 722 377 (546)
Cash flow from divestm. €m 26 1,020 15 (7) 1,054 110
Cash flow from investm. €m (248) (301) (239) (471) (1,259) (265)
Free cash flow €m (183) 369 (69) 580 697 (537)
FCF before divest €m (209) (651) (84) 587 (357) (647)
Cash and cash equivalents** (incl. short-term securities) €m 4,076 5,045 3,525 3,994 3,994 3,658
Net financial debt** €m 4,599 4,178 4,243 3,677 3,677 4,212
Equity €m 3,266 3,183 3,173 3,199 3,199 2,907
Employees 158,234 162,411 161,786 162,372 162,372 155,407
2013/14

Developing the future.
Charts on 1st Quarter 2014/15February 13, 2015
18
Key Financials (III) Full Group(Cont. ops. +
Inoxum effects until Q2 13/14)
** attributable to ThyssenKrupp AG’s stockholders* definition change
KPIs restated due to proportionate consolidation of HKM
2014/15
Q1 Q2 Q3 Q4 FY Q1
Order intake €m 10,661 10,210 10,153 10,352 41,376 10,094
Sales €m 9,088 10,269 10,720 11,135 41,212 10,044
EBITDA €m 669 608 643 410 2,330 587
EBITDA adjusted €m 518 593 693 661 2,466 623
EBIT* €m 396 322 344 82 1,145 281
EBIT adjusted* €m 245 306 394 384 1,329 317
EBT €m (43) 367 161 (57) 428 147
EBT adjusted €m (194) 351 210 243 610 183
Net income €m (70) 270 42 (47) 195 43
attrib. to TK AG stockh. €m (65) 269 39 (33) 210 50
Earnings per share** € (0.12) 0.48 0.07 (0.06) 0.38 0.09
FCF €m (183) 369 (69) 580 696 (541)
FCF before divest €m (209) (653) (83) 587 (356) (651)
2013/14

Developing the future.
Charts on 1st Quarter 2014/15February 13, 2015
19
~2,500
FY 2014/15EFY 2013/14FY 2012/13
Ramp-up Efficiency Gains 2015
Sustainable Efficiency Gains to Support EBIT Target FY 2014/15E
50% contribution to efficiency target from synergize+ especially by tapping unaddressed bundling potentials and pulling cross-functional levers
Efficiency Gains 2015 by Business Area
Efficiency Gains 2015 by Categories
2015
Energy & Other~10%
~20%
Operations
~20%
~50%Personnel
Corporate
~6%Industrial Solutions~15%
Components Technology ~14%
Steel Europe
Elevator Technology~14%
Materials Services
~12%
~27%
million €
(Procurement)500
100
~600
>1,000
~850
~13%Steel Americas
achievedQ1: ~250

Developing the future.
Charts on 1st Quarter 2014/15February 13, 2015
20
Capex Allocation
CapGoods (CT, ET, IS)
2012/13
Materials (MX, SE, AM)
~€1.3 bn ~34
~8
~33
CTETISMXSEAM
~33~67 in %
thereof:CT: ~60%SE: ~20%IS: ~10%
thereof:SE: ~45%MX: ~15%CT: ~15%
Maint.Growth
2013/14*
in %
~31
~8
~13 ~7
~34
~7
2014/15E
Cash flows from investing activities – continuing operations
CT
ETISMX
SE
AM
31%
11%5%6%
33%
14%
30%
7%5%9%
42%
7%
Business Area shares referring to capex excl. Corporate
~€1.25 bn
~€1.5 bn
Group cont. ops.
* restated due to proportionate consolidation of HKM

Developing the future.
Charts on 1st Quarter 2014/15February 13, 2015
21
Solid Financial Situation
Liquidity analysis and maturity profile of gross financial debt as of December 31, 2014 (million €)
2015/16 2016/17 2017/18 after2018/19
Available committed credit facilities
Cash and cash equivalents
1,2291,685
1,398
111
1,616
3,670
1,831
* incl. securities of €6 m
7,328
16% 21% 18% 23% 1% 21%
3,658*
2018/192014/159 months
€1 bn / 8.5% bond matures in Feb 2016 (all other outstanding bonds with coupon <5%)
Total: 7,870

Developing the future.
Charts on 1st Quarter 2014/15February 13, 2015
22
Accrued Pension and Similar Obligations
Accrued pension liability Germany
Accrued postretirement obligation other than pensions
Other accrued pension-related obligation
Sep 30, 2014
Accrued pension liability outside GER
Discount rateGermany
3.50
Reclassification liabilities associated with assets held for sale
7,348
6,427
Sep 30, 2013
7,288
2.60
7,490192 10
6,852
436252
698
(29)
6,039
388
7,354
13/14 14/15 15/16 16/17 …
Assumption: unchanged discount rate
“Patient” long-term debt, no immediate redemption in one go
Interest cost independent of ratings, covenants etc.
German discount rate aligned to interest rate for AA-rated corporate bonds and discounts rate of other German companies
Yoy increase in accrued pension liability mainly driven by decrease in German discount rate
Yoy decrease in postretirement obligation due to deconsolidation of Budd company
Number of plan participants steadily decreasing
64% of obligations owed to retired employees, average age ~74 years
17/18 18/19
2.10
8,02017810
7,315
516
7,288
2.60
7,490192
6,852
436
12/13 restated due to adoption IAS 19R, 13/14 due to proportionate consolidation HKM
Dec 31, 2014Sep 30, 2014
- 100-200 p.a.
Post-retirem.
11
Accrued pension and similar obligations (in €m) Accrued pension & similar obligations expected to decrease over time (in €m)
7,831
13/14 restated due to proportionate consolidation HKM

Developing the future.
Charts on 1st Quarter 2014/15February 13, 2015
23
Components Technology – Q1 2014/15 HighlightsOrder intake in €m Quarterly order intake auto components EBIT in €m; EBIT adj. margin in %
Q1 2014/15: yoy increase in order intake mainly driven by continuing strong demand
in the US (LV, trucks) and China (LV)
EBITEBIT adjusted
2013/14 2014/15 2013/14 2014/15
1,439
1,534
Q4Q1
1,573
4.4
54
4.8
Q1 Q1Q4
63
75
67
61
48
3.8
Q1
1,611
4.3
69
65
Q4Q2
2008/09
Q2
2010/11
Q4
2012/13
Q2 Q4
Inventories and Months of Supply - Europe Current trading conditions
CT
Sales by region – FY 2013/14
Germany
Rest of EUNAFTA
South America
Asia
32%
20%26%
6%
15%
€6.2 bn
Rest of World1%
1,621
67
67
2014/15
Order activity in Q1 remains on high level (+13% yoy)
• Light vehicles: ongoing positive development in China and the US; further recovery in Western Europe
• Trucks: ongoing difficult market conditions (except for the US)
• Industrial components: improved business environment for wind turbines (especially in China); no significant improvement in construction equipment market
EBIT adj. with increase of 6% yoy; ongoing efficiency programs with positive impact
4.2

Developing the future.
Charts on 1st Quarter 2014/15February 13, 2015
24
Components Technology
Key figures
* definition change
CT
2014/15
Q1 Q2 Q3 Q4 FY Q1
Order intake €m 1,439 1,573 1,611 1,534 6,157 1,621
Sales €m 1,428 1,555 1,603 1,586 6,172 1,597
EBITDA €m 121 136 135 123 514 140
EBITDA adjusted €m 129 144 139 135 547 140
EBIT* €m 54 67 65 48 234 67
EBIT adjusted* €m 63 75 69 61 268 67
EBIT adj. margin* % 4.4 4.8 4.3 3.8 4.3 4.2
TK Value Added €m (26)
BCF €m (41) 1 7 50 16 (128)
CF from divestm. €m 2 0 1 4 7 1
CF for investm. €m (65) (73) (75) (143) (356) (74)
28,057 28,354 28,500 28,941 28,941 29,162
2013/14
Employees

Developing the future.
Charts on 1st Quarter 2014/15February 13, 2015
25
Elevator Technology – Q1 2014/15 HighlightsUnits under Maintenance EBIT* in €m; EBIT * adj. margin in %
176
178
10.49.6
139
143
10.8
173
165
Q12013/14
Q4
115
156
10.1
Q1
11.3
202
62
ET
EBITEBIT adjusted
Order intake in €m
1,7451,8011,581
Q1 Q1Q42013/14
Americas Asia/Pacific
FY: 6,819
2004/05 2013/14
CAGR+4.6%
~0.8 m
~ 1.2 m
1,692
Units under Maintenance
Europe/Africa/Middle East
2014/15
1,868
2014/15* now excl. notional interest credit from net prepayment surplus
Current trading conditionsCurrent trading conditionsNew product: MULTI – First ropeless elevator
High flexibility: Horizontal as well as vertical movement possible
Product scope: No restrictions on building height or shape
Joint R&D: Exchanger module developed together with Components Technology; extra light cabins developed with TK Tech Center Carbon Composites, Dresden
Unique technology: Linear motor technology based on Transrapid
ETET CTCT+
Order backlog €4.3 bn again at record level (+13% yoy) Order intake in Q1 yoy up +4% driven by new installation
(Q1: adj. for F/X +/-0% yoy) New installation: demand driven by A/P (China, Korea) as well as
US (with tailwind from F/X); Southern Europe and France weak Modernization: negatively impacted by strike in France Maintenance: mature markets in e.g. S-Europe and USA stay competitive Q1 margin improvement by 0.3%-pt yoy reflecting numerous
measures of performance improvement program Q1 margin impacted by restructuring of factory in France

Developing the future.
Charts on 1st Quarter 2014/15February 13, 2015
26
Elevator Technology
Key figures
* definition change
ET
2014/15
Q1 Q2 Q3 Q4 FY Q1
Order intake €m 1,801 1,581 1,692 1,745 6,819 1,868
Sales €m 1,544 1,480 1,609 1,783 6,416 1,712
EBITDA* €m 133 157 184 91 566 195
EBITDA adjusted* €m 175 161 192 219 748 196
EBIT* €m 115 139 165 62 480 176
EBIT adjusted* €m 156 143 173 202 674 178
EBIT adj. margin* % 10.1 9.6 10.8 11.3 10.5 10.4
TK Value Added €m 378
BCF €m 51 230 159 201 641 56
CF from divestm. €m 1 1 0 2 4 2
CF for investm. €m (14) (20) (21) (33) (87) (29)
49,348 49,316 49,707 50,282 50,282 51,044
2013/14
Employees

Developing the future.
Charts on 1st Quarter 2014/15February 13, 2015
27
Industrial Solutions – Q1 2014/15 HighlightsOrder intake in €m Order backlog in €bn EBIT* in €m; EBIT* adj. margin in %
92
6.7
91
7.3
117
1,214
15.113.5
Major order Q1 2014/15 Current trading conditions
2,295
95
Q1 2013/14 big ticket MS
Plan
t Te
chno
logy
* now excl. notional interest credit from net prepayment surplus
Q1 Q4 Q12013/14 2014/15
15.5
91
7.1
111
Q1 Q42013/14
Q12013/14
Q42014/15
Q1
Mar
ine
Sys
tem
s
Plan
t Te
chno
logy
Mar
ine
Sys
tem
s
1,188
FY: 5,732
14.6 112
7.0
Q1
1,035
199100
5.5
14.0
Q1 orders ex MS / big ticket effect up by ~5% yoy, backlog covers >2x sales
• chemicals: interest for fertilizer & polymer plants esp. from US continues
• cement: sustained high demand for cement plants driven by infra-structure growth in EM as well as low US energy prices
• mining: ongoing lower customer new installation demand; but high order backlog and growing service & repair business secure solid performance
• good conditions in the auto plant market (esp. in US, Europe and China) as well as project chances from the aerospace industry
• Marine Systems benefited from smaller and reliable service orders
EBIT adj. with slight increase yoy however billing-related lower margin yoy
IS
114 107
EBITEBIT adjusted
1,075
2014/15
(Comparable project)
Cement plant for McInnis Cement, Canada: Representing the most techno-
logically advanced and environ-mentally sound plant of its kind
Cement clinker plant with 6,000 t/d POLCID proprietary process control
system and POLAB laboratory automation system for quality assurance and monitoring
Order value in high 2-digit €m range, SOP in 2016
Developing the future.
Charts on 1st Quarter 2014/15February 13, 2015
28
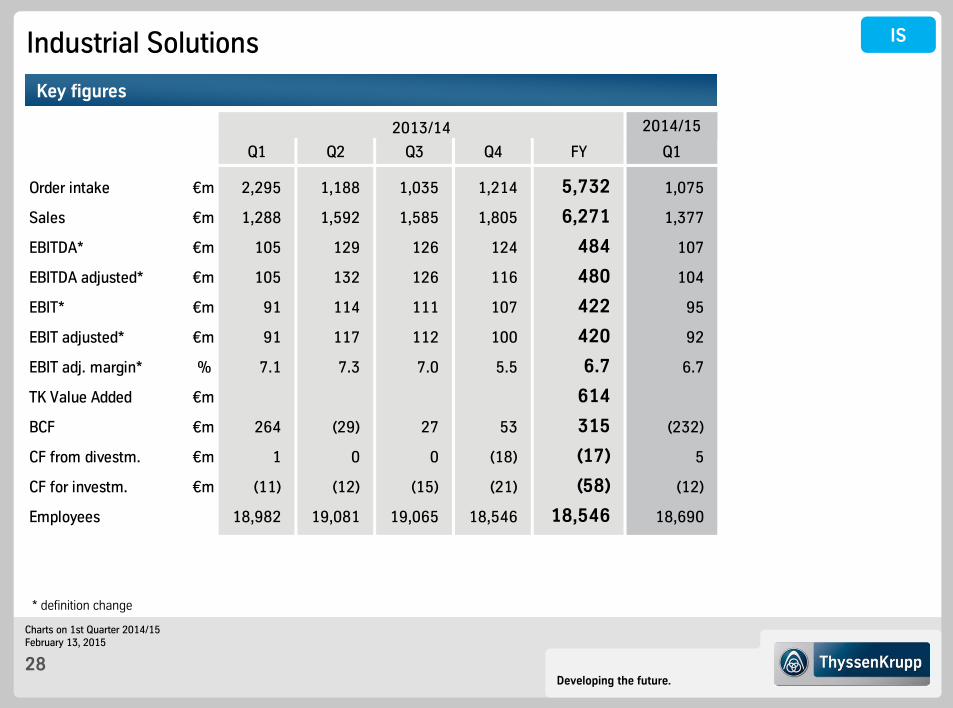
Industrial Solutions
Key figures
* definition change
IS
2014/15
Q1 Q2 Q3 Q4 FY Q1
Order intake €m 2,295 1,188 1,035 1,214 5,732 1,075
Sales €m 1,288 1,592 1,585 1,805 6,271 1,377
EBITDA* €m 105 129 126 124 484 107
EBITDA adjusted* €m 105 132 126 116 480 104
EBIT* €m 91 114 111 107 422 95
EBIT adjusted* €m 91 117 112 100 420 92
EBIT adj. margin* % 7.1 7.3 7.0 5.5 6.7 6.7
TK Value Added €m 614
BCF €m 264 (29) 27 53 315 (232)
CF from divestm. €m 1 0 0 (18) (17) 5
CF for investm. €m (11) (12) (15) (21) (58) (12)
18,982 19,081 19,065 18,546 18,546 18,690
2013/14
Employees

Developing the future.
Charts on 1st Quarter 2014/15February 13, 2015
29
Materials Services – Q1 2014/15 HighlightsEBIT in €m; EBIT adj. margin in %
1.21.7
34
(14)43 37
56
1.7
44
Q1 Q42013/14
Q1
58
1.5
(24)
MX
64
EBITEBIT adjusted
Order intake* in €m
* thereof materials warehousing business ~60%
3,726
2,842
3,414
Q1 Q4 Q12013/14
Materials warehousing shipments in 1,000 t
1,232
1,425
Q1 Q4 Q12013/14
3,7001,389
VDM/AST
1,384
Current trading conditionsCurrent stage of VDM/AST
Challenging and highly competitive environment, decreasing prices
Shipments of materials and raw materials increased in Q1 by 2% yoyto 3.2 mt due to constant sales initiatives
Order intake in Q1 +6% yoy on comparable basis (ex VDM/AST)driven by trading business and materials warehousing business in NA
VDM/AST contribute ~€500 m to order intake and sales; AST affected by impact from strike in Italy
Earnings slightly up yoy excluding VDM/AST
• VDM/AST with EBIT adj. contribution of €(33) m
excl. VDM/AST shipments
3,546
2014/15
1,239
2014/15
0.12
2014/15
VDM:• new organizational setup (incl. reduction of 135 FTE)• optimization and focusing of sales processes
AST: • cost reduction of >€100 m p.a. targeted and on track• strengthening of CR line• strengthening of EAF 1 and closure of EAF 2 in 2015/16• reduction of >300 people of which >290 have already
left the company• all relevant stakeholders agreed to performance concept

Developing the future.
Charts on 1st Quarter 2014/15February 13, 2015
30
Materials Services
Key figures
* definition change
MX
2014/15
Q1 Q2 Q3 Q4 FY Q1
Order intake €m 2,842 3,414 3,700 3,726 13,682 3,546thereof Special Materials 288 731 599 1,618 546
Sales €m 2,739 3,320 3,780 3,821 13,660 3,421thereof Special Materials 266 763 689 1,718 522
EBITDA €m 62 66 88 24 239 27
EBITDA adjusted €m 54 85 102 85 325 44thereof Special Materials 4 21 (4) 22 (12)
EBIT* €m 43 37 44 (24) 100 (14)
EBIT adjusted* €m 34 56 58 64 212 2thereof Special Materials (3) (2) (19) (24) (33)
EBIT adj. margin* % 1.2 1.7 1.5 1.7 1.6 0.1thereof Special Materials (1.1) (0.3) (2.8) (1.4) (6.3)
TK Value Added €m (198)
BCF €m (236) (67) (87) 349 (41) (92)thereof Special Materials (1) (43) 15 (30) (85)
CF from divestm. €m 19 1 3 7 30 94
CF for investm. €m (13) (17) (28) (55) (113) (22)
25,128 30,653 30,467 30,289 30,289 22,423
2013/14
Employees

Developing the future.
Charts on 1st Quarter 2014/15February 13, 2015
31
Steel Europe – Q1 2014/15 HighlightsShipments in 1,000 t
indexed (Q1 2004/05=100) Ø rev/t
Order intake* in €m EBIT* in €m; EBIT* adj. margin in %
2,095 2,272
2,4292,177
Q1 Q42014/152013/14
2,580
121
Q1 Q4 Q12013/14 2014/15 2013/14 2014/15
Q4
55190.9
18
64
2.7
91
117
3,109
Q1
119
2,858
118
Q1Q1
1.7
36
80
2,034
103
4.6
31
2,847
SE
117
2,554
Current trading conditionsInventories and Months of Supply - EuropeStrengthening differentiation: TetraFlex –innovative concept for steel wind turbine towers
Qoq higher EBIT adj. reflecting mainly higher production volumes following restart of BF#2, improved fixed cost dilution, lower maintenance & repair and raw material costs as well as efficiency gains from “Best-in-Class Reloaded”; reduced weekly working hours for pay-scale employees has become effective Oct 1, 2014
Orders, production and shipments affected by production constraints caused by delayed completion of modernization of continuous caster#1/restart of BF#2
Expectation fiscal Q2 2014/15: qoq slightly higher EBIT adj., higher volumes, lower selling prices
EBITEBIT adjusted
79
4.0
* restated due to proportionate consolidation of HKM
Enabling hub heights >120 m
Increasing heights with stronger and more constant wind drive full-load hours and electricity generation
Lower material, transportation and assembly costs
Patent applications filed for concept and individual components

Developing the future.
Charts on 1st Quarter 2014/15February 13, 2015
32
Steel Europe
Key figures
* definition change KPIs restated due to proportionate consolidation of HKM
SE
2014/15
Q1 Q2 Q3 Q4 FY Q1
Order intake €m 2,272 2,429 2,177 2,034 8,912 2,095
Sales €m 2,066 2,377 2,218 2,158 8,819 1,985
EBITDA €m 137 172 206 133 648 199
EBITDA adjusted €m 137 182 219 139 677 199
EBIT €m 19 55 91 31 195 80
EBIT adjusted* €m 18 64 103 36 221 79
EBIT adj. margin* % 0.9 2.7 4.6 1.7 2.5 4.0
TK Value Added €m (245)
BCF €m 58 (22) 56 139 232 (129)
CF from divestm. €m 0 (2) (4) (21) (27) 5
CF for investm. €m (105) (125) (111) (164) (506) (100)
28,259 28,022 27,665 27,858 27,858 27,740
2013/14
Employees

Developing the future.
Charts on 1st Quarter 2014/15February 13, 2015
33
156
122 130147
135121 117
153
116135 136
126 117139
120140 138
127 119120 129146
136123 118
HKM share
Steel Europe: Output, Shipments and Revenues per Metric Ton
Cold-rolledHot-rolled; incl. slabs
2008/09 2009/10 2010/11 2011/12 2012/13
Q1Q1 Q2 Q3 Q4Q1 Q2 Q3 Q4Q1 Q2 Q3 Q4Q1 Q2 Q3 Q4Q1 Q2 Q3 Q4
828863 790
Fiscal year
2010/112011/12 Q12014/15
2,485
3,312
Q12014/15Fiscal year
2010/11 2011/12
2,554
967
1,587
3,256
1,130
2,126
2,102
2,965
833
2,187
3,020 2,879
1,020
1,859
Q2 Q3 Q4
2012/132012/13
2,912
2,122
Q12013/14
786 863822
8432,360
3,146
Q2
2,555
3,418
Q3
3,119
2,2961,725
Q4
2,567
2013/14
Q1
2,555
1,725
Crude steel output (incl. share in HKM) 1,000 t/quarter
Average revenues per ton*, indexed Q1 2004/2005 = 100
Shipments*: Hot-rolled and cold-rolled products 1,000 t/quarter
SE
3,002
1,026
1,977
Q1
2013/14
2,580
947
1,633
Q2
3,109
1,205
1,904
Q3
2,858
1,041
1,817
2,847
1,064
1,783
Q4
2014/15

Developing the future.
Charts on 1st Quarter 2014/15February 13, 2015
34
Steel Americas – Q1 2014/15 HighlightsProduction & shipments in 1,000 t
Slab productionCSA
Slab shipmentsCSA
Q1 Q4 Q1
Q1 Q4 Q114/15
Order intake in €m EBIT in €m
620609
574 (19)
(1)
(27)
Q1 Q4 Q12013/14 2014/15
Q12013/14
Q42014/15
Q113/14
14/1513/14
998
115
987
9231,034412
12
4
1,071
1,046
AM
(34)
1,131(54)
Current trading conditions
Qoq higher EBIT adj. despite lower production and shipment volumes (converter repair/downtime in November) reflecting impact measures, lower raw material costs and less negative translation effects related to R$-based sales tax assets
Special items in Q1: €(11) m from updated valuation of a long-term freight contract
Expectation fiscal Q2 2014/15: qoq stable EBIT adj., higher volumes, lower selling prices
1,054 EBITEBIT adjusted
475
915
987
0
(11)
€ bn
Positive EBITDA Achieved; Cash Break-Even Targeted in FY’14/15

Developing the future.
Charts on 1st Quarter 2014/15February 13, 2015
35
Steel Americas
Key figures
* definition change
AM
2014/15
Q1 Q2 Q3 Q4 FY Q1
Order intake €m 609 574 412 620 2,215 475
Sales €m 538 535 441 546 2,060 502
EBITDA €m 29 143 33 (16) 188 21
EBITDA adjusted €m 10 1 40 (4) 48 32
EBIT €m (1) 115 4 (54) 64 (11)
EBIT adjusted* €m (19) (27) 12 (34) (68) 0
EBIT adj. margin* % (3.5) (5.0) 2.7 (6.2) (3.3) 0.0
TK Value Added €m (174)
BCF €m (178) (151) 84 64 (181) (23)
CF from divestm. €m 0 1,263 6 2 1,271 1
CF for investm. €m (22) (33) (3) (31) (89) (10)
5,491 4,037 3,446 3,466 3,466 3,348
2013/14
Employees

Developing the future.
Charts on 1st Quarter 2014/15February 13, 2015
36
Corporate: Overview
Key figures
2014/15
Q1 Q2 Q3 Q4 FY Q1
Order intake €m 42 43 41 51 177 47
Sales €m 42 43 41 51 177 45
EBITDA €m (107) (188) (130) (88) (513) (96)
EBITDA adjusted €m (94) (108) (127) (47) (377) (91)
EBIT* €m (116) (199) (139) (108) (563) (107)
EBIT adjusted* €m (104) (119) (136) (67) (426) (102)
BCF €m (30) (302) (118) (150) (600) 9
2,969 2,948 2,936 2,990 2,990 3,000
2013/14
Employees
* definition change

Developing the future.
Charts on 1st Quarter 2014/15February 13, 2015
37
Business Area Overview – Quarterly Order Intake
2014/15
million € Q1 Q2 Q3 Q4 FY Q1
Components Technology 1,439 1,573 1,611 1,534 6,157 1,621
Elevator Technology 1,801 1,581 1,692 1,745 6,819 1,868
Industrial Solutions 2,295 1,188 1,035 1,214 5,732 1,075
Materials Services 2,842 3,414 3,700 3,726 13,682 3,546
Steel Europe 2,272 2,429 2,177 2,034 8,912 2,095
Steel Americas 609 574 412 620 2,215 475
Corporate 42 43 41 51 177 47
Consolidation (639) (592) (515) (572) (2,318) (633)
Continuing operations 10,661 10,210 10,153 10,352 41,376 10,094
2013/14
2013/14 restated due to proportionate consolidation of HKM

Developing the future.
Charts on 1st Quarter 2014/15February 13, 2015
38
Business Area Overview – Quarterly Sales
2014/15
million € Q1 Q2 Q3 Q4 FY Q1
Components Technology 1,428 1,555 1,603 1,586 6,172 1,597
Elevator Technology 1,544 1,480 1,609 1,783 6,416 1,712
Industrial Solutions 1,288 1,592 1,585 1,805 6,271 1,377
Materials Services 2,739 3,320 3,780 3,821 13,660 3,421
Steel Europe 2,066 2,377 2,218 2,158 8,819 1,985
Steel Americas 538 535 441 546 2,060 502
Corporate 42 43 41 51 177 45
Consolidation (557) (633) (557) (615) (2,363) (595)
Continuing operations 9,088 10,269 10,720 11,135 41,212 10,044
2013/14
2013/14 restated due to proportionate consolidation of HKM

Developing the future.
Charts on 1st Quarter 2014/15February 13, 2015
39
Business Area Overview – Quarterly EBITDA and Margin
2013/14 restated due to proportionate consolidation of HKM * definition change
2014/15
million € Q1 Q2 Q3 Q4 FY Q1
Components Technology 121 136 135 123 514 140
% 8.5 8.7 8.4 7.8 8.3 8.8
Elevator Technology* 133 157 184 91 566 195
% 8.6 10.6 11.4 5.1 8.8 11.4
Industrial Solutions* 105 129 126 124 484 107
% 8.2 8.1 7.9 6.9 7.7 7.8
Materials Services 62 66 88 24 239 27
% 2.3 2.0 2.3 0.6 1.7 0.8
Steel Europe 137 172 206 133 648 199
% 6.6 7.2 9.3 6.2 7.3 10.0
Steel Americas 29 143 33 (16) 188 21
% 5.4 26.7 7.5 (2.9) 9.1 4.2
Corporate (107) (188) (130) (88) (513) (96)
Consolidation 2 (5) 2 19 19 (3)
Continuing operations 482 610 644 409 2,145 590
% 5.3 5.9 6.0 3.7 5.2 5.9
Discontinued operations 187 (2) 1 1 185 (3)
Group (incl. disc. operations) 669 608 643 410 2,330 587
% 7.4 5.9 6.0 3.7 5.7 5.8
2013/14

Developing the future.
Charts on 1st Quarter 2014/15February 13, 2015
40
Business Area Overview – Quarterly EBITDA adjusted and Margin
2014/15
million € Q1 Q2 Q3 Q4 FY Q1
Components Technology 129 144 139 135 547 140
% 9.0 9.3 8.7 8.5 8.9 8.8
Elevator Technology* 175 161 192 219 748 196
% 11.3 10.9 11.9 12.3 11.7 11.4
Industrial Solutions* 105 132 126 116 480 104
% 8.2 8.3 7.9 6.4 7.7 7.6
Materials Services 54 85 102 85 325 44
% 2.0 2.6 2.7 2.2 2.4 1.3
Steel Europe 137 182 219 139 677 199
% 6.6 7.7 9.9 6.4 7.7 10.0
Steel Americas 10 1 40 (4) 48 32
% 1.9 0.2 9.1 (0.7) 2.3 6.4
Corporate (94) (108) (127) (47) (377) (91)
Consolidation 2 (4) 2 18 18 (1)
Continuing operations 518 593 693 661 2,466 623
% 5.7 5.8 6.5 5.9 6.0 6.2
Discontinued operations 0 0 0 0 0 0
Group (incl. disc. operations) 518 593 693 661 2,466 623
% 5.7 5.8 6.5 5.9 6.0 6.2
2013/14
2013/14 restated due to proportionate consolidation of HKM * definition change

Developing the future.
Charts on 1st Quarter 2014/15February 13, 2015
41
Business Area Overview – Quarterly EBIT* and Margin
** until closing Feb 26, 2014 excluding regular depreciation for Steel USA* definition change
2014/15
million € Q1 Q2 Q3 Q4 FY Q1
Components Technology 54 67 65 48 234 67
% 3.8 4.3 4.1 3.0 3.8 4.2
Elevator Technology 115 139 165 62 480 176
% 7.4 9.4 10.3 3.5 7.5 10.3
Industrial Solutions 91 114 111 107 422 95
% 7.1 7.2 7.0 5.9 6.7 6.9
Materials Services 43 37 44 (24) 100 (14)
% 1.6 1.1 1.2 (0.6) 0.7 (0.4)
Steel Europe 19 55 91 31 195 80
% 0.9 2.3 4.1 1.4 2.2 4.0
Steel Americas** (1) 115 4 (54) 64 (11)
% (0.2) 21.5 0.9 (9.9) 3.1 (2.2)
Corporate (116) (199) (139) (108) (563) (107)
Consolidation 4 (3) 4 19 27 (1)
Continuing operations** 209 325 345 81 959 285
% 2.3 3.2 3.2 0.7 2.3 2.8
Discontinued operations 187 (3) (1) 2 186 (4)
Group** (incl. disc. operations) 396 322 344 82 1,145 281
% 4.4 3.2 3.2 0.7 2.8 2.8
2013/14

Developing the future.
Charts on 1st Quarter 2014/15February 13, 2015
42
Business Area Overview – Quarterly EBIT adjusted* and Margin
** until closing Feb 26, 2014 excluding regular depreciation for Steel USA* definition change
2014/15
million € Q1 Q2 Q3 Q4 FY Q1
Components Technology 63 75 69 61 268 67
% 4.4 4.8 4.3 3.8 4.3 4.2
Elevator Technology 156 143 173 202 674 178
% 10.1 9.6 10.8 11.3 10.5 10.4
Industrial Solutions 91 117 112 100 420 92
% 7.1 7.3 7.0 5.5 6.7 6.7
Materials Services 34 56 58 64 212 2
% 1.2 1.7 1.5 1.7 1.6 0.1
Steel Europe 18 64 103 36 221 79
% 0.9 2.7 4.6 1.7 2.5 4.0
Steel Americas** (19) (27) 12 (34) (68) 0
% (3.5) (5.0) 2.7 (6.2) (3.3) 0.0
Corporate (104) (119) (136) (67) (426) (102)
Consolidation 6 (3) 3 22 28 1
Continuing operations** 245 306 394 384 1,329 317
% 2.7 3.0 3.7 3.4 3.2 3.2
Discontinued operations 0 0 0 0 0 0
Group** (incl. disc. operations) 245 306 394 384 1,329 317
% 2.7 3.0 3.7 3.4 3.2 3.2
2013/14

Developing the future.
Charts on 1st Quarter 2014/15February 13, 2015
43
Special ItemsBusiness Area 2014/15(million €) Q1 Q2 Q3 Q4 FY Q1
Disposal effect 2 2ImpairmentRestructuring (7) (4) (14) (25)Others (1) (8) (1) (1) (11)Disposal effect (1) 1Impairment (11) (11)Restructuring (41) (4) (9) (57) (111) (1)Others (73) (73) (1)
Disposal effect 17 17 3Impairment (2) (2)Restructuring (4) (6) (10)Others (3) (3)Disposal effect 10 1 11 (10)Impairment (28) (28)Restructuring (17) 2 (46) (61) (3)Others (1) (2) (16) (16) (35) (3)Disposal effectImpairment 1 1 1 3 1Restructuring (14) (9) (4) (27)Others 3 (3)Disposal effect 141 141Impairment (9) (9)Others 18 2 (8) (12) 0 (11)Disposal effect (11) (77) 2 (35) (122) (3)Impairment (1) (1)Restructuring (2) (3) (4) (4) (12) (1)Others (1) (2) (2) (1)
Consolidation 1 1
Continuing operations (36) 18 (49) (301) (368) (32)
Discontinued operations 187 (2) (1) 2 186 (4)
Group (incl. discontinued operations) 151 16 (50) (299) (182) (36)
2013/14
SE
AM
Cor
p.C
TM
XIS
ET

Developing the future.
Charts on 1st Quarter 2014/15February 13, 2015
44
ThyssenKrupp-specific Key Figures: Reconciliation of EBIT Q1 2014/15
P&L StructureNet sales 10,044
- Cost of sales (8,414)
- SG&A, R&D (1,315)
+/- Other income/expense 10
+/- Other gains/losses (44)
= Income from operations 281
+/- Income from companies using equity method 17
+/- Finance income/expense (147)
= EBT 151
EBIT definition Net sales 10,044
- Cost of sales (8,414)
- SG&A, R&D (1,315)
+/- Other income/expense 10
+/- Other gains/losses (44)
+/- Income from companies using equity method 17
+/- Adjustm. for oper. items in fin. income/expense (13)
= EBIT 285
+/- Finance income/expense (147)
+/- Operating items in fin. income/expense 13
= EBT 151

Developing the future.
Charts on 1st Quarter 2014/15February 13, 2015
45
Disclaimer ThyssenKrupp AG
“The information set forth and included in this presentation is not provided in connection with an offer or solicitation for the purchase or sale of a security and is intended for informational purposes only.
This presentation contains forward-looking statements that are subject to risks and uncertainties. Statements contained herein that are not statements of historical fact may be deemed to be forward-looking information. When we use words such as “plan,” “believe,” “expect,” “anticipate,” “intend,” “estimate,” “may” or similar expressions, we are making forward-looking statements. You should not rely on forward-looking statements because they are subject to a number of assumptions concerning future events, and are subject to a number of uncertainties and other factors, many of which are outside of our control, that could cause actual results to differmaterially from those indicated. These factors include, but are not limited to, the following:(i) market risks: principally economic price and volume developments, (ii) dependence on performance of major customers and industries, (iii) our level of debt, management of interest rate risk and hedging against commodity price risks;(iv) costs associated with, and regulation relating to, our pension liabilities and healthcare measures, (v) environmental protection and remediation of real estate and associated with rising standards for real estate environmental protection, (vi) volatility of steel prices and dependence on the automotive industry, (vii) availability of raw materials; (viii) inflation, interest rate levels and fluctuations in exchange rates; (ix) general economic, political and business conditions and existing and future governmental regulation; and (x) the effects of competition. Please note that we disclaim any intention or obligation to update or revise any forward-looking statements whether as a result of new information, future events or otherwise.”