charting outcomes in the match - the match, national ... · pdf filecharting outcomes in the...
TRANSCRIPT
Charting Outcomes in the MatchSpecialties Matching Service®, Appointment Year 2011Characteristics of Applicants Who Matched to Their Preferred Specialty
1st Edition
Prepared by:National Resident Matching Programand Association of American Medical Colleges
May 2013
www.aamc.org www.nrmp.org

Questions about the contents of this publication may be directed to Mei Liang, Director of Research, National Resident Matching Program, (202) 618-3887 or [email protected].
Questions about the NRMP should be directed to Mona Signer, Executive Director, National Resident Matching Program, (866) 653-6767 or [email protected].
Questions about the AAMC data collections may be directed to Paul Jolly, Ph.D., Senior Director, Association of American Medical Colleges, (202) 828-0257 or [email protected].
Copyright © 2013 National Resident Matching Program and Association of American Medical Colleges. All materials subject to this copyright may be
photocopied for the purpose of nonprofit, scientific, or educational advancement.
Suggested CitationNational Resident Matching Program, Charting Outcomes in the Match, Specialties Matching
Service, Appointment Year 2011. National Resident Matching Program, Washington, DC 2013.

2011 Table of Contents
Introduction ..................................................................................................................................................... ii Summary ......................................................................................................................................................... iii Tables and Charts for All Specialties
Chart 1. Active Applicants in the Specialties Matching Service, 2011 Appointment Year ........................ 2 Table 1. Number of Applicants and Positions in the Specialties Matching Service, 2011 Appointment Year .............................................................................................................................................. 3 Chart 2. Ratio - Applicants Ranking Specialty First / Available Positions ................................................. 4 Chart 3. Match Rates ................................................................................................................................... 5 Table 2. Summary Statistics ........................................................................................................................ 6 Chart 4. Median Number of Contiguous Ranks .......................................................................................... 7 Chart 5. Mean Number of Different Specialties Ranked ............................................................................. 8 Chart 6. USMLE Step 1 Scores of Matched Applicants ............................................................................. 9 Chart 7. USMLE Step 2 Scores of Matched Applicants ........................................................................... 10 Chart 8. USMLE Step 3 Scores of Matched Applicants ........................................................................... 11 Chart 9. Mean Number of Research Experiences after Last Degree ........................................................ 12 Chart 10. Mean Number of Abstracts, Presentations, and Publications after Last Degree ....................... 13 Chart 11. Mean Number of Work Experiences after Last Degree ........................................................... 14 Chart 12. Mean Number of Volunteer Experiences after Last Degree ..................................................... 15 Chart 13. Percentage of U.S. Applicants Who are Members of AOA ...................................................... 16
Tables and Charts for Individual Specialties
Cardiovascular Disease................................................................................................................................ 17 Endocrinology, Diabetes, and Metabolism .................................................................................................. 33 Gastroenterology ........................................................................................................................................ 49 Hematology and Oncology .......................................................................................................................... 65 Infectious Disease ........................................................................................................................................ 81 Neonatal-Perinatal Medicine ....................................................................................................................... 97 Nephrology ................................................................................................................................................ 113 Pulmonary Disease and Critical Care Medicine ........................................................................................ 129 Rheumatology ............................................................................................................................................ 145
Copyright ©2013 NRMP and AAMC. Copies may be made for educational or noncommercial uses only.
Charting Outcomes in the Match, SMS, 2013i

Copyright ©2013 NRMP and AAMC. Copies may be made for educational or noncommercial uses only.
2011 Introduction
ii Charting Outcomes in the Match, SMS, 2013
The first edition of Charting Outcomes in the Match was published in August 2006 for the Main ResidencyMatch® with subsequent editions 2007, 2009, and 2011. This report, modeled after its predecessor, examinesoutcomes for selected fellowship Matches conducted by the National Resident Matching Program (NRMP).
NRMP's Specialties Matching Service® (SMS®) conducts Matches for advanced residency and fellowshippositions. Data in this report are for the 2011 appointment year and include 40 subspecialties participating in 20Matches. All specialties that participated in the Specialties Matching Service are included in the overall tables andcharts, but only specialties that offered 200 or more positions or had 200 or more applicants are reported separately.
This report is a collaboration of the National Resident Matching Program and the Association of American MedicalColleges (AAMC). Combining data from the NRMP, the AAMC’s Electronic Residency Application Service (ERAS) and other AAMC data sources, and USMLE scores from the National Board of Medical Examiners(NBME) and the Educational Commission for Foreign Medical Graduates (ECFMG), we identified ten applicantcharacteristics that contribute to match success. Probability analysis was used to evaluate the association betweenmatch success and contiguous ranks and USMLE Step scores. For the purposes of this report, success was definedas a match to the specialty of the applicant’s first-ranked program because that is assumed to be the specialty ofchoice. Lack of success includes matching to another specialty as well as failure to match at all. No distinction wasmade based on whether applicants matched to their first, second, third, or last choice program.
Four applicant groups are included in the report: U.S. allopathic medical school graduates, U.S. citizen international medical school graduates, non-U.S. citizen international medical school graduates, and graduates of osteopathicprograms. Because of the small number of applicants, the report does not include Canadian medical schoolgraduates and graduates of Fifth Pathway programs. Osteopathic applicants were excluded from some charts due tothe small number of observations.
For questions, comments or more information, please contact:
Mei Liang, Director of ResearchNational Resident Matching ProgramTel: (202) 618-3887Email: [email protected]
OrPaul Jolly, Ph.D., Senior Director, Special StudiesAssociation of American Medical CollegesTel: (202) 828-0257Email: [email protected]

iii Charting Outcomes in the Match, SMS, 2013Copyright ©2013 NRMP and AAMC. Copies may be made for educational or noncommercial uses only.
2011 Summary
Some general observations apply to all of the specialties in this report. Applicants who are successful in matching to their preferred specialty are more likely to:
· rank more programs within their preferred specialty· be U.S. graduates· have higher USMLE Step 1, Step 2, and Step 3 scores· be members of Alpha Omega Alpha Honor Medical Society (AOA)
Although some other measures seem to be related to match success for some specialties, the relationships were not consistent enough to draw broad conclusions across specialties. In addition, the data sources used for Charting Outcomes did not include other important applicant factors such as program director evaluations, reference letters, and the Medical School Performance Evaluation.
Despite the fairly strong relationship between USMLE Step scores and match success, the distributions of scores show that program directors consider other qualifications, and a high score is not a guarantee of success. Even in the least competitive specialties a few individuals with higher scores are not successful. Neither is a lower score a bar to success.
The data in this report support the following straightforward advice one should give to an applicant:
· Rank all of the programs you really want, without regard to your estimate of your chances with those programs.
· Include a mix of both highly competitive and less competitive programs within your preferred specialty.· Include all of the programs on your list where the program has expressed an interest in you and where you
would accept a position.· If you are applying to a competitive specialty and you would want to have a fellowship position in the event
you are unsuccessful in matching to a program in your preferred specialty, also rank your most preferred programs in an alternate specialty.
· Include all of your qualifications in your application, but know that you do not have to be AOA, to have the highest USMLE scores, to have publications, or to have participated in research projects to match successfully.

Tables and Charts for All Specialties
Copyright ©2013 NRMP and AAMC. Copies may be made for educational or noncommercial uses only.
1 Charting Outcomes in the Match, SMS, 2013

Copyright ©2013 NRMP and AAMC. Copies may be made for educational or noncommercial uses only.
2
Chart1
Active Applicants in the Specialties Matching Service, 2011 Appointment Yearby Applicant Type
Charting Outcomes in the Match, SMS, 2013
Source: NRMP Data Warehouse
Previous U.S. graduates
3,842 50%
Non‐U.S. international medical graduates
2,447
31%
U.S. international
medical graduates908
12%
Graduates of
OsteopathicMedical Schools
490 6%
Graduates ofCanadian
Medical Schools
46 1%
Graduates of
Fifth Pathway Programs
14 0%
Chart 1 shows the number of all active applicants who participated in the Specialties Matching Service (applicants who submitted rank order lists of programs) by applicant type.

Copyright ©2013 NRMP and AAMC. Copies may be made for educational or noncommercial uses only.
3
Table1
Summary StatisticsAll SMS Specialties Combined
Measure (n=3,259) (n=583) (n=486) (n=422)
U.S. GraduatesU.S. International
Medical Graduates
Matched Unmatched Matched Unmatched
Non-U.S. International Medical Graduates
Osteopathic Graduates
(n=1,051)(n=1,396)UnmatchedMatched
(n=162)(n=328)UnmatchedMatched
1. 7 4 6 3Mean number of contiguous ranks 6 3 5 3
2. 1 1 1 1Mean number of distinct specialties ranked
1 1 1 1
3. 222 214 214 208Mean USMLE Step 1 score n/a226 220 n/a
4. 229 216 217 209Mean USMLE Step 2 score n/a229 221 n/a
5. 217 209 207 200Mean USMLE Step 3 score n/a207 201 n/a
6. 0 0 1 1Mean number of research experiences after last degree
1 1 0 0
7. 2 3 3 4Mean number of abstracts, presentations, and publications after last degree
6 5 1 2
8. 0 0 1 1Mean number of work experiences after last degree
2 2 0 0
9. 0 0 0 0Mean number of volunteer experiences after last degree
1 1 0 1
10. 13 4Percentage who are AOA members
n/an/an/an/a n/a n/a
n/a: Not applicable or little/no reliable data were available.
Sources: Measures 1, 2, and match outcome are from the NRMP Data Warehouse; measures 3, 4, and 5 are from the AAMC Data Warehouse and from the ECFMG, both by permission of the NBME and ECFMG; measures 6-10 are from the AAMC Data Warehouse.
Note: USMLE Step 1 scores are not available for most osteopathic medical school graduates included in the independent applicant group.
Charting Outcomes in the Match, SMS, 2013
Table 1 provides summary statistics by applicant type and match outcome on the 10 measures presented in this report. This table reports on all 40 fellowship specialties with 2011 appointments. For specialties with 200 or more positions or 200 or more applicants, data on each of these measures will be displayed graphically by preferred specialty on the following pages. Of the 10 measures, only the United States Medical Licensing Examination (USMLE) scores had significant missing data. Overall, there were Step 1 scores for 91.5 percent of applicants, Step 2 scores for 91.8 percent and Step 3 scores for 73 percent of the applicants. Almost all U.S. graduates and 95 percent of U.S. IMGs and non-U.S. IMGs reported their Step 1 and Step 2 scores. Only 75 percent of U.S. graduates, 74 percent of U.S. IMGs and 83 percent of the non-U.S. IMGs reported a Step 3 scores. Almost all of the osteopathic applicants did not have any USMLE scores. They either take an alternative examination (the Comprehensive Osteopathic Medical Licensing Examination, or COMLEX-USA) or they take the USMLE exams but those data are not shared with the AAMC.

Copyright ©2013 NRMP and AAMC. Copies may be made for educational or noncommercial uses only.
4
Table2
Number of Applicants and Positions in the Specialties Matching Service, 2011 Appointment Yearby Preferred Specialty*
Table 2 provides a summary of the numbers of positions offered and applicants preferred each specialty for selected specialties for the 2011 appointment year. Only those specialties offering 200 or more positions or having 200 or more applicants are included. The numbers of applicants matched by applicant type (U.S. graduates, U.S. IMGs, non-U.S. IMGs, and osteopathic graduates) also are provided in this table.
TotalPositionsOffered
TotalNumber ofApplicants
Number ofApplicants
Per Position
U.S. International Medical Graduates
Non-U.S. International Medical Graduates OsteopathicU.S. Graduates
Preferred SpecialtyNot
MatchedNot
MatchedNot
MatchedNot
MatchedMatched Matched Matched Matched
729 1,106 1.5 425 71 62 76 201 225 28 15Cardiovascular Disease (CD)
233 341 1.5 102 16 21 28 79 74 11 7Endocrinology, Diabetes, and Metabolism (END)
383 648 1.7 251 69 26 55 68 129 16 32Gastroenterology (GE)
458 688 1.5 234 47 40 56 132 135 26 15Hematology and Oncology (HO)
314 303 1.0 124 5 31 16 94 13 14 5Infectious Disease (ID)
223 205 0.9 105 6 13 4 52 9 12 4Neonatal-Perinatal Medicine (NPM)
380 481 1.3 91 2 42 35 189 96 15 8Nephrology (NEP)
417 570 1.4 190 24 54 40 123 91 27 17Pulmonary Disease and Critical Care Medicine (PCC)
184 217 1.2 79 9 19 12 53 22 9 11Rheumatology (RHU)
*Preferred specialty is the specialty ranked first on an applicant's rank order list.Source: NRMP Data Warehouse.
Charting Outcomes in the Match, SMS, 2013

Copyright ©2013 NRMP and AAMC. Copies may be made for educational or noncommercial uses only.
5
Chart2
Ratio - Applicants Ranking Specialty First / Available Positionsby Preferred Specialty
0.0
0.5
1.0
1.5
2.0
CD END GE HO ID NPM NEP PCC RHU
0.7
0.5
0.8
0.6
0.40.5
0.2
0.5 0.5
0.2
0.2
0.2
0.2
0.10.1
0.2
0.20.2
0.6
0.7
0.5
0.6
0.3 0.3
0.8
0.5
0.4
0.10.1
0.1
0.1
0.10.1
0.1
0.1
0.1
Osteopathic Graduates Non-U.S. InternationalMedical Graduates
U.S. InternationalMedical Graduates Previous U.S. Graduates
Ap
plic
ants
per
ava
ilab
le p
osi
tio
n
Charting Outcomes in the Match, SMS, 2013
Chart 2 shows the ratios of applicants to available positions in each specialty for the four applicant types: U.S. graduates, U.S. international medical graduates, non-U.S. international medical graduates, and osteopathic graduates. Take Cardiovascular Disease for example, for each available position there were, on average, 0.7 previous U.S. graduate, 0.2 U.S. international medical graduate, 0.6 non-U.S. international medical graduate, and 0.1 osteopathic graduate who ranked the specialty first on their Rank Order List. For Infectious Disease and Neonatal-Perinatal Medicine, there were more available positions than applicants who preferred the specialty. In comparison, for each Gastronenterology or Cardiovascular Disease position there were more than 1.5 applicants who preferred that specialty.
Source: NRMP Data Warehouse
CD: Cardiovascular Disease END: Endocrinology, Diabetes, and Metabolism GE: Gastroenterology HO: Hematology and Oncology ID: Infectious Disease
NPM: Neonatal‐Perinatal Medicine NEP: Nephrology PCC: Pulmonary Disease and Critical Care Medicine RHU: Rheumatology

0
20
40
60
80
100
CD END GE HO ID NPM NEP PCC RHU
86 8678 83
96 95 9889 90
0
20
40
60
80
100
CD END GE HO ID NPM NEP PCC RHU
45 4332
42
6677
55 57 61
0
20
40
60
80
100
CD END GE HO ID NPM NEP PCC RHU
47 52
3549
88 85
6658
71
01020304050607080
CD END GE HO ID NPM NEP PCC RHU
65 61
33
6374 75
65 61
45
Previous U.S. Graduates
U.S. International Medical Graduates
Non-U.S. International Medical Graduates
Osteopathic Graduates
Copyright ©2013 NRMP and AAMC. Copies may be made for educational or noncommercial uses only.
6
Chart3
Match RatesPercent Matched by Preferred Specialty and Applicant Type
Charting Outcomes in the Match, SMS, 2013
Source: NRMP Data Warehouse
CD: Cardiovascular Disease END: Endocrinology, Diabetes, and Metabolism GE: Gastroenterology HO: Hematology and Oncology ID: Infectious Disease
NPM: Neonatal‐Perinatal Medicine NEP: Nephrology PCC: Pulmonary Disease and Critical Care Medicine RHU: Rheumatology

02468
10
CD END GE HO ID NPM NEP PCC RHU
8
4
8
5 54
5 56
3 32
35
21
23
Previous U.S. Graduates
02468
10
CD END GE HO ID NPM NEP PCC RHU
4 43
4 45 5
45
21 1 1
21
2 21
U.S. International Medical Graduates
02468
10
CD END GE HO ID NPM NEP PCC RHU
45
4 46
76 6
5
21 1 1
2 2 21
2
Non-U.S. International Medical Graduates
02468
10
CD END GE HO ID NPM NEP PCC RHU
43
23
56
54
5
21
2 24
13
43
Osteopathic Graduates
7Copyright ©2013 NRMP and AAMC. Copies may be made for educational or noncommercial uses only.
Chart4
Median Number of Contiguous Ranks by Preferred Specialty, Applicant Type, and Match Status
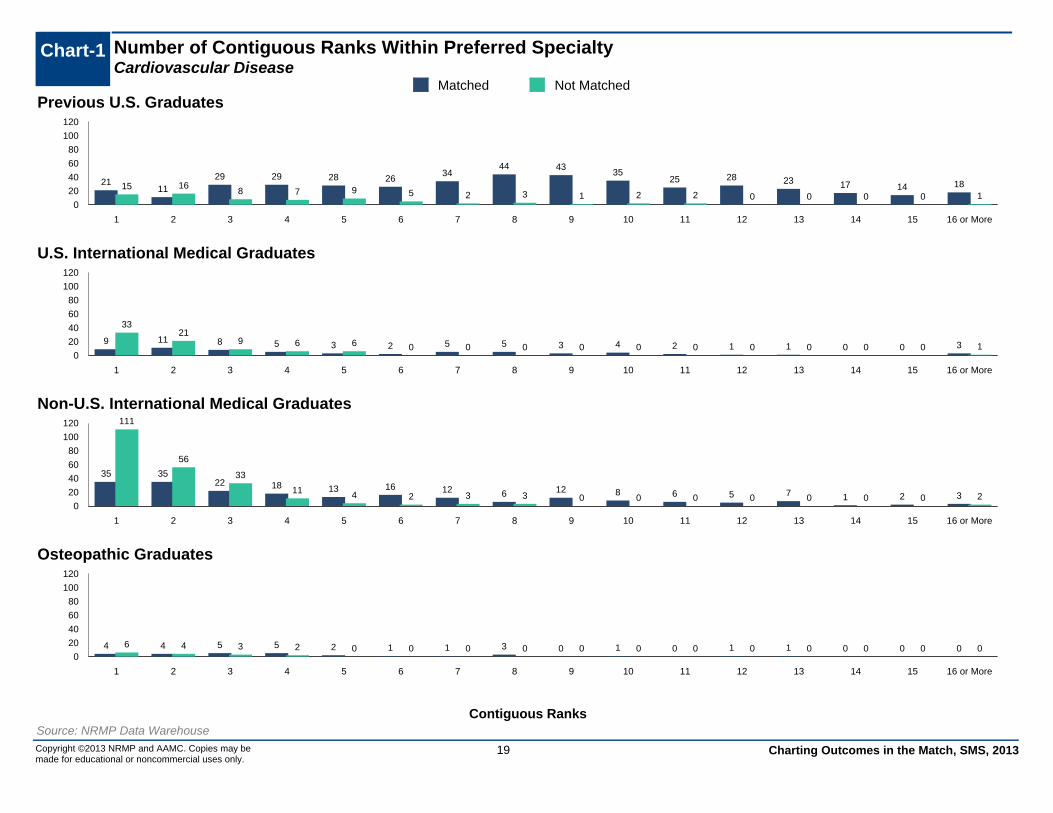
In general, applicants are more likely to be successful if they rank more programs in their desired specialty. To quantify this aspect of applicant behavior, we tallied the number of programs ranked in the first-choice specialty before a program in another specialty appeared on the applicant's rank order list. Chart 4 provides the median number of contiguous ranks by preferred specialty for each applicant type who matched and did not match. In general, matched applicants had longer contiguous ranks across the applicant types. The principal message of these graphs is that applicants with longer rank order lists are more successful than those with shorter ones.
Charting Outcomes in the Match, SMS, 2013
Matched Not Matched
Source: NRMP Data Warehouse
CD: Cardiovascular Disease END: Endocrinology, Diabetes, and Metabolism GE: Gastroenterology HO: Hematology and Oncology ID: Infectious Disease
NPM: Neonatal‐Perinatal Medicine NEP: Nephrology PCC: Pulmonary Disease and Critical Care Medicine RHU: Rheumatology

0.0
0.3
0.6
0.9
1.2
1.5
CD END GE HO ID NPM NEP PCC RHU
1.0 1.0 1.0
1.3
1.0 1.0 1.0 1.0 1.01.0 1.1 1.0
1.3
1.0 1.0 1.0 1.0 1.0
Previous U.S. Graduates
0.0
0.3
0.6
0.9
1.2
1.5
CD END GE HO ID NPM NEP PCC RHU
1.0 1.0 1.0
1.4
1.1 1.0 1.1 1.1 1.11.1 1.1 1.2 1.31.1 1.0
1.2 1.1 1.2
U.S. International Medical Graduates
0.0
0.3
0.6
0.9
1.2
1.5
CD END GE HO ID NPM NEP PCC RHU
1.0 1.0 1.0
1.5
1.0 1.0 1.0 1.1 1.11.1 1.0 1.0
1.3
1.0 1.0 1.1 1.2 1.1
Non-U.S. International Medical Graduates
0.0
0.3
0.6
0.9
1.2
1.5
CD END GE HO ID NPM NEP PCC RHU
1.0 1.0 1.1 1.21.0 1.0 1.0 1.0 1.01.0 1.0 1.0
1.3
1.0 1.0 1.1 1.1 1.0
Osteopathic Graduates
Copyright ©2013 NRMP and AAMC. Copies may be made for educational or noncommercial uses only.
8
Chart5
Mean Number of Different Specialties Rankedby Preferred Specialty, Applicant Type, and Match Status
Charting Outcomes in the Match, SMS, 2013
Most of the fellowship applicants were only interested in one specialty. However, some Matches included more than one specialty and applicants were able to apply to multiple specialties. For example, applicants could apply to both Hematology and Hematology/Oncology in the Medical Specialties Matching Program (MSMP). Applicants could also participate in different specialty Matches in the same year. Chart 5 displays the average number of different specialties ranked by applicant type, preferred specialty, and match outcome.
Matched Not Matched
Source: NRMP Data Warehouse
CD: Cardiovascular Disease END: Endocrinology, Diabetes, and Metabolism GE: Gastroenterology HO: Hematology and Oncology ID: Infectious Disease
NPM: Neonatal‐Perinatal Medicine NEP: Nephrology PCC: Pulmonary Disease and Critical Care Medicine RHU: Rheumatology

9Copyright ©2013 NRMP and AAMC. Copies may be made for educational or noncommercial uses only.
Chart6
USMLE Step 1 Scores of Matched Applicantsby Preferred Specialty and Applicant Type
180
190
200
210
220
230
240
250
260
CD END GE HO ID NPM NEP PCC RHU
Previous U.S. Graduates
180
190
200
210
220
230
240
250
260
CD END GE HO ID NPM NEP PCC RHU
U.S. International Medical Graduates
180
190
200
210
220
230
240
250
260
CD END GE HO ID NPM NEP PCC RHU
Non-U.S. International Medical Graduates
Chart 6 displays the Step 1 scores for matched applicants by specialty. The horizontal bars are the median values for successful applicants and the vertical lines show the interquartile ranges (the range of scores for applicants excluding the top and bottom quarters of the distribution). Scores generally are higher for the more competitive specialties, but there is substantial overlap when specialties are compared. Overall, previous U.S. graduates have mean USMLE Step 1 scores of 221.7 (s.d. = 19.7) and U.S. international medical graduates have mean scores of 212.4 (s.d. = 18.5), and non-U.S. international medical graduates have mean scores 223.6 (s.d.=18.8).
Note: Step 1 scores are not available for the majority of Osteopathic graduates.Sources: NRMP Data Warehouse and AAMC Data Warehouse. USMLE scores by permission of the NBME and ECFMG.
Charting Outcomes in the Match, SMS, 2013
CD: Cardiovascular Disease END: Endocrinology, Diabetes, and Metabolism GE: Gastroenterology HO: Hematology and Oncology ID: Infectious Disease
NPM: Neonatal‐Perinatal Medicine NEP: Nephrology PCC: Pulmonary Disease and Critical Care Medicine RHU: Rheumatology

Copyright ©2013 NRMP and AAMC. Copies may be made for educational or noncommercial uses only.
10
Chart7
USMLE Step 2 Scores of Matched Applicantsby Preferred Specialty and Applicant Type
180
190
200
210
220
230
240
250
260
CD END GE HO ID NPM NEP PCC RHU
Previous U.S. Graduates
180
190
200
210
220
230
240
250
260
CD END GE HO ID NPM NEP PCC RHU
U.S. International Medical Graduates
180
190
200
210
220
230
240
250
260
CD END GE HO ID NPM NEP PCC RHU
Non-U.S. International Medical Graduates
Chart 7 shows the Step 2 scores for matched applicants by preferred specialty. The horizontal bars are the median values for successful applicants and the vertical lines show the interquartile ranges. As was the case for the Step 1 scores, the more competitive specialties have higher average Step 2 scores. Overall, U.S. graduate applicants had mean USMLE step 2 scores of 227.6 (s.d. = 21.6) and U.S. international medical graduates and non-U.S. international medical gradutes had mean scores of 214.4 (s.d. = 20) and 226.3 (s.d.=20.8) respectively.
Note: Step 2 scores are not available for the majority of Osteopathic graduates.Sources: NRMP Data Warehouse and AAMC Data Warehouse. USMLE scores by permission of the NBME and ECFMG.
Charting Outcomes in the Match, SMS, 2013
CD: Cardiovascular Disease END: Endocrinology, Diabetes, and Metabolism GE: Gastroenterology HO: Hematology and Oncology ID: Infectious Disease
NPM: Neonatal‐Perinatal Medicine NEP: Nephrology PCC: Pulmonary Disease and Critical Care Medicine RHU: Rheumatology

180
190
200
210
220
230
240
250
260
CD END GE HO ID NPM NEP PCC RHU
Previous U.S. Graduates
180
190
200
210
220
230
240
250
260
CD END GE HO ID NPM NEP PCC RHU
U.S. International Medical Graduates
180
190
200
210
220
230
240
250
260
CD END GE HO ID NPM NEP PCC RHU
Non-U.S. International Medical Graduates
Charting Outcomes in the Match, SMS, 201311Copyright ©2013 NRMP and AAMC. Copies may be made for educational or noncommercial uses only.
Chart 8 shows the Step 3 scores for matched applicants by preferred specialty. The horizontal bars are the median values for successful applicants and the vertical lines show the interquartile ranges. Overall, U.S. graduate applicants had mean USMLE step 3 scores of 216.2 (s.d. = 16) and U.S. international medical graduates and non-U.S. international medical gradutes had mean scores of 204.9 (s.d. = 14) and 204.7 (s.d.= 14) respectively.
Note: Step 3 scores are not available for the majority of Osteopathic graduates.Sources: NRMP Data Warehouse and AAMC Data Warehouse. USMLE scores by permission of the NBME and ECFMG.
USMLE Step 3 Scores of Matched Applicantsby Preferred Specialty and Applicant Type
Chart8
CD: Cardiovascular Disease END: Endocrinology, Diabetes, and Metabolism GE: Gastroenterology HO: Hematology and Oncology ID: Infectious Disease
NPM: Neonatal‐Perinatal Medicine NEP: Nephrology PCC: Pulmonary Disease and Critical Care Medicine RHU: Rheumatology

0.00.51.01.52.02.5
CD END GE HO ID NPM NEP PCC RHU
0.4 0.2 0.4 0.3 0.3 0.1 0.2 0.3 0.20.3 0.4 0.3 0.30.6
0.2 0.3 0.4
Previous U.S. Graduates
0.00.51.01.52.02.5
CD END GE HO ID NPM NEP PCC RHU
0.9 0.7 0.81.2
0.6 0.8 0.60.3 0.50.7 0.5 0.7 0.8
0.1
1.00.7
0.3 0.5
U.S. International Medical Graduates
0.00.51.01.52.02.5
CD END GE HO ID NPM NEP PCC RHU
1.40.9
1.3 1.30.8 0.7 0.9 0.9 0.91.1
0.8 0.9 1.10.7
0.4 0.6 0.70.3
Non-U.S. International Medical Graduates
0.00.51.01.52.02.5
CD END GE HO ID NPM NEP PCC RHU
0.4 0.30.6
0.2 0.2 0.1 0.3 0.1 0.20.7 0.6 0.5 0.3
0.0 0.0 0.1 0.2 0.0
Osteopathic Graduates
Copyright ©2013 NRMP and AAMC. Copies may be made for educational or noncommercial uses only.
12
Chart9
Mean Number of Research Experiences After Last Degreeby Preferred Specialty, Applicant Type, and Match Status
The ERAS application allows applicants to self-report their participation in research projects. These experiences are not verified nor evaluated and may vary greatly. Chart 9 shows the average number of research experiences after they received their most recent degree by applicant type, preferred specialty, and match outcome.U.S. graduates averaged 0.3 research experiences with 72.0 percent reporting at least one experience. U.S. international medical graduates and non-U.S. international medical graduates both reported, on average, more experiences (0.7 and 1.0), and larger percentages (89.3% and 88.3%) listed having any research
Charting Outcomes in the Match, SMS, 2013
Matched Not Matched
Sources: NRMP Data Warehouse and AAMC Data Warehouse
CD: Cardiovascular Disease END: Endocrinology, Diabetes, and Metabolism GE: Gastroenterology HO: Hematology and Oncology ID: Infectious Disease
NPM: Neonatal‐Perinatal Medicine NEP: Nephrology PCC: Pulmonary Disease and Critical Care Medicine RHU: Rheumatology

0369
1215
CD END GE HO ID NPM NEP PCC RHU
2.5 1.32.7 1.7 1.9 0.8 1.2 1.6 1.31.7 1.1
2.6 1.8 1.2 0.3 1.0 1.5 0.4
Previous U.S. Graduates
0369
1215
CD END GE HO ID NPM NEP PCC RHU
4.71.6
5.8 4.52.7 3.5 2.6 2.3 1.7
5.53.4 4.5 3.7
1.8 0.82.5 2.5 1.9
U.S. International Medical Graduates
0369
1215
CD END GE HO ID NPM NEP PCC RHU
8.56.9
8.8 7.64.8 3.5
4.9 4.0 4.46.3
3.65.5 5.6
3.40.7
3.0 3.7 3.2
Non-U.S. International Medical Graduates
0369
1215
CD END GE HO ID NPM NEP PCC RHU
2.3 1.95.0
1.53.1
0.6 0.9 1.90.41.2 2.0
3.7 2.5 1.2 0.01.6 0.9 2.0
Osteopathic Graduates
Copyright ©2013 NRMP and AAMC. Copies may be made for educational or noncommercial uses only.
13
Chart10
Mean Number of Abstracts, Presentations, and Publications After Last Degreeby Preferred Specialty, Applicant Type, and Match Status
The ERAS application also permits applicants to list their publications. This information is self-reported and may include peer-reviewed articles, abstracts, poster sessions, and invited national or regional presentations. Some residency programs may independently verify and even review publications for applicants in whom they have an interest, but most probably do not. Many applicants report abstracts, presentations, or publications, sometimes dozens or even hundreds. Overall, the U.S. graduates reported an average of 2.7 publications, U.S. international medical graduates reported 3.8 and non-U.S. international medical graduates 5.5 publications. Chart 10 shows the average number of publications by applicant type, preferred specialty, and match outcome.
Charting Outcomes in the Match, SMS, 2013
Matched Not Matched
Sources: NRMP Data Warehouse and AAMC Data Warehouse
CD: Cardiovascular Disease END: Endocrinology, Diabetes, and Metabolism GE: Gastroenterology HO: Hematology and Oncology ID: Infectious Disease
NPM: Neonatal‐Perinatal Medicine NEP: Nephrology PCC: Pulmonary Disease and Critical Care Medicine RHU: Rheumatology

Copyright ©2013 NRMP and AAMC. Copies may be made for educational or noncommercial uses only.
14
Chart11
Mean Number of Work Experiences after Last Degreeby Preferred Specialty, Applicant Type, and Match Status
Chart 11 shows the average number of work experiences reported on the ERAS application by applicant type, preferred specialty, and match outcome. Overall, non-U.S. international medical graduates had an average of 2.1 work experiences after they obtained their last degree, highest among the applicant types. U.S. graduates had the least, 0.2.
Charting Outcomes in the Match, SMS, 2013
012345
CD END GE HO ID NPM NEP PCC RHU
0.2 0.1 0.1 0.1 0.2 0.2 0.1 0.2 0.20.30.9
0.3 0.4 0.80.3 0.0 0.3 0.0
Previous U.S. Graduates
012345
CD END GE HO ID NPM NEP PCC RHU
1.0 1.20.6 0.7
1.3 0.9 0.9 0.7 0.91.1 1.1 1.1 0.91.6
4.5
1.2 1.52.1
U.S. International Medical Graduates
012345
CD END GE HO ID NPM NEP PCC RHU
2.0 2.11.6 1.9
2.4 2.2 2.3 2.0 1.82.1 2.0 2.1 2.12.7
1.72.5 2.5
1.8
Non-U.S. International Medical Graduates
012345
CD END GE HO ID NPM NEP PCC RHU
0.2 0.3 0.1 0.1 0.1 0.2 0.2 0.0 0.00.10.6 0.3 0.0 0.0 0.3 0.1 0.4 0.0
Osteopathic Graduates
Matched Not Matched
Sources: NRMP Data Warehouse and AAMC Data Warehouse
CD: Cardiovascular Disease END: Endocrinology, Diabetes, and Metabolism GE: Gastroenterology HO: Hematology and Oncology ID: Infectious Disease
NPM: Neonatal‐Perinatal Medicine NEP: Nephrology PCC: Pulmonary Disease and Critical Care Medicine RHU: Rheumatology

Copyright ©2013 NRMP and AAMC. Copies may be made for educational or noncommercial uses only.
15
Chart12
Mean Number of Volunteer Experiences after Last Degreeby Preferred Specialty, Applicant Type, and Match Status
Chart 12 provides the average number of volunteer experiences after their last degree reported on the ERAS application by applicant type, preferred specialty, and match outcome. U.S. Overall, U.S. graduates had an average of 0.36 volunteer experiences, the least among the four applicant types, and non-U.S. international medical graduates had the most, 0.76.
Charting Outcomes in the Match, SMS, 2013
0.0
0.5
1.0
1.5
2.0
CD END GE HO ID NPM NEP PCC RHU
0.4 0.3 0.2 0.20.4 0.4
0.2 0.3 0.30.5
0.20.4 0.3
0.0 0.0 0.00.2 0.2
Previous U.S. Graduates
0.0
0.5
1.0
1.5
2.0
CD END GE HO ID NPM NEP PCC RHU
0.40.7
0.4 0.3 0.4
1.3
0.30.6
0.40.6
0.4 0.5 0.50.3
1.5
0.10.5
0.8
U.S. International Medical Graduates
0.0
0.5
1.0
1.5
2.0
CD END GE HO ID NPM NEP PCC RHU
0.8 0.80.6
0.8 0.8 0.7 0.7 0.8 0.70.7 0.70.5
0.7 0.7 0.7 0.70.9 0.8
Non-U.S. International Medical Graduates
0.0
0.5
1.0
1.5
2.0
CD END GE HO ID NPM NEP PCC RHU
0.3
0.8
0.3 0.2 0.30.6
0.3 0.20.4
0.6
0.1
0.7
0.20.4 0.3
0.9
0.3
1.2
Osteopathic Graduates
Matched Not Matched
Sources: NRMP Data Warehouse and AAMC Data Warehouse
CD: Cardiovascular Disease END: Endocrinology, Diabetes, and Metabolism GE: Gastroenterology HO: Hematology and Oncology ID: Infectious Disease
NPM: Neonatal‐Perinatal Medicine NEP: Nephrology PCC: Pulmonary Disease and Critical Care Medicine RHU: Rheumatology

Copyright ©2013 NRMP and AAMC. Copies may be made for educational or noncommercial uses only.
16
Chart13
Percentage of U.S. Graduates Who are Members of AOAby Preferred Specialty and Match Status
0
5
10
15
20
25
30
CD END GE HO ID NPM NEP PCC RHU
2221
15
23
15
1314
18
15
4
6 6
4
0
17
0
4
0
Matched Not Matched
Per
cen
t o
f A
OA
mem
ber
s
Membership in Alpha Omega Alpha (AOA), the national medical honor society, is an honor reserved for students with high academic achievement. AOA membership is limited to students in medical schools that sponsor an AOA chapter. Most, but not all, allopathic schools in the U.S. and Canada participate, and there is one foreign chapter in Beirut. Among the independent applicants, only graduate U.S. physicians, Canadians, and a small number of others could legitimately claim membership. For that reason, AOA status for each specialty in Chart 13 is reported only for U.S. graduates.
Data on AOA membership are self-reported on the ERAS application. Even for U.S. graduates, however, an analysis of its relationship with success in the Match is limited by the relatively small number of applicants who are members, by the fact that some schools do not have AOA chapters. Overall, 12.3 percent of U.S. graduates included in this report claimed AOA membership on their ERAS application. Among applicants who matched to their preferred specialty, 13.8 percent reported AOA membership, compared to 4.5 percent of unmatched applicants.
Charting Outcomes in the Match, SMS, 2013
Sources: NRMP Data Warehouse and AAMC ERAS Data Warehouse.
CD: Cardiovascular Disease END: Endocrinology, Diabetes, and Metabolism GE: Gastroenterology HO: Hematology and Oncology ID: Infectious Disease
NPM: Neonatal‐Perinatal Medicine NEP: Nephrology PCC: Pulmonary Disease and Critical Care Medicine RHU: Rheumatology

Cardiovascular Disease

Table-1 Summary StatisticsCardiovascular Disease
Measure (n=425) (n=71) (n=62) (n=76)
Previous U.S. Graduates
U.S.International Medical Graduates
Matched Unmatched Matched Unmatched(n=225)(n=201)
UnmatchedMatched
Non-U.S. InternationalMedical Graduates
(n=15)(n=28)UnmatchedMatched
Osteopathic Graduates
68 4 2Mean number of contiguous ranks1. 5 2 5 2
11 1 1Mean number of distinct specialties ranked2. 1 1 1 1
224226 209 212Mean USMLE Step 1 score3. 231 224 n/an/a
226233 212 212Mean USMLE Step 2 score4. 234 223 n/an/a
212221 209 203Mean USMLE Step 3 score5. 210 203 n/an/a
10 0 1Mean number of research experiences6. 1 1 0 1
53 2 6Mean number of abstracts, presentations, and publications
7. 9 6 2 1
10 0 1Mean number of work experiences8. 2 2 0 0
00 1 1Mean number of volunteer experiences9. 1 1 0 1
22 4Percentage who are AOA members n/a n/a10. n/an/a n/an/a
n/a: The measure either does not apply to, applies to only a small percentage of, or no reliable data were available for this type of applicants.Note: USMLE Step scores are not available for most osteopathic medical school graduates.
Sources: Measures 1, 2, and match outcome are from the NRMP Data Warehouse; measures 3, 4, and 5 are from the AAMC Data Warehouse and from the ECFMG, both by permission of the NBME and ECFMG; and measures 6-10 are from the AAMC Data Warehouse.
Charting Outcomes in the Match, SMS, 201318Copyright ©2013 NRMP and AAMC. Copies may be made for educational or noncommercial uses only.
Source: NRMP Data Warehouse
0
20
40
60
80
100
120
1 2 3 4 5 6 7 8 9 10 11 12 13 14 15 16 or More
2111
29 29 28 2634
44 4335
25 28 23 17 14 1815 168 7 9 5 2 3 1 2 2 0 0 0 0 1
Previous U.S. Graduates
0
20
40
60
80
100
120
1 2 3 4 5 6 7 8 9 10 11 12 13 14 15 16 or More
9 11 8 5 3 2 5 5 3 4 2 1 1 0 0 3
3321
9 6 6 0 0 0 0 0 0 0 0 0 0 1
U.S. International Medical Graduates
0
20
40
60
80
100
120
1 2 3 4 5 6 7 8 9 10 11 12 13 14 15 16 or More
35 3522 18 13 16 12 6 12 8 6 5 7 1 2 3
111
56
33
11 4 2 3 3 0 0 0 0 0 0 0 2
Non-U.S. International Medical Graduates
0
20
40
60
80
100
120
1 2 3 4 5 6 7 8 9 10 11 12 13 14 15 16 or More
4 4 5 5 2 1 1 3 0 1 0 1 1 0 0 06 4 3 2 0 0 0 0 0 0 0 0 0 0 0 0
Osteopathic Graduates
Chart-1 Number of Contiguous Ranks Within Preferred SpecialtyCardiovascular Disease
Copyright ©2013 NRMP and AAMC. Copies may be made for educational or noncommercial uses only.
Source: NRMP Data Warehouse
Charting Outcomes in the Match, SMS, 2013
Contiguous Ranks
Matched Not Matched
19
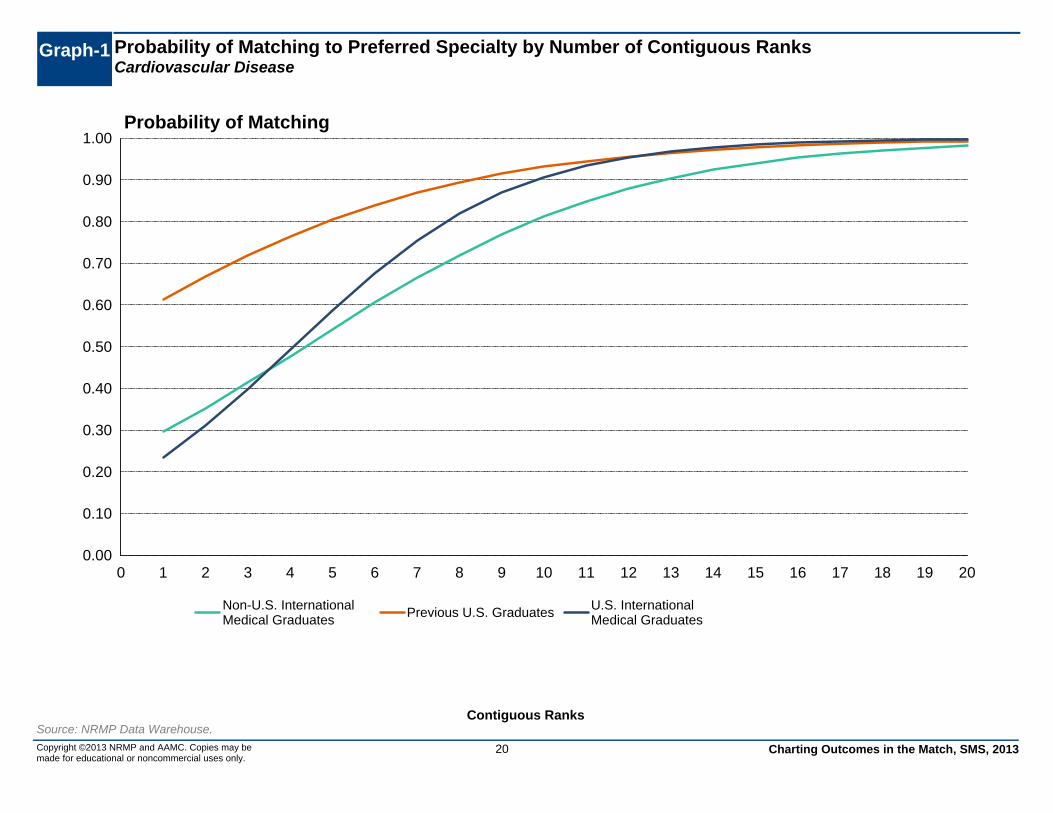
Graph-1 Probability of Matching to Preferred Specialty by Number of Contiguous RanksCardiovascular Disease
0.00
0.10
0.20
0.30
0.40
0.50
0.60
0.70
0.80
0.90
1.00
0 1 2 3 4 5 6 7 8 9 10 11 12 13 14 15 16 17 18 19 20
Non-U.S. InternationalMedical Graduates
Previous U.S. Graduates U.S. InternationalMedical Graduates
Probability of Matching
Copyright ©2013 NRMP and AAMC. Copies may be made for educational or noncommercial uses only.
Source: NRMP Data Warehouse.
20 Charting Outcomes in the Match, SMS, 2013
Contiguous Ranks

Chart-2 Number of Distinct Specialties RankedCardiovascular Disease
0
100
200
300
400
500
600
1 2 3 4 or More
424
1 0 070
1 0 0
Previous U.S. Graduates
0
100
200
300
400
500
600
1 2 3 4 or More
620 0 0
713 2 0
U.S. International Medical Graduates
0
100
200
300
400
500
600
1 2 3 4 or More
194
6 1 0
211
11 3 0
Non-U.S. International Medical Graduates
0
100
200
300
400
500
600
1 2 3 4 or More
27 1 0 015 0 0 0
Osteopathic Graduates
Copyright ©2013 NRMP and AAMC. Copies may be made for educational or noncommercial uses only.
Source: NRMP Data Warehouse
21 Charting Outcomes in the Match, SMS, 2013
Distinct Specialties Ranked
Matched Not Matched

Chart-3 USMLE Step 1 ScoresCardiovascular Disease
0
10
20
30
40
50
60
70
80
<= 180 Between 181 and190
Between 191 and200
Between 201 and210
Between 211 and220
Between 221 and230
Between 231 and240
Between 241 and250
Between 251 and260
>260 Score Unknown
0
13
34
52
76
58
79
55
39
136
0
1019
11 913
3 3 1 0 2
Previous U.S. Graduates
0
10
20
30
40
50
60
70
80
<= 180 Between 181 and190
Between 191 and200
Between 201 and210
Between 211 and220
Between 221 and230
Between 231 and240
Between 241 and250
Between 251 and260
>260 Score Unknown
0 3 4 412 12
17
72 0 11
714 12
1810
62 1 1 4
U.S. International Medical Graduates
0
10
20
30
40
50
60
70
80
<= 180 Between 181 and190
Between 191 and200
Between 201 and210
Between 211 and220
Between 221 and230
Between 231 and240
Between 241 and250
Between 251 and260
>260 Score Unknown
04 7
15
26
3741 38
20
5 80
13 14
2935
50
31 31
17
2 3
Non-U.S. International Medical Graduates
Copyright ©2013 NRMP and AAMC. Copies may be made for educational or noncommercial uses only.
Source: NRMP Data Warehouse and AAMC Data Warehouse. USMLE scores by permission of the NBME and ECFMG.
22 Charting Outcomes in the Match, SMS, 2013
Step 1 Scores
Matched Not Matched

Graph-2 Probability of Matching to Preferred Specialty by USMLE Step 1 ScoreCardiovascular Disease
0.00
0.10
0.20
0.30
0.40
0.50
0.60
0.70
0.80
0.90
1.00
160 180 200 220 240 260 280
Non-U.S. InternationalMedical Graduates Previous U.S. Graduates
U.S. InternationalMedical Graduates
Probability of Matching
Copyright ©2013 NRMP and AAMC. Copies may be made for educational or noncommercial uses only.
Source: NRMP Data Warehouse and AAMC Data Warehouse. USMLE scores by permission of the NBME and ECFMG. Note: Probabilities calculated based on 2009-2011 applicants.
23 Charting Outcomes in the Match, SMS, 2013
Step 1 Scores

Chart-4 USMLE Step 2 ScoresCardiovascular Disease
0
10
20
30
40
50
60
70
80
<= 180 Between 181and 190
Between 191and 200
Between 201and 210
Between 211and 220
Between 221and 230
Between 231and 240
Between 241and 250
Between 251and 260
>260 Score Unknown
0
2014
33
69
57
67 65
5446
028 11
15 14 12
1 3 2 2 1
Previous U.S. Graduates
0
10
20
30
40
50
60
70
80
<= 180 Between 181and 190
Between 191and 200
Between 201and 210
Between 211and 220
Between 221and 230
Between 231and 240
Between 241and 250
Between 251and 260
>260 Score Unknown
04 6 7 7 10 10 11
4 2 108 11
16 14 124 6
1 04
U.S. International Medical Graduates
0
10
20
30
40
50
60
70
80
<= 180 Between 181and 190
Between 191and 200
Between 201and 210
Between 211and 220
Between 221and 230
Between 231and 240
Between 241and 250
Between 251and 260
>260 Score Unknown
04
11 1120
28
3944
23
138
411
2226
38 36 38
21 20
6 3
Non-U.S. International Medical Graduates
Copyright ©2013 NRMP and AAMC. Copies may be made for educational or noncommercial uses only.
Source: NRMP Data Warehouse and AAMC Data Warehouse. USMLE scores by permission of the NBME and ECFMG.24 Charting Outcomes in the Match, SMS, 2013
Step 2 Scores
Matched Not Matched

Charting Outcomes in the Match, SMS, 2013Copyright ©2013 NRMP and AAMC. Copies may be made for educational or noncommercial uses only.
Source: NRMP Data Warehouse and AAMC Data Warehouse. USMLE scores by permission of the NBME and ECFMG. Note: Probabilities calculated based on 2009-2011 applican
Probability of Matching to Preferred Specialty by USMLE Step 2 ScoreCardiovascular Disease
Graph-3
0.00
0.10
0.20
0.30
0.40
0.50
0.60
0.70
0.80
0.90
1.00
160 180 200 220 240 260 280
Non-U.S. InternationalMedical Graduates Previous U.S. Graduates
U.S. InternationalMedical Graduates
Probability of Matching
25
Step 2 Scores

26 Charting Outcomes in the Match, SMS, 2013Copyright ©2013 NRMP and AAMC. Copies may be made for educational or noncommercial uses only.
Source: NRMP Data Warehouse and AAMC Data Warehouse. USMLE scores by permission of the NBME and ECFMG.
Step 3 Scores
Chart-5 USMLE Step 3 ScoresCardiovascular Disease
0
20
40
60
80
100
120
140
160
<= 180 Between 181and 190
Between 191and 200
Between 201and 210
Between 211and 220
Between 221and 230
Between 231and 240
Between 241and 250
Between 251and 260
>260 Score Unknown
0 3
2945
60 5840
19 151
155
1 8 7 12 5 8 3 2 1 0
24
Previous U.S. Graduates
0
20
40
60
80
100
120
140
160
<= 180 Between 181and 190
Between 191and 200
Between 201and 210
Between 211and 220
Between 221and 230
Between 231and 240
Between 241and 250
Between 251and 260
>260 Score Unknown
0 4 5 10 13 7 3 1 0 0
19
012 13 16 13
1 2 0 0 0
19
U.S. International Medical Graduates
0
20
40
60
80
100
120
140
160
<= 180 Between 181and 190
Between 191and 200
Between 201and 210
Between 211and 220
Between 221and 230
Between 231and 240
Between 241and 250
Between 251and 260
>260 Score Unknown
110
36 42 3523
10 5 0 0
39
2
34
5945
27 237 0 0 0
28
Non-U.S. International Medical Graduates
Matched Not Matched

Graph-4 Probability of Matching to Preferred Specialty by USMLE Step 3 ScoreCardiovascular Disease
Charting Outcomes in the Match, SMS, 2013Copyright ©2013 NRMP and AAMC. Copies may be made for educational or noncommercial uses only.
Source: NRMP Data Warehouse and AAMC Data Warehouse. USMLE scores by permission of the NBME and ECFMG. Note: Probabilities calculated based on 2009-2011 applican
0.00
0.10
0.20
0.30
0.40
0.50
0.60
0.70
0.80
0.90
1.00
160 180 200 220 240 260 280
Non-U.S. InternationalMedical Graduates Previous U.S. Graduates U.S. International
Medical Graduates
Probability of Matching
27
Step 3 Scores

Chart-6 Number of Research ProjectsCardiovascular Disease
0
50
100
150
200
250
300
None 1 2 3 4 5 or More
298
96
223 5 1
55
9 5 0 0 2
Previous U.S. Graduates
0
50
100
150
200
250
300
None 1 2 3 4 5 or More
31 15 12 1 1 243
213 6 2 1
U.S. International Medical Graduates
0
50
100
150
200
250
300
None 1 2 3 4 5 or More
8154
30 16 6 14
112
5730
9 3 14
Non-U.S. International Medical Graduates
0
50
100
150
200
250
300
None 1 2 3 4 5 or More
19 7 2 0 0 010 3 1 0 0 1
Osteopathic Graduates
Copyright ©2013 NRMP and AAMC. Copies may be made for educational or noncommercial uses only.
Source: NRMP Data Warehouse and AAMC Data Warehouse
28 Charting Outcomes in the Match, SMS, 2013
Research Projects
Matched Not Matched

Chart-7 Number of Abstracts, Presentations, and PublicationsCardiovascular Disease
0
20
40
60
80
100
120
140
None 1 2 3 4 5 or More
120
8674
47
28
70
31
8 13 6 5 8
Previous U.S. Graduates
0
20
40
60
80
100
120
140
None 1 2 3 4 5 or More
11 11 10 7 61714 7 8 7 5
35
U.S. International Medical Graduates
0
20
40
60
80
100
120
140
None 1 2 3 4 5 or More
18 14 15 15 12
127
3626 22 23
14
104
Non-U.S. International Medical Graduates
0
20
40
60
80
100
120
140
None 1 2 3 4 5 or More
7 5 5 6 1 46 6 0 1 1 1
Osteopathic Graduates
Copyright ©2013 NRMP and AAMC. Copies may be made for educational or noncommercial uses only.
Source: NRMP Data Warehouse and AAMC Data Warehouse29 Charting Outcomes in the Match, SMS, 2013
Publications
Matched Not Matched

Chart-8 Number of Work ExperiencesCardiovascular Disease
0
20
40
60
80
100
None 1 2 3 4 5 or More
377
34
82 1 3
58
7 3 1 0 2
Previous U.S. Graduates
0
20
40
60
80
100
None 1 2 3 4 5 or More
32
156 6 1 2
40
148 8
1 5
U.S. International Medical Graduates
0
20
40
60
80
100
None 1 2 3 4 5 or More
5646
30 35
1024
5949 51
21 1926
Non-U.S. International Medical Graduates
0
20
40
60
80
100
None 1 2 3 4 5 or More
25
2 0 1 0 013
2 0 0 0 0
Osteopathic Graduates
Copyright ©2013 NRMP and AAMC. Copies may be made for educational or noncommercial uses only.
Source: NRMP Data Warehouse and AAMC Data Warehouse30 Charting Outcomes in the Match, SMS, 2013
Work Experiences
Matched Not Matched

Chart-9 Number of Volunteer ExperiencesCardiovascular Disease
0
80
160
240
320
400 366
5719 6 1 0 1 0 0 0 0
77
9 1 1 0 1 0 1 1 0 0
None 1 2 3 4 5 6 7 8 9 10 or More
Previous U.S. Graduates
0
80
160
240
320
400
31 8 3 0 0 0 0 0 0 0 0
5613 8 0 1 1 0 0 0 0 2
None 1 2 3 4 5 6 7 8 9 10 or More
U.S. International Medical Graduates
0
80
160
240
320
400
117
42 21 6 3 3 0 0 0 0 0
156
6327 11 2 2 0 1 0 0 0
None 1 2 3 4 5 6 7 8 9 10 or More
Non-U.S. International Medical Graduates
0
80
160
240
320
400
20 5 0 0 0 0 1 0 0 0 022 1 0 0 0 0 0 0 0 0 0
None 1 2 3 4 5 6 7 8 9 10 or More
Osteopathic Graduates
Copyright ©2013 NRMP and AAMC. Copies may be made for educational or noncommercial uses only.
Source: NRMP Data Warehouse and AAMC Data Warehouse31 Charting Outcomes in the Match, SMS, 2013
Volunteer Experiences
Matched Not Matched

Chart-10
Percentage of U.S. Graduates Who are Members of AOACardiovascular Disease
0
50
100
150
200
250
300
350
No Yes
332
9367
3
Matched Not Matched
AOA Membership
Sources: NRMP Data Warehouse and AAMC Data Warehouse
Copyright ©2013 NRMP and AAMC. Copies may be made for educational or noncommercial uses only.
32 Charting Outcomes in the Match, SMS, 2013

Endocrinology, Diabetes, and Metabolism

Table-1 Summary StatisticsEndocrinology, Diabetes, and Metabolism
Measure (n=102) (n=16) (n=21) (n=28)
Previous U.S. Graduates
U.S.International Medical Graduates
Matched Unmatched Matched Unmatched(n=74)(n=79)
UnmatchedMatched
Non-U.S. InternationalMedical Graduates
(n=7)(n=11)UnmatchedMatched
Osteopathic Graduates
45 3 2Mean number of contiguous ranks1. 6 2 4 2
11 1 1Mean number of distinct specialties ranked2. 1 1 1 1
215222 205 208Mean USMLE Step 1 score3. 226 218 n/an/a
216231 209 206Mean USMLE Step 2 score4. 230 221 n/an/a
205223 204 198Mean USMLE Step 3 score5. 210 202 n/an/a
10 0 1Mean number of research experiences6. 1 1 0 1
21 1 3Mean number of abstracts, presentations, and publications
7. 7 4 2 2
10 1 1Mean number of work experiences8. 2 2 0 1
10 0 0Mean number of volunteer experiences9. 1 1 1 0
21 6Percentage who are AOA members n/a n/a10. n/an/a n/an/a
n/a: The measure either does not apply to, applies to only a small percentage of, or no reliable data were available for this type of applicants.Note: USMLE Step scores are not available for most osteopathic medical school graduates.
Sources: Measures 1, 2, and match outcome are from the NRMP Data Warehouse; measures 3, 4, and 5 are from the AAMC Data Warehouse and from the ECFMG, both by permission of the NBME and ECFMG; and measures 6-10 are from the AAMC Data Warehouse.
Charting Outcomes in the Match, SMS, 201334Copyright ©2013 NRMP and AAMC. Copies may be made for educational or noncommercial uses only.
Source: NRMP Data Warehouse

0
20
40
60
80
100
120
1 2 3 4 5 6 7 8 9 10 11 12 13 14 15 16 or More
20 13 8 12 12 7 6 5 3 4 2 3 1 1 1 45 2 3 1 4 1 0 0 0 0 0 0 0 0 0 0
Previous U.S. Graduates
0
20
40
60
80
100
120
1 2 3 4 5 6 7 8 9 10 11 12 13 14 15 16 or More
3 3 3 5 2 2 0 1 1 1 0 0 0 0 0 016
7 3 0 1 0 1 0 0 0 0 0 0 0 0 0
U.S. International Medical Graduates
0
20
40
60
80
100
120
1 2 3 4 5 6 7 8 9 10 11 12 13 14 15 16 or More
165 9 8 4 5 4 9 6 6 2 1 0 2 0 2
40
176 6 1 1 1 1 0 0 0 0 0 0 0 1
Non-U.S. International Medical Graduates
0
20
40
60
80
100
120
1 2 3 4 5 6 7 8 9 10 11 12 13 14 15 16 or More
3 1 3 1 1 1 0 0 0 0 0 0 1 0 0 04 0 1 1 1 0 0 0 0 0 0 0 0 0 0 0
Osteopathic Graduates
Chart-1 Number of Contiguous Ranks Within Preferred SpecialtyEndocrinology, Diabetes, and Metabolism
Copyright ©2013 NRMP and AAMC. Copies may be made for educational or noncommercial uses only.
Source: NRMP Data Warehouse
Charting Outcomes in the Match, SMS, 2013
Contiguous Ranks
Matched Not Matched
35

Graph-1 Probability of Matching to Preferred Specialty by Number of Contiguous RanksEndocrinology, Diabetes, and Metabolism
0.00
0.10
0.20
0.30
0.40
0.50
0.60
0.70
0.80
0.90
1.00
0 1 2 3 4 5 6 7 8 9 10 11 12 13 14 15 16 17 18 19 20
Non-U.S. InternationalMedical Graduates
Previous U.S. Graduates U.S. InternationalMedical Graduates
Probability of Matching
Copyright ©2013 NRMP and AAMC. Copies may be made for educational or noncommercial uses only.
Source: NRMP Data Warehouse.
36 Charting Outcomes in the Match, SMS, 2013
Contiguous Ranks

Chart-2 Number of Distinct Specialties RankedEndocrinology, Diabetes, and Metabolism
0
100
200
300
400
500
600
1 2 3 4 or More
102
0 0 015 1 0 0
Previous U.S. Graduates
0
100
200
300
400
500
600
1 2 3 4 or More
21 0 0 026 2 0 0
U.S. International Medical Graduates
0
100
200
300
400
500
600
1 2 3 4 or More
781 0 0
731 0 0
Non-U.S. International Medical Graduates
0
100
200
300
400
500
600
1 2 3 4 or More
11 0 0 07 0 0 0
Osteopathic Graduates
Copyright ©2013 NRMP and AAMC. Copies may be made for educational or noncommercial uses only.
Source: NRMP Data Warehouse
37 Charting Outcomes in the Match, SMS, 2013
Distinct Specialties Ranked
Matched Not Matched

Chart-3 USMLE Step 1 ScoresEndocrinology, Diabetes, and Metabolism
0
10
20
30
40
50
60
70
80
<= 180 Between 181 and190
Between 191 and200
Between 201 and210
Between 211 and220
Between 221 and230
Between 231 and240
Between 241 and250
Between 251 and260
>260 Score Unknown
05
10 12 14
25 25
6 4 1 005 2 2 4 2 1 0 0 0 0
Previous U.S. Graduates
0
10
20
30
40
50
60
70
80
<= 180 Between 181 and190
Between 191 and200
Between 201 and210
Between 211 and220
Between 221 and230
Between 231 and240
Between 241 and250
Between 251 and260
>260 Score Unknown
0 1 2 5 6 4 2 1 0 0 01 4 4 6 5 51 1 0 0 1
U.S. International Medical Graduates
0
10
20
30
40
50
60
70
80
<= 180 Between 181 and190
Between 191 and200
Between 201 and210
Between 211 and220
Between 221 and230
Between 231 and240
Between 241 and250
Between 251 and260
>260 Score Unknown
0 09 8
15 168
16
2 3 204
11 1014 12
18
40 0 1
Non-U.S. International Medical Graduates
Copyright ©2013 NRMP and AAMC. Copies may be made for educational or noncommercial uses only.
Source: NRMP Data Warehouse and AAMC Data Warehouse. USMLE scores by permission of the NBME and ECFMG.
38 Charting Outcomes in the Match, SMS, 2013
Step 1 Scores
Matched Not Matched

Graph-2 Probability of Matching to Preferred Specialty by USMLE Step 1 ScoreEndocrinology, Diabetes, and Metabolism
0.00
0.10
0.20
0.30
0.40
0.50
0.60
0.70
0.80
0.90
1.00
160 180 200 220 240 260 280
Non-U.S. InternationalMedical Graduates Previous U.S. Graduates
U.S. InternationalMedical Graduates
Probability of Matching
Copyright ©2013 NRMP and AAMC. Copies may be made for educational or noncommercial uses only.
Source: NRMP Data Warehouse and AAMC Data Warehouse. USMLE scores by permission of the NBME and ECFMG. Note: Probabilities calculated based on 2009-2011 applicants.
39 Charting Outcomes in the Match, SMS, 2013
Step 1 Scores

Chart-4 USMLE Step 2 ScoresEndocrinology, Diabetes, and Metabolism
0
10
20
30
40
50
60
70
80
<= 180 Between 181and 190
Between 191and 200
Between 201and 210
Between 211and 220
Between 221and 230
Between 231and 240
Between 241and 250
Between 251and 260
>260 Score Unknown
0 26 9
1420
1519
10 700 2 4 2 4 1 3 0 0 0 0
Previous U.S. Graduates
0
10
20
30
40
50
60
70
80
<= 180 Between 181and 190
Between 191and 200
Between 201and 210
Between 211and 220
Between 221and 230
Between 231and 240
Between 241and 250
Between 251and 260
>260 Score Unknown
0 04 2
73 4 1 0 0 03 2 5 6 3
80 0 0 0 1
U.S. International Medical Graduates
0
10
20
30
40
50
60
70
80
<= 180 Between 181and 190
Between 191and 200
Between 201and 210
Between 211and 220
Between 221and 230
Between 231and 240
Between 241and 250
Between 251and 260
>260 Score Unknown
0 15 8 11 14 14 12
7 5 22 5 513
9 12 158
3 1 1
Non-U.S. International Medical Graduates
Copyright ©2013 NRMP and AAMC. Copies may be made for educational or noncommercial uses only.
Source: NRMP Data Warehouse and AAMC Data Warehouse. USMLE scores by permission of the NBME and ECFMG.40 Charting Outcomes in the Match, SMS, 2013
Step 2 Scores
Matched Not Matched

Charting Outcomes in the Match, SMS, 2013Copyright ©2013 NRMP and AAMC. Copies may be made for educational or noncommercial uses only.
Source: NRMP Data Warehouse and AAMC Data Warehouse. USMLE scores by permission of the NBME and ECFMG. Note: Probabilities calculated based on 2009-2011 applican
Probability of Matching to Preferred Specialty by USMLE Step 2 ScoreEndocrinology, Diabetes, and Metabolism
Graph-3
0.00
0.10
0.20
0.30
0.40
0.50
0.60
0.70
0.80
0.90
1.00
160 180 200 220 240 260 280
Non-U.S. InternationalMedical Graduates Previous U.S. Graduates
U.S. InternationalMedical Graduates
Probability of Matching
41
Step 2 Scores

42 Charting Outcomes in the Match, SMS, 2013Copyright ©2013 NRMP and AAMC. Copies may be made for educational or noncommercial uses only.
Source: NRMP Data Warehouse and AAMC Data Warehouse. USMLE scores by permission of the NBME and ECFMG.
Step 3 Scores
Chart-5 USMLE Step 3 ScoresEndocrinology, Diabetes, and Metabolism
0
20
40
60
80
100
120
140
160
<= 180 Between 181and 190
Between 191and 200
Between 201and 210
Between 211and 220
Between 221and 230
Between 231and 240
Between 241and 250
Between 251and 260
>260 Score Unknown
0 0 3 1020 17 10 8 2 0
32
0 1 6 3 2 2 0 0 0 0 2
Previous U.S. Graduates
0
20
40
60
80
100
120
140
160
<= 180 Between 181and 190
Between 191and 200
Between 201and 210
Between 211and 220
Between 221and 230
Between 231and 240
Between 241and 250
Between 251and 260
>260 Score Unknown
0 1 8 1 4 3 0 0 0 0 41 3 5 5 4 1 0 0 0 09
U.S. International Medical Graduates
0
20
40
60
80
100
120
140
160
<= 180 Between 181and 190
Between 191and 200
Between 201and 210
Between 211and 220
Between 221and 230
Between 231and 240
Between 241and 250
Between 251and 260
>260 Score Unknown
1 6 13 13 14 10 5 2 0 015
111
21 15 11 5 0 0 0 010
Non-U.S. International Medical Graduates
Matched Not Matched

Graph-4 Probability of Matching to Preferred Specialty by USMLE Step 3 ScoreEndocrinology, Diabetes, and Metabolism
Charting Outcomes in the Match, SMS, 2013Copyright ©2013 NRMP and AAMC. Copies may be made for educational or noncommercial uses only.
Source: NRMP Data Warehouse and AAMC Data Warehouse. USMLE scores by permission of the NBME and ECFMG. Note: Probabilities calculated based on 2009-2011 applican
0.00
0.10
0.20
0.30
0.40
0.50
0.60
0.70
0.80
0.90
1.00
180 190 200 210 220 230 240 250 260
Non-U.S. InternationalMedical Graduates Previous U.S. Graduates U.S. International
Medical Graduates
Probability of Matching
43
Step 3 Scores

Chart-6 Number of Research ProjectsEndocrinology, Diabetes, and Metabolism
0
50
100
150
200
250
300
None 1 2 3 4 5 or More
80
202 0 0 09 5 0 0 0 2
Previous U.S. Graduates
0
50
100
150
200
250
300
None 1 2 3 4 5 or More
11 6 3 1 0 020 6 0 1 1 0
U.S. International Medical Graduates
0
50
100
150
200
250
300
None 1 2 3 4 5 or More
3922 9 4 4 1
36 24 9 3 2 0
Non-U.S. International Medical Graduates
0
50
100
150
200
250
300
None 1 2 3 4 5 or More
9 1 1 0 0 05 0 2 0 0 0
Osteopathic Graduates
Copyright ©2013 NRMP and AAMC. Copies may be made for educational or noncommercial uses only.
Source: NRMP Data Warehouse and AAMC Data Warehouse
44 Charting Outcomes in the Match, SMS, 2013
Research Projects
Matched Not Matched

Chart-7 Number of Abstracts, Presentations, and PublicationsEndocrinology, Diabetes, and Metabolism
0
20
40
60
80
100
120
140
None 1 2 3 4 5 or More
4426
186 1 77 3 1 2 1 2
Previous U.S. Graduates
0
20
40
60
80
100
120
140
None 1 2 3 4 5 or More
10 3 2 4 0 210 4 4 3 0 7
U.S. International Medical Graduates
0
20
40
60
80
100
120
140
None 1 2 3 4 5 or More
12 7 5 11 11
3321 15
3 8 522
Non-U.S. International Medical Graduates
0
20
40
60
80
100
120
140
None 1 2 3 4 5 or More
4 2 3 0 0 24 0 1 0 0 2
Osteopathic Graduates
Copyright ©2013 NRMP and AAMC. Copies may be made for educational or noncommercial uses only.
Source: NRMP Data Warehouse and AAMC Data Warehouse45 Charting Outcomes in the Match, SMS, 2013
Publications
Matched Not Matched

Chart-8 Number of Work ExperiencesEndocrinology, Diabetes, and Metabolism
0
20
40
60
80
100
None 1 2 3 4 5 or More
93
70 2 0 0
91 2 1 1 2
Previous U.S. Graduates
0
20
40
60
80
100
None 1 2 3 4 5 or More
112 3 3 1 1
153 7
0 2 1
U.S. International Medical Graduates
0
20
40
60
80
100
None 1 2 3 4 5 or More
21 2112 10
411
20 1812 9 5 10
Non-U.S. International Medical Graduates
0
20
40
60
80
100
None 1 2 3 4 5 or More
91 1 0 0 0
60 0 0 1 0
Osteopathic Graduates
Copyright ©2013 NRMP and AAMC. Copies may be made for educational or noncommercial uses only.
Source: NRMP Data Warehouse and AAMC Data Warehouse46 Charting Outcomes in the Match, SMS, 2013
Work Experiences
Matched Not Matched

Chart-9 Number of Volunteer ExperiencesEndocrinology, Diabetes, and Metabolism
0
80
160
240
320
400
83
11 1 2 0 0 1 0 0 0 013 5 1 0 0 0 0 0 1 0 3
None 1 2 3 4 5 6 7 8 9 10 or More
Previous U.S. Graduates
0
80
160
240
320
400
15 5 1 1 0 0 0 0 0 0 012 6 1 1 2 0 0 0 0 0 0
None 1 2 3 4 5 6 7 8 9 10 or More
U.S. International Medical Graduates
0
80
160
240
320
400
35 13 12 4 1 0 0 0 0 0 052
21 11 4 1 2 0 0 0 0 0
None 1 2 3 4 5 6 7 8 9 10 or More
Non-U.S. International Medical Graduates
0
80
160
240
320
400
9 0 0 0 0 0 0 0 0 0 06 1 2 0 0 0 0 0 0 0 0
None 1 2 3 4 5 6 7 8 9 10 or More
Osteopathic Graduates
Copyright ©2013 NRMP and AAMC. Copies may be made for educational or noncommercial uses only.
Source: NRMP Data Warehouse and AAMC Data Warehouse47 Charting Outcomes in the Match, SMS, 2013
Volunteer Experiences
Matched Not Matched

Chart-10
Percentage of U.S. Graduates Who are Members of AOAEndocrinology, Diabetes, and Metabolism
0
50
100
150
200
250
300
350
No Yes
81
21131
Matched Not Matched
AOA Membership
Sources: NRMP Data Warehouse and AAMC Data Warehouse
Copyright ©2013 NRMP and AAMC. Copies may be made for educational or noncommercial uses only.
48 Charting Outcomes in the Match, SMS, 2013

Gastroenterology

Table-1 Summary StatisticsGastroenterology
Measure (n=251) (n=69) (n=26) (n=55)
Previous U.S. Graduates
U.S.International Medical Graduates
Matched Unmatched Matched Unmatched(n=129)(n=68)
UnmatchedMatched
Non-U.S. InternationalMedical Graduates
(n=32)(n=16)UnmatchedMatched
Osteopathic Graduates
58 4 2Mean number of contiguous ranks1. 5 2 3 3
11 1 1Mean number of distinct specialties ranked2. 1 1 1 1
219223 210 209Mean USMLE Step 1 score3. 232 221 n/an/a
222230 216 213Mean USMLE Step 2 score4. 234 222 n/an/a
211221 210 201Mean USMLE Step 3 score5. 207 201 n/an/a
10 0 1Mean number of research experiences6. 1 1 1 1
63 3 5Mean number of abstracts, presentations, and publications
7. 9 6 5 4
10 0 1Mean number of work experiences8. 2 2 0 0
00 0 1Mean number of volunteer experiences9. 1 1 0 1
15 6Percentage who are AOA members n/a n/a10. n/an/a n/an/a
n/a: The measure either does not apply to, applies to only a small percentage of, or no reliable data were available for this type of applicants.Note: USMLE Step scores are not available for most osteopathic medical school graduates.
Sources: Measures 1, 2, and match outcome are from the NRMP Data Warehouse; measures 3, 4, and 5 are from the AAMC Data Warehouse and from the ECFMG, both by permission of the NBME and ECFMG; and measures 6-10 are from the AAMC Data Warehouse.
Charting Outcomes in the Match, SMS, 201350Copyright ©2013 NRMP and AAMC. Copies may be made for educational or noncommercial uses only.
Source: NRMP Data Warehouse

0
20
40
60
80
100
120
1 2 3 4 5 6 7 8 9 10 11 12 13 14 15 16 or More
8 11 17 22 21 18 25 2718 16 15 18
9 5 9 1225
12 8 4 7 2 4 2 2 2 0 0 0 0 0 1
Previous U.S. Graduates
0
20
40
60
80
100
120
1 2 3 4 5 6 7 8 9 10 11 12 13 14 15 16 or More
4 6 3 2 2 0 2 1 2 1 2 1 0 0 0 0
3215
5 0 1 0 1 0 0 0 1 0 0 0 0 0
U.S. International Medical Graduates
0
20
40
60
80
100
120
1 2 3 4 5 6 7 8 9 10 11 12 13 14 15 16 or More
12 10 311 5 1 8 4 5 4 0 0 3 0 0 2
75
32
11 6 4 0 0 0 0 0 0 0 0 0 0 1
Non-U.S. International Medical Graduates
0
20
40
60
80
100
120
1 2 3 4 5 6 7 8 9 10 11 12 13 14 15 16 or More
5 5 1 2 1 0 1 1 0 0 0 0 0 0 0 013 6 6 3 1 1 0 1 0 0 0 0 1 0 0 0
Osteopathic Graduates
Chart-1 Number of Contiguous Ranks Within Preferred SpecialtyGastroenterology
Copyright ©2013 NRMP and AAMC. Copies may be made for educational or noncommercial uses only.
Source: NRMP Data Warehouse
Charting Outcomes in the Match, SMS, 2013
Contiguous Ranks
Matched Not Matched
51

Graph-1 Probability of Matching to Preferred Specialty by Number of Contiguous RanksGastroenterology
0.00
0.10
0.20
0.30
0.40
0.50
0.60
0.70
0.80
0.90
1.00
0 1 2 3 4 5 6 7 8 9 10 11 12 13 14 15 16 17 18 19 20
Non-U.S. InternationalMedical Graduates
Previous U.S. Graduates U.S. InternationalMedical Graduates
Probability of Matching
Copyright ©2013 NRMP and AAMC. Copies may be made for educational or noncommercial uses only.
Source: NRMP Data Warehouse.
52 Charting Outcomes in the Match, SMS, 2013
Contiguous Ranks

Chart-2 Number of Distinct Specialties RankedGastroenterology
0
100
200
300
400
500
600
1 2 3 4 or More
251
0 0 067
2 0 0
Previous U.S. Graduates
0
100
200
300
400
500
600
1 2 3 4 or More
26 0 0 048
5 2 0
U.S. International Medical Graduates
0
100
200
300
400
500
600
1 2 3 4 or More
680 0 0
123
6 0 0
Non-U.S. International Medical Graduates
0
100
200
300
400
500
600
1 2 3 4 or More
15 1 0 032 0 0 0
Osteopathic Graduates
Copyright ©2013 NRMP and AAMC. Copies may be made for educational or noncommercial uses only.
Source: NRMP Data Warehouse
53 Charting Outcomes in the Match, SMS, 2013
Distinct Specialties Ranked
Matched Not Matched
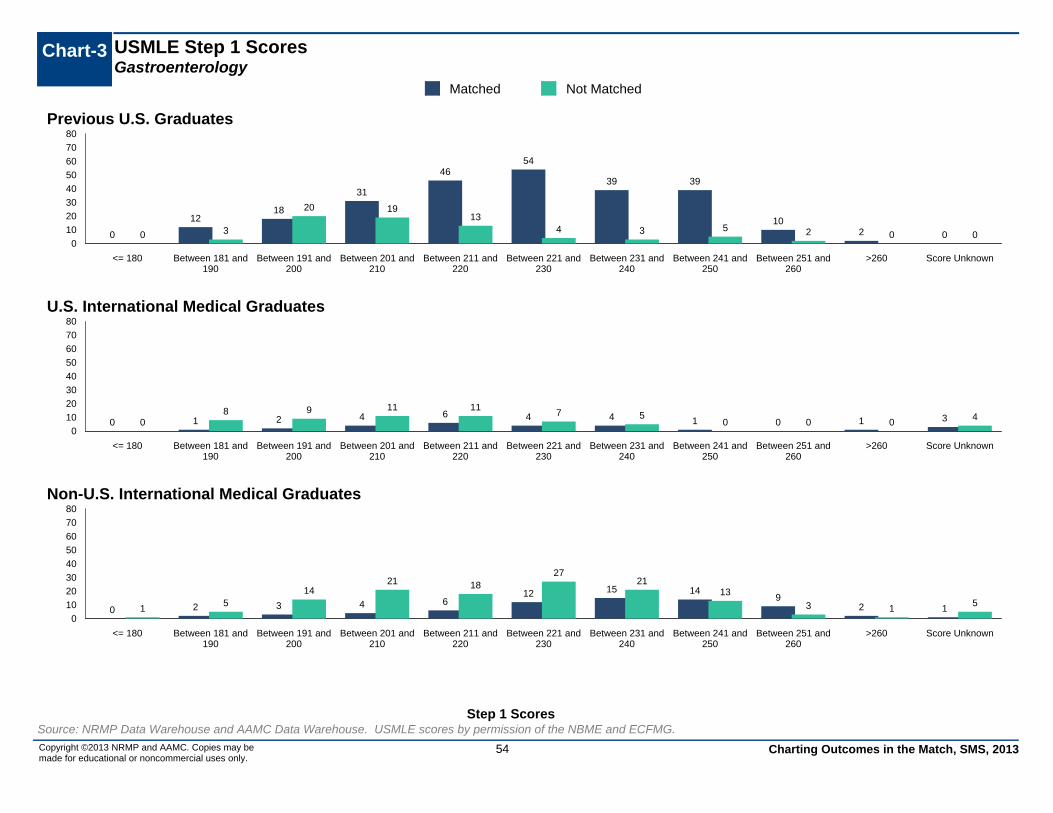
Chart-3 USMLE Step 1 ScoresGastroenterology
0
10
20
30
40
50
60
70
80
<= 180 Between 181 and190
Between 191 and200
Between 201 and210
Between 211 and220
Between 221 and230
Between 231 and240
Between 241 and250
Between 251 and260
>260 Score Unknown
0
1218
31
4654
39 39
102 00 3
20 1913
4 3 5 2 0 0
Previous U.S. Graduates
0
10
20
30
40
50
60
70
80
<= 180 Between 181 and190
Between 191 and200
Between 201 and210
Between 211 and220
Between 221 and230
Between 231 and240
Between 241 and250
Between 251 and260
>260 Score Unknown
0 1 2 4 6 4 4 1 0 1 308 9 11 11
7 50 0 0
4
U.S. International Medical Graduates
0
10
20
30
40
50
60
70
80
<= 180 Between 181 and190
Between 191 and200
Between 201 and210
Between 211 and220
Between 221 and230
Between 231 and240
Between 241 and250
Between 251 and260
>260 Score Unknown
0 2 3 4 612 15 14
92 11
514
21 1827
2113
3 15
Non-U.S. International Medical Graduates
Copyright ©2013 NRMP and AAMC. Copies may be made for educational or noncommercial uses only.
Source: NRMP Data Warehouse and AAMC Data Warehouse. USMLE scores by permission of the NBME and ECFMG.
54 Charting Outcomes in the Match, SMS, 2013
Step 1 Scores
Matched Not Matched
Graph-2 Probability of Matching to Preferred Specialty by USMLE Step 1 ScoreGastroenterology
0.00
0.10
0.20
0.30
0.40
0.50
0.60
0.70
0.80
0.90
1.00
160 180 200 220 240 260 280
Non-U.S. InternationalMedical Graduates Previous U.S. Graduates
U.S. InternationalMedical Graduates
Probability of Matching
Copyright ©2013 NRMP and AAMC. Copies may be made for educational or noncommercial uses only.
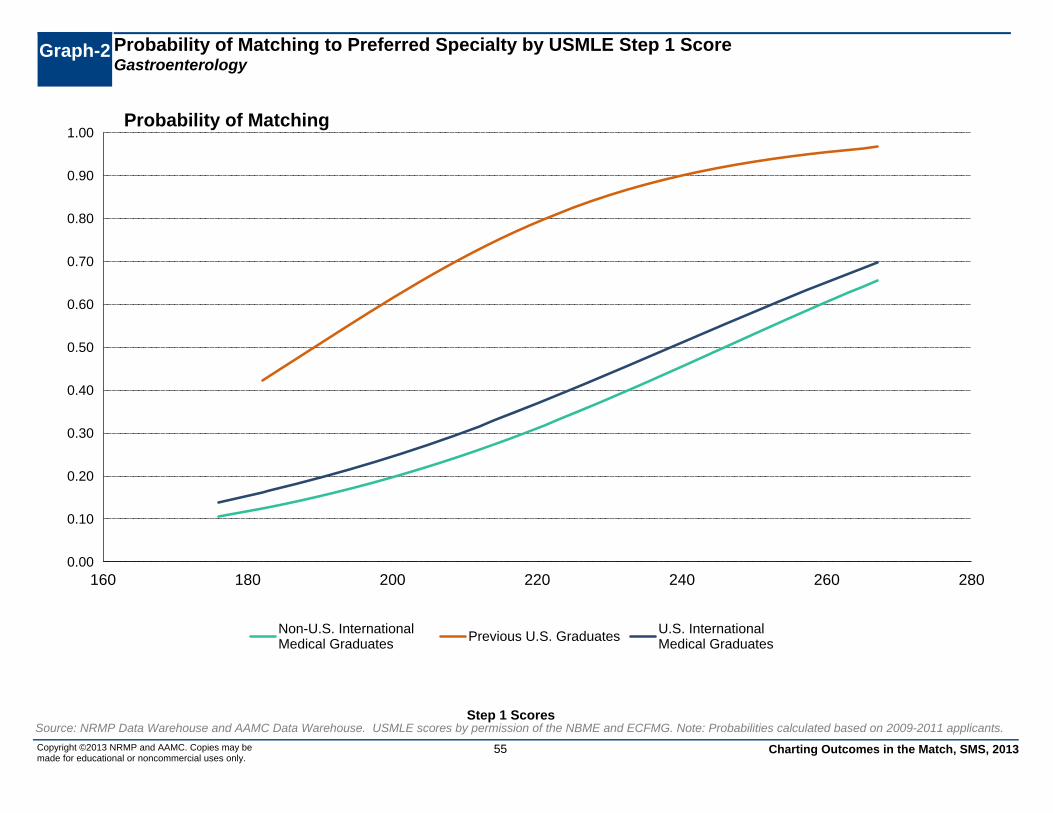
Source: NRMP Data Warehouse and AAMC Data Warehouse. USMLE scores by permission of the NBME and ECFMG. Note: Probabilities calculated based on 2009-2011 applicants.
55 Charting Outcomes in the Match, SMS, 2013
Step 1 Scores

Chart-4 USMLE Step 2 ScoresGastroenterology
0
10
20
30
40
50
60
70
80
<= 180 Between 181and 190
Between 191and 200
Between 201and 210
Between 211and 220
Between 221and 230
Between 231and 240
Between 241and 250
Between 251and 260
>260 Score Unknown
0 3
16
2736 39
44 43
31
12
009 8 10
16 136
2 2 3 0
Previous U.S. Graduates
0
10
20
30
40
50
60
70
80
<= 180 Between 181and 190
Between 191and 200
Between 201and 210
Between 211and 220
Between 221and 230
Between 231and 240
Between 241and 250
Between 251and 260
>260 Score Unknown
0 15
1 3 4 5 3 0 1 30 312
812
7 71 1 0
4
U.S. International Medical Graduates
0
10
20
30
40
50
60
70
80
<= 180 Between 181and 190
Between 191and 200
Between 201and 210
Between 211and 220
Between 221and 230
Between 231and 240
Between 241and 250
Between 251and 260
>260 Score Unknown
0 15 4 7
12 9 10 136
14 514 17 15
25 22
10 11
15
Non-U.S. International Medical Graduates
Copyright ©2013 NRMP and AAMC. Copies may be made for educational or noncommercial uses only.
Source: NRMP Data Warehouse and AAMC Data Warehouse. USMLE scores by permission of the NBME and ECFMG.56 Charting Outcomes in the Match, SMS, 2013
Step 2 Scores
Matched Not Matched

Charting Outcomes in the Match, SMS, 2013Copyright ©2013 NRMP and AAMC. Copies may be made for educational or noncommercial uses only.
Source: NRMP Data Warehouse and AAMC Data Warehouse. USMLE scores by permission of the NBME and ECFMG. Note: Probabilities calculated based on 2009-2011 applican
Probability of Matching to Preferred Specialty by USMLE Step 2 ScoreGastroenterology
Graph-3
0.00
0.10
0.20
0.30
0.40
0.50
0.60
0.70
0.80
0.90
1.00
160 180 200 220 240 260 280
Non-U.S. InternationalMedical Graduates Previous U.S. Graduates
U.S. InternationalMedical Graduates
Probability of Matching
57
Step 2 Scores

58 Charting Outcomes in the Match, SMS, 2013Copyright ©2013 NRMP and AAMC. Copies may be made for educational or noncommercial uses only.
Source: NRMP Data Warehouse and AAMC Data Warehouse. USMLE scores by permission of the NBME and ECFMG.
Step 3 Scores
Chart-5 USMLE Step 3 ScoresGastroenterology
0
20
40
60
80
100
120
140
160
<= 180 Between 181and 190
Between 191and 200
Between 201and 210
Between 211and 220
Between 221and 230
Between 231and 240
Between 241and 250
Between 251and 260
>260 Score Unknown
0 114 20
45 4628
6 1 0
90
1 5 7 9 156 4 1 0 0
21
Previous U.S. Graduates
0
20
40
60
80
100
120
140
160
<= 180 Between 181and 190
Between 191and 200
Between 201and 210
Between 211and 220
Between 221and 230
Between 231and 240
Between 241and 250
Between 251and 260
>260 Score Unknown
0 1 3 4 5 3 1 0 0 09
0 415 11 7 0 0 0 0 0
18
U.S. International Medical Graduates
0
20
40
60
80
100
120
140
160
<= 180 Between 181and 190
Between 191and 200
Between 201and 210
Between 211and 220
Between 221and 230
Between 231and 240
Between 241and 250
Between 251and 260
>260 Score Unknown
0 614 21
102 4 2 0 0
9416
34 3719
4 0 0 0 015
Non-U.S. International Medical Graduates
Matched Not Matched

Graph-4 Probability of Matching to Preferred Specialty by USMLE Step 3 ScoreGastroenterology
Charting Outcomes in the Match, SMS, 2013Copyright ©2013 NRMP and AAMC. Copies may be made for educational or noncommercial uses only.
Source: NRMP Data Warehouse and AAMC Data Warehouse. USMLE scores by permission of the NBME and ECFMG. Note: Probabilities calculated based on 2009-2011 applican
0.00
0.10
0.20
0.30
0.40
0.50
0.60
0.70
0.80
0.90
1.00
160 180 200 220 240 260 280
Non-U.S. InternationalMedical Graduates Previous U.S. Graduates U.S. International
Medical Graduates
Probability of Matching
59
Step 3 Scores

Chart-6 Number of Research ProjectsGastroenterology
0
50
100
150
200
250
300
None 1 2 3 4 5 or More
183
4915 1 3 0
56
10 1 1 1 0
Previous U.S. Graduates
0
50
100
150
200
250
300
None 1 2 3 4 5 or More
14 8 2 1 0 133
12 5 4 0 1
U.S. International Medical Graduates
0
50
100
150
200
250
300
None 1 2 3 4 5 or More
29 13 12 6 6 2
6038
19 7 1 4
Non-U.S. International Medical Graduates
0
50
100
150
200
250
300
None 1 2 3 4 5 or More
12 3 0 0 0 123
5 2 0 2 0
Osteopathic Graduates
Copyright ©2013 NRMP and AAMC. Copies may be made for educational or noncommercial uses only.
Source: NRMP Data Warehouse and AAMC Data Warehouse
60 Charting Outcomes in the Match, SMS, 2013
Research Projects
Matched Not Matched

Chart-7 Number of Abstracts, Presentations, and PublicationsGastroenterology
0
20
40
60
80
100
120
140
None 1 2 3 4 5 or More
80
4426 32
18
51
20 13 12 9 4 11
Previous U.S. Graduates
0
20
40
60
80
100
120
140
None 1 2 3 4 5 or More
2 3 2 5 11312 6 6 5 6
20
U.S. International Medical Graduates
0
20
40
60
80
100
120
140
None 1 2 3 4 5 or More
5 6 4 8 6
39
17 16 18 145
59
Non-U.S. International Medical Graduates
0
20
40
60
80
100
120
140
None 1 2 3 4 5 or More
2 3 2 2 1 69 8 6 1 2 6
Osteopathic Graduates
Copyright ©2013 NRMP and AAMC. Copies may be made for educational or noncommercial uses only.
Source: NRMP Data Warehouse and AAMC Data Warehouse61 Charting Outcomes in the Match, SMS, 2013
Publications
Matched Not Matched

Chart-8 Number of Work ExperiencesGastroenterology
0
20
40
60
80
100
None 1 2 3 4 5 or More
232
134 0 2 0
58
5 3 0 2 1
Previous U.S. Graduates
0
20
40
60
80
100
None 1 2 3 4 5 or More
185 1 1 0 1
30
104 3 5 3
U.S. International Medical Graduates
0
20
40
60
80
100
None 1 2 3 4 5 or More
22 18 135 4 6
3624 24 19
917
Non-U.S. International Medical Graduates
0
20
40
60
80
100
None 1 2 3 4 5 or More
142 0 0 0 0
27
3 0 1 0 1
Osteopathic Graduates
Copyright ©2013 NRMP and AAMC. Copies may be made for educational or noncommercial uses only.
Source: NRMP Data Warehouse and AAMC Data Warehouse62 Charting Outcomes in the Match, SMS, 2013
Work Experiences
Matched Not Matched

Chart-9 Number of Volunteer ExperiencesGastroenterology
0
80
160
240
320
400
204
297 0 0 1 0 0 0 0 0
607 2 1 0 0 1 0 0 0 0
None 1 2 3 4 5 6 7 8 9 10 or More
Previous U.S. Graduates
0
80
160
240
320
400
10 5 2 1 0 1 0 0 0 0 139
6 6 3 0 1 0 0 0 0 1
None 1 2 3 4 5 6 7 8 9 10 or More
U.S. International Medical Graduates
0
80
160
240
320
400
40 23 7 1 0 1 0 0 1 0 0
7328 16 5 1 0 0 0 0 0 1
None 1 2 3 4 5 6 7 8 9 10 or More
Non-U.S. International Medical Graduates
0
80
160
240
320
400
9 1 0 0 0 0 0 0 0 0 019 4 0 2 0 0 0 0 0 0 0
None 1 2 3 4 5 6 7 8 9 10 or More
Osteopathic Graduates
Copyright ©2013 NRMP and AAMC. Copies may be made for educational or noncommercial uses only.
Source: NRMP Data Warehouse and AAMC Data Warehouse63 Charting Outcomes in the Match, SMS, 2013
Volunteer Experiences
Matched Not Matched

Chart-10
Percentage of U.S. Graduates Who are Members of AOAGastroenterology
0
50
100
150
200
250
300
350
No Yes
213
3865
4
Matched Not Matched
AOA Membership
Sources: NRMP Data Warehouse and AAMC Data Warehouse
Copyright ©2013 NRMP and AAMC. Copies may be made for educational or noncommercial uses only.
64 Charting Outcomes in the Match, SMS, 2013

Hematology and Oncology

Table-1 Summary StatisticsHematology and Oncology
Measure (n=234) (n=47) (n=40) (n=56)
Previous U.S. Graduates
U.S.International Medical Graduates
Matched Unmatched Matched Unmatched(n=135)(n=132)
UnmatchedMatched
Non-U.S. InternationalMedical Graduates
(n=15)(n=26)UnmatchedMatched
Osteopathic Graduates
55 3 2Mean number of contiguous ranks1. 5 2 5 3
11 1 1Mean number of distinct specialties ranked2. 2 1 1 1
221224 214 211Mean USMLE Step 1 score3. 228 224 n/an/a
227231 215 211Mean USMLE Step 2 score4. 231 224 n/an/a
206222 211 203Mean USMLE Step 3 score5. 207 202 n/an/a
10 0 1Mean number of research experiences6. 1 1 0 0
52 2 4Mean number of abstracts, presentations, and publications
7. 8 6 2 3
10 0 1Mean number of work experiences8. 2 2 0 0
00 0 1Mean number of volunteer experiences9. 1 1 0 0
23 4Percentage who are AOA members n/a n/a10. n/an/a n/an/a
n/a: The measure either does not apply to, applies to only a small percentage of, or no reliable data were available for this type of applicants.Note: USMLE Step scores are not available for most osteopathic medical school graduates.
Sources: Measures 1, 2, and match outcome are from the NRMP Data Warehouse; measures 3, 4, and 5 are from the AAMC Data Warehouse and from the ECFMG, both by permission of the NBME and ECFMG; and measures 6-10 are from the AAMC Data Warehouse.
Charting Outcomes in the Match, SMS, 201366Copyright ©2013 NRMP and AAMC. Copies may be made for educational or noncommercial uses only.
Source: NRMP Data Warehouse

0
20
40
60
80
100
120
1 2 3 4 5 6 7 8 9 10 11 12 13 14 15 16 or More
2717
2642
25 22 24 20 163 5 2 1 1 2 1
156 5 8 5 2 4 0 1 0 0 0 0 0 0 1
Previous U.S. Graduates
0
20
40
60
80
100
120
1 2 3 4 5 6 7 8 9 10 11 12 13 14 15 16 or More
8 8 3 5 3 2 1 3 2 0 1 0 0 0 1 3
34
8 8 2 2 0 0 1 0 0 0 1 0 0 0 0
U.S. International Medical Graduates
0
20
40
60
80
100
120
1 2 3 4 5 6 7 8 9 10 11 12 13 14 15 16 or More
25 2513 9 13 13 10 4 5 5 4 2 1 1 2 0
69
3016 12
3 0 0 1 1 2 1 0 0 0 0 0
Non-U.S. International Medical Graduates
0
20
40
60
80
100
120
1 2 3 4 5 6 7 8 9 10 11 12 13 14 15 16 or More
7 4 4 1 2 3 1 0 0 1 2 0 0 0 0 14 7 0 2 1 1 0 0 0 0 0 0 0 0 0 0
Osteopathic Graduates
Chart-1 Number of Contiguous Ranks Within Preferred SpecialtyHematology and Oncology
Copyright ©2013 NRMP and AAMC. Copies may be made for educational or noncommercial uses only.
Source: NRMP Data Warehouse
Charting Outcomes in the Match, SMS, 2013
Contiguous Ranks
Matched Not Matched
67

Graph-1 Probability of Matching to Preferred Specialty by Number of Contiguous RanksHematology and Oncology
0.00
0.10
0.20
0.30
0.40
0.50
0.60
0.70
0.80
0.90
1.00
0 1 2 3 4 5 6 7 8 9 10 11 12 13 14 15 16 17 18 19 20
Non-U.S. InternationalMedical Graduates
Previous U.S. Graduates U.S. InternationalMedical Graduates
Probability of Matching
Copyright ©2013 NRMP and AAMC. Copies may be made for educational or noncommercial uses only.
Source: NRMP Data Warehouse.
68 Charting Outcomes in the Match, SMS, 2013
Contiguous Ranks

Chart-2 Number of Distinct Specialties RankedHematology and Oncology
0
100
200
300
400
500
600
1 2 3 4 or More
185
37 12 036 8 3 0
Previous U.S. Graduates
0
100
200
300
400
500
600
1 2 3 4 or More
27 11 2 043
9 4 0
U.S. International Medical Graduates
0
100
200
300
400
500
600
1 2 3 4 or More
8622 22 2
103
19 11 2
Non-U.S. International Medical Graduates
0
100
200
300
400
500
600
1 2 3 4 or More
21 4 1 010 5 0 0
Osteopathic Graduates
Copyright ©2013 NRMP and AAMC. Copies may be made for educational or noncommercial uses only.
Source: NRMP Data Warehouse
69 Charting Outcomes in the Match, SMS, 2013
Distinct Specialties Ranked
Matched Not Matched

Chart-3 USMLE Step 1 ScoresHematology and Oncology
0
10
20
30
40
50
60
70
80
<= 180 Between 181 and190
Between 191 and200
Between 201 and210
Between 211 and220
Between 221 and230
Between 231 and240
Between 241 and250
Between 251 and260
>260 Score Unknown
0
17 17
32 34
44
3326 25
510
4 5
159
5 4 3 2 0 0
Previous U.S. Graduates
0
10
20
30
40
50
60
70
80
<= 180 Between 181 and190
Between 191 and200
Between 201 and210
Between 211 and220
Between 221 and230
Between 231 and240
Between 241 and250
Between 251 and260
>260 Score Unknown
0 2 310
6 6 5 4 2 1 108
145 7 8 10
1 1 0 2
U.S. International Medical Graduates
0
10
20
30
40
50
60
70
80
<= 180 Between 181 and190
Between 191 and200
Between 201 and210
Between 211 and220
Between 221 and230
Between 231 and240
Between 241 and250
Between 251 and260
>260 Score Unknown
04 6
16 18
2824
1813
2 308 9 12
27 25 27
149
2 2
Non-U.S. International Medical Graduates
Copyright ©2013 NRMP and AAMC. Copies may be made for educational or noncommercial uses only.
Source: NRMP Data Warehouse and AAMC Data Warehouse. USMLE scores by permission of the NBME and ECFMG.
70 Charting Outcomes in the Match, SMS, 2013
Step 1 Scores
Matched Not Matched

Graph-2 Probability of Matching to Preferred Specialty by USMLE Step 1 ScoreHematology and Oncology
0.00
0.10
0.20
0.30
0.40
0.50
0.60
0.70
0.80
0.90
1.00
160 180 200 220 240 260 280
Non-U.S. InternationalMedical Graduates Previous U.S. Graduates
U.S. InternationalMedical Graduates
Probability of Matching
Copyright ©2013 NRMP and AAMC. Copies may be made for educational or noncommercial uses only.
Source: NRMP Data Warehouse and AAMC Data Warehouse. USMLE scores by permission of the NBME and ECFMG. Note: Probabilities calculated based on 2009-2011 applicants.
71 Charting Outcomes in the Match, SMS, 2013
Step 1 Scores

Chart-4 USMLE Step 2 ScoresHematology and Oncology
0
10
20
30
40
50
60
70
80
<= 180 Between 181and 190
Between 191and 200
Between 201and 210
Between 211and 220
Between 221and 230
Between 231and 240
Between 241and 250
Between 251and 260
>260 Score Unknown
09
1522
3729
3729 28 28
007 5 6
127 5 3 2 0 0
Previous U.S. Graduates
0
10
20
30
40
50
60
70
80
<= 180 Between 181and 190
Between 191and 200
Between 201and 210
Between 211and 220
Between 221and 230
Between 231and 240
Between 241and 250
Between 251and 260
>260 Score Unknown
0 2 1 4 611
7 5 2 1 127 4
14 15
3 5 2 1 1 2
U.S. International Medical Graduates
0
10
20
30
40
50
60
70
80
<= 180 Between 181and 190
Between 191and 200
Between 201and 210
Between 211and 220
Between 221and 230
Between 231and 240
Between 241and 250
Between 251and 260
>260 Score Unknown
1 411
514
29
1823
159
31
12 1016 15 18
2819
95 2
Non-U.S. International Medical Graduates
Copyright ©2013 NRMP and AAMC. Copies may be made for educational or noncommercial uses only.
Source: NRMP Data Warehouse and AAMC Data Warehouse. USMLE scores by permission of the NBME and ECFMG.72 Charting Outcomes in the Match, SMS, 2013
Step 2 Scores
Matched Not Matched

Charting Outcomes in the Match, SMS, 2013Copyright ©2013 NRMP and AAMC. Copies may be made for educational or noncommercial uses only.
Source: NRMP Data Warehouse and AAMC Data Warehouse. USMLE scores by permission of the NBME and ECFMG. Note: Probabilities calculated based on 2009-2011 applican
Probability of Matching to Preferred Specialty by USMLE Step 2 ScoreHematology and Oncology
Graph-3
0.00
0.10
0.20
0.30
0.40
0.50
0.60
0.70
0.80
0.90
1.00
160 180 200 220 240 260 280
Non-U.S. InternationalMedical Graduates Previous U.S. Graduates
U.S. InternationalMedical Graduates
Probability of Matching
73
Step 2 Scores

74 Charting Outcomes in the Match, SMS, 2013Copyright ©2013 NRMP and AAMC. Copies may be made for educational or noncommercial uses only.
Source: NRMP Data Warehouse and AAMC Data Warehouse. USMLE scores by permission of the NBME and ECFMG.
Step 3 Scores
Chart-5 USMLE Step 3 ScoresHematology and Oncology
0
20
40
60
80
100
120
140
160
<= 180 Between 181and 190
Between 191and 200
Between 201and 210
Between 211and 220
Between 221and 230
Between 231and 240
Between 241and 250
Between 251and 260
>260 Score Unknown
0 014
27 26 32 3016
3 0
86
0 3 2 8 5 5 3 0 0 0
21
Previous U.S. Graduates
0
20
40
60
80
100
120
140
160
<= 180 Between 181and 190
Between 191and 200
Between 201and 210
Between 211and 220
Between 221and 230
Between 231and 240
Between 241and 250
Between 251and 260
>260 Score Unknown
0 3 6 3 5 4 0 0 0 0
191 5
14 8 9 2 1 1 0 015
U.S. International Medical Graduates
0
20
40
60
80
100
120
140
160
<= 180 Between 181and 190
Between 191and 200
Between 201and 210
Between 211and 220
Between 221and 230
Between 231and 240
Between 241and 250
Between 251and 260
>260 Score Unknown
3 9
28 3117 20
5 1 0 018
2
26 30 3618
6 2 1 1 013
Non-U.S. International Medical Graduates
Matched Not Matched

Graph-4 Probability of Matching to Preferred Specialty by USMLE Step 3 ScoreHematology and Oncology
Charting Outcomes in the Match, SMS, 2013Copyright ©2013 NRMP and AAMC. Copies may be made for educational or noncommercial uses only.
Source: NRMP Data Warehouse and AAMC Data Warehouse. USMLE scores by permission of the NBME and ECFMG. Note: Probabilities calculated based on 2009-2011 applican
0.00
0.10
0.20
0.30
0.40
0.50
0.60
0.70
0.80
0.90
1.00
160 180 200 220 240 260 280
Non-U.S. InternationalMedical Graduates Previous U.S. Graduates U.S. International
Medical Graduates
Probability of Matching
75
Step 3 Scores

Chart-6 Number of Research ProjectsHematology and Oncology
0
50
100
150
200
250
300
None 1 2 3 4 5 or More
182
438 1 0 0
359 3 0 0 0
Previous U.S. Graduates
0
50
100
150
200
250
300
None 1 2 3 4 5 or More
19 11 7 0 2 129 18 3 3 3 0
U.S. International Medical Graduates
0
50
100
150
200
250
300
None 1 2 3 4 5 or More
51 4313 15 4 6
51 4821 10 1 4
Non-U.S. International Medical Graduates
0
50
100
150
200
250
300
None 1 2 3 4 5 or More
214 1 0 0 012 2 1 0 0 0
Osteopathic Graduates
Copyright ©2013 NRMP and AAMC. Copies may be made for educational or noncommercial uses only.
Source: NRMP Data Warehouse and AAMC Data Warehouse
76 Charting Outcomes in the Match, SMS, 2013
Research Projects
Matched Not Matched

Chart-7 Number of Abstracts, Presentations, and PublicationsHematology and Oncology
0
20
40
60
80
100
120
140
None 1 2 3 4 5 or More
97
59
2916 10
2316 174 5 1 4
Previous U.S. Graduates
0
20
40
60
80
100
120
140
None 1 2 3 4 5 or More
10 6 7 1 21412 14
6 5 415
U.S. International Medical Graduates
0
20
40
60
80
100
120
140
None 1 2 3 4 5 or More
12 9 13 15 8
75
24 259 7
16
54
Non-U.S. International Medical Graduates
0
20
40
60
80
100
120
140
None 1 2 3 4 5 or More
10 7 4 2 0 35 3 3 3 0 1
Osteopathic Graduates
Copyright ©2013 NRMP and AAMC. Copies may be made for educational or noncommercial uses only.
Source: NRMP Data Warehouse and AAMC Data Warehouse77 Charting Outcomes in the Match, SMS, 2013
Publications
Matched Not Matched

Chart-8 Number of Work ExperiencesHematology and Oncology
0
20
40
60
80
100
None 1 2 3 4 5 or More
212
18
1 1 1 1
37
3 5 1 0 1
Previous U.S. Graduates
0
20
40
60
80
100
None 1 2 3 4 5 or More
2114
3 1 0 1
31
126 4 2 1
U.S. International Medical Graduates
0
20
40
60
80
100
None 1 2 3 4 5 or More
34 31 3019
7 11
3527 31
13 920
Non-U.S. International Medical Graduates
0
20
40
60
80
100
None 1 2 3 4 5 or More
25
0 1 0 0 0
15
0 0 0 0 0
Osteopathic Graduates
Copyright ©2013 NRMP and AAMC. Copies may be made for educational or noncommercial uses only.
Source: NRMP Data Warehouse and AAMC Data Warehouse78 Charting Outcomes in the Match, SMS, 2013
Work Experiences
Matched Not Matched

Chart-9 Number of Volunteer ExperiencesHematology and Oncology
0
80
160
240
320
400
192
295 2 0 0 0 0 0 0 0
28 9 0 0 0 1 1 0 0 0 0
None 1 2 3 4 5 6 7 8 9 10 or More
Previous U.S. Graduates
0
80
160
240
320
400
23 4 2 0 0 0 0 0 0 0 025 5 3 1 0 0 0 0 0 0 0
None 1 2 3 4 5 6 7 8 9 10 or More
U.S. International Medical Graduates
0
80
160
240
320
400
94
29 17 3 0 0 0 0 0 0 0
80
19 11 10 2 1 1 1 0 0 0
None 1 2 3 4 5 6 7 8 9 10 or More
Non-U.S. International Medical Graduates
0
80
160
240
320
400
13 2 1 0 1 0 0 0 0 0 018 1 0 0 0 0 0 0 0 0 0
None 1 2 3 4 5 6 7 8 9 10 or More
Osteopathic Graduates
Copyright ©2013 NRMP and AAMC. Copies may be made for educational or noncommercial uses only.
Source: NRMP Data Warehouse and AAMC Data Warehouse79 Charting Outcomes in the Match, SMS, 2013
Volunteer Experiences
Matched Not Matched

Chart-10
Percentage of U.S. Graduates Who are Members of AOAHematology and Oncology
0
50
100
150
200
250
300
350
No Yes
181
5345
2
Matched Not Matched
AOA Membership
Sources: NRMP Data Warehouse and AAMC Data Warehouse
Copyright ©2013 NRMP and AAMC. Copies may be made for educational or noncommercial uses only.
80 Charting Outcomes in the Match, SMS, 2013

Infectious Disease

Table-1 Summary StatisticsInfectious Disease
Measure (n=124) (n=5) (n=31) (n=16)
Previous U.S. Graduates
U.S.International Medical Graduates
Matched Unmatched Matched Unmatched(n=13)(n=94)
UnmatchedMatched
Non-U.S. InternationalMedical Graduates
(n=5)(n=14)UnmatchedMatched
Osteopathic Graduates
55 4 2Mean number of contiguous ranks1. 7 4 7 3
11 1 1Mean number of distinct specialties ranked2. 1 1 1 1
205224 212 210Mean USMLE Step 1 score3. 226 209 n/an/a
211231 220 207Mean USMLE Step 2 score4. 229 216 n/an/a
205224 207 201Mean USMLE Step 3 score5. 210 204 n/an/a
10 1 0Mean number of research experiences6. 1 1 0 0
32 1 2Mean number of abstracts, presentations, and publications
7. 5 3 3 1
10 1 2Mean number of work experiences8. 2 3 0 0
00 0 0Mean number of volunteer experiences9. 1 1 0 0
15 0Percentage who are AOA members n/a n/a10. n/an/a n/an/a
n/a: The measure either does not apply to, applies to only a small percentage of, or no reliable data were available for this type of applicants.Note: USMLE Step scores are not available for most osteopathic medical school graduates.
Sources: Measures 1, 2, and match outcome are from the NRMP Data Warehouse; measures 3, 4, and 5 are from the AAMC Data Warehouse and from the ECFMG, both by permission of the NBME and ECFMG; and measures 6-10 are from the AAMC Data Warehouse.
Charting Outcomes in the Match, SMS, 201382Copyright ©2013 NRMP and AAMC. Copies may be made for educational or noncommercial uses only.
Source: NRMP Data Warehouse

0
20
40
60
80
100
120
1 2 3 4 5 6 7 8 9 10 11 12 13 14 15 16 or More
2110 13 10 12 18
7 10 9 7 3 3 0 1 0 01 0 0 1 3 0 0 0 0 0 0 0 0 0 0 0
Previous U.S. Graduates
0
20
40
60
80
100
120
1 2 3 4 5 6 7 8 9 10 11 12 13 14 15 16 or More
4 3 7 2 4 1 1 2 2 2 1 1 0 1 0 07 2 3 2 1 1 0 0 0 0 0 0 0 0 0 0
U.S. International Medical Graduates
0
20
40
60
80
100
120
1 2 3 4 5 6 7 8 9 10 11 12 13 14 15 16 or More
6 6 10 312 11 4 6 7 4 5 7 4 3 3 33 4 1 2 2 0 0 0 0 0 0 0 0 0 0 1
Non-U.S. International Medical Graduates
0
20
40
60
80
100
120
1 2 3 4 5 6 7 8 9 10 11 12 13 14 15 16 or More
0 1 1 1 5 1 1 0 1 0 1 0 2 0 0 02 0 0 2 1 0 0 0 0 0 0 0 0 0 0 0
Osteopathic Graduates
Chart-1 Number of Contiguous Ranks Within Preferred SpecialtyInfectious Disease
Copyright ©2013 NRMP and AAMC. Copies may be made for educational or noncommercial uses only.
Source: NRMP Data Warehouse
Charting Outcomes in the Match, SMS, 2013
Contiguous Ranks
Matched Not Matched
83

Graph-1 Probability of Matching to Preferred Specialty by Number of Contiguous RanksInfectious Disease
0.00
0.10
0.20
0.30
0.40
0.50
0.60
0.70
0.80
0.90
1.00
0 1 2 3 4 5 6 7 8 9 10 11 12 13 14 15 16 17 18 19 20
Non-U.S. InternationalMedical Graduates
Previous U.S. Graduates U.S. InternationalMedical Graduates
Probability of Matching
Copyright ©2013 NRMP and AAMC. Copies may be made for educational or noncommercial uses only.
Source: NRMP Data Warehouse.
84 Charting Outcomes in the Match, SMS, 2013
Contiguous Ranks

Chart-2 Number of Distinct Specialties RankedInfectious Disease
0
100
200
300
400
500
600
1 2 3 4 or More
124
0 0 05 0 0 0
Previous U.S. Graduates
0
100
200
300
400
500
600
1 2 3 4 or More
29 2 0 015 1 0 0
U.S. International Medical Graduates
0
100
200
300
400
500
600
1 2 3 4 or More
91
3 0 013 0 0 0
Non-U.S. International Medical Graduates
0
100
200
300
400
500
600
1 2 3 4 or More
14 0 0 05 0 0 0
Osteopathic Graduates
Copyright ©2013 NRMP and AAMC. Copies may be made for educational or noncommercial uses only.
Source: NRMP Data Warehouse
85 Charting Outcomes in the Match, SMS, 2013
Distinct Specialties Ranked
Matched Not Matched

Chart-3 USMLE Step 1 ScoresInfectious Disease
0
10
20
30
40
50
60
70
80
<= 180 Between 181 and190
Between 191 and200
Between 201 and210
Between 211 and220
Between 221 and230
Between 231 and240
Between 241 and250
Between 251 and260
>260 Score Unknown
06
1119 19 20 18
22
72 00 1 1 1 1 0 0 0 1 0 0
Previous U.S. Graduates
0
10
20
30
40
50
60
70
80
<= 180 Between 181 and190
Between 191 and200
Between 201 and210
Between 211 and220
Between 221 and230
Between 231 and240
Between 241 and250
Between 251 and260
>260 Score Unknown
05 8 9
3 40 1 0 0 10 2 4 2 4 2 2 0 0 0 0
U.S. International Medical Graduates
0
10
20
30
40
50
60
70
80
<= 180 Between 181 and190
Between 191 and200
Between 201 and210
Between 211 and220
Between 221 and230
Between 231 and240
Between 241 and250
Between 251 and260
>260 Score Unknown
0 17
11 1120 21
103 2
80 2 1 3 3 2 1 0 0 0 1
Non-U.S. International Medical Graduates
Copyright ©2013 NRMP and AAMC. Copies may be made for educational or noncommercial uses only.
Source: NRMP Data Warehouse and AAMC Data Warehouse. USMLE scores by permission of the NBME and ECFMG.
86 Charting Outcomes in the Match, SMS, 2013
Step 1 Scores
Matched Not Matched
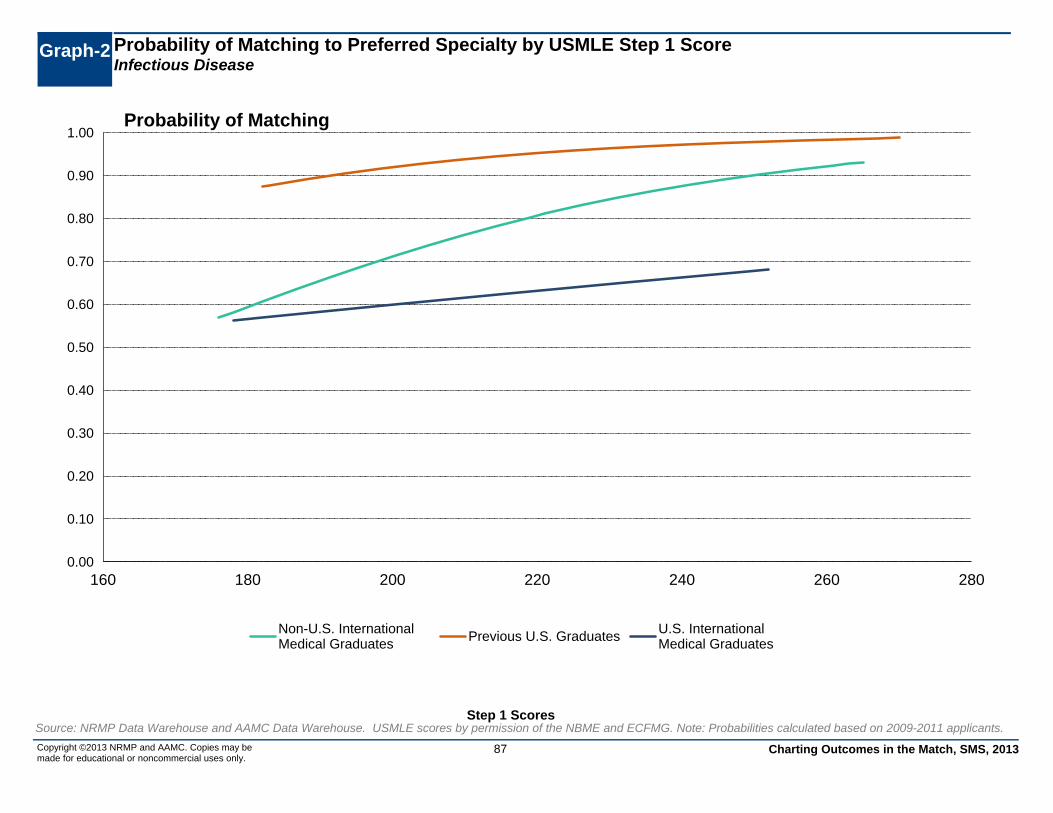
Graph-2 Probability of Matching to Preferred Specialty by USMLE Step 1 ScoreInfectious Disease
0.00
0.10
0.20
0.30
0.40
0.50
0.60
0.70
0.80
0.90
1.00
160 180 200 220 240 260 280
Non-U.S. InternationalMedical Graduates Previous U.S. Graduates
U.S. InternationalMedical Graduates
Probability of Matching
Copyright ©2013 NRMP and AAMC. Copies may be made for educational or noncommercial uses only.
Source: NRMP Data Warehouse and AAMC Data Warehouse. USMLE scores by permission of the NBME and ECFMG. Note: Probabilities calculated based on 2009-2011 applicants.
87 Charting Outcomes in the Match, SMS, 2013
Step 1 Scores

Chart-4 USMLE Step 2 ScoresInfectious Disease
0
10
20
30
40
50
60
70
80
<= 180 Between 181and 190
Between 191and 200
Between 201and 210
Between 211and 220
Between 221and 230
Between 231and 240
Between 241and 250
Between 251and 260
>260 Score Unknown
04 7
13 16 19 21 21
11 12
00 0 1 2 0 0 1 1 0 0 0
Previous U.S. Graduates
0
10
20
30
40
50
60
70
80
<= 180 Between 181and 190
Between 191and 200
Between 201and 210
Between 211and 220
Between 221and 230
Between 231and 240
Between 241and 250
Between 251and 260
>260 Score Unknown
2 3 5 38 5 2 1 1 0 10 1
6 60 1 1 1 0 0 0
U.S. International Medical Graduates
0
10
20
30
40
50
60
70
80
<= 180 Between 181and 190
Between 191and 200
Between 201and 210
Between 211and 220
Between 221and 230
Between 231and 240
Between 241and 250
Between 251and 260
>260 Score Unknown
1 1 4 610
27
13 10 95 8
0 1 04 2 3 2 0 0 0 1
Non-U.S. International Medical Graduates
Copyright ©2013 NRMP and AAMC. Copies may be made for educational or noncommercial uses only.
Source: NRMP Data Warehouse and AAMC Data Warehouse. USMLE scores by permission of the NBME and ECFMG.88 Charting Outcomes in the Match, SMS, 2013
Step 2 Scores
Matched Not Matched

Charting Outcomes in the Match, SMS, 2013Copyright ©2013 NRMP and AAMC. Copies may be made for educational or noncommercial uses only.
Source: NRMP Data Warehouse and AAMC Data Warehouse. USMLE scores by permission of the NBME and ECFMG. Note: Probabilities calculated based on 2009-2011 applican
Probability of Matching to Preferred Specialty by USMLE Step 2 ScoreInfectious Disease
Graph-3
0.00
0.10
0.20
0.30
0.40
0.50
0.60
0.70
0.80
0.90
1.00
160 180 200 220 240 260 280
Non-U.S. InternationalMedical Graduates Previous U.S. Graduates
U.S. InternationalMedical Graduates
Probability of Matching
89
Step 2 Scores

90 Charting Outcomes in the Match, SMS, 2013Copyright ©2013 NRMP and AAMC. Copies may be made for educational or noncommercial uses only.
Source: NRMP Data Warehouse and AAMC Data Warehouse. USMLE scores by permission of the NBME and ECFMG.
Step 3 Scores
Chart-5 USMLE Step 3 ScoresInfectious Disease
0
20
40
60
80
100
120
140
160
<= 180 Between 181and 190
Between 191and 200
Between 201and 210
Between 211and 220
Between 221and 230
Between 231and 240
Between 241and 250
Between 251and 260
>260 Score Unknown
0 2 5 11 1422 20
4 5 0
41
0 1 0 2 0 1 0 0 0 0 1
Previous U.S. Graduates
0
20
40
60
80
100
120
140
160
<= 180 Between 181and 190
Between 191and 200
Between 201and 210
Between 211and 220
Between 221and 230
Between 231and 240
Between 241and 250
Between 251and 260
>260 Score Unknown
0 4 8 3 3 5 1 0 0 0 71 1 6 3 1 0 1 0 0 0 3
U.S. International Medical Graduates
0
20
40
60
80
100
120
140
160
<= 180 Between 181and 190
Between 191and 200
Between 201and 210
Between 211and 220
Between 221and 230
Between 231and 240
Between 241and 250
Between 251and 260
>260 Score Unknown
1 414 21 17 13
4 1 0 0
19
0 0 4 2 1 1 0 0 0 0 5
Non-U.S. International Medical Graduates
Matched Not Matched

Graph-4 Probability of Matching to Preferred Specialty by USMLE Step 3 ScoreInfectious Disease
Charting Outcomes in the Match, SMS, 2013Copyright ©2013 NRMP and AAMC. Copies may be made for educational or noncommercial uses only.
Source: NRMP Data Warehouse and AAMC Data Warehouse. USMLE scores by permission of the NBME and ECFMG. Note: Probabilities calculated based on 2009-2011 applican
0.00
0.10
0.20
0.30
0.40
0.50
0.60
0.70
0.80
0.90
1.00
160 180 200 220 240 260 280
Non-U.S. InternationalMedical Graduates Previous U.S. Graduates U.S. International
Medical Graduates
Probability of Matching
91
Step 3 Scores

Chart-6 Number of Research ProjectsInfectious Disease
0
50
100
150
200
250
300
None 1 2 3 4 5 or More
94
233 2 1 13 1 1 0 0 0
Previous U.S. Graduates
0
50
100
150
200
250
300
None 1 2 3 4 5 or More
21 7 1 1 0 115 0 1 0 0 0
U.S. International Medical Graduates
0
50
100
150
200
250
300
None 1 2 3 4 5 or More
5421 12 4 1 25 7 1 0 0 0
Non-U.S. International Medical Graduates
0
50
100
150
200
250
300
None 1 2 3 4 5 or More
11 3 0 0 0 05 0 0 0 0 0
Osteopathic Graduates
Copyright ©2013 NRMP and AAMC. Copies may be made for educational or noncommercial uses only.
Source: NRMP Data Warehouse and AAMC Data Warehouse
92 Charting Outcomes in the Match, SMS, 2013
Research Projects
Matched Not Matched

Chart-7 Number of Abstracts, Presentations, and PublicationsInfectious Disease
0
20
40
60
80
100
120
140
None 1 2 3 4 5 or More
50
20 2110 9 14
2 2 0 0 1 0
Previous U.S. Graduates
0
20
40
60
80
100
120
140
None 1 2 3 4 5 or More
10 8 2 1 3 77 2 3 2 0 2
U.S. International Medical Graduates
0
20
40
60
80
100
120
140
None 1 2 3 4 5 or More
23 168 10 6
31
6 2 1 1 1 2
Non-U.S. International Medical Graduates
0
20
40
60
80
100
120
140
None 1 2 3 4 5 or More
3 1 3 1 3 33 1 0 0 0 1
Osteopathic Graduates
Copyright ©2013 NRMP and AAMC. Copies may be made for educational or noncommercial uses only.
Source: NRMP Data Warehouse and AAMC Data Warehouse93 Charting Outcomes in the Match, SMS, 2013
Publications
Matched Not Matched

Chart-8 Number of Work ExperiencesInfectious Disease
0
20
40
60
80
100
None 1 2 3 4 5 or More
110
100 2 0 23 1 0 1 0 0
Previous U.S. Graduates
0
20
40
60
80
100
None 1 2 3 4 5 or More
11 10 6 1 1 26 4 2 3 0 1
U.S. International Medical Graduates
0
20
40
60
80
100
None 1 2 3 4 5 or More
21 2114 12 11 15
2 2 1 5 1 2
Non-U.S. International Medical Graduates
0
20
40
60
80
100
None 1 2 3 4 5 or More
131 0 0 0 05 0 0 0 0 0
Osteopathic Graduates
Copyright ©2013 NRMP and AAMC. Copies may be made for educational or noncommercial uses only.
Source: NRMP Data Warehouse and AAMC Data Warehouse94 Charting Outcomes in the Match, SMS, 2013
Work Experiences
Matched Not Matched

Chart-9 Number of Volunteer ExperiencesInfectious Disease
0
80
160
240
320
400
101
17 5 2 0 0 1 0 0 0 04 4 0 0 0 0 0 0 0 0 0
None 1 2 3 4 5 6 7 8 9 10 or More
Previous U.S. Graduates
0
80
160
240
320
400
17 2 1 1 0 0 1 0 0 0 013 3 1 0 1 0 0 0 0 0 0
None 1 2 3 4 5 6 7 8 9 10 or More
U.S. International Medical Graduates
0
80
160
240
320
400
5811 4 5 3 4 1 0 0 0 016 9 1 1 0 0 0 1 0 0 0
None 1 2 3 4 5 6 7 8 9 10 or More
Non-U.S. International Medical Graduates
0
80
160
240
320
400
11 3 0 0 0 0 0 0 0 0 02 0 0 0 0 0 0 0 0 0 0
None 1 2 3 4 5 6 7 8 9 10 or More
Osteopathic Graduates
Copyright ©2013 NRMP and AAMC. Copies may be made for educational or noncommercial uses only.
Source: NRMP Data Warehouse and AAMC Data Warehouse95 Charting Outcomes in the Match, SMS, 2013
Volunteer Experiences
Matched Not Matched

Chart-10
Percentage of U.S. Graduates Who are Members of AOAInfectious Disease
0
50
100
150
200
250
300
350
No Yes
105
185 0
Matched Not Matched
AOA Membership
Sources: NRMP Data Warehouse and AAMC Data Warehouse
Copyright ©2013 NRMP and AAMC. Copies may be made for educational or noncommercial uses only.
96 Charting Outcomes in the Match, SMS, 2013

Neonatal-Perinatal Medicine

Table-1 Summary StatisticsNeonatal-Perinatal Medicine
Measure (n=105) (n=6) (n=13) (n=4)
Previous U.S. Graduates
U.S.International Medical Graduates
Matched Unmatched Matched Unmatched(n=9)(n=52)
UnmatchedMatched
Non-U.S. InternationalMedical Graduates
(n=4)(n=12)UnmatchedMatched
Osteopathic Graduates
54 4 3Mean number of contiguous ranks1. 8 3 6 3
11 1 1Mean number of distinct specialties ranked2. 1 1 1 1
207217 212 199Mean USMLE Step 1 score3. 218 210 n/an/a
208228 227 205Mean USMLE Step 2 score4. 220 217 n/an/a
197218 209 195Mean USMLE Step 3 score5. 202 201 n/an/a
10 0 1Mean number of research experiences6. 1 0 0 0
41 0 1Mean number of abstracts, presentations, and publications
7. 4 1 1 0
10 0 5Mean number of work experiences8. 2 2 0 0
10 0 2Mean number of volunteer experiences9. 1 1 1 0
13 17Percentage who are AOA members n/a n/a10. n/an/a n/an/a
n/a: The measure either does not apply to, applies to only a small percentage of, or no reliable data were available for this type of applicants.Note: USMLE Step scores are not available for most osteopathic medical school graduates.
Sources: Measures 1, 2, and match outcome are from the NRMP Data Warehouse; measures 3, 4, and 5 are from the AAMC Data Warehouse and from the ECFMG, both by permission of the NBME and ECFMG; and measures 6-10 are from the AAMC Data Warehouse.
Charting Outcomes in the Match, SMS, 201398Copyright ©2013 NRMP and AAMC. Copies may be made for educational or noncommercial uses only.
Source: NRMP Data Warehouse
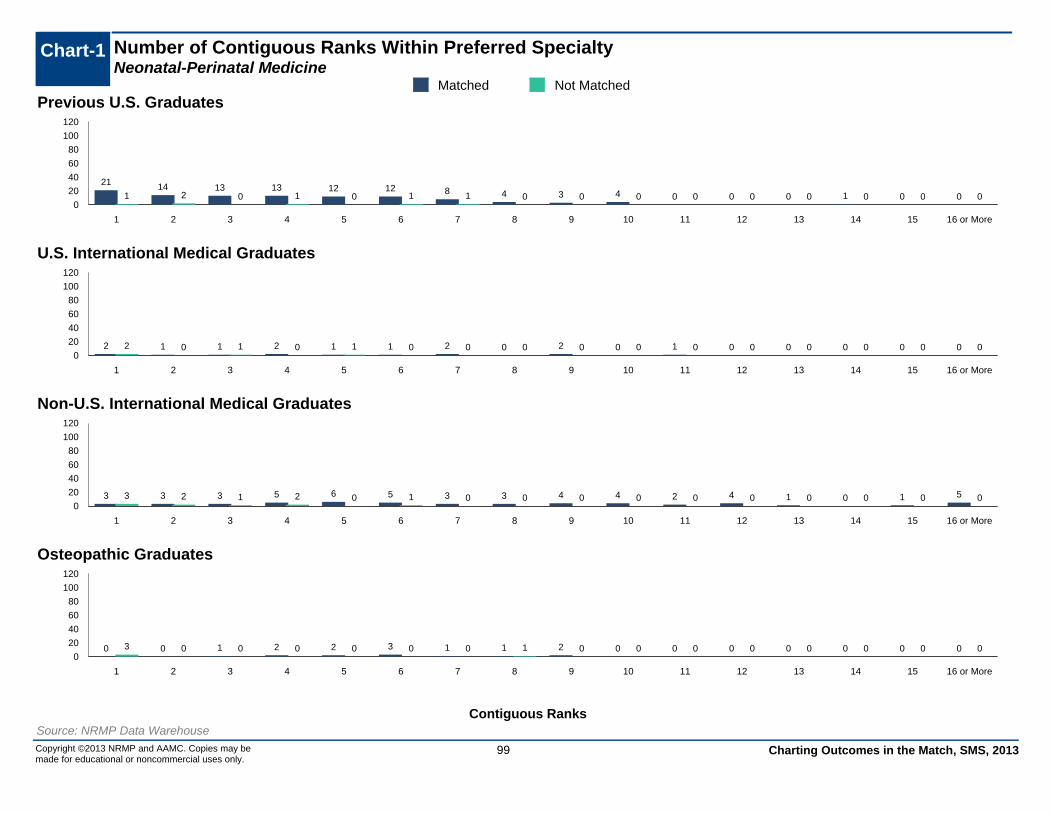
0
20
40
60
80
100
120
1 2 3 4 5 6 7 8 9 10 11 12 13 14 15 16 or More
21 14 13 13 12 12 8 4 3 4 0 0 0 1 0 01 2 0 1 0 1 1 0 0 0 0 0 0 0 0 0
Previous U.S. Graduates
0
20
40
60
80
100
120
1 2 3 4 5 6 7 8 9 10 11 12 13 14 15 16 or More
2 1 1 2 1 1 2 0 2 0 1 0 0 0 0 02 0 1 0 1 0 0 0 0 0 0 0 0 0 0 0
U.S. International Medical Graduates
0
20
40
60
80
100
120
1 2 3 4 5 6 7 8 9 10 11 12 13 14 15 16 or More
3 3 3 5 6 5 3 3 4 4 2 4 1 0 1 53 2 1 2 0 1 0 0 0 0 0 0 0 0 0 0
Non-U.S. International Medical Graduates
0
20
40
60
80
100
120
1 2 3 4 5 6 7 8 9 10 11 12 13 14 15 16 or More
0 0 1 2 2 3 1 1 2 0 0 0 0 0 0 03 0 0 0 0 0 0 1 0 0 0 0 0 0 0 0
Osteopathic Graduates
Chart-1 Number of Contiguous Ranks Within Preferred SpecialtyNeonatal-Perinatal Medicine
Copyright ©2013 NRMP and AAMC. Copies may be made for educational or noncommercial uses only.
Source: NRMP Data Warehouse
Charting Outcomes in the Match, SMS, 2013
Contiguous Ranks
Matched Not Matched
99

Graph-1 Probability of Matching to Preferred Specialty by Number of Contiguous RanksNeonatal-Perinatal Medicine
0.00
0.10
0.20
0.30
0.40
0.50
0.60
0.70
0.80
0.90
1.00
0 1 2 3 4 5 6 7 8 9 10 11 12 13 14 15 16 17 18 19 20
Non-U.S. InternationalMedical Graduates
Previous U.S. Graduates U.S. InternationalMedical Graduates
Probability of Matching
Copyright ©2013 NRMP and AAMC. Copies may be made for educational or noncommercial uses only.
Source: NRMP Data Warehouse.
100 Charting Outcomes in the Match, SMS, 2013
Contiguous Ranks

Chart-2 Number of Distinct Specialties RankedNeonatal-Perinatal Medicine
0
100
200
300
400
500
600
1 2 3 4 or More
105
0 0 06 0 0 0
Previous U.S. Graduates
0
100
200
300
400
500
600
1 2 3 4 or More
13 0 0 04 0 0 0
U.S. International Medical Graduates
0
100
200
300
400
500
600
1 2 3 4 or More
520 0 09 0 0 0
Non-U.S. International Medical Graduates
0
100
200
300
400
500
600
1 2 3 4 or More
12 0 0 04 0 0 0
Osteopathic Graduates
Copyright ©2013 NRMP and AAMC. Copies may be made for educational or noncommercial uses only.
Source: NRMP Data Warehouse
101 Charting Outcomes in the Match, SMS, 2013
Distinct Specialties Ranked
Matched Not Matched

Chart-3 USMLE Step 1 ScoresNeonatal-Perinatal Medicine
0
10
20
30
40
50
60
70
80
<= 180 Between 181 and190
Between 191 and200
Between 201 and210
Between 211 and220
Between 221 and230
Between 231 and240
Between 241 and250
Between 251 and260
>260 Score Unknown
0
14 11 1322
11
22
82 2 00 0 0 3 2 1 0 0 0 0 0
Previous U.S. Graduates
0
10
20
30
40
50
60
70
80
<= 180 Between 181 and190
Between 191 and200
Between 201 and210
Between 211 and220
Between 221 and230
Between 231 and240
Between 241 and250
Between 251 and260
>260 Score Unknown
0 2 2 4 3 1 0 1 0 0 00 1 2 0 1 0 0 0 0 0 0
U.S. International Medical Graduates
0
10
20
30
40
50
60
70
80
<= 180 Between 181 and190
Between 191 and200
Between 201 and210
Between 211 and220
Between 221 and230
Between 231 and240
Between 241 and250
Between 251 and260
>260 Score Unknown
04
9 7 514
101 1 1 00 0 3 1 2 3 0 0 0 0 0
Non-U.S. International Medical Graduates
Copyright ©2013 NRMP and AAMC. Copies may be made for educational or noncommercial uses only.
Source: NRMP Data Warehouse and AAMC Data Warehouse. USMLE scores by permission of the NBME and ECFMG.
102 Charting Outcomes in the Match, SMS, 2013
Step 1 Scores
Matched Not Matched

Graph-2 Probability of Matching to Preferred Specialty by USMLE Step 1 ScoreNeonatal-Perinatal Medicine
0.00
0.10
0.20
0.30
0.40
0.50
0.60
0.70
0.80
0.90
1.00
160 180 200 220 240 260 280
Non-U.S. InternationalMedical Graduates Previous U.S. Graduates
U.S. InternationalMedical Graduates
Probability of Matching
Copyright ©2013 NRMP and AAMC. Copies may be made for educational or noncommercial uses only.
Source: NRMP Data Warehouse and AAMC Data Warehouse. USMLE scores by permission of the NBME and ECFMG. Note: Probabilities calculated based on 2009-2011 applicants.
103 Charting Outcomes in the Match, SMS, 2013
Step 1 Scores

Chart-4 USMLE Step 2 ScoresNeonatal-Perinatal Medicine
0
10
20
30
40
50
60
70
80
<= 180 Between 181and 190
Between 191and 200
Between 201and 210
Between 211and 220
Between 221and 230
Between 231and 240
Between 241and 250
Between 251and 260
>260 Score Unknown
05
11 1015 15
22
8 11 800 0 0 2 0 2 1 0 0 1 0
Previous U.S. Graduates
0
10
20
30
40
50
60
70
80
<= 180 Between 181and 190
Between 191and 200
Between 201and 210
Between 211and 220
Between 221and 230
Between 231and 240
Between 241and 250
Between 251and 260
>260 Score Unknown
04 2 2 3 0 0 1 1 0 00 2 1 0 0 0 0 0 1 0 0
U.S. International Medical Graduates
0
10
20
30
40
50
60
70
80
<= 180 Between 181and 190
Between 191and 200
Between 201and 210
Between 211and 220
Between 221and 230
Between 231and 240
Between 241and 250
Between 251and 260
>260 Score Unknown
05 4 7 10 9 9
5 2 1 00 0 1 2 15
0 0 0 0 0
Non-U.S. International Medical Graduates
Copyright ©2013 NRMP and AAMC. Copies may be made for educational or noncommercial uses only.
Source: NRMP Data Warehouse and AAMC Data Warehouse. USMLE scores by permission of the NBME and ECFMG.104 Charting Outcomes in the Match, SMS, 2013
Step 2 Scores
Matched Not Matched

Charting Outcomes in the Match, SMS, 2013Copyright ©2013 NRMP and AAMC. Copies may be made for educational or noncommercial uses only.
Source: NRMP Data Warehouse and AAMC Data Warehouse. USMLE scores by permission of the NBME and ECFMG. Note: Probabilities calculated based on 2009-2011 applican
Probability of Matching to Preferred Specialty by USMLE Step 2 ScoreNeonatal-Perinatal Medicine
Graph-3
0.00
0.10
0.20
0.30
0.40
0.50
0.60
0.70
0.80
0.90
1.00
160 180 200 220 240 260 280
Non-U.S. InternationalMedical Graduates Previous U.S. Graduates
U.S. InternationalMedical Graduates
Probability of Matching
105
Step 2 Scores

106 Charting Outcomes in the Match, SMS, 2013Copyright ©2013 NRMP and AAMC. Copies may be made for educational or noncommercial uses only.
Source: NRMP Data Warehouse and AAMC Data Warehouse. USMLE scores by permission of the NBME and ECFMG.
Step 3 Scores
Chart-5 USMLE Step 3 ScoresNeonatal-Perinatal Medicine
0
20
40
60
80
100
120
140
160
<= 180 Between 181and 190
Between 191and 200
Between 201and 210
Between 211and 220
Between 221and 230
Between 231and 240
Between 241and 250
Between 251and 260
>260 Score Unknown
0 311 17 16 13 9 9
0 3
24
0 1 1 0 1 2 0 0 0 0 1
Previous U.S. Graduates
0
20
40
60
80
100
120
140
160
<= 180 Between 181and 190
Between 191and 200
Between 201and 210
Between 211and 220
Between 221and 230
Between 231and 240
Between 241and 250
Between 251and 260
>260 Score Unknown
0 2 2 1 1 0 0 0 0 0 70 1 2 0 0 0 0 0 0 0 1
U.S. International Medical Graduates
0
20
40
60
80
100
120
140
160
<= 180 Between 181and 190
Between 191and 200
Between 201and 210
Between 211and 220
Between 221and 230
Between 231and 240
Between 241and 250
Between 251and 260
>260 Score Unknown
1 7 13 156 3 0 0 1 0 60 3 3 1 1 1 0 0 0 0 0
Non-U.S. International Medical Graduates
Matched Not Matched

Graph-4 Probability of Matching to Preferred Specialty by USMLE Step 3 ScoreNeonatal-Perinatal Medicine
Charting Outcomes in the Match, SMS, 2013Copyright ©2013 NRMP and AAMC. Copies may be made for educational or noncommercial uses only.
Source: NRMP Data Warehouse and AAMC Data Warehouse. USMLE scores by permission of the NBME and ECFMG. Note: Probabilities calculated based on 2009-2011 applican
0.00
0.10
0.20
0.30
0.40
0.50
0.60
0.70
0.80
0.90
1.00
160 180 200 220 240 260 280
Non-U.S. InternationalMedical Graduates Previous U.S. Graduates U.S. International
Medical Graduates
Probability of Matching
107
Step 3 Scores

Chart-6 Number of Research ProjectsNeonatal-Perinatal Medicine
0
50
100
150
200
250
300
None 1 2 3 4 5 or More
89
9 1 0 0 65 1 0 0 0 0
Previous U.S. Graduates
0
50
100
150
200
250
300
None 1 2 3 4 5 or More
8 2 2 0 1 01 2 1 0 0 0
U.S. International Medical Graduates
0
50
100
150
200
250
300
None 1 2 3 4 5 or More
28 16 6 1 1 06 2 1 0 0 0
Non-U.S. International Medical Graduates
0
50
100
150
200
250
300
None 1 2 3 4 5 or More
11 1 0 0 0 04 0 0 0 0 0
Osteopathic Graduates
Copyright ©2013 NRMP and AAMC. Copies may be made for educational or noncommercial uses only.
Source: NRMP Data Warehouse and AAMC Data Warehouse
108 Charting Outcomes in the Match, SMS, 2013
Research Projects
Matched Not Matched

Chart-7 Number of Abstracts, Presentations, and PublicationsNeonatal-Perinatal Medicine
0
20
40
60
80
100
120
140
None 1 2 3 4 5 or More
67
178 1 2
105 0 1 0 0 0
Previous U.S. Graduates
0
20
40
60
80
100
120
140
None 1 2 3 4 5 or More
5 2 3 0 1 23 0 0 1 0 0
U.S. International Medical Graduates
0
20
40
60
80
100
120
140
None 1 2 3 4 5 or More
24
4 6 1 116
7 0 1 0 1 0
Non-U.S. International Medical Graduates
0
20
40
60
80
100
120
140
None 1 2 3 4 5 or More
8 2 1 1 0 04 0 0 0 0 0
Osteopathic Graduates
Copyright ©2013 NRMP and AAMC. Copies may be made for educational or noncommercial uses only.
Source: NRMP Data Warehouse and AAMC Data Warehouse109 Charting Outcomes in the Match, SMS, 2013
Publications
Matched Not Matched

Chart-8 Number of Work ExperiencesNeonatal-Perinatal Medicine
0
20
40
60
80
100
None 1 2 3 4 5 or More
87
101 1 0
64 2 0 0 0 0
Previous U.S. Graduates
0
20
40
60
80
100
None 1 2 3 4 5 or More
6 4 1 2 0 01 0 1 0 0 2
U.S. International Medical Graduates
0
20
40
60
80
100
None 1 2 3 4 5 or More
147 12 7 5 75 2 0 0 0 2
Non-U.S. International Medical Graduates
0
20
40
60
80
100
None 1 2 3 4 5 or More
102 0 0 0 03 1 0 0 0 0
Osteopathic Graduates
Copyright ©2013 NRMP and AAMC. Copies may be made for educational or noncommercial uses only.
Source: NRMP Data Warehouse and AAMC Data Warehouse110 Charting Outcomes in the Match, SMS, 2013
Work Experiences
Matched Not Matched

Chart-9 Number of Volunteer ExperiencesNeonatal-Perinatal Medicine
0
80
160
240
320
400
6915 5 3 0 0 0 0 0 0 63 2 0 0 0 0 0 0 0 1 1
None 1 2 3 4 5 6 7 8 9 10 or More
Previous U.S. Graduates
0
80
160
240
320
400
4 1 0 1 0 1 0 0 0 0 01 0 0 1 0 0 0 0 0 0 0
None 1 2 3 4 5 6 7 8 9 10 or More
U.S. International Medical Graduates
0
80
160
240
320
400
20 14 11 3 0 0 0 0 0 0 12 0 0 0 0 0 0 0 0 0 1
None 1 2 3 4 5 6 7 8 9 10 or More
Non-U.S. International Medical Graduates
0
80
160
240
320
400
9 0 1 1 0 0 0 0 0 0 02 0 0 0 0 0 0 0 0 0 0
None 1 2 3 4 5 6 7 8 9 10 or More
Osteopathic Graduates
Copyright ©2013 NRMP and AAMC. Copies may be made for educational or noncommercial uses only.
Source: NRMP Data Warehouse and AAMC Data Warehouse111 Charting Outcomes in the Match, SMS, 2013
Volunteer Experiences
Matched Not Matched

Chart-10
Percentage of U.S. Graduates Who are Members of AOANeonatal-Perinatal Medicine
0
50
100
150
200
250
300
350
No Yes
85
145 1
Matched Not Matched
AOA Membership
Sources: NRMP Data Warehouse and AAMC Data Warehouse
Copyright ©2013 NRMP and AAMC. Copies may be made for educational or noncommercial uses only.
112 Charting Outcomes in the Match, SMS, 2013

Nephrology

Table-1 Summary StatisticsNephrology
Measure (n=91) (n=2) (n=42) (n=35)
Previous U.S. Graduates
U.S.International Medical Graduates
Matched Unmatched Matched Unmatched(n=96)(n=189)
UnmatchedMatched
Non-U.S. InternationalMedical Graduates
(n=8)(n=15)UnmatchedMatched
Osteopathic Graduates
65 4Mean number of contiguous ranks1. 7 3 5 5n/a
11 1Mean number of distinct specialties ranked2. 1 1 1 1n/a
211221 204Mean USMLE Step 1 score3. 226 220 n/an/an/a
213228 204Mean USMLE Step 2 score4. 230 220 n/an/an/a
207219 197Mean USMLE Step 3 score5. 207 200 n/an/an/a
10 1Mean number of research experiences6. 1 1 0 0n/a
31 3Mean number of abstracts, presentations, and publications
7. 5 3 1 2n/a
10 1Mean number of work experiences8. 2 3 0 0n/a
00 0Mean number of volunteer experiences9. 1 1 0 1n/a
14Percentage who are AOA members n/a n/a10. n/an/a n/an/an/a
n/a: The measure either does not apply to, applies to only a small percentage of, or no reliable data were available for this type of applicants.Note: USMLE Step scores are not available for most osteopathic medical school graduates.
Sources: Measures 1, 2, and match outcome are from the NRMP Data Warehouse; measures 3, 4, and 5 are from the AAMC Data Warehouse and from the ECFMG, both by permission of the NBME and ECFMG; and measures 6-10 are from the AAMC Data Warehouse.
Charting Outcomes in the Match, SMS, 2013114Copyright ©2013 NRMP and AAMC. Copies may be made for educational or noncommercial uses only.
Source: NRMP Data Warehouse

0
20
40
60
80
100
120
1 2 3 4 5 6 7 8 9 10 11 12 13 14 15 16 or More
11 10 9 9 9 11 12 6 3 6 1 4 0 0 0 01 0 1 0 0 0 0 0 0 0 0 0 0 0 0 0
Previous U.S. Graduates
0
20
40
60
80
100
120
1 2 3 4 5 6 7 8 9 10 11 12 13 14 15 16 or More
112 4 3 3 2 2 4 2 5 0 2 0 0 0 2
156 1 3 5 0 0 0 1 2 0 1 0 0 0 1
U.S. International Medical Graduates
0
20
40
60
80
100
120
1 2 3 4 5 6 7 8 9 10 11 12 13 14 15 16 or More
18 14 18 17 1423 17
8 12 9 10 8 2 4 5 10
3925
8 6 8 4 2 0 0 1 0 1 0 1 1 0
Non-U.S. International Medical Graduates
0
20
40
60
80
100
120
1 2 3 4 5 6 7 8 9 10 11 12 13 14 15 16 or More
3 1 2 1 2 3 0 0 1 0 2 0 0 0 0 02 1 1 1 0 0 0 2 0 0 1 0 0 0 0 0
Osteopathic Graduates
Chart-1 Number of Contiguous Ranks Within Preferred SpecialtyNephrology
Copyright ©2013 NRMP and AAMC. Copies may be made for educational or noncommercial uses only.
Source: NRMP Data Warehouse
Charting Outcomes in the Match, SMS, 2013
Contiguous Ranks
Matched Not Matched
115
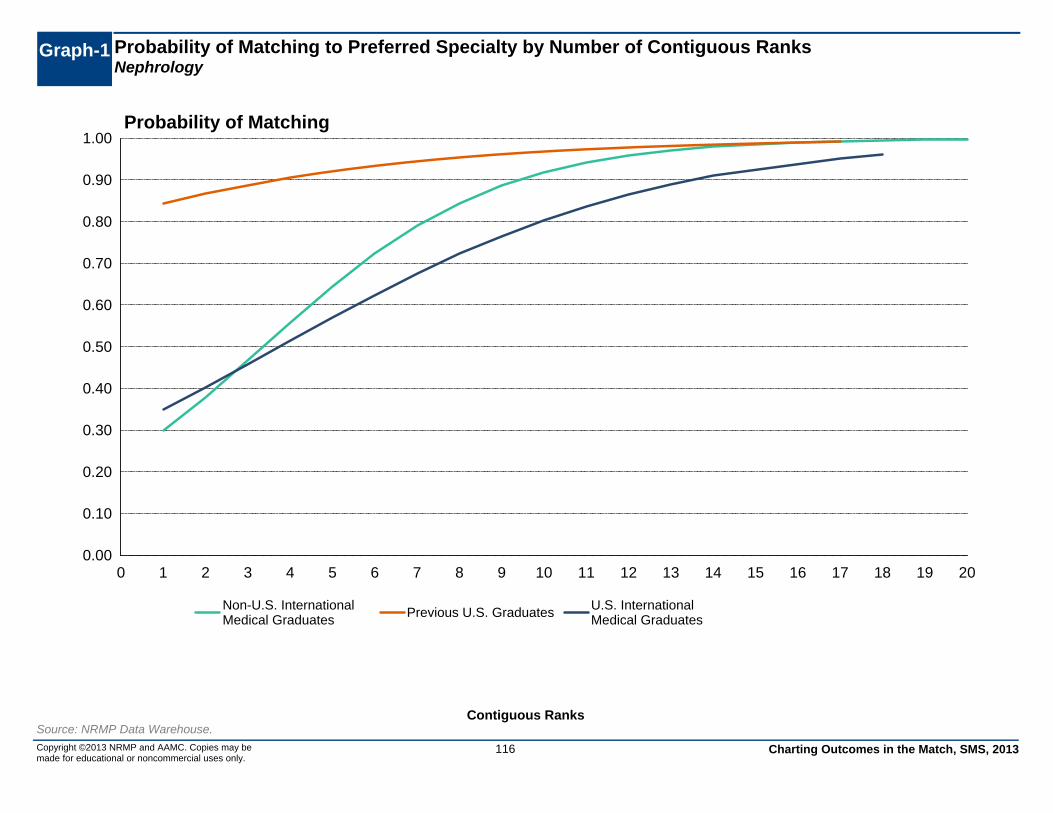
Graph-1 Probability of Matching to Preferred Specialty by Number of Contiguous RanksNephrology
0.00
0.10
0.20
0.30
0.40
0.50
0.60
0.70
0.80
0.90
1.00
0 1 2 3 4 5 6 7 8 9 10 11 12 13 14 15 16 17 18 19 20
Non-U.S. InternationalMedical Graduates
Previous U.S. Graduates U.S. InternationalMedical Graduates
Probability of Matching
Copyright ©2013 NRMP and AAMC. Copies may be made for educational or noncommercial uses only.
Source: NRMP Data Warehouse.
116 Charting Outcomes in the Match, SMS, 2013
Contiguous Ranks

Chart-2 Number of Distinct Specialties RankedNephrology
0
100
200
300
400
500
600
1 2 3 4 or More
91
0 0 02 0 0 0
Previous U.S. Graduates
0
100
200
300
400
500
600
1 2 3 4 or More
384 0 031 2 2 0
U.S. International Medical Graduates
0
100
200
300
400
500
600
1 2 3 4 or More
184
5 0 0
89
5 2 0
Non-U.S. International Medical Graduates
0
100
200
300
400
500
600
1 2 3 4 or More
15 0 0 07 1 0 0
Osteopathic Graduates
Copyright ©2013 NRMP and AAMC. Copies may be made for educational or noncommercial uses only.
Source: NRMP Data Warehouse
117 Charting Outcomes in the Match, SMS, 2013
Distinct Specialties Ranked
Matched Not Matched

Chart-3 USMLE Step 1 ScoresNephrology
0
10
20
30
40
50
60
70
80
<= 180 Between 181 and190
Between 191 and200
Between 201 and210
Between 211 and220
Between 221 and230
Between 231 and240
Between 241 and250
Between 251 and260
>260 Score Unknown
06 9 10
2016 19
7 40 00 0 0 0 2 0 0 0 0 0 0
Previous U.S. Graduates
0
10
20
30
40
50
60
70
80
<= 180 Between 181 and190
Between 191 and200
Between 201 and210
Between 211 and220
Between 221 and230
Between 231 and240
Between 241 and250
Between 251 and260
>260 Score Unknown
0 210 9 8 8
2 0 1 0 22 48 7 8
2 2 0 0 0 2
U.S. International Medical Graduates
0
10
20
30
40
50
60
70
80
<= 180 Between 181 and190
Between 191 and200
Between 201 and210
Between 211 and220
Between 221 and230
Between 231 and240
Between 241 and250
Between 251 and260
>260 Score Unknown
04
1118
30
4044
22
101
90
5 6
18 1822 19
3 2 1 2
Non-U.S. International Medical Graduates
Copyright ©2013 NRMP and AAMC. Copies may be made for educational or noncommercial uses only.
Source: NRMP Data Warehouse and AAMC Data Warehouse. USMLE scores by permission of the NBME and ECFMG.
118 Charting Outcomes in the Match, SMS, 2013
Step 1 Scores
Matched Not Matched

Graph-2 Probability of Matching to Preferred Specialty by USMLE Step 1 ScoreNephrology
0.00
0.10
0.20
0.30
0.40
0.50
0.60
0.70
0.80
0.90
1.00
160 180 200 220 240 260 280
Non-U.S. InternationalMedical Graduates Previous U.S. Graduates
U.S. InternationalMedical Graduates
Probability of Matching
Copyright ©2013 NRMP and AAMC. Copies may be made for educational or noncommercial uses only.
Source: NRMP Data Warehouse and AAMC Data Warehouse. USMLE scores by permission of the NBME and ECFMG. Note: Probabilities calculated based on 2009-2011 applicants.
119 Charting Outcomes in the Match, SMS, 2013
Step 1 Scores

Chart-4 USMLE Step 2 ScoresNephrology
0
10
20
30
40
50
60
70
80
<= 180 Between 181and 190
Between 191and 200
Between 201and 210
Between 211and 220
Between 221and 230
Between 231and 240
Between 241and 250
Between 251and 260
>260 Score Unknown
08 5 8 11
15 15 13 14
2 00 1 0 0 0 0 0 1 0 0 0
Previous U.S. Graduates
0
10
20
30
40
50
60
70
80
<= 180 Between 181and 190
Between 191and 200
Between 201and 210
Between 211and 220
Between 221and 230
Between 231and 240
Between 241and 250
Between 251and 260
>260 Score Unknown
0 37 8 8 9
3 2 0 0 22 59
5 5 5 2 0 0 0 2
U.S. International Medical Graduates
0
10
20
30
40
50
60
70
80
<= 180 Between 181and 190
Between 191and 200
Between 201and 210
Between 211and 220
Between 221and 230
Between 231and 240
Between 241and 250
Between 251and 260
>260 Score Unknown
1 37
12
3038 40
31
126 9
17 10 10
1521 18
82 2 2
Non-U.S. International Medical Graduates
Copyright ©2013 NRMP and AAMC. Copies may be made for educational or noncommercial uses only.
Source: NRMP Data Warehouse and AAMC Data Warehouse. USMLE scores by permission of the NBME and ECFMG.120 Charting Outcomes in the Match, SMS, 2013
Step 2 Scores
Matched Not Matched

Charting Outcomes in the Match, SMS, 2013Copyright ©2013 NRMP and AAMC. Copies may be made for educational or noncommercial uses only.
Source: NRMP Data Warehouse and AAMC Data Warehouse. USMLE scores by permission of the NBME and ECFMG. Note: Probabilities calculated based on 2009-2011 applican
Probability of Matching to Preferred Specialty by USMLE Step 2 ScoreNephrology
Graph-3
0.00
0.10
0.20
0.30
0.40
0.50
0.60
0.70
0.80
0.90
1.00
160 180 200 220 240 260 280
Non-U.S. InternationalMedical Graduates Previous U.S. Graduates
U.S. InternationalMedical Graduates
Probability of Matching
121
Step 2 Scores

122 Charting Outcomes in the Match, SMS, 2013Copyright ©2013 NRMP and AAMC. Copies may be made for educational or noncommercial uses only.
Source: NRMP Data Warehouse and AAMC Data Warehouse. USMLE scores by permission of the NBME and ECFMG.
Step 3 Scores
Chart-5 USMLE Step 3 ScoresNephrology
0
20
40
60
80
100
120
140
160
<= 180 Between 181and 190
Between 191and 200
Between 201and 210
Between 211and 220
Between 221and 230
Between 231and 240
Between 241and 250
Between 251and 260
>260 Score Unknown
0 110 9 8 11 9 6 1 0
36
0 0 0 0 0 0 0 0 0 0 2
Previous U.S. Graduates
0
20
40
60
80
100
120
140
160
<= 180 Between 181and 190
Between 191and 200
Between 201and 210
Between 211and 220
Between 221and 230
Between 231and 240
Between 241and 250
Between 251and 260
>260 Score Unknown
0 4 6 7 6 4 1 0 0 014
2 7 9 7 3 1 0 0 0 0 6
U.S. International Medical Graduates
0
20
40
60
80
100
120
140
160
<= 180 Between 181and 190
Between 191and 200
Between 201and 210
Between 211and 220
Between 221and 230
Between 231and 240
Between 241and 250
Between 251and 260
>260 Score Unknown
015
39 4628
179
1 0 0
34
118
26 28
9 5 0 0 0 09
Non-U.S. International Medical Graduates
Matched Not Matched

Graph-4 Probability of Matching to Preferred Specialty by USMLE Step 3 ScoreNephrology
Charting Outcomes in the Match, SMS, 2013Copyright ©2013 NRMP and AAMC. Copies may be made for educational or noncommercial uses only.
Source: NRMP Data Warehouse and AAMC Data Warehouse. USMLE scores by permission of the NBME and ECFMG. Note: Probabilities calculated based on 2009-2011 applican
0.00
0.10
0.20
0.30
0.40
0.50
0.60
0.70
0.80
0.90
1.00
160 180 200 220 240 260
Non-U.S. InternationalMedical Graduates Previous U.S. Graduates U.S. International
Medical Graduates
Probability of Matching
123
Step 3 Scores

Chart-6 Number of Research ProjectsNephrology
0
50
100
150
200
250
300
None 1 2 3 4 5 or More
75
12 3 1 0 02 0 0 0 0 0
Previous U.S. Graduates
0
50
100
150
200
250
300
None 1 2 3 4 5 or More
305 5 1 0 117 14 3 0 1 0
U.S. International Medical Graduates
0
50
100
150
200
250
300
None 1 2 3 4 5 or More
9259
22 7 4 5
5627
6 5 2 0
Non-U.S. International Medical Graduates
0
50
100
150
200
250
300
None 1 2 3 4 5 or More
12 2 0 1 0 07 1 0 0 0 0
Osteopathic Graduates
Copyright ©2013 NRMP and AAMC. Copies may be made for educational or noncommercial uses only.
Source: NRMP Data Warehouse and AAMC Data Warehouse
124 Charting Outcomes in the Match, SMS, 2013
Research Projects
Matched Not Matched

Chart-7 Number of Abstracts, Presentations, and PublicationsNephrology
0
20
40
60
80
100
120
140
None 1 2 3 4 5 or More
53
188 3 1 81 0 1 0 0 0
Previous U.S. Graduates
0
20
40
60
80
100
120
140
None 1 2 3 4 5 or More
146 12
0 01010 7 7 4 0 7
U.S. International Medical Graduates
0
20
40
60
80
100
120
140
None 1 2 3 4 5 or More
36 3114
2414
70
26 1910 11 7
23
Non-U.S. International Medical Graduates
0
20
40
60
80
100
120
140
None 1 2 3 4 5 or More
6 5 3 1 0 04 1 1 0 1 1
Osteopathic Graduates
Copyright ©2013 NRMP and AAMC. Copies may be made for educational or noncommercial uses only.
Source: NRMP Data Warehouse and AAMC Data Warehouse125 Charting Outcomes in the Match, SMS, 2013
Publications
Matched Not Matched

Chart-8 Number of Work ExperiencesNephrology
0
20
40
60
80
100
None 1 2 3 4 5 or More
81
81 1 0 02 0 0 0 0 0
Previous U.S. Graduates
0
20
40
60
80
100
None 1 2 3 4 5 or More
25
82 1 6
0
21
3 4 3 3 1
U.S. International Medical Graduates
0
20
40
60
80
100
None 1 2 3 4 5 or More
4937 38
2517
2318 18 1521
11 13
Non-U.S. International Medical Graduates
0
20
40
60
80
100
None 1 2 3 4 5 or More
123 0 0 0 0
71 0 0 0 0
Osteopathic Graduates
Copyright ©2013 NRMP and AAMC. Copies may be made for educational or noncommercial uses only.
Source: NRMP Data Warehouse and AAMC Data Warehouse126 Charting Outcomes in the Match, SMS, 2013
Work Experiences
Matched Not Matched

Chart-9 Number of Volunteer ExperiencesNephrology
0
80
160
240
320
400
105
14 2 1 0 0 0 0 0 0 012 2 1 1 0 0 0 0 0 0 0
None 1 2 3 4 5 6 7 8 9 10 or More
Previous U.S. Graduates
0
80
160
240
320
400
346 0 3 0 2 1 0 0 0 0
262 3 1 0 0 0 0 0 0 0
None 1 2 3 4 5 6 7 8 9 10 or More
U.S. International Medical Graduates
0
80
160
240
320
400
104
3916 7 0 2 0 0 0 0 0
88
30 16 6 0 0 0 1 1 0 0
None 1 2 3 4 5 6 7 8 9 10 or More
Non-U.S. International Medical Graduates
0
80
160
240
320
400
8 0 0 0 0 0 0 0 0 0 07 0 0 0 0 0 0 0 0 0 0
None 1 2 3 4 5 6 7 8 9 10 or More
Osteopathic Graduates
Copyright ©2013 NRMP and AAMC. Copies may be made for educational or noncommercial uses only.
Source: NRMP Data Warehouse and AAMC Data Warehouse127 Charting Outcomes in the Match, SMS, 2013
Volunteer Experiences
Matched Not Matched

Chart-10
Percentage of U.S. Graduates Who are Members of AOANephrology
0
50
100
150
200
250
300
350
No Yes
78
132 0
Matched Not Matched
AOA Membership
Sources: NRMP Data Warehouse and AAMC Data Warehouse
Copyright ©2013 NRMP and AAMC. Copies may be made for educational or noncommercial uses only.
128 Charting Outcomes in the Match, SMS, 2013

Pulmonary Disease and Critical Care Medicine

Table-1 Summary StatisticsPulmonary Disease and Critical Care Medicine
Measure (n=190) (n=24) (n=54) (n=40)
Previous U.S. Graduates
U.S.International Medical Graduates
Matched Unmatched Matched Unmatched(n=91)(n=123)
UnmatchedMatched
Non-U.S. InternationalMedical Graduates
(n=17)(n=27)UnmatchedMatched
Osteopathic Graduates
55 3 3Mean number of contiguous ranks1. 7 2 4 4
11 1 1Mean number of distinct specialties ranked2. 1 1 1 1
216223 210 208Mean USMLE Step 1 score3. 231 221 210n/a
218233 213 210Mean USMLE Step 2 score4. 235 225 199n/a
209222 208 202Mean USMLE Step 3 score5. 210 202 203n/a
00 0 0Mean number of research experiences6. 1 1 0 0
22 2 3Mean number of abstracts, presentations, and publications
7. 4 4 2 1
10 0 2Mean number of work experiences8. 2 3 0 0
10 0 1Mean number of volunteer experiences9. 1 1 0 0
18 4Percentage who are AOA members n/a n/a10. n/an/a n/an/a
n/a: The measure either does not apply to, applies to only a small percentage of, or no reliable data were available for this type of applicants.Note: USMLE Step scores are not available for most osteopathic medical school graduates.
Sources: Measures 1, 2, and match outcome are from the NRMP Data Warehouse; measures 3, 4, and 5 are from the AAMC Data Warehouse and from the ECFMG, both by permission of the NBME and ECFMG; and measures 6-10 are from the AAMC Data Warehouse.
Charting Outcomes in the Match, SMS, 2013130Copyright ©2013 NRMP and AAMC. Copies may be made for educational or noncommercial uses only.
Source: NRMP Data Warehouse

0
20
40
60
80
100
120
1 2 3 4 5 6 7 8 9 10 11 12 13 14 15 16 or More
2515 16 23 23
12
31
12 11 11 6 4 1 0 0 011 4 2 3 2 0 2 0 0 0 0 0 0 0 0 0
Previous U.S. Graduates
0
20
40
60
80
100
120
1 2 3 4 5 6 7 8 9 10 11 12 13 14 15 16 or More
7 11 6 3 6 3 4 1 2 6 1 0 1 0 2 111 12 5 7 2 1 0 0 0 2 0 0 0 0 0 0
U.S. International Medical Graduates
0
20
40
60
80
100
120
1 2 3 4 5 6 7 8 9 10 11 12 13 14 15 16 or More
188 13 9 13 9 6 8 9 9 3 4 6 2 1 5
53
15 134 3 1 0 0 1 1 0 0 0 0 0 0
Non-U.S. International Medical Graduates
0
20
40
60
80
100
120
1 2 3 4 5 6 7 8 9 10 11 12 13 14 15 16 or More
5 2 3 6 6 1 0 1 3 0 0 0 0 0 0 04 2 1 5 0 2 2 0 0 0 0 0 0 0 1 0
Osteopathic Graduates
Chart-1 Number of Contiguous Ranks Within Preferred SpecialtyPulmonary Disease and Critical Care Medicine
Copyright ©2013 NRMP and AAMC. Copies may be made for educational or noncommercial uses only.
Source: NRMP Data Warehouse
Charting Outcomes in the Match, SMS, 2013
Contiguous Ranks
Matched Not Matched
131

Graph-1 Probability of Matching to Preferred Specialty by Number of Contiguous RanksPulmonary Disease and Critical Care Medicine
0.00
0.10
0.20
0.30
0.40
0.50
0.60
0.70
0.80
0.90
1.00
0 1 2 3 4 5 6 7 8 9 10 11 12 13 14 15 16 17 18 19 20
Non-U.S. InternationalMedical Graduates
Previous U.S. Graduates U.S. InternationalMedical Graduates
Probability of Matching
Copyright ©2013 NRMP and AAMC. Copies may be made for educational or noncommercial uses only.
Source: NRMP Data Warehouse.
132 Charting Outcomes in the Match, SMS, 2013
Contiguous Ranks

Chart-2 Number of Distinct Specialties RankedPulmonary Disease and Critical Care Medicine
0
100
200
300
400
500
600
1 2 3 4 or More
188
2 0 024 0 0 0
Previous U.S. Graduates
0
100
200
300
400
500
600
1 2 3 4 or More
477 0 0
363 1 0
U.S. International Medical Graduates
0
100
200
300
400
500
600
1 2 3 4 or More
109
14 0 077
14 0 0
Non-U.S. International Medical Graduates
0
100
200
300
400
500
600
1 2 3 4 or More
27 0 0 015 2 0 0
Osteopathic Graduates
Copyright ©2013 NRMP and AAMC. Copies may be made for educational or noncommercial uses only.
Source: NRMP Data Warehouse
133 Charting Outcomes in the Match, SMS, 2013
Distinct Specialties Ranked
Matched Not Matched

Chart-3 USMLE Step 1 ScoresPulmonary Disease and Critical Care Medicine
0
10
20
30
40
50
60
70
80
<= 180 Between 181 and190
Between 191 and200
Between 201 and210
Between 211 and220
Between 221 and230
Between 231 and240
Between 241 and250
Between 251 and260
>260 Score Unknown
09
18
3123
3831
21
117
10 26 7
2 2 50 0 0 0
Previous U.S. Graduates
0
10
20
30
40
50
60
70
80
<= 180 Between 181 and190
Between 191 and200
Between 201 and210
Between 211 and220
Between 221 and230
Between 231 and240
Between 241 and250
Between 251 and260
>260 Score Unknown
0 39 8 7
16
2 3 1 1 40
610
59 6
0 2 1 0 1
U.S. International Medical Graduates
0
10
20
30
40
50
60
70
80
<= 180 Between 181 and190
Between 191 and200
Between 201 and210
Between 211 and220
Between 221 and230
Between 231 and240
Between 241 and250
Between 251 and260
>260 Score Unknown
0 3 29
17
2822 25
84 5
0 3
139
18 17 19
5 4 1 2
Non-U.S. International Medical Graduates
Copyright ©2013 NRMP and AAMC. Copies may be made for educational or noncommercial uses only.
Source: NRMP Data Warehouse and AAMC Data Warehouse. USMLE scores by permission of the NBME and ECFMG.
134 Charting Outcomes in the Match, SMS, 2013
Step 1 Scores
Matched Not Matched

Graph-2 Probability of Matching to Preferred Specialty by USMLE Step 1 ScorePulmonary Disease and Critical Care Medicine
0.00
0.10
0.20
0.30
0.40
0.50
0.60
0.70
0.80
0.90
1.00
160 180 200 220 240 260 280
Non-U.S. InternationalMedical Graduates Previous U.S. Graduates
U.S. InternationalMedical Graduates
Probability of Matching
Copyright ©2013 NRMP and AAMC. Copies may be made for educational or noncommercial uses only.
Source: NRMP Data Warehouse and AAMC Data Warehouse. USMLE scores by permission of the NBME and ECFMG. Note: Probabilities calculated based on 2009-2011 applicants.
135 Charting Outcomes in the Match, SMS, 2013
Step 1 Scores

Chart-4 USMLE Step 2 ScoresPulmonary Disease and Critical Care Medicine
0
10
20
30
40
50
60
70
80
<= 180 Between 181and 190
Between 191and 200
Between 201and 210
Between 211and 220
Between 221and 230
Between 231and 240
Between 241and 250
Between 251and 260
>260 Score Unknown
17 6
1623
29
39
27 2517
00 3 6 4 2 4 2 0 2 1 0
Previous U.S. Graduates
0
10
20
30
40
50
60
70
80
<= 180 Between 181and 190
Between 191and 200
Between 201and 210
Between 211and 220
Between 221and 230
Between 231and 240
Between 241and 250
Between 251and 260
>260 Score Unknown
0 38 9 8 9
4 5 2 2 40
7 410 7 6 3 2 0 0 1
U.S. International Medical Graduates
0
10
20
30
40
50
60
70
80
<= 180 Between 181and 190
Between 191and 200
Between 201and 210
Between 211and 220
Between 221and 230
Between 231and 240
Between 241and 250
Between 251and 260
>260 Score Unknown
0 3 49 9
1724
28
17
7 50
4 7 1014
18 179 8
2 2
Non-U.S. International Medical Graduates
Copyright ©2013 NRMP and AAMC. Copies may be made for educational or noncommercial uses only.
Source: NRMP Data Warehouse and AAMC Data Warehouse. USMLE scores by permission of the NBME and ECFMG.136 Charting Outcomes in the Match, SMS, 2013
Step 2 Scores
Matched Not Matched

Charting Outcomes in the Match, SMS, 2013Copyright ©2013 NRMP and AAMC. Copies may be made for educational or noncommercial uses only.
Source: NRMP Data Warehouse and AAMC Data Warehouse. USMLE scores by permission of the NBME and ECFMG. Note: Probabilities calculated based on 2009-2011 applican
Probability of Matching to Preferred Specialty by USMLE Step 2 ScorePulmonary Disease and Critical Care Medicine
Graph-3
0.00
0.10
0.20
0.30
0.40
0.50
0.60
0.70
0.80
0.90
1.00
160 180 200 220 240 260 280
Non-U.S. InternationalMedical Graduates Previous U.S. Graduates
U.S. InternationalMedical Graduates
Probability of Matching
137
Step 2 Scores

138 Charting Outcomes in the Match, SMS, 2013Copyright ©2013 NRMP and AAMC. Copies may be made for educational or noncommercial uses only.
Source: NRMP Data Warehouse and AAMC Data Warehouse. USMLE scores by permission of the NBME and ECFMG.
Step 3 Scores
Chart-5 USMLE Step 3 ScoresPulmonary Disease and Critical Care Medicine
0
20
40
60
80
100
120
140
160
<= 180 Between 181and 190
Between 191and 200
Between 201and 210
Between 211and 220
Between 221and 230
Between 231and 240
Between 241and 250
Between 251and 260
>260 Score Unknown
0 215 21 26
3618 19
3 1
49
1 3 6 2 3 3 3 1 0 0 2
Previous U.S. Graduates
0
20
40
60
80
100
120
140
160
<= 180 Between 181and 190
Between 191and 200
Between 201and 210
Between 211and 220
Between 221and 230
Between 231and 240
Between 241and 250
Between 251and 260
>260 Score Unknown
0 313 11 7 7 3 1 0 0
90 5 11 10 6 1 0 0 0 0 7
U.S. International Medical Graduates
0
20
40
60
80
100
120
140
160
<= 180 Between 181and 190
Between 191and 200
Between 201and 210
Between 211and 220
Between 221and 230
Between 231and 240
Between 241and 250
Between 251and 260
>260 Score Unknown
0 7
27 22 2816
6 1 0 016
110
27 2510 4 2 0 0 0
12
Non-U.S. International Medical Graduates
Matched Not Matched

Graph-4 Probability of Matching to Preferred Specialty by USMLE Step 3 ScorePulmonary Disease and Critical Care Medicine
Charting Outcomes in the Match, SMS, 2013Copyright ©2013 NRMP and AAMC. Copies may be made for educational or noncommercial uses only.
Source: NRMP Data Warehouse and AAMC Data Warehouse. USMLE scores by permission of the NBME and ECFMG. Note: Probabilities calculated based on 2009-2011 applican
0.00
0.10
0.20
0.30
0.40
0.50
0.60
0.70
0.80
0.90
1.00
160 180 200 220 240 260 280
Non-U.S. InternationalMedical Graduates Previous U.S. Graduates U.S. International
Medical Graduates
Probability of Matching
139
Step 3 Scores

Chart-6 Number of Research ProjectsPulmonary Disease and Critical Care Medicine
0
50
100
150
200
250
300
None 1 2 3 4 5 or More
144
377 1 0 117 7 0 0 0 0
Previous U.S. Graduates
0
50
100
150
200
250
300
None 1 2 3 4 5 or More
437 3 1 0 0
324 4 0 0 0
U.S. International Medical Graduates
0
50
100
150
200
250
300
None 1 2 3 4 5 or More
6629 17 5 4 2
5219 12 7 0 1
Non-U.S. International Medical Graduates
0
50
100
150
200
250
300
None 1 2 3 4 5 or More
234 0 0 0 016 0 0 1 0 0
Osteopathic Graduates
Copyright ©2013 NRMP and AAMC. Copies may be made for educational or noncommercial uses only.
Source: NRMP Data Warehouse and AAMC Data Warehouse
140 Charting Outcomes in the Match, SMS, 2013
Research Projects
Matched Not Matched

Chart-7 Number of Abstracts, Presentations, and PublicationsPulmonary Disease and Critical Care Medicine
0
20
40
60
80
100
120
140
None 1 2 3 4 5 or More
71
4532
15 11 1611 6 2 2 1 2
Previous U.S. Graduates
0
20
40
60
80
100
120
140
None 1 2 3 4 5 or More
209 9 3 2
11146 4 6 3 7
U.S. International Medical Graduates
0
20
40
60
80
100
120
140
None 1 2 3 4 5 or More
26 23 16 10 13
3526
12 12 9 6
26
Non-U.S. International Medical Graduates
0
20
40
60
80
100
120
140
None 1 2 3 4 5 or More
8 5 6 4 2 29 4 2 1 1 0
Osteopathic Graduates
Copyright ©2013 NRMP and AAMC. Copies may be made for educational or noncommercial uses only.
Source: NRMP Data Warehouse and AAMC Data Warehouse141 Charting Outcomes in the Match, SMS, 2013
Publications
Matched Not Matched

Chart-8 Number of Work ExperiencesPulmonary Disease and Critical Care Medicine
0
20
40
60
80
100
None 1 2 3 4 5 or More
161
196 1 1 2
20
3 0 0 0 1
Previous U.S. Graduates
0
20
40
60
80
100
None 1 2 3 4 5 or More
35
121 3 0 3
148 11
2 3 2
U.S. International Medical Graduates
0
20
40
60
80
100
None 1 2 3 4 5 or More
3225 21 24
10 1114 19 17 17 12 12
Non-U.S. International Medical Graduates
0
20
40
60
80
100
None 1 2 3 4 5 or More
26
1 0 0 0 0
151 0 0 0 1
Osteopathic Graduates
Copyright ©2013 NRMP and AAMC. Copies may be made for educational or noncommercial uses only.
Source: NRMP Data Warehouse and AAMC Data Warehouse142 Charting Outcomes in the Match, SMS, 2013
Work Experiences
Matched Not Matched

Chart-9 Number of Volunteer ExperiencesPulmonary Disease and Critical Care Medicine
0
80
160
240
320
400
167
21 5 1 1 1 0 1 1 0 311 1 0 1 0 0 0 0 0 0 0
None 1 2 3 4 5 6 7 8 9 10 or More
Previous U.S. Graduates
0
80
160
240
320
400
354 1 0 1 0 0 0 0 0 019 8 5 0 1 0 0 0 1 0 0
None 1 2 3 4 5 6 7 8 9 10 or More
U.S. International Medical Graduates
0
80
160
240
320
400
7825 16 1 3 1 0 0 0 0 0
6222 13 5 1 2 0 0 0 0 1
None 1 2 3 4 5 6 7 8 9 10 or More
Non-U.S. International Medical Graduates
0
80
160
240
320
400
20 4 0 0 0 0 0 0 0 0 013 0 0 0 0 0 0 0 0 0 0
None 1 2 3 4 5 6 7 8 9 10 or More
Osteopathic Graduates
Copyright ©2013 NRMP and AAMC. Copies may be made for educational or noncommercial uses only.
Source: NRMP Data Warehouse and AAMC Data Warehouse143 Charting Outcomes in the Match, SMS, 2013
Volunteer Experiences
Matched Not Matched

Chart-10
Percentage of U.S. Graduates Who are Members of AOAPulmonary Disease and Critical Care Medicine
0
50
100
150
200
250
300
350
No Yes
154
3523
1
Matched Not Matched
AOA Membership
Sources: NRMP Data Warehouse and AAMC Data Warehouse
Copyright ©2013 NRMP and AAMC. Copies may be made for educational or noncommercial uses only.
144 Charting Outcomes in the Match, SMS, 2013

Rheumatology

Table-1 Summary StatisticsRheumatology
Measure (n=79) (n=9) (n=19) (n=12)
Previous U.S. Graduates
U.S.International Medical Graduates
Matched Unmatched Matched Unmatched(n=22)(n=53)
UnmatchedMatched
Non-U.S. InternationalMedical Graduates
(n=11)(n=9)UnmatchedMatched
Osteopathic Graduates
76 3 2Mean number of contiguous ranks1. 6 3 5 3
11 1 1Mean number of distinct specialties ranked2. 1 1 1 1
220215 202 213Mean USMLE Step 1 score3. 225 215 n/an/a
223224 209 213Mean USMLE Step 2 score4. 234 219 n/an/a
212214 202 202Mean USMLE Step 3 score5. 210 201 n/an/a
10 0 1Mean number of research experiences6. 1 0 0 0
21 0 2Mean number of abstracts, presentations, and publications
7. 4 3 0 2
10 0 2Mean number of work experiences8. 2 2 0 0
00 0 1Mean number of volunteer experiences9. 1 1 0 1
15 0Percentage who are AOA members n/a n/a10. n/an/a n/an/a
n/a: The measure either does not apply to, applies to only a small percentage of, or no reliable data were available for this type of applicants.Note: USMLE Step scores are not available for most osteopathic medical school graduates.
Sources: Measures 1, 2, and match outcome are from the NRMP Data Warehouse; measures 3, 4, and 5 are from the AAMC Data Warehouse and from the ECFMG, both by permission of the NBME and ECFMG; and measures 6-10 are from the AAMC Data Warehouse.
Charting Outcomes in the Match, SMS, 2013146Copyright ©2013 NRMP and AAMC. Copies may be made for educational or noncommercial uses only.
Source: NRMP Data Warehouse

0
20
40
60
80
100
120
1 2 3 4 5 6 7 8 9 10 11 12 13 14 15 16 or More
6 5 10 7 7 12 9 5 6 3 5 1 0 2 0 11 2 3 0 2 1 0 0 0 0 0 0 0 0 0 0
Previous U.S. Graduates
0
20
40
60
80
100
120
1 2 3 4 5 6 7 8 9 10 11 12 13 14 15 16 or More
0 0 6 2 3 1 2 0 1 0 1 1 0 1 0 17 1 1 2 1 0 0 0 0 0 0 0 0 0 0 0
U.S. International Medical Graduates
0
20
40
60
80
100
120
1 2 3 4 5 6 7 8 9 10 11 12 13 14 15 16 or More
123 5 3 5 4 7 3 3 3 1 1 0 1 0 27 7 4 0 0 1 2 0 0 0 0 1 0 0 0 0
Non-U.S. International Medical Graduates
0
20
40
60
80
100
120
1 2 3 4 5 6 7 8 9 10 11 12 13 14 15 16 or More
1 1 1 1 2 1 0 1 0 0 0 0 0 0 1 03 0 4 2 1 0 0 1 0 0 0 0 0 0 0 0
Osteopathic Graduates
Chart-1 Number of Contiguous Ranks Within Preferred SpecialtyRheumatology
Copyright ©2013 NRMP and AAMC. Copies may be made for educational or noncommercial uses only.
Source: NRMP Data Warehouse
Charting Outcomes in the Match, SMS, 2013
Contiguous Ranks
Matched Not Matched
147

Graph-1 Probability of Matching to Preferred Specialty by Number of Contiguous RanksRheumatology
0.00
0.10
0.20
0.30
0.40
0.50
0.60
0.70
0.80
0.90
1.00
0 1 2 3 4 5 6 7 8 9 10 11 12 13 14 15 16 17 18 19 20
Non-U.S. InternationalMedical Graduates
Previous U.S. Graduates U.S. InternationalMedical Graduates
Probability of Matching
Copyright ©2013 NRMP and AAMC. Copies may be made for educational or noncommercial uses only.
Source: NRMP Data Warehouse.
148 Charting Outcomes in the Match, SMS, 2013
Contiguous Ranks

Chart-2 Number of Distinct Specialties RankedRheumatology
0
100
200
300
400
500
600
1 2 3 4 or More
781 0 09 0 0 0
Previous U.S. Graduates
0
100
200
300
400
500
600
1 2 3 4 or More
17 2 0 011 0 1 0
U.S. International Medical Graduates
0
100
200
300
400
500
600
1 2 3 4 or More
484 1 020 2 0 0
Non-U.S. International Medical Graduates
0
100
200
300
400
500
600
1 2 3 4 or More
9 0 0 011 0 0 0
Osteopathic Graduates
Copyright ©2013 NRMP and AAMC. Copies may be made for educational or noncommercial uses only.
Source: NRMP Data Warehouse
149 Charting Outcomes in the Match, SMS, 2013
Distinct Specialties Ranked
Matched Not Matched

Chart-3 USMLE Step 1 ScoresRheumatology
0
10
20
30
40
50
60
70
80
<= 180 Between 181 and190
Between 191 and200
Between 201 and210
Between 211 and220
Between 221 and230
Between 231 and240
Between 241 and250
Between 251 and260
>260 Score Unknown
0
10 1017
12 9 123 4 1 10 1
50 3 0 0 0 0 0 0
Previous U.S. Graduates
0
10
20
30
40
50
60
70
80
<= 180 Between 181 and190
Between 191 and200
Between 201 and210
Between 211 and220
Between 221 and230
Between 231 and240
Between 241 and250
Between 251 and260
>260 Score Unknown
0 04 2 5 2 5
0 0 1 00 2 1 15
1 1 1 0 0 0
U.S. International Medical Graduates
0
10
20
30
40
50
60
70
80
<= 180 Between 181 and190
Between 191 and200
Between 201 and210
Between 211 and220
Between 221 and230
Between 231 and240
Between 241 and250
Between 251 and260
>260 Score Unknown
0 0 39 7
14 115 4
0 00 08
1 4 4 4 1 0 0 0
Non-U.S. International Medical Graduates
Copyright ©2013 NRMP and AAMC. Copies may be made for educational or noncommercial uses only.
Source: NRMP Data Warehouse and AAMC Data Warehouse. USMLE scores by permission of the NBME and ECFMG.
150 Charting Outcomes in the Match, SMS, 2013
Step 1 Scores
Matched Not Matched

Graph-2 Probability of Matching to Preferred Specialty by USMLE Step 1 ScoreRheumatology
0.00
0.10
0.20
0.30
0.40
0.50
0.60
0.70
0.80
0.90
1.00
160 180 200 220 240 260 280
Non-U.S. InternationalMedical Graduates Previous U.S. Graduates
U.S. InternationalMedical Graduates
Probability of Matching
Copyright ©2013 NRMP and AAMC. Copies may be made for educational or noncommercial uses only.
Source: NRMP Data Warehouse and AAMC Data Warehouse. USMLE scores by permission of the NBME and ECFMG. Note: Probabilities calculated based on 2009-2011 applicants.
151 Charting Outcomes in the Match, SMS, 2013
Step 1 Scores

Chart-4 USMLE Step 2 ScoresRheumatology
0
10
20
30
40
50
60
70
80
<= 180 Between 181and 190
Between 191and 200
Between 201and 210
Between 211and 220
Between 221and 230
Between 231and 240
Between 241and 250
Between 251and 260
>260 Score Unknown
04 4
15 16 13 115 6 4 10 1 2 1 3 2 0 0 0 0 0
Previous U.S. Graduates
0
10
20
30
40
50
60
70
80
<= 180 Between 181and 190
Between 191and 200
Between 201and 210
Between 211and 220
Between 221and 230
Between 231and 240
Between 241and 250
Between 251and 260
>260 Score Unknown
0 1 2 2 4 4 2 2 1 1 00 1 3 3 1 1 2 1 0 0 0
U.S. International Medical Graduates
0
10
20
30
40
50
60
70
80
<= 180 Between 181and 190
Between 191and 200
Between 201and 210
Between 211and 220
Between 221and 230
Between 231and 240
Between 241and 250
Between 251and 260
>260 Score Unknown
0 0 05 5
13 127 9
2 02 1 3 3 1 3 4 4 1 0 0
Non-U.S. International Medical Graduates
Copyright ©2013 NRMP and AAMC. Copies may be made for educational or noncommercial uses only.
Source: NRMP Data Warehouse and AAMC Data Warehouse. USMLE scores by permission of the NBME and ECFMG.152 Charting Outcomes in the Match, SMS, 2013
Step 2 Scores
Matched Not Matched

Charting Outcomes in the Match, SMS, 2013Copyright ©2013 NRMP and AAMC. Copies may be made for educational or noncommercial uses only.
Source: NRMP Data Warehouse and AAMC Data Warehouse. USMLE scores by permission of the NBME and ECFMG. Note: Probabilities calculated based on 2009-2011 applican
Probability of Matching to Preferred Specialty by USMLE Step 2 ScoreRheumatology
Graph-3
0.00
0.10
0.20
0.30
0.40
0.50
0.60
0.70
0.80
0.90
1.00
160 180 200 220 240 260 280
Non-U.S. InternationalMedical Graduates Previous U.S. Graduates
U.S. InternationalMedical Graduates
Probability of Matching
153
Step 2 Scores

154 Charting Outcomes in the Match, SMS, 2013Copyright ©2013 NRMP and AAMC. Copies may be made for educational or noncommercial uses only.
Source: NRMP Data Warehouse and AAMC Data Warehouse. USMLE scores by permission of the NBME and ECFMG.
Step 3 Scores
Chart-5 USMLE Step 3 ScoresRheumatology
0
20
40
60
80
100
120
140
160
<= 180 Between 181and 190
Between 191and 200
Between 201and 210
Between 211and 220
Between 221and 230
Between 231and 240
Between 241and 250
Between 251and 260
>260 Score Unknown
0 110 7
176 3 2 2 0
31
0 2 0 3 1 0 0 0 0 0 3
Previous U.S. Graduates
0
20
40
60
80
100
120
140
160
<= 180 Between 181and 190
Between 191and 200
Between 201and 210
Between 211and 220
Between 221and 230
Between 231and 240
Between 241and 250
Between 251and 260
>260 Score Unknown
0 1 5 2 2 3 2 1 0 0 30 1 4 3 2 0 0 0 0 0 2
U.S. International Medical Graduates
0
20
40
60
80
100
120
140
160
<= 180 Between 181and 190
Between 191and 200
Between 201and 210
Between 211and 220
Between 221and 230
Between 231and 240
Between 241and 250
Between 251and 260
>260 Score Unknown
0 5 715 9 5 3 2 0 0 73 3 3 4 5 1 1 0 0 0 2
Non-U.S. International Medical Graduates
Matched Not Matched

Graph-4 Probability of Matching to Preferred Specialty by USMLE Step 3 ScoreRheumatology
Charting Outcomes in the Match, SMS, 2013Copyright ©2013 NRMP and AAMC. Copies may be made for educational or noncommercial uses only.
Source: NRMP Data Warehouse and AAMC Data Warehouse. USMLE scores by permission of the NBME and ECFMG. Note: Probabilities calculated based on 2009-2011 applican
0.00
0.10
0.20
0.30
0.40
0.50
0.60
0.70
0.80
0.90
1.00
160 180 200 220 240 260
Non-U.S. InternationalMedical Graduates Previous U.S. Graduates U.S. International
Medical Graduates
Probability of Matching
155
Step 3 Scores

Chart-6 Number of Research ProjectsRheumatology
0
50
100
150
200
250
300
None 1 2 3 4 5 or More
68
7 3 1 0 06 2 1 0 0 0
Previous U.S. Graduates
0
50
100
150
200
250
300
None 1 2 3 4 5 or More
12 6 0 0 1 08 2 2 0 0 0
U.S. International Medical Graduates
0
50
100
150
200
250
300
None 1 2 3 4 5 or More
24 18 4 7 0 018 2 2 0 0 0
Non-U.S. International Medical Graduates
0
50
100
150
200
250
300
None 1 2 3 4 5 or More
7 2 0 0 0 011 0 0 0 0 0
Osteopathic Graduates
Copyright ©2013 NRMP and AAMC. Copies may be made for educational or noncommercial uses only.
Source: NRMP Data Warehouse and AAMC Data Warehouse
156 Charting Outcomes in the Match, SMS, 2013
Research Projects
Matched Not Matched

Chart-7 Number of Abstracts, Presentations, and PublicationsRheumatology
0
20
40
60
80
100
120
140
None 1 2 3 4 5 or More
40
166 10
1 67 0 2 0 0 0
Previous U.S. Graduates
0
20
40
60
80
100
120
140
None 1 2 3 4 5 or More
8 4 3 2 1 15 4 0 1 0 2
U.S. International Medical Graduates
0
20
40
60
80
100
120
140
None 1 2 3 4 5 or More
146 5 7 4
177 8 1 0 0 6
Non-U.S. International Medical Graduates
0
20
40
60
80
100
120
140
None 1 2 3 4 5 or More
6 2 1 0 0 04 5 1 0 0 1
Osteopathic Graduates
Copyright ©2013 NRMP and AAMC. Copies may be made for educational or noncommercial uses only.
Source: NRMP Data Warehouse and AAMC Data Warehouse157 Charting Outcomes in the Match, SMS, 2013
Publications
Matched Not Matched

Chart-8 Number of Work ExperiencesRheumatology
0
20
40
60
80
100
None 1 2 3 4 5 or More
73
4 0 0 0 29
0 0 0 0 0
Previous U.S. Graduates
0
20
40
60
80
100
None 1 2 3 4 5 or More
104 2 2 1 04 4 0 0 2 2
U.S. International Medical Graduates
0
20
40
60
80
100
None 1 2 3 4 5 or More
14 167 7 2 710
4 1 2 1 4
Non-U.S. International Medical Graduates
0
20
40
60
80
100
None 1 2 3 4 5 or More
90 0 0 0 0
110 0 0 0 0
Osteopathic Graduates
Copyright ©2013 NRMP and AAMC. Copies may be made for educational or noncommercial uses only.
Source: NRMP Data Warehouse and AAMC Data Warehouse158 Charting Outcomes in the Match, SMS, 2013
Work Experiences
Matched Not Matched

Chart-9 Number of Volunteer ExperiencesRheumatology
0
80
160
240
320
400
648 3 1 0 0 0 0 0 0 013 1 1 0 0 0 0 0 0 0 0
None 1 2 3 4 5 6 7 8 9 10 or More
Previous U.S. Graduates
0
80
160
240
320
400
14 4 2 1 1 1 0 0 0 0 012 3 0 2 0 0 0 0 0 0 0
None 1 2 3 4 5 6 7 8 9 10 or More
U.S. International Medical Graduates
0
80
160
240
320
400
30 12 3 6 1 0 0 0 0 0 035
12 7 0 0 0 1 0 0 0 0
None 1 2 3 4 5 6 7 8 9 10 or More
Non-U.S. International Medical Graduates
0
80
160
240
320
400
10 1 0 0 0 0 0 0 0 0 011 0 0 0 0 0 0 0 0 0 0
None 1 2 3 4 5 6 7 8 9 10 or More
Osteopathic Graduates
Copyright ©2013 NRMP and AAMC. Copies may be made for educational or noncommercial uses only.
Source: NRMP Data Warehouse and AAMC Data Warehouse159 Charting Outcomes in the Match, SMS, 2013
Volunteer Experiences
Matched Not Matched

Chart-10
Percentage of U.S. Graduates Who are Members of AOARheumatology
0
50
100
150
200
250
300
350
No Yes
67
129 0
Matched Not Matched
AOA Membership
Sources: NRMP Data Warehouse and AAMC Data Warehouse
Copyright ©2013 NRMP and AAMC. Copies may be made for educational or noncommercial uses only.
160 Charting Outcomes in the Match, SMS, 2013