charlottesville area 3rd qtr 2014 real estate market data
TRANSCRIPT
1
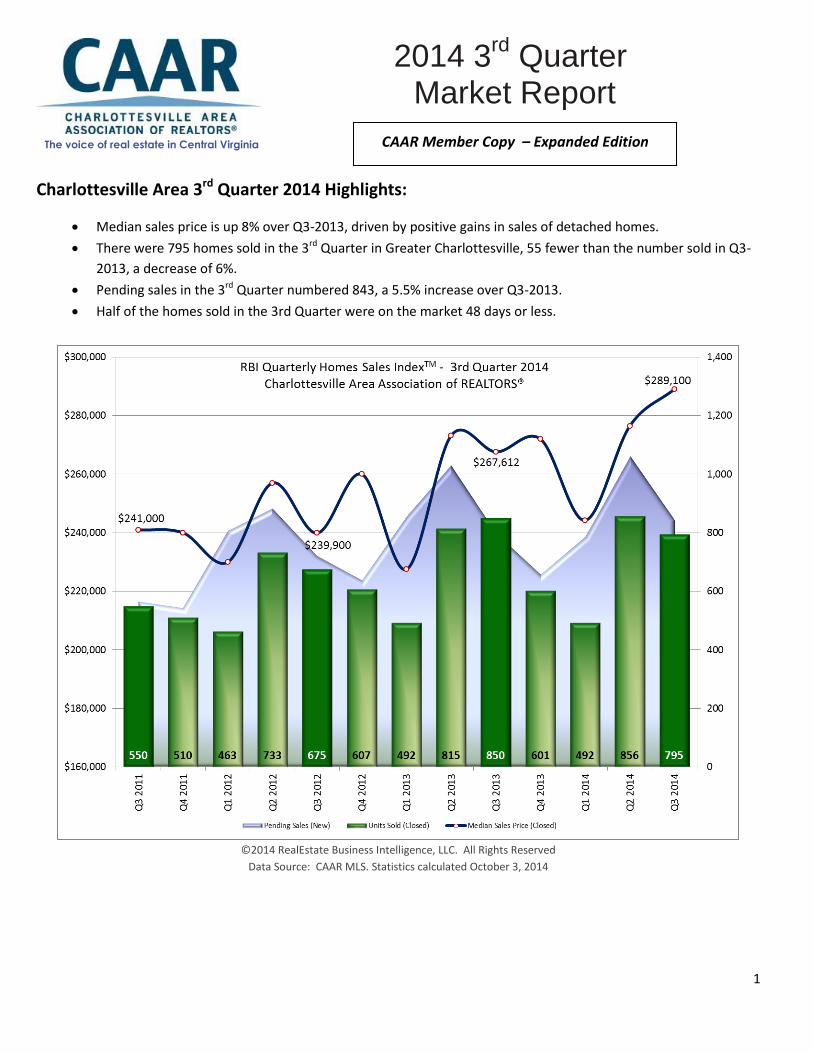
Charlottesville Area 3rd Quarter 2014 Highlights:
Median sales price is up 8% over Q3-2013, driven by positive gains in sales of detached homes.
There were 795 homes sold in the 3rd Quarter in Greater Charlottesville, 55 fewer than the number sold in Q3-
2013, a decrease of 6%.
Pending sales in the 3rd Quarter numbered 843, a 5.5% increase over Q3-2013.
Half of the homes sold in the 3rd Quarter were on the market 48 days or less.
©2014 RealEstate Business Intelligence, LLC. All Rights Reserved
Data Source: CAAR MLS. Statistics calculated October 3, 2014
The voice of real estate in Central Virginia
2014 3rd
Quarter Market Report
2011 Year End Market Report Market ReportReport
CAAR Member Copy – Expanded Edition

2
3rd Quarter 2014 Sales Activity – Shifting Home Choice
There were 795 homes sold in the 3rd Quarter in Greater Charlottesville, 55 fewer than the number sold in Q3-2013. The year-over-year sales decrease was attributed to a slowdown in the attached home segment. The 165 attached homes sold were 29.2% fewer than the 233 sold in Q3-2013. Attached homes also accounted for 20.8% of all homes sold in the quarter, down from a 27.4% share in the same quarter last year. The 630 detached homes sold actually represented a 2.1% increase (+13 sales) over Q3-2013. This shift in the home type of purchase contributed to an 11.3% bump in the average sales price for the region. This in turn resulted in a 4.1% increase in the total sold dollar volume compared to Q3-2013, despite the decrease in overall sales.
©2014 RealEstate Business Intelligence, LLC. All Rights Reserved
Data Source: CAAR MLS. Statistics calculated October 3, 2014
Greene (+13.1%) was the sales leader with a significant increase in closed sales compared to Q3-2013. Louisa, with one more sale, was the only other county with a sales increase. Nelson had the sharpest percent decrease from last year, posting 51 sales, a drop of 30.1% from the 73 closed sales in Q3-2013. On the heels of a notably active 2nd Quarter where sales were up 50.7% versus 2013, sales dropped 15.6% in Fluvanna. Albemarle (-5.6%) had 23 fewer homes sold than Q3-2013 while Charlottesville had four fewer sales (-2.7%).
Inventory – Small Movements & Pending Sales on the Increase While closed sales were down slightly across the total market, the 843 new pending sales represented a 5.5% increase
over Q3-2013. Notably, there were 18.9% more new pending sales in September than the same month last year. Louisa
and Greene both recorded 20% more new pending sales in this quarter than last year. Albemarle (+11.4%) also had a
significant increase in purchase activity. New pending sales were flat in Fluvanna and the city of Charlottesville. Nelson
was the outlier in terms of purchase activity, with 23.2% fewer new pending sales than last year.

3
Following a busy 2nd Quarter for potential sellers where listing activity was up 10.4% from 2013, 3rd Quarter seller activity was flat compared to last year. The 1,183 new listings added were only three more than the Q3-2013 total. Louisa (+38.2%) and Nelson (+21.0%) were the only jurisdictions with gains in new listings. Greene (-25.4%) had the largest percent decrease in new listing activity. Inventory headed into the 3rd Quarter was 6.7% higher than the same time last year. With increases in the number of new pending sales in the quarter and flat growth in new listings added, active inventory to close the quarter is only 2.9% higher than this time last year. Using the average monthly sales pace over the last twelve
©2014 RealEstate Business Intelligence, LLC. All Rights Reserved Data Source: CAAR MLS. Statistics calculated October 3, 2014
months, the 2,221 active listings represent 10.6 months of supply. Days on Market (DOM) and Pricing The median DOM for Greater Charlottesville in the 3rd Quarter was 48 days, meaning half the homes sold in the quarter were on the market seven weeks or less. This is two days longer than Q3-2013 and the second time that the 3rd Quarter median DOM was lower than 50 days since 2007. The average DOM for homes sold in the 3rd Quarter was 101 days, four days better than the Q3-2013 mark (105 days).
©2014 RealEstate Business Intelligence, LLC. All Rights Reserved
Data Source: CAAR MLS. Statistics calculated October 3, 2014
Homes sold fastest, based on median DOM levels, in Charlottesville (33 days) and Albemarle (42 days). Fluvanna homes took three days longer than the regional median, but the county had the biggest improvement (-23 days) over its Q3-2013. The city of Charlottesville was the only other jurisdiction with a lower median DOM than Q3-2013, with a one-day improvement. Homes sold in Louisa were on the market 54 days which is 18 days less than in the 2nd Quarter when the median DOM was 72 days. Half the homes sold in Greene were on the market 86 days or more and the median DOM in Nelson was 143 days.
4
©2014 RealEstate Business Intelligence, LLC. All Rights Reserved
Data Source: CAAR MLS. Statistics calculated October 3, 2014
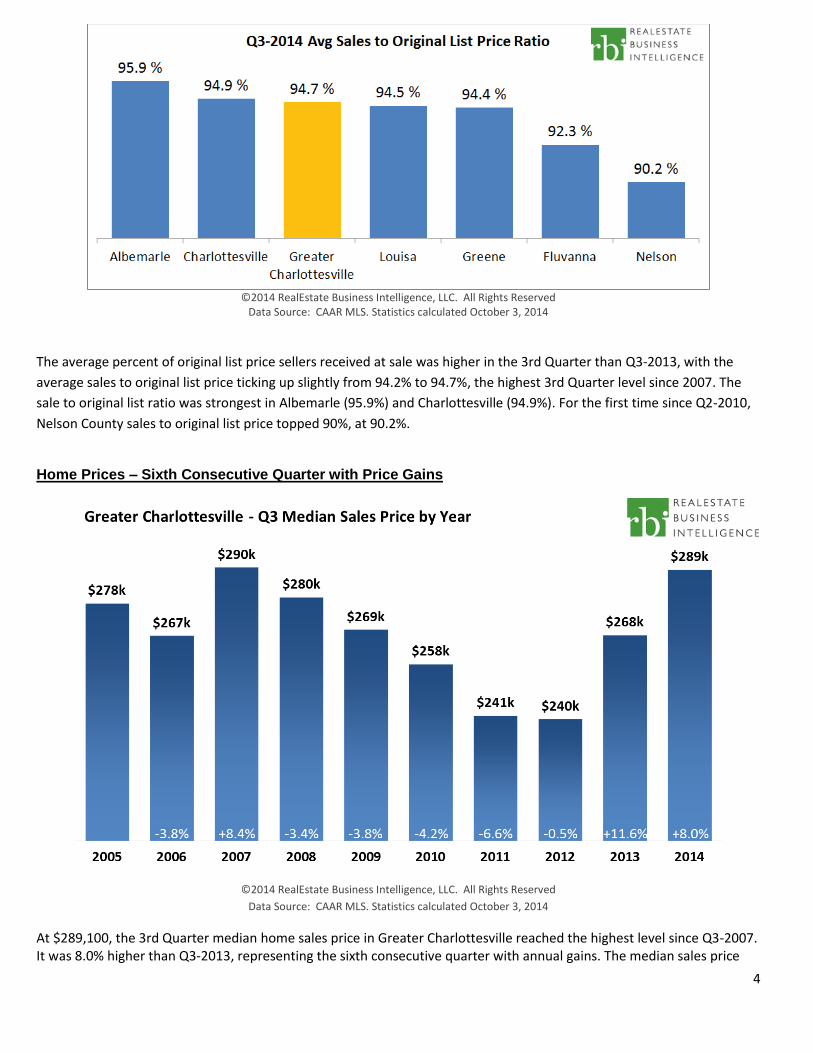
The average percent of original list price sellers received at sale was higher in the 3rd Quarter than Q3-2013, with the
average sales to original list price ticking up slightly from 94.2% to 94.7%, the highest 3rd Quarter level since 2007. The
sale to original list ratio was strongest in Albemarle (95.9%) and Charlottesville (94.9%). For the first time since Q2-2010,
Nelson County sales to original list price topped 90%, at 90.2%.
Home Prices – Sixth Consecutive Quarter with Price Gains
©2014 RealEstate Business Intelligence, LLC. All Rights Reserved
Data Source: CAAR MLS. Statistics calculated October 3, 2014
At $289,100, the 3rd Quarter median home sales price in Greater Charlottesville reached the highest level since Q3-2007. It was 8.0% higher than Q3-2013, representing the sixth consecutive quarter with annual gains. The median sales price

5
was 20.5% above the 3rd Quarter mark in 2012, the year in which prices were the lowest in the region, and was only $800 below the record high for the third quarter ($289,900 in Q3-2007). Growth in the detached segment’s proportion of homes (sold from 72.6% in Q3-2013 to 79.2% in Q3-2014), coupled with a 7.5% increase in the median sales price for this segment, were key factors in the overall 8.0% year-over-year increase from last year. The attached segment, which had 29.2% fewer sales than Q3-2012, posted a 6.6 decrease in median sales price.
©2014 RealEstate Business Intelligence, LLC. All Rights Reserved
Data Source: CAAR MLS. Statistics calculated October 3, 2014
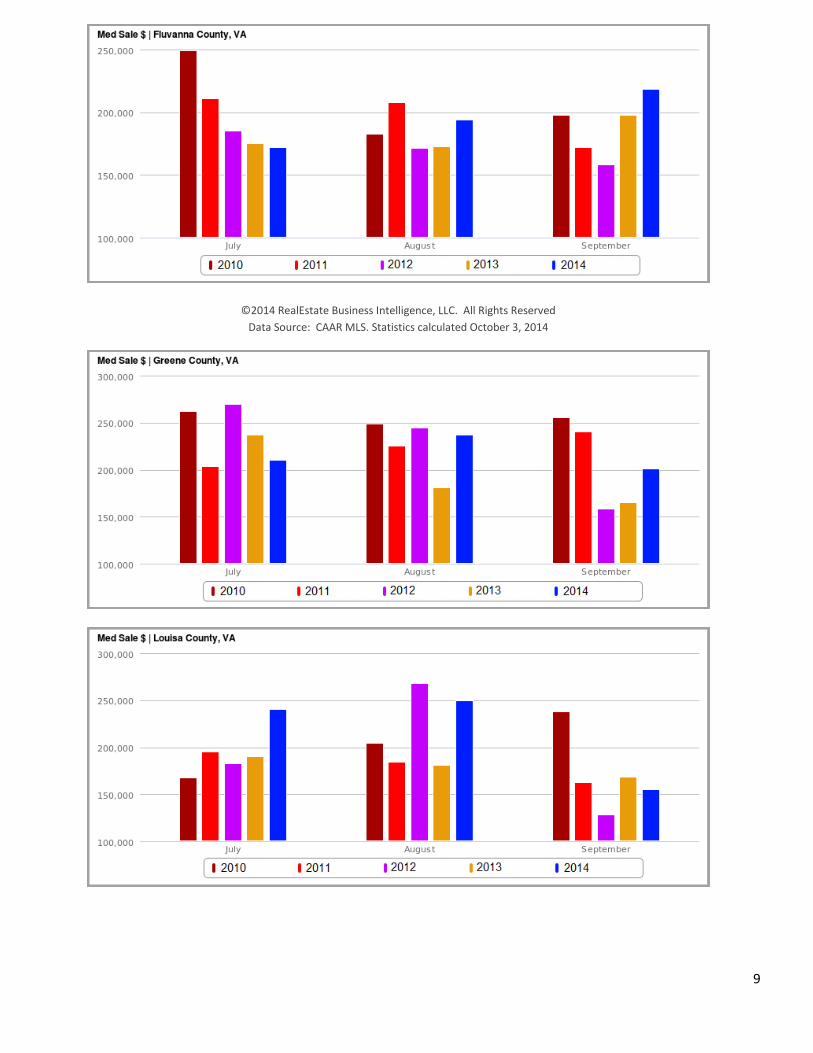
Five of the six jurisdictions had year-over-year gains in median sales price in the 3rd Quarter. Louisa ($235,000) led the region in price gains with a 23.7% increase. Albemarle ($339,000) and Charlottesville ($270,000) had the next highest gains, up 8.0% and 6.9%, respectively. Nelson ($290,000) and Fluvanna ($187,500) had modest gains of 1.6% and 1.4%. Greene ($217,000) was the only county with a year-over-year decrease, although slight at -0.9%. Attached vs. Detached Homes – Home Choice Trends
Indicators were positive for the detached housing segment in Greater Charlottesville in the 3rd Quarter. The median sales price for detached homes in Greater Charlottesville in the 3rd Quarter was up 7.5% from Q3-2013 to $315,000. This represented the highest level for any quarter since 2007. The number of detached homes sold in the quarter also improved over Q3-2013 levels, gaining 2.1% with 630 sales reported. The median DOM for detached homes was 44 days, the lowest 3rd quarter level since 2005 and 20 days lower than the ten-year average for the quarter. Trends in the attached housing segment were less positive. The median sales price of $206,500 was 6.6% down from Q3-2013, and was the lowest level for any quarter since Q1-2013. The 165 attached homes sold were 29.2% fewer than Q3-2013. Half the attached homes sold in 60 days or less, which is two weeks higher than the median DOM of 46 days in the same quarter last year. This was the highest 3rd Quarter median DOM for attached homes since 2011.

6
©2014 RealEstate Business Intelligence, LLC. All Rights Reserved
Data Source: CAAR MLS. Statistics calculated October 3, 2014
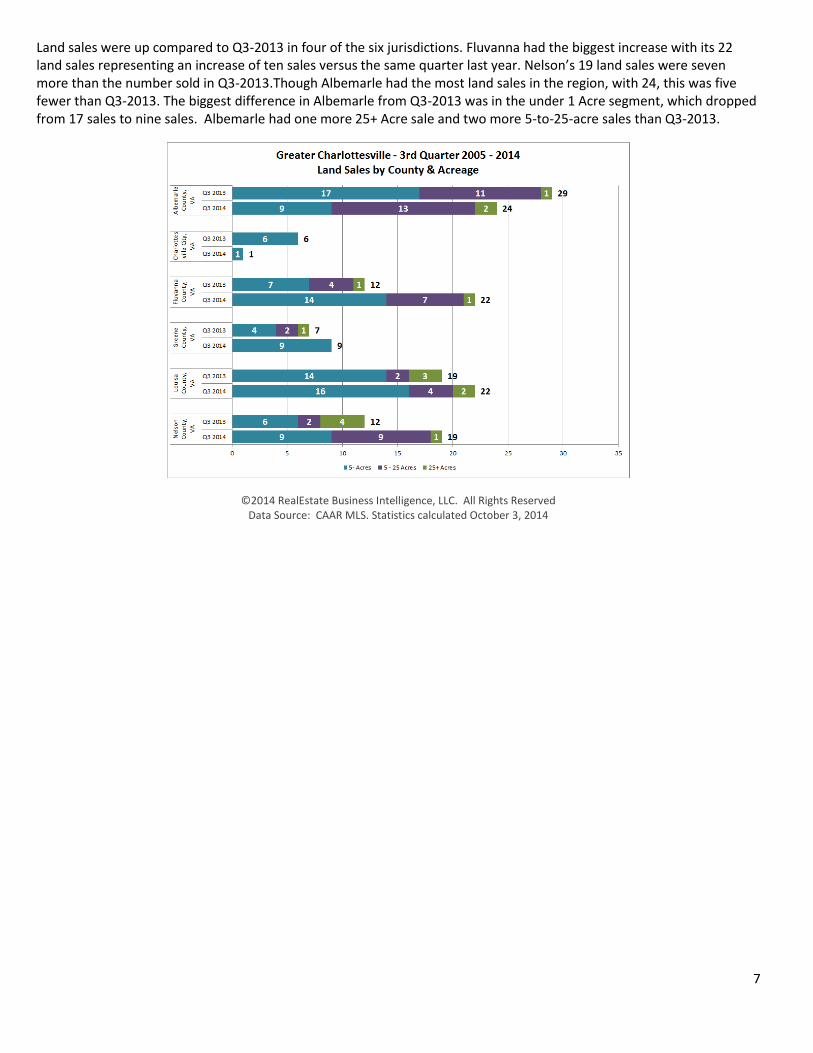
Land/Acreage Sales There were 97 land/acreage sales in Greater Charlottesville in the 3rd Quarter, 12 more than in Q3-2013 and the highest 3rd Quarter tally since 2007. With 33 sales, the 5-to-25-acre segment saw the largest increase, with 12 more sales than Q3-2013. Land sales in the under 5 acre segment also rose, from 54 sales in Q3-2013 to 58 sales in Q3-2014. There were only six sales in the 25+ acre segment, four fewer than the same quarter last year.
All Residential Q3-14 % Q-O-Q Q2-14 % Y-O-Y Q3-13 % Y-O-2Y Q3-12 % Y-O-3Y Q3-11
Average Sales Price (Closed) $356,125 7.0% $332,679 11.3% $319,940 13.6% $313,445 21.4% $293,438
Median Sales Price (Closed) $289,100 4.6% $276,500 8.0% $267,612 20.5% $239,900 20.0% $241,000
Units Sold (Closed) 795 -7.1% 856 -6.5% 850 17.8% 675 44.5% 550
Average DOM (Closed) 101 -9.8% 112 -3.8% 105 -20.5% 127 -21.7% 129
Listing Discount (Average) 5.3% 4.9% 5.8% 8.8% 8.5%
Ratio Avg SP/Avg OLP 94.7% 95.1% 94.2% 91.2% 91.5%
Avg SP/Sq Ft 152 5.6% 144 6.3% 143 14.3% 133 10.9% 137
Detached Q3-14 % Q-O-Q Q2-14 % Y-O-Y Q3-13 % Y-O-2Y Q3-12 % Y-O-3Y Q3-11
Average Sales Price (Closed) $387,629 7.9% $359,293 10.0% $352,301 11.6% $347,406 18.8% $326,382
Median Sales Price (Closed) $315,000 5.7% $298,000 7.5% $293,000 18.1% $266,625 16.7% $270,000
Units Sold (Closed) 630 -3.5% 653 2.1% 617 23.5% 510 54.4% 408
Average DOM (Closed) 99 -15.4% 117 -8.3% 108 -26.1% 134 -22.7% 128
Listing Discount (Average) 5.3% 5.5% 6.6% 9.5% 8.7%
Ratio Avg SP/Avg OLP 94.7% 94.5% 93.4% 90.5% 91.3%
Avg SP/Sq Ft 153 7.7% 142 7.7% 142 15.9% 132 12.5% 136
Attached Q3-14 % Q-O-Q Q2-14 % Y-O-Y Q3-13 % Y-O-2Y Q3-12 % Y-O-3Y Q3-11
Average Sales Price (Closed) $235,836 -4.5% $247,072 0.7% $234,246 13.1% $208,472 18.6% $198,783
Median Sales Price (Closed) $206,500 -9.8% $228,900 -6.6% $221,000 14.7% $180,000 10.5% $186,950
Units Sold (Closed) 165 -18.7% 203 -29.2% 233 0.0% 165 16.2% 142
Average DOM (Closed) 109 12.4% 97 10.1% 99 0.9% 108 -16.8% 131
Listing Discount (Average) 5.1% 2.9% 3.7% 6.6% 8.0%
Ratio Avg SP/Avg OLP 94.9% 97.1% 96.3% 93.5% 92.0%
Avg SP/Sq Ft 148 -1.3% 150 1.4% 146 6.5% 139 5.0% 141
RBI Key Housing Trend Metrics
Charlottesville Area Association of REALTORS®
7
Land sales were up compared to Q3-2013 in four of the six jurisdictions. Fluvanna had the biggest increase with its 22 land sales representing an increase of ten sales versus the same quarter last year. Nelson’s 19 land sales were seven more than the number sold in Q3-2013.Though Albemarle had the most land sales in the region, with 24, this was five fewer than Q3-2013. The biggest difference in Albemarle from Q3-2013 was in the under 1 Acre segment, which dropped from 17 sales to nine sales. Albemarle had one more 25+ Acre sale and two more 5-to-25-acre sales than Q3-2013.
©2014 RealEstate Business Intelligence, LLC. All Rights Reserved Data Source: CAAR MLS. Statistics calculated October 3, 2014

8
©2014 RealEstate Business Intelligence, LLC. All Rights Reserved
Data Source: CAAR MLS. Statistics calculated October 3, 2014
9
©2014 RealEstate Business Intelligence, LLC. All Rights Reserved Data Source: CAAR MLS. Statistics calculated October 3, 2014

10
©2014 RealEstate Business Intelligence, LLC. All Rights Reserved
Data Source: CAAR MLS. Statistics calculated October 3, 2014