charleston county - community profileslmi.dew.sc.gov/lmi...
TRANSCRIPT

Charleston County
S.C. Department of Employment & Workforce
Business Intelligence Department
www.SCWorkforceInfo.com
803.737.2660
1550 Gadsden Street, PO Box 995
Columbia, SC 29202
Updated: 06/15/2018

Table Of Contents
Educational Attainment............................................................................................
Graduate Trends......................................................................................................
Educational Institutions............................................................................................
Projections by Occupation.......................................................................................
Growing Occupations.............................................................................................
Declining Occupations............................................................................................
Employment by Industry..........................................................................................
New Startup Firms..................................................................................................
Top Occupational Openings...................................................................................
New Hires by Industry............................................................................................
Turnover by Industry...........................................................................................
Average Annual Wage by Industry.......................................................................
Age of Workers by Industry....................................................................................
Projections by Industry...........................................................................................
Population.........................................................................................................
Age...............................................................................................................
Race.............................................................................................................
Gender..........................................................................................................
Change..........................................................................................................
Commuting Patterns...............................................................................................
Residents Commuting To..................................................................................
Workers Commuting From................................................................................
Employer Data......................................................................................................
Size of Establishments......................................................................................
Employment by Size of Establishment..............................................................
20 Largest Employers ......................................................................................
Annual Unemployment Rates...............................................................................
Monthly Unemployment Rates..............................................................................
Area Job Openings................................................................................................
Unemployment Insurance.....................................................................................
Demographic Data..........................................................................................
Industry Data...................................................................................................
Occupation Data.............................................................................................
Retail Sales...........................................................................................................
1
2
3
4
4
5
6
7
1. Economic Data
2. Demographic Data
8
8
9
9
10
11
12
12
13
13
13
14
3. Industry Data
15
16
17
18
19
20
21
22
23
24
25
4. Occupation Data
5. Education Data
26
27
28
Charleston CountyCommunity Profile
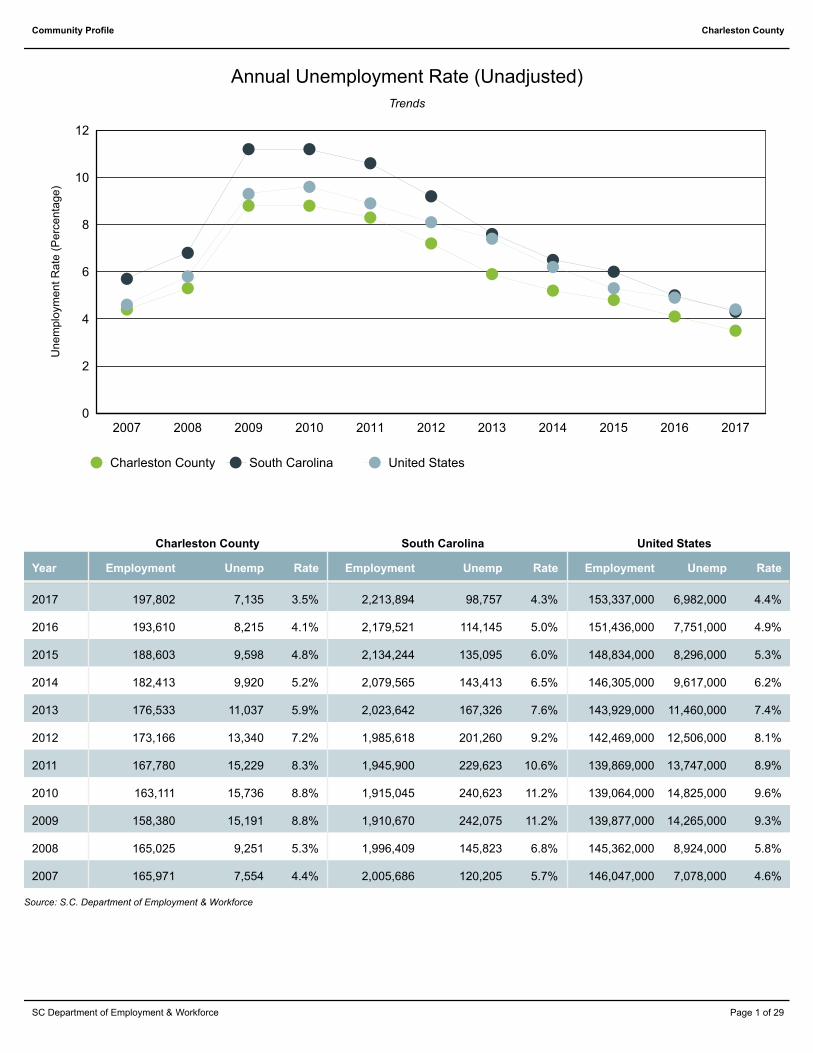
Annual Unemployment Rate (Unadjusted)
Trends
0
2
4
6
8
10
12
2007 2008 2009 2010 2011 2012 2013 2014 2015 2016 2017
Charleston County South Carolina United States
Un
em
plo
ym
en
t R
ate
(P
erc
en
tag
e)
United StatesCharleston County South Carolina
Year Employment Unemp Rate Employment Unemp Rate Employment Unemp Rate
2017 197,802 7,135 3.5% 2,213,894 98,757 4.3% 153,337,000 6,982,000 4.4%
2016 193,610 8,215 4.1% 2,179,521 114,145 5.0% 151,436,000 7,751,000 4.9%
2015 188,603 9,598 4.8% 2,134,244 135,095 6.0% 148,834,000 8,296,000 5.3%
2014 182,413 9,920 5.2% 2,079,565 143,413 6.5% 146,305,000 9,617,000 6.2%
2013 176,533 11,037 5.9% 2,023,642 167,326 7.6% 143,929,000 11,460,000 7.4%
2012 173,166 13,340 7.2% 1,985,618 201,260 9.2% 142,469,000 12,506,000 8.1%
2011 167,780 15,229 8.3% 1,945,900 229,623 10.6% 139,869,000 13,747,000 8.9%
2010 163,111 15,736 8.8% 1,915,045 240,623 11.2% 139,064,000 14,825,000 9.6%
2009 158,380 15,191 8.8% 1,910,670 242,075 11.2% 139,877,000 14,265,000 9.3%
2008 165,025 9,251 5.3% 1,996,409 145,823 6.8% 145,362,000 8,924,000 5.8%
2007 165,971 7,554 4.4% 2,005,686 120,205 5.7% 146,047,000 7,078,000 4.6%
Source: S.C. Department of Employment & Workforce
Page 1 of 29SC Department of Employment & Workforce
Charleston CountyCommunity Profile
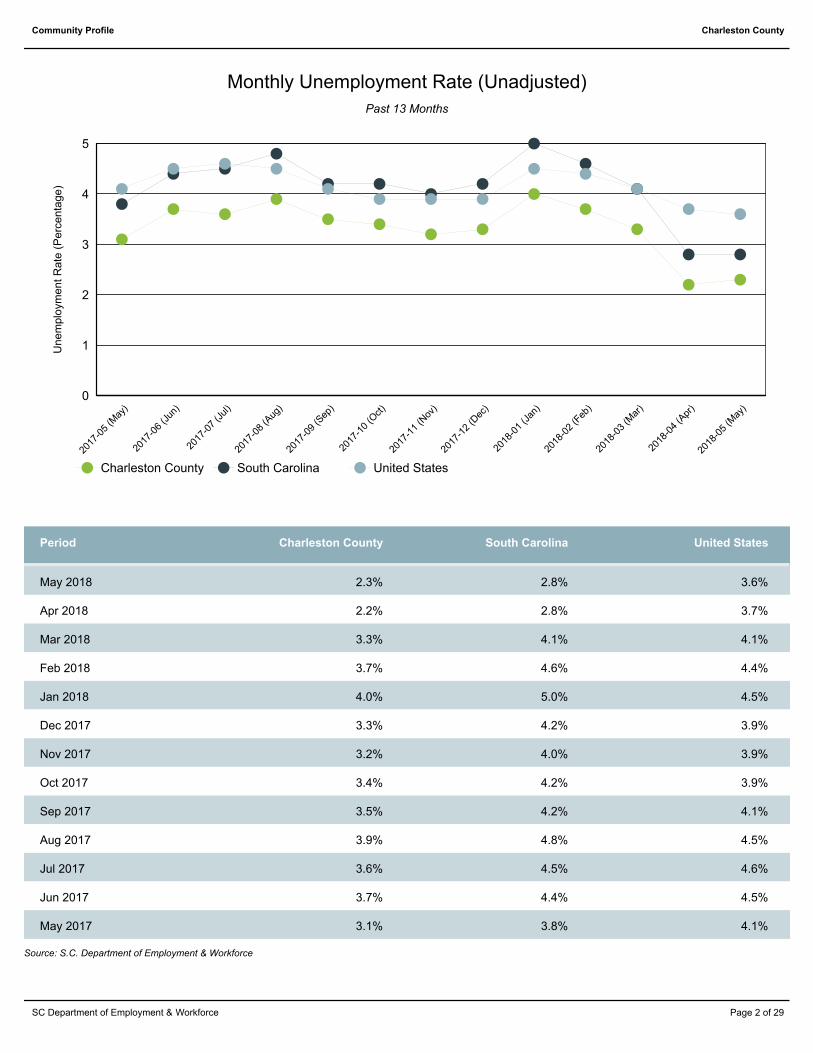
Past 13 Months
Monthly Unemployment Rate (Unadjusted)
0
1
2
3
4
5
2017
-05
(May
)
2017
-06
(Jun
)
2017
-07
(Jul)
2017
-08
(Aug
)
2017
-09
(Sep
)
2017
-10
(Oct)
2017
-11
(Nov
)
2017
-12
(Dec
)
2018
-01
(Jan
)
2018
-02
(Feb
)
2018
-03
(Mar
)
2018
-04
(Apr
)
2018
-05
(May
)
Charleston County South Carolina United States
Un
em
plo
ym
en
t R
ate
(P
erc
en
tag
e)
Charleston CountyPeriod South Carolina United States
May 2018 2.3% 2.8% 3.6%
Apr 2018 2.2% 2.8% 3.7%
Mar 2018 3.3% 4.1% 4.1%
Feb 2018 3.7% 4.6% 4.4%
Jan 2018 4.0% 5.0% 4.5%
Dec 2017 3.3% 4.2% 3.9%
Nov 2017 3.2% 4.0% 3.9%
Oct 2017 3.4% 4.2% 3.9%
Sep 2017 3.5% 4.2% 4.1%
Aug 2017 3.9% 4.8% 4.5%
Jul 2017 3.6% 4.5% 4.6%
Jun 2017 3.7% 4.4% 4.5%
May 2017 3.1% 3.8% 4.1%
Source: S.C. Department of Employment & Workforce
Page 2 of 29SC Department of Employment & Workforce

Charleston CountyCommunity Profile
South CarolinaCharleston County
Area Job Openings
Period Employed Unemployed Unemp.
Rate
Job
Openings
Employed Unemployed Unemp.
Rate
Job
Openings
May-18 198,712 4,685 2.3% 10,430 2,225,431 92,498 4.0% 61,940
Apr-18 198,390 4,494 2.2% 11,103 2,225,655 97,929 4.2% 64,770
Mar-18 198,739 6,806 3.3% 11,026 2,225,252 102,079 4.4% 59,107
Feb-18 197,281 7,601 3.7% 10,011 2,223,397 101,415 4.4% 57,596
Jan-18 194,511 8,189 4.0% 9,564 2,221,051 100,182 4.3% 51,746
Dec-17 195,975 6,697 3.3% 9,003 2,220,845 97,879 4.2% 56,028
Nov-17 197,980 6,532 3.2% 9,234 2,221,189 97,944 4.2% 60,228
Oct-17 198,235 6,905 3.4% 10,130 2,221,475 97,934 4.2% 57,940
Sep-17 198,091 7,114 3.5% 9,401 2,220,466 97,769 4.2% 58,456
Aug-17 198,644 7,966 3.9% 10,057 2,218,539 97,377 4.2% 61,865
Jul-17 200,932 7,558 3.6% 10,155 2,216,343 96,879 4.2% 62,395
Jun-17 199,988 7,699 3.7% 10,879 2,213,831 96,674 4.2% 66,498
May-17 199,197 6,430 3.1% 11,360 2,211,586 97,141 4.2% 65,966
Source: S.C. Department of Employment & Workforce & The Conference Board's Help Wanted OnLine® data series
South Carolina Data is Seasonally Adjusted
Page 3 of 29SC Department of Employment & Workforce

Charleston CountyCommunity Profile
May 2018
Characteristics of Unemployment Insurance Claimants
Charleston County South CarolinaGender
Female 11 3,740Male 9 2,999O 75
0% 10% 20% 30% 40% 50% 60%
Female
Male
Charleston County South Carolina
Charleston CountyRace South Carolina
Asian 0 41BLACK 12 3,572MULTIPLE 1 160UNKNOWN 1 231WHITE 6 2,762
0% 10% 20% 30% 40% 50% 60%
Asian
BLACK
HAWAIIAN
MULTIPLE
NATIVE AMERICAN
UNKNOWN
WHITE
Charleston County South CarolinaAge Group
18 - 24 1 65625 - 40 6 2,98541 - 55 9 2,07956 - 64 3 85565+ 1 237Less than 18 0 2
0% 5% 10% 15% 20% 25% 30% 35% 40% 45%
18 - 24
25 - 40
41 - 55
56 - 64
65+
Less than 18
Source: S.C. Department of Employment & Workforce
Charleston CountyEducation South Carolina
College Grad 10 2,964Some College 6 2,972Some High School 2 530No High School 0 45Unknown 2 303
0% 10% 20% 30% 40% 50%
College Grad
No High School
Some College
Some High School
Unknown
Page 4 of 29SC Department of Employment & Workforce

Charleston CountyCommunity Profile
Characteristics of Unemployment Insurance Claims by IndustryIndustry Groups With Largest Number of Claims
May 2018
0% 5% 10% 15% 20% 25% 30% 35% 40%
Administrative and Support and WasteManageme
Construction
Manufacturing
Other Services (except Public Administration)
Retail Trade
Charleston County South Carolina
Charleston CountyIndustry South Carolina
Construction 3 423
Manufacturing 3 818
Retail Trade 2 738
Administrative and Support and Waste Manageme 8 925
Accommodation and Food Services 1 880
Other Services (except Public Administration) 2 211
Unknown 1 663
Source: S.C. Department of Employment & Workforce
Page 5 of 29SC Department of Employment & Workforce

Charleston CountyCommunity Profile
Characteristics of Unemployment Insurance Claims by OccupationOccupation Groups With Largest Number of Claims
May 2018
0% 4% 8% 12% 16% 20%
Farming, Fishing, and Forestry Occupations
Management Occupations
Office and Administrative Support Occupations
Production Occupations
Sales and Related Occupations
South CarolinaCharleston County
Charleston CountyOccupation South Carolina
Construction and Extraction Occupations 1 322Educational Instruction and Library Occupations 1 180Farming, Fishing, and Forestry Occupations 3 23Installation, Maintenance, and Repair Occupations 1 225Management Occupations 2 594Office and Administrative Support Occupations 2 1,037Production Occupations 4 727Sales and Related Occupations 1 538Transportation and Material Moving Occupations 1 424Unknown 4 641
Source: S.C. Department of Employment & Workforce
Page 6 of 29SC Department of Employment & Workforce

Charleston CountyCommunity Profile
Retail Sales
Charleston County South Carolina
$0
$200,000,000
$400,000,000
$600,000,000
$800,000,000
$1,000,000,000
$1,200,000,000
$1,400,000,000
$1,600,000,000
$1,800,000,000
$0
$4,000,000,000
$8,000,000,000
$12,000,000,000
$16,000,000,000
$20,000,000,000
$24,000,000,000
$28,000,000,000
Feb 2
017
Mar
201
7
Apr 2
017
May
201
7
Jun
2017
Jul 2
017
Aug 2
017
Sep 2
017
Oct 2
017
Nov
201
7
Dec
201
7
Jan
2018
Feb 2
018
South CarolinaCharleston County
Source: S.C. Department of Revenue
Page 7 of 29SC Department of Employment & Workforce

Charleston CountyCommunity Profile
Population by Age
0 2 4 6 8 10
0-4
10-14
20-24
30-34
40-44
50-54
60-64
70-74
80-84
0-4
10-14
20-24
30-34
40-44
50-54
60-64
70-74
80-84
Charleston County South Carolina
Charleston CountyAge Range South Carolina United States
0-4 22,990 298,242 20,052,1125-9 21,834 302,111 20,409,06010-14 17,869 297,443 20,672,60915-19 21,780 321,540 21,715,07420-24 30,703 342,237 22,099,88725-29 32,085 305,167 21,243,36530-34 26,478 293,464 20,467,91235-39 23,636 291,183 19,876,16140-44 20,563 308,158 20,998,00145-49 23,713 325,660 22,109,94650-54 24,730 329,431 22,396,32255-59 23,382 309,061 20,165,89260-64 21,363 289,690 17,479,21165-69 16,434 229,251 13,189,50870-74 11,052 165,797 9,767,52275-79 8,287 117,187 7,438,75080-84 6,213 82,223 5,781,69785 and older 5,624 71,757 5,673,565
Source: U.S. Census Bureau, American Community Survey
Page 8 of 29SC Department of Employment & Workforce
Charleston CountyCommunity Profile
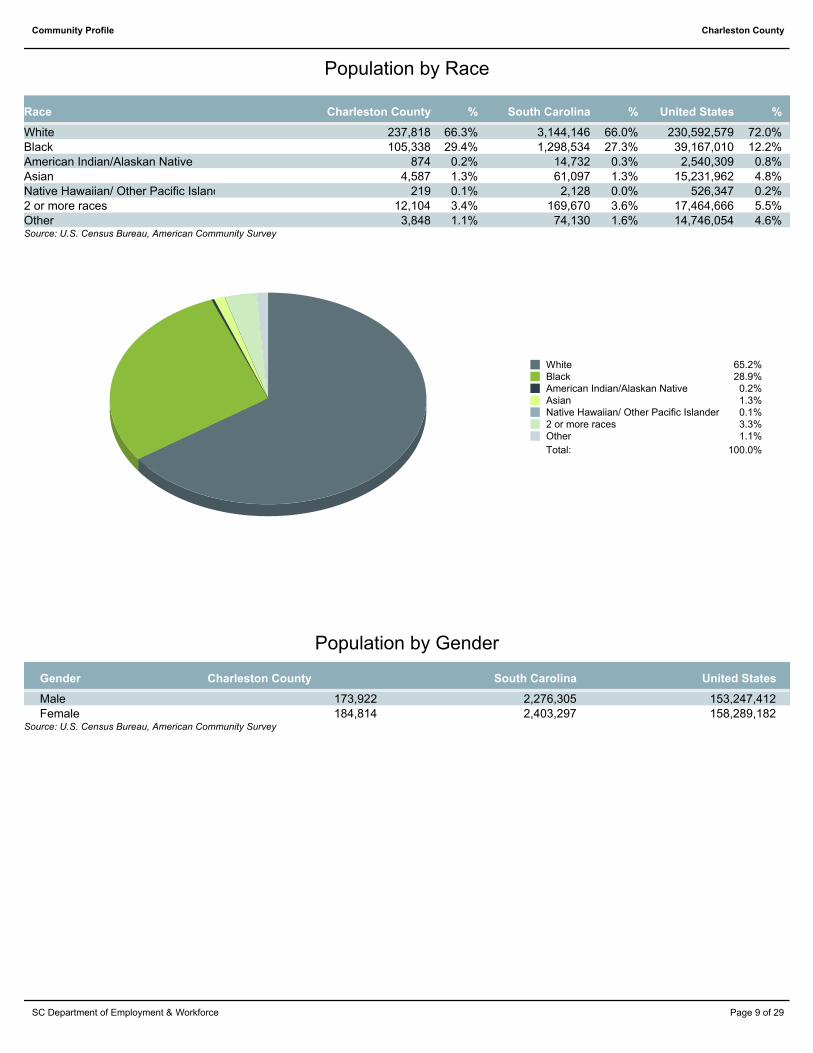
Population by Race
Charleston CountyRace % South Carolina % United States %
White 237,818 66.3% 3,144,146 66.0% 230,592,579 72.0%Black 105,338 29.4% 1,298,534 27.3% 39,167,010 12.2%American Indian/Alaskan Native 874 0.2% 14,732 0.3% 2,540,309 0.8%Asian 4,587 1.3% 61,097 1.3% 15,231,962 4.8%Native Hawaiian/ Other Pacific Islander 219 0.1% 2,128 0.0% 526,347 0.2%2 or more races 12,104 3.4% 169,670 3.6% 17,464,666 5.5%Other 3,848 1.1% 74,130 1.6% 14,746,054 4.6%Source: U.S. Census Bureau, American Community Survey
White 65.2%Black 28.9%American Indian/Alaskan Native 0.2%Asian 1.3%Native Hawaiian/ Other Pacific Islander 0.1%2 or more races 3.3%Other 1.1%
Total: 100.0%
Population by Gender
Charleston CountyGender South Carolina United States
Male 173,922 2,276,305 153,247,412Female 184,814 2,403,297 158,289,182
Source: U.S. Census Bureau, American Community Survey
Page 9 of 29SC Department of Employment & Workforce

Charleston CountyCommunity Profile
Historical and Projected
Population Change
South CarolinaCharleston County
0K
50K
100K
150K
200K
250K
300K
350K
400K
0K
1000K
2000K
3000K
4000K
5000K
6000K
1970 1980 1990 2000 2010 2020 2030
Year
South CarolinaCharleston County
Charleston CountyYear South Carolina
1970 247,561 2,590,7131980 276,556 3,121,8201990 295,159 3,486,3102000 309,969 4,012,0122010 348,370 4,549,1502020 366,380 5,020,4002030 386,660 5,488,460
Source: U.S. Census Bureau
Page 10 of 29SC Department of Employment & Workforce

Charleston CountyCommunity Profile
Commuting Patterns
In-Commuters 41.2%Out-Commuters 31.3%Work and Live in County 27.5%
Total: 100.0%
WorkersCommuting Patterns
Work and Live in County 146,452
In-Commuters 219,654
Out-Commuters 166,693
Source: U.S. Census Bureau - 2010
Page 11 of 29SC Department of Employment & Workforce

Charleston CountyCommunity Profile
Top 10 Places Residents Are Commuting To
Area Workers
Berkeley County, SC 9,932Dorchester County, SC 5,533Colleton County, SC 348Richland County, SC 253FULTON COUNTY, GA 206Lexington County, SC 190Horry County, SC 187Orangeburg County, SC 152Georgetown County, SC 150Greenville County, SC 119
Source: U.S. Census Bureau - 2010
Top 10 Places Residents Are Commuting From
Area Workers
Berkeley County, SC 36,248Dorchester County, SC 27,878Colleton County, SC 1,882Orangeburg County, SC 826Georgetown County, SC 419Richland County, SC 400Lexington County, SC 289MECKLENBURG COUNTY, NC 270Horry County, SC 263Florence County, SC 211
Source: U.S. Census Bureau - 2010
Page 12 of 29SC Department of Employment & Workforce

Charleston CountyCommunity Profile
Employers by Size of Establishment
Charleston CountyEmployees South Carolina
0 to 4 8,625 75,6495 to 9 2,377 20,26310 to 19 1,764 14,97720 to 49 1,486 11,54750 to 99 568 4,562100 to 249 227 2,731250 to 499 69 866500 to 999 21 3871000 + 17 293
Source: S.C. Department of Employment & Workforce - 2017 Q3
- Indicates that the requested data is suppressed
Employment by Size of Establishment
Charleston CountyEmployees South Carolina
0 to 4 12,619 110,0575 to 9 15,827 135,03810 to 19 23,915 203,46920 to 49 45,303 352,61350 to 99 38,388 311,959100 to 249 33,726 411,508250 to 499 22,427 294,535500 to 999 14,648 262,9921000 + 43,279 738,384
Source: S.C. Department of Employment & Workforce - 2017 Q3
- Indicates that the requested data is suppressed
Page 13 of 29SC Department of Employment & Workforce

Charleston CountyCommunity Profile
20 Largest Employers
(Listed Alphabetically)
Corporation Name
AUTOZONERS LLC
CAREALLIANCE HEALTH SERVICES
CHARLESTON COUNTY
CHARLESTON COUNTY SCHOOL DISTRICT
CITY OF CHARLESTON
CITY OF NORTH CHARLESTON
COLLEGE OF CHARLESTON
DEPARTMENT OF DEFENSE
HARRIS TEETER LLC
IQOR HOLDINGS US INC
KIAWAH ISLAND INN COMPANY LLC
MEDICAL UNIV OF SC HOSPITAL AUTHORI
MEDICAL UNIVERSITY OF SC
THE BOEING COMPANY
TRIDENT MEDICAL CENTER LLC
TRIDENT TECHNICAL COLLEGE
UNIVERSITY MEDICAL ASSOCIATES INC
US POSTAL SERVICE
WAL-MART ASSOCIATES INC
WJBD VA MEDICAL CENTER
Source: S.C. Department of Employment & Workforce - 2017 Q3
Page 14 of 29SC Department of Employment & Workforce

Charleston CountyCommunity Profile
Employment by Industry
35,142
19,847
169
4,773
12,958
18,599
6,146
37,986
4,329
2,088
27
6,220
16,640
15,486
5,148
1,265
6,019
Accommodation and Food Services
Administrative and Support and Waste Management andRemediation Services
Agriculture, Forestry, Fishing and Hunting
Arts, Entertainment, and Recreation
Construction
Educational Services
Finance and Insurance
Health Care and Social Assistance
Information
Management of Companies and Enterprises
Mining, Quarrying, and Oil and Gas Extraction
Other Services (except Public Administration)
Professional, Scientific, and Technical Services
Public Administration
Real Estate and Rental and Leasing
Utilities
Wholesale Trade
Source: S.C. Department of Employment & Workforce
Quarterly Census of Employment and Wages (QCEW) - 2017 Q3
Page 15 of 29SC Department of Employment & Workforce
Charleston CountyCommunity Profile
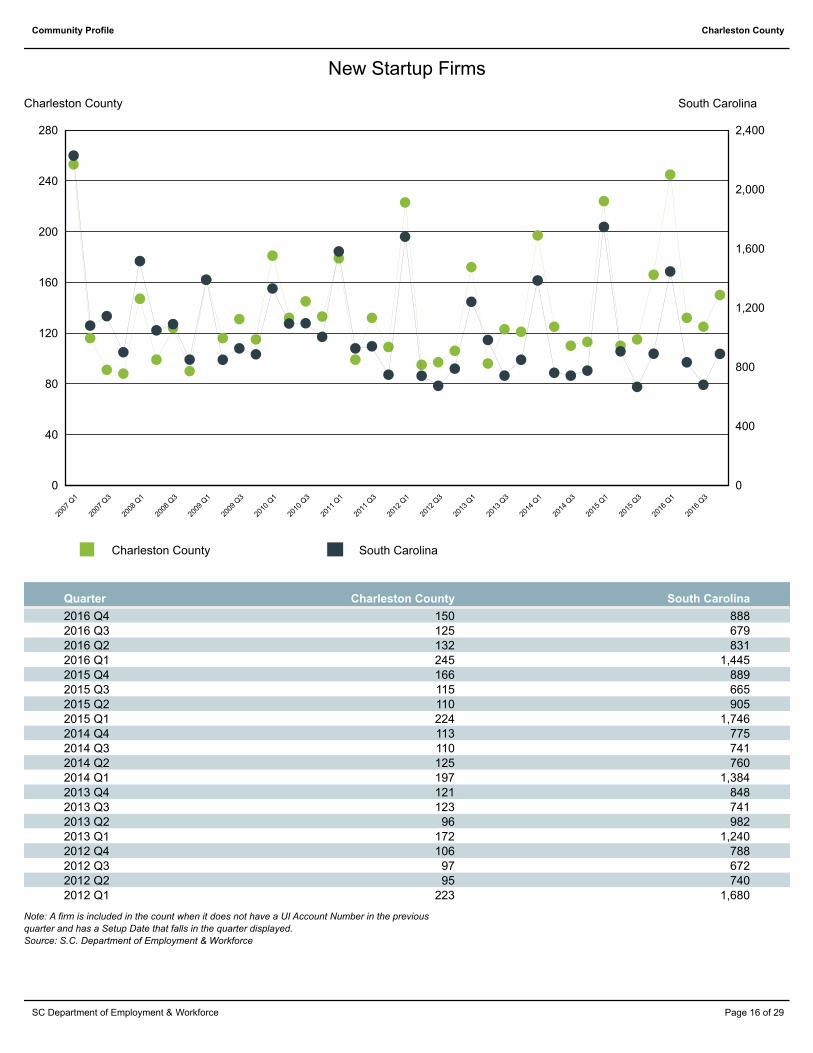
New Startup Firms
South CarolinaCharleston County
0
40
80
120
160
200
240
280
0
400
800
1,200
1,600
2,000
2,400
2007
Q1
2007
Q3
2008
Q1
2008
Q3
2009
Q1
2009
Q3
2010
Q1
2010
Q3
2011
Q1
2011
Q3
2012
Q1
2012
Q3
2013
Q1
2013
Q3
2014
Q1
2014
Q3
2015
Q1
2015
Q3
2016
Q1
2016
Q3
South CarolinaCharleston County
Charleston CountyQuarter South Carolina
2016 Q4 150 8882016 Q3 125 6792016 Q2 132 8312016 Q1 245 1,4452015 Q4 166 8892015 Q3 115 6652015 Q2 110 9052015 Q1 224 1,7462014 Q4 113 7752014 Q3 110 7412014 Q2 125 7602014 Q1 197 1,3842013 Q4 121 8482013 Q3 123 7412013 Q2 96 9822013 Q1 172 1,2402012 Q4 106 7882012 Q3 97 6722012 Q2 95 7402012 Q1 223 1,680
Note: A firm is included in the count when it does not have a UI Account Number in the previous
quarter and has a Setup Date that falls in the quarter displayed.
Source: S.C. Department of Employment & Workforce
Page 16 of 29SC Department of Employment & Workforce

Charleston CountyCommunity Profile
Top 20 Occupational Openings
Charleston County
April-2016
Occupation Name (Soccode) Job Openings
Registered Nurses (29-1141) 707
Heavy and Tractor-Trailer Truck Drivers (53-3032) 446
Retail Salespersons (41-2031) 329
First-Line Supervisors of Food Preparation and Serving Workers (35-1012) 272
First-Line Supervisors of Retail Sales Workers (41-1011) 253
Maids and Housekeeping Cleaners (37-2012) 205
Maintenance and Repair Workers, General (49-9071) 187
Customer Service Representatives (43-4051) 170
First-Line Supervisors of Office and Administrative Support Workers (43-1011) 159
Waiters and Waitresses (35-3031) 135
First-Line Supervisors of Construction Trades and Extraction Workers (47-1011) 125
Light Truck Drivers (53-3033) 119
Janitors and Cleaners, Except Maids and Housekeeping Cleaners (37-2011) 117
Cooks, Restaurant (35-2014) 115
Executive Secretaries and Executive Administrative Assistants (43-6011) 114
Insurance Sales Agents (41-3021) 111
Medical and Health Services Managers (11-9111) 109
Sales Representatives, Wholesale and Manufacturing, Except Technical and Scientific Products
(41-4012)
108
Industrial Engineers (17-2112) 104
Landscaping and Groundskeeping Workers (37-3011) 99
Source: S.C. Department of Employment & Workforce & The Conference Board's Help Wanted OnLine® data series
Page 17 of 29SC Department of Employment & Workforce

Charleston CountyCommunity Profile
New Hires by Industry
14,519
8,800
211
1,981
2,714
920
670
3,728
905
233
1,088
0
1,538
2,486
656
874
6,215
1,250
41
777
Accommodation and Food Services
Administrative and Support and Waste Managementand Remediation Services
Agriculture, Forestry, Fishing and Hunting
Arts, Entertainment, and Recreation
Construction
Educational Services
Finance and Insurance
Health Care and Social Assistance
Information
Management of Companies and Enterprises
Manufacturing
Mining, Quarrying, and Oil and Gas Extraction
Other Services (except Public Administration)
Professional, Scientific, and Technical Services
Public Administration
Real Estate and Rental and Leasing
Retail Trade
Transportation and Warehousing
Utilities
Wholesale Trade
Source: U.S. Census Bureau, Local Employment Dynamics - 2016 Q2
Page 18 of 29SC Department of Employment & Workforce
Charleston CountyCommunity Profile
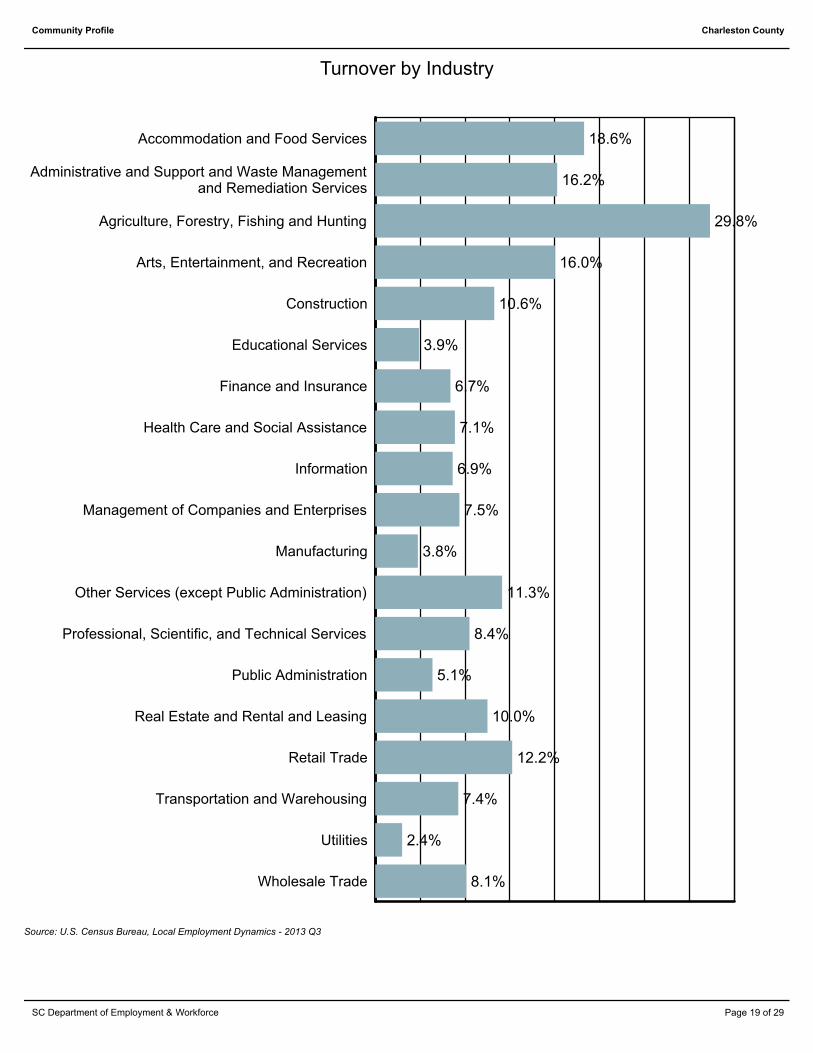
Turnover by Industry
18.6%
16.2%
29.8%
16.0%
10.6%
3.9%
6.7%
7.1%
6.9%
7.5%
3.8%
11.3%
8.4%
5.1%
10.0%
12.2%
7.4%
2.4%
8.1%
Accommodation and Food Services
Administrative and Support and Waste Managementand Remediation Services
Agriculture, Forestry, Fishing and Hunting
Arts, Entertainment, and Recreation
Construction
Educational Services
Finance and Insurance
Health Care and Social Assistance
Information
Management of Companies and Enterprises
Manufacturing
Other Services (except Public Administration)
Professional, Scientific, and Technical Services
Public Administration
Real Estate and Rental and Leasing
Retail Trade
Transportation and Warehousing
Utilities
Wholesale Trade
Source: U.S. Census Bureau, Local Employment Dynamics - 2013 Q3
Page 19 of 29SC Department of Employment & Workforce

Charleston CountyCommunity Profile
Average Annual Wage by Industry
$21,892
$30,628
$24,804
$22,828
$56,732
$47,788
$69,992
$59,592
$54,132
$66,092
$35,568
$34,892
$72,436
$60,008
$46,644
$60,736
$61,828
Accommodation and Food Services
Administrative and Support and WasteManagement and Remediation Services
Agriculture, Forestry, Fishing and Hunting
Arts, Entertainment, and Recreation
Construction
Educational Services
Finance and Insurance
Health Care and Social Assistance
Information
Management of Companies and Enterprises
Mining, Quarrying, and Oil and Gas Extraction
Other Services (except Public Administration)
Professional, Scientific, and Technical Services
Public Administration
Real Estate and Rental and Leasing
Utilities
Wholesale Trade
Source: S.C. Department of Employment & Workforce
Quarterly Census of Employment and Wages (QCEW) - 2017 Q3
Page 20 of 29SC Department of Employment & Workforce

Charleston CountyCommunity Profile
Age of Workers by Industry
65+55-6445-5435-4425-3422-2419-2114-18Industry
Total, All Industries 4,382 9,169 14,794 61,560 51,392 47,502 35,663 12,576
Agriculture, Forestry, Fishing and Hunting 4 4 8 39 25 26 45 28
Mining, Quarrying, and Oil and Gas Extraction 0 0 0 3 4 0 0 3
Utilities 0 10 25 213 238 284 272 49
Construction 53 300 553 2,762 3,046 2,774 1,833 571
Manufacturing 34 180 592 4,154 4,062 4,434 3,256 565
Wholesale Trade 14 117 259 1,338 1,502 1,586 1,078 324
Retail Trade 1,060 2,378 2,633 7,174 4,857 4,911 3,851 1,759
Transportation and Warehousing 16 119 352 1,589 1,853 2,174 1,766 497
Information 33 82 208 1,314 1,272 962 647 174
Finance and Insurance 5 58 229 1,480 1,552 1,444 1,069 309
Real Estate and Rental and Leasing 20 89 257 1,304 1,117 1,038 809 452
Professional and Technical Services 53 198 677 4,645 4,379 3,525 2,592 952
Management of Companies and Enterprises 20 38 92 602 593 596 427 103
Administrative and Waste Services 126 837 1,497 5,556 4,292 3,923 2,734 1,162
Educational Services 45 236 640 4,472 4,424 4,199 3,694 1,344
Health Care and Social Assistance 91 404 1,374 9,039 8,353 7,770 6,050 1,772
Arts, Entertainment, and Recreation 403 323 427 1,095 783 636 578 394
Accommodation and Food Services 2,259 3,396 4,130 10,829 5,728 3,798 2,251 954
Other Services, Except Public Administration 89 280 513 1,787 1,332 1,347 993 516
Public Administration 57 119 327 2,166 1,980 2,070 1,717 647
Source: U.S. Census Bureau, Local Employment Dynamics - 2016 Q2
Page 21 of 29SC Department of Employment & Workforce

Charleston CountyCommunity Profile
Labor Market ProjectionsTotal Employment by Industry
(County/Metropolitan Statistical Area Data Unavailable)
Note: Projections are available by Workforce Investment Area (WIA). The data displayed is selected from the appropriate WIA.
Trident 2014 2024
Industry Estimated
Employment
Projected
Employment
Change Percent
Change
Annual
Percent
Total Employment, All Jobs 327,765 370,163 42,398 12.94 1.22
Health care and social assistance 36,913 44,868 7,955 21.55 1.97
Administrative and support and waste management
and remediat
23,554 29,739 6,185 26.26 2.36
Professional, scientific, and technical services 18,707 23,513 4,806 25.69 2.31
Educational services; state, local, and private 27,168 31,361 4,193 15.43 1.45
Accommodation and food services 36,947 40,729 3,782 10.24 0.98
Construction 15,243 18,445 3,202 21.01 1.93
Manufacturing 24,511 27,098 2,587 10.55 1.01
Retail Trade 37,929 40,101 2,172 5.73 0.56
Transportation and Warehousing 12,658 14,244 1,586 12.53 1.19
Other services (except public administration) 12,269 13,039 770 6.28 0.61
Finance and insurance 7,487 8,238 751 10.03 0.96
Real estate and rental and leasing 5,160 5,672 512 9.92 0.95
Information 4,917 5,402 485 9.86 0.95
Arts, entertainment, and recreation 4,420 4,787 367 8.30 0.80
Management of companies and enterprises 1,914 2,073 159 8.31 0.80
Source: S.C. Department of Employment & Workforce - Industry Projections
Page 22 of 29SC Department of Employment & Workforce

Charleston CountyCommunity Profile
Total Employment by Occupation(County/Metropolitan Statistical Area Data Unavailable)
Note: Projections are available by Workforce Investment Area (WIA). The data displayed is selected from the appropriate WIA.
Labor Market Projections
Trident 2014 2024
Occupation Estimated
Employment
Projected
Employment
Annual
Openings
Openings
(Replace)
Openings
(Growth)
Total, all occupations 12,270 4,364 7,906 370,163 327,765
Management occupations 590 217 373 18,476 16,383
Business and financial operations occupations 511 214 297 17,084 14,991
Computer and mathematical occupations 335 217 118 10,359 8,230
Architecture and engineering occupations 288 104 184 8,259 7,251
Life, physical, and social science occupations 76 25 51 2,103 1,874
Community and social service occupations 118 46 72 3,788 3,332
Legal occupations 73 33 40 2,544 2,221
Education, training, and library occupations 761 359 402 22,328 18,746
Arts, design, entertainment, sports, and media
occupations
158 44 114 4,985 4,579
Healthcare practitioners and technical occupations 856 356 500 26,169 22,608
Healthcare support occupations 330 156 174 9,489 7,945
Protective service occupations 248 60 188 8,096 7,512
Food preparation and serving related occupations 1,578 376 1,202 36,060 32,504
Building and grounds cleaning and maintenance
occupations
476 214 262 15,132 12,995
Personal care and service occupations 458 172 286 12,794 11,076
Sales and related occupations 1,410 312 1,098 39,833 36,710
Office and administrative support occupations 1,486 470 1,016 52,901 48,624
Farming, fishing, and forestry occupations 38 1 37 1,379 1,465
Construction and extraction occupations 529 286 243 18,882 16,018
Installation, maintenance, and repair occupations 500 187 313 15,311 13,472
Production occupations 655 231 424 20,682 18,557
Transportation and material moving occupations 796 284 512 23,509 20,672
Source: S.C. Department of Employment & Workforce - Occupational Projections
Page 23 of 29SC Department of Employment & Workforce

Charleston CountyCommunity Profile
Growing Occupations
(County/Metropolitan Statistical Area Data Unavailable)
Note: Projections are available by Workforce Investment Area (WIA). The data displayed is selected from the appropriate WIA.
Labor Market Projections
Trident 2014 2024
Occupation Estimated
Employment
Projected
Employment
Percent
Change
Replace Growth Total Average
Salary
Personal care aides $ 19,728 61 52 9 46 1,654 1,135
Assemblers and fabricators, all other $ 29,914 7 5 2 42 155 109
Statisticians $ 60,393 3 2 1 41 86 61
Home health aides $ 20,920 31 20 11 41 706 502
Computer systems analysts $ 68,981 83 63 20 40 2,211 1,582
Web developers $ 61,155 12 9 3 39 330 237
Computer-controlled machine tool operators,
metal and plasti
$ 37,860 59 33 26 39 1,183 853
Operations research analysts $ 72,040 23 16 7 39 570 411
Software developers, applications $ 83,896 30 22 8 37 802 587
Software developers, systems software $ 74,884 28 20 8 36 753 553
Nurse practitioners $ 86,191 14 8 6 35 313 232
Education administrators, preschool and
childcare center/pro
$ 38,695 12 6 6 35 253 188
Information security analysts $ 70,785 15 11 4 34 437 327
Preschool teachers, except special education $ 27,437 64 33 31 32 1,379 1,045
Forensic science technicians $ 48,240 2 1 1 32 29 22
Computer and information systems managers $ 122,120 25 18 7 32 767 583
Miscellanouse Teachers and Instructors $ 68,612 73 46 27 31 1,913 1,455
Veterinary technologists and technicians $ 32,336 13 10 3 31 441 336
Substance abuse and behavioral disorder
counselors
$ 35,410 1 1 0 30 30 23
Commercial pilots $ 109,560 2 1 1 29 44 34
Occupations are sorted by highest estimated percentage growth from estimate year to projection year.
Source: S.C. Department of Employment & Workforce - Occupational Projections
Page 24 of 29SC Department of Employment & Workforce
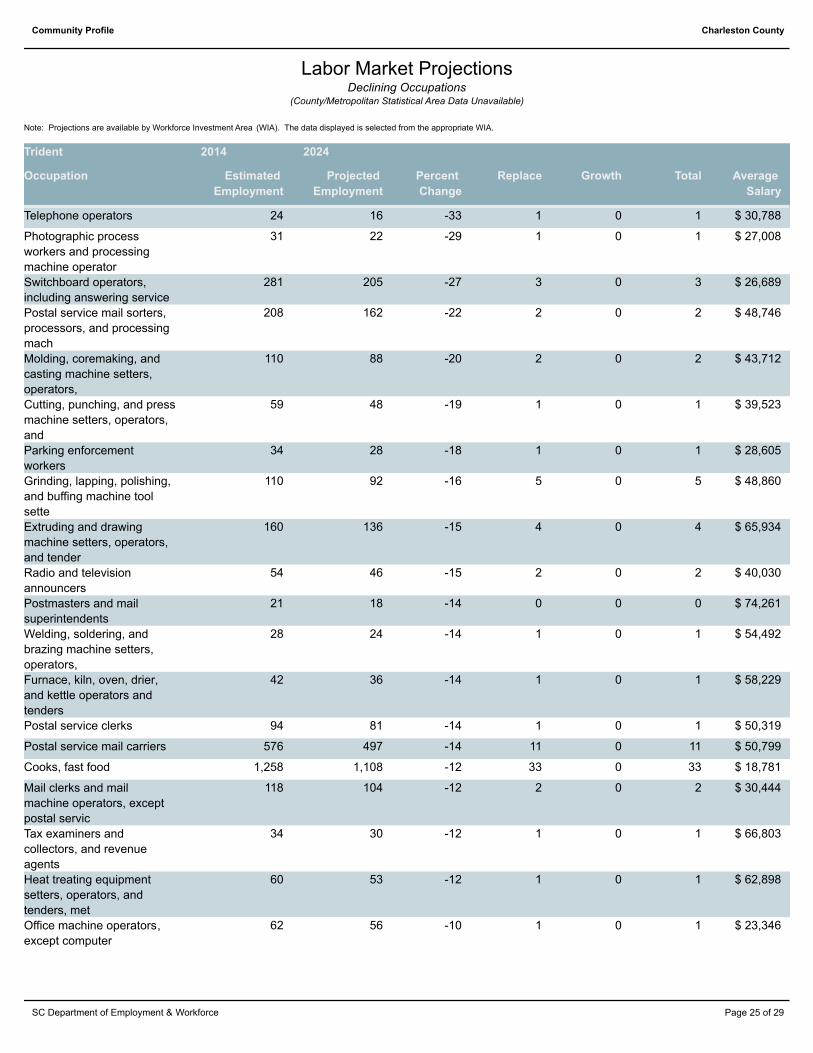
Charleston CountyCommunity Profile
Declining Occupations(County/Metropolitan Statistical Area Data Unavailable)
Note: Projections are available by Workforce Investment Area (WIA). The data displayed is selected from the appropriate WIA.
Labor Market Projections
Trident 2014 2024
Occupation Estimated
Employment
Projected
Employment
Percent
Change
Replace Growth Total Average
Salary
Telephone operators 24 16 -33 1 0 1 $ 30,788
Photographic process
workers and processing
machine operator
31 22 -29 1 0 1 $ 27,008
Switchboard operators,
including answering service
281 205 -27 3 0 3 $ 26,689
Postal service mail sorters,
processors, and processing
mach
208 162 -22 2 0 2 $ 48,746
Molding, coremaking, and
casting machine setters,
operators,
110 88 -20 2 0 2 $ 43,712
Cutting, punching, and press
machine setters, operators,
and
59 48 -19 1 0 1 $ 39,523
Parking enforcement
workers
34 28 -18 1 0 1 $ 28,605
Grinding, lapping, polishing,
and buffing machine tool
sette
110 92 -16 5 0 5 $ 48,860
Extruding and drawing
machine setters, operators,
and tender
160 136 -15 4 0 4 $ 65,934
Radio and television
announcers
54 46 -15 2 0 2 $ 40,030
Postmasters and mail
superintendents
21 18 -14 0 0 0 $ 74,261
Welding, soldering, and
brazing machine setters,
operators,
28 24 -14 1 0 1 $ 54,492
Furnace, kiln, oven, drier,
and kettle operators and
tenders
42 36 -14 1 0 1 $ 58,229
Postal service clerks 94 81 -14 1 0 1 $ 50,319
Postal service mail carriers 576 497 -14 11 0 11 $ 50,799
Cooks, fast food 1,258 1,108 -12 33 0 33 $ 18,781
Mail clerks and mail
machine operators, except
postal servic
118 104 -12 2 0 2 $ 30,444
Tax examiners and
collectors, and revenue
agents
34 30 -12 1 0 1 $ 66,803
Heat treating equipment
setters, operators, and
tenders, met
60 53 -12 1 0 1 $ 62,898
Office machine operators,
except computer
62 56 -10 1 0 1 $ 23,346
Page 25 of 29SC Department of Employment & Workforce

Charleston CountyCommunity Profile
Occupations are sorted by highest estimated percentage decline from estimate year to projection year.
Source: S.C. Department of Employment & Workforce - Occupational Projections
Page 26 of 29SC Department of Employment & Workforce
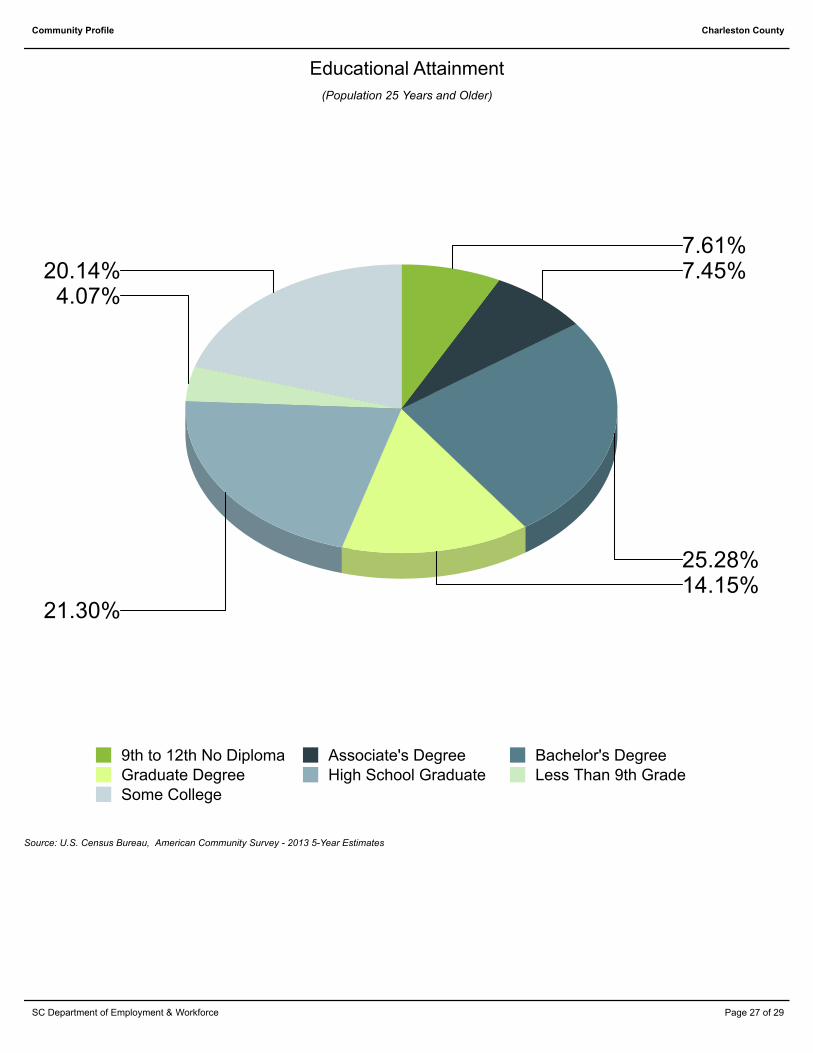
Charleston CountyCommunity Profile
(Population 25 Years and Older)
Educational Attainment
7.61%7.45%
25.28%14.15%
21.30%
4.07%20.14%
9th to 12th No Diploma Associate's Degree Bachelor's DegreeGraduate Degree High School Graduate Less Than 9th GradeSome College
Source: U.S. Census Bureau, American Community Survey - 2013 5-Year Estimates
Page 27 of 29SC Department of Employment & Workforce

Charleston CountyCommunity Profile
(Based On Graduates From Area Schools)
Graduate Trends
0
500
1000
1500
2000
2500
3000
3500
2003 2004 2005 2006 2007 2008 2009 2010 2011 2012 2013 2014
Bachelor's Degree Doctor's Degrees Master's Degree
Source: Institute of Education Sciences (IES), Integrated Postsecondary Education Data System
Page 28 of 29SC Department of Employment & Workforce

Charleston CountyCommunity Profile
Educational Institutions
Centura College-North Charleston
8088 Rivers Ave
North Charleston, SC 29406
843.569.0889
http://www.centuracollege.edu
2014 Degrees Awarded: 59
Charleston School of Law
81 Mary Street
Charleston, SC 29403
843.329.1000
http://www.charlestonlaw.edu/
2014 Degrees Awarded: 202
Charleston Southern University
9200 University Blvd
Charleston, SC 29406
843.863.7000
http://www.csuniv.edu
2014 Degrees Awarded: 593
Citadel Military College of South Carolina
171 Moultrie St
Charleston, SC 29409
843.225.3294
http://www.citadel.edu
2014 Degrees Awarded: 821
College of Charleston
66 George St
Charleston, SC 29424
843.953.5500
http://www.cofc.edu
2014 Degrees Awarded: 2,490
ITT Technical Institute-North Charleston
2431 W Aviation Ave
North Charleston, SC 29406
843.745.5700
http://www.itt-tech.edu
2014 Degrees Awarded: 41
Medical University of South Carolina
179 Ashley Ave
Charleston, SC 29425
843.792.2300
http://www.musc.edu/
2014 Degrees Awarded: 929
Miller-Motte Technical College-North Charleston
8085 Rivers Ave., Ste E
Charleston, SC 29418
843.574.0101
http://miller-motte.edu
2014 Degrees Awarded: 331
Paul Mitchell The School-Charleston
4952 Centre Pointe Drive, Suite 114
North Charleston, SC 29418
843.725.0246
http://charleston.paulmitchell.edu
2014 Degrees Awarded: 110
Southeastern Institute-Charleston
4600 Goer Dr, Ste 105
North Charleston, SC 29406
843.747.1279
http://www.southeasterninstitute.com
2014 Degrees Awarded: 184
The Art Institute of Charleston
24 N. Market St
Charleston, SC 29401
843.727.3500
http://www.artinstitutes.edu/charleston
2014 Degrees Awarded: 144
Trident Technical College
7000 Rivers Avenue
Charleston, SC 29423
843.574.6111
http://www.tridenttech.edu
2014 Degrees Awarded: 3,298
Virginia College-Charleston
6185 Rivers Avenue
North Charleston, SC 29406
843.614.4300
http://www.vc.edu/charleston
2014 Degrees Awarded: 176
Source: Institute of Education Sciences (IES), Integrated Postsecondary Education Data System
Page 29 of 29SC Department of Employment & Workforce