charge and currentdensity on moderately crossed ... · unclassified...
TRANSCRIPT

rr-jTiss
CHARGE AND CURRENT DENSITY DISTRIBUTIONSON MODERATELY THICK TRANSMITTING
CROSSED-MONOPOLE ANTENNAS
William Edward Beyatte
mi


Report Number NPS62Zn76121
NAVAL POSTGRADUATE SCHOOL
Monterey, California
THESISCHARGI
ON: AND CURRENT DENSITY DISTRIBUTIONSMODERATELY THICK TRANSMITTINGCROSSED-MONOPOLE ANTENNAS
by
William Edward Beyatte
December 1976
Thesis Advisor: R. W. Burton
Approved for public release; distribution onlimited.
Prepared for: Air Force Weapons Laboratory/PRPKirtland AFBNew Mexico 87117


UNCLASSIFIEDSECURITY CLASSIFICATION OF THIS PA«E (Whan Dmtm Snlar*^)
REPOUT DOCUMENTATION PAGE READ INSTRUCTIONSBEFORE COMPLETING FORM
1. RCPOAT NUMBER
NPS62Zn76121
2. GOVT ACCESSION NO. ) RECIPIENT'S CATALOG NUMBER
4. TITLE (and Subtltia)
CHARGE AND CURRENT DENSITY DISTRIBUTIONSON MODERATELY THICK TRANSMITTINGCROSSED-MONOPOLE ANTENNAS
5. TYPE OF REPORT * PERIOD COVERED
Final Report1 Apr 7 6 - 1 Dec 7 6«. PERFORMING ORG. REPORT NUMBER
7. AUTHOI»<«>
William E. Beyattein conjunction withRobert W. Burton
a. CONTRACT OR GRANT NUMBERfa^
t. PERFORMING ORQ-ANI Z ATION NAME ANO ADDRESS
Naval Postgraduate SchoolMonterey, California
10. PROGRAM ELEMENT. PROJECT, TASKAREA * WORK UNIT NUMBERS
1 1. CONTROLLING OFFICE NAME AND ADDRESS
Air Force Weapons Laboratory/PRPKirtland AFBNew Mexico 87117
12. REPORT DATE
December 1976IS. NUMBER OF PAGES
incr14. MONITORING AGENCY NAME * ADDRESS<1/ dlUarant horn Controltint OWea) IS. SECURITY CLASS, (at IMa riport)
UnclassifiedIS«. DECLASSIFICATION/ DOWNGRADING
SCHEDULE
t«. DISTRIBUTION STATEMENT (ot thia Kapori)
Approved for public release, distribution unlimited.
17. DISTRIBUTION STATEMENT Co/ Ml* a*attmcl antfd In Btack 30. II ditlatant Iraan Raport)
18. SUPPLEMENTARY NOTES
IS. KEY WORDS (Canllmia an rawaram aida II nacaaaatr an^ Idantilr br Mee* ntmtbar)
Surface Charge and Current DistributionCross ed-MonopoleJunction Charge
20. ABSTRACT (Conllnua on tavataa alda II nacaaamr dnd Idantilr kr blaa* tmmbat)
Charge and current density distributions in the vicinityof the cross junction of several configurations ofelectrically long, moderately thick, crossed-monopoleantennas with an intersecting angle of 45 degrees weremeasured. The recorded data was compared with a monopoleantenna with the same dimensions as the vertical segment
"W I JAN 73
(Page 1)
1473 EDITION OF t NOV SS IS OBtOLETCS/N 0103-014- «<01
I
UNCLASSIFIEDSECURITY CLASSIFICATION OF THIS PAGE (Whan Data Kntarad)


TINri.A^^TFTFnfiiCUWITY CLASSIFICATION OF THIS P»GEr>»^Ti n»tm gw>«r«rf
of the crossed monopole. Junction conditions such that therewould be a maximum current/minimum charge and minimum current/maximum charge on the vertical monopole were investigated.
DD Form 1473, 1 Jan 73
S/N 0102-014-6601UNCLASSIFIED
SECURITY CLASSIFICATION OF THIS PAGEr"*«n Dmim Enffd)


Charge and Current Density Distributions
on Moderately Thick Transmitting
Crossed-Monopole Antennas
by
William Edward Beyatte
Lieutenant, United States Navy
B.E.E.E. Vanderbilt University, 1970
Submitted in partial fulfillment of the
requirements for the degree of
ilASTEfi OF SCIENCE IN ELECTRICAL ENGINEERING
from the
NAVAL POSTGRADUATE SCHOOL
December 1976


NAVAL POSTGRADUATE SCHOOL
Monterey, California
Rear Admiral Isham W. Linder Jack R. Borsting
Superintendent Provost
This thesis was prepared in conjunction with
research supported in part by AFWL/PRP under Project numbers
75-002 and 76-211. Reproduction of all or part of this
report is authorized.
Released as a
technical report by:


ABSTRACT
Charge and current density distributions in the
vicinity of the cross junction of several
configurations of electrically long, moderately thicX,
crossed-monopole antennas with an intersecting angle
of 45 degrees were measured. The recorded data was
compared with a monopole antenna with the same
dimensions as the vertical segment of the
crossed-monopole. Junction conditions such that there
would be a maximum current/minimum charge and minimum
cuiprent/maximum charge on the vertical monopole were
investigated.


TABLE 0? CONTENTS
I. INTRODUCTION 8
A. BACKGROUND 8
B. THESIS OBJECTIVE 11
II. THEORY 12
A. MONOPOLES 12
B. CBOSSED-MONOPOLES 13
III. CHARGE AND CURRENT DISTRIBUTIONS 16
1. Antennas.... 16
A. EXPERIMENTAL APPARATUS 16
a. Honopole 16
b. Crossed-Monopoles 18
c. Length Adjustment 20
1. Feed System 22
2. Image Plane 25
3. Charge and Current Probes 27
4. Instrumentation 34
B. EXPERIMENTAL PROCEDURE 41
1. Antenna Configurations 41
2. Data Acquisition 44


3. Data Processing 45
4. Data Analysis 46
a. Case 1 48
b. Case 2 55
c. Case 3 60
d. Case 4 65
IV. CONCLUSIONS 70
V. RECOMMENDATIONS 72
Appendix A: DATA PROCESSING PROGRAMS 73
Appendix 3: NUMERICAL DATA , 31
BIBLIOGRAPHY 98
INITIAL DISTHIBOTION LIST 99

ACKNOWLEDGEMENT
The author is sincerely grateful to Associate
Professor Robert tf. Burton for his professional guidance,
dedicated counsel and continual support during the
preparation of this thesis. Other members of the Naval
Postgraduate School staff who provided valuable assistance
include Mr. Frank Abbe, Mr. Robert Moeller, and ET1 Thomas
Nowak. Finally, the completion of this thesis is due in no
small part to the moral support provided by the author's
wife, Gail.


I. INTRODUCTION
A. BACKGROUND
The' charge and current density distributions on the
conducting surfaces of complex structures are the basis for
understanding how those structures would function as
antennas. Two structures which have been investigated in
recent years are the crossed- monopole and crossed-dipole
antennas (Figure 1). The motivation for studying these two
antenna configurations has been their use as models in
determining the effects on fixed wing aircraft of exposure
to the Electromagnetic Pulse (EMP) associated with
detonation of a nuclear weapon. Electric field intensities
as high as 100,000 volts/meter from a high level nuclear
explosion pose a threat to the electronic and electrical
systems aboard aircraft, missiles, and surface installations
[DNA Report No. 2772T]. The broad spectrum electromagnetic
pulse can excite large standing waves on structures at
specific frequencies determined by the physical dimensions
of the object. Aircraft at high altitudes, thousands of
miles from the nuclear burst, would be vulnerable to EMP
effects from a high altitude burst since the thin atmosphere


would absorb only a small portion of the electromagnetic
energy. The possibility of large currents and charge
concentrations being induced on the wings and fuselage of an
aircraft has generated concern that aiission effectiveness
may be impaired or destroyed by the detrimental effects on
internal components resulting from EMP exposure.
(a) (b)
Figure 1. - (a) Crossed-monopole antenna over ground plane
and (b) crossed-dipole antenna
An electrically thin crossed-dipole scattering antenna has
been studied as a first approximation model to a fixed wing
aircraft [Burton 1974, Burton and King 197 5]. A moderately
thick crossed-monopole over a ground plane has also been


used to model an aircraft [McDowell 1976]. The
crossed- monopole over a ground plane does not share the same
similarity with an aircraft as does the crossed-dipole, but
it does allow practical experimental determination of charge
and current density distributions on the conducting . surface.
In addition to studying an aircraft as an unintentional
gatherer of electromagnetic energy it is interesting to
consider the possibility of utilizing the entire aircraft
structure as a transmitting or receiving antenna. Such an
antenna would be inherently low profile and would lack the
usual problem of integrating the antenna into the
aerodynamic design.
The study of crossed-monopoles also has importance
outside the aeronautical community. A monopole antenna may
be modified by addition of a cross arm with resulting
changes in the monopole' s radiation pattern and feed point
impedance. A crossed-monopole may thus be better suited for
some applications than the standard monopole. Empirical
data on crossed-monoploes can also be valuable in assessing
the validity of analytic solutions for charge and current
distributions such as digital computer simulation programs.
10


B. THESIS OBJECTIVE
The object of this work was to expand the present
reservior of information on crossed-monopole antennas.
Charge and current density distributions on a moderately
thick base driven crossed- monopole transmitting antenna with
a non-orthogonal geometry were to be experimentally
determined. The interaction between the two cross elements
was to be analyzed using Kirchoff's Current Law, Lenz's Law,
and a recent development in the understanding of junction
boundary conditions [Burton and King 1975]. Also the far
field radiation patterns for both orthogonal and
non-orthogonal configurations were to be determined.
11

II. THEORY
A. MONOPOLES
Theoretical solutions for the charge and current density
distributions on cylindrical monopole antennas are well
established and have been proven valid in experimental work
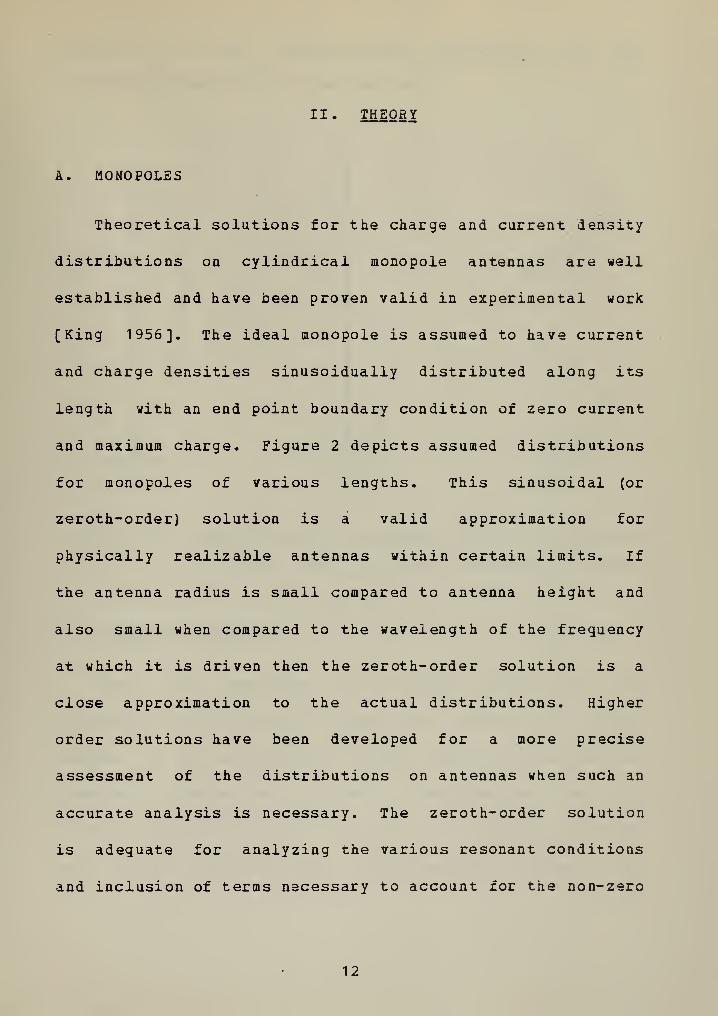
[King 1956]. The ideal monopole is assumed to have current
and charge densities sinusoidually distributed along its
length with an end point boundary condition of zero current
and maximum charge. Figure 2 depicts assumed distributions
for monopoles of various lengths. This sinusoidal (or
zeroth-order) solution is a valid approximation for
physically realizable antennas within certain limits. If
the antenna radius is small compared to antenna height and
also small when compared to the wavelength of the frequency
at which it is driven then the zeroth-order solution is a
close approximation to the actual distributions. Higher
order solutions have been developed for a more precise
assessment of the distributions on antennas when such an
accurate analysis is necessary. The zeroth-order solution
is adequate for analyzing the various resonant conditions
and inclusion of terms necessary to account for the non-zero
12


miaimums and other non-sinusoidual phenomena only adds
unnecessary complexity to the analysis.
7 J' f'^ f ^
(b)
Figure 2. - Assumed charge and current density on monopoles
(ai 1/2, (b) 1, (c) 3/2 wavelength in height
B. CROSSED-MONOPOLES
When two monopoles are crossed (Figure la) the
sinusoidal distributions of charge and current no longer
conform to the zeroth-order solution, particularly near the
junction. Charge and current distributions on the
crossed- Jiono pole may be analyzed by considering the two
major factors affecting those distributions. First, each
13

segment has a distribution influenced by the end point
boundary conditions and tendency to establish sinusoidally
varying distributions representing the zeroth-order
solution. Second, forces due to inductive coupling and
charge accumulation on adjacent segments serve to reinforce
or oppose the natural sinusoidal distributions. If the
cross arm is perpendicular to the base fed segment no
inductive coupling occurs and the distributions on the cross
arm are determined by the charge distributions along the
vertical member and the length of the cross arm [ McDowell
1976]. If the cross arm is not perpendicular then inductive
coupling will also have an effect on the distributions along
the cross arms. Earlier studies in this area [Burton 1974,
McDowell 1976] have concentrated on crossed-monopoles with
perpendicular geometry. Consideration of non-perpendicular
intersections of crossed-monopole segments provides a better
understanding of the general crossed-monopole configuration.
In the perpendicular case the charge standing wave
pattern on the vertical element produces E field forces
oriented perpendicular to the driven crossed segments; these
E field variations induce currents and charge concentrations
along the crossed segments. In the oblique case the forces
due to charge concentrations are combined with additional
14


forces due to inductive coupling. The distributions on the
cross arms result from the combined effect of inductive and
charge relaxed forces and are complicated by the lack of
symmetry. The inductive coupling effect becomes more
significant as the antenna configuration departs further
from the perpendicular case. The contribution due to
inductive coupling to the cross arms is more involved than
the contribution due to charge concentrations since the
induced currents are a function of the time rate of change
of current in the driven segment, not simply current
magnitudes.
15


III. CHAfiGB AND CURRENT DISTRIBUTIONS
&. EXPERIMENTAL APPARATUS
1 . Antennas
Brass tubing 6.35 cm (2.5 inches) in diameter was
used to construct the antennas. The diameter was
sufficiently large to classify the antennas as moderately
thicJc (the circumference was .2 wavelength at 300 Mhz, .13
wavelength at 195 Mhz) and the opening inside the tubing was
large enough to accomodate the apparatus used to position
the charge and current measuring devices.
a. Honopole
The reference monopole (Figure 3) was 101.5 cm
in height with a .32 cm (1/8 inch) slot cut longitudinally
from 30 cm above the base to 1.5 cm from the top. Correct
operation of the test apparatus was verified by taking data
on this antenna and comparing it with established
theoretical and experimental results for monopoles [King
1956].
16


j/t'^ ^^ -*' ??«i- >'«r«>'' ~x5:s;v»<'
Figure 3. - Reference moaopole
17


b. Crossed-Monopoles
The cross structure was constructed by joining
two sections of brass tubing at a 45^* angle (Figure 4) , The
vertical member extended to a height of 99 cm and the cross
member measured 60 cm end to end. A .32 cm slot extended
longitudinally for 30 cm from the junction center out along
each segment. Additional slots were cut along the bottom of
the cross segments and down the sides of the lower vertical
section. A pulley was located inside the antenna at the
junction to facilitate measurements along the cross
segments. The pulley was suspended from a solid brass rod
which extended down from a point near the top of the
vertical section where a brass disc was secured inside the
tubing.
18


"^-an^ '«S!S'5»<ft»>, -SS^SS-^jfjir. --«i(»«ai«Sj«j>im. '«»>SiS^>ifii5i'^^^^'«S»***^ *.«"
Figure 4. - Typical crossed-monopole configuration
19

c. Length Adjustment
Additional sections of brass tubing were fitted
onto the ends of the basic antennas to vary their length.
The sections were cut to lengths of 25, 7.5, 5, and 3.25 cm.
Each had a slotted ring extending from one end which was
machined to the inner diameter of the antenna tubing, thus
the sections could be mated without in-croducing any
significant discontinuities on the outer surface. To
provide electrical continuity and additional support the
junctions were covered with conductive copper or aluminum
tape. Accurate length adjustment was accomplished by using
standard length sections to provide approximate lengths and
then custom cutting small sections of tubing to make fine
adjustments. End caps were constructed to close the tubing
at the antenna extremities. Figure 5 shows (clockwise from
upper left) a 25 cm extension, 7.5 cm extension, end cap,
and fine adjustment rings.
20


u
C<U
tn
o•H
+j
a
in
(0
00•H
21


2. Feed System
A feed system was required which would allow access
to the inside of the crossed-monopoie structure to position
the charge and current measuring devices. The undesirable
alternative would have been to position a probe supporting
mechanism and observer above the ground plane in the near
field of the antenna. The feed system (Figure 6) consisted
of a short section of coaxial transmission line suitable for
driving the antennas. The dimensions were chosen to provide
a characterirtic impedance of as near 50 ohms as possible.
Two standard sizes of brass tubing (6 inch and 2.5 inch)
were selected which resulted in a calculated characteristic
impedance of 50.9 ohms. The aluminum flange at the top of
the feed was added to match the circular opening in the
image plane (discussed below) . The extension of the inner
conductor above the flange was machined to the inner
diameter of the antenna tubing allowing antennas to be
mounted. The antenna then formed a continuation of the
coaxial inner conductor. RF energy was applied to the feed
system via two N-type connectors located 24 cm above the
base plate on opposite sides of the outer conductor. The
system was fed from two sides to provide symmetrical
22


exitation which reduced the possibility of multiple modes of
propagation within the coax. The center conductors of the
N-type jacks were extended to the inner conductor of the
feed system with a .32 cm brass rod. A plexiglass disc at
the top to the feed supported thq center conductor.
23


I
i
e
Pcn
>stn
<0
<0
P
24


3. Image Plane
The image plane (Figure 7) upon which the antennas
were placed was a 10 meter square aluminum surface which
formed the roof of an enclosure used to house equipment
necessary for the antenna measurements. A 20.3 cm (8 inch )
diameter circular opening in the image plane provided a
location for mounting antennas. The flange at the top of
the feed system fit into the opening, leaving a smooth
surface atop the plane. The opening was located slightly
off center on the square plane to reduce the poss-ibility of
resonances occuring on the image plane surface.
25


(U
3
o
S
•H
26


^ • Charge and Curreat Probes
An accumulation of charge on a conductor is
accompanied by an electric field proportional to the charge
density. This electric field is perpendicular to the
conductor surface for a perfect conductor and nearly
perpendicular in the case of a very good conductor like
brass. A monopole antenna oriented parallel to the electric
field will therefore generate an EMF proportional to the
charge density. If the monopole is small, it will react
only to the charge density in the near vicinity and the
probe's presence will have negligible effect on the field
present. Similarly a wire loop positioned in a plane
perpendicular to a changing magnetic field produced by an
alternating current on the surface of a conductor will
generate an EMF proportional to the time rate of change of
current. As with the monopole probe, the loop must be small
so as not to significantly disturb the current present on
the conductor during the sampling process. For accurate
resolution of current densities it must also be small so it
is influenced only by currents in the near vicinity. For
sinusoidal exitation the time rate of change of current is
also sinusoidal so an EMF proportional to the current can be
27


obtained by applying a phase correction.
The principles discussed above were used in the
design and construction of the charge and current probes
(Figure 8) used to taJce experimental data on the
crossed" oionopoles. The charge probe consisted of a monopole
antenna constructed from a section of Microdot
Microminiature coaxial cable (250-3920) . The outer
conductor of the the coax was removed from a 17 mm segment
of the cable to form the monopole probe which was mounted on
the probe body. The teflon dielectric was left intact for
added structural strength. The probe body was machined to
fit into the .32 cm slots cut in the antennas so that the
probe element was aligned perpendicular to the antenna
surface. A beryllium copper retaining plate was used to
hold the probe in place as it was positioned along the
antenna. The <:enter conductor of the coax was connected to
a Microdot 31-34 connector which was made part of the probe
body.
The current sensing element consisted of a
semicircular section of UT-20 solid shield coaxial caDle
with .5 cm radius. The coax was terminated at one end on
the probe body where a portion of the cable was hollowed out
28


and filled with solder. At the top to the semicircular arc
a .5 mm gap kras formed by removing the outer conductor and
dielectric from the cable. The coax then continued intact
through the semicircle and into the probe body where it was
terminated at a Microdot 31-59 connector. The design and
construction of the probes was based on previously
established theoretical and experimental results [ Whiteside
1962].
29


^
:::^—0^
=i-m)
i ^"^
ir-tn
ir~^
rr~fl
(D
•PCO
r-(
a?-•
<u
1^•Ha•p
•H
cn
(U
oua,
<u
DO?-.
C05
P<v
5-«
U
oo
HP..
-nj
30


The EMF generated by the probes provided an
indication of the relative magnitude of charge and current
density which was sufficient for the magnitude plots. To
arrive at a true indication of the phase relationship
between charge and current densities it was necessary to
calibrate the probes. Phase calibration was accomplished by
measuring the charge and current density distributions
inside a coaxial feed systen similar to the one used to feed
the antennas. The results were compared with distributions
predicted by transmission line theory and correction factors
were determined. The feed system used for probe calibration
was 126 cm long and had a slotted center conductor to
accomodate the probes. For a transmission line shorted at
its end the voltage should lead the current by 90° within
odd quarter wavelengths and lag by 90° within even quarter
wavelengths. The data shown in Figures 9 and 10 depict
charge and current density distributions at 19 5 Mhz and
300 Mhz respectively. A phase calibration factor was
applied to the current data to establish the required phase
relationships, +5. 3° for 195 Mhz and +8.7^ for 300 Mhz.
These factors were applied to all antenna plots to provide a
true representation to the phase relationships between
distributions.
31


-10 ...••••.
-^X""X, .•••' "••. -
-s *% ••
'••. /^ 4 . . *< + . . +uw -7 4- -4 -
>- • J.*'as 4 * •
^ -6 .* / • .
H + +
IpI.' *. 4
< -5 . * +' •.^v/
• 4 4 . .
aA '4 + .a -4 * • •
n 4H
+ +
< \ :-
s4 +
-2 • . 4-
4 +*+ *
-1 • • 4 _^
4 4*4 4
•.••. . . V -
- 180 -
+
-135 - -
-90 -
C/5
CU9l
«a *
cuQ
cuen<X --45 .
a. 3p
•
.-90
.-135 **+++ ++44 4444 44444 44444 HtllHM -
.-180"
-X/2 •X/4
Figure 9. - Measured charge and current density
distributions at 195 Mhz within a coaxial transmission line
terminated in a short circuit
32


-10 -
-9
liL-* * .* '
** .
' ' + • +
-8 * ,
< * +. •
wM.
•*-7 .
>- 4*sn • +
^ • + + .
H -6 •
i-t + +ta
T •
«( I
' « 4< -5 IpI • -
cu : + .
Qr) -4 * •
HZ +a
-3* *
+-2 + "
-1 4 *
- 180 -
- 135 -
- 90 -
C/3 - 45
9i.
UOSaMa
fTT
•
w *9p
<a.
- -45
•
"
*
- -90. -
— 135
.-ISO .
-.^X/4 \/2 -,\/4
Figure 10. - Measured charge and current density
distributions at 300 Mhz within a coaxial transmission line
terminated in a short circuit
33


5 . Tnstrumeatation
The electronic test equipment necessary for the
experimental set-up (Figure 11) was assembled from off the
shelf components.
'//' ''//wsfsffi^iif^^i'/ ''/Sy//:^i$!S'A 'i
..^^^:.^ifcM*Ssi^
Figure 11. - Arrangement of instrumentation
34


Figure 12 shows the arrangement of test equipment in
block diagram form. A Hewlett Packard 8640A signal
generator was chasen to provide RF exitation for the
antennas under test. The generator provided sufficient
drive power (+20 dbm) to induce voltages well above the
noise level in the change and current probes. A reference
output jack at the rear of the signal generator was fed to a
Tektronix DC 502 frequency counter to monitor the output
frequency. The signal generator was connected to a HP Model
764D dual directional coupler. The direct output of the
directional coupler was divided by a HP 11549A power
splitter and applied to the two N type connectors on the
antenna feed system. The attenuated forward output from the
directional coupler provided a sample of the drive signal
for use in monitoring the power output. The power setting
for all cases was maintained at +13 dbm at the direct output
of the directional coupler. The directional coupler output
representing a sample of the energy reflected from the
antenna was not needed and was terminated with a HP 908A
50 ohm load. All interconnections were made with RG-8A or
RG-9A coaxial cable. A Hewlett Packard 8405A Vector
Voltmeter was used to measure amplitude and relative phase
of the RF voltages induced in the charge and current probes.
35


A reference signal for the phase was applied to Channel A
from the attenuated forward output of the directional
coupler. The charge or current probe was connected to
Channel B. Cables were adapted to the vector voltmeter
probes with a HP 11536A 50 ohm tee and a HP 903A 50 ohm
termination on each probe.
36


Ground Plane
TektronixDC 502FrequencyCounter
HP 8640ASignalGenerator
Feed System
PowerSplitter
4 \.
Channel A '
'
HP 8405AVectorVoltmeter
Channel B
HP 764DDirectionalCoupler
50 Ohm ^Termination^
"^
Figure 12. - Block diagram of instrumentation
37

A specially constructed coaxial cable was used to
connect the charge and current probes, one at a time, to the
test equipment. A rigid section of coax was constructed by
removing the outer shielding from RG 142 B/0 cable and
inserting it into a 150 cm length of .32 cm (1/8 inch) brass
tubing. At the lower end of tKe brass tube the RG 142 B/D
continued with shield intact for an additional 190 cm w.ere
it was termijiated with an N type connector. The upper end
of the brass tube was terminated with a Mircodot connector
to match the probes. This arrangement was adequate for
positioning the probe along the vertical element. To allow
for cross segment measurements a flexible section on top of
the brass rod was necessary. A 42 cm section of double
shielded cable was added for this purpose. To make all
measurements compatible, the flexible extension was not
removed for vertical measurements, thus no correction factor
was necessary when comparing vertical and cross segment
measurements. Additional shielding was found to be required
for the flexible extension, it would otherwise pick up stray
RF energy inside the antenna near the slot openings. A
braided metal shield was added which reduced the
interference significantly.
38


A rack and pinion positioning device (Figure 13) was
fitted to the bottom of the feed system to move the charge
and current probes along the antennas. The pinion gear was
located in a movable housing which contained an index
pointer, positioning knob, and provisions to fasten the
rigid section of coaxial cable used for probe connections.
The cable was drawn down as the positioning knob was turned,
moving the probe along the antenna. The pointer indicated
the relative position of the probe on a metric scale
attached to the fixed rack.
39


Figure 13. - Raclc and pinion probe positioning mechanism
40


B. EXPESIilENTAL PROCEDaRE
1 • l£l§SIl^ Configurat ions
The electrical length of the crossed-monopole
antennas were manipulated to produce four configurations.
The intent was to locate the junction at the position of
different combinations of maximum and minimum charge and
current densities. The different configurations were
obtained by adjusting the physical dimensions of the
antennas and the excitation frequency. Since the height of
the junction above the ground plane was fixed at 68,5 cm it
was necessary to vary the excitation frequency until the
chosen conditions were satisfied. The total height of all
configurations was fixed at 137 cm to place the junction at
the center of the vertical member maintaining a degree of
symmetry. Experimental data on a 137 cm monopole at 300 Mhz
(Figure 14) places a charge minimum/current maximum at
approximately 68.5 cm from the ground plane. An ideal
treatment of this configuration would place the minimum
charge/maximum current 75 cm (3/4 wavelength) from the top
of the antenna but end effects cause an apparent shortening
of the wavelength on the antenna.
41

.10 1
1 -^PROPOSED JUNCnCN LOCATICN•9 '
8 1
• 7 .1 .
•2 *--..4^--^* '-i^i
•11
180
-"^^1 ^^^''•Hmh.^
"• %
. 90 1
^'"**'^**——*^I
• 45 1
• -45 '
-^ '"'''"''*'*****'"*"*"'*'''-^'
.9X
• -135 • • • *%-^'—.
•
.-180—y £ 1 1 1 1 1 1 1 <• ^
—
A/4 A/2
Figure 14. - Measured charge and current density
distrihutions on the reference monopole at 195 Mhz
The frequency required to place a charge maximum/current
minimum on the monopoie 68.5 cm above the ground plane was
195 Mhz (Figure 15). The physical length of the cross arm
segments required to reflect a particular charge and current
condition was derived from rhe experimentally determined
42

distances for the monopoie. The four cases x.ested are
depicted in Figures 17, 20, 23 and 26. Each figure
illustrates the zeroth-order solutions for the charge and
current distributions, assuming no interaction between the
vertical and cross members.
10
8
-7
•6
1-4
32•1
' ' ' '
H-PPOPOSED JUNCTION LCXaiTCN
Ml
• 180
135
90
45
^f.
"^
. -45
-90
-135
-180
1.4X
X/2I t I ' ' ' >
,
3A/4
Figure 15. - Measured charge and current density
distributions on the reference monooole at 300 Mhz
43


2. Data Acquisition
Data was taken at 1 cm increments along the antenna
segments, or approximately every .01 wavelength at 300 Mhz,
•0065 wavelength at 195 Mhz. At each position rhe magnitude
and relative phase of the probe voltage was recorded. Each
data run was begun by positioning the charge or current
probe at the furthermost point from the antenna base and
locking the pinion housing on the brass tubing with the
index mark at cm on the attached metric scale. The true
position of the probe on the antenna was recorded to
correlate it with the scale readings beside the rack.
Positions were measured up from the image plane. At the end
of each run the actual position was again measured and
compared with the index reading to check for any slippage.
For cross segment measurements some inaccuracy was
introduced by the pulliy arrangement. As tension on the
pulley varied the pulley was displaced slightly to the side,
degrading the agreement between the scale reading and actual
position on the antenna. Errors detected did not exceed
±.15 cm (.0015 wavelength at 300 Mhz, .0007 wavelengrh at
195 Mhz) .
44


The vector voltmeter was checked and calibrated
immediately tefore data acquisixion started. Its accuracy
was ±6% of full scale for the voltage readings and ±4.5° for
phase measurements. The vector voltmeter was capable of
phase accuracy of ±1.5° if both channels received the same
amplitude signal but it was impractical to readjust the
signal applied to the reference channel for every data
point.
3. Data Processing
A Hewlett Packard 9821A Calculator and 9862A Plotter
(Figure 16) were used to process and display all data. Two
programs were utilized to perform the necessary operations.
Appendix A includes a listing of both programs. One program
provided a means of storing on magnetic tape the charge and
current data along with parameters identifying the
configuration. A second program processed the data and
plotted it. Processing- included converting the scale
readings along the rack and pinion assembly to true
positions along the antenaa, scaling for graph plotting and
converting physical measurements to fractions of a
wavelength.
45


Figure 16. -^ Data processing equipment
4 . Data Analy sis
Analysis of the charge distributions on the
crossed- monopoles was a straightforward proceeding. The
magnitude and phase varied sinusoidually with only minor
variations for all cases. Comparison with data from the
reference monopole and with theoretically predicted
distributions could be carried out directly. Assuming an
ideal point junction, a boundary condition could be imposed
requiring that the amplitude and phase of charge along all
segments converge to a common value at the junction [Burton
46


and King 1975]. Extrapolation of the data presented
confirms this fact in each of the four cases.
Kirchoff*s Currant Law, that the vector sum of
currents entering a junction sum to zero, may be applied to
the cross junction. Unfortunately, mechanical limitations
prevented taking cross arm data closer than within
approximately 6 cm of the junction and the vertical current
data suffers some inaccuracy near the junction center. As
the probe approaches to within a few centimeters of the
junction center an abrupt change in the current magnitude
data occurs just as the retaining plate bridges the gap
formed by the intersecting slot from the cross arm. After
the probe has passed through the junction center tue
retaining plate passes over the gap and from that point on
the data is free from irregularities. Even if precise data
was available at the junction it would be inadequate for
application cf Kirchoff's Law since the probe would be
sensitive tc currents flowing only along the two axes of
probe orientation while at the junction center current may
be flowing in any direction. A practical solution would be
to move back from the junction a short distance along all
four segments where it could be assumed that the currents
still possess rotational symmetry and are predominantly
47


flowing longitudinally. k distance twice the radius of the
antenna away from the junction center was chosen as the
location to take data for application of Kirchoff's Current
Law. This distance (6.35 cm) is approximately the point
where the cross data starts, it is beyond the irregularity
caused by the probe retainer plate, and is not so far from
the junction so as to introduce any significant error due to
displacement from the junction where Kirchoff*s Law should
theoretically be applied.
a. Case 1
The vertical member standing alone as a monopole
would support a standing wave pattern with a maximum
currenxL/minimum charge at the position of the junction. The
two cross segments are each one half wavelength suggesting
that the boundary conditions at the cross segment ends would
normally reflect a current minimum a half wavelength bac)c,
at the junction (Figure 17) .
48


*- Range h
of data
f f 1 1 f i i I f f }
Cb)
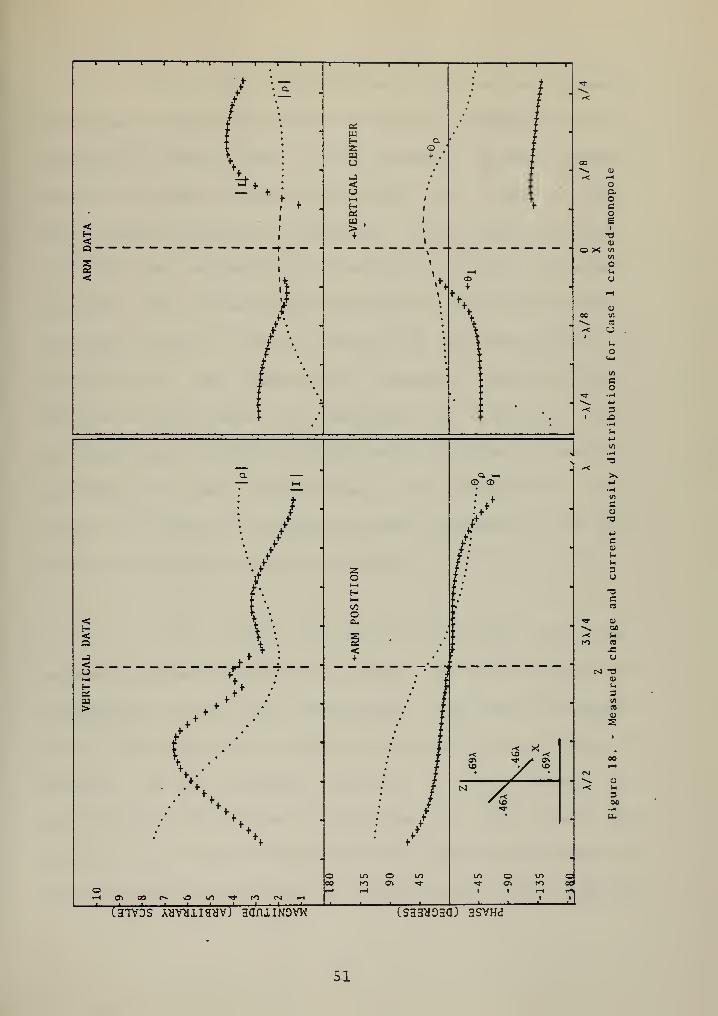
Figure 17. - Assumed charge and current density
distributions for Case 1 crossed- monopole
49


Comparing the charge distributions on the ideal
crossed- monopole vertical member current shown in Figure 18
with the zercth-order distribution shown in Figure 17 it may
be seen that the charge distribution on the crossed-monopole
retains the same general shape and locations for maxima and
minima. The peak charge magnitude above the junction is
reduced, an expected result due to the loading effect caused
by the cross segments. The junction charge density does not
achieve a lower minimum due to the effect of the cross arm
which is an electrical length which reflects a maximum
charge density at the junction.
50

-I 1 1 1 1 1 1 r
<<Q •
I
I
I
0£lUHZUiu
<uH
a+ .
«n +
oo.ocoSI
•o4)
O X wtn
ohU
nu
o
in
eo
3
T3
«
3U
e«
^^ OO^ uro «
tJ
OVi
3w«oS
3
<
<u1^Hpa>
o
/
•/
\i^ •.
.f^-
oH(—
(
Oa.
<
\:
O. h-l
-< !><>< IX) /<(Ti T y* "S^
VO /r ^
M
o o
2C37VDS A^V^liaHVj HQnilNDVW (S33^Daa) 3SVHd
51


The current distribution on the vertical element
maintains a sinusoidal pattern to within approximately 1/8
wavelength either side of the junction. Minimum current
magnitudes appear to occur just beyond the range of data
both above and below the junction. If so, their occurrence
is near the corresponding positions on the reference
monopole, but in each case displaced a short distance away
from the junction. This is contrary to the results for the
perpendicular case studied by McDowell, where the lower
minimum occured nearer the junction; an indication that
impedance seen at the feed point could be varied by changing
the angle of cross intersection. An intermediate point
could be chosen to present the same impedance at the feed
point as a monopole of the same height.
The charge concentrations along the cross
segments approach a relative maximum at the junction as
presupposed using the zeroth-order approximation (Figure
17b) . The same point is a relative minimum for the vertical
member, so the natural condition on both members is
satisfied. A dashed line on the cross arm data near the
junction in Figure 18 indicates the assumed convergence of
the magnitude and phase of the charge density. The value at
52


the center of the cross arm was taken as identically the
same as that recorded on the vertical member at that same
position, which it in fact must be. It is reasonable to
assume that no radical variations in charge density occur in
the short distance where data was unavailabl-e. All four
cases were treated in this manner. The upper cross arm
presents an approximately sinusoidal distribution for charge
with a minimum occuring 1/4 wavelength from the junction.
The current is likewise sinusoidal with a maximum at
1/4 wavelength. Both distributions seem little disturbed by
their proximity to the upper vertical element. The lower
cross arm is, however, a different matter. The larger
concentration of charge and greater magnitude current
disturb the natural resonance of the arm. Where a minimum
charge would be expected about 1/4 wavelength from the
junction the charge magnitude is still increasing under the
effect of the concentration of opposite polarity along the
lower vertical element. The phase relationship between arm
and vertical segments provides another indication of the
interaction which occurs between cross segments. Below the
junction the charge concentration can be assigned a
polarity, say positive, for reference. Figure 18 depicts
the phase in the region of maximum charge concentration to
be approximately +130^. On the lower cross arm segment
53


adjacent to this charge concentration the phase cf the
maximum charge is approximately -45°, nearly 180<* out of
phase with the vertical member charge. The current plot is
likewise distorted under the influence of the adjacent
vertical element. The current maxiaun 1/8 wavelength b«low
the junction is located directly across from the position of
the disproportionately high current maximum on the lower
cross arm as a result of inductive coupling.
It is not apparent from observing the data in
Figure 19 that Kirchoff's Current Law is satisfied at the
junction. a vector, diagram showing the sum of currents
existing 6.35 cm from the junction center (Figure 19)
demonstrates that the currents at that point approximately
add to zero. An exact cancellation is unlikely since the
currents chosen only approximate those at the junction,
approximately 1/16 wavelength away. The vectors shown
include 180° corrections where necessary to account for the
probe sensing direction.
54


figure 19. - Application of Kirchoff's Current Law at
junction of Case 1 crossed-monopole
b. Case 2
Ihis case combines the vertical and cross
segments in a more compatible, or reinforcing, combination
of natural resonances. In this instance all segments are of
equal length. The vertical member standing alone (Figure
20a) would present a maximum current/minimum charge at the
junction. The cross segment lengths alone (Figure 20b)
would also reflect a current maximum/charge minimum at the
junction.
55


^Rangeof data
///////////(b)
Figure 20. - Assumed charge and current density
distributions for Case 2 crossed-monopole
56


The data froai the vertical member of the cross (Figure 21)
is nearly the same as that recorded for Case 1. The charge
minimum at the junction has a lower magnitude since the
cross elements are also tending toward a charge minimum.
The upper cross arm supports a smooth sinusoidal
distribution for both charge and current with a minimum
current/maximum charge located nearly 1/4 wavelength from
the junction, a situation which agrees with the natural
resonant conditions. The lower cross arm also has
distributions much like Case 1. The similarity between the
lower cross arm distributions on Cases 1 and 2 suggests that
the influence of the lower vertical element is more
significant than arm length in deciding the distributions on
the adjacent cross arm.
57


-1 1 1 1 1 1 1 1
>"
' '
1 1 r r
. .f r. + z
/..
Of rO; I+ .
Xf • °- T/ . ei T *"
i* W t©— t_i « T
1—1
' z t^—
i
cu X> u I+^ * If
,
u a •
*s ••.
< •'
f+
i 1 ,** 1 b: J< 1 u 1H 1 >< 1 + 1
Q l_ _l
g 1
< 1 t
• ^ 1
^
t • ,
<••• ,\• f '
. +.•
. >. +•, +
+ t'.
f ft +
'.
: ^
*n-•-
f , +.f ff f
•. / : \
J— XQ. .
1—
1
i 1•
/^f . ,<f j-
f +. f *
(•
zoH
r ;
o / .' a< • a. / • ®H • r •
<a \ < /.'
-i f + f ,
-J* — — — — — — — —i-— — — —-- « . —f— - ...^.•M. — »^«-u1—
1
H \ /a: f * icu . f
'^• . T .
•
>,.^^^ .••• ;
1> > J X{
.*
1*
i r ^ o /-<t. p a\ 'X <^
V;- .
j
•
. /.N y'
f
,
i Xf f •*<'^h f / w
f f/^ lO
f < f • •
' + /'^. /f
.
f
•
O ul o 1/1 LD O Ul Ooo r-^ o 'T «3- O^ 1^ 00'
o 1—1 r-4 1 . -H -Sf-H CTl OOP^OLO^S-t'lfvli—(
_^ .
. oo.o
oSI
O X 0)
in
in
Ouu
00 tn
uo
<n
o
in
eo
c
u3u
13e«
so
0)tl
3in
ca
o
3
(37VDS AHV^iia^v) aaniiNDVw (S33^D3a) 3SVHd
58


In Case 2 the resulting distributions have higher magnitude
since there is closer agreement between natural and forced
modes. The charge density recorded at the junction on the
vertical data plot compares favorably with the magnitude and
phase of charge density arrived at by extrapolation of the
cross arm data. The vector addition of the currents
recorded 1/16 wavelength from the junction (Figure 22)
illustrates the application of Kirchoff's Current Law to
rhis configuration. As with Case ^, the vector sum is near
zero.
Figure 22. - Application of Kirchoff's Current Law at
junction of Case 2 crossed-monopola
59


c. Case 3
This configuration was constructed with four
equal segments, each 1/2 wavelength long. The resonant
modes of each place a maximum charge/minimum current at the
junction (Figure 23)
.
Figure 23. - Assumed charge and current density
distributions for Case 3 crossed-monopoie
60


The data recorded for .th^ cross (Figure 24) indicates a
relative charge maximum for three segments at the junction,
a relative minimum for the lower vertical element. The
vertical member distributions depart significantly from the
ideal case (Figure 23a) . The charge density is
moootonically decreasing across the entire range of data
with a minimum at the topmost data point on the antenna.
The vertical member current density distribution maintains
the same general shape below the junction as the first two
cases. Above the junction the current density climbs toward
a maximum in the same manner as the ideal case, though it
appears to peak earlier.
61


<<a
<<a.J<.u
>
a:uzuu
<u
«>+
oaoeosI
•ooo X tn
If)
O
u
«in
cs
U
o
2O
o
<4-
O
3
>s
•1-4
lA
SV
e«
)••
3O-3
a00HCS
.c
M -a
3(0
4>
s
1)
300
C31VDS AHvyiiayv) aaniiNDvw CSHIHDaa) 3SVHd
62


As with Case 2, the upper cross arm
distributions closely approximate the expected plots (Figure
23t) . The charge distribution on the lower cross arm is
also much like the ideal case and matches the upper arm
almost point for point. The current distribution on the
lower cross arm again shows the effects of the inductive
coupling. The current standing wave on the vertical member
reaches a maximum between 1/16 and 1/8 wavelengrh below the
junction. As the current builds in one direction, falls,
and builds again in the opposite direction a varying H field
is generated. As the H field cuts across the nearby lower
cross arm, currents are generated as would be the case when
any conductor is present in a varying H field. The close
proximity and greater magnitude current combine to make the
effects more noticable at this location. Regretably, tne
lower frequency required for scaling resulted in a range of
data for the arms which was less than 1/4 wavelength. A
trend toward a current maximum is nevertheless apparent on
both arms and a sinusoidal progression toward the end point
boundary condition can be assumed. The vector addition of
the currents near the junction (Figure 25) was not as
successful as with the first two cases. Undetected rapid
phase shifts in arm currents very near the junction render
63


the samples invalid for application of Kirchoff's Law at the
junction. In the first two cases the current phase exhibits
no radical changes near the junction, lending credibility to
the approximation techaigue. In this case a phase shift of
almost 180° occurs within 1/16 wavelength of the junction
above the vertical element and a steep slope is apparent on
the lower cross arm current phase at the end of the data.
Figure 25. - Application of Kirchoff's Current Law at
junction of Case 3 crossed- monopole
6a


d. Case 4
This configuration shows the most radical
departure from the expected resonant mode for the vertical
member (Figure 26a) , As with the other three cases, the
current magnitude records a peak just below the junction
center (Figure 27) .
t- Range ->
of data
/ ^ i i 1 1 / I i 1
1
Cb)
Figure 26. - Assumed charge and current density
distributions for Case 4 crossed-monopole
65


Just above the junction a sharp minimum occurs accompanied
by a rapid 180° phase shift. Further above the junction the
current tends toward a maximum that presumably occurs near
1/4 wavelength above the junction. The vertical charge
distribution is likewise markedly different than expected^
Although a charge maximum was predicted at the junction, a
charge minimum occurs very near the junction along with a
180<* phase shift. The magnitude of the arm exitation is
largest of any of the cases, and the upper arm has a larger
current magnitude than the lower for this case alone.
Ob


I I I I I 1 I I I I
'•J
<<a
K-+\
}'
.\
Q.o
(XaiH2MU
<uI—
(
esw>+
I I I
. o
oa,oaos
•a
</)
in
o
u
CO
u
3
in
3
-3Crt
oCO
CO
u
T)a>
Wi
Snca
oS
0)
300
<
<uHofu>
\
\,
1,1111C31VDS AHV^iiayvj 3aniINDVW
ao
2o
COo
<+
M 7^
(S33HD3a) 3SVHdJ
67


Repeated attempts to get smooth data near the upper cross
arm end resulted in widely fluctuating readings indicating a
measure of instability. The large standing wave pattern and
inconsistent data on the upper cross arm signify the
presence of a resonant condition unigue to this
configuration. It is difficult to state categorically why
this combination of dimensions should produce a greater
response than the other cases but it conceivable that the
response is associated with a combination of segments
combining to produce a strong resonant structure.
Near the segment extremities the current values
do tend toward a minimum as the charge magnitude increases
toward a maximum. This configuration, with only ^/H
wavelength cross arm segments, provided the sole opportunity
to take data reasonably close to the segment ends, allowing
observation of the developing end point boundary conditions.
The vector addition of currents fails again in this case
(Figure 28) . Here the rapid phase shift above the junction
combined with an apparent phase shift on the lower cross arm
near the junction forecast problems similar to those
incurred in Case 3 when sampling the current some distance
away from the junction.
68

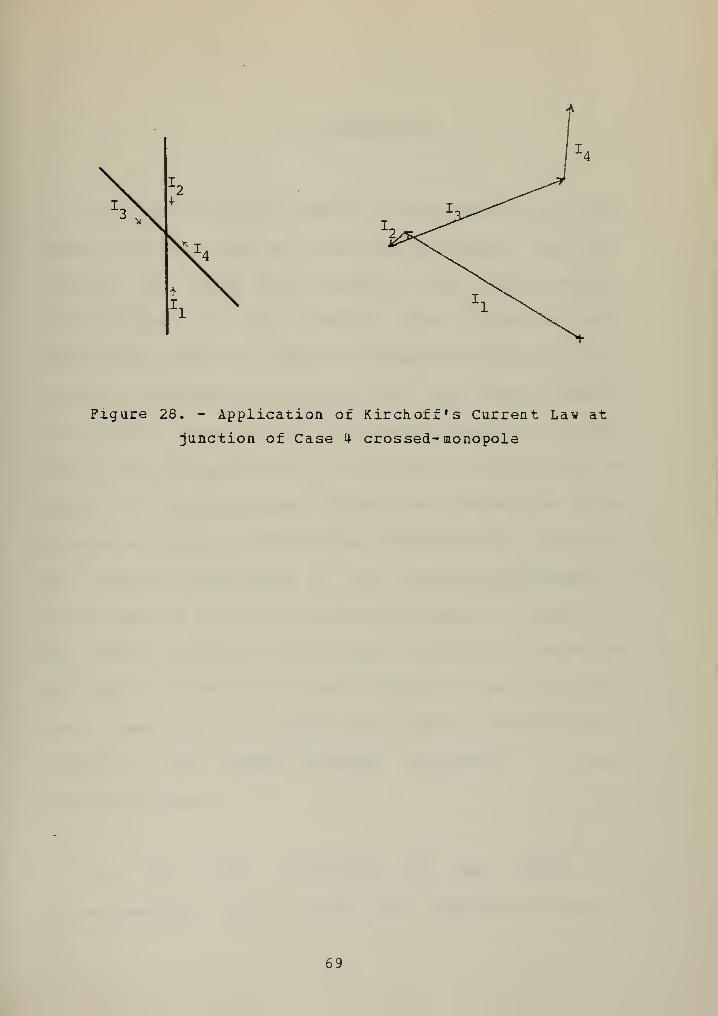
Figure 28. - Application of Kirch off»s Current Law at
junction of Case 4 crossed- monopola
69


17. CONCLUSIONS
Charge and current density distributions on base fed
monopole antennas can be altered significantly with the
addition of cross arm segments. The charge density
distributions on the monopole are disturbed more
significantly when the junction is placed at the position of
a current maximum/charge minimum while the charge density
distribution variation on the monopole maintains the same
general form independent of the position of the junction or
length of the cross arms. The oblique intersection of the
cross arms results in asymetrical distributions along the
arm segments highlighted by the interaction between the
lower cross arm and the lower vertical segment, a result of
the current magnitude peak being largest just below the
junction on the vertical element adjacent to the lower cross
arm. Standing wave patterns of varying magnitudes are
induced on the antenna segments depending on their
electrical length.
The feed point impedance of the base fed
crossed- monopole can be varied by changing the angle of
70

intersection between vertical and cross members. Such a
phenomenon could be practically applied to situations where
impedance matching is an important consideration. Where
inductive coupling is significant betjween members, it
determines the distributions on the cross arms with little
regard to the length of the arm. Also, resonant and
unstable conditions may occur unexpectedly on some
non-orthogonal configurations. The importance of
considering inductive coupling when analyzing the possible
resonant conditions on non-orthogonal structures has thus
been demonstrated.
71

V. RECOMMENDATIONS
Nonavailibility of the required test apparatus precluded
recording far field patterns for the crossed-raonopoles as
originall]^ intended. Pattern recording ranges exist at
Naval Electronics Laboratory Center (NELC) , San Diego,
California and, subject to their availability, the
collection of radiatioQ pattern data would provide
information required to assess the possibility of using
crossed- mono poles as antennas in special applications where
a standard monopole is not suitable.
When dealing with moderately thick antennas it would be
advantageous to have a better method of measuring charge and
current density distributions. The method used in this
thesis would suffice if rotational symmetry can be assumed
at all locations on the antennas. This is not the case for
the antennas studied at locations near the junction where
accurate data would be of most value. The use of infrared
imagery to record l^R heating holds the promise of solving
this problem and its application to similar investigations
should be pursued.
72


APPENDIX A
DATA PROCESSING PROGRAMS
This appendix contains a listing of the computer
programs used for processing and displaying the data
acquired during the course of this thesis research. The
programs were written for the Hewlett Packard 9821A
Calculator, however the algorithms could easily be
translated into another language. The major programming
task was performed by LCDR Elmer J. McDowell in connection
with thesis research at Naval Postgraduate School, Monterey,
CA. The programs listed are modifications of McDowell's
work and are included here to provide assistance in any
similar investigations.
73


1. Program to Input Charge and Current Data to Memory
0: PRT "INSTRUCTIONS"; SPC 1; .BEL; -BEL
1: PRT "WHEN BELL SOUNDS ";" READ TAPE PRINT-"
2: PRT "OUT FOR INFORMA-" , "TION REQUIRED", "TO
ANSWER", "INQUIRES" SPC 3
3: PRT "PROGRAM TO", "INPUT BOTH", "CHARGE AND"," CURRENT
DAT A", "TO MEMCRI "
4: > A; SPC 2
5: > RA; JMP (A + 1 > A) > 499
6: > A; FXD 3; SPC 2
7: PRT "1 > AEM DATA", "0 > VERTICAL DATA"; -BEL; -BEL;
SPC 2
8: ENT "ARM OR VERTICAL?" , R490
9: ENT "FREQ. (MHZ) = ?",R480
10: PRT "ALL DIMENSIONS", "IN CENTIMETERS"; -BEL; .BEL SPC 2
11: ENT "ANT. HEIGHT = ?",R481
12: ENT "JUNCTION HT. ?",R482, "RIGHT ARM LGTH ?",R483
13: ENT "LEFT ARM LGTH ?",R484
14: PRT "PROBE POS."; -BEL; -BEL;
15: IF R490 < 0.5; PRT "MEASURED UP FROM", "GROUND PLANE";
SPC 2
16: IF R490 > 0.5; PRT "MEASURE FROM THE", "CENTER OF THE",
"JUNCTION"
17: SPC 2
18: ENT "I PROBE POS. ?",R4 85
19: ENT "Q PROBE POS. ?" ,R486 ,"ANT. RADIUS = ?",R487
20: PRT "DATA RECORD"; SPC 2
21: IF R490 = 0; PRT "VERTICAL MEMBER"; SPC 2; GTO +2
22: PRT "CROSS ARM"; SPC 2
23: PRT "ANT. HEIGHT =" ,R48 1, "ANT. RADIUS =",R487 , "LOWER
CROSS ARM"
24: PRT "LENGTH =",R483 , "UPPER CROSS ARM", "LENGTH =",R484
25: PRT "JUNCTION HT. =",H482;SPC 1
74


26: PRT "FBEQUENCY",BU80, "MEGAHERTZ"; SPC 2
27; PRT "0 » CHARGE", "1 > CURRENT"; SPC 2; -BEL; -BEL;
ENT "CHG OR CUR DATA?", X; > A
28: JMP 13X+1
29: SPC 3; PRT "DATA READOUT IN", "FOLLOWING FORMAT"; SPC 1
30: PRT"REL POSITION", " MAGNITUDE"," PHASE" ; SPC 2
31: PRT "CHARGE DATA"; SPC 1
32: ENT "REI. Q POSITION? ",RA; IF FLG 13; A > R488; CFG 13;
GTO +8
33: IF A = 0; GTO +2
34: IF ABS (SA-R (A-1)>>1.2; IF FLG 3=0; -BEL; GTO -2
35: ENT "Q MAGNITUDE ?" ,R (80 + A) ;
IF ABS (R(80-»-A)-R(79+A) ) > 1; IF A > 0; IF FLG 3 = 0;
BEL; GTO +0
36: ENT "QPHASE ?",R(160>A); IF ABS(R(160 + A) ) > 150;
GTO +2
37: IF ABS (R(160 + A) - R(159 + A) ) > 35; IF A > 0;
IF FLG 3=0; -BEL; GTO -1
38: PRT BA, R(80 -»• A), R(160 + A); SPC 1; A "«• 1 > A;
IF A < 79; GTO -6
39: PRT "CHARGE STORAGE", "REGISTERS FILLED"; A > R488;SPC 2
40: PRT "0 > NO", "1 > lES"; SPC 2; -BEL; «BEL;
ENT "INPUT COMPLETE ?", C; IF C = 0; GTO -13
41: GTO +11
42: PRT"REL POSITION", " MAGNITUDE",
" PHASE" ; SPC 2
43: PRT "CURRENT DATA"; SPC 1
44: ENT "REL. I POSITION?", R (240 + A) ; IF FLG 13;
A > R489;. CFG 13; GTO -4
45: IF ABS (R (240 + A) - R (239 + A)) > 1.2; IF A > ;
IF FLG 3=0; bBEL; GTO -1
46: ENT "I MAG", R (320 + A) ;
IF ABS (R(320 + A) ) > 1 ; IF A > 0;
IF FLG 3=0; GTO +0
75


47: ENT "I PHASE ?",S(400 + A) ; IF ABS (fi (400 A)) > 150;
GTO +2
48: IF ABS (R(400 + A) - R (399 A)) > 35; IF A > 0;
IF FLG 3 = 0; .BEL; GTO -^1
49: PRT R(240 + A) , R(320 > A), R(400 A; SPC 1
50: A + 1 > A; IF A < 79; GTO -6
51: PRT "CORR. STORAGE", "REGISTERS FILLED";A > R489; SPC 2;
GTO -11
52: ENT "TO WHICH TAPE ?",!; SPC 15
53; 2NT "TO WHAT FILE ?",X;PRT "DATA STORED ON",
"TAPE NO.",Y,"IN FILE NO.",X
54: SPC 15; -RCF 1, RO, R499
55: ENT "COLUMN PRINTOUT?", X IF < .5; GTO +14
56: > I > B
57: > A; IF Y > 2.5; 1 > B
58: IF I = 0; PRT "CHARGE DATA"; GTO +6
59: IF Y = 1 ; GTO +6
60: IF Y = 2; GTO +6
61: IF Y = 3; SPC 8; PRT "CURRENT DATA"; GTO +3
62: IF Y = 4; GTO +3
63: IF Y = 5; GTO +3
64: SPC 2; PRT " POS"; SPC 1; GTO +3
65: SPC 5; PRT " MAG"; SPC 1; GTO +2
66: SPC 5; PRT" PHASE"; SPCl
67: PRT R(80Y + A); PRT " ";
JMP (A + 1 > A) = R(488 + B)
68: Y + 1 > Y; IF < 5; GTO -11
69: SPC 15; END
76

2. Program to Plot Charge and Current Data
0:
1:
2:
3:
4:
3:
6:
7:
8:
9:
10:
11:
12:
13:
14:
15:
16:
17:
18:
19:
20:
21:
22:
FXD 3; SPC 1
TBL 4
ENT "TAPE NO. ?", X, "FILE NO. ?», Y; LDF Y; .4 > H494;
.007 > R495
PHT "TAPE NO.", 1, "DATA FILE NO.", Y; SPC 1;
3E4/E480 > E491; JMP R490 + 1
PHT "VERT, DATA PLOT"; GTO +2
PRT "ARM DATA PLOT"
SPC 1; PRT "FREQUENCY (MHZ) =",R480,=LAHBDA (CM.) =",
E491; SPC 1
PRT "ANT. HEIGHT =" ,R481/R491 ,"
PRT "ANT. RADIOS =" ,R4 87/R491 , "
PET "RIGHT ARM LNGTH=", R483/H491, "
SPC 1
PRT "LEFT ARM LENGTH=", R484/R491, "
SPC 1
PRT "JUNCTION HGT =", R482/R49 1,
ENT "SOPRESS AXIS?", X
SCL 30,165.8,0,2.2; IF X = 1 ; GTO +33
ENT "PLOT LIMITS SEr?",Z
PLT 30,0; PLT 32,0; LTR 32,0,211; PLT
PLT 101,0; LTR 101,0,211; PLT ",,"
PLT 102.4,0; PLT 105,0; PEN; PLT 105.8,0; PLT 165.8,0;
PLT 165.8,2.2; PLT 105.8,2.2; PEN
PLT 105,2.2; PLT 30,2.2; PLT 30,0; PEN; PLT 30,1.1;
PLT 105,1.1; PEN
PLT 105.8,1.1; PLT 165.8,1.1; PEN; PLT 105.8,0
PLT 105.8,2.2; PEN; PLT 105,2.2; PLT 105,0; PEN
PLT 30, .55; PLT 105,. 55; PEN; PLT 105. 8, .55
PLT 165. 8, .55; PEN
.1 > A > B; 1 > C > X > Y; 30 > Z
LAMBDA"; SPC 1
LAMBDA"; SPC 1
LAMBDA";
LAMBDA";
LAMBDA"; SPC 1
(I II PLT 33.6,0;
77


23: PLT 165.3,1.1 + A; PLT 165.8,1.1 * A; PEN;
JMP (A + . 1 > A) = 1 . 1
24: PLT 30,1.1 > B; PLT 30.5,1.1 * B; PEN;
JMP (B + . 1 > B) > 1
25: PLT Z,.55 * . 130263CY; PLT Z + .5,. 55 + .130263CY; PEN
26: C + 1 > C; IF 5 > C; GTO -1
27: IF Y > 0; -1 > Y; 1 > C; GTO -2
28: IF 50 > Z; 165.3 > Z; 1 > Y > C; GTO -3
29: 1 > A > C; 1. 1 > B
30: PLT CAR491/16 « 135. 8, B -t- .015;
PLT CAH491/16 * 135. 8, B; PEN
31: A + 1 > A; IF 30 > AR491/16; GTO -1
32: IF C > 0; -1 > C; > A; GTO -2
33: IF B > 0; > B; 1 > C > A; GTO -3
34: 1 > A; 1.1 > B
35: A + 1 > A > Y; JMP Afi491/16 > 35
36: PLT AR491/16, B + .015; PLT AR491/16,B; PEN; A + 1 > A;
JflP AR491/16 > 105
37: IF 3 > 0; > B; Y > A; GTO -1
38: 2.1 > Y; R482 > X; GTO +2
39: 135.8 > X; 2. 1 > Y
40: PLT X,Y; PLT X,Y - .03; PEN; JMP (Y - .06 > Y) < 1.15
41: 1.05 > Y
42: PLT X,Y; PLT X,Y - .03; PEN; JMP (Y - .06 > Y) < .05
43: IF X < 100; GTO -4
44: LTR 144,2.15,111
45: LTR 157.5 - R494,2.1 - R495,111; PEN
46: > A > B > C
47: R485 - R (240 + A) > R (240 A); JMP (A + 1 > A) = R489
48: ENT "IMAG SCL FACTOR?", Z; PRT "IMAG SCL FACTOR=", Z;
SPC 1; IF Z = 1 ; GTO +2
49: ZR (320 + C) > R (320 C) ; JMP (C + 1 > C) = R489
50: IF R(320 + B) > R493; R (320 + B) > R493
51: 3 + 1 > B; IF B < Rt*89 - 1; GTO -1
52: PRT "MAXIMUM CURRENT", "MAGNITUDE =", R493; SPC 1
53: ENT "IMAG GRAPHLIMII?" , Z; IR 1.1Z > R493; Z > R493
78

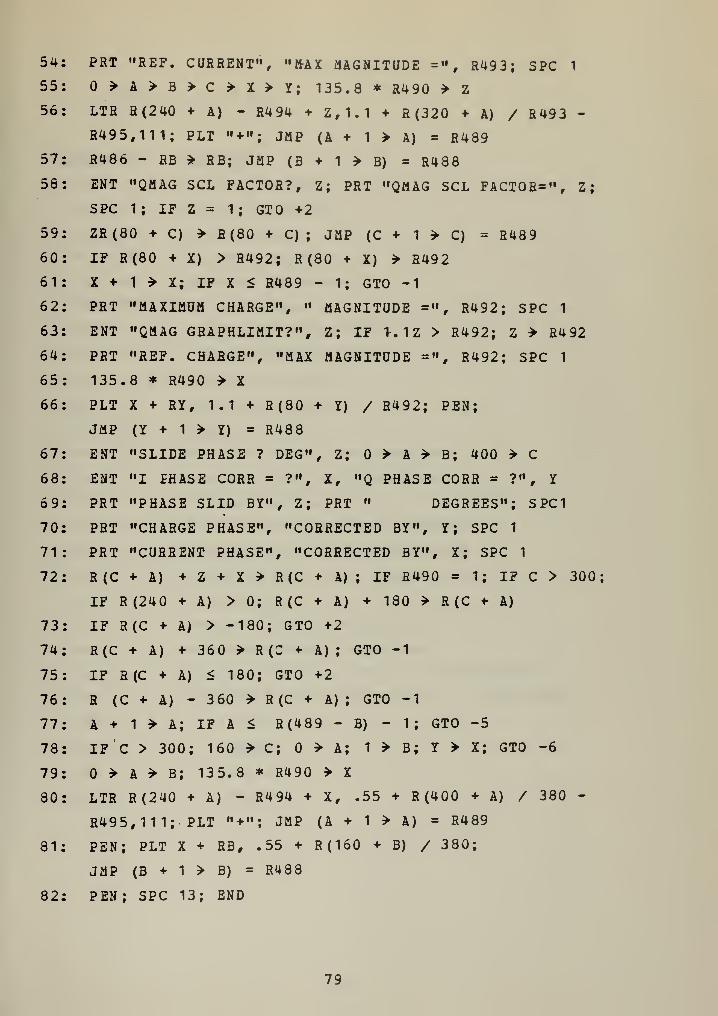
54: PRT "REF. CaERENT", "M-AX iilAGNITUDE =", RU93; SPC 1
55: 0>A>B>C>X>Y; 135.8 * R490 > Z
56: LTR a(240 + A) - R4 94 + Z,1.1 + R (320 + A) / R493 -
R495,111; PLT "+"; JMP (A 1 > A) = R489
57: R486 - RB » RB; JMP (B + 1 > B) = R488
58: ENT "QMAG SCL FACTOR?, Z; PRT "QMAG SCL FACTOR=", Z;
SPC 1 ; IF Z = 1 ; GTO +2
59: ZR(80 + C) > R(80 + C) ; JMP (C + 1 > C) = R489
60: IF R(80 + X) > R492; R (80 ^ X) > R492
61: X + 1 > X; IF X < R489 - 1; GTO -1
62: PRT "MAXIMUM CHARGE", " MAGNITUDE =", R492; SPC 1
63: ENT "QMAG GRAPHLIMIT?", Z; IF 1-. 1 Z > R492; Z > R4 92
64: PRT "REF. CHARGE", "MAX MAGNITUDE =", R492; SPC 1
65: 135.8 * R490 > X
66: PLT X + RY, 1.1 + R(80 Y) / R492; PEN;
JMP (Y + 1 > Y) = R488
67: ENT "SLIDE PHASE ? DEG", Z; > A > B; 400 > C
68: ENT "I PHASE CORR = ?", X, "Q PHASE CORR = ?", Y
6 9: PRT "PHASE SLID BY", Z; PRT " DEGREES"; SPC1
70: PRT "CHARGE PHASE", "CORRECTED BY", Y; SPC 1
71: PRT "CURRENT PHASE", "CORRECTED BY", X; SPC 1
72: R(C + A) +Z + X> R(C + A) ; IF R490 = 1 ; IF C > 300;
IF R(240 + A) > 0; R (C + A) + 180 > R (C + A)
73: IF R(C + A) > -180; GTO +2
74: R(C + A) + 360 > R (C ^ A); GTO -1
75: IF R (C + A) < 180; GTO *2
76: R (C + A) - 360 > R (C + A); GTO -1
77: A + 1 > A; IF A < R(489 - B) - 1; GTO -5
78: IF C > 300; 160 > C; > A; 1 > B; Y > X; GTO -6
79: > A > B; 135.8 * R490 > X
80: LTR R(240 -«• A) - R494 + X, .55 + R(400 + A) / 380 -
R495,111; PLT "+"; JMP (A + 1 > A) = R489
81: PEN; PLT X + RB, .55 + R(160 » B) / 380;
JMP (B + 1 > B) = RU88
82: PEN; SPC 13; END
79


3. Memory Allocation
HEGISTEfi CONTENT
0-79 Charge Position
80-159 Charge Magnitude
160-239 Charge Phase
240-319 Current Position
320-399 Current Magnitude
400-479 Current Phase
480 Frequency (Megahertz)
481 Antenna Height (cm)
483 Right Arm Length
482 Junction Height
484 Left Arm Length
485 Current Probe Zero Position
486 Charge Probe Zero Position
487 Antenna Radius
488 Number of Charge Data Points
489 Number of Current Data Points
490 Vertical Data (0) ; Arm Data (1)
491 Wavelength
492 Maximum Charge Magnitude
493 Maximum Current Magnitude
494 Vertical Correction for "+•' character
495 Horizontal Correction for •• + " Character
496 (Empty)
497 (Empty)
498 (Empty)
499 (Empty)
80

APPENDIX B
NOMEBICAL DATA
This appendix contains the numerical data for the four
configurations investigated. Position is given in
centimeters above the ground plane for vertical data and
centimeters to the right (positive) or left t^^egative) of
the junction for arm data. Magnitude values indicate
relative signal strength and phase measurements indicate
relative phase with respect to the reference, a sample of
the antenna exitation signal.
81


•CASE 1 VERTICAL CHARGE DATA
POSITION MAGNITODE PHASE POSITION MAGNITODE PHASE
(cm) (rel.) (deg) (cm) (rel.) (deg)
97.00 2.22 -46.4 69.00 1.21 35.5
96.00 2.24 -45.5 68.00 1.21 41.3
95.00 2.25 -44.2 67.00 1.27 55.5
94.00 2.25 -43.0 66.00 1.31 57.5
93.00 2.24 -41.7 65.00 1.37 61.3
92.00 2.23 -40.5 64.00 1.44 65.3
91.00 2.20 -39.1 63.00 1.52 69.6
90.00 2.17 -37.6 62.00 1.62 74.1
89.00 2.14 -36.1 61.00 1.73 78.5
88.00 2.10 -34.6 60.00 1.85 82.9
87.00 2.05 -33.0 59.00 2.02 87.5
86.00 2.01 -31.2 58.00 2.15 91.4
85.00 1.94 -29.5 57.00 2.30 94.9
84.00 1.88 -27.1 56.00 2.49 98.0
83.00 1.81 -25.0 55.00 2.66 100.2
82.00 1.75 -22.6 54.00 2.85 103.0
81.00 1.68 -20.1 53.00 3.03 105.4
80.00 1.61 -17.1 52.00 3.20 107.5
79.00 1.54 -14.2 51.00 3.36 109.5
78.00 1.47 -11.0 50.00 3.53 111.5
77.00 1.42 -7.4 49.00 3.68 113.3
76.00 1.36 -3.6 48.00 3.82 115.0
75.00 1.32 .4 47.00 3.95 116.5
74.00 1.28 4.0 46.00 4.08 118.0
73.00 1.25 8.0 45.00 4.18 119.3
72.00 1.20 14.8 44.00 4.29 121 .0
71.00 1. 18 20.0 43.00 4.37 122.5
70.00 1.18 26.6 42.00 4.45 123.9
41.00 4.51 125.3
82


CASE 1 VERTICAL CURRENT DATA
POSITION MAGNITUDE PHASE POSITION MAGNITUDE PHASE
(cm) (rel.) (deg) (cm) (rel.) (deg)
95.20 .53 -81.8 67.20 1.65 -5.6
94.20 .55 -72^0 66.20 1.56 -3.1
93.20 .58 -62.6 65.20 1.44 -3. 1
92.20 .62 -54.4 64.20 1.57 -1.3
SI. 20 .68 -48.0 63.20 1.71 .3
90.20 .74 -41.6 62.20 1.89 1.7
89.20 .79 -36.6 61.20 2.08 3.0
88.20 .86 -32.5 60.20 2.26 4.0
87.20 .92 -28.9 59.20 2.40 4.9
86.20 .99 -25.8 58.20 2.53 5.9
85.20 1.05 -23.3 57.20 2.60 6.9
84.20 1.11 -21 .
2
56.20 2.64 7.9
83.20 1.15 -19.2 55.20 2.64 9.0
82.20 1.20 -18.1 54.20 2.62 10.4
81.20 1.23 -16.6 53.20 2.57 11.8
80.20 1.26 -15.7 52.20 2.52 13.2
79.20 1.27 -15.1 51.20 2.43 14.8
78.20 1.27 -14.3 50.20 2.34 16.6
77.20 1.26 -14.6 49.20 2.23 18.7
76.20 1.23 -14.7 48.20 2.11 21.2
75.20 1.20 -15.0 47.20 1.98 23.3
74.20 1.17 -15.0 46.20 1.86 26.3
73.20 1.15 -14.8 45.20 1.72 30.6
72.10 1.11 -14.3 44.20 1.59 34.5
71.20 1.08 -13.6 43.20 1.46 39.3
70.20 1.32 -10.6 42.20 1.33 45.5
69.20 1.47 -9.1 41.20 1.21 53.0
68.20 1.59 -7.1 40.20 1.12 61.9
83


CASE 1 CROSS ARM CHARGE DATA
SITION MAGNITODE PHASE POSITION MAGNITUDE PHASE
(cm) (rel.) (deg) (cm) (rel.) (deg)
28.50 3.98 150.5 -6.2 1.77 98.9
27.50 3.83 150.4 -7.20 1.90 97.7
26.50 3.65 150.1 -8.20 2.03 96.8
25.50 3.50 149.8 -9.20 2.19 95.9
24.50 3.36 149.6 -10.20 2.35 95.0
23.50 3.23 149.4 -11.20 2.52 94.4
22.50 3.31 149.0 -12.20 2.70 93.6
21.50 2.97 148.6 -13.20 2.89 93.1
20.50 2.86 148.5 -14.20 3.07 92.5
19.50 2.73 148.2 -15.20 3.25 92.1
18.50 2.60 148.0 -16.20 3.44 91.6
17.50 2.47 147.6 -17.20 3.62 91.2
16.50 2.35 147.1 -18.20 3.81 90.7
15.50 2.22 146.7 -19.20 4.00 90.3
14.50 2.10 146.2 -20.20 4.20 89.8
13.50 1.97 145.5 -21.20 4.40 89.4
12.50 1.84 144.8 -22.20 4.59 89. 1
11.50 1.71 143.7 -23.20 4-79 88.8
10.50 1.59 142.6 -24.20 5.00 88.5
9.40 1.46 141.0 -25.20 5.27 87.9
8.40 1.37 139.5 -26.20 5.60 85.6
-27.20 5.30 90.1
-28.20 5.75 89. 1
84


CASE 1 CROSS ARM CURRENT DATA
POSITION MAGNITUDE PHASE POSITION MAGNITUDE PHASE
(cm) (rel.) (deg) (cm) (rel.) (deg)
, 27.00 1.33 -110.4 -5.20 2.16 -174.5
26.00 1.37 -110.2 -6.20 2.31 -174.4
25.00 1.45 -110.0 -7.20 2.46 -174.5
24.00 1.51 -109.4 -8.20 2.62 -174.6
23.00 1.57 -108.5 -9.20 2.77 -174.9
22.00 1.64 -108.2 -10.20 2.88 -175.0
21.00 1.69 -108.1 -11.20 2.95 -175.2
20.00 1.72 -106.9 -12.20 2.99 -175.2
19.00 1.76 -106.7 -13.20 3.00 -175,3
18.00 1.79 -106.1 -14.20 3.00 -175.6
17.00 1.80 -105.2 -15.20 2.97 -175.7
16.00 1.81 -104.3 -16.20 2.93 -175.9
15.00 1.80 -103.3 -17.20 2.88 -176.0
14.00 1.77 -102.0 -18.20 2.81 -176.1
13.00 1.72 -100.5 -19.20 2.73 -176.2
12.00 1.66 -98.5 -20.20 2.65 -176.5
11.00 1.56 -95.9 -21.20 2.57 -176.9
10.00 1.43 -92.0 -22.20 2.49 -177.5
9.00 1.27 -85.2 -23.20 2.39 -178.3
8.00 1. 10 -75.2 -24.20 2.35 179.5
7.00 .98 -62.5 -25.20 2.25 177.0
-26.20 2.90 141.0
-27.20 .70 -146.5
85


CASE 2 VERTICAL CHARGE DATA
POSITION MAGNITUDE PHASE POSITION MAGNITUDE PHASE
(cm) (rel.) (deg) (cm) (rel,) (deg)
97.50 1.95 -86.0 68.50 .62 8,1
96.50 1.96 -85.2 67.50 -62 25.9
95.50 1.97 -83,9 66,50 .69 53.5
94.50 1.97 -82.9 65.50 .74 58.8
93.40 1.96 -81.7 64.50 .82 66,4
92.50 1.95 -80.7 63.50 .93 73.9
91.50 1.93 -79.3 62.50 1.08 81.7
90.50 1.90 -78.0 61.50 1.27 89.4
89.50 1.87 -76.9 60.50 1.47 95.4
88,50 1.84 -75.2 59.50 1.65 99,1
87.50 1.79 -73.7 58.50 1.74 100,1
86.50 1.74 -72.3 57.40 1.93 102.6
85.50 1.69 -71.4 56.50 2.11 105.6
84.50 1.62 -69.6 55.50 2.35 108.4
83.50 1.57 -67.2 54.50 2.68 111.9
82.50 1.50 -65.0 53.50 2.91 113.8
81.50 1.44 -62,9 52.50 3.15 115,8
80.50 1.37 -60.5 51.50 3.38 117.4
79.50 1.30 -57.9 50,50 3.58 118.5
78.50 1.23 -54.9 49,50 3.80 119.8
77,50 1,15 -51.6 48,50 3.97 121,1
76.50 1,08 -47.9 47.50 4.14 122,2
75,50 1.02 -44.0 46.50 4,29 123,0
74.50 .95 -39.6 45.50 4.44 124,0
73.50 .90 -34.9 44,50 4.58 124,9
72.50 .84 -29.9 43.50 4.71 125.8
71,50 .75 -22.8 42.50 4.82 126.6
70.50 .69 -15.0 41.50 4.94 127.5
69,50 . .65 -5.5 40,50 5.00 128,0
86


CASE 2 VERTICAL CURRENT DATA
POSITION MAGNITUDE PHASE POSITION MAGNITUDE PHASE
(cm) (rel.) (deg) (cm) (rel.) (deg)
96.70 .58 -98.6 67.70 1.67 35. 1
95.70 .55 -91.3 66.70 1.62 37.3
94.60 .54 -82.1 65.70 1.58 38.9
93.70 .53 -74.4 64.70 1.60 41.5
92.70 .53 -65.9 63.60 1.78 44.0
91.70 .55 -57.7 62.70 1.95 45.8
90.70 .57 -50-2 61.70 2.15 47.7
89.70 .60 -43.1 60.70 2.36 49. 1
88.70 .63 -36.8 59.70 2.54 50.6
87.70 .67 -31.6 58.70 2.69 51.8
86.70 .71 -26.5 57.60 2.82 52.5
85-70 .74 -22.3 56.70 2.86 53.5
84.70 .78 -18.7 55.70 2.88 54.3
83.70 .82 -15.1 54.70 2.86 55. 1
82.70 .86 -12.0 53.70 2.83 55.9
81.70 .89 -9.0 52.70 2.78 56.9
80.70 .92 -6.3 51.70 2.69 57.9
79.70 .94 -3.7 50.70 2.60 58.9
78.70 .96 -1.2 49.70 2.48 60. 1
77.70 .97 1.3 48.70 2.36 61. 4
76.70 .98 4.0 47.70 2.23 62.7
75.70 .98 6.6 46.70 2.08 64. 4
74.70 .98 9.4 45.70 ' 1.93 66. 1
73.70 .98 12.2 44.70 1.76 68.4
72.70 .99 14.8 43.70 1.61 71.2
71.70 .99 17.2 42.70 1.44 74.5
70.70 .98 18.9 41.70 1.28 78.4
69.70 1.28 25.1 40.70 1.10 84. 1
68.70 1.46 29.5 39.70 .95 91.2
87


CASE 2 CROSS ARM CHARGE DATA
POSITION MAGNITUDE PHASE POSITION MAGNITUDE PHASE
(cm) (rel.) (deg) (cm) (rel.) (deg)
28.75 2.27 -37.1 -7.05 .81 -2.5
28.25 2.22 -36.8 -8.05 .86 -5.4
27.25 2.15 -36.0 -9.05 .92 -8.5
26.25 2.10 -35.3 -10.05 .97 -11.0
25.25 2.03 -34.4 -11.05 1.02 -13.2
24.25 1.96 -33.1 -12.05 1.08 -15.3
23.25 1.88 -31.5 -13.05 1.12 -16.6
22.2Li 1.79 -31.0 -14.05 1.16 -18.0
21.25 1.72 -28.5 -14.95 1.20 -19.0
20.25 1.6U -25.5 -16.05 1.24 -20.6
19.25 1.55 -24.3 -16.95 1.27 -21.2
18.25 1.46 -21 .0 -18.05 1.31 -23.5
17.25 1.38 -18.3 -19.05 1.34 -24.6
16.25 1,30 -15.4 -20.0 5 1.35 -25.4
15.25 1.22 -11.0 -21.05 1.36 -26.0
14.25 1.14 -6.2 -22.05 1.37 -26.6
13.25 1.06 -2.3 -23.05 1.38 -27.2
12.25 .99 1.9 -24.05 1.37 -27.8
11.25 .92 6.4 . -25.05 1.37 -28.0
10.25 .85 10.9 -26.05 1.35 -28.5
9.25 .80 14.8 -27.05 1,34 -30.0
8.25 .75 17.3 -28-05 1.30 -30.2
-29.05 1.26 -30.5
88

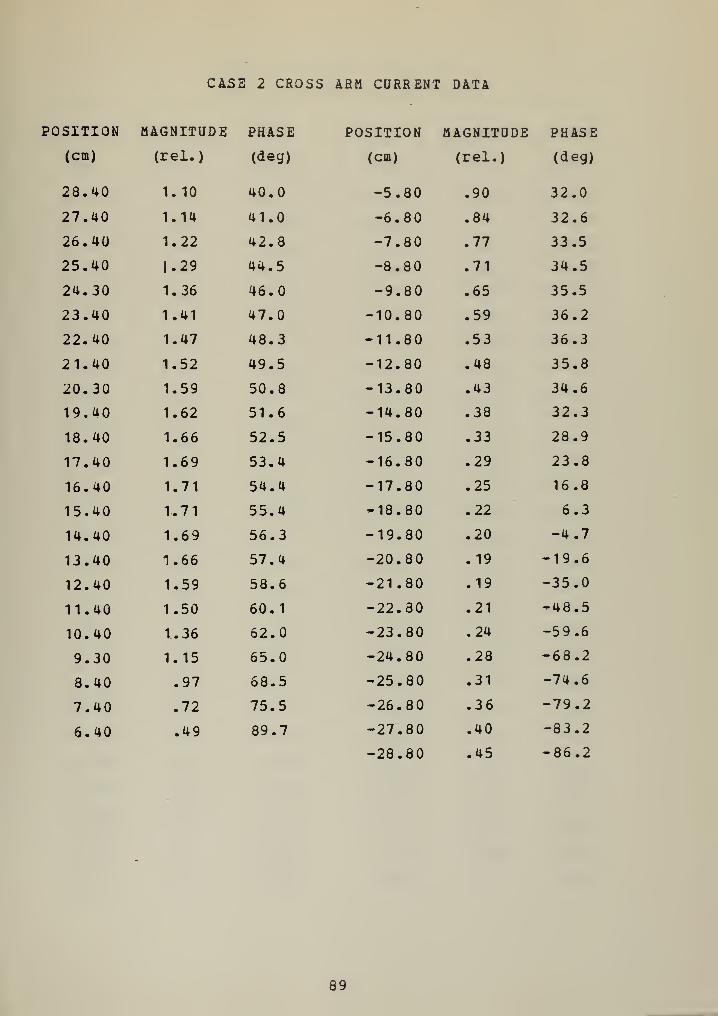
CASE 2 CROSS ABM CURRENT DATA
POSITION MAGNITUDE PHASE POSITION MAGNITUDE PHASE
(cm) (rel.) (deg) (cm) (rel.) (deg)
28.40 1.10 40.0 -5.80 .90 32.0
27.40 1.14 41.0 -6.80 .84 32.6
26.40 1.22 42.8 -7.80 .77 33.5
25.40 1.29 44.5 -8.80 .71 34.5
24.30 1.36 46.0 -9.80 .65 35.5
23.40 1.41 47.0 -10.80 .59 36.2
22.40 1.47 48.3 -11.80 .53 36.3
21.40 1.52 49.5 -12.80 .48 35.8
20.30 1.59 50.8 -13.80 .43 34.6
19,40 1.62 51.6 -14.80 .38 32.3
18.40 1.66 52.5 -15.80 .33 28.9
17.40 1.69 53.4 -16.80 .29 23-8
16.40 1.71 54.4 -17.80 .25 16.8
15.40 1.71 55.4 -18.80 .22 6.3
14.40 1.69 56.3 -19.80 ,20 -4.7
13.40 1.66 57.4 -20.80 .19 -19.6
12.40 1.59 58.6 -21.80 .19 -35.0
11.40 1.50 60.1 -22.80 .21 -48.5
10.40 1.36 62.0 -23.80 .24 -59.6
9.30 1.15 65.0 -24.80 .28 -68.2
8.40 .97 68.5 -25.80 .31 -74.6
7.40 .72 75.5 -26.80 .36 -79.2
6.40 .49 89.7 -27.80 .40 -83.2
-28.80 .45 -86.2
89


CASE 3 VEfiTICAL CHARGE DATA
POSITION MAGNITUDE PHASE POSITION flAGNITODE PHASE
(cm) (rel.) (deg) (cm) (rel.) (deg)
97.95 .81 160.1 68.95 1.72 -158.8
96.95 .85 162.7 67.95 1.79 -154.5
95.95 .90 165.0 66.95 1.81 -154.3
94.95 .95 167.6 65.95 1.85 -153.5
93-95 .99 170. 1 64.95 1.90 -151.2
92.95 1.02 172.0 63.95 1.96 -151.2
91.95 1.07 173.9 62.95 2.03 -149.5
90.95 1. 11 175.4 61.95 2.10 -147.7
89.85 1.16 177.2 60.95 2.17 -145.9
88.85 1.20 178.8 59.95 2.24 -144.2
87.95 1.23 -179.8 58.95 2.28 -142.9
86.85 1.27 -177.7 57.85 2.34 -141.0
85^95 1.30 -176.9 56.95 2.39 -139.3
84.85 1.32 -175.6 55.95 2.47 -137.3
83.85 1.36 -174.4 54.95 2.58 -135.0
82.95 1.39 -173.2 53.95 2.65 -133.
1
81.95 1.42 -172.0 52.95 2.72 -131.4
30.95 1.45 -171.0 51.95 2.80 -129.6
79.95 1.46 -170.0 50.95 2.86 -128.0
78.95 1.48 -168.9 49.95 2.94 -126.4
77.95 1.50 -167.9 48.95 2.99 -124.9
76.95 1.53 -167.0 47.95 3.04 -123.4
75.95 1.55 -166.0 46.95 3.10 -122.9
74.95 1.57 -165.0 45.95 3.15 -120.3
73.95 1.59 -164.3 44.95 3.21 -118.6
72.95 1.60 -163.5 43.95 3.27 -117.2
71.95 1.61 -162.1 42.95 3.34 -115.9
70.95 1.63 -161.2 41.95 3.38 -114.5
69.95 1.66 -160.2 40.95 3.41 -113. 4
90


CASE 3 VERTICAL CURRENT DATA
POSITION MAGNITUDE PHASE POSITION MAGNITUDE PHASE(cm) (rel.) (deg) (cm) (rel.) (deg)
96.70 .78 139.0 67.70 .85 -175.0
95.70 .81 139.6 66.70 .83 -173.0
94.70 .82 141.3 65.70 .75 -171.9
93.70 .84 142.3 64.70 .81 -169.2
92.70 .83 143.5 63.70 .89 -166.9
91.70 .82 144.8 62.70 .99 -165.0
90.70 .79 146.2 61.70 1.08 -163.1
89.70 .78 147.1 60.70 1.18 -161.8
88.70 .77 148.3 59.70 1.28 -160.5
87.70 .75 149.7 58.70 1.36 -159.2
86.70 .74 151.4 57.70 1.42 -158.0
85.70 .72 152.9 56.70 1.46 -156.9
84.70 .71 154.3 55.70 1.48 -155.8
83.70 .69 155.6 54.70 1.50 -154.4
82.70 .68 157.1 53.70 1.50 -153.0
81.70 .67 158.5 52.70 1.51 -151.4
80.70 .65 160. 1 51.70 1.50 -149.5
79.70 .64 161.6 50.70 1.48 -147.7
78.70 .62 163.0 49.70 1.46 -146.0
77.70 .61 164.2 48.70 1.44 -144.0
76.70 .59 165.4 47.70 1.42 -142.1
75.70 .57 166.5 46.70 1.39 -139.8
74.70 .55 167.6 45.70 1.36 -137.5
73.70 .54 168.9 44.70 1.33 -135.0
72.70 .53 170.5 43.70 1.30 -132^5
71.60 .51 172.4 42.70 1.27 -129.6
70.70 .50 173.6 41.70 1.24 -126.5
69.70 .66 177.9 40.70 1.21 -123.4
68.70 .75 -178.6 39.70 1. 18 -120.0
91


CASE 3 CfiOSS ARM CHAfiGE DATA
POSITION MAGNITUDE PHASE POSITION MAGNITUDE PHASE
(cm) (rel.) (deg) (cm) (rel.) (deg)
29.40 1.11 160.9 -7.10 1.75 -162.5
28.40 1.15 164.0 -8.10 1.74 -163.3
27.40 1.18 167.0 -9.10 1.73 -164.1
26.40 1.22 170.1 -10.10 1.72 -164.9
25.40 1.26 173.2 -11.00 1.70 -165.5
24.40 1.30 176.0 -12.10 1.69 -166.4
23.40 1.33 178.4 -13.10 1.66 -167.1
22.40 1.38 -178.9 -14.10 1.64 -168.0
21.40 1.42 -176.5 -15.10 1.60 -168.8
20.40 1.45 -174.4 -16.10 1.57 -169.7
19.40 1.49 -172.7 -17.10 1.52 -170.6
18.40 1.53 -170.1 -18.10 1.48 -171.6
17.30 1.56 -168.0 -19.10 1.44 -172.5
16.40 1.59 -166.4 -20.10 1.39 -173.5
15.40 1.62 -164.6 -21.10 1.34 -174.4
14.40 1.65 -163.1 -22.10 1.29 -175.5
13.40 (.68 -161.
8
-23.10 1.23 -17 6.6
12.40 1.70 -160.5 -24.10 1.18 -177.8
11.40 1.71 -159.5 -25.10 1. 12 -179.1
10.40 1.72 -158.5 -26.10 1.06 179. 1
9.40 1.73 -158.0 -27. 10 1.00 177.5
8.40 1.74 -157.6 -28.10 .95 175.8
-29.10 .88 173.7
92


CASE 3 CROSS ARM CURRENT DATA
POSITION MAGNITUDE PHASE POSITION MAGNITUDE PHASE
(cm) (rel.) (deg) (cm) (rel.) (deg)
27.90 1.46 164.5 -7.40 .61 166.2
26.90 1.45 164.5 -8.4 .61 162.7
25.90 1.44 165.5 -9.4 .62 159.2
24.90 1.43 166.6 -10.40 .63 156.0
23.80 1.42 167.5 -11.40 .64 153.0
22.90 1.41 168.4 -12.40 .66 150.1
21.90 1.39 169.5 -13.40 -68 147.5
20.90 1.37 171.7 -14.40 .70 145.5
19.90 1.35 172.0 -15.40 .73 143.5
18.90 1.32 173.4 -16.40 .75 141 .6
17.80 1.29 174.9 -17.40 .77 139.8
16.90 1.26 175.6 -18.40 .80 138.0
15.90 1.21 177.0 -19.40 .83 136.2
14.90 1.17 178.0 -20.40 .86 134.8
13.90 1.12 179.2 -21 .40 .88 133.9
12.90 1.06 -179.6 -22.4 .91 132.6
11.90 1.00 -178.2 -23.40 .94 131 .6
10.80 .92 -177.5 -24.40 .96 130.8
9.90 .83 -176.6 -25.4 .98 130.0
8.90 .71 -176.4 -26.40 1.00 129.0
7.90 .57 -176.
1
-27.40 1.02 128.5
6.90 .42 -176.3 -28.40 1.03 128.1
5.90 .28 -177.2 -29.40 1.05 127.6
93


CASE 4 VERTICAL CHARGE DATA
POSITION MAGNITUDE PHASE POSITION MAGNITUDE PHASE
(cm) (rel.) (deg) (cm) (rel.) (deg)
96.95.-54 90.0 68.95 1.19 116.2
95.95 .62 92.3 67.95 1.12 116.7
94.95 • 71 93.1 66.95 .97 116. 1
93.95 .79 95.6 65.95 .89 119.5
92.95 .87 96.9 64.95 .79 123.5
91.95 .94 97.8 63.95 .69 128. 1
90.95 1.02 98.8 62.95 .58 134.9
89.95 1.09 99.5 61.95 .47 144.2
88.95 1.16 99.8 60.95 .36 160.1
87.95 1.22 100.4 59.95 .29 -173.8
86.95 1^28 100.9 53.95 .31 -138.6
85.95 1.35 101.4 57.95 .42. -114.
1
84.95 1.41 101.9 56.95 .57 -100.6
83.95 1.46 102.4 55.95 .76 -92.8
82.95 1.50 102-8 54.95 .95 -87.6
81.95 1.55 103.2 53.95 1.15 -84.0
80.95 1.59 103.6 52.95 1.36 -81.7
79.95 1.62 104.1 51.95 1.57 -80.0
78.95 1.64 104.5 50.95 1.78 -78.5
77.95 1.66 105.0 49.95 1.99 -77.5
76.95 1.66 105.6 48,95 2.20 -76.6
75.95 1.65 106.2 47.95 2.41 -76.8
74.95 1.63 107.0 46.95 2.60 -75.4
73.95 1.60 107.8 45.95 2.81 -74.9
72.95 1.55 108.8 44.95 3.01 -74.5
71.95 1.48 109.5 43.95 3.19 -74. 1
70.95 1.42 110.8 42.95 3.39 -73.9
69.65 1.34 112.5 41.95 3.57 -73.6
40.95 3.77 -73.4
94


CASE U VERTICAL CURRENT DATA
SITION MAGNITUDE PHASE POSITION MAGNITUDE PHASE
(cm) (rel.) (deg) (cm) (rel.) (deg)
95.75 1.93 -24.3 67.75 1.90 150.4
94.75 1.96 -24.2 66.75 1.97 152.2
93.75 1.93 -24.0 65.75 1.97 152.9
92.75 1.90 -23.9 64.75 2.08 153.9
91.75 1.86 -23.8 63.75 2.24 156.6
90.75 1.83 -23.6 62.75 2.43 159.4
89.75 1.79 -23.5 61.75 2.65 162.1
88.75 1.74 -23.3 60.75 2.89 164.4
87.75 1.69 -23.1 59.75 3.07 166.2
86.75 1.63 -22.7 58.75 3.26 167.7
85.75 1.56 -22.3 57.75 3.42 168.8
84.75 1.49 -22.0 56.75 3.55 169.8
83.75 1.40 -21.4 55.75 3.62 170.6
82.75 1.31 -20.5 54.75 3.69 171.2
81.75 1.20 -19.4 53.75 3.73 171 .8
80.75 1.08 -17.9 52.75 3.75 172.1
79.75 .94 -15.6 51.75 3.76 172.6
78.75 .77 -12.0 50.75 3.75 173.0
77.65 .57 -3.9 49.75 3.74 173.4
76.75 .42 10.5 48.75 3.71 173.7
75.75 .28 45.9 47.75 3.67 174.1
74.75 .33 92.0 46.75 3.62 174.4
73.75 .50 113.3 45.75 3.57 174.8
72.75 .68 123.0 44.75 3.52 175.3
71.75 .85 127.5 43,65 3.44 175.6
70.75 .99 129.8 42.75 3.38 176.0
69.75 1.21 140.8 41.75 3.30 176.5
68.75 1.50 144.9 40.75 3.21 177.0
39.75 3.12 177.6
95

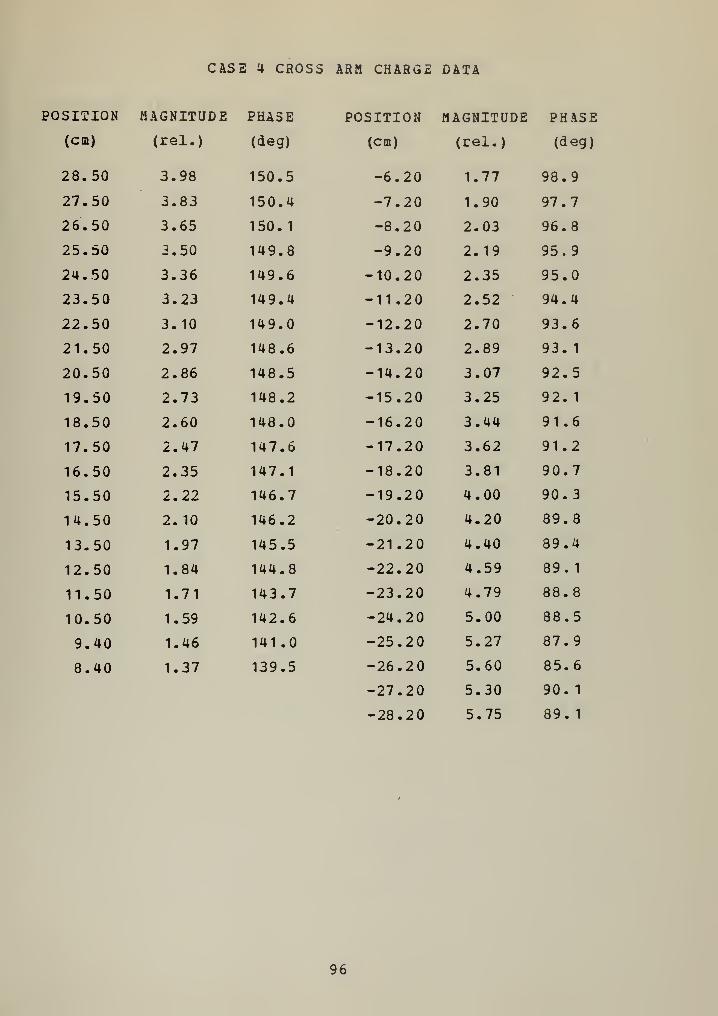
CASE 4 CROSS ARM CHARGE DATA
POSITION MAGNITUDE PHASE POSITION MAGNITUDE PHASE
(cm) (rel.) (deg) (cm) (rel.) (deg)
28.50 3.98 150.5 -6.20 1.77 98.9
27.50 3.83 150.4 -7.20 1.90 97.7
26.50 3.65 150.1 -8.20 2.03 96.8
25.50 3.50 149.8 -9.20 2.19 95.9
24.50 3.36 149.6 -10.20 2.35 95.0
23.50 3.23 149.4 -11.20 2.52 94.4
22.50 3.10 149.0 -12.20 2.70 93.6
21.50 2.97 148.6 -13.20 2.89 93. 1
20.50 2.86 148.5 -14.20 3.07 92.5
19.50 2.73 148.2 -15.20 3.25 92. 1
18.50 2.60 148.0 -16.20 3.44 91.6
17.50 2.47 147.6 -17.20 3.62 91.2
16.50 2.35 147.1 -18.20 3.81 90.7
15.50 2.22 146.7 -19.20 4.00 90.3
14.50 2.10 146.2 -20.20 4.20 89.8
13.50 1.97 145.5 -21.20 4.40 89.4
12.50 1.84 144.8 -22.20 4.59 89. 1
11.50 1.71 143.7 -23.20 4.79 88.8
10.50 1.59 142.6 -24.20 5.00 88.5
9.40 1.46 141 .0 -25.20 5.27 87.9
8.40 1.37 139.5 -26.20 5.60 85.6
-27.20 5.30 90. 1
-28.20 5.75 89. 1
96


CASE 4 CROSS ARM CURRENT DATA
POSITION MAGNITUDE PHASE POSITION MAGNITUDE PHASE
(cm) (rel.) (deg) (cm) (rel.) (deg)
27.00 1.33 -110.4 -5.20 2. 16 -174.5
26.00 1.37 -110.2 -6.20 2.31 -174.4
25.00 1.45 -110.0 -7.20 2.46 -174.6
24.00 1.51 -109.4 -8.20 2.62 -174.6
23.00 1.57 -108.6 -9.20 2.77 -174.9
22.00 1.64 -108.2 -10.20 2.88 -175.0
21.00 1.69 -108.1 -11.20 2.95 -175.2
20.00 1.72 -106.9 -12.20 2.99 -175.2
19.00 1.76 -106.7 -13.20 3.00 -175.3
18.00 1.79 -106. 1 -14.20 3.00 -175.6
17.00 1.80 -105.2 -15.20 2.97 -175.7
16.00 1.81 -104.3 -16.20 2.93 -175.9
15.00 1.80 -103.3 -17.20 2.88 -176.0
14.00 1.77 -102.0 -18.20 2.81 -176.1
13.00 1.72 -100.5 -19.20 2.73 -176.2
12.00 1.66 -98.5 -20.20 2.65 -176.5
11.00 1.56 -95.9 -21.20 2.57 -176.9
10.00 1,43 -92.0 -22.20 2.49 -177.5
9.00 1.27 -85.2 -23.20 2.39 -178.0
8.00 1. 10 -75.2 -24.20 2.35 179.5
7.00 .98 -62.5 -25.20 2.25 177.0
-26.20 2.90 141.0
-27.20 .70 -146.5
97


BIBLIOGRAPHY
1. Brown, R. G., Sharpe, R. A., Hughes, W. L. , and Post,
R . E, , Lines
,
Waves, and Antennas, T he Transm ission of
Electric Energy , The Ronald Press Company, New loric,
1973.
2. Burton, R. W. , "The Crossed-Dipole Structure of
Aircraft in an Electromagnetic Pulse Environment,"
Proceedings of The Conference on Electromagne tic Nois e,
Inter ferenc e and Compatibility Advisory Gro up for
Aerospace R esearch and Deve lopment ( AGARD ) NAT O, p.
30-1 thru 30-15, Paris, France, October 197U.
3. Burton, R. ». and King, R. H. P., "Measured Currents
and Charges on Thin Crossed Antennas in a Plane-Wave
Field, '^ IEEE Transa ctions oh Antennas and Pro pagation ,
V. AP-23, No. 5, p. 657 - 664, September 1975.
4. Cruft Laboratory, Harvard University Report Number 377,
Electro magnetic Field Probes, by Haven Whiteside,
October 1962.
5. Defense Nuclear Agency Report Number 2772T, EMP
Awareness Course No^es^, IIT Research Institute, p. 1,
August 1971.
6. King, R. W. P., The Theory of Linear Antennas , Harvard
University Press, Cambridge, massachusetts, 1956.
7. Mc Dow ell, E. J., Charge and Current Distribu tions on,,
and Input I mpedance of Modera te ly Fat Transm itting
Crossod-Mono£ole Antennas, M.S. E.E. Thesis, Naval
Postgraduate School, Monterey, California, March 1976.
98


INITIAL DISTRIBaTION LIST
1. Defense Documentation Center 2
Cameron Station
Alexandria, Virginia 22314
2. Library, Code 0212 2
Naval Postgraduate School
Monterey, California 93940
3. Department Chairman, Code 62 1
Department of Electrical Engineering
Naval Postgraduate School
Monterey, California 93940
4. Assoc. Prof. R H. Burton, Code 62Zn 15
Department of Electrical Engineering
Naval Postgraduate School
Monterey, California 93940
5. LT Hilliam E. Beyatte 1
Field Command, Defense Nuclear Agency
Livermore Branch
PO Box 808(L-395)
Livermore, California 94550
6. Post-Doctoral Program 1
RADC-RBC
Home Air Development Center
Griffiss AFB
New York 1344 1
99


7. Mr. Phillip Blacksmith
Code LZfi
Air Forqe Research Lab.
Laurence G. Hanscom Field
Bedford, Massachusetts 01730
8. Air Force Weapons Laboratory/PRP
Kirtland AFB
New Mexico 87117
100


Thesi s
B505c.l
BeyatteCharge and current
density distributionson moderately thicktransmitting crossed-monopole antennas.
Thesis
c.l
1GT331p*»v?»tt»
Charge and current
density distributionson moderately thick
transmitting crossed-
monopole antennas.

thesB505
Charge and current density distributions
3 2768 002 13805 9DUDLEY KNOX LIBRARY