characterizing opex in next generation fiber-to-the...
TRANSCRIPT
Materials Systems Laboratory
Characterizing OpEx in Next Generation Fiber-to-the-Home Access Networks:
Thomas Rand-NashDr. Richard RothProf. Rajeev Ram
Prof. Randolph Kirchain

Materials Systems Laboratory
Optical Broadband Working GroupI. Within Broadband Working Group in the
Communications Futures Program
II. OBBWG MIT Research ParticipantsMaterials Systems Laboratory (MSL)Center for Integrated Photonics (CIPS)
III. Corporate Working Group Members
IV. Other Participating Companies
Materials Systems Laboratory
Optical Broadband Working Group Goals
I. Understand how the technical status of optical components influences future FTTx architectures
II. Investigation of where optical components are headed including timing and cost issues
III. How technology and cost development path will influence network deployment strategies
Materials Systems Laboratory
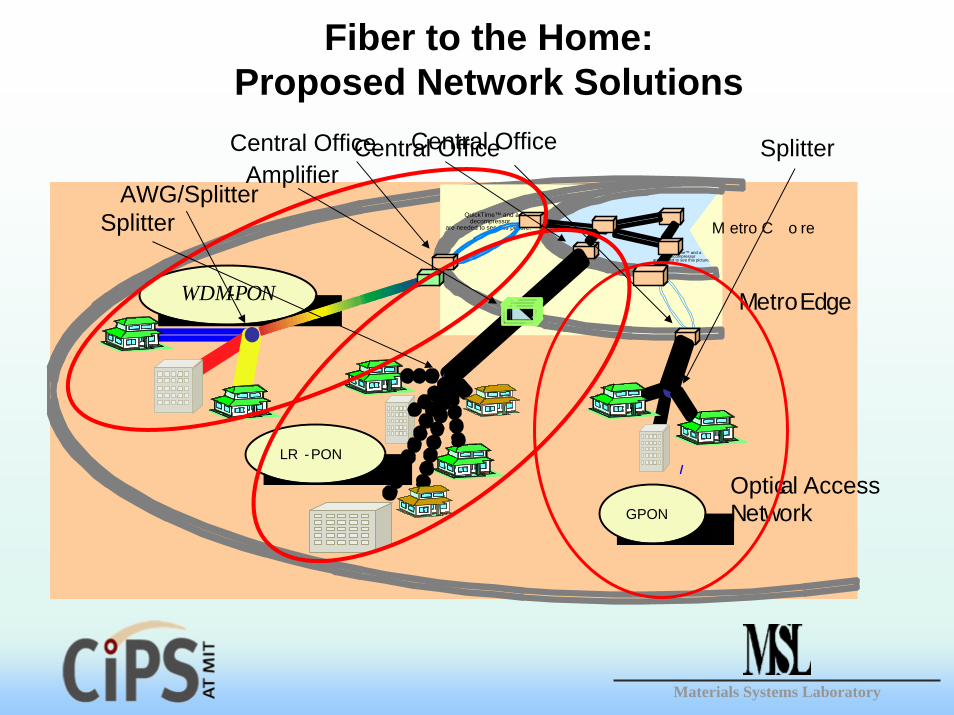
Fiber to the Home: Proposed Network Solutions
Metro Edge
Optical Access Network
WDM-PON
QuickTime™ and a decompressor
are needed to see this picture.
QuickTime™ and a decompressor
are needed to see this picture.
GPON
LR -PON
M etro C o re
Central Office SplitterCentral Office
AWG/Splitter
Central OfficeAmplifier
Splitter
Materials Systems Laboratory5
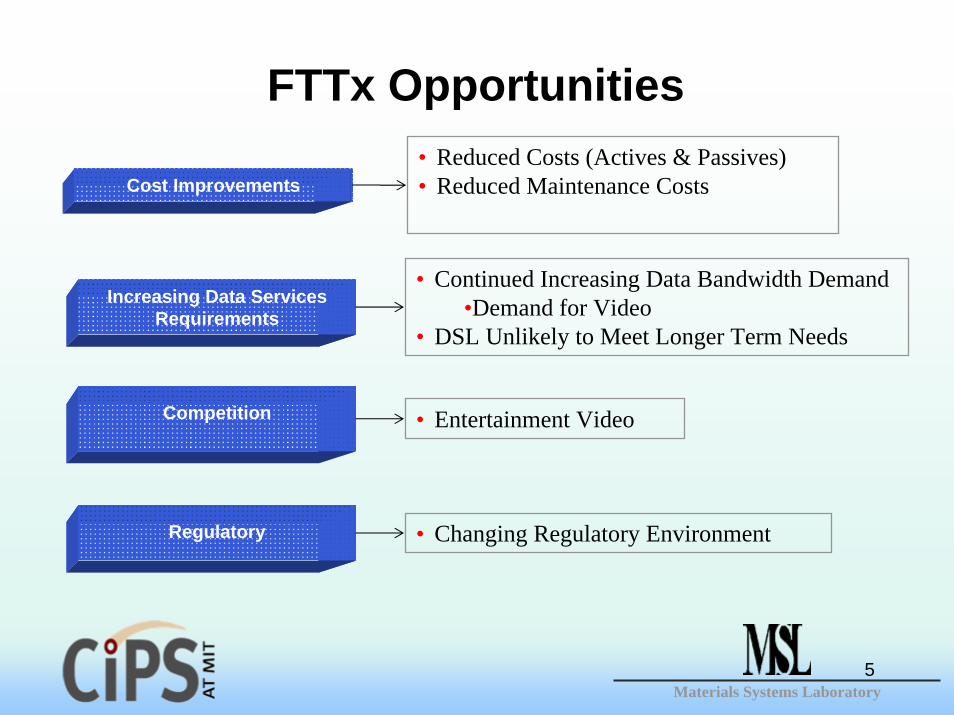
Increasing Data Services Requirements
• Continued Increasing Data Bandwidth Demand•Demand for Video
• DSL Unlikely to Meet Longer Term Needs
Competition
Regulatory
• Entertainment Video
• Changing Regulatory Environment
Cost Improvements• Reduced Costs (Actives & Passives)• Reduced Maintenance Costs
FTTx Opportunities

Materials Systems Laboratory
Modeling Activities

Materials Systems Laboratory
Modeling Activity Overview
DemandDemographics
TechnologicalConstraints
OperatingContext
Central OfficeSiting
SplitterSiting
Fiber PlantSiting
Network ModelInputs
Network DesignModel
NetworkDesign
ComponentCosts
LaborCosts
Resource Costs
NetworkConstraints
Network Cost Models
NetworkCapEx
NetworkOpEx

Materials Systems Laboratory
Modeling Advantages
I. Ability to capture impacts of technological changeII. No comprehensive OpEx models exist
Only one paper published on topicWant to predict network operational characteristics
III. Enables a large solution spaceNot tied to legacyCan model next-gen components

Materials Systems Laboratory
Network Design Model
Each red dot represents:
-Number of locations passed
-Total data

Materials Systems Laboratory
Network Design Model

Materials Systems Laboratory
Network Design Model

Materials Systems Laboratory
Network Design Model

Materials Systems Laboratory
Network Design Model

Materials Systems Laboratory
Model Validation

Materials Systems Laboratory
Network Design Model Validation:
I. Characterize key input parameters/constraints:Re-create coverage region demographics:
• Populations• Data demands• Geographic coverage region
Incorporate network architecture parameters:• Splitter strategies• Multiplexing strategy• Data transfer rates
II. Compare outputs required to satisfy constraints:• Total fiber plant route lengths• Splitter sites/number

Materials Systems Laboratory
Network Design Model: ValidationScenario (1) BT (1) MIT (2) Corning (2) MIT
Homes Passed 7353 7228 71331 71176
Splitter Strategy Non-Cascaded1x32
Cascaded1x4 1x8
Data Rate (Gbps) 2.5 2.5
Reach (km) 12 20
Central Offices 1 3
Route Length (km) 758 717 10357 10658
Stage 1 Splitters 263 294 2634 2607
Stage 2 Splitters N/A N/A 10658 10283
Model Inputs
Model Outputs

Materials Systems Laboratory
Analysis

Materials Systems Laboratory
Network Cost ModelsI. CapEx model: Maps component, labor, &
resource costs to network design II. OpEx model: Maps component reliability, &
operational labor/resource costs to network design
“Bottom-up” approach utilizes industry component failure modes, mode rates, costs
• FIT data• Reliability modeling
“Top-down” data provides observed component failure modes, mode rates, rents, energy etc.
• Carrier field data• Municipality field data
Materials Systems Laboratory
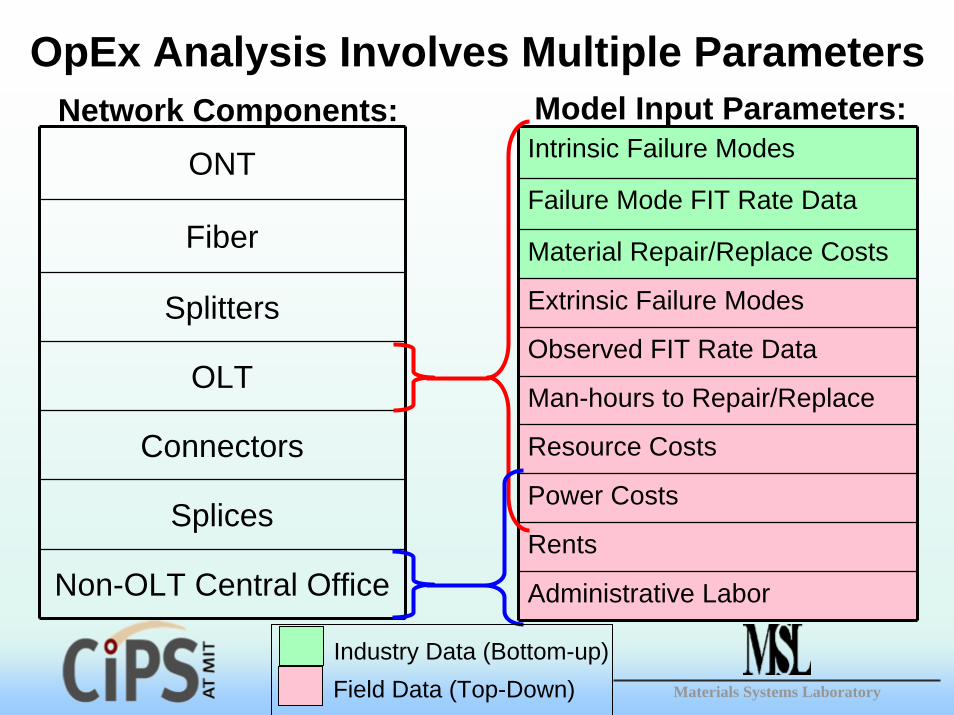
OpEx Analysis Involves Multiple Parameters
Intrinsic Failure Modes
Failure Mode FIT Rate Data
Material Repair/Replace Costs
Extrinsic Failure Modes
Observed FIT Rate Data
Man-hours to Repair/Replace
Resource Costs
Power Costs
Rents
Administrative Labor
Model Input Parameters:Network Components:ONT
Fiber
Splitters
OLT
Connectors
Splices
Non-OLT Central Office
Industry Data (Bottom-up)Field Data (Top-Down)

Materials Systems Laboratory
Scenarios ModeledScenario (3)Base Case (4)Long Range (5)High Split
Homes Passed 61711
Penetration Modeled 30%
Data Rate (Gbps) 2.5
Power Margin (dB) 3
Splitter Loss (dB) 3.5 per log(N)
Fiber Loss (dB) 0.3 per km
Splitter Strategy 1x4 1x8 1x4 1x8 1x4 1x32Reach (km) 5 20 20
Central Offices 4 1 1
ONT Rx Type: PIN APD APD
Rx Sensitivity (dBm) -25 -31 -31
OLT Tx Power (dBm) -3 -3 +3

Materials Systems Laboratory
$0
$200
$400
$600
$800
$1,000
$1,200
$1,400
(3) (4) (5)
Cap
Ex p
er
Su
bsc
rib
er
COFiberHardwa
(3) 5km (4) 20km (5) 20km1x4,1x8 1x4,1x8 1x4,1x32
BC LR HS
CapEx
CapEx By Network Component
22% Savings4.5% Savings
Total$1282
Total$1001
Total$1225

Materials Systems Laboratory
$0
$10
$20
$30
$40
$50
$60
$70
$80
$90
(3) (4) (5)
An
nu
al O
pEx p
er
Su
bsc
rib
er
COFiber Hardware
OpEx By Network Component
(3) 5km (4) 20km (5) 20km1x4,1x8 1x4,1x8 1x4,1x32
OpEx
52% Savings 62% Savings
BC LR HS
Total$77.59 Total
$29.70
Total$37.38

Materials Systems Laboratory
Annual OpEx Savings per Sub vs. Base Case
$0.73$0.09
$39.39
62% Savings($47.89)
52% Savings($40.21)
High Split Count vs. Base CaseLonger Reach vs. Base Case
$3.90$0.40
$43.59

Materials Systems Laboratory
OpEx By Network Cost Driver
$29.5
$14.3 $11.5
$36.3
$9.07
$10.7
$11.0
$9.64
$5.07
$0
$10
$20
$30
$40
$50
$60
$70
$80
$90
3 4 5
An
nu
al
Op
Ex p
er
Su
bsc
rib
er
MaterialsPower/RenLabor
Total$29.70
Total$37.38
Total$77.59
(3) 5km (4) 20km (5) 20km1x4,1x8 1x4,1x8 1x4,1x32
Materials Systems Laboratory
Future Work: Short Term
I. Model additional link budgetsII. Continue OpEx data collection
Component reliabilitiesReal-World network failure statistics
III. Move to incorporate backhaul costsIV. Develop optoelectronic reliability model
• Predict/characterize next-gen component failure modes• Predict/characterize failure rates• Characterize network failure cost effects

Materials Systems Laboratory
Thank You
Questions?