characterizing genomic alterations in cancer by
TRANSCRIPT
Characterizing genomic alterationsin cancer by complementary
functional associationsThe Harvard community has made this
article openly available. Please share howthis access benefits you. Your story matters
Citation Kim, J. W., O. B. Botvinnik, O. Abudayyeh, C. Birger, J. Rosenbluh,Y. Shrestha, M. E. Abazeed, et al. 2016. “Characterizing genomicalterations in cancer by complementary functional associations.”Nature biotechnology 34 (5): 539-546. doi:10.1038/nbt.3527. http://dx.doi.org/10.1038/nbt.3527.
Published Version doi:10.1038/nbt.3527
Citable link http://nrs.harvard.edu/urn-3:HUL.InstRepos:29408333
Terms of Use This article was downloaded from Harvard University’s DASHrepository, and is made available under the terms and conditionsapplicable to Other Posted Material, as set forth at http://nrs.harvard.edu/urn-3:HUL.InstRepos:dash.current.terms-of-use#LAA

Characterizing genomic alterations in cancer by complementary functional associations
J. W. Kim1,5,*, O. B. Botvinnik1,2,3,4,*, O. Abudayyeh1,5,8, C. Birger1, J. Rosenbluh1,5, Y. Shrestha1,5, M. E. Abazeed1,6, P. S. Hammerman1,7,8, D. DiCara1, D. J. Konieczkowski1,5, C. M. Johannessen1,5, A. Liberzon1, A. R. Alizad-Rahvar10, G. Alexe1,11,12,13, A. Aguirre1,5, M. Ghandi1, H. Greulich1,5,14, F. Vazquez1,5, B. A. Weir1, E. M. Van Allen1,5, A. Tsherniak1, D. D. Shao1,5, T. I. Zack1,16,17, M. Noble1, G. Getz1, R. Beroukhim1,5,14,16, L. A. Garraway1,5,14, M. Ardakani10, C. Romualdi9, G. Sales9, D. A. Barbie1,5, J. S. Boehm1, W. C. Hahn1,5,14,15, J. P. Mesirov18,19,1, and P. Tamayo19,18,1
1Eli and Edythe Broad Institute of Harvard and MIT, Cambridge MA
2Bioinformatics and Systems Biology Program, University of California at San Diego, La Jolla, CA
3Department of Cellular and Molecular Medicine, University of California at San Diego, La Jolla, CA
4Stem Cell Program and Institute for Genomic Medicine, University of California at San Diego, La Jolla, CA
5Department of Medical Oncology, Dana-Farber Cancer Institute, Boston MA
6Department of Radiation Oncology, Cleveland Clinic, Cleveland, OH
7Department of Medicine, Dana Farber Cancer Institute, Boston MA
8Harvard Medical School, Boston MA
9Department of Biology, University of Padova, Via Ugo Bassi 58/B, 35121 Padova, Italy
10Department of Electrical and Computer Engineering, University of Alberta, Edmonton, AB, Canada
Users may view, print, copy, and download text and data-mine the content in such documents, for the purposes of academic research, subject always to the full Conditions of use: http://www.nature.com/authors/editorial_policies/license.html#terms*These authors contributed equally to this work.
Author contributions:
• Designed and conceptualized the method: JWK, OBB, JPM, JSB, WH, PT.
• Implemented the algorithm: OBB, OA, CB, PT.
• Analyzed and interpreted analysis results: JWK, DAB, JR, YS, MEA, PSH, AA, HG, FV, BAW, EMVA, DDS, TIZ, RB, LAG, JPM, PT.
• Provided expertise or work on specific issues regarding algorithmic approaches, data analysis, data preparation, data resources, benchmarking, validation datasets, and method comparisons: ARAR, MA, CR, GS, DD, GG, MG, GA, AT, PT.
• Wrote the manuscript: JWK, OBB, MEA, JR, JPM and PT.
Competing financial interests statement: I declare that the authors have no competing interest as defined by Nature Publishing Group, or other interests that might be perceived to influence the results and discussion reported in this paper.
HHS Public AccessAuthor manuscriptNat Biotechnol. Author manuscript; available in PMC 2016 October 18.
Published in final edited form as:Nat Biotechnol. 2016 May ; 34(5): 539–546. doi:10.1038/nbt.3527.
Author M
anuscriptA
uthor Manuscript
Author M
anuscriptA
uthor Manuscript

11Department of Pediatric Oncology, Dana-Farber Cancer Institute, Boston MA
12Boston Children’s Hospital, Boston MA
13Bioinformatics Graduate Program, Boston University, Boston MA
14Department of Medicine, Brigham and Women’s Hospital, Boston MA
15Center for Cancer Genome Discovery, Dana-Farber Cancer Institute, Boston, MA
16Department of Cancer Biology, Dana-Farber Cancer Institute, Boston MA
17Program in Biophysics, Harvard University, Boston, MA
18Department of Medicine, University of California San Diego, La Jolla, CA
19Moores Cancer Center, University of California San Diego, La Jolla, CA
Abstract
Systematic efforts to sequence the cancer genome have identified large numbers of relevant
mutations and copy number alterations in human cancers; however, elucidating their functional
consequences, and their interactions to drive or maintain oncogenic states, is still a significant
challenge. Here we introduce REVEALER, a computational method that identifies combinations
of mutually exclusive genomic alterations correlated with functional phenotypes, such as the
activation or gene-dependency of oncogenic pathways or the sensitivity to a drug treatment. We
use REVEALER to uncover complementary genomic alterations associated with the
transcriptional activation of β-catenin and NRF2, MEK-inhibitor sensitivity, and KRAS
dependency. REVEALER successfully identified both known and new associations demonstrating
the power of combining functional profiles with extensive characterization of genomic alterations
in cancer genomes.
The Cancer Genome Atlas (TCGA) and other large-scale genome sequencing projects are
providing ever-increasing catalogs of somatic and epigenetic alterations in cancer1–4
. A
major challenge moving forward is to be able to identify subsets of functionally relevant
lesions for further study and eventual therapeutic targeting5–6
. These “driver” lesions, in
synergistic combinations, are responsible for the generation and maintenance of the
oncogenic state and may determine the characteristics of each tumor or tumor type.
However, the identification of such drivers is complicated by genomic instability, which
increases the number of genomic alterations including low penetrance events with uncertain
functional roles.
Genome-wide functional studies of cancer cell lines and tumors, have proven useful in
identifying associations between gene dependencies and genomic abnormalities.7–11
.
Associating recurrent genomic abnormalities with their matching therapeutic agent is a
common strategy under the ‘oncogene addiction’ paradigm. However, the challenge of
effectively mapping molecular alterations to pathway activity and drug response can be quite
difficult as those relationships are not one-to-one. Indeed, some driver mutations only
partially predict drug response because of functional heterogeneity and the rise of resistance
mechanisms.
Kim et al. Page 2
Nat Biotechnol. Author manuscript; available in PMC 2016 October 18.
Author M
anuscriptA
uthor Manuscript
Author M
anuscriptA
uthor Manuscript
One way to address these difficulties is to systematically explore the landscape of mutually
exclusive genomic abnormalities along so called functional axes that represent the activation
of oncogenic pathways or sensitivity to genetic or chemical perturbations. The use of
appropriate functional profiles is important because the complementary nature of genomic
alterations is only clearly delineated in the right context, for example, where the relevant
oncogenic programs, and other synergies such as immune or stress responses, are co-
activated to drive or maintain the oncogenic state.
Here we present REVEALER (Repeated Evaluation of VariablEs conditionAL Entropy and Redundancy), a method to identify groups of genomic alterations that together associate
with a functional activation, gene dependency, or drug response profile. The combination of
these alterations explains more of the functional target activation or sensitivity than any
individual alteration considered in isolation. REVEALER can be applied to a wide variety of
problems and allows prior relevant background knowledge to be incorporated into the
model. We show that REVEALER can be used to identify genomic features associated with
functional cancer phenotypes and demonstrate its higher sensitivity and specificity compared
to other model selection methods.
Results
REVEALER Overview
The optimal execution of REVEALER requires three inputs: i) a functional “target” profile
for individual samples across a given dataset, ii) a dataset containing a comprehensive
collection of genomic “features,” and iii) an optional “seed” feature with which to initialize
the search. The target profile is a readout from quantitative measurements, including e.g.
gene expression, pathway activation, gene-dependency or drug response. Ideally, the seed is
a feature that has a known effect on the target profile. REVEALER starts by measuring the
degree of association between the target and seed feature using a re-scaled mutual
information metric that we call the Information Coefficient (IC, Figure 1A and
Supplementary Information). The IC is a non-linear correlation coefficient that takes values
between 1 (perfect match) and −1 (perfect anti-match). One key distinguishing feature of
REVEALER is the ability to identify features based on both: target profile and seed.
Features that match the target profile but are correlated with the seed are penalized, while
features that associate with the target, and are also complementary to the seed, are scored
higher. In this way, only genomic features that explain activation or sensitivity in the target
profile that is not already accounted for, will be included in the model. REVEALER
achieves this by computing the conditional mutual information of the target profile and each
feature, conditioned on the seed feature. We refer to this as the Conditional Information Coefficient (CIC) (Figure 1B and Supplementary Information). REVEALER then iterates
this process (Figure 1C).
REVEALER uncovers alterations associated with β-catenin activation
We first used REVEALER to identify genomic features associated with the oncogenic
activation of β-catenin.12
In Figure 2A, the target t is a β-catenin activation TCF4 reporter13
assayed across 83 cancer cell lines whose mutations and copy number profiles have
Kim et al. Page 3
Nat Biotechnol. Author manuscript; available in PMC 2016 October 18.
Author M
anuscriptA
uthor Manuscript
Author M
anuscriptA
uthor Manuscript

previously been reported.14
The seed feature so, corresponds to activating mutations in β-
catenin (S33, S34, S37, T45, T41) and the target profile in dark blue represents its presence
in each sample. The seed feature associates strongly with the target (IC = 0.44) with all of
the β-catenin mutations located where the reporter readout is high (left side of heatmap),
consistent with the known activating role for these events. However, about half of the
samples with high β-catenin activation cannot be explained by alterations in β-catenin.
Therefore, we used REVEALER to find additional genomic features from a large set of
candidates to explain the target profile.
The top-scoring genomic feature of the first REVEALER iteration (CIC=0.49) is APC mutations (Figure 2A). REVEALER found this specific alteration from 17,721 feature
candidates consisting of 671 mutations and 17,050 amplifications/deletions (Supplementary
Fig. 1A). These were generated after filtering out low/high frequency features
(Supplementary Information) from an initial set of 48,270 features. APC mutations are
known to be associated with an uncontrolled stabilization and transcriptional activation of β-
catenin15
and are mutually exclusive with β-catenin mutations. Combining β-catenin and
functional APC mutations to obtain the summary feature increases the IC with the target to
0.61 (Figure 2A). REVEALER then proceeds to a second iteration and finds the
amplification of chr13q33 (ITGBL1_AMP), as the top scoring feature (CIC= 0.49, Figure
2A). Several other features in the same region chr13q11–34 also attain almost the same CIC
(Supplementary Fig. 2A). Recurrent amplifications in 13q are indeed common in colon
cancer, and notably, one of our previous studies identified CDK8 in chr13q12.13, as a colon
oncogene that regulates β-catenin activity16
. Attempts to perform a third iteration fail to find
any feature that will increase the IC with the target and thus REVEALER has completed the
task. In this case REVEALER performed two iterations before completion but in other cases
it may require a smaller or larger number of iterations.
The complete REVEALER results are summarized at the bottom of Figure 2A. The three
features have high complementarity and attain a collective IC of 0.70, accounting for 17 out
of the top 20 samples with the highest β-catenin. (Supplementary Figs. 1 and 2). In addition
to finding the best scoring abnormalities at every iteration, REVEALER also clusters them
to facilitate the identification of alternative or “second best” hits (Supplementary Figs. 1B
and 2A, Supplementary Information).
We also investigated whether these features associate with shRNA β-catenin dependence in
cancer cell lines (Supplementary Information). The samples harboring REVEALER’s
features indeed display a much higher degree of β-catenin dependency (P values: 0.0005,
0.0001 and 0.0009, respectively) and are also highly complementary to each other (Figure
2B). This significant mutual exclusivity and association with both: transcriptional and
dependency targets provides strong evidence that these alterations indeed activate β-catenin.
To investigate REVEALER’s results robustness, we randomly subsampled 80% of the
samples, re-ran REVEALER, and found that APC mutations and the 13q-12–34 amplicon
re-appear in 8 out of 10 runs, suggesting these results are reasonably robust (Supplementary
Information).
Kim et al. Page 4
Nat Biotechnol. Author manuscript; available in PMC 2016 October 18.
Author M
anuscriptA
uthor Manuscript
Author M
anuscriptA
uthor Manuscript

Transcriptional NRF2/NFE2L2 activation in lung cancer
Here we show how REVEALER can also be used with a combined seed feature.
The transcription factor NRF2 (NFE2L2), induces a cytoprotective response to oxidative
stresses and its mutations confer constitutive activation in cancer17
. We generated a target
profile using the single-sample GSEA8 scores of NRF2-driven genes
18 across 182 lung
cancer cell lines from the Broad-Novartis Cancer Cell Line Encyclopedia, hereafter referred
as CCLE14
. We selected lung cancer cell lines due to the higher frequency of NFE2L2 alterations,
19,20 and used as seed both: NFE2L2 mutations and amplifications (Figure 3A).
REVEALER merges multiple seeds(logical OR function) to produce a single summary seed.
The input genomic features consisted of a set of 32,154 alterations (991 mutations and
31,253 amplification/deletions after filtering from an original set of 48,270).
The first REVEALER iteration yielded KEAP1 mutations, which is an established direct
mediator of NRF2 and its targets21
(Figure 3A and Supplementary Fig. 3). The second
iteration yielded features encompassing amplification of chr15q22/26 (OR4F13P_AMP,
Figure 3A and Supplementary Fig. 4). Besides these two no other features improved the
match with the target. Of special interest within this amplicon is NOX5 (NADPH oxidase 5)
because its α and β isoforms have been implicated in the production of extracellular
superoxide, H2O2 or other reactive oxygen species (ROS)22–24
.
To experimentally assess whether NOX5 indeed regulates NRF2 transcriptional activity, we
used an antioxidant response element (ARE) luciferase reporter as readout of the NRF2 pathway
25. We co-transfected ARE-driven luciferase reporter construct with NOX5, NRF2
(positive control), and LacZ (negative control) open-reading frame (ORFs) constructs. We
found that NRF2 and NOX5 ORF constructs led to significant increases in the ARE-driven
luciferase activity relative to LacZ or no vector indicating that NOX5 expression indeed
regulates ARE (Figure 3B). To test whether these results comport with biological behavior
in vivo, we examined a TCGA lung cancer dataset26
and found that these genomic features
are enriched in tumors with higher NRF2 activation suggesting REVEALER’s results
generalize to tumors (Supplementary Fig. 5).
Drug sensitivity: the MEK-inhibitor PD-0325901 and MAPK Activation
In this example, we show REVEALER de novo discovery without a seed and with a drug
sensitivity target.
MEK (MAP2K1), a member of the MAPK signaling pathway, is constitutively activated as a
result of oncogenic mutations in e.g. BRAF, RAS and MEK1.27
As a target, we used the
sensitivity profile to the MEK inhibitor PD-032590128
in 493 cancer cell lines from the
CCLE. As MEK itself is rarely mutated, we ran REVEALER without a seed. The first
iteration of REVEALER yielded BRAF mutations as the top-scoring feature (Figure 4 and
Supplementary Fig. 6). The next two iterations yielded mutations in KRAS and NRAS. These 3 genes are well-known oncogenic activators of MAPK signaling and their
combination explains a large fraction of PD-0325901 sensitive samples in the CCLE (Figure
4 and Supplementary Figs. 7–8).
Kim et al. Page 5
Nat Biotechnol. Author manuscript; available in PMC 2016 October 18.
Author M
anuscriptA
uthor Manuscript
Author M
anuscriptA
uthor Manuscript

Example 4. KRAS dependency
Lastly, we show how REVEALER can be used with a gene dependency target.
The high frequency of KRAS mutations highlights its significance as a major oncogene.
Besides studies linking KRAS mutations with dependency29
, there is growing evidence for
KRAS wild-type states that are also KRAS-dependent.8,9 Consistent with these findings, our
examination of KRAS dependency profile across cancer cell lines,30
found evidence that
while KRAS dependency associates with KRAS mutation status (IC = −0.41), a significant
number of wild-type samples were also dependent on KRAS. We used REVEALER to
assess if any other genomic alteration besides KRAS mutation, might account for these
unexplained KRAS dependencies. We used as target the shRNA KRAS dependency score
and KRAS mutations as seed (Figure 5A). Strikingly, REVEALER found a copy number
gain (CNG) in chr8q23–4 (NSMCE2_AMP) as the top-scoring feature in the first iteration
(Figure 5A and Supplementary Fig. 9A). This feature is followed by amplifications in
chr9p21 and chr12p12 (KRAS locus), and deletions in chr9q12 as potentially
complementary alterations with lesser incremental benefit (Figures 5A and Supplementary
Figs. 10–12). These features together explain the majority of the KRAS dependent cell lines:
30 out of the top 35 samples with higher KRAS dependency (Figure 5A).
Alterations in chr8q23–24 are frequent events in cancer,31
and the REVEALER finding
corresponds to a broad region of chr8q23–24 (“chr8q24 gain”) instead of the more specific
focal MYC amplification (“MYC amplification”, Figure 5B). To assess differences in KRAS dependence we grouped cell lines based on: MYC amplification, chr8q24 gain, KRAS mutations or none of the above. We found statistically significant differences between cells
that harbor chr8q24 gain and cells that either have MYC amplification or other genotypes
(Figure 5C). As both events are centromeric with respect to, and potentially target MYC itself, we asked if there were differences in MYC expression between these events. MYC amplified cell lines had significantly higher expression of MYC compared to cell lines with
the 8q24 gain (Figure 5D), which perhaps can be explained by high copy number value of
MYC amplification region (data not shown). This is consistent with previous studies that
show tumors with low MYC expression display increased dependence on KRAS32
.
To further validate these findings we selected an independent panel of NSCLC cell lines
with either mutations in KRAS, chr8q24 gain, or controls, and assayed them for relative
viability upon suppression of KRAS (Figure 5E). Validated shRNAs against KRAS8,9 were
used to assess if 8q24-gain predicts sensitivity to KRAS suppression. As expected, cells with
mutant KRAS status were highly dependent on KRAS. Consistent with previous
observations,8, 33
we also found that cells that do not have alterations in KRAS or chr8q24
are less dependent on KRAS; however, cells that harbor 8q24 gain were significantly more
sensitive to KRAS suppression, suggesting that these samples indeed require KRAS for their
survival.
REVEALER: Simulated data analysis—The objective of this benchmark was to
investigate how well the CIC metric used by REVEALER could find a known
complementary feature in controlled circumstances where we know the answer. We were
also interested in comparing the CIC with other alternative approaches including the partial
Kim et al. Page 6
Nat Biotechnol. Author manuscript; available in PMC 2016 October 18.
Author M
anuscriptA
uthor Manuscript
Author M
anuscriptA
uthor Manuscript

correlation coefficient and two other methods: the ElasticNet34
and mRMR35
(Supplementary Information). We generated 5,000 simulated data instances of target, seed and complementary-feature (the “signal”) using probabilistic models parameterized to fit to
the empirical data using skew-t distributions and random sampling. We also generate a set of
2,000 random features (the “noise”) (Supplementary Information and Supplementary Figs.
13–15). We use each method to find the correct complementary feature in each instance and
evaluated the results using ROC (Receiving Operating Characteristics) curves, which we can
estimate because we know the correct complementary feature in each case. The results show
that the CIC is the most sensitive at finding the correct complementary feature and attains an
area under ROC equal to 0.872, compared with 0.674 for partial correlation, 0.633 for
ElasticNet, and 0.672 for mRMR (Figure 6A and Supplementary Fig. 15E).
REVEALER: Comparisons with other methods—Methods to search for
complementary genomic alterations36–42
or general non-redundant features have been
proposed in the past;34,35,43
however, REVEALER is different in several aspects: i) it
incorporates 3 inputs: a target profile, a features dataset and a seed feature(s), ii) it uses a
sequential search process where the features found in subsequent iterations are influenced by
the choice of features in early iterations, and iii) it uses the conditional differential mutual
information. These distinctions make it difficult to directly compare REVEALER with other
methods; however, if one restricts the comparison to cases with no seed REVEALER can be
compared with other methods such as the ElasticNet34
and Dendrix.41
We ran REVALER side to side with those methods using the data for Examples 1–4 without
seeds and compared the results to provide insights into the characteristics of each method
and delineate their potential suitability to different problem settings. We present below a
summary of results and refer the reader to the Supplementary Information for details.
Table 1 and Figure 6B summarize the results using: the Target Association Score, the
absolute value of the IC of a summary feature consisting of the combination of all the top
selected features, and the Feature Complementarity Index, one minus the average IC across
pairs of features. Table 1 shows that several of the features found by the ElasticNet overlap
with REVEALER’s, suggesting that strong feature-target associations are retrieved by both
methods. Examination of the differences appear to show that the features selected by the
ElasticNet, while correlated with the target profile, were less complementary with each other
than the ones selected by REVEALER (Figure 6B). This is likely a consequence of
ElasticNet’s cost function34
which favors fitting the target and finds features with low
correlation with each other but not necessarily mutual exclusivity. Dendrix produces rather
different sets of features compared with the other methods (Table 1 and Supplementary Figs.
15A–D) and performs a more comprehensive search of feature complementarity without
using the sample-per-sample target. As a consequence Dendrix appears to find features with
high complementarity to each other but somewhat less association with the target
(Supplementary Fig. 15A–D).
REVEALER is available in GenePattern (www.genepattern.org).
Kim et al. Page 7
Nat Biotechnol. Author manuscript; available in PMC 2016 October 18.
Author M
anuscriptA
uthor Manuscript
Author M
anuscriptA
uthor Manuscript
Discussion
In the examples presented above we demonstrated how REVEALER effectively maps
genomic alterations to their relevant functional profiles. The identification of i) APC and
KEAP1 mutations, as alternative causes of activation of β–catenin and NRF2 respectively; ii)
the association of BRAF, KRAS and NRAS mutations with MEK-inhibition sensitivity, and
iii) our successful validation of the role of NOX5 in NRF2 activation, and the chr8q23–4
amplicon in predicting KRAS dependency, all provide a direct confirmation of
REVEALER’s utility and effectiveness.
The use of mutual information for estimating genomic feature association is not new,44–46
however, REVEALER makes innovative use of conditional mutual information based on
continuous distributions and avoids the need for discretization and other simplifying
assumptions. The simulated benchmark shows that REVEALER can identify a
complementary feature reasonably well where its CIC is above 0.30 for a wide range of IC
values between target and seed The results also show that the conditional mutual information
is more sensitive than the partial correlation, and other selection methods, to discriminate
subtler relationships between genomic features.
The comparative results across methods (Table 1 and Supplementary Fig. 15A–D) suggest
that REVEALER strikes a good balance between weighting the features’ complementarity
and their association with the target. REVEALER is particularly well suited in cases where
there is: a) an accurate sample-per-sample functional profile representing a biological state
of interest, b) prior information to guide the choice of seed(s), c) a comprehensive
characterization of genomic abnormalities.
The differences between approaches are likely produced by the different emphasis of each
algorithm. The ElasticNet emphasizes finding uncorrelated features that primarily “predict”
the target, and are not strictly restricted to be complementary, It is well suited for cases
where matching the target profile is more important than strict feature complementarity.
Dendrix, on the other hand, is more appropriate to find multiple sets of features that are
highly complementary in a subset of samples with less emphasis in fitting the target. These
methods are all complementary approaches that emphasize different aspects of feature
selection and have potential applicability depending on the problem setting.
Supplementary Material
Refer to Web version on PubMed Central for supplementary material.
Acknowledgments
This project was supported in part by NIH grants R01 CA154480, R01 CA121941, U01 CA176058 and R01 CA109467.
References
1. Meyerson M, Gabriel S, Getz G. Advances in understanding cancer genomes through second-generation sequencing. Nat Rev Genet. 2010; 11:685–696. [PubMed: 20847746]
Kim et al. Page 8
Nat Biotechnol. Author manuscript; available in PMC 2016 October 18.
Author M
anuscriptA
uthor Manuscript
Author M
anuscriptA
uthor Manuscript

2. Lawrence MS, et al. 2013, Mutational heterogeneity in cancer and the search for new cancer- associated genes. Nature. 2013 Jul 11; 499(7457):214–8. [PubMed: 23770567]
3. Lawrence MS, Stojanov P, Mermel CH, Robinson JT, Garraway LA, Golub TR, Meyerson M, Gabriel SB, Lander ES, Getz G. Discovery and saturation analysis of cancer genes across 21 tumour types. Nature. 2014 Jan 23; 505(7484):495–501. [PubMed: 24390350]
4. Cancer Genome Atlas Research Network. Weinstein JN, Collisson EA, Mills GB, Shaw KR, Ozenberger BA, Ellrott K, Shmulevich I, Sander C, Stuart JM. The Cancer Genome Atlas Pan-Cancer analysis project. Nat Genet. 2013 Oct; 45(10):1113–20. [PubMed: 24071849]
5. Beroukhim R, et al. Assessing the significance of chromosomal aberrations in cancer: methodology and application to glioma. Proc Natl Acad Sci U S A. 2007; 104:20007–20012. [PubMed: 18077431]
6. Chin L, Hahn WC, Getz G, Meyerson M. Making sense of cancer genomic data. Genes Dev. 2011; 25:534–555. [PubMed: 21406553]
7. Luo B, et al. Highly parallel identification of essential genes in cancer cells. Proc Natl Acad Sci U S A. 2008; 105:20380–20385. [PubMed: 19091943]
8. Barbie DA, et al. Systematic RNA interference reveals that oncogenic KRAS-driven cancers require TBK1. Nature. 2009; 462:108–112. [PubMed: 19847166]
9. Cheung HW, et al. Systematic investigation of genetic vulnerabilities across cancer cell lines reveals lineage-specific dependencies in ovarian cancer. Proc Natl Acad Sci U S A. 2011; 108:12372–12377. [PubMed: 21746896]
10. Boehm JS, Hahn WC. Towards systematic functional characterization of cancer genomes. Nat Rev Genet. 2011; 12:487–498. [PubMed: 21681210]
11. Nijhawan D, et al. Cancer vulnerabilities unveiled by genomic loss. Cell. 2012; 150:842–854. [PubMed: 22901813]
12. Valenta T, Hausmann G, Basler K. The many faces and functions of beta-catenin. EMBO J. 2012; 31:2714–2736. [PubMed: 22617422]
13. Rosenbluh J, et al. β-Catenin-driven cancers require a YAP1 transcriptional complex for survival and tumorigenesis. Cell. 2012; 151:1457–1473. [PubMed: 23245941]
14. Barretina J, et al. The Cancer Cell Line Encyclopedia enables predictive modelling of anticancer drug sensitivity. Nature. 2012; 483:603–607. [PubMed: 22460905]
15. Minde DP, Anvarian Z, Rudiger SG, Maurice MM. Messing up disorder: how do missense mutations in the tumor suppressor protein APC lead to cancer? Mol Cancer. 2011; 10:101. [PubMed: 21859464]
16. Firestein R, et al. CDK8 is a colorectal cancer oncogene that regulates beta-catenin activity. Nature. 2008; 455:547–551. [PubMed: 18794900]
17. DeNicola GM, et al. Oncogene-induced Nrf2 transcription promotes ROS detoxification and tumorigenesis. Nature. 2011; 475:106–109. [PubMed: 21734707]
18. Malhotra D, et al. Global mapping of binding sites for Nrf2 identifies novel targets in cell survival response through ChIP-Seq profiling and network analysis. Nucleic Acids Res. 2010; 38:5718–5734. [PubMed: 20460467]
19. Cancer Genome Atlas Research Network. Comprehensive genomic characterization of squamous cell lung cancers. Nature. 2012; 489:519–525. [PubMed: 22960745]
20. Singh A, et al. Dysfunctional KEAP1-NRF2 interaction in non-small-cell lung cancer. PLoS Med. 2006; 3:e420. [PubMed: 17020408]
21. Solis LM, et al. Nrf2 and Keap1 abnormalities in non-small cell lung carcinoma and association with clinicopathologic features. Clin Cancer Res. 2010; 16:3743–3753. [PubMed: 20534738]
22. Brar SS, Corbin Z, Kennedy TP, Hemendinger R, Thornton L, Bommarius B, Arnold RS, Whorton AR, Sturrock AB, Huecksteadt TP, Quinn MT, Krenitsky K, Ardie KG, Lambeth JD, Hoidal JR. NOX5 NAD(P)H oxidase regulates growth and apoptosis in DU145 prostate cancer cells. Am J Physiol Cell Physiol. 2003 Aug; 285(2):C353–69. [PubMed: 12686516]
23. Pendyala S, Natarajan V. Redox regulation of Nox proteins. Respir Physiol Neurobiol. 2010 Dec 31; 174(3):265–71. Epub 2010 Sep 29. DOI: 10.1016/j.resp.2010.09.016 [PubMed: 20883826]
Kim et al. Page 9
Nat Biotechnol. Author manuscript; available in PMC 2016 October 18.
Author M
anuscriptA
uthor Manuscript
Author M
anuscriptA
uthor Manuscript

24. Pandey D, Patel A, Patel V, Chen F, Qian J, Wang Y, Barman SA, Venema RC, Stepp DW, Rudic RD, Fulton DJ. Expression and functional significance of NADPH oxidase 5 (Nox5) and its splice variants in human blood vessels. Am J Physiol Heart Circ Physiol. 2012 May 15; 302(10):H1919–28. [PubMed: 22427510]
25. Abazeed ME, et al. Integrative radiogenomic profiling of squamous cell lung cancer. Cancer Res. 2013 Oct 15; 73(20):6289–98. [PubMed: 23980093]
26. The Cancer Genome Atlas. 2012. http://cancergenome.nih.gov/
27. McCubrey JA, et al. Roles of the Raf/MEK/ERK pathway in cell growth, malignant transformation and drug resistance. Biochim Biophys Acta. 2007; 1773:1263–1284. [PubMed: 17126425]
28. Chin L, Garraway LA, Fisher DE. Malignant melanoma: genetics and therapeutics in the genomic era. Genes Dev. 2006; 20:2149–2182. [PubMed: 16912270]
29. Young A, et al. Ras signaling and therapies. Adv Cancer Res. 2009; 102:1–17. [PubMed: 19595305]
30. Shao DD, et al. ATARiS: computational quantification of gene suppression phenotypes from multisample RNAi screens. Genome Res. 2013; 23:665–678. [PubMed: 23269662]
31. Raeder MB, et al. Integrated genomic analysis of the 8q24 amplification in endometrial cancers identifies ATAD2 as essential to MYC-dependent cancers. PLoS One. 2013; 8(2):e54873. Epub 2013 Feb 5. doi: 10.1371/journal.pone.0054873 [PubMed: 23393560]
32. Hollern DP, Yuwanita I, Andrechek ER. A mouse model with T58A mutations in Myc reduces the dependence on KRas mutations and has similarities to claudin-low human breast cancer. Oncogene. 2013; 32:1296–1304. [PubMed: 22525269]
33. Scholl C, et al. Synthetic lethal interaction between oncogenic KRAS dependency and STK33 suppression in human cancer cells. Cell. 2009; 137:821–834. [PubMed: 19490892]
34. Zou H, Hastie T. Regularization and variable selection via the elastic net. Journal of the Royal Statistical Society: Series B (Statistical Methodology). 2005; 67:301–320.
35. Peng H, Long F, Ding C. Feature selection based on mutual information: criteria of max-dependency, max-relevance, and min-redundancy. IEEE Trans Pattern Anal Mach Intell. 2005; 27:1226–1238. [PubMed: 16119262]
36. Ciriello G, Cerami E, Sander C, Schultz N. Mutual exclusivity analysis identifies oncogenic network modules. Genome Res. 2012; 22:398–406. [PubMed: 21908773]
37. Miller CA, Settle SH, Sulman EP, Aldape KD, Milosavljevic A. Discovering functional modules by identifying recurrent and mutually exclusive mutational patterns in tumors. BMC Med Genomics. 2011; 4:34. [PubMed: 21489305]
38. Vandin F, Upfal E, Raphael BJ. De novo discovery of mutated driver pathways in cancer. Genome Res. 2012; 22:375–385. [PubMed: 21653252]
39. Leiserson MD, Blokh D, Sharan R, Raphael BJ. Simultaneous identification of multiple driver pathways in cancer. PLoS Comput Biol. 2013; 9:e1003054. [PubMed: 23717195]
40. Gu Y, et al. Network analysis of genomic alteration profiles reveals co-altered functional modules and driver genes for glioblastoma. Mol Biosyst. 2013; 9:467–477. [PubMed: 23344900]
41. Vandin F, Upfal E, Raphael BJ. Algorithms for detecting significantly mutated pathways in cancer. J Comput Biol. 2011; 18:507–522. [PubMed: 21385051]
42. Vaske CJ, et al. Inference of patient-specific pathway activities from multi-dimensional cancer genomics data using PARADIGM. Bioinformatics. 2010; 26:i237–245. [PubMed: 20529912]
43. Waldron L, et al. Optimized application of penalized regression methods to diverse genomic data. Bioinformatics. 2011; 27:3399–3406. [PubMed: 22156367]
44. Butte AJ, Kohane IS. Mutual information relevance networks: functional genomic clustering using pairwise entropy measurements. Pac Symp Biocomput. 2000:418–429. [PubMed: 10902190]
45. Steuer R, Kurths J, Daub CO, Weise J, Selbig J. The mutual information: detecting and evaluating dependencies between variables. Bioinformatics. 2002; 18(Suppl 2):S231–240. [PubMed: 12386007]
46. Margolin AA, et al. ARACNE: an algorithm for the reconstruction of gene regulatory networks in a mammalian cellular context. BMC Bioinformatics. 2006; 7(Suppl 1):S7. [PubMed: 16723010]
Kim et al. Page 10
Nat Biotechnol. Author manuscript; available in PMC 2016 October 18.
Author M
anuscriptA
uthor Manuscript
Author M
anuscriptA
uthor Manuscript
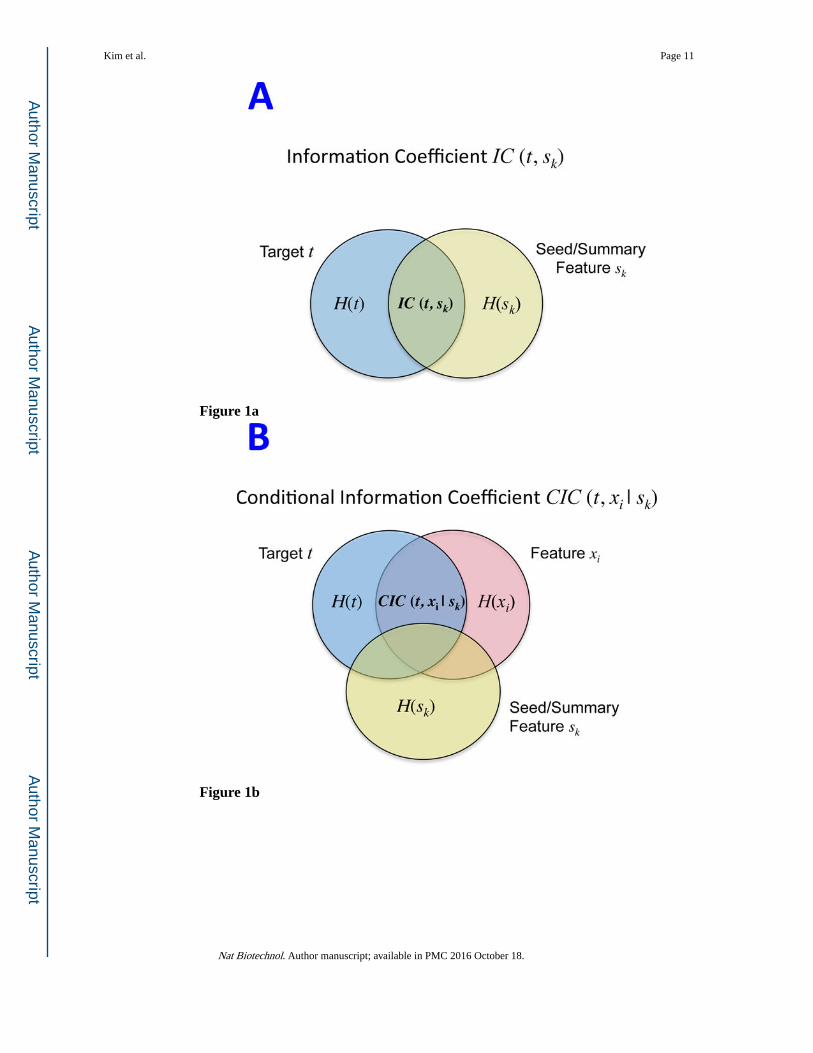
Figure 1a
Figure 1b
Kim et al. Page 11
Nat Biotechnol. Author manuscript; available in PMC 2016 October 18.
Author M
anuscriptA
uthor Manuscript
Author M
anuscriptA
uthor Manuscript

Figure 1c
Figure 1. REVEALER Information-based metrics. A)The Information Coefficient IC(t, sk) represents
the information shared by the target and the seed or summary feature. B) The Conditional
Information Coefficient CIC(t, xi | sk) represents the information shared by the target and a
feature, such as a genomic alteration, conditional to the seed feature. C) Detailed schematics
of the REVEALER algorithm.
Kim et al. Page 12
Nat Biotechnol. Author manuscript; available in PMC 2016 October 18.
Author M
anuscriptA
uthor Manuscript
Author M
anuscriptA
uthor Manuscript

Figure 2a
Figure 2b
Figure 2.
Kim et al. Page 13
Nat Biotechnol. Author manuscript; available in PMC 2016 October 18.
Author M
anuscriptA
uthor Manuscript
Author M
anuscriptA
uthor Manuscript

REVEALER results for transcriptional activation of β-catenin in cancer. A) This heatmap
illustrates the use of the REVEALER approach to find complementary genomic alterations
that match the transcriptional activation of β-catenin in cancer. The target profile is a TCF4
reporter that provides an estimate of the degree of activation of β-catenin. The “seed” is the
β-catenin activating mutations, the known “cause” of high values in the target. REVEALER
iterates two times and finds APC mutations and the amplification of 13q33 as
complementary alterations. At the bottom the heatmap shows the complete set genomic
alterations associated with activation of β-catenin found by REVEALER. As can be seen in
the figure the features are highly complementary and account for 17 out of the top 20
samples with highest reporter values. B) Profiles of the features shown in Figure 2A,
compared with an shRNA profile of β-catenin dependence in 209 cell lines (Supplementary
Information). The 3 features are associated with a high degree of β-catenin essentiality but
are also highly complementary to each other. The IC scores and nominal p-values with
respect to the target are shown on the right side of the heatmap.
Kim et al. Page 14
Nat Biotechnol. Author manuscript; available in PMC 2016 October 18.
Author M
anuscriptA
uthor Manuscript
Author M
anuscriptA
uthor Manuscript
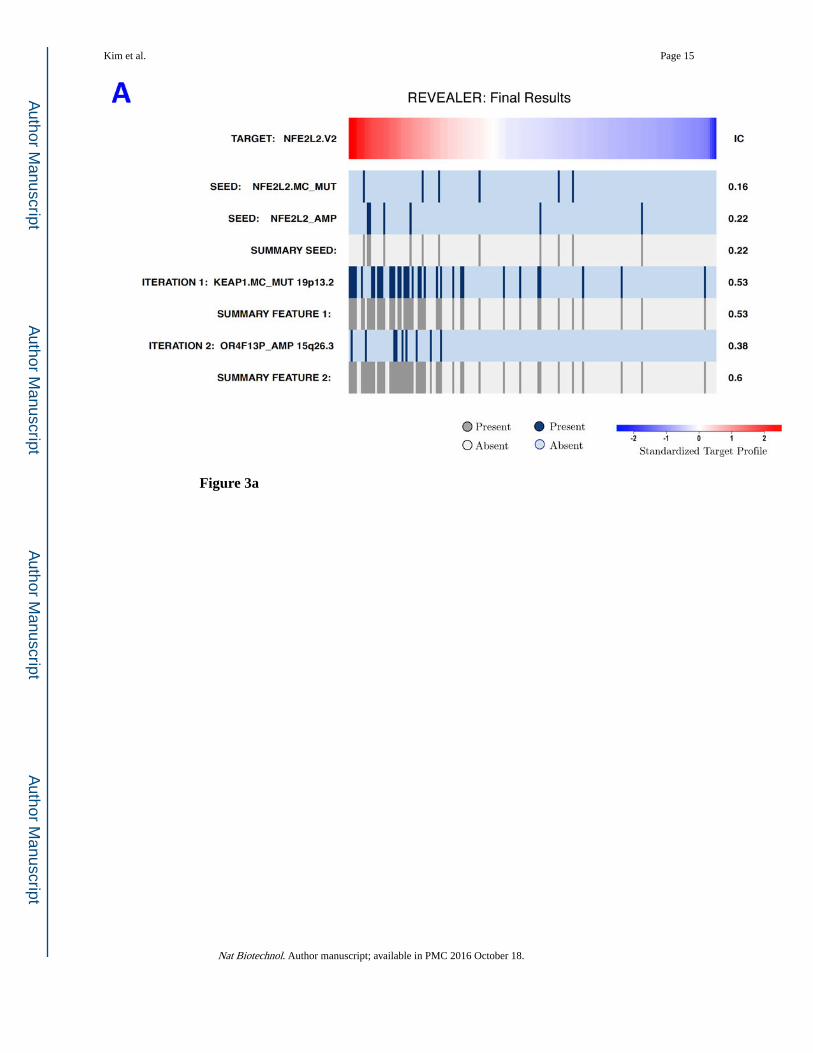
Figure 3a
Kim et al. Page 15
Nat Biotechnol. Author manuscript; available in PMC 2016 October 18.
Author M
anuscriptA
uthor Manuscript
Author M
anuscriptA
uthor Manuscript

Figure 3b
Figure 3. REVEALER results for transcriptional NRF2 activation in lung cancer. A) The target profile
is the single-sample GSEA profile of a group of NRF2-driven genes in a group of 182 lung
cancer cell lines. The seed feature was defined as the status of NRF2 mutation or
amplification. The first iteration of REVEALER identifies KEAP1 mutation, a known co-
activator of NRF2, as a potential cause of activation of NRF2 complementary to the seed
feature. The second iteration identifies amplification of chr15q22/26 containing the locus of
NOX5 (NADPH oxidase 5). B) Results of luciferase assay using antioxidant response
element (ARE) reporter as readout of NRF2 pathway activation and open-reading frame
(ORF) constructs for NOX5 (REVEALER result), NRF2 (positive control) and LacZ and no
vector as negative controls (two tailed unpaired t-test: NOX5 vs. LacZ *p>0.01, NRF2 vs.
LacZ **p>0.001).
Kim et al. Page 16
Nat Biotechnol. Author manuscript; available in PMC 2016 October 18.
Author M
anuscriptA
uthor Manuscript
Author M
anuscriptA
uthor Manuscript
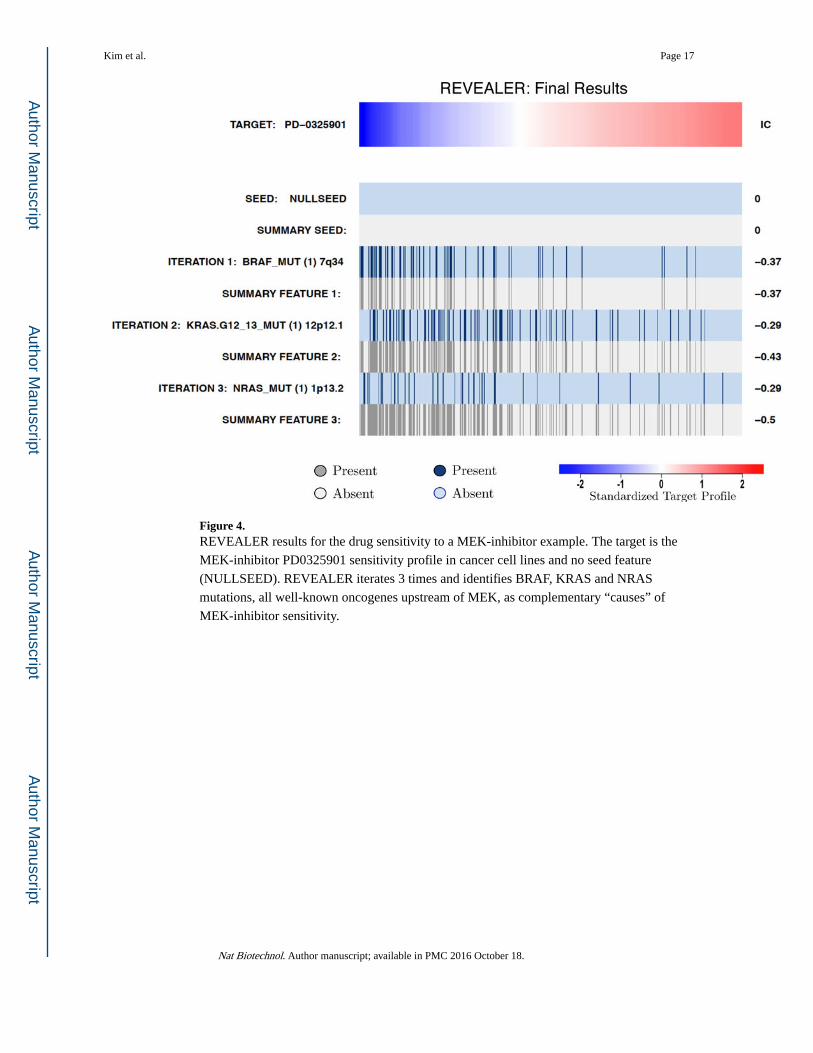
Figure 4. REVEALER results for the drug sensitivity to a MEK-inhibitor example. The target is the
MEK-inhibitor PD0325901 sensitivity profile in cancer cell lines and no seed feature
(NULLSEED). REVEALER iterates 3 times and identifies BRAF, KRAS and NRAS
mutations, all well-known oncogenes upstream of MEK, as complementary “causes” of
MEK-inhibitor sensitivity.
Kim et al. Page 17
Nat Biotechnol. Author manuscript; available in PMC 2016 October 18.
Author M
anuscriptA
uthor Manuscript
Author M
anuscriptA
uthor Manuscript
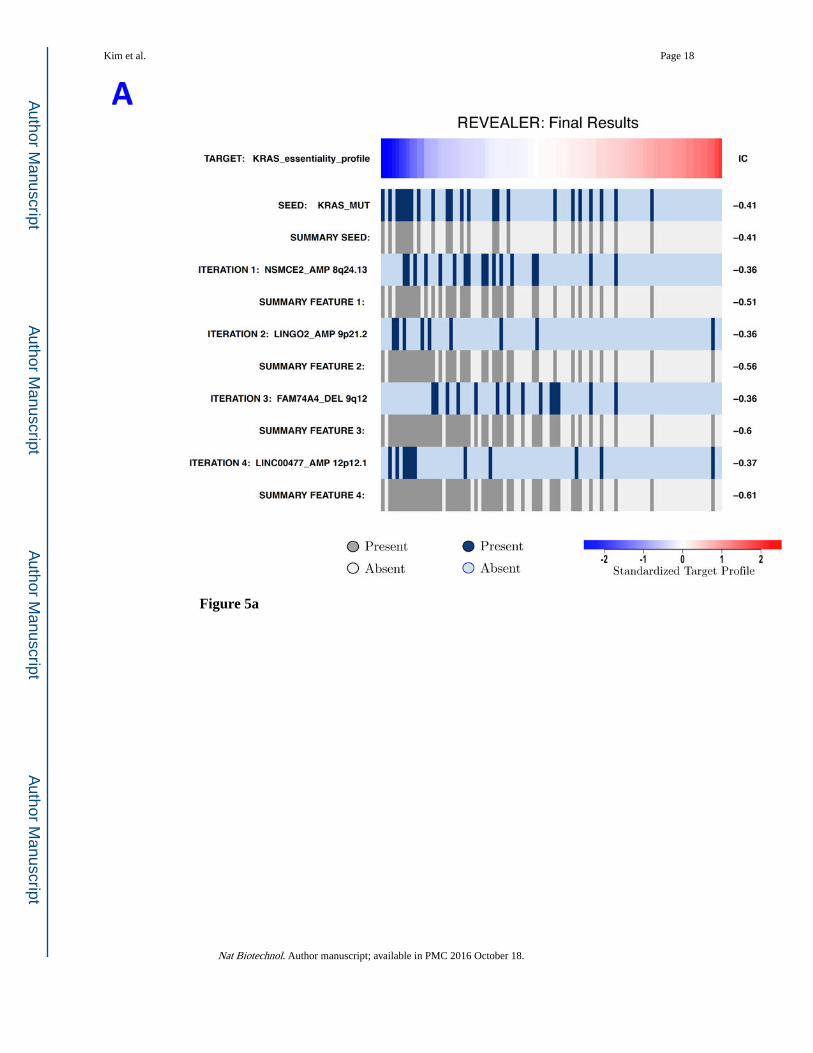
Figure 5a
Kim et al. Page 18
Nat Biotechnol. Author manuscript; available in PMC 2016 October 18.
Author M
anuscriptA
uthor Manuscript
Author M
anuscriptA
uthor Manuscript

Kim et al. Page 19
Nat Biotechnol. Author manuscript; available in PMC 2016 October 18.
Author M
anuscriptA
uthor Manuscript
Author M
anuscriptA
uthor Manuscript

Figure 5b
Figure 5e
Figure 5. REVEALER results for KRAS-dependency. A) The target profile is the relative KRAS-
dependence score in 100 cancer cell lines. The seed feature is the mutation status of KRAS,
Kim et al. Page 20
Nat Biotechnol. Author manuscript; available in PMC 2016 October 18.
Author M
anuscriptA
uthor Manuscript
Author M
anuscriptA
uthor Manuscript

a well-known cause of activation, and the genomic features matrix represents mutations and
copy number alterations in the same cell lines. REVEALER identifies a copy number gain
(CNG) across a region on chromosome 8q23–24 as the most complementary genomic
alteration to KRAS mutation in order to explain KRAS dependency. Other features such as
amplifications in chr9p21, and chr12p12 and deletions in chr9q12 are also identified but
with lesser incremental benefit. B) Pattern of copy number changes in cancer cells that have
gain in 8q23–24 show that copy number changes centromeric to MYC have two distinct
patterns. Red indicates regions of chromosomal gain (log2 ratio >0.6). C) Dot plot of relative
KRAS dependence across cell lines with various genotypes (X-axis). Differential KRAS
dependence between cells were examined between cells with copy number gain on 8q23–24
relative to cells with other genotype (student t-test with Welch’s Correction ***p<0.0001).
D) Dot plot of relative MYC mRNA expression across cell lines with various genotypes (X-
axis). Differential MYC mRNA levels were assessed between cells with copy number gain
on 8q23–24 vs. MYC amplification (student t-test with Welch’s Correction ***p<0.0001).
E) Validation of KRAS dependence in non-small cell lung cancer cells with indicated
genotypic status. Cancer cells which harbor 8q23–24 gain from the CCLE were chosen and
their relative KRAS dependence was assessed for cells that either have mutations in KRAS
or those that harbor 8q23–24 alteration (KRAS mutant cells: NCIH2009, NCIH1944, A549,
NCIH1792), 8q23–24 gain: NCIH2110, NCIH1781, NCIH1648, NCIH2126, NCIH2342,
Others: NCIH28, NCIH1437, NCIH2228). Relative viability was assessed using CellTiter-
Glo assay (Promega) and by normalizing the luminescence values of shKRAS infected cells
with shLuciferase controls 7 days post-infection.
Kim et al. Page 21
Nat Biotechnol. Author manuscript; available in PMC 2016 October 18.
Author M
anuscriptA
uthor Manuscript
Author M
anuscriptA
uthor Manuscript

Figure 6a
Kim et al. Page 22
Nat Biotechnol. Author manuscript; available in PMC 2016 October 18.
Author M
anuscriptA
uthor Manuscript
Author M
anuscriptA
uthor Manuscript

Figure 6b
Figure 6. Simulated data results. A) Summary ROC curves for the simulated data benchmark using the
CIC/information-based metric, the PCOR/partial correlation the Elastic Net and mRMR
feature selection. B) Bar plot of the across-method comparative analysis of top features
shown in Table 1 (IC metric), and the corresponding results using the square error metric
instead of the IC.
Kim et al. Page 23
Nat Biotechnol. Author manuscript; available in PMC 2016 October 18.
Author M
anuscriptA
uthor Manuscript
Author M
anuscriptA
uthor Manuscript

Author M
anuscriptA
uthor Manuscript
Author M
anuscriptA
uthor Manuscript
Kim et al. Page 24
Table 1
Comparative summary of top features results in the four examples
Example 1WNT/Beta-catenin Activation
Example 2NRF2 Activation
Example 3MEK-inhibitor Sensitivity
Example 4KRAS Essentiality
REVEALER (seed)Top Features
CTNNB1 mut (seed)APC mutITGBL1 amp (13q33)
NFE2L2 mut (seed)NFE2L2 amp (seed)KEAP1 mutOR4F13P
amp(15q26.3)1
N/A (this example had no seed)
KRAS mut (seed)NSMCE2 amp (8q24.13)LINGO2 amp (9p21.2)FAM74A4 del (9q12)LINC00477 amp
(12p12.1)2
Target Assoc Score (IC)Feature Comp Index
0.70.877
0.60.929
––
0.540.847
REVEALER (no seed)Top Features
ITGBL1 amp (13q33)CTNNB1 mutAPC mut
KEAP1 mutLRP1B del (2q21.2)OR4F13P amp
(15q26.3)1
BRAF mutKRAS.G12-13 mutNRAS mut
KRAS.G12-13 mutLINC00340 del (6p22.3)ZNF385B amp (2q31.3)NUP153 mut
Target Assoc Score (IC)Feature Comp Index
0.70.877
0.540.941
0.50.9268
0.60.901
ElasticNetTop Features
CTNNB1 mutAPC mutFAM69A del (1p22)
KEAP1 mut (19p13.2)PICALM mut (11q14)DOCK10 del (2q36.3)
BRAF mutBRAF.V600E mutBRAF.MC mut
BICD1 del (12p11.1)3
ZNF385B amp (2q31.3)FAM69 del (1p22)EMB del (5q11.1)
Target Assoc Score (IC)Feature Comp Index
0.580.855
0.490.869
0.380.517
0.240.763
DendrixTop Features
OR2T11 amp (1q44)PTCD1 amp (7q22.1)SLC25A37 amp (8p21.2)
KEAP1 mut (19p13.2)LOC100505687 amp (3q26)TAB2 del (6q25.1)
BRAF mutKRAS mutSHISA6 del (17p12)
GSTM2 del (1p13.3)KCNJ12 amp (17p11.1)MACROD2 del (20p12.1)UGT3A2 amp (5p13.2)
Target Assoc Score (IC)Feature Comp Index
0.390.873
0.520.936
0.420.895
0.300.873
Each row corresponds to one method’s results. The first method is REVEALER as described in the examples in the main text, the second is REVEALER without the seed, the third is the ElasticNet and the fourth is Dendrix. The quantities shown are the target association score, the absolute value of the IC of the summary feature consisting of the combination of all the top selected features, and the feature complementarity index, 1 minus the average IC across pairs of features. A higher complementary index means that the features are more mutually exclusive.
*Confirmed experimentally (gene NOX5, this study).
#KRAS locus.
†Potentially representing loss of wild-type KRAS.
Nat Biotechnol. Author manuscript; available in PMC 2016 October 18.