characterization of the skin barrier to chemical
TRANSCRIPT

CHARACTERIZATION OF THE SKIN BARRIER TO CHEMICAL
PERMEATION BY IMPEDANCE SPECTROSCOPY
by
Erick A. White

ii
A thesis submitted to the Faculty and the Board of Trustees of the
Colorado School of Mines in partial fulfillment of the requirements for the degree
of Doctor of Philosophy (Chemical Engineering)
Golden, Colorado Date_____________
Signed: ________________________ Eric A. White
Signed: ________________________ Dr. Annette L. Bunge
Thesis Advisor
Signed: ________________________ Dr. Mark E. Orazem
Thesis Advisor
Golden, Colorado Date_____________
Signed: ________________________ Dr. David W.M. Marr Professor and Head
Department of Chemical Engineering

iii
ABSTRACT
Human skin is a heterogeneous composite membrane that acts as an
effective barrier to permeation for most chemicals and ions. The barrier to ions is
reflected in electrical impedance measurements, which are easily made,
especially if measured at only one frequency. While measurements at a single
frequency are useful, additional information about the skin barrier can be learned
from measurements collected over a spectrum of frequencies. Despite the wide
application of impedance measurements for the characterization of the skin
barrier, the interpretation of those measurements remains nebulous.
The goals of this work were to develop a quantitative foundation for
evaluating skin impedance measurements collected over a spectrum of
frequencies and then to relate the results of the impedance data analysis to the
effectiveness of skin samples in acting as barriers to chemical permeation.
Toward this end, impedance spectra of undamaged and intentionally damaged
samples of excised human skin, all fully hydrated, were analyzed using simple
equivalent circuit models consisting of resistors and constant phase elements. In
various experiments, including data from the literature, impedance results were
compared with permeation measurements of tritiated water or two model
lipophilic chemicals, 4-cyanophenol or parachloronitrobenzene.
Estimates of the effective capacitance calculated using parameters from
the equivalent circuit models were remarkably similar for all samples studied,
perhaps because water comprises a large volume fraction of fully hydrated skin.
Moreover, the effective capacitance of skin treated with neat dimethyl sulfoxide

iv
(DMSO), a polar aprotic solvent, for as long as one hour, did not change,
although the skin resistance decreased as much as 150 fold. Impedance
measurements for skin treated with DMSO for less than one hour were
consistent with the presence of two layers in series: an undamaged layer with
properties of the original skin sample, and a damaged layer with a thickness that
was proportional to the square-root of the treatment time up to about 0.5 h, when
the sample was fully damaged. For comparison, impedance spectra determined
before and after the skin was punctured with a needle were adequately described
by adding a low-resistance shunt in parallel with the skin that was otherwise
unchanged. Significantly, the changes in impedance spectra collected before
and after DMSO treatment for one hour could not be explained by a low
resistance shunt parallel pathway.
Because the effective capacitance of hydrated skin is relatively constant,
the DC skin resistance can be reliably estimated from single frequency
impedance measurements reported in PAR mode at frequencies as large as
1000 Hz. By applying this analysis to four large data sets from three different
laboratories comparing in vitro measurements of tritiated water permeability and
impedance determined using an LCR databridge at 100 and 1000 Hz, the DC
skin resistance was shown to be linearly proportional to the inverse of the tritiated
water permeability coefficient. This result supports the hypothesis that water
diffuses, to at least some significant extent, through the same polar pathway as
ions.

v
The findings of this work illustrate the value of measuring impedance over
a range of frequencies to examine skin barrier function. By analyzing the
impedance spectrum, previously used methods of interpreting skin impedance
measurements, especially for estimating the effective capacitance and DC
resistance, were shown to not always reflect the true electrical properties of the
skin. Also, insight into the mechanisms of chemical and physical damage can be
deduced from a more complete analysis of the impedance spectrum.

vi
TABLE OF CONTENTS
ABSTRACT ..................................................................................................... iii
LIST OF FIGURES............................................................................................... x
LIST OF TABLES ...............................................................................................xvi
ACKNOWLEDGEMENTS................................................................................. xviii
CHAPTER 1 INTRODUCTION.......................................................................... 1
1.1 Structure of Human Skin..................................................................... 3
1.2 Dermal Absorption .............................................................................. 4
1.3 Chemical Flux Through Skin............................................................... 6
1.4 Electrical Properties of Skin ................................................................ 9
1.5 Impedance Spectroscopy ................................................................. 12
1.6 Error Analysis of Impedance Data .................................................... 19
1.7 Thesis Overview ............................................................................... 29
REFERENCES................................................................................................... 32
CHAPTER 2 A CRITICAL ANALYSIS OF SINGLE-FREQUENCY LCR
DATABRIDGE IMPEDANCE MEASUREMENTS OF HUMAN
SKIN........................................................................................... 35
2.1 Introduction ....................................................................................... 36
2.2 Theory............................................................................................... 40
2.3 Materials and Methods...................................................................... 44
2.3.1 Dummy Cell......................................................................... 44
2.3.2 Chemicals and Materials ..................................................... 45
2.3.3 Skin Impedance .................................................................. 46

vii
2.4 Results and Discussion..................................................................... 47
2.4.1 Dummy Cell Measurements ................................................ 47
2.4.2 Application to Human Skin .................................................. 49
2.4.3 Estimation of Skin Resistivity .............................................. 53
2.4.4 Application for Assessing Skin Integrity .............................. 60
2.4.5 Comparison to the Literature............................................... 65
2.5 Conclusions ...................................................................................... 66
REFERENCES................................................................................................... 67
APPENDIX ................................................................................................... 70
CHAPTER 3 SINGLE-FREQUENCY IMPEDANCE MEASUREMENTS AS
PREDICTORS OF HUMAN SKIN PERMEABILITY TO
WATER AND OTHER HYDROPHILIC COMPOUNDS .............. 72
3.1 Introduction ....................................................................................... 73
3.2 Theory............................................................................................... 78
3.2.1 Skin Impedance ............................................................................. 78
3.2.2 Skin Permeability ................................................................ 80
3.2.3 Relationship Between Skin Impedance and Permeability ... 81
3.3 Materials and Methods...................................................................... 82
3.4 Results and Discussion..................................................................... 87
3.4.1 Application to Tritiated Water .............................................. 88
3.4.2 Application to Polar Compounds......................................... 95
3.4.3 Application to Tests of Skin Integrity ................................... 98
3.5 Conclusions ...................................................................................... 99
viii
REFERENCES................................................................................................. 101
CHAPTER 4 CHARACTERIZATION OF DMSO DAMAGED SKIN AND
PINHOLE DAMAGED SKIN BY IMPEDANCE
SPECTROSCOPY ................................................................... 104
4.1 Introduction ..................................................................................... 105
4.2 Theory............................................................................................. 108
4.2.1 Skin Impedance Models.................................................... 108
4.2.2 Graphical Representations of Impedance ......................... 114
4.3 Materials and Methods.................................................................... 116
4.3.1 Chemicals and Materials ................................................... 116
4.3.2 Impedance-Diffusion Cell Apparatus................................. 117
4.3.3 Analytical Instruments ....................................................... 117
4.3.4 Experimental Procedures.................................................. 118
4.3.4.1 DMSO Experiments............................................. 118
4.3.4.2..Pinhole Experiments............................................ 120
4.3.4.3 Steady-State Flux Determination......................... 121
4.3.4.4 Solution Resistivity of PBS .................................. 121
4.3.5 Regression........................................................................ 122
4.4 Results and Discussion................................................................... 124
4.4.1 DMSO Experiments .......................................................... 128
4.4.2 Pinhole Experiments ......................................................... 147
4.5 Conclusions .................................................................................... 157
REFERENCES................................................................................................. 160

ix
APPENDIX ................................................................................................. 163
CHAPTER 5 SUMMARY OF FINDINGS AND RECOMMENDATIONS ........ 164
5.1 Summary of Findings ...................................................................... 164
5.2 Recommendations for Future Work ................................................ 170
REFERENCES................................................................................................. 176
APPENDIX ................................................................................................. 177

x
LIST OF FIGURES
Figure 1.1 A schematic diagram illustrating the diffusion of a lipophilic compound from a donor solution to the systemic circulation via a tortuous path through the lamellar lipids ...................................... 5
Figure 1.2 Plots of permeability as a function of resistance for (a) urea (logKo/w = -2.11) and (b) corticosterone (logKo/w = 1.94) reproduced from Peck et al. (1995)............................................... 11
Figure 1.3 Two equivalent circuit models that have been used to model skin impedance. The R-C circuit (top) is a parallel resistor (Rm) and capacitor (C) in series with an electrolyte resistance (Re). The R-CPE circuit (bottom) is similar to the R-C circuit except that a constant phase element (CPE) replaces the capacitor ....... 15
Figure 1.4 The impedance-plane plots of the experimental R-C circuit
(half-filled circles, Re = 0.100 kΩ, Rm = 115 kΩ and C = 47 nF) and the theoretical R-CPE circuit with the same characteristic
frequency (Re =0.100 kΩ, Rm = 115 kΩ, α = 0.80 and Q = 20.9 nF, which corresponds to Ceff = 47 nF calculated using Eq. (1.28)). The filled circles designate impedance at 1, 10, 100 and 1000 Hz.................................................................................. 19
Figure 1.5 The standard deviation of the real (circles) and imaginary (triangles) residual errors for eight impedance scans of human split-thickness skin plotted as a function of frequency. The dashed curve represents the regression of Eq. (1.37) o the real and imaginary residual errors........................................................ 25
Figure 1.6 The results of the Voigt measurement model regressed to the imaginary part of a typical skin impedance spectrum plotted as a function of frequency. The circles are the imaginary part of the impedance of the scan. The solid curve is the regression result. The dashed curves represent the 95.4% confidence interval for the model..................................................................... 26
Figure 1.7 The real part of a typical impedance spectrum plotted as a function of frequency (circles). The solid curve represents the real part of the impedance predicted by the parameters from the regression fit to the imaginary part of the impedance spectrum shown in Figure 1.6. The dashed curves represent the 95.4% confidence interval for the model ................................. 27

xi
Figure 1.8 The relative residual errors for the regression fit of the measurement model to the imaginary part of the impedance data plotted as a function of frequency. The circles represent the relative residual errors of the regression as a function of frequency. The dashed curves represents the 95.4% confidence interval for the model obtained by Monte Carlo simulation using the calculated confidence intervals for the estimated parameters ................................................................... 28
Figure 1.9 The relative residual errors for the real part of the impedance that is predicted by regression of the Voigt measurement model to the imaginary part of the impedance spectrum. The circles represent the relative residual errors of the real part of the regression as a function of frequency. The dashed curves represents the 95.4% confidence interval for the model obtained by Monte Carlo simulation.............................................. 29
Figure 2.1 A simple R-C circuit model of skin ................................................ 43
Figure 2.2 RPAR and RSER measured by the Tinsley LCR databridge at 100 and 1000 Hz compared with Zr and 1/Yr spectra measured
by the Gamry potentiostat for the dummy cell (Re = 100 Ω,
Rskin = 115 kΩ, Cskin = 47 nF) ........................................................ 48
Figure 2.3 CPAR and CSER measured by the Tinsley LCR databridge
compared with Yj /ω and -1/ωZj spectra measured by the
Gamry potentiostat for the dummy cell (Re = 100 Ω, Rskin = 115
kΩ, Cskin = 47 nF) .......................................................................... 49
Figure 2.4 Area-normalized values of RSER (open symbols) and RPAR (filled symbols) calculated from the complex impedance measured with the Gamry potentiostat as a function of frequency for a high impedance skin sample (squares) and a low impedance skin sample (triangles) ......................................... 50
Figure 2.5 Area normalized values of CSER (open symbols) and CPAR (filled symbols) calculated from the complex impedance measured with the Gamry potentiostat as a function of frequency for a high impedance skin sample (squares) and a low impedance skin sample (triangles) ......................................... 52
Figure 2.6 Ratios of RPAR and RSER to the low frequency real impedance
(Zr,lf ≅ Rskin) plotted as a function of RPAR and RSER, respectively for 145 samples of human cadaver skin measured at 100 or 1000 Hz......................................................................................... 54

xii
Figure 2.7 Area-normalized values of CSER and CPAR calculated from the complex impedance of 145 cadaver skin samples measured using the Gamry potentiostat at either 100 or 1000 Hz and plotted as a function of (Zr,lf A)....................................................... 57
Figure 2.8 Area-normalized values of CSER calculated from the complex impedance of 145 cadaver skin samples measured using the Gamry potentiostat plotted as a function of the Zr,lf compared with CSER/A predicted by the R-CPE model circuit plotted as a function of Rskin for the mean value of Cskin,eff/A (solid curve) plus and minus one standard deviation (long and short dashed curves respectively) assuming a log mean distribution of Cskin,eff/A for the 145 skin samples shown in Figures 2.6 and 2.7: data compared with model at 100 Hz (a) and 1000 Hz (c); and model alone at 100 Hz (b) and 1000 Hz (d) ........................... 59
Figure 2.9 Schematic diagram illustrating the scheme for evaluating surrogate measurements for testing skin integrity......................... 62
Figure 2.10 Area-normalized values of RPAR calculated from the complex impedance of 145 cadaver skin samples measured at 100 Hz and 1000 Hz using the Gamry potentiostat plotted as a function of the (Zr,lf A). The solid lines were determined by linear regression and correspond to Eqs. (2.8) and (2.9) for the 100 Hz and 1000 Hz measurements, respectively ........................ 64
Figure 3.1 A simple R-CPE circuit model of skin............................................ 79
Figure 3.2 Tritiated water absorption at 1 h compared with absorption at 2
h for all samples with less than 10 µL/cm2 of water absorbed in 2 h. The line representing the best-fit linear regression of the data forced through the origin has a slope of 0.34 (r2 = 0.86) ....... 88
Figure 3.3 (RPAR⋅A) measured at 100 and 1000 Hz plotted as a function of the inverse kp for tritiated water determined in this study (circles) compared to data reported by Davies et al. (2004) and
Fasano et al. (2002) for (RPAR⋅A) measured at 100 and 1000 Hz, respectively (triangles). For Davies et al. measurements collected on whole skin and heat separated human epidermal membrane are distinguished by filled and open triangles, respectively. The curves represent the theoretical relationship
for (RPAR⋅A) versus 1/kp described by Eq. (3.9) for the value of
b (63 Ω cm3/h) that minimized the sum of the square residuals
for all the data assuming α is 0.8 and Cskin,eff is 39.8 nF/cm2, which is the log-mean average determined in the multi-frequency impedance study of White et al. (2011) ........................ 89

xiii
Figure 3.4 A comparison of (RPAR⋅A) versus (Rskin⋅A) data (small filled circles) from the multi-frequency impedance study of White et
al. (2011) with (RPAR⋅A) measured at 100 and 1000 Hz versus b/kp data from three different laboratories (open circles) for b
equal to 63 Ωcm3/h: (a) Charles River data measured at 100 Hz, (b) Charles River data measured at 1000 Hz, (c) Davies et al. (2004) data measured at 100 Hz, and (d) Fasano et al. (2002) data measured at 1000 Hz. The theoretical relationship
for (RPAR⋅A) plotted as a function of (Rskin⋅A) was calculated
using Eq. (3.4) for α equal to 0.8 and Cskin,eff /A equal to 39.8 nF/cm2 (solid curves), 75.8 nF/cm2 (dot-dashed curves), and 20.2 nF/cm2 (dashed curves), which represent the mean and plus and minus one standard deviation of log(Cskin,eff /A) determined in the multi-frequency impedance study of White et al. (2011)....................................................................................... 94
Figure 3.5 (Rskin A) plotted as a function of 1/kp for urea (diamonds) measured at 27oC and 39oC (Peck et al., 1995) and for mannitol (squares) measured at 23oC (Tang et al., 2001). The solid lines have a slope of 1 and intercepts, log(b), equal to (log(Rskin A) – log (1/kp)) averaged over all data for each
chemical: b is 4.9 Ω cm2 and 1.4 Ω cm2 for urea and mannitol, respectively. For comparison, the best-fit linear regressions to
the data (dashed lines) are included: for urea, log[(Rskin A), kΩ
cm2] = 0.93 log[1/(1000 kp), h/cm] + log(5.5 Ω cm2), r2 = 0.95;
for mannitol, log[(Rskin A), kΩ cm2] = 1.01 log[1/(1000 kp), h/cm]
+ log(1.4 Ω cm2), r2 = 0.91 ............................................................ 97
Figure 4.1 Diagrams of equivalent circuit models: (a) 1-time-constant model, (b) 2-time-constant model, (c) pinhole model, and (d) fraction-damaged model ............................................................. 109
Figure 4.2 Diagram of stratum corneum that is partially damaged after exposure to DMSO on both sides. The dashed lines represent distinct and uniform boundaries between damaged and undamaged layers that may not actually exist ............................ 112
Figure 4.3 Impedance spectra calculated using either the fraction-damaged model for varying xd/L or the pinhole model for varying numbers of holes. The model parameters are typical
of those observed for human skin impedance: Rs A = 167.0 kΩ
cm2, Rd A = 1.36 kΩ cm2, αs = 0.682, αd = 0.81, fc,s = 51 Hz and fc,d = 5640............................................................................. 126

xiv
Figure 4.4 Three representations of the impedance plotted as a function of the frequency before and after skin is treated with DMSO for 0.25 and 1 h: (a) area normalized real part of the impedance, (b) area normalized imaginary part of the impedance, and (c) first derivative of the area normalized imaginary part of the impedance .................................................................................. 129
Figure 4.5 Impedance spectra after skin samples were treated with DMSO for 0.25, 0.5, 0.75 and 1 h, which corresponds to experiments G, H, I and J, respectively: (a) area normalized real part of the impedance, (b) area normalized imaginary part of the impedance, and (c) first derivative of the area normalized imaginary part of the impedance .............................. 131
Figure 4.6 Example impedance spectra of skin before and after DMSO treatment for 0.25 h and 1 h compared to equivalent circuit models: (a) area normalized real part of the impedance, (b) area normalized imaginary part of the impedance, and (c) impedance plane (Nyquist) plot with characteristic frequencies noted. The solid lines represent the total impedance derived by regression of the 1-time-constant model to data measured before DMSO and after DMSO treatment for 1 h, and regression of the 2-time-constant model to the data measured after DMSO treatment for 0.25 h. The dot-dashed lines and the dashed lines represent respectively the impedance of the undamaged and damaged skin fractions after DMSO treatment for 0.25 hr.................................................................................... 139
Figure 4.7 The first derivative of the logarithm of (-Zj A) with respect to the logarithm of frequency plotted as a function of the average frequency for skin that has been treated with DMSO for 0.25 and 1 h compared respectively to the 2-time-constant (solid lines) and the 1-time-constant (dashed lines) models ................. 141
Figure 4.8 The after-to-before treatment ratio of the characteristic frequencies estimated for the undamaged and damaged layers of skin treated with DMSO for 0.25 h compared to skin treated with PBS and with DMSO for 1 h. The dashed line indicates the mean value of the ratio for all of the PBS control experiments (fc,s/fc,s before = 1.1), and the solid line represents the mean value of the ratio for skin treated with DMSO for 1 h DMSO experiments (fc,d/fc,s before = 94)......................................... 143
Figure 4.9 The fraction damaged plotted as a function of the square root of treatment time for the time-course study (triangles) and the 0.25 h DMSO experiments listed in Table 4.4 (diamonds) .......... 146

xv
Figure 4.10 Typical impedance spectra measured before (point-up triangles) and after (point-down triangles) pinhole (subject IV): (a) area normalized real part of the impedance, (b) area normalized imaginary part of the impedance, and (c) impedance plane (Nyquist) plot with characteristic frequencies noted with diamonds ................................................................... 152

xvi
LIST OF TABLES
Table 1.1 Typical circuit elements and corresponding impedance................ 14
Table 2.1 Equations for the PAR and SER modes of R and C for the R-C model circuit shown in Figure 1..................................................... 44
Table 2.2 Performance of (RPAR A) at 100 Hz and 1000 Hz and (CSER/A) at 100 Hz as surrogate criteria for (Rskin A) in testing skin integritya ........................................................................................ 63
Table 3.1 Recommended values of area normalized electrical resistance (R A) for testing human skin integrity for in-vitro determinations of chemical permeation ................................................................. 76
Table 3.2 (RPAR A) and kp data from four different laboratories..................... 91
Table 3.3 Calculated values of the 1-h absorption, (Rskin A), and (RPAR A) determined at 100 Hz and 1000 Hz corresponding to different values of tritiated water permeability ............................................. 99
Table 4.1 Parameters of the 1-time-constant model derived by regression to impedance spectra before and after PBS (control) treatments for 0.25 and 1 h and DMSO treatment for 1 h ............................................................................................... 133
Table 4.2 Mean values of the parameters of the 1- time-constant model derived by regression to impedance spectra measured before and after PBS (control) treatments for 0.25 and 1 h and DMSO treatment for 1 h compared to mean values before all treatments ................................................................................... 136
Table 4.3 Parameters of the 2-time-constant model derived by regression to impedance spectra from skin after DMSO treatment for 0.25 h..................................................................... 137
Table 4.4 Estimated values for the fraction damaged (xd/L) and model parameters of the damaged and undamaged skin layers for skin treated with DMSO for 0.25 h .............................................. 144
Table 4.5 Estimates of the area normalized total skin resistance before and after DMSO treatment for the time-course study.................. 145
Table 4.6 Comparing the steady-state flux of PCNB (µg/cm2/h) measured before and after treatments with DMSO and PBS (control) for 0.25 and 1 h............................................................. 148

xvii
Table 4.7 Parameter values of the 1-time-constant model regressed to skin data before and after pinhole and estimates of the pinhole resistance and diameter.............................................................. 150
Table 4.8 Parameter values of the 1-time-constant model regressed to skin data for the control sample in the pinhole experiment ......... 153
Table 4.9 Comparing predictions and experimental values for the ratio of the characteristic frequencies after to before skin is punctured with a needle............................................................................... 156
Table 4.10 Steady-state flux of 4-CP (µg/cm2/h) before and after pinhole .... 158
Table 5.1 Interpretation of the LCR databridge measurements in terms of the complex impedance (Z) and admittance (Y) ......................... 168

xviii
ACKNOWLEDGMENTS
I would like to extend my sincere gratitude to my co-advisors
Annette L. Bunge and Mark E. Orazem for the opportunity to pursue this
Ph.D under their supervision. I owe the success of this project to their
patience, support, knowledge and commitment to excellence. I especially
thank Dr. Bunge for her extraordinary help in writing this thesis and for her
guidance in conducting the experiments. I also thank the members of my
committee: Dr. J. Douglas Way, Dr. Andrew M. Herring, Dr. Ryan
O’Hayre, and Dr. William C. Navidi for their feedback.
I thank Alan Horne, Jill Runciman, Clive S. Roper from Charles
River Preclinical Services Edinburgh Limited for their contributions to this
thesis.
I acknowledge funding support from the National Institute of
Occupational Safety and Health and from the Colorado School of Mines.
I thank my lovely wife Kelly Keefer for her patience,
encouragement, love and support throughout this long journey. I couldn’t
have done it without her.
Finally, I would like to thank my parents, Al and Nancy for their love
and support in everything I undertake. They have instilled the curiosity
and values required to complete this huge undertaking.

1
CHAPTER 1
INTRODUCTION
Human skin is a large and complicated organ. It is comprised of several
layers each with different properties. The outer most layer, the stratum corneum
(sc), is the primary barrier to permeation into and out of the body for many
chemicals and is the main focus of this research. Unless stated otherwise in this
thesis the word skin will refer to the sc. The sc is a formidable but not a perfect
barrier to chemicals. The skin’s excellent barrier properties are attributed to its
composite structure. The sc can be visualized with a brick and mortar model
where dead skin cells, corneocytes, are the bricks and a matrix of lamellar lipids
form the mortar. It is widely accepted that chemical flux through the sc is a
solution-diffusion process; however, the pathway of diffusion is still debated
(Kasting et al., 2003; Wang et al., 2006, 2007).
The sc varies in thickness and composition with body region and between
persons. To control for skin variability, one approach is to study permeation
through skin from many subjects, but this is costly and time consuming. In skin
penetration studies it is often difficult to distinguish between natural skin
variability and actual damage. A common test for skin damage, also refered to
as a skin integrity test, is to measure the permeability of tritiated water prior to or
during the permeation experiment of the compound of interest. An ‘acceptable’
permeability of tritiated water is chosen above which the skin sample is deemed
damaged and therefore unsuitable for permeation studies. This may result in an

2
unrepresentative sample population by discarding samples that are undamaged
but have naturally high tritiated water permeability. Also, for samples with
acceptable values of water permeability, the permeability of lipophilic compounds
from water generally do not correlate with water permeability. This lack of
correlation is attributed to a different pathway for skin permeation by lipophilic
compounds than the pathway for polar compounds(Tang et al., 2002).
Single frequency impedance measurements are increasingly replacing
tritiated water permeability measurements as skin integrity tests because they
are inexpensive and quick compared to tritiated water permeability
measurements. In these experiments, a value for skin impedance above which
skin is deem acceptable is often chosen by comparing impedance
measurements with established acceptance criteria for tritiated water
permeability. A complication of single frequency impedance measurements is
that the dielectric material in the skin causes the impedance to be a complex
number that varies with the measurement frequency. As a result, except for
measurements at low frequency, the relationship between single frequency
impedance measurements and water permeability is nonlinear as observed by
Fasano et al., (2002).
Chapters 2 and 3 of this thesis focus on the interpretation of single
frequency impedance measurements made with a particular instrument, called
the LCR data bridge, and the relationship between those measurements and the
permeability coefficients of tritiated water and two hydrophilic compounds: urea
and mannitol. In Chapter 4 the skin impedance measurements collected over a

3
range of frequencies are used to quantify the electrical properties of skin before
and after skin is damaged either chemically or mechanically. These results are
then compared with the steady-state flux of non-polar compounds through skin.
This chapter provides additional background and theory relevant to
Chapters 2, 3 and 4, which because they are written in journal format, only
contain brief descriptions of the most relevant background and theory. This
chapter provides more detailed descriptions of the structure of human skin, the
theory of dermal absorption, a model for chemical flux through skin, and the
electrical properties of skin and impedance spectroscopy including the theory
and modeling of impedance measurements. The last section is an overview of
Chapters 2, 3 and 4.
1.1 Structure of Human Skin
Human skin is comprised of two macroscopic layers; the dermis is the
inner layer and the epidermis is the outer layer. The dermis is a vascularized,
essentially acellular layer approximately 1-2 mm thick (Rushmer et al., 1966) that
contains hair follicles, muscles, sweat glands, sebaceous glands and blood
vessels. The hair follicles and sweat glands, which occupy only 0.1-1% of the
total skin surface area (Chien et al., 1989), originate in the dermis and penetrate
through the epidermis. Blood vessels within the dermis provide a route to the
systemic circulation for chemical to be cleared from the dermis.
The epidermis consists of two distinct avascular layers. The outermost
layer, the sc, is a highly ordered, lipophilic layer of essentially dead cells. Below
the sc is a hydrophilic layer of living cells called the viable epidermis (ve).

4
The sc is made of wide (20-40 µm), thin (~1 µm), and pentagonal or
hexagonal shaped cells called corneocytes. The corneocytes have a dense cell
wall of cross-linked proteins within which there are keratin filaments that are
hydrophilic yet insoluble in water. Cells from healthy skin are exfoliated from the
surface of the sc at a rate of about one cell layer per day, and replaced from the
lower layers of the ve at the same rate to maintain a relatively constant sc
thickness (10-40 µm).
The sc corneocytes are surrounded by highly organized lipid. The lipids
are primarily made up of ceramides, saturated free fatty acids and cholesterol.
The wall of the corneocytes contains covalently bound lipids that interact with the
lipid bilayers which contributes to the mechanical strength of the sc (Wertz et al.,
1989).
1.2 Dermal Absorption
Chemical penetration through the epidermis occurs via passive Fickian
diffusion. Diffusion coefficients through the highly organized sc are much smaller
than through the less organized ve. Thus, except for highly lipophilic solutes,
which have low solubility in the hydrophilic ve, the sc controls the penetration of
most chemicals through the skin.
Polar and ionic compounds appear to permeate the skin by a different
path than nonpolar or lipophilic compounds. It has been argued that polar and
ionic compounds permeate skin through a polar pathway at rates that depend
primarily on molecular size, while non-polar compounds permeate through a non-
polar pathway at rates that depend on both molecular size an lipophilicity (i.e.,

5
more lipophilic compounds permeate faster than less lipophilic compounds of the
same size) (Kasting et al., 1992). The lipopilicity of a compound is often
described by the octanol-water partition coefficient ( o/wK ). It is possible that
lipophilic molecules diffuse through the sc via the extracellular lipids rather than
through the water-filled corneocytes (Michaels et al., 1975). The schematic
diagram in Figure 1.1 illustrates chemical permeation through the lipid bilayers
surrounding the corneocytes into the dermis where it is cleared by the blood.
viableepidermis
Blood
Chemical in vehicleextracellularlipid layers
dermis (vascularized)
stratum corneumkeratin filled
corneocytes
10-20 µm
100-200 µmviable
epidermis
Blood
Chemical in vehicleChemical in vehicleextracellularlipid layers
dermis (vascularized)
stratum corneumkeratin filled
corneocytes
10-20 µm
100-200 µm
Figure 1.1 A schematic diagram illustrating the diffusion of a lipophilic compound from a donor solution to the systemic circulation via a tortuous path through the lamellar lipids.
In most cases solutes must first dissolve into the outermost layer of the sc
before it can diffuse through the sc. Penetration of solutes in the sc is slow
compared to diffusion of most compounds in liquids; thus, it is generally correct
to assume equilibrium between the solvent and the outermost layer of the sc.
Permeation through the epidermis to the dermis is usually slow relative to
clearance by the blood, resulting in low concentrations of the solute in the

6
dermis. For this reason, the dermis is often assumed to be a perfect sink for
permeation across the epidermis.
Several chemicals are known to alter the barrier function of human sc.
For example, Kurihara-Bergstrom demonstrated that dimethyl sulfoxide (DMSO)
alters the barrier function of full-thickness excised skin (sc, ve and dermis) from
hairless mouse by eluting sc lipids, and perhaps also by delaminating the sc and
denaturing the sc proteins. However, when mixed with saline, DMSO had to
exceed 50% strength (w/v) to alter the skin. In solutions containing 50% or less
DMSO, the dermal absorption rates after adjusting for differences in
thermodynamic activity were independent of DMSO concentration for methanol,
1-butanol and 1-octanol, which exhibit a wide range of octanol-water partitioning.
1.3 Chemical Flux Through Skin
The sc can be assumed to behave as a pseudo-homogeneous, isotropic
membrane (Kasting et al., 1992). Under these conditions transport through the
sc is described by Fick’s second law
2
2 0
C CD x L
t x
∂ ∂= > >
∂ ∂ (1.1)
where C is the concentration of the solute within the sc, D is the effective
diffusivity of the solute in the sc and L is the thickness of the sc. If initially there
is no chemical within the skin then the initial condition is
0 0 0t C x L= = < < . (1.2)
Assuming equilibrium between the solution in contact with the outermost layer of
the sc, the vehicle, also called the donor solution, then:
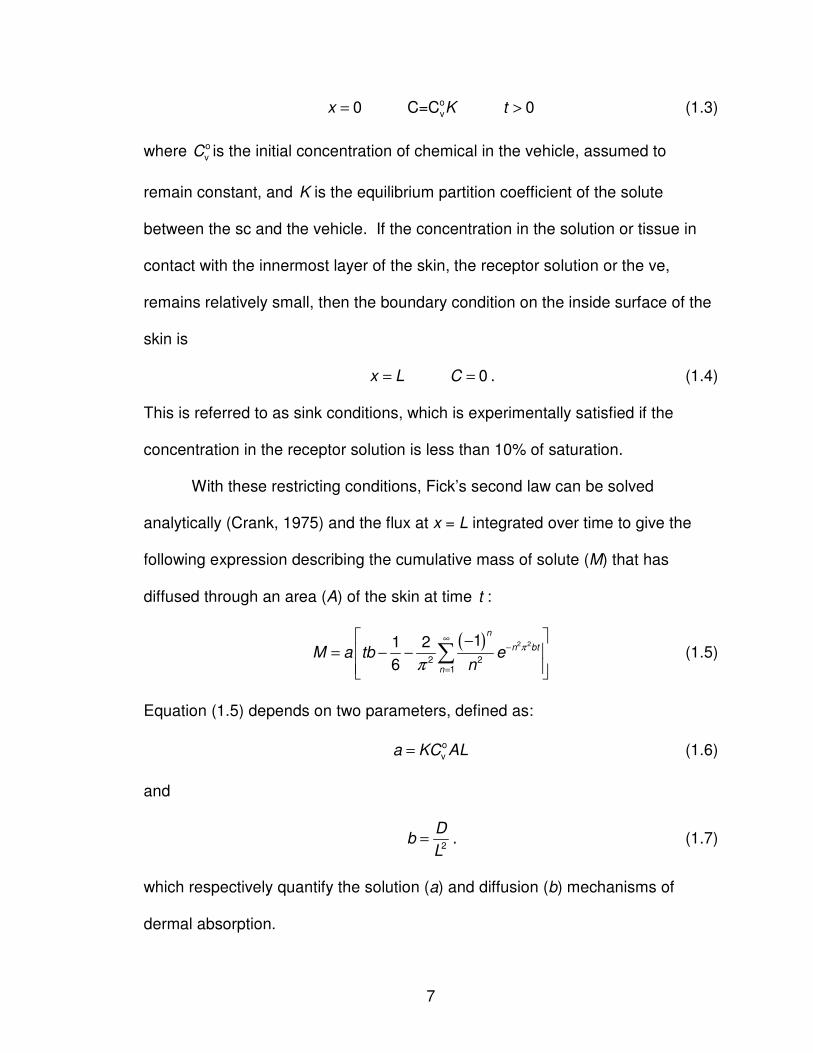
7
o
v0 C=C 0x K t= > (1.3)
where o
vC is the initial concentration of chemical in the vehicle, assumed to
remain constant, and K is the equilibrium partition coefficient of the solute
between the sc and the vehicle. If the concentration in the solution or tissue in
contact with the innermost layer of the skin, the receptor solution or the ve,
remains relatively small, then the boundary condition on the inside surface of the
skin is
0x L C= = . (1.4)
This is referred to as sink conditions, which is experimentally satisfied if the
concentration in the receptor solution is less than 10% of saturation.
With these restricting conditions, Fick’s second law can be solved
analytically (Crank, 1975) and the flux at x = L integrated over time to give the
following expression describing the cumulative mass of solute (M) that has
diffused through an area (A) of the skin at time t :
( ) 2 2
2 21
11 2
6
n
n bt
n
M a tb en
π
π
∞−
=
−= − −
∑ (1.5)
Equation (1.5) depends on two parameters, defined as:
o
va KC AL= (1.6)
and
2
Db
L= . (1.7)
which respectively quantify the solution (a) and diffusion (b) mechanisms of
dermal absorption.

8
In diffusion cell experiments, excised skin is clamped between two
chambers, one containing the donor solution and the other the receptor solution,
which is kept close to sink conditions. In these experiments, concentration is
measured in the receptor chamber solution from which the cumulative mass
permeated is calculated. Eq (1.5) can be regressed to the cumulative mass as a
function of time using the terms in the infinite series that contribute significantly.
The lag time (tlag) is calculated as
2
lag
1
6 6
Lt
D b= = (1.8)
and the permeability coefficient (P) is calculated as
o
v
KD abP
L AC= = (1.9)
Note that here, as in most literature on skin penetration, the permeability
coefficient is a function of the skin thickness. In other membrane literature P is
called permeance.
After a delay that is approximately 2.4 times the tlag, M in the receptor
solution increases linearly with t (Bunge et al., 1995a). The rate that M per unit
skin area (i.e. M/A) increases after 2.4 tlag is the steady-state flux (Jss) and is
calculated from parameters a and b by Eq. (1.10)
ss
abJ
A= (1.10)
If there is not sufficient data early in the experiment to model the rate of
appearance of M in the receptor solution during transient period, Jss and tlag are

9
derived from regression of Eq. (1.11) to data in the linear portion of the M/A
versus t curve.
ss ss lag/M A J t J t= − for t > 2.4 tlag (1.11)
The slope of the regression line is Jss and tlag is the ratio of the intercept to the
Jss. Experimental estimates for Jss derived by linear regression to Eq. (1.11) will
be systematically lower than the actual value for Jss if measurements of M/A at
times less than about 2.4 tlag are included in the linear regression (Bunge et al.,
1995b).
1.4 Electrical Properties of Skin
Electrical resistivity (ρ) is the intrinsic material property that characterizes
the flux of ions through the the sc. Resistivity, which has units of Ω-cm, is related
to the DC resistance of the skin membrane (Rm) as:
mR A
Lρ = (1.12)
where A is the area of the skin measured and L is the thickness of the sc barrier,
which is not normally known. It is convenient, therefore, to report the product of
ρ and L, which is equal to Rm⋅A and has units of Ω cm2. Thus, measurements of
the ionic transport barrier of skin samples should be represented by the DC
resistance multiplied by the sample area. Because skin is a heterogeneous
membrane, (Rm A) is proportional to the average resistivity over the area of the
skin sampled.

10
Likewise, the dielectric constant (ε), which is non-dimensional, is the
intrinsic property of a membrane like the sc that has a capacitive component.
The value of the effective capacitance (Ceff) is related to the dielectric constant by
oeff
AC
L
ε ε= (1.13)
where εo = 8.8542 x 10⁻⁵ nF/cm is the permittivity of vacuum. As with resistivity,
since L is not known, it is typical to report εεo / L which is equal to Ceff / A with
units of nF / cm2.
Mass transfer across the sc is through either polar or non-polar pathways
depending upon the o/wK of the penetrating molecule (Bennett and Barry, 1985).
This is supported by experiments that show that the electrical resistance of skin
is linearly related to the permeability of ionic and polar compounds (Burnette and
Bagniefski, 1988; DeNuzzio and Berner, 1990; Oh et al., 1993). For example, as
shown in Figure 1.2, the permeability of a polar compound (urea) is correlated
with skin resistance while the permeability of a lipophilic compound
(corticosterone) is independent of skin resistance. Since resistance measures
the inverse of ionic mobility, decreasing values of resistance should correspond
with easier penetration though the polar pathway. Further, the lack of correlation
between the lipophilic compound and the resistance suggests that the lipophilic
compound takes a different path than the charge conducting species.
Investigators have suggested that the skin capacitance arises from the
highly ordered sc lipid layers (the major component of the lipophilic pathway),

11
which act as the dielectric material in the skin (DeNuzzio and Berner, 1990; Oh et
al., 1993).
Figure 1.2 Plots of permeability as a function of resistance for (a) urea (logKo/w = -2.11) and (b) corticosterone (logKo/w = 1.94) reproduced from Peck et al. (1995).
Several studies have been conducted in which the skin was treated in such a
way that the lipid structure was altered and the impedance was measured. For
example, Kim and Oh (2011) applied non-ionic surfactants that were thought to
increase the fluidity of the sc lipids to hairless mouse skin and observed an
increase in skin capacitance. They also found that the surfactant treatment
enhanced penetration of a nonpolar drug, ketoprofen, suggesting that
capacitance may characterize the lipid pathway. Oh et al. (1993) found that the
capacitance of hairless mouse skin increased with increasing temperature
(between 20° C and 60° C) while the resistance decreased. They attributed the
increase in skin capacitance to changes in the intercellular lipids presumed to be
related to increased lipid fluidity and the decrease in skin resistance at elevated
temperatures to the increased ionic mobility. They observed that at the gel-to-

12
liquid crystalline phase transition temperature of hairless mouse skin the
impedance became indistinguishable from that of the electrolyte solution (Oh et
al., 1993).
1.5 Impedance Spectroscopy
Skin impedance (Z) is measured by applying a small-amplitude oscillating
current or potential signal across the skin and measuring the responding
potential or current. The impedance is the ratio of the change in potential (V) to
the change in current (I). Electrical resistance (R) is the direct current (DC)
analog to Z. Like R, Z has units of Ohms (Ω) and is an extrinsic property, which
depends on the area (A) and thickness (L) of the sample as well as the skin
resistivity (ρ). Skin impedance also depends on the frequency of the applied
signal. Measuring the impedance of a sample over a range of frequencies is
called impedance spectroscopy.
The time variation, also known as the waveform, of the modulated signal
can have different shapes, although sinusoidal variations are common. For
potentiostatic impedance, the sinusoidal time oscillation of the potential (or
voltage) E can be described as:
( )o( ) cos 2E t E f tπ= (1.14)
where t is time, and Eo is the amplitude and f is the frequency, respectively of the
potential signal. The current response to this oscillating potential is expressed
as:
( ) ( )o cos 2I t I f tπ φ= − (1.15)

13
where φ is the phase shift and Io is the amplitude of the measured current
response signal. The impedance (Z) is related to the potential and current by
Ohms law (i.e., Z = E / I ). Thus,
( )
( )o o
o o
cos 2
cos 2
j jE f t E
Z e Z eI f t I
φ φπ
π φ= = =
− (1.16)
in which |Z| is the frequency-dependent magnitude (i.e., the modulus) of the
impedance and j = 1− . Using Euler’s relationship,
( )cos sinje jφ φ φ= + (1.17)
the impedance can be written as the sum of real and imaginary components (Zr
and Zj, respectively):
r jZ Z j Z= + (1.18)
where
r jcos and sinZ Z Z Zφ φ= = (1.19)
are related to the modulus and phase as follows:
2 2
r jZ Z Z= + (1.20)
j
r
arctanZ
Zφ = (1.21)
If the phase shift is zero, the impedance of the system is independent of the
applied frequency and only a function of the amplitude of the perturbation (i.e.
o oZ E I= ). This occurs for systems that only contain ideal resistors.
In general, non-zero values for the phase shift arises from time-dependant
processes within the system. In skin the phase shift is likely due to a

14
capacitance that arises from the polarization and subsequent relaxation of the
insulating material within the skin (DeNuzzio and Berner, 1990; Yamamoto and
Yamamoto, 1976b).
Impedance measurements from physical systems like skin are commonly
interpreted by relating them to the impedance that would arise from an electrical
circuit, called an equivalent circuit model, comprised of passive elements that
represent the impedance of the skin. Circuit elements that are commonly used in
models applied to skin are a resistor (with resistance R), a capacitor (with
capacitance C), and a constant-phase element (CPE) that is characterized by the
parameters Q and α. The functional form of the impedance (Z) that arises from
each of these elements is summarized in Table 1.1. The impedance of the
resistor is independent of the frequency, while, as mentioned above, the
impedance for the capacitor and the constant phase element (CPE) vary with
frequency. Thus, the system resistance affects the magnitude of the impedance
signal while components that behave like a capacitor or CPE affect the phase
angle of the signal.
Table 1.1 Typical circuit elements and corresponding impedance
Element Symbol Impedance
Resistor R
Capacitor
1
j Cω
Constant Phase
Element ( )
1
Q jα
ω

15
Often, the equivalent circuit model required to represent the observed
impedance-frequency response involves two or more circuit elements connected
in either series or parallel. For circuits containing a number of elements (n) in
series, the total impedance is the sum of the impedances as represented by Eq.
(1.22).
1
n
ii
Z Z=
=∑ (1.22)
For circuits with n elements in parallel, the reciprocal of the total impedance is
the sum of reciprocals of the impedances as in Eq. (1.23).
1
1 1n
i iZ Z=
=∑ (1.23)
The diagrams of two equivalent circuits that have been used to model skin
impedance are displayed in Figure 1.3. The R-C circuit is comprised of a parallel
resistor (Rm) and capacitor (C) that represent the skin membrane, in series with a
resistor (Re) representing the electrolyte resistance. The R-CPE circuit is similar
to the R-C circuit except that the capacitor is replaced with a CPE.
RmRm
C
RmRmRm
C
Figure 1.3 Two equivalent circuit models that have been used to model skin impedance. The R-C circuit (left) is a parallel resistor (Rm) and capacitor (C) in series with an electrolyte resistance (Re). The R-CPE circuit (right) is similar to the R-C circuit except that a constant phase element (CPE) replaces the capacitor.

16
Expressions describing the complex impedance for the R-C and R-CPE
circuits depicted in Figure 1.3 are given in Eqs. (1.24) and (1.25), respectively.
( )m
e
m1 2
RZ R
R C f jπ= +
+ (1.24)
( )m
e
m1 2
RZ R
R Q f jα
π= +
+ (1.25)
The R-C circuit is characterized by a single characteristic frequency (fc)
c
m
1
2f
R Cπ= (1.26)
which has units of Hz.
CPE behavior is attributed to a normal distribution of relaxation processes,
characterized by the parameter α, which, for skin, is a number less than or equal
to 1. If α is 1, then the R-CPE circuit is equivalent to the R-C circuit.
The R-CPE circuit represents the skin impedance better than the R-C
circuit. This might be expected because the pathway for ions (and current)
through skin consists of multiple paths of varying length and area, combined with
the various sources of skin capacitance, which would result in a continuous
distribution of characteristic frequencies. Integration over the distribution of
characteristic frequencies results in the R-CPE equivalent circuit, which exhibits
a single characteristic frequency (i.e. fc,CPE) (Orazem and Tribollet, 2008;
Yamamoto and Yamamoto, 1976b).
( )
c,CPE 1
m
1
2f
R Qα
π= (1.27)

17
The CPE behavior of skin should be related to the dielectric constants and
geometric configurations of the sc components, which are not yet known, that
produce the frequency dependent impedance response. For the purpose of
comparing skin samples, it is convenient to estimate an effective capacitance
(Ceff). Hsu and Mansfeld (2001) suggested that because the characteristic
frequency of the R-CPE circuit is independent of α, an expression relating Ceff to
the R-CPE parameters Rm, Q and α can be derived by equating fc and fc,CPE (Eq.
(1.26) and Eq. (1.27) respectively) and substituting Ceff for C, resulting in Eq.
(1.28)
( )1
1
eff mC QRα
α−= (1.28)
As discussed in Chapter 4 of this thesis, estimates of Ceff for skin calculated
using Eq. (1.28) are unrealistically large by one or two orders of magnitude.
Recently, Hirschorn et al. (2010) demonstrated that the R-CPE behavior of
skin impedance is consistent with a power-law decay of resistivity with depth into
the skin while the dielectric constant is independent of position. There are
published experimental results supporting this possibility (Kalia et al., 1996;
Yamamoto and Yamamoto, 1976a). In this case, Ceff is defined as:
( )11 1
eff LC g Q Rα αα α −
= (1.29)
where RL is the resistance of the inner most interface of the dominant resistive
layer, which in this case is the stratum corneum, and the parameter g is defined
by Eq. (1.30).
( )2.375
1 2.88 1g α= + − (1.30)

18
Depending on the magnitude RL, which is always smaller than Rm, values for Ceff
estimated according to the Eq. (1.29) are more physically realistic than the Hsu
and Mansfeld approach.
It is convenient (and common) to present impedance-frequency data on
an impedance-plane plot (also called a Nyquist plot), which displays the negative
of the imaginary part of the impedance (-Zj) as a function of the real part of the
impedance (Zr) determined at each frequency. In Figure 1.4 an impedance plane
plot of the impedance measured for an actual R-C circuit, configured as shown in
Figure 1.3, is compared to the impedance of a theoretical R-CPE with the same
characteristic frequency as the R-C circuit. The R-C circuit was comprised of
resistors and capacitors such that Re = 0.100 ± 1% kΩ, Rm = 115 ± 1% kΩ and C
= 47 ± 20% nF (RadioShack, Ft. Worth, TX). The impedance was measured
under sinusoidal potentiostatic modulation, 10 mV rms perturbation, over a
frequency range of 0.1 Hz to 20 kHz. The impedance of the R-CPE circuit also
shown in Figure 1.4 was calculated using Eq. (1.25) with Re = 0.1 kΩ, Rm = 115
kΩ, α = 0.80 and Q = 20.9 nF, which corresponds to Ceff = 47 nF calculated using
Eq. (1.28). These values of Re, Rm and Q are typical to those observed in a
1.77-cm2 sample of human skin when α = 0.80 which is a reasonable value for
skin. In Figure 1.4, the solid circles designate measurements collected (or
calculated in the case of the R-CPE circuit) at the indicated frequencies and the
symbol X designates the characteristic frequency for each circuit.

19
Figure 1.4 The impedance-plane plots of the experimental R-C circuit (half-filled
circles, Re = 0.100 kΩ, Rm = 115 kΩ and C = 47 nF) and the theoretical R-CPE
circuit with the same characteristic frequency (Re =0.100 kΩ, Rm = 115 kΩ, α = 0.80 and Q = 20.9 nF, which corresponds to Ceff = 47 nF calculated using Eq. (1.28)). The filled circles designate impedance at 1, 10, 100 and 1000 Hz.
1.6 Error Analysis of Impedance Data
Analysis of error in impedance data is important for assessing
experimental technique and for analysis of experimental data (Agarwal et al.,
1995a). Minimizing the systematic experimental error and quantifying the
stochastic error in the impedance measurement increases the amount and
quality of information that can be obtained from the EIS measurements. The
Measurement Model Toolbox for impedance spectroscopy, developed by Mark
Orazem, was used in this work to model the stochastic error of the
measurements and to check the measurements for Kramers-Kronig consistency
(Orazem, 2001). The method summarized here is described elsewhere in more

20
detail (Agarwal et al., 1995a; Agarwal et al., 1995b; Agarwal et al., 1992, 1996;
Orazem, 2004; Orazem et al., 1996).
The frequency dependant residual error, resε , in the impedance data is
defined by Eq. (1.31)
( ) ( ) ( )res
ˆZ Zε ω ω ω= − (1.31)
where ω is the radial frequency equal to 2πf, ( )Z ω is the measured value of the
impedance and ( )ˆZ ω is the model value of the impedance. The residual error in
turn depends on the systematic error due to lack of fit of the model ( fitε ), the
systematic experimental (bias) error ( biasε ), and the random stochastic error
( stochε ) as described by Eq. (1.32)(Orazem, 2004):
( ) ( ) ( ) ( )res fit bias stochε ω ε ω ε ω ε ω= + + . (1.32)
Bias errors are a result of instrumental artifacts or experimental factors described
below. The measurement model method of error analysis identifies the
frequency range of a spectrum that is affected by the bias error and provides a
weighting strategy for regression based on the stochastic error of the data.
Inconsistency with the Kramers-Kronig relations indicates bias error in the
impedance measurement. The Kramers-Kronig relations are a set of integral
equations from which the imaginary component of the impedance can be
predicted from the real component and vice versa, as expressed by Eqs. (1.33)
and (1.34) respectively.

21
( )( ) ( )
2 20
2 r r
j
Z x ZZ dx
x
ωωω
π ω
∞ − = −
− ∫ (1.33)
( ) ( )( ) ( )
2 20
2 j j
r r
xZ x ZZ Z dx
x
ω ωω
π ω
∞ − = ∞ +
− ∫ (1.34)
where x represents all frequencies between zero and infinity. The problem with
applying the Kramers-Kronig relationships directly is that it requires measuring
the impedance at a sufficient number of frequencies to approximate a continuous
function between zero and infinity which is often unattainable in practice.
Satisfaction of the Kramers-Kronig relations is a necessary but not
sufficient requirement of a system that is causal, stable and stationary. A system
is causal if the response of the system is caused by a perturbation to the system.
A system is stable if the response to a perturbation decays to its un-perturbed
value with time. In the case of EIS, a stationary system means a system that
does not change with time.
The electrochemical systems are rarely stationary; thus, the stationary
condition is defined on three time scales. The first is non-stationary in which the
system changes while collecting one data point (i.e., datum at one frequency in a
spectrum). Impedance spectroscopy is generally not applicable to systems in
this regime. The second is pseudo-stationary in which the system changes
negligibly over the time required to collect an entire spectrum but significantly
over the course of the experiment. This is the typical regime for electrochemical
systems. The third time scale is stationary in which the system does not change
with time during the entire experiment. To satisfy the Kramers-Kronig relations,
the changes in the skin must be slow enough to be at least pseudo-stationary.

22
Non-stationary impedance behavior of human skin may indicate time variation in
the hydration of the skin, a gradient in the concentration of charge-carrying ions
across the skin, or skin damage caused by the measurement. Kramers-Kronig
consistency is not sufficient to prove that the measured spectrum reflects only
the properties of the system because some instrument artifacts may result in
impedance features that are consistent with the Kramers-Kronig relations
(Orazem, 2004).
To evaluate the data for bias errors, the magnitude of the stochastic errors
must be determined. The magnitude of the stochastic error for skin impedance
measurements cannot be determined by calculating the standard deviation of
replicate measurements because the pseudo-stationary behavior of the skin
introduces bias errors to the estimate of the stochastic error. The measurement
model approach described below enables determination of the magnitude of the
stochastic error by using a Kramers-Kronig consistent circuit model as a filter for
experimental bias, baseline drift and fitting errors in the impedance
measurements. Following Agarwal et al. (Agarwal et al., 1995a; Agarwal et al.,
1995b; Agarwal et al., 1992, 1996) and Orazem et al. (Orazem et al., 1996), the
measurement model chosen for this work consists of Voigt elements, composed
of a parallel resistor and capacitor, in series with a resistor, representing the
solution resistance, as expressed by the following equation
( )( )e
1
ˆ
1
nk
k k
RZ R
jω
τ ω=
= ++
∑ (1.35)

23
where eR is the electrolyte resistance, kR and kτ are the resistance and the time
constant (equal to 1/(2πfk) where fk is the characteristic frequency) of the thk
Voigt element.
The stochastic error is determined by fitting the measurement model, Eq.
(1.35), to several EIS scans, measured on the same experimental apparatus, by
modulus-weighted, complex non-linear least squares regression. Each scan
must have the same number of data points measured at the same frequencies.
Also, each scan must be regressed to the same measurement model (i. e., the
value of n in Eq. (1.35) must be the same for each scan). The value of n is the
maximum number of Voigt elements that can be regressed to all of the scans
such that the 95.4 % confidence interval for each fit parameter, kR and kτ , does
not include zero. The value of n is determined iteratively by adding Voigt
elements to the measurement model until the fit is no longer improved by the
addition of further Voigt elements as determined by the 95.4% confidence
interval.
The residual error between the data and the measurement model cannot
be taken as the stochastic error because the error due to lack of fit could be
significant. However, the standard deviation of the residuals, as expressed by
Eq. (1.36), is an estimate of the stochastic error as a function of frequency.
( ) ( ) ( )( )2
2
res, , res,1
1
1r r r
n
Z Z k Zkn
σ ω ε ω ε ω=
= −−∑ (1.36)
where ( )res, ,rZ kε ω is the residual error, as defined by Eq. (1.31), of the real part of
the impedance at frequency ω of scan k , ( )res, rZε ω is the mean of the residual

24
errors at frequency ω for n scans. The residual errors of the imaginary parts can
be treated in the same way to estimate the standard deviation of the stochastic
error. For Kramers-Kronig consistent data, rZσ is indistinguishable from
jZσ (Durbha et al., 1997).
Agarwal et al. (1995a) suggested Eq. (1.37) as a general model for the
stochastic error
r j
2
j
m
Z Z r
ZZ
Rσ σ α β γ δ= = + Ζ + + (1.37)
where mR is the known value of the current measuring resistor inside the
instrument used for the experiment and α , β , γ , and δ are constants to be
determined by regression (Agarwal et al., 1995a). Because the stochastic error
is a characteristic of the impedance instrument, the stochastic error model can be
used to weight all impedance scans of similar impedance magnitude measured
by the same instrument over the same range of frequencies. For example,
impedance measurements of damaged skin with low impedance can exhibit
different stochastic errors than measurements of high impedance undamaged
skin.
The stochastic error of eight impedance scans of human split-thickness
skin is presented in Figure 1.5. The measurements were performed after twelve
hours of equilibration in phosphate buffered saline solution and were regressed
by the model of Eq. (1.37) as a function of frequency. The model of the
stochastic error described by Eq. (1.37) and represented by the dashed curve in

25
Figure 1.5 does not capture all of the features of the error structure, particularly
the peak near 1000 Hz which is likely an artifact of the potentiostat.
100
101
102
103
104
105
Frequency (Hz)
10-4
10-3
10-2
10-1
Figure 1.5 The standard deviation of the real (circles) and imaginary (triangles) residual errors for eight impedance scans of human split-thickness skin plotted as a function of frequency. The dashed curve represents the regression of Eq. (1.37) o the real and imaginary residual errors.
The general method to check for Kramers-Kronig consistency is to fit the
measurement model with the maximum number of statistically significant Voigt
elements to either the real or imaginary part of the impedance and use the
regression parameters to predict the other component. For example, in Figure
1.6 the measurement model regressed to the imaginary part of a skin impedance
spectrum, weighted by the model of the stochastic error shown in Figure 1.5, is
plotted as a function of frequency. The parameters derived from this regression
to the imaginary part were used to predict the real part of the impedance, which
is shown in Figure 1.7.

26
Weighting the regression of the data to the measurement model with the
frequency-dependant stochastic error emphasizes data points with small
stochastic error and de-emphasizes data points with large stochastic error
(Agarwal et al., 1995a). The model of the stochastic error also provides criteria
for a good fit of the measurement model to the data. The dashed curves in
Figure 1.6 and Figure 1.7 represent the 95.4% confidence interval for the model
obtained by Monte Carlo simulation using the calculated confidence intervals for
the estimated parameters described elsewhere (Agarwal et al., 1995b).
100
101
102
103
104
105
Frequency (Hz)
10-1
100
101
Figure 1.6 The results of the Voigt measurement model regressed to the imaginary part of a typical skin impedance spectrum plotted as a function of frequency. The circles are the imaginary part of the impedance of the scan. The solid curve is the regression result. The dashed curves represent the 95.4% confidence interval for the model.

27
Figure 1.7 The real part of a typical impedance spectrum plotted as a function of frequency (circles). The solid curve represents the real part of the impedance predicted by the parameters from the regression fit to the imaginary part of the impedance spectrum shown in Figure 1.6. The dashed curves represent the 95.4% confidence interval for the model.
A more sensitive plot for assessing Kramers-Kronig consistency of the
data is shown in Figure 1.8 in which the residuals of the regression to the
imaginary data (circles) is plotted. The predicted residuals of the real data are
shown in Figure 1.9. In both Figures 1.8 and 1.9, the dashed curves indicate the
95.4% confidence interval for the model obtained by Monte Carlo simulation
using the calculated confidence intervals for the estimated parameters.
Data that fall outside of the 95.4% confidence interval for the model
prediction are considered to be inconsistent with the Kramers-Kronig relations.
All of the data shown in Figure 1.9 are within the 95.4% confidence interval of the
fit, which confirms that the skin impedance data presented here are consistent
with the Kramers-Kronig relations. Had there been data that were shown to be
inconsistent with the Kramers-Kronig relations, the Kramers-Kronig inconsistent

28
data would be discarded and the entire process repeated. The remaining data,
weighted with the variance of the stochastic error, is then regressed to the
process model (e.g. the R-CPE model) using complex nonlinear least squares
weighted by the stochastic error as described in more detail in Chapter 4. If the
impedance data over a large portion of the frequency range were determined to
be inconsistent with the Kramers-Kronig relations, then the experimental
apparatus and procedure would need to be re-evaluated for sources of bias
error.
Figure 1.8 The relative residual errors for the regression fit of the measurement model to the imaginary part of the impedance data plotted as a function of frequency. The circles represent the relative residual errors of the regression as a function of frequency. The dashed curves represents the 95.4% confidence interval for the model obtained by Monte Carlo simulation using the calculated confidence intervals for the estimated parameters.

29
Figure 1.9 The relative residual errors for the real part of the impedance that is predicted by regression of the Voigt measurement model to the imaginary part of the impedance spectrum. The circles represent the relative residual errors of the real part of the regression as a function of frequency. The dashed curves represents the 95.4% confidence interval for the model obtained by Monte Carlo simulation.
1.7 Thesis Overview
The objective of this work is to establish a quantitative foundation for
evaluating skin impedance measurements. In doing so, this work further
develops impedance spectroscopy as a tool for measuring skin variability and
skin damage in order to decrease the uncertainty in skin permeation experiments
and thereby reduce the cost and duration of experimentation.
In Chapter 2 the theoretical interpretation of single frequency impedance
measurements made with an LCR data bridge is clarified and demonstrated
experimentally. Specifically, manipulations of the equations for a simple R-CPE
equivalent circuit model are used to relate the measurements from an LCR data
bridge to the DC skin resistance, which is the value that is most sensitive to skin

30
integrity. An average value for the effective capacitance, as determined by the
Hsu and Mansfeld approach (Eq. (1.28)) is calculated from the impedance
spectra of 145 skin samples and found to be relatively constant. Based on this
analysis, it was shown that LCR databridge measurements at 100 Hz reported as
R in parallel mode and C in series mode are more sensitive to skin integrity than
R measured in series mode or C in parallel mode. Also, measurements at 100
Hz were superior to those collected at 1000 Hz.
In Chapter 3 the equations describing the frequency dependence of R
reported in PAR mode developed in Chapter 2 are used to correlate LCR
databridge impedance measurements with the permeability coefficient of tritiated
water measured on the same piece of skin. The relationship between impedance
measurements and the tritiated water permeability, which is based on the
impedance of an R-CPE equivalent circuit, is extended to two other hydrophilic
molecules. This relationship is used to compare previously published impedance
criteria for identifying skin as acceptable for chemical absorption studies.
In Chapter 4, the skin impedance and the flux of moderately lipophilic
compounds are quantitatively characterized before and after two treatments
known to alter skin either chemically, with the polar solvent dimethyl sulfoxide
(DMSO), or mechanically by puncture with a needle. The impedance spectrum
of skin treated with DMSO for less than 0.5 h appears to consist of an
undamaged layer and a damaged layer but the flux of p-chloronitrobenzene does
not change after DMSO treatments for 0.25 or 1 h.

31
The pinhole experiments provide a quantitative test for the Hsu and
Mansfeld formula (Eq. (1.28)) for estimating the effective capacitance of skin
when there are other features not associated with the electrical properties of the
skin itself. Before and after pinhole, the skin impedance is consistent with a
single R-CPE circuit, the characteristic frequency of the skin changes in a way
that is predicted by the theory recently published by Hirshchorn (2010). After the
puncture, the flux of 4-cyanophenol increases by a small but significant amount
that is not correlated with the estimated area of the pinhole calculated from the
change in the resistance of the system.

32
REFERENCES
Agarwal, P., Crisalle, O., Orazem, M.E., Garcia-Rubio, L., 1995a. Application of measurement models to impedance spectroscopy, II. Determination of the stochastic contribution to the error structure. Journal of the Electrochemical Society 142, 4149-4158.
Agarwal, P., Orazem, M.E., Garcia-Rubio, L., 1995b. Application of measurement models to impedance spectroscopy, III. Evaluation of consistency with Kramers-kronig relations. Journal of the Electrochemical Society 142, 4159-4168.
Agarwal, P., Orazem, M.E., Garcia-Rubio, L.H., 1992. Measurement Models for Electrochemical Impedance Spectroscopy 1. Demonstration of Applicability. Journal of Electrochemical Society 139, 1917-1926.
Agarwal, P., Orazem, M.E., Garcia-Rubio, L.H., 1996. The influence of error structure on interpretation of impedance spectra. Electrochim. Acta 41, 1017-1022.
Bennett, S.L., Barry, B.W., 1985. Effectiveness of skin penetration enhancers propylene glycol, azone, decylmethylsulphoxide and oleic acid with model polar (mannitol) and nonpolar (hydrocortisone) penetrants. J. Pharm. Pharmacol. 37, 84P.
Bunge, A.L., Cleek, R.L., Vecchia, B.E., 1995a. A new method for estimating dermal absorption from chemical exposure. 3. Compared with steady-state methods for prediction and data analysis. Pharm. Res. 12, 972-982.
Bunge, A.L., Cleek , R.L., Vecchia, B.E., 1995b. A new method for estimating dermal absorption from chemical exposure. 3. Compared with steady-state methods for prediction and data analysis. Pharm. Res. 12, 972-982.
Burnette, R.R., Bagniefski, T.M., 1988. Influence of constant current iontophoresis on the impedance and passive Na+ permeability of excised nude mouse skin. J. Pharm. Sci. 77, 492-497.
Chien, Y.W., Siddiqui, O., Shi, W.M., Lelawongs, P., Liu, J.C., 1989. Direct current iontophoretic transdermal delivery of peptide and protein drugs. J. Pharm. Sci. 78, 376-383.
Crank, J., 1975. The Mathematics of Diffusion, Second Edition ed. Oxford University Press, Oxford.
DeNuzzio, J.D., Berner, B., 1990. Electrochemical and iontophoretic studies of human skin. J. Controlled. Release 11, 105-112.
Durbha, M., Orazem, M.E., Garcia-Rubio, L.H., 1997. Spectroscopy Applications of the Kramers-Kronig Transforms: Implications for Error Structure Identification. Journal of The Electrochemical Society 144, 48-55.

33
Fasano, W.J., Manning, L.A., Green, J.W., 2002. Rapid integrity assessment of rat and human epidermal membranes for in vitro dermal regulatory testing: correlation of electrical resistance with tritiated water permeability. Toxicol. In Vitro 16, 731-740.
Hirschorn, B., Orazem, M.E., Tribollet, B., Vivier, V., Frateur, I., Musiani, M., 2010. Determination of effective capacitance and film thickness from constant-phase-element parameters. Electrochim. Acta 55, 6218-6227.
Hsu, C.H., Mansfeld, F., 2001. Technical note: Concerning the conversion of the constant phase element parameter Y0 into a capacitance. Corrosion 57, 747-748.
Kalia, Y.N., Pirot, F., Guy, R.H., 1996. Homogeneous transport in a heterogeneous membrane: Water diffusion across human stratum corneum in vivo. Biophys. J. 71, 2692-2700.
Kasting, G.B., Barai, N.D., Wang, T.-F., Nitsche, J.M., 2003. Mobility of water in human stratum corneum J. Pharm. Sci. 92, 2326-2340.
Kasting, G.B., Smith, R.L., Anderson, B.D., 1992. Prodrugs for dermal delivery: solubility, molecular size, and functional group effects, In: Sloan, K.B. (Ed.), Prodrugs: Topical and Ocular Drug Delivery. Marcel Dekker, New York, pp. 117-161.
Kim, H.S., Oh, S.Y., 2011. Effect of Polyoxyethylene Alkyl Esters on Permeation Enhancement and Impedance of Skin. Biomolecules & Therapeutics 19, 109-117.
Kurihara-Bergstrom, T., Flynn, G.L., Higuchi, W.I., 1986. Physicochemical study of percutaneous absorption enhancement by dimethyl sulfoxide: kinetic and thermodynamic determinants of dimethyl sulfoxide mediated mass transfer of alkanols. J. Pharm. Sci. 75, 479-486.
Michaels, A.S., Chandrasekaran, S.K., Shaw, J.E., 1975. Drug permeation through human skin: Theory and in vitro experimental measurement. American Institute of Chemical Engineers' Journal 21, 985-996.
Oh, S.Y., Leung, L., Bommannan, D., Guy, R.H., Potts, R.O., 1993. Effect of current, ionic strength and temperature on the electrical properties of skin. J. Controlled. Release 27, 115-125.
Orazem, M.E., 2001. User Manual for the Measurement Model Toolbox for Impedance Spectroscopy. University of Florida, Gainesville, FL.
Orazem, M.E., 2004. A systematic approach toward error structure identification for impedance spectroscopy. Journal of Electroanalytical Chemistry 572, 317-327.
Orazem, M.E., Moustafid, T.E., Deslouis, C., Tribollet, B., 1996. The Error Structure of Impedance Spectra for Systems with a Large Ohmic Resistance with Respect to the Polarization Impedance. Journal of The Electrochemical Society 143, 3880-3890.
34
Orazem, M.E., Tribollet, B., 2008. Electrochemical Impedance Spectroscopy. Wiley-Interscience, Hoboken, NJ.
Peck, K.D., Ghanem, A.H., Higuchi, W.I., 1995. The effect of temperature upon the permeation of polar and ionic solutes through human epidermal membrane. J. Pharm. Sci. 84, 975-982.
Rushmer, R.F., Buettner, K.J.K., Short, J.M., Odland, G.F., 1966. The Skin The Most Accessible Tissue of the Body Serves as a Potential Focus for Multidisciplinary Research. Science 154, 343-348.
Tang, H., Blankschtein, D., Langer, R., 2002. Prediction of steady-state skin permeabilities of polar and nonpolar permeants across excised pig skin based on measurements of transient diffusion: Characterization of hydration effects on the skin porous pathway. J. Pharm. Sci. 91, 1891-1907.
Wang, T.F., Kasting, G.B., Nitsche, J.M., 2006. A multiphase microscopic diffusion model for stratum corneum permeability. I. Formulation, solution, and illustrative results for representative compounds. J. Pharm. Sci. 95, 620-648.
Wang, T.F., Kasting, G.B., Nitsche, J.M., 2007. A multiphase microscopic diffusion model for stratum corneum permeability. II. Estimation of physicochemical parameters, and application to a large permeability database. J. Pharm. Sci. 96, 3024-3051.
Wertz, P.W., Madison, K.C., Downing, D.T., 1989. Covalently bound lipids of human stratum corneum. J. Invest. Dermatol. 92, 109-111.
Yamamoto, T., Yamamoto, Y., 1976a. Dielectric constant and resistivity of epidermal stratum corneum. Med. Biol. Eng. Comput. 14, 494-500.
Yamamoto, T., Yamamoto, Y., 1976b. Electrical properties of the epidermal stratum corneum. Med. Biol. Eng. 14, 151-158.

35
CHAPTER 2
A CRITICAL ANALYSIS OF SINGLE-FREQUENCY LCR
DATABRIDGE IMPEDANCE MEASUREMENTS OF HUMAN SKIN
The content of this chapter was published in Toxicology in Vitro (White et al.,
2011) and reproduced here with consent from the publisher.
Testing whether the barrier of skin samples has sufficient integrity for
meaningful measurements of in-vitro chemical permeability is usually required
when data are generated for regulatory purposes. Recently, skin integrity has
been assessed using LCR databridge measurements, which are reported as
resistances determined in either series (SER) or parallel (PAR) modes at a single
frequency, typically 100 or 1000 Hz. Measurements made at different
combinations of mode and frequency are known to differ, although the skin
literature reveals confusion over the meaning of these differences and the impact
on the interpretation of integrity test results. Here, the theoretical meanings of
resistance and capacitance measurements in PAR and SER mode are described
and confirmed experimentally. SER-mode resistances are equal to the real part
of the complex impedance; whereas, PAR-mode resistances are the inverse of
the real part of the admittance. Capacitance measurements reported in SER and
PAR modes are similar manipulations of the imaginary parts of the complex
impedance and admittance. A large body of data from human cadaver skin is
used to show that the PAR-mode resistance and SER-mode capacitance

36
measured at 100 Hz are sensitive to skin resistivity, which is the electrical
measurement most closely related to skin integrity.
2.1 Introduction
Measurement of electrochemical impedance has been shown to be a
convenient method for characterizing many different materials, including human
or animal skin. The method involves applying small-amplitude sinusoidal
modulation of an input current or potential and measuring the responding
potential or current. Impedance is the ratio of the change in potential to the
change in current. Because the phase difference between the measured and
input signals depends on the modulation frequency, it is convenient to express
the impedance as a complex number that varies with the frequency of the time
variation. In the limit of low frequency, the impedance measurement should
approach the direct current (DC) resistance (RDC).
Percutaneous absorption data are required for risk assessments of
potentially toxic chemicals. In-vitro measurements of human skin can be used to
avoid testing on human volunteers or animals. However, the collection and
handling of excised skin can introduce damage, which may affect the
percutaneous absorption measurements (Scott et al., 1991). Therefore, testing
whether the barrier function of skin samples has sufficient integrity for meaningful
measurements of in-vitro chemical permeability is common and usually required
when data are generated for regulatory purposes (Heylings and Esdaile, 2007;
International Programme on Chemical Safety (IPCS), 2006; OECD, 2004a).
Measurement of skin impedance is faster and less expensive than measuring
37
tritiated water permeation (Davies et al., 2004; Fasano and Hinderliter, 2004;
Fasano et al., 2002), which has been the conventional skin integrity test (Franz
and Lehman, 1990; Kasting et al., 1994; Scott et al., 1992). For the same
reason, in-vitro impedance measurements are also used to identify chemicals
and chemical mixtures that cause irreversible (or corrosive) damage to the skin
(OECD, 2004a).
Several papers have described impedance measurements of in-vitro skin
samples determined using an LCR databridge; e.g., from PRISM (Davies et al.,
2004; OECD, 2004b) or Tinsley (Fasano et al., 2002). According to their
manufacturers, these instruments measure inductance (L), capacitance (C) or
resistance (R) in either a parallel (PAR) or series (SER) mode determined at one
of two user-selected frequencies, usually 100 or 1000 Hz. Nearly always, the
reported resistance values measured by PAR and SER modes (i.e., RPAR and
RSER, respectively) at a given frequency are different. Also, RPAR and RSER,
determined at different frequencies, are different, clearly indicating that these
instruments are not reporting the DC skin resistance (Fasano and Hinderliter,
2004).
In assessing skin integrity or corrosion, the meaningful quantity is the
electrical resistivity of the skin (ρ), which quantitatively characterizes the pathway
for transport of ions. Consistent with this, the permeability of polar and ionic
chemicals through skin has been shown to be inversely proportional to the
resistivity (Kasting and Bowman, 1990; Peck et al., 1994, 1995). Low resistivity,
therefore, indicates high permeability to ions or polar chemicals, which is

38
consistent with damage. Because the thickness of the stratum corneum (ℓ), the
skin layer primarily responsible for electrical resistance, is not usually measured,
it is convenient to report the product of ρ and ℓ, which is equal to the DC
resistance of the skin (Rskin) multiplied by the area for charge transfer (A). LCR
databridge measurements of skin will meaningfully assess skin integrity or
damage only if the resistance measured represents a reliable estimate of the DC
resistance.
The strategy is to reject skin samples with resistivity below a specified
acceptance criterion as being too damaged for determining reliable chemical
permeation parameters. Typically, the acceptance criterion is selected by
comparing electrical measurements on a series of samples to the percutaneous
absorption measurements for tritiated water (Davies et al., 2004; Fasano et al.,
2002), other polar compounds (Peck et al., 1995), or ionized salts (Kasting and
Bowman, 1990). Peck et al. (1995) and Kasting and Bowman (1990)
recommended that DC resistance values of 20 and 35 kΩ cm2, respectively, were
suitable acceptance criteria. Proposed minimum acceptable values in RPAR from
LCR databridge measurements, derived by comparing RPAR measurements to
the same maximum acceptable tritiated water absorption of 1.5 mg cm-2 h-1
(which is equal to a permeability coefficient of 1.5 x 10⁻³ cm/h), differ depending
on the frequency of the RPAR measurement. Fasano et al. (2002) suggested that
skin samples be rejected if they have a resistance, measured at 1000 Hz and
normalized for area, less than 11 kΩ cm2. Davies et al. (2004) recommended

39
using a criterion of 25 kΩ cm2 based on measurements at 100 Hz. (Note that
Davies et al. (2004) incorrectly listed the measuring frequency as 100 kHz rather
than 100 Hz (Heylings, 2009).) The OECD 430 guidelines for identifying
corrosive chemicals used measurements at 100 Hz in SER mode in validation
studies, and recommend measurement frequencies between 50 and 1000 Hz
(OECD, 2004b).
Given that skin integrity is characterized by the resistivity, equal to
Rskin⋅A/ℓ, it is important to know the extent to which LCR databridge
measurements at 100 or 1000 Hz, reported in either PAR or SER modes, are
correlated with the DC skin resistance. The objective of this work is to explain
and establish experimentally the electrical quantities represented by RPAR and
RSER and also the capacitance reported in PAR and SER modes (i.e., CPAR and
CSER, respectively). A large quantity of skin impedance data is used to
demonstrate the significant advantage of using the PAR resistance
measurements at 100 Hz or the SER capacitance measurements at 100 Hz to
estimate the skin resistivity, and therefore, integrity. These data are also used to
derive equations relating the DC resistance to RPAR at 100 and 1000 Hz and CSER
at 100 Hz. In a companion study, measurements of tritiated water permeation
are shown to be linearly correlated with estimates of DC resistance derived from
LCR databridge measurements determined at either 100 or 1000 Hz in three
different laboratories (White, 2011).

40
2.2 Theory
Impedance (Z) is the alternating current (AC) analog to the DC resistance
(RDC), which is expressed in terms of real (Zr) and imaginary (Zj) parts as
r jZ Z j Z= + (2.1)
where 1j = − . The inverse of the impedance is the admittance (Y), which is the
AC analog of DC conductance. Like the impedance, the admittance can be
written in terms of real (Yr) and imaginary (Yj) parts as
r j
1Y Y jY
Z= = + (2.2)
Notably, Zr is only equal to the inverse of Yr when the imaginary part of the
impedance is zero.
The complex capacitance is defined to be the admittance (or the inverse
of the impedance) divided by the angular frequency (ω), i.e.,
r j
1YC C j C
j j Zω ω= = = + (2.3)
in which ω is equal to 2πf, where f is the number of cycles per time. It is
important to note that the complex capacitance depends on frequency and is not
the intrinsic dielectric property of the material.
The presence of dielectric material in the skin causes a phase lag in the
response to a periodic electrical signal. As a result, Z, Y and C measured for
skin vary with frequency and include imaginary parts. It has been suggested that
highly ordered stratum corneum lipids are the dielectric material (DeNuzzio and

41
Berner, 1990; Oh et al., 1993). If skin were to behave as a simple resistor, there
would be no phase shift and no imaginary parts, and Z and Y would be
independent of frequency (Fasano and Hinderliter, 2004).
The references to ‘parallel’ and ‘series’ in the LCR databridge
measurements is nomenclature from older technology in which a variable resistor
and capacitor in either parallel or series circuits were used on one side of a
Wheatstone bridge circuit. The electrochemical cell on which measurements are
being made is connected to the other side of the Wheatstone bridge circuit, and
the magnitudes of the capacitor and resistor are adjusted to balance the potential
drop across the Wheatstone bridge. The values of the resistor and capacitor in
the balanced circuit gave the real and imaginary parts of the impedance. If the
configuration of the balancing circuit is a resistor and capacitor in series, then the
impedance, referred to as ZSER is given by:
SER SER
SER
1r jZ R j Z j Z
Cω
−= + = + (2.4)
It follows that the real part of the impedance, Zr = RSER, and the imaginary part of
the impedance, Zj = -1/ωCSER.
Similarly, when the balancing circuit is configured as a resistor and
capacitor in parallel, then the inverse of the impedance of the parallel circuit
(1/ZPAR) is equal to the inverse of the impedance for the resistor and capacitor as
follows:
PAR PAR r j
PAR PAR
1 1Y j C Y jY
Z Rω= = + = + (2.5)

42
Therefore, the measured RPAR is equivalent to 1/Yr and the measured CPAR is
equivalent to Yj /ω.
Unlike Wheatstone bridge devices, LCR databridge instruments do not
contain an actual resistor-capacitor (R-C) measuring circuit. Instead, the LCR
databridge instruments use a phase-sensitive analog-to-digital converter to
determine the magnitude of the resulting voltage that is in-phase with the
perturbation and the magnitude of the voltage that is out-of-phase with the
perturbation. The corresponding current is measured with a current-to-voltage
converter (H. Tinsley & Co, 1996). The measurement theory and practice is
described in detail in the 6401 LCR Databridge Users Manual (H. Tinsley & Co,
1996).
A physical model of skin impedance is not available because the source of
the skin impedance is not well understood. As a result, it is customary to use
equivalent circuits, comprised of simple circuit elements, to model the skin
impedance. A common circuit model of in-vitro skin impedance, depicted in
Figure 2.1, is a resistor that represents the frequency-independent (Ohmic)
resistance containing contributions from the electrolyte, wires, and possibly the
dermis (Re) in series with a parallel resistor (Rskin) and capacitor (Cskin) that
represent the skin polarization resistance and skin capacitance, respectively.
Although this simple R-C circuit model does not represent actual skin impedance
spectra as well as alternative circuit models like a resistor in parallel with a
constant phase element (Hirschorn et al., 2010; Kontturi and Murtomaki, 1994;
Yamamoto and Yamamoto, 1976b; Yamamoto and Yamamoto, 1976a;

43
Yamamoto and Yamamoto, 1976c, 1981a, b) , it is presented here because it
does capture the important features.
Figure 2.1 A simple R-C circuit model of skin
The impedance response of the R-C circuit presented in Figure 2.1 is
similar to that of human skin, determined either in vitro or in vivo, in that the Zr in
both cases approach asymptotic values at high and low frequencies. As the
alternating current (AC) frequency approaches zero, Zj approaches zero and Zr
approaches the DC resistance of the system; thus, Z= Zr = RDC = Re + Rskin. For
large frequencies, the impedance of the skin becomes negligibly small and Z = Zr
= Re (Orazem and Tribollet, 2008). The equations presented in Table 2.1 for
RPAR, RSER, CPAR and CSER, corresponding to the R-C circuit in Figure 2.1, can be
obtained by algebraic rearrangements of the expressions describing the complex
impedance provided in the Appendix. The equations describing RPAR, RSER, CPAR
and CSER for a circuit with a resistor in series with a resistor in parallel with a
constant phase element (R-CPE circuit) also are listed in the Appendix.

44
Table 2.1 Equations for the PAR and SER modes of R and C for the R-C model circuit shown in Figure 1.
PAR SER
R
( )
( )
ω
ω
+ + = =
+ +
2
2eskin e skin
skin
PAR2 er
e skin skin
skin
11
1
RR R C
RR
RYR R C
R
( )ω= = +
+
skinSER r e 2
skin skin1
RR Z R
R C
C ( )
ωω
= =
+ +
j skinPAR 2
2ee skin
skin
1
Y CC
RR C
R
SER skin 2 2
skin skin
1 1
j
C CZ R Cω ω
= − = +
2.3 Materials and Methods
Impedance and LCR databridge measurements were performed on a
“dummy cell” circuit constructed of resistors and capacitors to confirm the
interpretation of the LCR databridge results in terms of a full spectrum
impedance analysis. Impedance measurements on human skin were then used
to simulate LCR databridge readings and, thereby, to establish the relationship
between LCR databridge measurements and skin integrity.
2.3.1 Dummy Cell
A dummy cell electrical circuit, constructed to mimic approximately the
impedance behavior of skin, was used to test the theoretical definitions of RPAR,

45
RSER, CPAR and CSER. Specifically, measurements of RPAR, RSER, CPAR and CSER
from an LCR databridge (Tinsley Model 6401 LCR Databridge, Croydon, UK)
measured at 100 and 1000 Hz were compared to the complex impedance and
admittance spectra determined for frequencies from 0.1 Hz to 20 kHz using a
Gamry potentiostat (model PCI4/300, Warminster, PA). The dummy cell (Radio
Shack, Fort Worth, TX) was assembled on a modular integrated circuit
breadboard socket with a resistor (Re = 100 ± 1 Ω) placed in series with a second
resistor (Rskin = 115 ± 1 kΩ) that was in parallel with a capacitor (Cskin = 47.0 ±
9.4 nF). The impedance electrode leads were connected to the circuit in a two
electrode configuration with solderless breadboard jumper wires. The LCR
databridge data were provided by C. Roper (Charles River Laboratories,
Edinburgh, UK). For the Gamry potentiostat measurements, the potential was
modulated 10 mV rms with a mean applied potential of zero (i.e. no DC bias was
applied) at 10 frequencies per logarithmic decade over the frequency range.
2.3.2 Chemicals and Materials
Phosphate buffered saline (0.01 M) with 0.138 M NaCl, 0.0027 M KCl (pH
7.4, Sigma P-3813) was prepared in de-ionized (DI) water (Millipore Corporation,
Bedford, MA). Split-thickness human cadaver skin (approximately 300 µm thick),
harvested from the back or abdomen within 24 hours post mortem, was
purchased from National Disease Research Interchange (NDRI, Philadelphia,
PA). The skin was immediately frozen after collection and stored at
temperatures less than -60° C until used.

46
2.3.3 Skin Impedance
Impedance was measured across skin samples mounted between two
horizontally oriented chambers in one of three configurations. Most experiments
were conducted in glass Side-Bi-SideTM cells from PermeGear, Inc. (Hellertown,
PA), which have an exposed skin area of 1.77 cm2 and a 13-mL volume for each
chamber. Other impedance experiments were conducted in custom-made,
polycarbonate cells (0.64-cm2 area and a chamber volume between 9 and 15 mL
each), or in Side-Bi-SideTM cells modified to hold a customized frame assembly
(PDM Services, Golden, CO), in which the skin is mounted (area and nominal
volume are 1.70 ± 0.14 cm2 and 13 mL, respectively). Both chambers of the
three cell configurations were designed to accommodate two Ag/AgCl electrodes
(In Vivo Metric, Healdsburg, CA), one working and one reference. The working
electrodes were 12 mm diameter discs oriented with the face parallel to the skin
surface. The cylindrical reference electrodes (1.5 mm diameter and 3 mm long)
were oriented such that the long axis is parallel to the skin surface. During an
experiment, both chambers were filled with PBS solution and the temperature
was maintained at 32°C in either a temperature-controlled environmental
chamber (Electro-Tech Systems, Inc., PA) or by circulating water through the
water jacket from a temperature-controlled bath.
Spectra of impedance-frequency scans were measured for 145 skin
samples from 6 subjects (all Caucasian, 4 males, ages 51 to 78 years, average
of 68.5 years) using the Gamry potentiostat at the same operating conditions
used in the dummy cell experiment. The frequency range was from 1 Hz to 10

47
kHz, except for a few scans for which the frequency was as low as 0.1 Hz or as
high as 300 kHz. Impedance scans were collected hourly during an equilibration
period of 8 to 12 h to establish a baseline for the electrical properties of the skin
as well as to verify that the skin was at equilibrium as indicated by insignificant
differences between subsequent spectra. The frequency dependence in the
measurements was consistent among the six subjects. No distinguishable effect
of age or gender was observed; e.g., the subjects with the highest and lowest
average impedance values (85 and 17 kΩ cm2) were males of 78 and 76 years,
respectively.
2.4 Results and Discussion
Experiments performed on a “dummy cell” circuit constructed of resistors
and capacitors provided confirmation of the relationship between LCR databridge
values and impedance results at the same frequency. This correspondence was
used to assess the use of LCR databridge values to estimate skin resistivity and
as a measure of skin integrity.
2.4.1 Dummy Cell Measurements
Measurements of the dummy cell determined using the LCR databridge
are compared in Figure 2.2 to the Zr and 1/Yr spectra measured with the Gamry
potentiostat. In agreement with the equations presented in Table 2.1, Zr and 1/Yr
asymptotically approach the sum Re + Rskin at low frequency and Re at high
frequency. At intermediate frequencies, Zr and 1/Yr both decrease with
frequency, although the rate of decrease for Zr is greater than 1/Yr. Consistent

48
with the definitions provided in Table 2.1 for LCR databridge measurements,
values of RSER measured at 100 Hz and 1000 Hz are indistinguishable from the
corresponding Zr values. Likewise, RPAR measured at 100 Hz and 1000 Hz are
indistinguishable from the corresponding 1/Yr values.
Figure 2.2 RPAR and RSER measured by the Tinsley LCR databridge at 100 and 1000 Hz compared with Zr and 1/Yr spectra measured by the Gamry potentiostat
for the dummy cell (Re = 100 Ω, Rskin = 115 kΩ, Cskin = 47 nF).
Values for CPAR and CSER reported by the Tinsley 6401 at 100 Hz and
1000 Hz are compared in Figure 2.3 to (-1/ωZj) and Yj /ω calculated from the
complex impedance spectra measured with the Gamry potentiostat. The values
of CSER and CPAR determined at 100 Hz and 1000 Hz with the Tinsley instrument
are indistinguishable from values of (-1/ωZj) and Yj /ω, respectively, which
confirms the definitions of the CSER and CPAR measurements presented in Table
2.1. For an ideal R-C circuit, Cskin is the asymptotic limit for (-1/ωZj) at high
frequency and also for Yj /ω at low frequency if Re << Rskin (Table 2.1). For the

49
dummy cell, the asymptotic limits of Yj /ω and (-1/ωZj) are the same and
approximately 40 nF, which is within the component tolerance reported by the
manufacturer. The small but evident frequency dependence at low and high
frequency for Yj /ω and (-1/ωZj), respectively, indicates that the electrical
components of the dummy cell were not perfectly ideal capacitors.
Figure 2.3 CPAR and CSER measured by the Tinsley LCR databridge compared
with Yj /ω and -1/ωZj spectra measured by the Gamry potentiostat for the dummy
cell (Re = 100 Ω, Rskin = 115 kΩ, Cskin = 47 nF).
2.4.2 Application to Human Skin
The results presented in the previous section confirm that impedance
measurements at 100 and 1000 Hz can be used to estimate the values of RPAR,
RSER, CPAR, and CSER measured by a Tinsley LCR databridge. Values of RSER
and RPAR calculated from the complex impedance measured as a function of
frequency for two samples of human cadaver skin are presented in Figure 2.4 as
examples of skin exhibiting low and high impedance values. The frequency

50
variation of CPAR and CSER are presented in Figure 5 for the same two pieces of
skin.
Figure 2.4 Area-normalized values of RSER (open symbols) and RPAR (filled symbols) calculated from the complex impedance measured with the Gamry potentiostat as a function of frequency for a high impedance skin sample (squares) and a low impedance skin sample (triangles).
The features of the RSER and RPAR spectra for human skin are similar to
those observed for the dummy R-C circuit shown in Figure 2.2. At low frequency,
RSER and RPAR asymptotically approach the DC resistance of the total cell (i.e., Re
+ Rskin), which is approximately 9 and 180 kΩ cm2 for the low and high
impedance samples, respectively. As with the dummy cell, RPAR and RSER both
asymptotically approach Re at higher frequencies. Also, like the dummy cell, at a
given intermediate frequency, RPAR is larger than RSER for both the high and low
impedance skin. For both RSER and RPAR, the magnitude of any deviation from
the DC resistance of the cell is reduced when measurements are made at lower
frequency.

51
Notably, although the frequency dependence is similar for skin and the
dummy cell, the maximum slope of the RPAR and RSER spectra is smaller for the
skin samples than would be expected for an ideal R-C circuit. This is consistent
with many other skin impedance studies (Hirschorn et al., 2010; Kontturi and
Murtomaki, 1994; Membrino et al., 1997; Yamamoto and Yamamoto, 1976c),
which found that, while the frequency dependence of the impedance for a simple
R-C circuit model is similar to that measured in skin, a good quantitative fit of the
skin data with an R-C circuit is not possible.
The CSER and CPAR spectra of the cadaver skin samples shown in Figure
2.5 and the dummy cell shown in Figure 2.3 also have similar features. The CPAR
spectra for the high and low impedance skin samples almost overlap, indicating
little sensitivity to the large difference in DC resistance of the skin. Furthermore,
the CPAR values are nearly independent of frequency over most of the measured
spectrum, decreasing significantly only at the higher frequencies. The rate of
change of CSER with frequency is large for both skin samples at frequencies less
than about 100 Hz and relatively independent of frequency at frequencies of
about 1000 Hz and higher. Overall, the CSER spectra for the high impedance skin
is shifted to the left relative to the CSER spectra for low impedance skin,
suggesting that CSER is sensitive to variations in the DC cell resistance, although
this will not be apparent if CSER is measured at a higher frequency. At higher
frequencies, CSER for both pieces of skin approach a similar asymptotic value,
which is related to, but not normally equal to, the effective capacitance of the skin
sample (which is defined and discussed in the Appendix). Despite the more than

52
20-fold difference in the low frequency impedance values, the asymptotic values
of CSER at high frequency for the low and high impedance skin samples shown in
Figures 2.4 and 2.5 differ by only a factor of about two, which is consistent with
the typically small variation in the effective capacitance for fully hydrated skin in
diffusion cell experiments.
Figure 2.5 Area normalized values of CSER (open symbols) and CPAR (filled symbols) calculated from the complex impedance measured with the Gamry potentiostat as a function of frequency for a high impedance skin sample (squares) and a low impedance skin sample (triangles).
The frequency-dependent in-vitro measurements presented in Figures 2.4
and 2.5 are consistent with measurements collected over a similar range of
frequencies on human subjects in vivo, including the effects of treatments that
caused skin damage; e.g., (Curdy et al., 2001; Curdy et al., 2004; Kalia et al.,
1996; Rosell et al., 1988). Quantitative in vitro-in vivo comparisons to these
published data are not possible due to differences in the experimental protocols.

53
There are a few commercial instruments designed to assess human skin
hydration in vivo through measurement of the total magnitude of the impedance,
the reciprocal of the resistance of the impedance, or the capacitance contribution
of the impedance (Barel and Clarys, 2006; Gabard et al., 2006; Nicander et al.,
2006; Tagami, 2006). Quantitative comparisons of the measurements among
these instruments are impossible due to differences in the measurement
frequencies, the nature of the skin-electrode contact, and the electrode type,
shape and configuration (Nicander et al., 2006). Compared with in-vitro
impedance measurements, which are made across known skin layers, the skin
depth measured by these commercial instruments is unknown and different for
each. Also, some of the devices (e.g., the Corneometer from Courage-Khazaka
Electronic) only report results in arbitrary units related to skin hydration.
Moreover, in contrast to the LCR databridge and Gamry measurements
presented here, these commercial devices measure at frequencies that are large,
at least 1 kHz and often greater than 1 MHz (Barel and Clarys, 2006; Gabard et
al., 2006; Nicander et al., 2006; Tagami, 2006). Most probably the observations
from these measurements are related to factors other than stratum corneum
resistivity.
2.4.3 Estimation of Skin Resistivity
The resistance of skin is usually much larger than the Ohmic resistance
(i.e., Rskin >> Re), and, therefore, the low-frequency asymptote of the real part of
the impedance approximates the DC resistance of the skin sample (Rskin). If the
lowest frequency measured is sufficiently small, the low-frequency asymptote
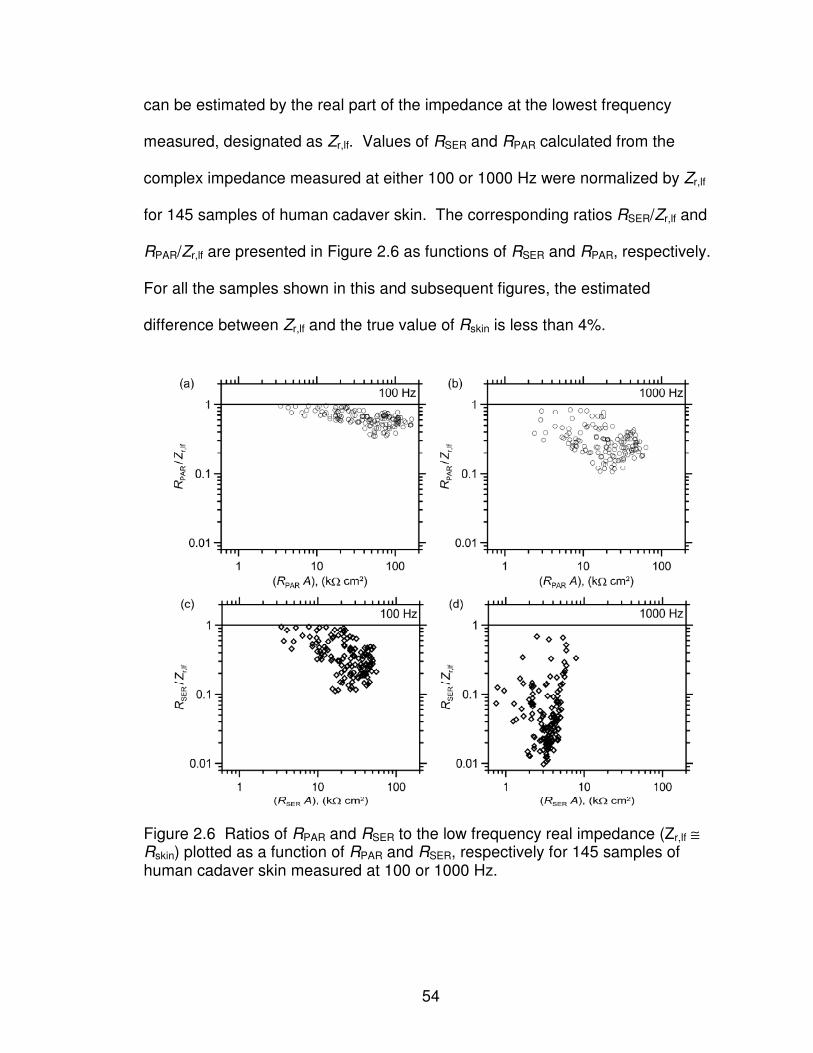
54
can be estimated by the real part of the impedance at the lowest frequency
measured, designated as Zr,lf. Values of RSER and RPAR calculated from the
complex impedance measured at either 100 or 1000 Hz were normalized by Zr,lf
for 145 samples of human cadaver skin. The corresponding ratios RSER/Zr,lf and
RPAR/Zr,lf are presented in Figure 2.6 as functions of RSER and RPAR, respectively.
For all the samples shown in this and subsequent figures, the estimated
difference between Zr,lf and the true value of Rskin is less than 4%.
Figure 2.6 Ratios of RPAR and RSER to the low frequency real impedance (Zr,lf ≅ Rskin) plotted as a function of RPAR and RSER, respectively for 145 samples of human cadaver skin measured at 100 or 1000 Hz.

55
Consistent with the results in Figure 2.4 for two representative pieces of
skin, the data presented in Figure 2.6 show that RPAR is a better estimate for Zr,lf
than is RSER at both frequencies (i.e., measurements of RPAR/Zr,lf are close to 1
more often than are measurements of RSER/Zr,lf). Also, RPAR more closely
estimates Zr,lf when RPAR is smaller; the same applies to RSER. At 100 Hz, RPAR
and RSER can underestimate Zr,lf by factors of 3 and 10, respectively. This
increases to factors of 13 and 100 for RPAR and RSER, respectively when
measured at 1000 Hz.
Overall, the skin impedance results shown in Figure 2.6 indicate that skin
resistivity and, therefore, its barrier function to ions or polar molecules is
estimated better by impedance measurements at lower frequency, and that
measurements at higher frequency may show little correlation with skin
resistivity. This is consistent with observations from others. For example, Kalia
et al. (1998) found that changes in measurements of in-vivo transepidermal water
loss (TEWL) during skin barrier function development in premature infants
correlated with the modulus of the impedance measured at 1.6 Hz but not with
impedance measured at 486 Hz. Also, in experiments comparing in-vitro
measurements of tritiated water permeability with RPAR determined at 1000 Hz for
heat-separated human epidermal membranes, Fasano et al. (2002) observed
that the natural logarithm of the tritiated water permeability was not linearly
related to the natural logarithm of RPAR measured at 1000 Hz. Their observation
is consistent with the results presented in Figure 2.6b and d, which shows that

56
the ratios of RPAR/Zr,lf and RSER/Zr,lf measured at 1000 Hz were not equal to one
or independent of the measured skin impedance.
The OECD guidelines for identifying chemicals that irreversibly damage
skin recommend measuring impedance in SER mode at frequencies between 50
and 1000 Hz (OECD, 2004b). Based on the present, more thorough,
examination of the frequency dependence of skin impedance measurements, the
skin barrier to polar and ionic compounds is best assessed at a frequency that is
not larger than 100 Hz.
Values of CSER/A and CPAR/A calculated from Gamry potentiostat
measurements at 100 and 1000 Hz are presented in Figure 2.7 as a function of
(Zr,lf A) for the same skin samples shown in Figure 2.6. As expected from the
results shown in Figure 2.5, CPAR determined at either 100 or 1000 Hz is
insensitive to variations in (Zr,lf A). In contrast, CSER decreases with increasing
Zr,lf, although the data scatter for the measurements at 1000 Hz are too large to
derive a meaningful correlation. However, measurements of CSER at 100 Hz are
obviously correlated with (Zr,lf A) with only a little scatter for skin samples having
area-normalized values of Zr,lf between about 20 and 80 kΩ cm2; for these,
CSER/A is related to (Zr,lf A) by
( ) ( )SER r,lflog / 1.07 log 3.85C A Z A= − ⋅ + r2 = 0.94 (2.6)
where the units for CSER/A and (Zr,lf A) are nF/cm2 and kΩ cm2, respectively.

57
Figure 2.7 Area-normalized values of CSER and CPAR calculated from the complex impedance of 145 cadaver skin samples measured using the Gamry potentiostat at either 100 or 1000 Hz and plotted as a function of (Zr,lf A).
Two factors make CSER measured at 100 Hz for human skin more
sensitive to changes in the skin resistance than CSER measured at 1000 Hz.
First, the variation in the effective capacitance of most skin samples is relatively
small. Second, 100 Hz is usually within a factor of about four of the characteristic
frequency (fc) for human skin, defined here as the frequency at which the
negative of the imaginary component of the impedance is maximized. For an R-
C model circuit, fc is related to the skin resistance and capacitance as (Orazem
and Tribollet, 2008):

58
c
skin
1
2 skin
fR Cπ
= (2.7)
For an R-CPE circuit model, Cskin in Eq. (2.7) is the effective skin capacitance,
Cskin,eff, which is described in the Appendix.
When CSER is measured at a frequency close to the characteristic
frequency, it varies strongly with Rskin but minimally with small variations in the
effective skin capacitance. When measured at a frequency that is more than an
order of magnitude larger or smaller than the characteristic frequency, CSER is
nearly insensitive to Rskin but affected by variations in the effective capacitance.
The variation of CSER at 100 Hz and 1000 Hz with Rskin is illustrated in
Figure 2.8, in which predictions from the R-CPE model circuit (described by Eqs.
(A.7)and (A.8) in the Appendix) are presented and compared to the 145
experimental values from Figure 2.7. The model predictions were calculated at
the mean value in the effective skin capacitance plus and minus one standard
deviation assuming a log mean distribution of the effective capacitance values for
the 145 skin samples shown in Figures 2.6 and 2.7. Specifically, the mean ± one
standard deviation in the logarithm of Cskin,eff/A was equal to 1.60 ± 0.30, which
corresponds to a mean of 39.8 nF/cm2 with upper and lower bounds at 75.8
nF/cm2 and 20.2 nF/cm2, respectively. The α parameter in the R-CPE model
was assumed to be 0.8, which is a typical number for skin (Hirschorn et al., 2010;
Poon and Choy, 1981). The predicted dependence of CSER with Rskin is in
excellent agreement with the experimental results at both 100 and 1000 Hz.

59
Figure 2.8 Area-normalized values of CSER calculated from the complex impedance of 145 cadaver skin samples measured using the Gamry potentiostat plotted as a function of the Zr,lf compared with CSER/A predicted by the R-CPE model circuit plotted as a function of Rskin for the mean value of Cskin,eff/A (solid curve) plus and minus one standard deviation (long and short dashed curves respectively) assuming a log mean distribution of Cskin,eff/A for the 145 skin samples shown in Figures 2.6 and 2.7: data compared with model at 100 Hz (a) and 1000 Hz (c); and model alone at 100 Hz (b) and 1000 Hz (d).
The values of (Zr,lf A) at 20 and 80 kΩ cm2 indicated on Figure 2.8
designate the interval over which CSER measured at 100 Hz appears to be
approximately linear with (Zr,lf A). The characteristic frequencies for skin samples
within the 20 to 80 kΩ cm2 interval are approximately 25 to 400 Hz. For these
samples, 100 Hz is within a factor of 4 smaller or larger than fc, whereas, 1000

60
Hz is larger than fc by 2.5 to 40 fold, which is consistent with the greater effect of
skin resistance on CSER measured at 100 Hz. Typically, fc is less than 100 Hz for
samples with (Rskin A) > 80 kΩ cm2 and greater than 100 Hz for samples with
(Rskin A) < 20 kΩ cm2. Skin samples considered acceptable for diffusion cell
determinations of chemical permeability generally have (Rskin A) that are 20 kΩ
cm2 or a little larger, which is within the approximately linear interval for CSER and
Rskin.
Interestingly, from the model predictions at 100 Hz (Figure 2.8b) for a fixed
effective skin capacitance, it is evident that CSER actually is not linear with Rskin
over the interval between 20 and 80 kΩ cm2. The apparent linear relationship of
CSER and Rskin between 20 and 80 kΩ cm2 is caused by the intersections of the
CSER versus Rskin curves at various values of the effective skin capacitance.
2.4.4 Application for Assessing Skin Integrity
Often the goal of LCR databridge measurements is to test the integrity of
skin samples used for in-vitro determinations of chemical permeation through
skin. For this purpose, the meaningful test quantity is electrical resistivity, the
magnitude of which, for LCR databridge instruments reporting RPAR, RSER, CPAR
and CSER values at 100 and 1000 Hz, is most closely represented by RPAR at 100
Hz. However, the correlation between CSER and Zr,lf observed in Figures 2.7 and
2.8 suggests that CSER measured at 100 Hz might also be used as a surrogate
measure for resistivity. Therefore, using the 145 cadaver skin measurements
presented in Figures 2.6 through 2.8, the suitability of using (RPAR A) and

61
(CSER/A) determined at 100 Hz as surrogates for identifying skin samples with
acceptable and unacceptable resistivity was explored.
The evaluation scheme is illustrated in Figure 2.9. For the selected test
value of the area-normalized DC skin resistance (Rskin A)test, the test value of the
surrogate measurement is chosen. For the chosen surrogate test value, the
number of skin samples was determined that, according to the area-normalized
surrogate measure, was either acceptable or unacceptable. By comparing
(Rskin A)test to values of (Zr,lf A), assumed to represent (Rskin A) for each skin
sample, results identified as acceptable according to the surrogate
measurements were then categorized as either true acceptable (designated TA),
meaning (Rskin A) > (Rskin A)test, or true unacceptable (designated TU), meaning
(Rskin A) < (Rskin A)test. Similarly, results identified by the surrogate measurements
as unacceptable were categorized as either false acceptable, FA, or false
unacceptable, FU, according to (Rskin A) compared with (Rskin A)test. For (RPAR A)
as the selected surrogate test measurement, skin samples are deemed
acceptable if (RPAR A) > (RPAR A)test, and unacceptable if (RPAR A) < (RPAR A)test.
Since (CSER /A) decreases with increasing skin resistance, skin samples are
deemed acceptable if (CSER /A) < (CSER
/A)test, and unacceptable if (CSER /A) >
(CSER /A)test. The performance results for four surrogate criteria are reported in
Table 2.2 as the percentage of the 145 skin samples identified as TA, FA, TU or
FU for values of (Rskin A)test between 10 and 36 kΩ-cm2, which represents the
range of previously proposed test values for RPAR or Rskin.

62
Figure 2.9 Schematic diagram illustrating the scheme for evaluating surrogate measurements for testing skin integrity.
The first surrogate criteria in Table 2.2 is (RPAR A)test set equal to
(Rskin A)test, which is consistent with the assumption that RPAR measured at 100
Hz is a good estimate of Rskin. Because RPAR measured at 100 Hz is generally
less than Zr,lf (see Figure 2.6), choosing (RPAR A)test at 100 Hz to equal (Rskin A)test
is biased toward rejecting acceptable skin samples.
To use (CSER/A) measured at 100 Hz as a surrogate for recognizing skin
samples with acceptable and unacceptable resistivity, suitable values for
(CSER/A)test must be determined. Assuming the cadaver skin impedance data
shown in Figure 2.8 are representative of skin samples generally, criteria for
(CSER/A)test were estimated by substituting (Rskin A)test for (Zr,lf A) in Eq. (2.6).
Overall, using (CSER/A)test calculated using Eq. (2.6) as surrogate test criterion for
(Rskin A)test was superior to using (RPAR A)test at 100 Hz equal to (Rskin A)test.
(RP
AR
⋅ A
) (Rskin ⋅ A)
≅ (Zr,lf ⋅ A)
TA
TU
FA
FU
Surrogate measurement
test value:
(RPAR ⋅ A)test or
(CSER /A)test (C
SE
R /A
)
(Rskin ⋅ A)test
Su
rro
ga
te m
ea
su
rem
en
t

63
Table 2.2 Performance of (RPAR A) at 100 Hz and 1000 Hz and (CSER/A) at 100 Hz as surrogate criteria for (Rskin A) in testing skin integritya
Surrogate Criterion
f (Hz) Quantity
Relationship of test
value to (Rskin A)test b
Test value
b
(Rskin A)test
kΩ cm2
TA
TU FA FU
10 10 93.8 5.5 0.0 0.7 15 15 85.5 10.3 0.0 4.1 20 20 75.2 13.8 0.0 11.0 25 25 68.3 20.7 0.0 11.0 30 30 64.1 26.9 0.0 9.0
100 (RPAR A) (RPAR A)test =
(Rskin A)test
36 36 60.0 32.4 0.0 7.6
598 10 92.4 4.8 0.7 2.1 387 15 89.0 9.0 1.4 0.7 285 20 84.8 13.1 0.7 1.4 224 25 76.6 19.3 1.4 2.8 185 30 73.1 26.2 0.7 0.0
100 (CSER/A) Eq. (6):
log (CSER/A)test =
-1.07 log(Rskin·A)test
+ 3.85
152 36 67.6 32.4 0.0 0.0
8.5 10 93.8 5.5 0.0 0.7 11.9 15 89.0 9.7 0.7 0.7 15.1 20 84.8 13.1 0.7 1.4 18.3 25 76.6 17.2 3.4 2.8 21.3 30 68.3 24.1 2.8 4.8
100 (RPAR A) Eq. (8):
log (RPAR A)test =
0.837 log(Rskin A)test
+ 0.092 24.8 36 67.6 31.7 0.7 0.0
5.3 10 93.8 4.8 0.7 0.7 6.9 15 85.5 8.3 2.1 4.1 8.4 20 77.9 11.7 2.1 8.3 9.7 25 71.0 15.2 5.5 8.3
11.0 30 66.2 19.3 7.6 6.9
1000 (RPAR A) Eq. (9):
log (RPAR A)test =
0.668 log(Rskin A)test
+ 0.053 12.4 36 64.8 26.9 5.5 2.8
a Results are reported as the percentage of the 145 skin samples that are identified by the surrogate criterion as acceptable in agreement (TA = true acceptable) or disagreement (FA =
false acceptable) with (Rskin A) or that are identified by the surrogate criterion as unacceptable
in agreement (TU = true unacceptable) or disagreement (FU = false unacceptable) with
(Rskin A). For (Rskin A) and (RPAR A), acceptable skin must exceed the test value; for (CSER/A)
acceptable skin must be less than the test value. b Test value of the surrogate measurement in units of kΩ cm
2 for (RPAR A)test and nF/cm
2 for
(CSER/A)test.
The following regression of (RPAR A) determined at 100 Hz to (Zr,lf A),
( ) ( )PAR r,lflog 0.837log 0.092R A Z A= + r2 = 0.97 (2.8)

64
where the units for (Zr,lf A) and (RPAR A) are kΩ cm2, should provide an improved
criterion for (RPAR A)test. Specifically, (RPAR A)test at 100 Hz is calculated by
substituting (Rskin A)test for (Zr,lf A) in Eq. (2.8). A similar approach was also
applied to derive (RPAR A)test measured at 1000 Hz from the following regression
for (RPAR A)test at 1000 Hz to (Zr,lf A):
( ) ( )PAR r,lflog 0.668log 0.053R A Z A= + r2 = 0.83 (2.9)
Equations (2.8) and (2.9) are compared with the 145 experimental
measurements in Figure 2.10. The values of (RPAR A)test calculated according to
Eqs. (2.8) and (2.9) for selected values of (Rskin A)test are listed in Table 2.2 along
with a performance summary.
Figure 2.10 Area-normalized values of RPAR calculated from the complex impedance of 145 cadaver skin samples measured at 100 Hz and 1000 Hz using the Gamry potentiostat plotted as a function of the (Zr,lf A). The solid lines were determined by linear regression and correspond to Eqs. (2.8) and (2.9) for the 100 Hz and 1000 Hz measurements, respectively.

65
Compared with the results for (RPAR A)test = (Rskin A)test, applying (RPAR A)test
calculated from Eq. (2.8) produced fewer incorrectly identified samples, although
more samples were incorrectly identified as acceptable (i.e., FA). Clearly,
(RPAR A) measured at 1000 Hz is inferior to the other surrogate measurements
listed in Table 2.2 for correctly identifying skin samples with acceptable and
unacceptable integrity.
2.4.5 Comparison to the Literature
Equations (2.8) and (2.9) provide a means of estimating the DC skin
resistance that corresponds with the previously proposed test values for RPAR
based on LCR databridge measurements. Davies et al. (2004) recommended
using (RPAR A)test of 25 kΩ cm2 measured at 100 Hz, which corresponds to
(Rskin A)test equal to about 36 kΩ cm2 calculated using Eq. (2.8). This is not too
different from (Rskin A)test equal to 30 kΩ cm2, which is estimated for (RPAR A)test at
1000 Hz equal to 11 kΩ cm2 (Fasano et al., 2002). This similarity in (Rskin A)test
values is expected because (RPAR A)test in both studies was chosen to match the
same value for tritiated water absorption (i.e., 1.5 mg cm-2 h-1). Notably, Kasting
and Bowman (1990) recommended 35 kΩ cm2 for (Rskin A)test based in part on
current-voltage behavior in studies of sodium ion absorption in experiments at
37oC. More recently, 13 kΩ cm2 and 7 kΩ cm2 have been suggested for
(RPAR A)test measured at 100 and 1000 Hz, respectively (Horne et al., 2010);
these values, developed to be consistent with a tritiated water absorption of 3.5
mg cm-2 h-1, correspond to (Rskin A)test equal to 16 kΩ cm2.

66
From the ratio of urea permeability measured at 39o and 27oC, Peck et al.
(1995) discovered that heat-separated human skin with (Rskin A) less than 20 kΩ
cm2 at 27oC, behaved differently than higher resistance skin and like porous
Nuclepore membranes. Thus, Peck et al. (1995) selected 20 kΩ cm2 for
(Rskin A)test. This DC resistance criteria would correspond with 15.1 and 8.4 kΩ
cm2 for (RPAR A)test determined at 100 and 1000 Hz, respectively or 285 nF/cm2
for (CSER/A)test measured at 100 Hz.
2.5 Conclusions
Resistance and capacitance values reported by LCR databridge
instruments represent manipulations of the complex impedance and are,
therefore, functions of the measurement frequency. With the exception of low
impedance skin samples, the RSER, RPAR and CPAR measured at 1000 Hz and
RSER and CPAR measured at 100 Hz will generally provide poor estimates of the
skin resistivity. Measurements of RPAR and CSER at 100 Hz may be used as
surrogate measures for skin resistivity to assess the integrity of human skin
samples. While the sensitivity of RPAR measured at low frequency to skin
resistance is consistent with results presented in the literature, a surprising result
of the present study is that the capacitance CSER measured at low frequency
provides an even better surrogate for skin resistivity. One should caution,
however, that, depending on the chosen acceptance criteria, some skin may be
falsely identified as acceptable or unacceptable.

67
REFERENCES
Davies, D.J., Ward, R.J., Heylings, J.R., 2004. Multi-species assessment of electrical resistance as a skin integrity marker for in vitro percutaneous absorption studies. Toxicol. In Vitro 18, 351-358.
DeNuzzio, J.D., Berner, B., 1990. Electrochemical and iontophoretic studies of human skin. Journal of Controlled Release 11, 105-112.
Fasano, W.J., Hinderliter, P.M., 2004. The Tinsley LCR Databridge Model 6401 and electrical impedance measurements to evaluate skin integrity in vitro. Toxicol. In Vitro 18, 725-729.
Fasano, W.J., Manning, L.A., Green, J.W., 2002. Rapid integrity assessment of rat and human epidermal membranes for in vitro dermal regulatory testing: correlation of electrical resistance with tritiated water permeability. Toxicol. In Vitro 16, 731-740.
Franz, T.J., Lehman, P.A., 1990. The use of water permeability as a means of validation for skin integrity in vitro percutaneous absorption studies. J. Invest. Dermatol. 94, 525.
H. Tinsley & Co, 1996. 6401 LCR Databridget Users Manual, Surrey, England.
Heylings, J.R., 2009. Personal communication, October 13,.
Heylings, J.R., Esdaile, D.J., 2007. Percutaneous absorption of pesticides, In: Roberts, M.S., Walters, K.A. (Eds.), Dermal Absorption and Toxicity Assessment, Second edition ed. Informa Healthcare, New York, pp. 575-591.
Hirschorn, B., Orazem, M.E., Tribollet, B., Vivier, V., Frateur, I., Musiani, M., 2010. Determination of effective capacitance and film thickness from constant-phase-element parameters. Electrochimica Acta 55, 6218-6227.
Horne, A., Blackstock, C., Roper, C.S., 2010. Evaluation of electrical resistance for use as a rapid method for human skin barrier integrity assessment in the flow through diffusion cell, Proceedings of the Skin Forum, 11th Annual Meeting, Edinburgh, Scotland.
Hsu, C.H., Mansfeld, F., 2001. Technical note: Concerning the conversion of the constant phase element parameter Y0 into a capacitance. Corrosion 57, 747-748.
International Programme on Chemical Safety (IPCS), 2006. Dermal Absorption, Environmental Health Criteria 235. World Health Organization, Geneva.
Kalia, Y.N., Nonato, L.B., Lund, C.H., Guy, R.H., 1998. Development of skin barrier function in premature infants. J. Invest. Dermatol. 111, 320-326.
Kasting, G.B., Bowman, L.A., 1990. DC electrical properties of frozen, excised human skin. Pharm. Res. 7, 134-143.

68
Kasting, G.B., Filloon, T.G., Francis, W.R., Meredith, M.P., 1994. Improving the sensitivity of in vitro skin penetration experiments. Pharm. Res. 11, 1747-1754.
Kontturi, K., Murtomaki, L., 1994. Impedance spectroscopy in human skin. A refined model. Pharm. Res. 11, 1355-1357.
Nicander, I., Åberg, P., Ollmar, S., 2006. Bioimpedance as a noninvasive method for measuring changes in skin, In: Serup, J., Jemec, G.B.E., Grove, G.L. (Eds.), Handbook of Non-Invasive Methods and the Skin, Second ed. Taylor & Francis, Boca Raton, FL.
OECD, 2004a. OECD Guideline for Testing of Chemicals. Guideline 428: Skin Absorption: In Vitro Method (Original Guideline, adopted 13th April 2004).
OECD, 2004b. OECD Guideline for the Testing of Chemicals. Guidline 430: In Vitro Skin Corrosion: Transcutaneous Electrical Resistance Test (TER) (Original Guideline, adopted 13th April 2004).
Oh, S.Y., Guy, R.H., 1994a. Effect of enhancers on the electrical properties of skin: The effect of azone and ethanol. J. Kor. Pharm. Sci. 24, S41-S47.
Oh, S.Y., Guy, R.H., 1994b. The effect of oleic acid and propylene glycol on the electrical properties of skin. J. Kor. Pharm. Sci. 24, 281-287.
Oh, S.Y., Leung, L., Bommannan, D., Guy, R.H., Potts, R.O., 1993. Effect of current, ionic strength and temperature on the electrical properties of skin. Journal of Controlled Release 27, 115-125.
Orazem, M.E., Tribollet, B., 2008. Electrochemical Impedance Spectroscopy. Wiley-Interscience, Hoboken, NJ.
Peck, K.D., Ghanem, A.H., Higuchi, W.I., 1995. The effect of temperature upon the permeation of polar and ionic solutes through human epidermal membrane. J. Pharm. Sci. 84, 975-982.
Poon, C.S., Choy, T.T.C., 1981. Frequency dispersions of human-skin dielectrics. Biophys. J. 34, 135-147.
Scott, R.C., Batten, P.L., Clowes, H.M., Jones, B.K., Ramsey, J.D., 1992. Further validation of an in vitro method to reduce the need for in vivo studies for measuring the absorption of chemicals through rat skin. Fundam. Appl. Toxicol. 19, 484-492.
Scott, R.C., Corrigan, M.A., Smith, F., Mason, H., 1991. The influence of skin structure on permeability: an intersite and interspecies comparison with hydrophilic penetrants. J. Invest. Dermatol. 96, 921-925.
White, E.A., 2011. PhD Thesis. Colorado School of Mines, Golden, Colorado.
White, E.A., Orazem, M.E., Bunge, A.L., 2011. A critical analysis of single-frequency LCR databridge impedance measurements of human skin. Toxicol. In Vitro 25, 774-784.

69
Yamamoto, T., Yamamoto, Y., 1976a. Dielectric constant and resistivity of epidermal stratum corneum. Medical and Biological Engineering and Computing 14, 494-500.
Yamamoto, T., Yamamoto, Y., 1976b. Dielectric constant and resistivity of epidermal stratum corneum. Med. Biol. Eng. Comput. 14, 494-500.
Yamamoto, T., Yamamoto, Y., 1976c. Electrical properties of the epidermal stratum corneum. Med. Biol. Eng. 14, 151-158.
Yamamoto, T., Yamamoto, Y., 1981a. Non-linear electrical-properties of skin in the low-frequency range. Med. Biol. Eng. Comput. 19, 302-310.
Yamamoto, T., Yamamoto, Y., 1981b. Non-linear electrical-properties of skin in the low-frequency range. Med. Biol. Eng. Comput. 19, 302-310.

70
APPENDIX
The complex impedance of the R-C circuit model shown in Figure 1 is
represented by the following equation:
skine
skin skin1
RZ R
R Cω= +
+. (A.1)
from which the real and imaginary parts are determined to be:
( )
skinr e 2
skin skin1
RZ R
R Cω= +
+ (A.2)
and
( )
2
skin skinj 2
skin skin1
R CZ
R C
ω
ω= −
+ (A.3)
where the radial frequency ω is equal to 2πf for f given in cycles per time.
Although Eqs. (A.1) through (A.3) capture the essential features of skin
impedance measured as a function of frequency, the R-CPE circuit model, in
which a constant phase element (CPE) replaces the capacitor shown in Figure 1,
provides better quantitative agreement with experimental data (Hirschorn et al.,
2010; Kontturi and Murtomaki, 1994; Yamamoto and Yamamoto, 1976b, c,
1981a).
The complex impedance of the R-CPE model circuit is more complicated
than the R-C model circuit because the impedance of a CPE depends on two
parameters, Q and α, rather than just one (the capacitance, Cskin) for a capacitor.
For the R-CPE model circuit, the PAR and SER modes for R and C are
described by the following four equations:

71
( )
( )( )
2
e
e e
ePAR 2
re
e
2 cos21
1 cos2
RQRR R QRR
R RR
Y R QRQR
R R
α
α
α
α
ω απω
ω απω
+ + +
+ = =
+ +
+
(A.4)
( )
2
SER r e2
cos2
1 2 cos2
R R Q
R Z R
RQ RQ
α
α α
απω
απω ω
+
= = +
+ +
(A.5)
( ) ( )
( )
12
ej
PAR 2
e
e e
e
sin2
2 cos2
QR R RY
CRQR
R R QRRR R
α
α
α
απω
ω ω απω
− +
= =
+ + +
+
(A.6)
and
( )2
SER2 2
1 2 cos1 2
sin2
j
RQ RQ
CZ
R Q
α α
α
απω ω
απωω
+ +
= − =
(A.7)
The effective capacitance of an R-CPE model circuit of skin can be
estimated using Eq. (2.7) from the characteristic frequency, defined here as the
frequency at which the negative of the imaginary part of the impedance is at its
maximum value (Orazem and Tribollet, 2008). It follows that this definition of the
effective skin capacitance (Cskin,eff) is related to α and Q as follows:
( )11
skin,eff skinC Q Rα αα −
= (A.8)
As described by Hirschorn et al. (2010), Eq. (A.8) is in agreement with the
development presented by Hsu and Mansfeld (2001) and used by Oh and Guy
(1994a, 1994b) to estimate the capacitance of human skin.

72
CHAPTER 3
SINGLE-FREQUENCY IMPEDANCE MEASUREMENTS AS
PREDICTORS OF HUMAN SKIN PERMEABILITY TO WATER AND
OTHER HYDROPHILIC COMPOUNDS
The content of this chapter was accepted for publication in Toxicology in Vitro
(White et al., 2011a) and reproduced here with consent from the publisher and co-
authors (see thesis Appendix).
The objective of this study was to correlate measurements on the same
pieces of skin of tritiated water permeability with impedance determined at either
100 or 1000 Hz using an LCR databridge. A previously published expression
based on a simple circuit of a parallel resistor and constant phase element (CPE)
was used to relate (RPAR A) measured at different frequencies to the steady-state
skin permeability of tritiated water. Using this analysis, tritiated water
permeability (kp) and (RPAR A) data from three laboratories were shown to be
consistent with each other and also with the relationship between (Rskin A) and kp
observed for other model hydrophilic chemicals: urea and mannitol. These
results were used to compare on a consistent basis proposed tests for identifying
and excluding damaged skin from chemical absorption studies. The criterion of
20 kΩ cm2 for (Rskin A) corresponds to a tritiated water permeability of 3.2 x 10⁻³
cm/h, which should exclude damaged skin without screening undamaged but
higher permeability skin samples from study.

73
3.1 Introduction
In vitro diffusion cell methods have been used extensively to measure the
rate and extent of chemical penetration into and through skin from humans or
animals. The potential exists for skin samples to be damaged during collection,
storage or handling, which may affect the percutaneous absorption
measurements (Scott et al., 1991). Therefore, the use of a barrier integrity test
for skin penetration studies is advised and is often required if data are collected
for regulatory submission (Heylings and Esdaile, 2007; International Programme
on Chemical Safety (IPCS), 2006; OECD, 2004). Recommended integrity test
protocols include determination of tritiated water permeability, the rate of
transepidermal water loss (TEWL), and transcutaneous electrical resistance
(International Programme on Chemical Safety (IPCS), 2006; OECD, 2004). Skin
samples are rejected if the water permeability or water loss is considered to be
too high or the electrical resistance too low for reliable determination of
permeability parameters.
With respect to tritiated water permeability measured at steady state (kp),
the criteria for rejecting human skin samples have been set variously at 1.5 x 10⁻³
cm/h (Davies et al., 2004; Fasano et al., 2002; Scott et al., 1987), 2.0 x 10⁻³ cm/h
(van de Sandt et al., 2000), 2.5 x 10⁻³ cm/h (Bronaugh and Stewart, 1986) and
4.0 x 10⁻³ cm/h (Buist et al., 2005). Recently, Meidan and Roper (2008)
suggested that using smaller values of tritiated water permeability as integrity
criteria could cause undamaged but higher permeability samples to be rejected,
which could bias the permeability measurements toward underestimating

74
absorption. Therefore, they recommended using 4.5 x 10⁻³ cm/h as the tritiated
water permeability criterion based on the observation that 95% of the 2390 skin
samples in a study of 112 female volunteers were below this value.
Steady-state determinations of tritiated water permeability require two or
more hours, which delays the start of chemical permeation measurements when
used to test skin integrity. Alternative tritiated water methods requiring less time
have been proposed. Kasting et al. (1994) judged skin to be acceptable for
diffusion cell measurements if the amount of tritiated water collected in the
receptor fluid over 1 h after a 5-minute application was less than 1.6 µL/cm2. By
comparing hourly measurements of tritiated water absorption collected for 2 h,
Runciman et al. (2009), concluded that an absorption of 2.4 µL/cm2 (i.e.,
calculated from 0.6% of the 400 µL/cm2 application) in the first hour was
equivalent to a permeability coefficient of 3.5 x 10⁻³ cm/h calculated from
absorption at 2 h.
Single-frequency electrical impedance measurements are rapid and
economical alternatives to tritiated water flux for skin integrity testing. The
method involves measuring the potential or current response to a small-
amplitude, typically sinusoidal, modulation of an input current or potential.
Impedance is the ratio of the change in potential to the change in current, which
for skin depends on the modulation frequency. In the limit of low frequency, the
impedance measurement approaches the direct current (DC) resistance,
designated for skin as Rskin.

75
Proposed criteria for in vitro testing of human skin integrity, several of
which are listed in Table 3.1, have been selected by comparing electrical
measurements on a series of samples to the percutaneous absorption
measurements for tritiated water (Davies et al., 2004; Fasano et al., 2002), polar
compounds (Peck et al., 1995), or ionized salts (Kasting and Bowman, 1990).
For electrical resistance criteria derived from tritiated water permeability data, the
chosen kp criterion is reported. Electrical resistance test criteria vary widely, from
7 to 45 kΩ cm2 for the studies listed in Table 3.1. Even for those derived using
the same tritiated water permeability coefficient, the differences in criteria are
large (e.g., 11 to 45 kΩ cm2 for kp of 1.5 x 10⁻³ cm/h).
The variation in the electrical resistance test criteria is due in part to the
choice of the percutaneous absorption measurement method. In addition to this,
skin resistance has been determined in different ways that affect the magnitude
of the measurement. For example, resistances determined using an LCR
databridge, like the PRISM or Tinsley instruments (Davies et al., 2004; Fasano et
al., 2002; OECD, 2004b), in PAR mode (RPAR) measured at different frequencies
are different; in general, these are also different from resistance determined
using a DC method (Fasano and Hinderliter, 2004; White et al., 2011b).
In assessing skin integrity, the meaningful quantity is electrical resistivity
(ρ), which characterizes quantitatively the pathway for transport of ions, which is
enhanced for damaged skin. The skin resistivity is proportional to the area-
normalized skin resistance measured using a direct current method; i.e., (Rskin A)
where A is the area.
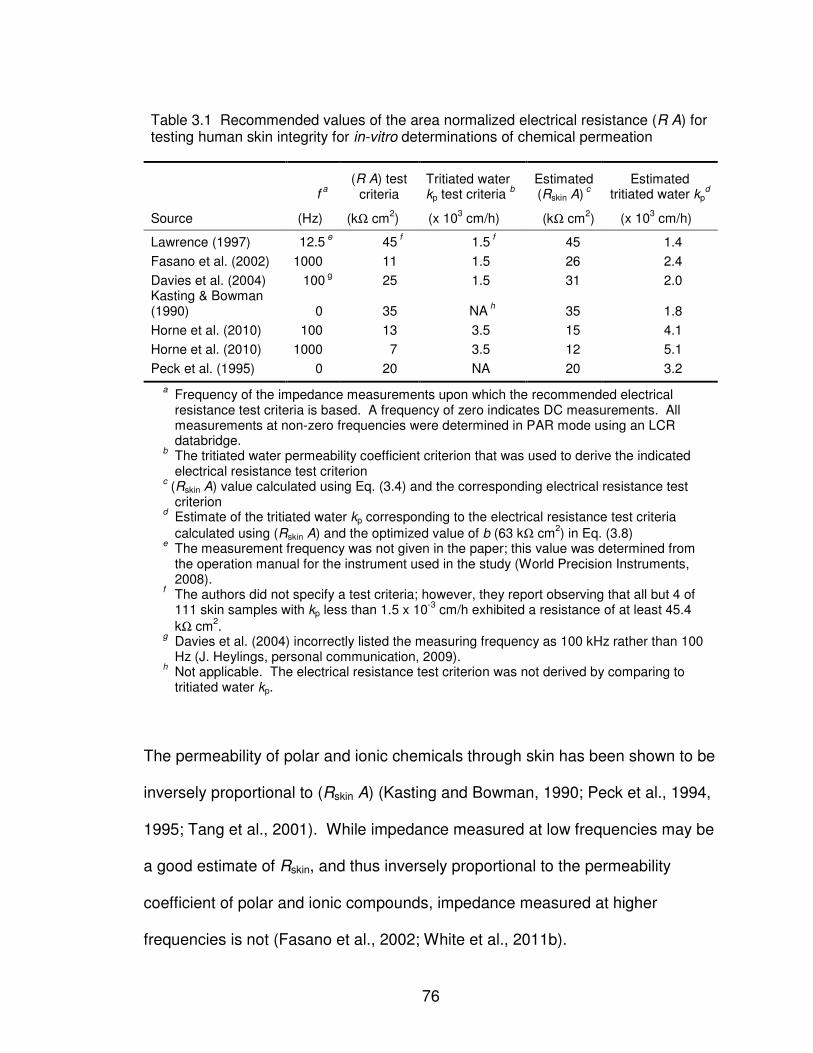
76
Table 3.1 Recommended values of the area normalized electrical resistance (R A) for testing human skin integrity for in-vitro determinations of chemical permeation
f a
(R A) test criteria
Tritiated water kp test criteria
b
Estimated (Rskin A)
c
Estimated tritiated water kp
d
Source (Hz) (kΩ cm2) (x 10
3 cm/h) (kΩ cm
2) (x 10
3 cm/h)
Lawrence (1997) 12.5 e 45
f 1.5
f 45 1.4
Fasano et al. (2002) 1000 11 1.5 26 2.4
Davies et al. (2004) 100 g
25 1.5 31 2.0 Kasting & Bowman (1990) 0 35 NA
h 35 1.8
Horne et al. (2010) 100 13 3.5 15 4.1
Horne et al. (2010) 1000 7 3.5 12 5.1
Peck et al. (1995) 0 20 NA 20 3.2 a
Frequency of the impedance measurements upon which the recommended electrical resistance test criteria is based. A frequency of zero indicates DC measurements. All measurements at non-zero frequencies were determined in PAR mode using an LCR databridge.
b The tritiated water permeability coefficient criterion that was used to derive the indicated electrical resistance test criterion
c (Rskin A) value calculated using Eq. (3.4) and the corresponding electrical resistance test
criterion d Estimate of the tritiated water kp corresponding to the electrical resistance test criteria
calculated using (Rskin A) and the optimized value of b (63 kΩ cm2) in Eq. (3.8)
e The measurement frequency was not given in the paper; this value was determined from the operation manual for the instrument used in the study (World Precision Instruments, 2008).
f The authors did not specify a test criteria; however, they report observing that all but 4 of
111 skin samples with kp less than 1.5 x 10⁻³
cm/h exhibited a resistance of at least 45.4
kΩ cm2.
g Davies et al. (2004) incorrectly listed the measuring frequency as 100 kHz rather than 100 Hz (J. Heylings, personal communication, 2009).
h Not applicable. The electrical resistance test criterion was not derived by comparing to tritiated water kp.
The permeability of polar and ionic chemicals through skin has been shown to be
inversely proportional to (Rskin A) (Kasting and Bowman, 1990; Peck et al., 1994,
1995; Tang et al., 2001). While impedance measured at low frequencies may be
a good estimate of Rskin, and thus inversely proportional to the permeability
coefficient of polar and ionic compounds, impedance measured at higher
frequencies is not (Fasano et al., 2002; White et al., 2011b).

77
White et al. (2011) derived a relationship for RPAR in terms of skin
properties and developed a theoretical basis for describing the frequency
dependence of RPAR. Based on an analysis of impedance measurements of
many skin samples at multiple frequencies, the authors concluded that for skin
integrity testing, RPAR measurements at both 100 and 1000 Hz could be used,
although measurements at 100 Hz were preferred. In addition, the authors
proposed equations for relating (RPAR A) measured at different frequencies to
(Rskin A). It follows that it should be possible to extend these equations to relate
skin integrity test criteria based on tritiated water kp with electrical resistance test
criteria based on (RPAR A) measured at various frequencies.
The objective of this study was to compare (RPAR A) determined at 100
and 1000 Hz to the cumulative tritiated water absorption during 1 h of skin
exposure measured on the same pieces of skin. These new measurements
were then compared to previously reported correlations of steady-state tritiated
water permeation and RPAR determined at 100 and 1000 Hz by Davies et al.
(2004) and Fasano et al. (2002), respectively. The relationship between tritiated
water absorption and the estimate of skin resistivity was examined using
published equations relating the DC resistance to RPAR measurements
determined at different frequencies using an LCR databridge (White et al., 2011).
The observed linear correlation between the DC resistance estimates and
tritiated water permeability coefficients was consistent among the three
laboratories. These results were also consistent with the correlation in human

78
skin of the permeability coefficient for two model polar compounds and skin
resistance, measured using DC or low frequency AC methods.
3.2 Theory
Impedance spectroscopy and permeability measurements probe, in
different ways, the barrier that skin presents to the absorption of hydrophilic
compounds. An overview of the two measurement techniques and the
relationship between them is presented in this section.
3.2.1 Skin Impedance
Skin impedance is measured by applying a small-amplitude alternating
current or potential signal across the skin and measuring the responding
potential or current. The impedance is the ratio of the change in potential to the
change in current. The dielectric material in the skin causes a phase shift in the
measured signal relative to the applied signal, and, as a result, the measured
impedance varies with the frequency of the applied signal. Mathematically, this
means that the impedance is a complex number containing both real and
imaginary parts. The frequency response of skin is represented reasonably by a
simple equivalent circuit model consisting of a frequency-independent (Ohmic)
resistance (Re) in series with a parallel skin resistance (Rskin) and constant phase
element (CPE) as shown in Figure 3.1 (Hirschorn et al., 2010; Kontturi and
Murtomaki, 1994; Yamamoto and Yamamoto, 1976a; Yamamoto and Yamamoto,
1976b, 1981). For in vitro determinations of skin impedance, Re includes

79
contributions from the electrolyte solution on both sides of the skin, the wires,
and possibly the dermis and viable epidermis.
Figure 3.1 A simple R-CPE circuit model of skin.
In the skin integrity studies described below, an LCR databridge (i.e., the
Tinsley 6401 or AIM 6401) was used to measure impedance at a frequency of
100 or 1000 Hz. These instruments report one component of the complex
impedance as a resistance in parallel mode (RPAR), which is equal to the inverse
of the real part of the skin admittance (White et al., 2011b). The admittance is
the alternating current analog of the DC conductance and is equal to the inverse
of the impedance. Therefore, the frequency dependence of RPAR is described by
the following expression derived from the R-CPE equivalent circuit model (White
et al., 2011b):
( )( )( )
( )( )( )
( )
2
skin e
e skin skin e
skin ePAR 2
e skin
skin
skin e
22 2 cos
2
21 2 cos
2
R QR fR R QR R f
R RR
R QR fQR f
R R
α
α
α
α
π αππ
π αππ
+ + +
+ =
+ +
+
(3.1)

80
where f is the frequency (in units of Hz, cycles per second) of the applied
alternating current or potential, and Q and α are parameters quantifying the
behavior of the CPE (Orazem and Tribollet, 2008). For human skin, α is
approximately constant at 0.8 (Hirschorn et al., 2010; Poon and Choy, 1981) and
Q is related to the resistance (Rskin) and the effective capacitance of the skin
(Cskin,eff) by (Hirschorn et al., 2010; Hsu and Mansfeld, 2001)
( )1
skin,eff skinQ C Rαα −
= (3.2)
If Re is small compared to Rskin, then Eq. (3.1) can be simplified to give
( )
skinPAR
skin1 2 cos2
RR
QR fα απ
π
=
+
(3.3)
which can be written, after substituting for Q using Eq. (3.2), as
( )
skinPAR
skin skin,eff1 2 cos2
RR
f R Cα απ
π
=
+
(3.4)
According to Eq. (3.4), RPAR is only equal to Rskin when it is measured at low
frequency. At higher measurement frequencies, RPAR is less than Rskin and it
approaches zero in the limit of large frequency. If Re is not small relative to Rskin,
then RPAR will approach Re at high frequency and the sum of Rskin and Re at low
frequency.
3.2.2 Skin Permeability
Skin permeability to a chemical is often characterized by the permeability
coefficient (kp). It is calculated from the ratio of the steady-state flux (Jss) to the

81
driving force for diffusion, which is the chemical concentration in the vehicle (C)
when the concentration in the receptor fluid is kept close to zero, i.e.,
pssJ
kC
= (3.5)
In many in vitro diffusion cell experiments, the cumulative mass of chemical
delivered into the receptor solution (M) per area (A) is determined as a function
of time (t). If the concentration in the vehicle C is held constant, M/A increases
linearly with t after a delay that is approximately 2.4 times the lag time (tlag)
(Bunge and Cleek 1995). The slope of the linear (steady-state) portion of the
M/A versus t curve is Jss, and the time intercept is the lag time (tlag), thus,
( )ss lag/M A J t t= − for t > 2.4 tlag (3.6)
Experimental estimates for Jss that include M/A measurements at times less than
about 2.4 tlag, are systematically lower than the actual value (Bunge et al., 1995).
3.2.3 Relationship Between Skin Impedance and Permeability
The electrical resistivity of (ρ), which quantitatively characterizes the
resistance to ionic transport through skin, is related to the area normalized DC
skin resistance Rskin as
skinR A = ρℓ (3.7)
where ℓ is the thickness of the skin layer primarily responsible for electrical
resistance, which is usually the stratum corneum. The rate of ionic transport
through the skin is proportional to the electrical conductivity, which is the inverse
of ρ. Since kp for an ionic compound is also proportional to ionic transport
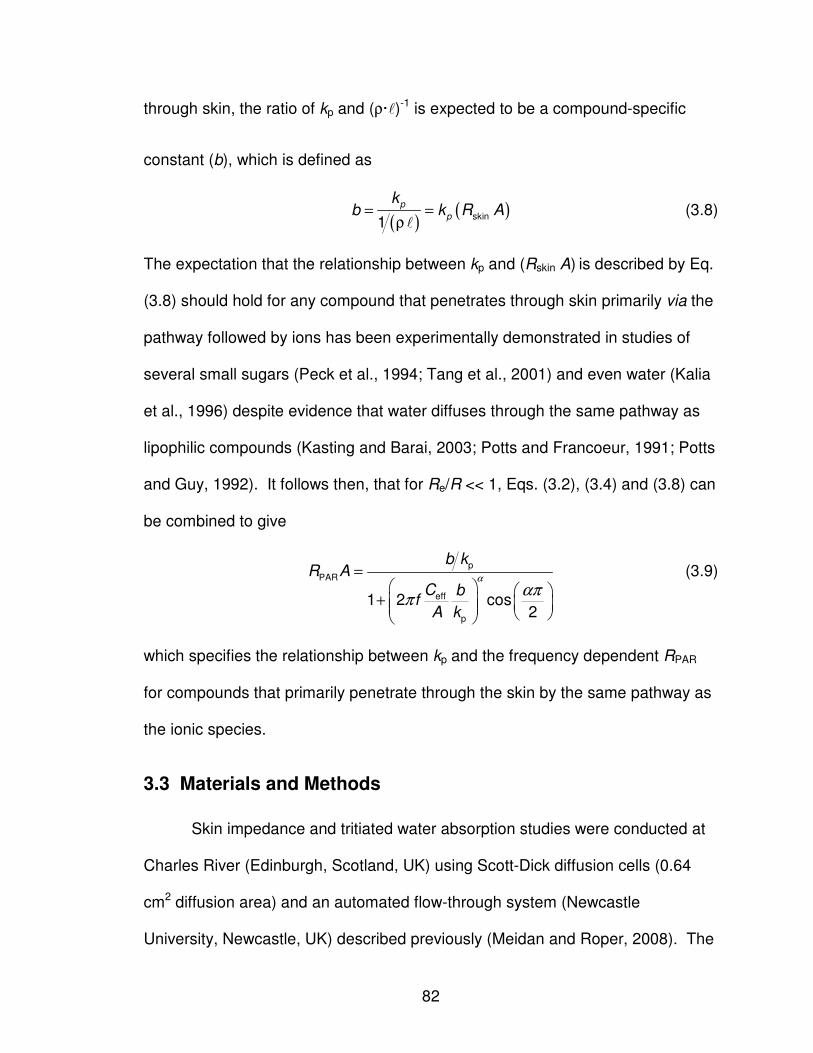
82
through skin, the ratio of kp and (ρ·ℓ)-1 is expected to be a compound-specific
constant (b), which is defined as
( )
( )skin1
p
p
kb k R A= =
ρℓ (3.8)
The expectation that the relationship between kp and (Rskin A) is described by Eq.
(3.8) should hold for any compound that penetrates through skin primarily via the
pathway followed by ions has been experimentally demonstrated in studies of
several small sugars (Peck et al., 1994; Tang et al., 2001) and even water (Kalia
et al., 1996) despite evidence that water diffuses through the same pathway as
lipophilic compounds (Kasting and Barai, 2003; Potts and Francoeur, 1991; Potts
and Guy, 1992). It follows then, that for Re/R << 1, Eqs. (3.2), (3.4) and (3.8) can
be combined to give
p
PAR
eff
p
1 2 cos2
b kR A
C bf
A k
α
αππ
=
+
(3.9)
which specifies the relationship between kp and the frequency dependent RPAR
for compounds that primarily penetrate through the skin by the same pathway as
the ionic species.
3.3 Materials and Methods
Skin impedance and tritiated water absorption studies were conducted at
Charles River (Edinburgh, Scotland, UK) using Scott-Dick diffusion cells (0.64
cm2 diffusion area) and an automated flow-through system (Newcastle
University, Newcastle, UK) described previously (Meidan and Roper, 2008). The

83
receptor fluid flow rate was set to 1.5 mL/h. This is referred to as the Charles
River study in the discussion below. Full thickness human skin obtained from 20
different donors (8 male abdomen, 7 female abdomen and 5 female breast, ages
19 to 66 years old) was acquired with full informed consent from the Plastic
Surgery Unit of St John’s Hospital (Livingston, Scotland, UK) and stored at about
–20°C as described elsewhere (Meidan and Roper, 2008). After removal from
frozen storage, samples were dermatomed (Zimmer, Swindon, UK) to a depth of
200-400 µm and used immediately. Five skin samples from each subject were
mounted with the stratum corneum facing the donor chamber. The receptor
solution was minimum essential medium eagle (Sigma, Product No. M4655) with
added glucose (1%, weight per volume), polyoxyethylene 20 oleyl ether (6%,
weight per volume), penicillin G (100 units/ mL) and streptomycin (0.1 mg/mL).
The skin surface temperature was maintained at 32 ± 1°C (Meidan and Roper,
2008).
Phosphate buffered saline (Sigma, Product No. P4417) 1 mL, was applied
to the skin surface in the donor chamber and allowed to equilibrate for 0.5 h, after
which RPAR was measured at 1000 Hz and then 100 Hz with the Tinsley 6401
LCR databridge (Surrey, England) using two 2-mm diameter stainless-steel wire
electrodes (Low Voltage Meter Probe, RS Components Limited, Corby,
Northamptonshire, UK) placed in the receptor and donor chambers, respectively.
The donor solution was then removed by pipette; the skin surface was dried with
tissue paper and left exposed to ambient air for 0.5 h while a blank sample of the
receptor solution was collected. Next, 250 µL (390 µL/cm2) of tritiated water

84
(Amersham Pharmacia Biotech UK Limited, Little Chalfont, Buckinghamshire,
UK) at 400,000 dpm/mL was applied to the stratum corneum surface of the skin
within the donor chamber for 1 h and the receptor fluid collected. This sample
was combined with 10 mL of liquid scintillation cocktail (Aquasafe 500 plus,
Zinsser Analytic, Frankfurt, Germany) and analyzed by liquid scintillation
counting using a Packard 2100-TR liquid scintillation analyzer (Perkin-Elmer,
Beaconsfield, UK).
The fraction of the applied tritiated water collected in the receptor solution
(fabs) was calculated for each skin sample. The cumulative volume of water that
penetrated through the skin during the 1-h exposure (equal to M divided by the
density of water) was calculated from the product of fabs and the volume of the
tritiated donor solution applied to the skin sample (V), which was 250 µL.
For comparison to studies by Davies et al. (2004) and Fasano et al.
(2002), kp was estimated as
( )
absp
lag
f Vk
A t t=
− (3.10)
where t was 1 h and tlag was estimated to be 0.5 h from the results of a separate
2-h absorption study. In this study (Runciman et al., 2009), which followed
procedures similar to those described above, the amount of tritiated water in the
receptor solution was determined at 1 and 2 h after 400 µL/cm2 of tritiated water
was applied to 1082 split-thickness (ca 400 µm thick) skin samples acquired from
96 different donors (34 abdomen, 60 breast and 2 upper arm, aged 19 to 87
years old) with 2 to 47 samples from a given donor.

85
Davies et al. (2004) reported paired in vitro measurements of tritiated
water kp and RPAR at 100 Hz for whole and heat separated human skin (59 and
53 samples, respectively) determined at 32°C in diffusion cells with an area of
2.54 cm2. In these experiments, the receptor fluid (0.9% sodium chloride) was
sampled at 3, 4, 5 and 6 h after application of tritiated water (also in 0.9% sodium
chloride solution) and kp was calculated from the steady-state slope of M/A
versus time. Electrical impedance was measured at least 0.5 h after application
of the tritiated water solution using the PRISM Electronics AIM 6401 LCR
databridge connected to stainless steel wire electrodes, one each placed in the
donor and receptor solutions. Skin samples that exhibited "very high" tritiated
water absorption at 3 h were rejected for comparison with the electrical
resistance measurements. Data from this study were derived from Figures 1A
and 1D in Davies et al. (2004) using Grapher (Version 8.5, Golden Software, Inc.,
Golden, CO, USA).
In the study from Fasano et al. (2002), in vitro measurements of tritiated
water kp and RPAR determined at 1000 Hz using the Tinsley model 6401 LCR
Databridge (Surrey, UK) were collected on split-thickness human skin from 11
subjects in vertically oriented diffusion cells at 32°C with an area of 0.64 cm2.
The experimental procedures were similar to those followed by Davies et al.
(2004), except for the timing of the receptor solution sampling, which occurred at
0.5, 1 and 2 h (Fasano et al., 2002). The data for 63 samples, which are plotted
in Figure 4 of Fasano et al. (2002), were provided by W. Fasano (private
communication, August 2010).

86
The tritiated water permeability and RPAR data from this study as well as
the studies from Davies et al. (2004) and Fasano et al. (2002) were compared to
multi-frequency impedance scans of 145 samples of split-thickness
(approximately 300 µm thick) human cadaver skin collected from 6 different
subjects as described previously (White et al., 2011b). In this study, impedance
of skin equilibrated for several hours with phosphate buffered saline (Sigma,
Product No. P-3813) at 32oC was determined in horizontal diffusion cells as a
function of frequency using four Ag-AgCl electrodes (In Vivo Metric, Healdsburg,
CA, USA) by modulating the potential 10 mV rms with a Gamry potentiostat
(model PCI4/300, Warminster, PA) for a range of frequencies (typically, between
1 Hz and 10 kHz) with ten measurement frequencies per logarithmic decade.
The real part of the skin impedance determined at the lowest measured
frequency was taken to be the DC skin resistance; this value was estimated to be
within 4% of the actual DC skin resistance for skin samples in the study.
The effective capacitance of each sample (Cskin,eff) was calculated using
skin,eff
skin
1
2 c
Cf Rπ
= (3.11)
where the characteristic frequency of each skin sample (fc) is the frequency at
which the negative of the imaginary component of the impedance is maximized
(Orazem and Tribollet, 2008). The log-mean average of Cskin,eff was 39.8 nF/cm2.
3.4 Results and Discussion
Experimental verification of the proposed relationship between electrical and
permeability properties of skin are developed here for fluxes of tritiated water and

87
two polar compounds. This work is then extended to quantify criteria employed to
assess skin integrity.
3.4.1 Application to Tritiated Water
The area-normalized volume of tritiated water collected in the receptor
fluid (fabs V/A) in the first hour after tritiated water was applied is compared in
Figure 3.2 to (fabs V/A) collected over 2 h. Under the assumption that a steady-
state flux was reached within 1 h, (fabs V/A) at 1 h and at 2 h should be related
according to the following expression derived from Eq. (3.10):
[ ] [ ]abs absabs at 1 h at 2 h
p
lag lag lag1h 2h
f V A f V Af V Ak
t t t t= = =
− − − (3.12)
It follows then that a plot of (fabs V/A) at 1 h compared to (fabs V/A) at 2 h should
be represented by a line described by
lagabs abs
lagat 1h at 2h
1h
2h
tf V f V
A t A
− =
− (3.13)
which represents a line with a slope of (1h – tlag)/(2h – tlag). The slope of the
best-fit line through the data in Figure 3.2 is 0.34. From this, tlag was calculated
to be about 0.5 h, which indicates that a steady-state flux should be achieved in
about 1.2 h (Bunge et al., 1995). In general, including data that were not at
steady state in the analysis will cause tlag to be underestimated. However, the
difference between 1 h and 1.2 h is small enough that the 0.5 estimate for tlag is
reasonable within the accuracy of the measurements.

88
Figure 3.2 Tritiated water absorption at 1 h compared with absorption at 2 h for
all samples with less than 10 µL/cm2 of water absorbed in 2 h. The line representing the best-fit linear regression of the data forced through the origin has a slope of 0.34 (r2 = 0.86).
Measurements of (RPAR⋅A) determined at 100 and 1000 Hz from the
Charles River study are plotted in Figure 3.3 as functions of the inverse of kp
estimated from tritiated water absorption over 1 h under the assumption that tlag
was equal to 0.5 h for all skin samples. The assumption that tlag was the same
for all samples increases the variability of the estimated kp. For comparison, the
data reported by Davies et al. (2004) and Fasano et al. (2002) for (RPAR⋅A)
measured at 100 and 1000 Hz, respectively (triangles) are also shown in Figure
3.3. In the Davies et al. (2004) study, there was no apparent difference in
measurements from whole skin (filled triangles; RPAR = 37 ± 13 kΩ cm2 and
kp = 0.97 x 10⁻³ ± 0.41 x 10⁻³ cm/h, reported as mean ± one standard deviation)
compared with human epidermal membranes (HEM) prepared by heat
separation (open triangles; RPAR = 53 ± 18 kΩ cm2 and kp = 0.81 x 10⁻³ ± 0.56 x
10-3 cm/h).

89
Figure 3.3 (RPAR⋅A) measured at 100 and 1000 Hz plotted as a function of the inverse kp for tritiated water determined in this study (circles) compared to data
reported by Davies et al. (2004) and Fasano et al. (2002) for (RPAR⋅A) measured at 100 and 1000 Hz, respectively (triangles). For Davies et al. measurements collected on whole skin and heat separated human epidermal membrane are distinguished by filled and open triangles, respectively. The curves represent the
theoretical relationship for (RPAR⋅A) versus 1/kp described by Eq. (3.9) for the
value of b (63 Ω cm3/h) that minimized the sum of the square residuals for all the
data assuming α is 0.8 and Cskin,eff is 39.8 nF/cm2, which is the log-mean average determined in the multi-frequency impedance study of White et al. (2011).
The curves in Figure 3.3 represent the theoretical relationship for (RPAR A)
versus 1/kp calculated according to Eq. (3.9) for b equal to 63 Ω cm3/h, which is
the value of b that minimized the sum of the square residuals for all data from the
three laboratories weighted equally. In the calculation, Cskin,eff /A was assigned a
value of 39.8 nF/cm2, which is the log-mean average from White et al. (2011),

90
and α was assumed to be 0.8, which is a typical number for skin (Hirschorn et al.,
2010; Poon and Choy, 1981).
Consistent with the impedance theory, the experimental values of RPAR for
a given skin sample were smaller at 1000 Hz than at 100 Hz. As a result, for the
same range of kp values, the range of observed RPAR values is compressed at
1000 Hz compared with 100 Hz. Therefore, changes in the skin barrier are
detected with greater sensitivity using RPAR determined at lower frequency
(Davies et al., 2004; Fasano and Hinderliter, 2004).
Mean values and 90% confidence intervals, ignoring the influence of
different subjects, are presented in Table 3.2 for the (RPAR A) and kp data shown
in Figure 3.3 as well as the values of (RPAR A) reported by White et al. (2011) for
frequencies of 1000, 100 and approximately zero Hz (which represents Rskin A).
In several cases, the mean value of the same measurement collected in a
different laboratory differed by a statistically significant amount. This indicates
that there were differences in the skin samples between laboratories with respect
to skin resistance and tritiated water permeability. One source of these
differences may be the exclusion by Davies et al. (2004) of skin samples with
very large tritiated water concentrations in the receptor at 3 h.
Despite the differences between laboratories, as shown in Figure 3.3, the
relationship between kp and RPAR determined at both 100 and 1000 Hz are
consistent between laboratories and are also consistent with the theoretical
model, Eq. (3.9), which includes two parameters (α and Cskin,eff /A) derived from
an impedance study of a different set of skin samples (White et al., 2011b).
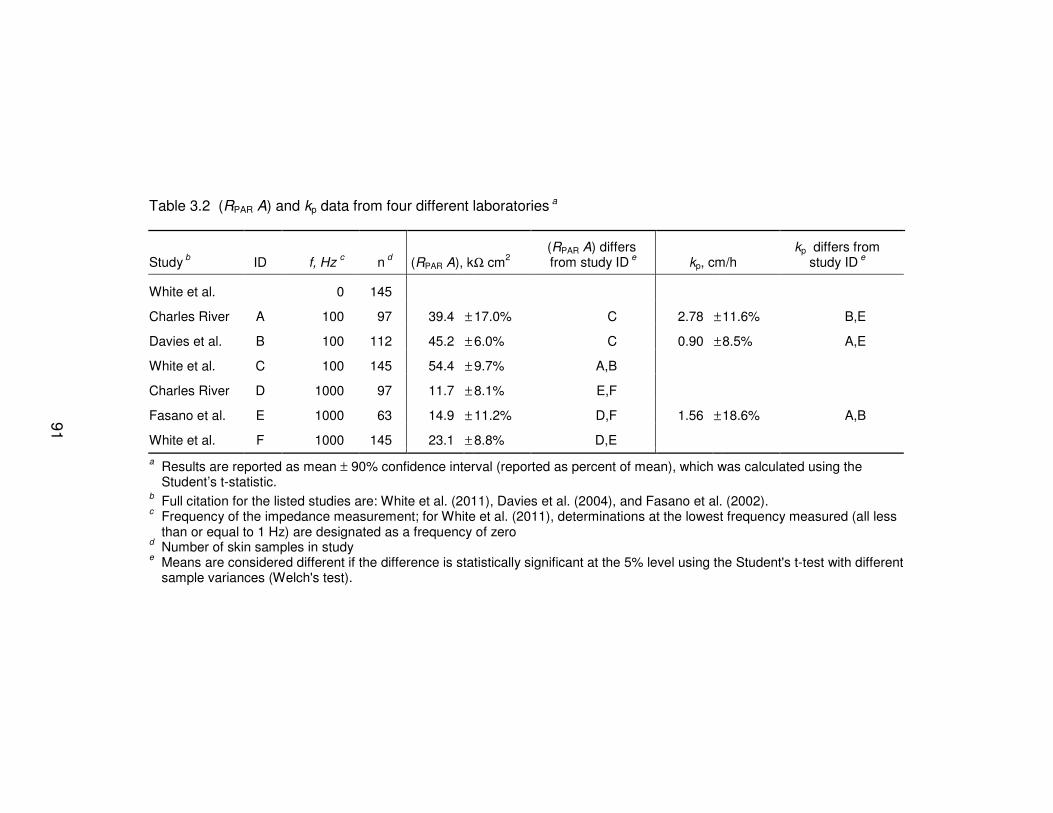
91
Table 3.2 (RPAR A) and kp data from four different laboratories a
Study b ID f, Hz
c n
d (RPAR A), kΩ cm
2
(RPAR A) differs from study ID
e kp, cm/h
kp differs from study ID
e
White et al. 0 145
Charles River A 100 97 39.4 ± 17.0% C 2.78 ± 11.6% B,E
Davies et al. B 100 112 45.2 ± 6.0% C 0.90 ± 8.5% A,E
White et al. C 100 145 54.4 ± 9.7% A,B
Charles River D 1000 97 11.7 ± 8.1% E,F
Fasano et al. E 1000 63 14.9 ± 11.2% D,F 1.56 ± 18.6% A,B
White et al. F 1000 145 23.1 ± 8.8% D,E
a Results are reported as mean ± 90% confidence interval (reported as percent of mean), which was calculated using the
Student’s t-statistic. b Full citation for the listed studies are: White et al. (2011), Davies et al. (2004), and Fasano et al. (2002).
c Frequency of the impedance measurement; for White et al. (2011), determinations at the lowest frequency measured (all less
than or equal to 1 Hz) are designated as a frequency of zero d Number of skin samples in study
e Means are considered different if the difference is statistically significant at the 5% level using the Student's t-test with different
sample variances (Welch's test).

92
Five data points from the Fasano et al. (2004) study, all with (RPAR A)
determined at 1000 Hz that were less than 5 kΩ cm2, appear to deviate
systematically from the model prediction. This different behavior of low
resistance skin samples compared to higher resistance samples has been
observed previously. From the ratio of urea permeability measured at 39o and
27oC, Peck et al. (1995) discovered that heat-separated human skin (epidermis)
with (Rskin A) less than 20 kΩ cm2 at 27oC behaved more like a porous Nuclepore
membranes than like higher resistance skin. Thus, Peck et al. (1995) selected
20 kΩ cm2 as the minimum value of (Rskin A) for skin with acceptable integrity,
which is one of the test criteria listed in Table 3.1. Notably, the value of b
determined by best-fit regression of the data in Figure 3.3 to Eq. (3.9) was
unaffected by the presence of the five deviant points in the Fasano et al. data
set.
In the derivation of Eq. (3.9), which relates (RPAR A) and kp, it was
assumed that the product of the area normalized DC skin resistance (Rskin A) and
kp for a given chemical is a constant, b. This hypothesis is tested directly in
Figure 3.4, in which RPAR measurements, determined at either 100 or 1000 Hz
from each of the three laboratories, are plotted as a function of b/kp for b at the
optimum value of 63 kΩ cm3/h. The figures also include (RPAR A) data from White
et al. (2011) plotted as a function of (Rskin A). Within the variability of the
measurements, the four different sets of (RPAR A) values and the kp data from
three different laboratories were in remarkable agreement with the (RPAR A) and
(Rskin A) data from White et al. (2011).

93
The solid curves in Figure 3.4 are plots of the frequency dependent
relationship between (RPAR A) and (Rskin A) predicted by Eq. (3.4), which
represents the R-CPE circuit model for α = 0.8 and Cskin,eff /A = 39.8 nF/cm2 with
the reasonable assumption that Re (typically, of order 0.1 kΩ cm2 for PBS
solutions in these diffusion cells) is small relative to Rskin (typically, larger than 10
kΩ cm2). (Identical curves would be generated using Eq. (3.9) to calculate (RPAR
A) as a function of b/kp for b at the optimum value of 63 kΩ cm3/h.) Although the
curve closely represents the (RPAR A) versus (Rskin A) data measured at 100 Hz,
there is a systematic deviation between the theory and data measured at 1000
Hz for (Rskin A) larger than approximately 100 kΩ cm2.
A likely cause of this deviation is that the R-CPE circuit model does not
represent perfectly the skin impedance at all frequencies (Grimnes and
Martinsen, 2005; Martinsen et al., 1997; Yamamoto and Yamamoto, 1976b). As
a result, different values of Cskin,eff /A and also α are derived when the R-CPE
model equation is regressed to data from different frequency ranges. The 39.8
nF/cm2 value for Cskin.eff/A is the log-mean average of Cskin.eff/A determined from
the characteristic frequency for the 145 skin samples (White et al., 2011b).
Upper and lower bounds calculated by adding or subtracting one standard
deviation, 0.3, to the logarithm of 39.8 nF/cm2 corresponded to 75.8 and 20.2
nF/cm2, respectively (White et al., 2011b). The curve calculated using Cskin,eff /A
equal to 20.2 nF/cm2 rather than 39.8 nF/cm2 in Eq. (3.4) more closely
represented the large impedance skin samples at 1000 Hz (see dashed curve in
Figure 3.4).

94
Figure 3.4 A comparison of (RPAR A) versus (Rskin A) data (small filled circles) from the multi-frequency impedance study of White et al. (2011) with (RPAR A) measured at 100 and 1000 Hz versus b/kp data from three different laboratories
(open circles) for b equal to 63 Ωcm3/h: (a) Charles River data measured at 100 Hz, (b) Charles River data measured at 1000 Hz, (c) Davies et al. (2004) data measured at 100 Hz, and (d) Fasano et al. (2002) data measured at 1000 Hz. The theoretical relationship for (RPAR A) plotted as a function of (Rskin A) was
calculated using Eq. (3.4) for α equal to 0.8 and Cskin,eff /A equal to 39.8 nF/cm2 (solid curves), 75.8 nF/cm2 (dot-dashed curves), and 20.2 nF/cm2 (dashed curves), which represent the mean and plus and minus one standard deviation of log(Cskin,eff /A) determined in the multi-frequency impedance study of White et al. (2011).

95
Since there were only a few kp data points with RPAR determined at 1000 Hz that
are larger than 100 kΩ cm2, the systematic deviation of Eq. (3.4) calculated using
39.8 nF/cm2 to the 1000 Hz data at large (Rskin A) resulted in little effect on the
estimate of b. Moreover, because (Rskin A) values of interest for skin integrity
testing are much less than 100 kΩ cm2, Eq. (3.4) with Cskin,eff /A equal to 39.8
nF/cm2 can be used reliably to relate (RPAR A) and (Rskin A) test criteria.
3.4.2 Application to Polar Compounds
The values of the proportionality constants b for different chemicals that
permeate skin through the same pathway as ions should be related to their
permeability coefficients: the DC resistance (Rskin A) for a given skin sample
should equal the ratio of the chemical specific values of b and kp for these
chemicals as follows:
( )skin
p pchemical 1 chemical 2
b bR A
k k
= =
(3.14)
Thus, b for tritiated water should be related to b for a different polar compound
and the ratio of the permeability coefficients of tritiated water to the chemical by
p, water
water chemical
p, chemical
kb b
k
=
(3.15)
The temperature dependence of (Rskin A) and 1/kp should be the same, and
therefore, b should be independent of temperature. However, kp values do vary
with temperature, and kp measurements used in Eq. (3.15) should be at the
same temperature.

96
Permeability coefficient data and the corresponding DC resistance
measurements were digitally derived from Figure 7 in Peck et al. (1995) for urea
(logKo/w = -2.11 (Hansch et al., 1995) and MW = 60.05 Da) using Grapher and
replotted in Figure 3.5. The best-fit linear regression of log(Rskin A) with log(1/kp)
is also shown, which, consistent with Eq. (3.8), has a slope close to 1. The
expectation that temperature should not affect the relationship between (Rskin A)
with (1/kp) is supported by these results, which include data determined at both
27oC and 39oC (Peck et al., 1995). Under the assumption that the slope has a
value exactly equal to one, log(b) was determined from the log (Rskin A) intercept
for each data point as
log(b) = log(Rskin A) – log(1/kp) (3.16)
and then averaged over all data points. The resulting estimate for b was
4.9 ± 0.7 Ω cm3/h (mean ± 1 standard deviation).
Peck et al. (1995) reported kp values for urea of 0.201 x 10⁻³ cm/h and
0.272 x 10⁻³ cm/h at 27°C and 39°C, respectively, from which kp at 32oC was
estimated by interpolation to be approximately 0.234 x 10⁻³ cm/h at 32°C. This is
slightly larger than 0.148 x 10⁻³ cm/h, which was measured by Barber et al.
(1992) at 32°C. Using a kp for tritiated water between 1.5 and 2.0 x 10⁻³ cm/h
(see Table 3.2 and Meidan and Roper, 2008), the ratio of kp values for water and
urea is between 6.4 and 14. Multiplying b for urea by this ratio gives an
estimated value of b for tritiated water between 31 and 66 Ω cm3/h, which is
consistent with 63 Ω cm3/h derived by regression to the data from three different
laboratories.
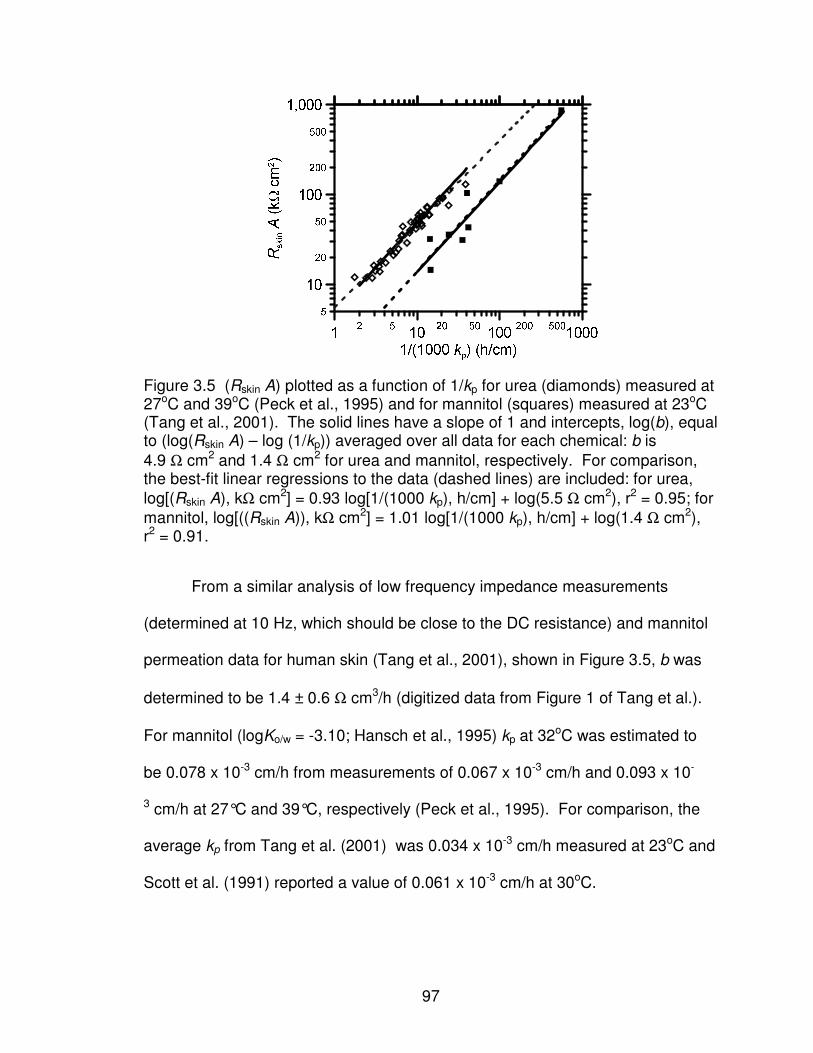
97
Figure 3.5 (Rskin A) plotted as a function of 1/kp for urea (diamonds) measured at 27oC and 39oC (Peck et al., 1995) and for mannitol (squares) measured at 23oC (Tang et al., 2001). The solid lines have a slope of 1 and intercepts, log(b), equal to (log(Rskin A) – log (1/kp)) averaged over all data for each chemical: b is
4.9 Ω cm2 and 1.4 Ω cm2 for urea and mannitol, respectively. For comparison, the best-fit linear regressions to the data (dashed lines) are included: for urea,
log[(Rskin A), kΩ cm2] = 0.93 log[1/(1000 kp), h/cm] + log(5.5 Ω cm2), r2 = 0.95; for
mannitol, log[((Rskin A)), kΩ cm2] = 1.01 log[1/(1000 kp), h/cm] + log(1.4 Ω cm2), r2 = 0.91.
From a similar analysis of low frequency impedance measurements
(determined at 10 Hz, which should be close to the DC resistance) and mannitol
permeation data for human skin (Tang et al., 2001), shown in Figure 3.5, b was
determined to be 1.4 ± 0.6 Ω cm3/h (digitized data from Figure 1 of Tang et al.).
For mannitol (logKo/w = -3.10; Hansch et al., 1995) kp at 32oC was estimated to
be 0.078 x 10⁻³ cm/h from measurements of 0.067 x 10⁻³ cm/h and 0.093 x 10-
3 cm/h at 27°C and 39°C, respectively (Peck et al., 1995). For comparison, the
average kp from Tang et al. (2001) was 0.034 x 10⁻³ cm/h measured at 23oC and
Scott et al. (1991) reported a value of 0.061 x 10⁻³ cm/h at 30oC.

98
3.4.3 Application to Tests of Skin Integrity
A rearrangement of Eq. (3.10) along with Eqs. (3.8) and (3.4) provide a
means of estimating, for a given tritiated water kp, the corresponding values for
tritiated water absorption after 1 h, (Rskin A), and (RPAR A) measured at a given
frequency. The results are presented in Table 3.3 for tritiated water kp values
that have been used variously as criteria for rejecting skin that was potentially
damaged. Also listed in Table 3.3 are values for (RPAR A) calculated using two
equations derived by linear regression of the logarithms of (RPAR A)
measurements at 100 and 1000 Hz, respectively to the logarithm of (Rskin A)
measured on the same piece of skin (White et al., 2011b). Generally, these
values of (RPAR A) are smaller than those estimated from Eq. (3.4), although the
difference was usually less than 10%. The chief advantage of Eq. (3.4) over the
linear regression equations from White et al. (2011) is that it can be used to
estimate (RPAR A) at any frequency. Based on the results shown in Figure 3.4, it
is appropriate to restrict the use of Eq. (3.4) to frequencies less than about 1000
Hz.
Using Eq. (3.4), the (Rskin A) values that corresponded with the various
electrical resistance integrity test criteria listed in Table 3.1 have been calculated.
These are listed in Table 3.1 along with tritiated water kp values estimated using
Eq. (3.8), which can be compared to the kp values that were used to derive the
test criteria. Of the criteria in Table 3.1, the recommendation of 20 kΩ cm2 for
(Rskin A) from Peck et al. (1995) was based on membrane behavior that is
consistent with damage rather than correlation to a selected permeability

99
coefficient value. Significantly, 20 kΩ cm2 as a test criterion for (Rskin A)
corresponds to 17 kΩ cm2 for (RPAR A) at 100 Hz and a tritiated water kp of 3.2 x
10-3 cm/h. This kp may be large enough so that undamaged but higher
permeability skin samples are not screened from study.
Table 3.3 Calculated values of the 1-h absorption, (Rskin A), and (RPAR A) determined at 100 Hz and 1000 Hz corresponding to different values of tritiated water permeability
Tritiated water
a (RPAR A) from Eq. (4)
(RPAR A) from White et al. 2011
c
kp x 103
1-h absorption
(Rskin A) =
b/kpb
100 Hz 1000 Hz 100 Hz 1000 Hz
(cm/h) (µL/cm2) (kΩ cm
2) (kΩ cm
2) (kΩ cm
2) (kΩ cm
2) (kΩ cm
2)
1.5 0.8 42 32 14 28 14
2.0 1.0 32 25 12 21 11
2.5 1.3 25 21 11 18 10
3.0 1.5 21 18 9.7 15 8.6
3.5 1.8 18 15 8.9 13 7.8
4.0 2.0 16 14 8.2 12 7.1
4.5 2.3 14 12 7.6 11 6.6
a Equal to fabs V/A at 1 h calculated using Eq. (3.10) and assuming tlag = 0.5 h
b For b equal to 63, which is the optimum value determined by minimizing the sum of the squared residuals to the prediction from Eq, (3.9) equally weighting all measurements from all studies
c White et al. (2011) provided the following two equations for estimating (RPAR·A) from 100 Hz
and 1000 Hz, respectively: log [(RPAR A) at 100 Hz] = 0.837 log(Rskin A) + 0.092 log [(RPAR A) at 1000 Hz] = 0.668 log(Rskin A) + 0.053
3.5 Conclusions
Impedance measurements collected at a single frequency not larger than
1000 Hz on human skin in vitro are related in a predictable way to DC skin
resistance (Rskin A), based on a simple circuit of a parallel resistor and constant

100
phase element (CPE) in parallel, and therefore, after normalizing for area, to the
steady-state permeability coefficient (kp) for ionic or hydrophilic compounds. The
nonlinear relationship between kp values for tritiated water and resistances
reported in parallel (PAR) mode obtained in three different laboratories at either
100 or 1000 Hz were predicted using a single equation, even though the mean
values of the skin samples for permeability and resistance were significantly
different for the different laboratories. The success of this equation supports the
hypothesis that kp values for tritiated water are linearly correlated with Rskin A,
which are a measure of the barrier function to ions, even though water may
permeate skin through both hydrophilic and lipophilic pathways. Moreover, the
proportionality constant relating Rskin A and water kp values is consistent with
constants for urea and mannitol, which are known to permeate skin through a
hydrophilic pathway. Using this equation relating water kp and RPAR A, previously
published impedance criteria for identifying skin as acceptable for chemical
absorption studies were compared on the basis of water kp. Overall, RPAR A
determined at 100 Hz can be used reliably to test for skin integrity with better
sensitivity than RPAR A determined at 1000 Hz. The test criterion of 20 kΩ cm2
for (Rskin A), has been shown to correspond with a tritiated water permeability of
about 3.2 x 10⁻³ cm/h. This criterion could be able to exclude damaged skin
without screening undamaged but higher permeability skin samples from study.

101
REFERENCES
Barber, E.D., Teetsel, N.M., Kolberg, K.F., Guest, D., 1992. A comparative study of the rates of in vitro percutaneous absorption of eight chemicals using rat and human skin. Fundam. Appl. Toxicol. 19, 493-497.
Bronaugh, R.L., Stewart, R.F., 1986. Methods for in vitro percutaneous absorption studies VI: Preparation of the barrier layer. J. Pharm. Sci. 75, 487-491.
Buist, H.E., van de Sandt, J.J.M., van Burgsteden, J.A., de Heer, C., 2005. Effects of single and repeated exposure to biocidal active substances on the barrier function of the skin in vitro. Regul. Toxicol. Pharm. 43, 76-84.
Bunge, A.L., Cleek , R.L., 1995. A new method for estimating dermal absorption from chemical exposure. 2. Effect of molecular weight and octanol-water partitioning. Pharm. Res. 12, 87-94.
Bunge, A.L., Cleek , R.L., Vecchia, B.E., 1995. A new method for estimating dermal absorption from chemical exposure. 3. Compared with steady-state methods for prediction and data analysis. Pharm. Res. 12, 972-982.
Davies, D.J., Ward, R.J., Heylings, J.R., 2004. Multi-species assessment of electrical resistance as a skin integrity marker for in vitro percutaneous absorption studies. Toxicol. In Vitro 18, 351-358.
Fasano, W.J., Hinderliter, P.M., 2004. The Tinsley LCR Databridge Model 6401 and electrical impedance measurements to evaluate skin integrity in vitro. Toxicol. In Vitro 18, 725-729.
Fasano, W.J., Manning, L.A., Green, J.W., 2002. Rapid integrity assessment of rat and human epidermal membranes for in vitro dermal regulatory testing: correlation of electrical resistance with tritiated water permeability. Toxicol. In Vitro 16, 731-740.
Grimnes, S., Martinsen, O.G., 2005. Cole electrical impedance model - A critique and an alternative. IEEE Trans. Biomed. Eng. 52, 132-135.
Hansch, C., Leo, A., Hoekman, D., 1995. Exploring QSAR: Hydrophobic, Electronic, and Steric Constants. American Chemical Society, Washington, DC.
Heylings, J.R., Esdaile, D.J., 2007. Percutaneous absorption of pesticides, In: Roberts, M.S., Walters, K.A. (Eds.), Dermal Absorption and Toxicity Assessment, Second edition ed. Informa Healthcare, New York, pp. 575-591.
Hirschorn, B., Orazem, M.E., Tribollet, B., Vivier, V., Frateur, I., Musiani, M., 2010. Determination of effective capacitance and film thickness from constant-phase-element parameters. Electrochimica Acta 55, 6218-6227.

102
Hsu, C.H., Mansfeld, F., 2001. Technical note: Concerning the conversion of the constant phase element parameter Y0 into a capacitance. Corrosion 57, 747-748.
International Programme on Chemical Safety (IPCS), 2006. Dermal Absorption, Environmental Health Criteria 235. World Health Organization, Geneva.
Kalia, Y.N., Pirot, F., Guy, R.H., 1996. Homogeneous transport in a heterogeneous membrane: Water diffusion across human stratum corneum in vivo. Biophys. J. 71, 2692-2700.
Kasting, G.B., Barai, N.D., 2003. Equilibrium water sorption in human stratum corneum. J. Pharm. Sci. 92, 1624-1631.
Kasting, G.B., Bowman, L.A., 1990. DC electrical properties of frozen, excised human skin. Pharm. Res. 7, 134-143.
Kasting, G.B., Filloon, T.G., Francis, W.R., Meredith, M.P., 1994. Improving the sensitivity of in vitro skin penetration experiments. Pharm. Res. 11, 1747-1754.
Kontturi, K., Murtomaki, L., 1994. Impedance Spectroscopy in Human Skin. A Refined Model. Pharm. Res. 11, 1355-1357.
Martinsen, O.G., Grimnes, S., Sveen, O., 1997. Dielectric properties of some keratinised tissues .1. Stratum corneum and nail in situ. Med. Biol. Eng. Comput. 35, 172-176.
Meidan, V.M., Roper, C.S., 2008. Inter- and intra-individual variability in human skin barrier function: A large scale retrospective study. Toxicol. In Vitro 22, 1062-1069.
OECD, 2004. OECD Guideline for Testing of Chemicals. Guideline 428: Skin Absorption: In Vitro Method (Original Guideline, adopted 13th April 2004).
Orazem, M.E., Tribollet, B., 2008. Electrochemical Impedance Spectroscopy. Wiley-Interscience, Hoboken, NJ.
Peck, K.D., Ghanem, A.H., Higuchi, W.I., 1994. Hindered diffusion of polar molecules through and effective pore radii estimates of intact and ethanol treated human epidermal membrane. Pharm. Res. 11, 1306-1314.
Peck, K.D., Ghanem, A.H., Higuchi, W.I., 1995. The effect of temperature upon the permeation of polar and ionic solutes through human epidermal membrane. J. Pharm. Sci. 84, 975-982.
Poon, C.S., Choy, T.T.C., 1981. Frequency dispersions of human-skin dielectrics. Biophys. J. 34, 135-147.
Potts, R.O., Francoeur, M.L., 1991. The influence of stratum corneum morphology on water permeability. J. Invest. Dermatol. 96, 495-499.
Potts, R.O., Guy, R.H., 1992. Predicting skin permeability. Pharm. Res. 9, 663-669.

103
Runciman, J., Roper, C.S., Madden, S. Evaluation of a rapid tritiated water skin barrier integrity method for use in regulatory toxicology testing in vitro, Occupational and Environmental Exposure of the Skin to Chemicals (OEESC), Edinburgh, Scotland, June 14-17, 2009.
Scott, R.C., Corrigan, M.A., Smith, F., Mason, H., 1991. The influence of skin structure on permeability: an intersite and interspecies comparison with hydrophilic penetrants. J. Invest. Dermatol. 96, 921-925.
Scott, R.C., Dugard, P.H., Ramsey, J.D., Rhodes, C., 1987. In vitro absorption of some ortho-phthalate diesters through human and rat skin. Environmental Health Perspectives 74, 223-227.
Tang, H., Mitragotri, S., Blankschtein, D., Langer, R., 2001. Theoretical description of transdermal transport of hydrophilic permeants: Application to low-frequency sonophoresis. J. Pharm. Sci. 90, 545-568.
van de Sandt, J.J., Meuling, W.J., Elliott, G.R., Cnubben, N.H., Hakkert, B.C., 2000. Comparative in vitro-in vivo percutaneous absorption of the pesticide propoxur. Toxicol. Sci. 58, 15-22.
White, E.A., Horne, A., Runciman, J., Orazem, M.E., Navidi, W.C., Roper, C.S., Bunge, A.L., 2011a. Single-Frequency Impedance Measurements as Predictors of Human Skin Permeability to Water and Other Hydrophilic Compounds. Toxicol. In Vitro, in press.
White, E.A., Orazem, M.E., Bunge, A.L., 2011b. A critical analysis of single-frequency LCR databridge impedance measurements of human skin. Toxicol. In Vitro 25, 774-784.
World Precision Instruments, 2008. EVOM & EVOMX Epithelial Voltohmmeters, Instruction Manual, Sarasota, FL.
Yamamoto, T., Yamamoto, Y., 1976a. Dielectric constant and resistivity of epidermal stratum corneum. Medical and Biological Engineering and Computing 14, 494-500.
Yamamoto, T., Yamamoto, Y., 1976b. Electrical properties of the epidermal stratum corneum. Med. Biol. Eng. 14, 151-158.
Yamamoto, T., Yamamoto, Y., 1981. Non-linear electrical-properties of skin in the low-frequency range. Med. Biol. Eng. Comput. 19, 302-310.

104
CHAPTER 4
CHARACTERIZATION OF DMSO DAMAGED SKIN AND PINHOLE
DAMAGED SKIN BY IMPEDANCE SPECTROSCOPY
Electrical impedance and the flux of non-polar compounds were measured
before and after treatments that irreversibly altered human cadaver skin either
chemically using dimethyl sulfoxide (DMSO) or mechanically by needle puncture.
The impedance spectra collected before and after skin was treated for 1 h with
DMSO exhibited a single characteristic frequency that was about 100 times
larger after treatment. After DMSO exposure for only 0.25 h, the impedance
spectra were consistent with two characteristic frequencies that coincided with
those observed before and after DMSO treatment for 1 h. These observations
are consistent with DMSO damage to a fraction of the skin, which it is shown
increased proportional to the square-root of treatment time until about 0.5 h.
DMSO exposure for both treatment times did not significantly change the flux of
the non-polar compound, p-chloronitrobenzene, compared to the phosphate
buffered saline control. The characteristic frequency of the impedance scans
determined after needle puncture increased by an amount that could be
predicted using a recently published theory. The flux of 4-cyanophenol increased
by a small but significant amount that did not correlate with the hole resistance
calculated assuming the resistance of the surrounding skin did not change.

105
4.1 Introduction
The outer most layer of the skin, the stratum corneum, is a matrix of dead
keratinized cells suspended in lipid bilayers. It is the primary barrier to chemical
penetration and electric current through the skin. Therefore, unless stated
otherwise, in this chapter the word skin refers to the stratum corneum.
Impedance spectroscopy, which is the measurement of the impedance for a
range of frequencies, provides information about the electrical properties of skin.
Impedance measurements at a given frequency involve measuring the current or
potential response to small amplitude modulation of an input current or potential.
The impedance is the ratio of the change in potential to the change in current,
which for skin is a function of the modulation frequency. Dielectric material in
skin causes the resulting signal to shift in time relative to the applied signal
resulting in a complex number for impedance. Changes in the impedance
spectrum of skin subsequent to chemical exposure or mechanical damage
indicate changes in the structure or composition of skin.
The electrical response of the skin is related to two intrinsic properties: the
resistivity and the dielectric constant. The skin resistivity is proportional to the
area-normalized skin resistance measured using a direct current method; i.e.,
Rs A where A is the skin area normal to current flow. The dielectric constant of
skin is proportional to the capacitance normalized by the inverse area (Cs / A).
Because the stratum corneum is heterogeneous, macroscopic electrical
measurements of the skin produce effective values for the skin resistance and
capacitance that combine effects from the various structures within the stratum

106
corneum. Hydrophilic and lipophilic molecules diffuse through skin via different
pathways with different rate limiting mechanisms depending upon the octanol-
water partition coefficient (Ko/w) (Bennett and Barry, 1985). For skin submerged
in electrolyte solution, dissolved ions transport through the skin in response to an
electric field. Thus, skin resistivity quantitatively characterizes the pathway for
transport of ions through skin. Consistent with this, the permeability of
hydrophilic and ionic chemicals through skin has been shown to be inversely
proportional to (Rs⋅A) (Kasting and Bowman, 1990; Peck et al., 1994, 1995; Tang
et al., 2001).
Though the source of skin capacitance is not well understood,
investigators have suggested that the skin capacitance arises from the highly
ordered stratum corneum lipids (Curdy et al., 2000; DeNuzzio and Berner, 1990;
Kim and Oh, 2000; Oh et al., 1993). The stratum corneum lipids are thought to
be the major component of the lipophilic pathway suggesting that the effective
capacitance of skin may characterize the lipophilic pathway.
High concentrations of the polar, aprotic solvent dimethyl sufoxide
(DMSO) irreversibly change skin impedance and the barrier it exhibits to
chemical penetration. Kurihara-Bergstrom et al. (1986) present evidence that
DMSO damages rat skin - a common model for human skin - by elution of sc
lipids, denaturation of sc structural proteins (keratin), and delamination of the
stratum corneum layer. They showed that damage was irreversible and
coincided with loss of mass, hypothesized to be extracted lipids, when skin was
submerged in DMSO:water mixtures >50% strength for two hours. Allenby et al.

107
(1969) observed that low frequency skin impedance, which is an estimate of the
skin resistance, decreased over time to a minimum value in less than 0.5 h in the
presence of 100% DMSO. In light of these results, we hypothesize that
impedance spectroscopy is sensitive to the changes caused by DMSO.
The objective of this study was to quantify the effect of DMSO for
treatment times of 1 h or less on the impedance and flux of a model lipophilic
chemical, p-chloronitrobenzene (PCNB). We present impedance data that
indicate skin treated with DMSO for 0.25 h has frequency dependence consistent
with a 2-time-constant model circuit, while skin treated with DMSO for 1 h has
frequency dependence consistent with a 1-time-constant model circuit. We
hypothesize that DMSO progressively damages a larger fraction of the skin
thickness over time and that the undamaged fraction of the skin retains the
intrinsic electric properties of the skin before DMSO treatment. The observed
decrease in the magnitude of the impedance is due therefore, to a decrease in
the thickness of undamaged skin. We then compare the impedance of DMSO
treated skin to that of skin punctured with a needle, which is consistent with a 1-
time-constant model. We also compare the flux of a different lipophilic
compound 4-cyanophenol (CP) before and after the skin was punctured with a
needle. Circuit models consistent with the nature of the skin damage are
proposed and the model parameters are determined quantitatively by regression.

108
4.2 Theory
Skin impedance is related to the structure and composition of the stratum
corneum. In this study the skin barrier is altered in two different ways and circuit
models are proposed to describe the resulting skin impedance.
4.2.1 Skin Impedance Models
A common circuit model of in-vitro skin impedance is a resistor that
represents the frequency-independent (Ohmic) resistance containing
contributions from the electrolyte, wires, and possibly the dermis (Re) in series
with a parallel resistor (Rs) and constant phase element (CPE). This model,
referred to here as the 1-time-constant model, is depicted in Figure 4.1a. The
CPE is thought of as a non-ideal capacitor, with complex impedance, Z, defined
as
( ) s
s
1
2Z
Q j fα
π= (4.1)
where Qs and αs are the CPE parameters, j is the complex number 1− , and f is
the frequency with units of inverse seconds (Hz). Jorcin et al. (2006)
demonstrated that, in general, CPE behavior can be the result of distributions of
resistance and capacitance in the material. In skin, the CPE behavior has been
attributed to the stratum corneum heterogeneity (Yamamoto and Yamamoto,
1976).

109
CPE: Qs, αs CPE: Qd, αd
Re
RdRs
1-xd/L xd/L
Re
CPE: Qs, αs
Rs
CPE: Qs, αs CPE: Qd, αd
Re
Rs
CPE: Qs, αs
Rs
Re
CPE: Qs, αs
Re
CPE: Qs, αs
Rs
Rhole
(a) (b)
(c) (d)
sQ
sR dR
dQ
CPE: Qs, αs CPE: Qd, αd
Re
RdRs
1-xd/L xd/L
Re
CPE: Qs, αs
Rs
Re
CPE: Qs, αs
Rs
CPE: Qs, αs CPE: Qd, αd
Re
Rs
CPE: Qs, αs
Rs
Re
CPE: Qs, αs
Re
CPE: Qs, αs
Rs
Rhole
Re
CPE: Qs, αs
Rs
Re
CPE: Qs, αs
Rs
Rhole
(a) (b)
(c) (d)
sQ
sR dR
dQ
Figure 4.1 Diagrams of equivalent circuit models: (a) 1-time-constant model, (b) 2-time-constant model, (c) pinhole model, and (d) fraction-damaged model.
The impedance of the 1-time-constant model is described by Eq. (4.2).
( ) s
se
s s1 2
RZ R
R Q j fα
π= +
+ (4.2)
The characteristic frequency of the 1-time-constant model, fc,s, which
corresponds to the frequency at which the absolute value of the imaginary part of
the impedance is a maximum, is calculated with Eq. (4.3).
( ) s1
s s
1
2f
R Qα
π=c,s (4.3)
Eq. (4.2) is characterized by a single time constant that is equal to the inverse of
this characteristic frequency (1/fc,s).
A common simplification of the 1-time-constant model is to replace the
CPE with a capacitor that has a capacitance Cs. The impedance of this

110
simplified R-C circuit model, in which a resistor is in series with a parallel resistor
(Rs) and capacitor (Cs), is represented exactly by Eq. (4.2) for Qs = Cs and α = 1.
It follows that the characteristic frequency for the R-C circuit model is defined by
Eq. (4.4).
c,s
s s
1
2f
R Cπ= (4.4)
Since the dielectric constant for a material is related to the capacitance, it is
useful to relate the CPE parameters in the 1-time-constant model (Qs and αs) to
an effective capacitance. One approach for doing this is to determine the value
of Cs in Eq. (4.4) that gives the same characteristic frequency as the 1-time-
constant model; i.e., Eq. (4.3). The resulting expression, referred to as the Hsu
and Mansfeld equation (Hsu and Mansfeld, 2001),
( )s ss 11
s s sC Q Rα αα −
= (4.5)
is derived by equating Eqs. (4.3) and (4.4) and solving for Cs in terms of Rs, Qs
and αs.
The impedance of skin treated with DMSO for shorter periods of time
exhibit frequency dependence consistent with the 2-time-constant model
depicted in Figure 4.1b, which we hypothesize reflects the presence of two skin
layers: one undamaged and one damaged. This model consists of an electrolyte
resistor, Re, in series with two circuits each consisting of a resistor and CPE in
parallel. The impedance of the 2-time-constant model is described by Eq. (4.6):
( ) ( )s d
s de
s s d d
ˆ ˆ
ˆ ˆˆ ˆ1 2 1 2
R RZ R
R Q j f R Q j fα α
π π= + +
+ + (4.6)

111
where the R-CPE parameters, sR , sQ and αs represent the undamaged skin
layer and dR , dQ and αd, the damaged skin layer. The parameters with hats
indicate values that are dependent on the thickness of the respective layers. The
characteristic frequency and effective capacitance of both R-CPE circuits (fc,s, fc,d
and sC , dC respectively) are calculated using the parameters corresponding to
each layer in Eqs. (4.3). Eq. (4.6) is characterized by two time constants that are
equal to 1/fc,s and 1/fc,d.
Figure 4.2 is a schematic diagram of partially damaged stratum corneum,
which we hypothesize occurs when skin is treated with DMSO for a short time.
In this diagram, the total thickness of the damaged layer (xd) is less than the
stratum corneum thickness (L). Because DMSO was applied to both sides of the
skin, both sides will be affected. The schematic in Figure 4.2 depicts the
thickness of the two damaged regions (i.e. the non-shaded regions) to be equal,
although this is not necessarily the case. The difference between L and xd is the
length of the remaining undamaged stratum corneum; the fraction damaged is
xd/L.
An assumption in the development of the fraction-damaged equivalent
circuit model is that the interface between the damaged and undamaged skin
layers is distinct and uniform across the area of the DMSO treated skin.
However, it is likely that DMSO does not affect the stratum corneum uniformly,
resulting in a non-uniform interface between the damaged and undamaged parts
of the skin. This situation is represented schematically in Figure 4.2 by the solid,
wavy lines.

112
xd/2
L
xd/2 L-xd
Dam
ag
ed
Dam
ag
ed
Und
am
age
d
xd/2
L
xd/2 L-xd xd/2
L
xd/2 L-xd
Dam
ag
ed
Dam
ag
ed
Und
am
age
d
Figure 4.2 Diagram of stratum corneum that is partially damaged after exposure to DMSO on both sides. The dashed lines represent distinct and uniform boundaries between damaged and undamaged layers that may not actually exist.
The fraction damaged circuit model depicted in Figure 4.1d is described
by Eq. (4.7)
( ) ( )s d
s d d de
s s d d
11 2 1 2
R x R xZ R
L LR Q j f R Q j fα α
π π
= + − +
+ +
(4.7)
where the length-independent values of R and Q for the undamaged and
damaged layers are represented as Rs, Qs and Rd, Qd, respectively. Comparing
Eqs. (4.6) and (4.7), it is evident that
( )
ss
d
ˆ
1
RR
x L=
− (4.8)
( )s s dˆ 1Q Q x L= − (4.9)
dd
d
RR
x L= (4.10)
( )d d dˆQ Q x L= (4.11)

113
From these, the effective length-independent capacitance values of each layer,
Cs and Cd, are calculated using the parameters for that layer by Eq. (4.5).
The impedance of punctured skin is hypothesized to vary with frequency
as described by the pinhole equivalent circuit depicted in Figure 4.1c, and
represented by the Eq. (4.12)
( ) t
te
t s1 2
RZ R
R Q j fα
π= +
+ (4.12)
where Qs and αs are the CPE parameters of the skin after the hole was
punctured, and Rt is the total resistance of the skin and hole operating in parallel
as defined by Eq. (4.13):
1
t
s hole
1 1R
R R
−
= +
(4.13)
Like the 1-time-constant model, the pinhole equivalent circuit model has a single
characteristic frequency, fc,t, which is described by Eq.(4.14).
( ) s1
t s
1
2f
R Qα
π=c,t (4.14)
From the characteristic frequency of the corresponding R-C circuit, given in Eq.
(4.15)
c,t
t s
1
2f
R Cπ= (4.15)
the effective capacitance of the punctured skin, Cs, is derived to be:
( )s ss 11
s s tC Q Rα αα −
= (4.16)
using the procedure described above for the 1-time-constant model. If the cross-
sectional area of the hole is small compared to the skin area, then the skin

114
resistance (Rs) and the dielectric constant of the skin before and after the pinhole
are expected to be the same. If Cs represents the effective dielectric constant of
the stratum corneum, it follows that Cs, measured before and after the skin is
punctured should be the same.
4.2.2 Graphical Representations of Impedance
Log-log graphs of the real and imaginary components of the impedance
(i.e., Zr A and -Zj A) plotted as a function of frequency each reveal different
features of the impedance response or circuit model. For the circuit models
shown in Figure 4.1, the real component of the impedance approaches the total
resistance of the sample at small frequencies (i.e., (Re + Rs) A for undamaged
skin and (Re + sR + dR ) A for fractionally damaged skin) and Re at high
frequencies. For impedance spectra that are consistent with the 1-time-constant
model, Eq. (4.2), the characteristic frequency corresponds to the maximum value
of the –Zj A versus frequency plot. At low and high frequencies relative to the
characteristic frequency, the slope of the curve approaches αs and -αs,
respectively.
Impedance plane plots, also called Nyquist plots, show –Zj A plotted as a
function of Zr A on linear axes. In this plot, the 1-time-constant model looks like a
single squashed semi-circle where the maximum value of –Zj A is less than half
the difference of the maximum and minimum values of Zr A. The degree to which
the impedance deviates from a perfect semi-circle, which occurs when αs = 1,
depends on how much αs deviates from 1. In this plot, the low frequency data

115
appears on the right side of the Zr A axis and frequency increases towards the
left. Thus, the low and high impedance intercepts of the Zr A axis, which
correspond to high and low frequency, are equal to Re A and the total resistance
of the system (i.e, (Re + Rs) A for undamaged skin and (Re + sR + dR ) for
fractionally damaged skin), respectively. The impedance values corresponding
to the characteristic frequency appear at top of the semi-circle (i.e. where –Zj A is
a maximum).
Occasionally, features that cannot be identified in the three plots
described above are evident in a graph of the first derivative of log(–Zj A) with
respect to log(f) plotted as a function of frequency (Hirschorn et al., 2010). The
derivative is estimated numerically by the following difference equation:
( )
j j k j k 1
k k 1
log( ) log( ) log( )
log( ) log( ) log
d Z A Z A Z A
d f f f
−
−
− − − −=
− (4.17)
for each log(f)
( )( )k k 1
log log2
f ff −
+= (4.18)
where k and k-1 are the indices of measurements at adjacent frequencies. For
the 1-time-constant model given by Eq. (4.2), d log(-Zj A)/ d log(f) asymptotically
approaches αs at low frequencies and -αs at high frequencies, and equals zero at
the characteristic frequency. In this graph, systems described by two
characteristic frequencies, fc,s and fc,d, will consist of the sum of the curves for
each characteristic frequency. As long as the two characteristic frequencies are
sufficiently different and the magnitudes of the impedance contributions by each
curve sufficiently similar, the presence of a second characteristic frequency will

116
produce a clear perturbation to the behavior of a system with only one
characteristic frequency.
4.3 Materials and Methods
Chemical flux and impedance spectra were measured before and after
skin was altered either chemically using DMSO or mechanically by needle
puncture. The experimental procedures for these studies and the related
determination of solution resistivity are described here.
4.3.1 Chemicals and Materials
Phosphate buffered saline (0.01 M) with 0.138 M NaCl, 0.0027 M KCl (pH
7.4, Sigma P-3813) was prepared in de-ionized (DI) water (Millipore Corporation,
Bedford, MA). Skin was either treated with DMSO (99.9%, CAS 67-68-5, Fisher
Scientific) or punctured with a needle (26S gauge, Hamilton CO., Reno, NV).
The permeation of two solutes, p-chloronitrobenzene (MW = 157.56 Da, log Ko/w
= 2.4, Sigma) and 4-cyanophenol (CAS 767-00-0, MW = 119.1 Da, log Ko/w = 1.6,
pKa = 7.97, Sigma), were measured in the DMSO and pinhole experiments,
respectively. Split-thickness human cadaver skin (300-400 µm thick) identified
as Q (from the back of a 77-year old Caucasian female) and AS (from either the
back or abdomen of a 78-year old Caucasian male ) was purchased from the
National Disease Research Interchange (NDRI, Philadelphia, PA). The skin was
collected within 24 h post mortem, frozen immediately and stored at
temperatures less than -60 °C until used.

117
4.3.2 Impedance-Diffusion Cell Apparatus
Skin impedance and chemical flux were both measured in horizontally
oriented glass diffusion cells from PermeGear (13 mL, Side-Bi-SideTM diffusion
cells, Hellertown, PA) adapted to allow 4-electrode impedance measurements
and to support the skin sample during manipulations requiring it to be removed
from the cell. Each skin sample was mounted into one of four custom-made
frames (one with area of 1.84 cm2 and three with area of 1.65 cm2, PDM
Services, Golden, CO). This frame was then clamped between the two diffusion
cell chambers modified to hold two Ag/AgCl electrodes: one working and one
reference (In Vivo Meteric, Healdsburg, CA). The working electrodes were 12-
mm diameter discs oriented with the face parallel to the skin surface. The
cylindrical reference electrodes (1.5 mm diameter and 3 mm long) were oriented
such that the long axis was parallel to the skin surface. Experiments were
conducted in a temperature-controlled chamber (Electro-Tech Systems, Inc., PA)
that was large enough to hold all four cells and maintained at 32 °C.
4.3.3 Analytical Instruments
Impedance was measured using a Gamry potentiostat (model PCI4/300,
Warminster, PA) in a four electrode configuration over a frequency range of 1 Hz
to 100 kHz for the DMSO experiments and 0.1 Hz to 20 kHz for the pinhole
experiments. A 10 mV root-mean-squared, sinusoidal AC perturbation signal
was used for all impedance measurements.

118
Chemical concentrations in solutions were measured by high pressure
liquid chromatography (HPLC, Hewlett Packard 1100, Palo Alto, CA) equipped
with auto-sampling and a diode array detector set to 254 nm and 274 nm for
measurements of CP and PCNB, respectively. The stationary phase was a
Zorbax Extend-C18 (4.6 x 250 mm, Agilent Technologies, Santa Clara, CA)
column. The mobile phase was acetonitrile and water (70:30 v:v,) with flow rates
of 1 and 1.5 mL/min, which correspond to retention times of about 2.3 and 3.7
minutes, for analysis of CP and PCNB, respectively. Calibration using 4 or 5
standards, with concentrations that encompass the range of sample
concentrations, was conducted prior to chemical analysis.
4.3.4 Experimental Procedures
The procedures used in the DMSO and pinhole experiments as well as the
determination of the PBS solution resistivity are described next.
4.3.4.1 DMSO Experiments
The DMSO experiments consisted of simultaneous measurements of
impedance and PCNB flux through skin in four impedance-diffusion (ID) cells
before and after four different treatments: 0.25 and 1 h treatments with 100%
DMSO or with PBS, which acted as the control. The entire experiment was
repeated three times. For each treatment, skin was mounted in a frame, which
was then clamped into an ID cell. Both chambers were filled with PBS for an
eight to twelve hour equilibration period. During the equilibration period,
impedance spectra were measured hourly to establish a baseline for the

119
electrical properties of the skin as well as to verify that the skin was at equilibrium
as indicated by insignificant differences between subsequent spectra.
After equilibration, both chambers were emptied and the receptor and
donor chambers were rinsed and filled with 13 mL of PBS and PCNB-saturated
PBS, respectively. To ensure saturation of the donor solution throughout the
experiment, excess crystals of PCNB were added to the donor chamber solution.
One-milliliter samples, collected periodically from the receptor chamber, were
replaced with an equal volume of chemical-free PBS. A total of nine samples
were collected over 8 h. The first sample was collected between 0 and 0.5 h
after the introduction of the donor solution. The eight subsequent samples were
collected approximately hourly relative to the time that the saturated donor
solution was introduced to the donor chamber. Impedance scans were also
collected approximately hourly during the permeation study. Next, the receptor
and donor chambers were emptied and filled with either DMSO or with PBS (for
the control experiments). After treatment for either 0.25 or 1 h, the frame holding
each skin sample, including the PBS controls, was removed from its ID-cell
assembly and soaked in approximately 1 L of fresh deionized water three times
for 0.25 h and then for 1 h in about 1 L of PBS. The ID cells were rinsed
thoroughly and then reassembled and filled with PBS solution for another 8-h
equilibration period with hourly impedance scans. After this, the PCNB flux
measurements were repeated. Impedance results reported for before and after
DMSO treatment were derived from the last spectrum collected during the
equilibration periods.

120
In a separate time-course study, four skin samples from one subject were
each treated with DMSO for one of four different times: 0.25, 0.5, 0.75 and 1 h.
All four experiments were conducted at the same time following the same
procedure described above except that 4-CP was used in the permeation study
rather than PCNB.
4.3.4.2 Pinhole Experiments
The pinhole experiments were conducted following a similar procedure to
the DMSO treatment experiments. After the same initial equilibration period,
solutions from both chambers were drained and 13 mL of PBS and CP-saturated
PBS were placed in the receptor chamber and donor chambers, respectively.
Either 1 or 2-milliliter samples were collected hourly from the receptor solution
with replacement starting 4 h after introducing the saturated donor solution and
continuing for 3 h. After this, the frame holding the skin was removed from the ID
cells, a hole was poked with a 26 Ga needle (464 µm outside diameter), the ID
cell was reassembled, and the donor and receptor chambers refilled with fresh
CP-saturated PBS and PBS, respectively. Seven 2-mL samples were collected
from the receptor chamber with replacement every 0.75 h after introducing the
CP donor solution. Impedance spectra were collected hourly during the PCNB
flux measurements and results reported before and after needle puncture were
derived from the last spectrum collected during the CP flux measurements.

121
4.3.4.3 Steady-State Flux Determination
The cumulative mass of chemical delivered into the receptor solution (M)
at a sample time (t) was calculated by summing the mass of chemical in the
receptor chamber and the total mass of chemical removed from the receptor
solution in previous samples. The mass of chemical in the receptor chamber at t
is the product of the receptor solution volume and the measured chemical
concentration in the sample collected at time t. The mass removed from the
receptor chamber by sampling is the product of the concentration and volume of
the sample.
The steady-state flux (Jss), which is the slope of the linear portion of the
area normalized cumulative mass (M/A) versus t curve, was determined by linear
regression. The lag time (tlag) is the ratio of the intercept to the slope of the
regressed line. Experimental estimates for Jss that include M/A measurements at
times less than about 2.4 times the lag time, are systematically lower than the
actual value (Bunge et al., 1995); thus, data points collected before 2.4tlag were
removed and the regression was repeated. In most cases, Jss was determined
using at least four data points: in all cases, three data points were used.
4.3.4.4 Solution Resistivity of PBS
The resistivity of the PBS solution at 32oC was determined to be 54.855 ±
0.003 Ω cm (mean ± one standard deviation, n = 6) by measuring the resistance
of the PBS solution in one of the ID cells containing no skin and filled with 26-mL
of PBS. Six successive impedance spectra of frequencies between 1 Hz and

122
100 kHz were measured in the four electrode configuration. The resistance from
each spectrum was the average value of Zr measured at frequencies where only
the resistance of the PBS solution contributed to the impedance response of the
system as indicated by –Zj = 0 (typically between 10 - 300 Hz). The average
resistance of the six scans was 93.623 ± 0.005 Ω cm2 (mean ± one standard
deviation). The resistivity was calculated from the product of this resistance and
the electrode cell constant, which accounts for the effective area and length of
the solution between the electrodes in the ID cell. The cell constant was
determined by measuring the resistance of standard solutions (0.01, 0.1 and 1
molal potassium chloride in DI water) with known resistivity at 32° C (8.19, 68.68
and 623.91 Ω cm, respectively from Pratt et al., 2001) in the same ID cell by the
procedure described above. The cell constants for the three solutions, calculated
from the ratio of the resistivity to the measured resistance, were independent of
the potassium chloride concentration and equal to 0.586 ± 0.005 cm (average ±
standard deviation).
4.3.5 Regression
Equations representing the various equivalent circuit models were
regressed to the complex impedance data by minimization of the objective
function ( χ2) described by Eq. (4.19)
( )( ) ( )( ) ( ) ( )( )
( )
dat
2 2
r k r k j k j k2
2k 1 k
ˆ ˆˆ ˆN Z f Z f Z f Z f
fχ
σ=
− + −
=
∑P P
p (4.19)
123
where k is an index for the observation at each measurement frequency, Ndat is
the total number of measurement frequencies in the spectrum, Zr and Zj are the
real and imaginary impedance data measured at frequencies fk, ( )ˆ
|r kZ f P and
( )ˆ
|j kZ f P are the real and imaginary parts of the equivalent circuit model
equation evaluated at frequency fk for the parameter vector P (which includes all
of the model parameters being optimized), and ( )kfσ is the average of the
stochastic error at frequency fk determined as described below. The errors
reported for tabulated values of the regressed parameters presented below are
the asymptotic standard parameter errors, which is the square root of the
covariance matrix (Gavin, 2011). The objective function was minimized using a
Levenberg-Marquardt algorithm developed and implemented in MatLabTM by
Gavin (2011). Orazem and Tribollet (2008) provide a description of the
Levenberg-Marquardt method for regression to complex numbers.
The stochastic error in the measurements at each frequency ( )2
kfσ was
estimated from the average of the stochastic error of the real (σr) and imaginary
(σj) parts of the measured impedance at frequency fk. The σr and σj were
estimated following the measurement model approach described in the papers
by Agarwal et al. and Orazem et al.(Agarwal, 1992; Agarwal et al., 1995a;
Agarwal et al., 1995b; Agarwal et al., 1996; Orazem et al., 1996). Briefly, this
involves fitting the impedance data to a simple equivalent circuit model (also
known as the measurement model) consisting of an optimal number of R-C
circuits in series to five successive impedance spectra by modulus-weighted,

124
complex non-linear least squares regression using the Measurement Model
Toolbox developed by Orazem (2001). The residual error between the data and
the measurement model cannot be taken as the stochastic error because the
error due to lack of fit could be significant. However, the standard deviation of
the residuals, as expressed by Eq. (4.20), is an estimate of the standard
deviation of the stochastic error as a function of frequency
( ) ( ) ( )( )scans
22
k res,m k res km 1scans
1
1
N
f f fN
σ ε ε=
= −−∑ (4.20)
where ( )res kfε is the mean of the residual errors at frequency fk for all scans
(Nscans) included in the analysis (i.e., Nscans = 5 in this study) and εres,m(fk) is the
residual error of either the real or imaginary part of the impedance at frequency fk
of scan m, defined as
( ) ( ) ( )MMres,m k k k
ˆf Z f Z fε = − (4.21)
In Eq. (4.21), Z(fk) is the measured value of the impedance and ( )MM k
ˆZ f is the
impedance calculated from the measurement model at frequency fk for the
optimal number of R-C circuits in series.
4.4 Results and Discussion
Using the fraction-damaged model described by Eq. (4.7), the real and
imaginary components of the impedance (Zr A and -Zj A ) as well as d log(-Zj A)/d
log(f), were calculated as a function of frequency for input parameter values that
are reasonable for skin. Parameter values for the undamaged skin layer are the
regression results for sample B before treatment with DMSO for 0.25 h that are

125
presented below: Rs A = 167.0 kΩ cm2, αs = 0.682 and fc,s = 51 Hz. Parameter
values for the damaged layer are the mean of regression parameters for three
samples after DMSO treatment that are presented below: Rd A = 1.36 kΩ cm2,
αd = 0.81, fc,d = 5640 Hz). The results are shown in the left-hand column of
Figure 4.3 for the relative thickness of the damaged layer (xd/L) varying from zero
(i.e., no damage) to one (i.e., fully damaged).
When the skin is undamaged (xd/L = 0) or completely damaged (xd/L = 1),
the frequency dependence is consistent with a 1-time-constant model described
by Eq. (4.2). For xd/L values between 0 and 1 both time constants corresponding
to the undamaged and damaged layers contribute to the total impedance. As
xd/L increase the relative contribution to the total impedance of the undamaged
layer decreases and the impedance of the damaged layer increases.
An assumption of the fraction-damaged model is that the characteristic
frequencies of both time constants, which for the theoretical curves shown in
Figure 4.3 are 51 Hz for the undamaged layer and 5640 Hz for the damaged
layer, are independent of the fraction damaged. Although the magnitude of the
impedance changes with xd/L, the characteristic frequency of each layer remains
unchanged. In skin, this is consistent with the relative thicknesses of the
undamaged and damaged skin layers decreasing and increasing, respectively,
while the intrinsic electric properties of each layer (i.e. resistivity and dielectric
constant) of the undamaged and damaged layers remain constant.

126
ZrA(k
cm2)
-ZjA(k
cm2)
dlog(-ZjA)/dlog(f)
Figure 4.3 Impedance spectra calculated using either the fraction-damaged model for varying xd/L or the pinhole model for varying numbers of holes. The model parameters are typical of those observed for human skin impedance: Rs A
= 167.0 kΩ cm2, Rd A = 1.36 kΩ cm2, αs = 0.682, αd = 0.81, fc,s = 51 Hz and fc,d = 5640.
In plots of d log(-Zj A) / d log(f) versus frequency, impedance features can
be identified that are not readily visible in other graphical representations. For
example, when xd/L is greater than zero but not one, the presence of a second

127
time constant with characteristic frequency at 5640 Hz is apparent in the plots of
d log(-Zj A) / d log(f) versus frequency in Figure 3c because inflection points,
which are difficult to identify in the –Zj A or Zr A plots, appear as local a minimum
and maximum at frequencies greater than about 100 Hz.
If skin is partially damaged, neglecting the second time constant can
produce estimates for Rs A and Cs / A that are unrealistic. For example, if the
impedance spectrum of the fraction-damaged model with xd/L = 0.8 shown in
Figure 4.3 was analyzed using the 1-time-constant model with a characteristic
frequency corresponding to the maximum value of –Zj A (i.e. fc,s = 51 Hz) and
Rs A is taken to be Zr A at the lowest measured frequency (~ 38 kΩ cm2), then,
from Eq. (4.4), the apparent Cs / A would be ~82 nF/cm2, which is about 4-fold
larger than the capacitance estimated for either the damaged or undamaged
layers. This arises because Zr A at the lowest measured frequency includes the
resistances from both the damaged and undamaged layer. Thus, by not
recognizing that the system consists of two layers, the resistance is estimated to
be between that of the damaged and undamaged layers and the capacitance is
calculated to be much larger than either the damaged or undamaged layers.
Using the pinhole model described by Eq. (4.12), Zr A, –Zj A and d log(–Zj
A)/ d log(f) were calculated as a function of frequency with the same skin
parameters as used for the undamaged skin layer in the fraction-damaged model
described above (Rs A = 167.0 kΩ cm2, αs = 0.682, Qs/A = 41.4 and fc,s = 51 Hz).
The results are shown in the right-hand column of Figure 4.3 with the number of
holes varying from 0 to 5. Each hole was assumed to not influence the

128
impedance of the other holes, and it was assumed that adding holes did not
change the R-CPE parameters of the skin (i.e., Rs, Qs and αs were assumed to
be constant). Each hole acted in parallel to the skin resistance with a resistance
normalized by the exposed skin area (Rhole A) equal to 19.3 kΩ cm2, which is
similar what was seen in the experiments with one hole described below (i.e.,
subject III). Therefore, the total resistance attributed to the holes (Rholes) is the
resistance of one hole (Rhole) divided by the number of all holes (Nholes) as follows
holeholes
holes
RR
N= (4.22)
For the pinhole model spectra shown in the right-hand column of Figure 4.3, the
total resistance, indicated by Zr A at low frequency, decreases with increasing
number of pinholes while the characteristic frequency, which is the frequency at
which the –Zj A curves are maximized or where d log(-Zj A)/d log(f) equals zero,
increases with the number of holes. Increasing the number of pinholes reduces
the total resistance of the system causing the time constant to shift to higher
frequencies.
4.4.1 DMSO Experiments
Experimental impedance spectra for six skin samples before and after
DMSO treatment for either 0.25 h (samples A, B and C) or 1 h (samples D, E and
F) are shown side-by-side for easy comparison in Figure 4.4. Graphs of Zr A, -Zj
A and d log(-Zj A)/ d log(f) plotted as functions of frequency before treatment are
shown in the left column. The impedance spectra measured after DMSO

129
treatment for 0.25 h and 1 h are presented in the middle and right columns,
respectively.
Figure 4.4 Three representations of the impedance plotted as a function of the frequency before and after skin is treated with DMSO for 0.25 and 1 h: (a) area normalized real part of the impedance, (b) area normalized imaginary part of the impedance, and (c) first derivative of the area normalized imaginary part of the impedance.
Comparing the columns of plots shown in Figure 4.4, consistent trends in
the skin impedance response subsequent to DMSO treatment for 0.25 h and 1 h
are evident. On average, Zr A at low frequency decreases by factors of ~4 and
~100 after 0.25 and 1 h DMSO treatment, respectively, while DMSO treatment at

130
both times had no effect on the Zr A at the highest frequencies. Consistent with
the theoretical impedance curves for the fraction-damaged model shown in
Figure 4.3, the impedance spectra of skin before DMSO treatment and after
DMSO treatment for 1 h each exhibit one characteristic frequency as predicted
by the 1-time-constant model (corresponding to xd/L equal to 0 and 1
respectively); while the impedance spectra of the 0.25 h DMSO treated samples
behaves as predicted by the 2-time-constant model (i.e. 0 < xd/L < 1).
The impedance spectra before DMSO treatment show considerable
sample-to-sample variation in the magnitude of the low-frequency impedance
and the characteristic frequency, which corresponds to the frequency where –Zj
A is a maximum or equivalently where d log(-Zj A)/d log(f) is equal to zero.
Variability is significantly reduced in skin that was treated with DMSO for 1 h.
Consistent with this, the data for each of the three samples is in close agreement
with the average fc,d, indicated by the vertical line through the 1-h DSMO
treatment data in Figure 4.4. Even the scatter in the low frequency values of
d log(-Zj A)/d log(f) is similar, which almost certainly arises because the
magnitude of -Zj A is small enough to be affected by instrument noise.
The time-course impedance results for four skin samples after DMSO
treatment for 0.25, 0.5, 0.75 and 1 h (samples G, H, I and J, respectively) are
shown in Figure 4.5. The Zr A, -Zj A and d log(-Zj A) / d log (f) spectra for the two
skin samples treated with DMSO for 0.25 and 1 h are consistent with the
impedance spectra of the samples treated for the same times shown in Figure
4.4. Similar to the theoretical curves of the fraction-damaged model shown in

131
Figure 4.3, the magnitude of the skin impedance decreases with longer DMSO
treatment times and the samples treated with DMSO for less than 1 h have
frequency dependence consistent with the 2-time-constant model.
Figure 4.5 Impedance spectra after skin samples were treated with DMSO for 0.25, 0.5, 0.75 and 1 h, which corresponds to experiments G, H, I and J, respectively: (a) area normalized real part of the impedance, (b) area normalized imaginary part of the impedance, and (c) first derivative of the area normalized imaginary part of the impedance.

132
After 0.5 h DMSO treatment, the two convoluted time constants appear as
a broad peak in the –Zj A spectrum. The presence of two time constants for this
sample is more apparent in the d log(-Zj A) / d log (f) plot in Figure 4.5c, where
the two time constants are evident by the change in slope of the d log(-Zj A) / d
log (f) curve between 100 and 200 Hz.
After DMSO treatment for 0.75 h, the impedance response is consistent
with a nearly completely damaged skin layer with a dominant time constant at
high frequency similar to the 1 h DMSO damaged skin. There is a slight
contribution from the undamaged layer at lower frequencies that is evident by the
deviation of the –Zj A spectrum from the spectrum after 1 h DMSO treatment.
Skin impedance data were regressed to the equivalent circuit models
described above to give the results reported in Tables 4.1 - 4.3. Parameters of
the 1-time-constant model regressed to the skin impedance data before and after
0.25 h and 1 h treatments with either PBS or DMSO are listed in Table 4.1. The
mean values (n = 3) of the regression parameters after 0.25 h PBS, 1 h PBS and
1 h DMSO treatments are given in Table 4.2 and compared to the mean values
of skin before all treatments (n = 12). The parameters of the 2-time-constant
model regressed to skin impedance spectra for the three samples treated with
DMSO for 0.25 h are listed in Table 4.3 along with the mean and standard
deviation of the parameter values. Meaningful estimates of the 2-time-constant
model parameters could not be determined for skin samples treated with DSMO
for 0.5 and 0.75 h because the contribution of the undamaged layer was too
small to reliably resolve.

13
3
Table 4.1 Parameters of the 1-time-constant model derived by regression to impedance spectra before and after PBS (control) treatments for 0.25 and 1 h and DMSO treatment for 1 h
Sample ID
AC BC CC
Treatment Parameter (units) Before After Before After Before After
0.25 h PBS Regressed parametersa
Re A (kΩ cm2) 0.13 ± 0.40 0.14 ± 0.42 0.16 ± 0.099 0.15 ± 0.09 0.18 ± 0.043 0.17 ± 0.028
Rs A (kΩ cm2) 137 ± 0.8 131.6 ± 0.8 29.7 ± 0.1 28.7 ± 0.1 13.9 ± 0.1 9.69 ± 0.04
αs 0.859 ± 0.007 0.863 ± 0.008 0.894 ± 0.006 0.884 ± 0.006 0.918 ± 0.005 0.900 ± 0.005
Qs / A ((nF sα
)/cm2) 41.9 ± 1.8 44.3 ± 2.1 35.2 ± 1.8 40.4 ± 2.0 27.9 ± 1.3 36.0 ± 1.5
Calculated parametersb
Cs / A (nF/cm2) 17.9 ± 0.3 19.5 ± 0.3 15.5 ± 0.2 16.6 ± 0.2 13.9 ± 0.2 14.9 ± 0.2
fc,s (Hz) 65 ± 2 62 ± 1 345 ± 5 347 ± 5 823 ± 10 1106 ± 12
DC EC FC
Treatment Parameter (units) Before After Before After Before After
1 h PBS Regressed parametersa
Re A (kΩ cm2) 0.09 ± 0.59 0.11 ± 0.58 0.17 ± 0.10 0.17 ± 0.08 0.13 ± 0.45 0.14 ± 0.35
Rs A (kΩ cm2) 297.9 ± 1.4 258.0 ± 1.3 25.7 ± 0.1 21.2 ± 0.1 116.8 ± 0.8 105.8 ± 0.7
αs 0.856 ± 0.005 0.859 ± 0.006 0.880 ± 0.007 0.874 ± 0.007 0.866 ± 0.009 0.859 ± 0.008
Qs / A ((nF sα
)/cm2) 37.3 ± 1.1 41.0 ± 1.3 35.8 ± 2.0 40.4 ± 2.3 41.8 ± 2.4 48.7 ± 2.4
Calculated parametersb
Cs / A (nF/cm2) 17.5 ± 0.2 19.4 ± 0.2 13.8 ± 0.2 14.6 ± 0.2 18.3 ± 0.3 20.6 ± 0.3
fc,s (Hz) 30.5 ± 0.3 32.8 ± 0.4 448 ± 7 514 ± 8 74 ± 1 73 ± 1

13
4
Table 4.1 Continued
Sample ID
A B C
Treatment Parameter (units) Before After Before After Before After
0.25 h DMSO Regressed parametersa
Re A (kΩ cm2) 0.14 ± 0.59 0.12 ± 0.13 0.15 ± 0.46 0.12 ± 0.10 0.16 ± 0.53 0.15 ± 0.10
Rs A (kΩ cm2) 313.3 ± 1.5 80.6 ± 0.4 167.0 ± 0.9 25.9 ± 0.2 169 ± 1 47.2 ± 0.2
αs 0.85 ± 0.01 0.72 ± 0.01 0.682 ± 0.007 0.64 ± 0.01 0.879 ± 0.008 0.72 ± 0.01
Qs / A ((nF sα
)/cm2) 47.7 ± 1.3 308 ± 7 41.4 ± 1.67 874 ± 44 37 ± 2 346 ± 10
Calculated parametersb
Cs / A (nF/cm2) 22.81 ± 0.23 75.4 ± 0.8 18.7 ± 0.3 108 ± 3 18.4 ± 0.3 72 ± 1
fc,s (Hz) 22 ± 2 26 ± 1 51.0 ± 0.7 57 ± 1.5 50.9 ± 0.8 47 ± 1
D E F
Treatment Parameter (units) Before After Before After Before After
1 h DMSOc Regressed parameters
a
Re A (kΩ cm2) 0.16 ± 0.28 0.185 ± 0.004 0.11 ± 0.89 0.146 ± 0.006 0.14 ± 0.67 0.190 ± 0.004
Rs A (kΩ cm2) 83.4 ± 0.4 1.396 ± 0.004 181.6 ± 1.8 1.194 ± 0.007 193.9 ± 1.5 1.480 ± 0.004
αs 0.875 ± 0.007 0.807 ± 0.003 0.87 ± 0.012 0.809 ± 0.005 0.857 ± 0.009 0.810 ± 0.003
Qs / A ((nF sα
)/cm2) 33.4 ± 1.6 143 ± 5 34.7 ± 2.5 190 ± 10 45.6 ± 2.3 140 ± 4
Calculated parametersb
Cs / A (nF/cm2) 14.4 ± 0.2 18.7 ± 0.2 16.4 ± 0.4 25.3 ± 0.4 20.7 ± 0.4 19.4 ± 0.1
fc,s (Hz) 133 ± 2 6089 59 54 1 5263 87 40 1 5553 45

13
5
Table 4.1 Continued
a Values are reported as the regressed parameters ± the standard parameter error. b Values are reported as the calculated parameter ± the error estimated by propagation of the standard parameter error on the regressed parameters contained in the calculated parameter (Orazem and Tribollet, 2008).
c Parameter values after DMSO treatment for 1 h represent damaged skin.

13
6
Table 4.2 Mean values of the parameters of the 1- time-constant model derived by regression to impedance spectra measured before and after PBS (control) treatments for 0.25 and 1 h and DMSO treatment for 1 h compared to mean values before all treatments
Treatmenta
0.25 h PBS 1 h PBS 1 h DMSO All treatmentsb
Parameter (units) Before After Before After Before Afterc Before
Regressed parameters
Re A (kΩ cm2) 0.16 ± 0.03 0.15 ± 0.02 0.13 ± 0.04 0.14 ± 0.03 0.14 ± 0.03 0.17± 0.02 0.14± 0.03
Rs A (kΩ cm2) 60 ± 67 57 ± 66 147 ± 139 128 ± 120 153 ± 61 1.36± 0.15 120± 94
αs 0.89 ± 0.03 0.88 ± 0.02 0.87 ± 0.01 0.86 ± 0.01 0.87 ± 0.01 0.81± 0.01 0.87± 0.02
Qs / A ((nF sα)/cm2) 35 ± 7 40 ± 4 38 ± 3. 43 ± 5 38 ± 7 158± 28 38± 6
Calculated parameters
Cs / A (nF/cm2) 16 ± 2 17 ± 2 17 ± 2 18 ± 3 17 ± 3 21± 3 17± 3
fc,s (Hz) 411 ± 383 505 ± 540 184 ± 230 207 ± 277 76 ± 50 5640± 420 178± 244
a Mean ± one standard deviation of values determined in 3 skin samples for each treatment b Mean ± one standard deviation of values determined in 12 skin samples before all treatments; i.e., 0.25 h and 1 h treatments with
PBS and with DMSO c Parameter values after DMSO treatment for 1 h represent damaged skin.

13
7
Table 4.3 Parameters of the 2-time-constant model derived by regression to impedance spectra from skin after DMSO treatment for 0.25 h
Sample ID All Samplesa
Parameter Units A B C Mean Std dev
Regressed parametersb Undamaged layer
eR A kΩ cm2 0.16± 0.07 0.18 ± 0.07 0.17± 0.06 0.17 0.06
sR A kΩ cm2 76.9± 0.3 24.0 ± 0.2 45.4± 0.2 48.8 39.3
αs unitless 0.77± 0.01 0.72 ± 0.01 0.77± 0.01 0.75 0.43
sˆ /Q A (nF sα
)/cm2 252± 3 583 ± 12 273± 3 369 291
Calculated parametersc
sˆ /C A
b nF/cm2 77.6± 1.0 111 ± 3.5 71.5± 1.1 86.6 23.4
fc,s Hz 27± 0.3 60 ± 2 49± 1 45 24
Regressed parametersb
dR A kΩ cm2 1.62± 0.25 0.72 ± 0.18 0.56± 0.16 0.97 0.74
αd unitless 0.90± 0.09 0.89 ± 0.16 0.91± 0.20 0.9 0.40
dˆ /Q A (nF sα
)/cm2 142± 118 125 ± 189 151± 286 139 88
Calculated parametersc
dˆ /C A nF/cm2 55± 62 39 ± 81 57± 151 50 11
Damaged layer
fc,d Hz 1790± 2040 5670 ± 11900 4990± 13200 4150 2750
a Values are reported as the mean ± one standard deviation of the parameter values for all three samples. b Values are reported as the regressed parameters ± the standard parameter error c Values are reported as the calculated parameter ± the error estimated by propagation of the standard parameter error on the regressed parameters contained in the calculated parameter (Orazem and Tribollet, 2008)

138
In these tables regressed parameters are reported plus or minus the
standard error. Values of the characteristic frequency and effective capacitance
calculated from the regressed parameters are reported with errors estimated by
propagation of the standard error through the calculation. Except for dˆ /Q A , all
values of the regressed parameters listed in Table 4.3 were determined with a
high degree of confidence as indicated by the small errors. The inability to
resolve dˆ /Q A with more certainty is likely due to the convolution of the small-
impedance damaged layer with the large-impedance undamaged layer. The
large uncertainty of dˆ /Q A is reflected in large estimated errors for the calculated
values of dˆ /C A and fc,d.
Models and impedance data are compared in Figure 4.6 for samples B
and E before and after DMSO treatment. The results for both skin samples
before treatment are shown in the left column. The results after treatment for
0.25 h (sample B) and 1 h (sample E) are presented in the middle and right
columns, respectively. The solid lines in Figure 4.6 represent the total
impedance calculated using the regressed models to the data. The dot-dashed
lines and dashed lines in the center column represent the impedance calculated
for each R-CPE element of the 2-time-constant model corresponding to the
undamaged and damaged skin layers. The diamonds in the impedance plane
plots of Figure 4.6c represent the characteristic frequencies of the models. For
skin treated with DMSO for 0.25 h, the characteristic frequencies of the
undamaged and damaged layers are highlighted for both the total impedance
and for the impedance of each element.

139
Figure 4.6 Example impedance spectra of skin before and after DMSO treatment for 0.25 h and 1 h compared to equivalent circuit models: (a) area normalized real part of the impedance, (b) area normalized imaginary part of the impedance, and (c) impedance plane (Nyquist) plot with characteristic frequencies noted. The solid lines represent the total impedance derived by regression of the 1-time-constant model to data measured before DMSO and after DMSO treatment for 1 h, and regression of the 2-time-constant model to the data measured after DMSO treatment for 0.25 h. The dot-dashed lines and the dashed lines represent respectively the impedance of the undamaged and damaged skin fractions after DMSO treatment for 0.25 hr.
Before DMSO treatment, the impedance spectra of the two skin samples
were nearly identical, with small differences that are primarily visible in the
impedance plane plot (Figure 4.6c). Although the maximum values of Zr A,

140
determined at the lowest measured frequency, are noticeably different for the two
samples in Figure 4.6c, the characteristic frequencies are the same, indicating
that the effective capacitances were slightly different.
After 0.25 h DMSO treatment, the impedance of the damaged layer,
represented by the dashed lines, contributes little to the total impedance for
frequencies below ~1000 Hz. However, it is interesting to note that the shape
and magnitude of the impedance response of the damaged layer is similar to that
of the skin treated with DMSO for 1 h shown in the right column.
The data for skin treated with DMSO for 1 h are in good agreement with
the 1-time-constant model except for –Zj A measured at frequencies below about
5 Hz. A similar behavior has been observed in spectra from other samples that
are not shown here. Data over the entire spectrum were shown to be consistent
with the Kramers-Kronig relations using the measurement model method
described by Agarwal et al. (Agarwal, 1992; Agarwal et al., 1995a; Agarwal et al.,
1995b; Agarwal et al., 1996). Therefore, the deviation between model and data
is most probably not an experimental artifact and a different model is required to
capture the low frequency dispersion observed in these samples.
The d log(–Zj A)/d log(f) spectra of samples B and E after DMSO
treatment are shown in Figure 4.7 with lines representing the 2-time-constant and
1-time constant models, respectively. When the data are presented this way, the
similarity in the fc,d values for both treatment times is evident.
If the impedance response of the 0.25 h DMSO treated skin is consistent
with the fraction-damaged model given by Eq. (4.7), then the characteristic

141
frequency estimated for the undamaged skin layer (fc,s) should be similar to skin
before DMSO treatment as well as to skin in the control experiments that was
treated with PBS.
Figure 4.7 The first derivative of the logarithm of (-Zj A) with respect to the logarithm of frequency plotted as a function of the average frequency for skin that has been treated with DMSO for 0.25 and 1 h compared respectively to the 2-time-constant (solid lines) and the 1-time-constant (dashed lines) models.
Likewise, the characteristic frequency estimated for the damaged layer (fc,d)
should be similar to fc,d for skin treated with DMSO for 1 h. The mean value of fc,s
for samples A, B and C after 0.25 h DMSO treatment, listed in Table 4.3, is
statistically indistinguishable from the mean value of fc,s for the same three
samples before 0.25 h DMSO treatment listed in Table 4.2 (paired student t-test,
p < 0.05). Also, the mean value of fc,s for samples A, B and C after 0.25 h DMSO
treatment is statistically indistinguishable from the mean fc,s for all 12 samples
before DMSO and PBS treatment, which is listed in Table 4.2 (2 sample student
t-test, p < 0.05). Furthermore, the mean value of fc,d for samples A, B and C after
0.25 h DMSO treatment, listed in Table 4.3, is statistically indistinguishable from

142
the mean value of fc,d values samples D, E and F after 1 h DMSO treatment
(student t-test, p < 0.05).
In Figure 4.8 the characteristic frequencies are compared graphically as
the ratios of fc,s and fc,d after treatment to fc,s before treatment (i.e., fc,s/fc,s before and
fc,d/fc,s before) for 0.25 h and 1 h treatments with either DMSO or PBS. The dashed
line, plotted on the left-hand axis at 1.1, represents the mean value of fc,s/fc,s before
for the six PBS control experiments; the solid line, the mean value of 94 for
fc,d/fc,s before from the three skin samples treated with DMSO for 1 h plotted on the
right-hand axis. Consistent with the assumption of the fraction-damaged model,
the after-to-before ratios of the characteristic frequencies for the undamaged and
damaged layers of skin treated with DMSO for 0.25 h are similar to the ratios
observed after treatment with PBS at both treatment times and with DMSO for
1 h, respectively.
Values for xd/L for skin treated with DMSO for 0.25 h were estimated by
requiring that the resistances of the two skin layers sum to give the total
resistance observed experimentally as specified by Eq. (4.23):
( )s d s d d dˆ ˆ 1R R R x L R x L+ = − + (4.23)
which after rearrangement gives
( )s s d
d
s d
ˆ ˆR R Rx L
R R
− +=
− (4.24)
In addition, it was assumed that: (a) Rd A is equal to the mean value of the
resistance measured in skin treated with DMSO for 1 h, and (b) Rs A is equal to
the resistance determined in the same piece of skin before treatment multiplied

143
by 0.86, which was the average change in Rs A observed in treatment with PBS
for 0.25 and 1 h combined (no difference was observed in 0.25 h compared to
1 h).
Figure 4.8 The after-to-before treatment ratio of the characteristic frequencies estimated for the undamaged and damaged layers of skin treated with DMSO for 0.25 h compared to skin treated with PBS and with DMSO for 1 h. The dashed line indicates the mean value of the ratio for all of the PBS control experiments (fc,s/fc,s before = 1.1), and the solid line represents the mean value of the ratio for skin treated with DMSO for 1 h DMSO experiments (fc,d/fc,s before = 94).
Calculated values for xd/L as well as the length-independent values for the
area normalized capacitance for three samples treated with DMSO for 0.25 h are
summarized in Table 4.4. Interestingly, the mean Cs / A estimated for the
undamaged layer (21 ± 2 nF/cm2) is the same as before DMSO treatment (20 ± 2
nF/cm2). For the damaged layer, the mean Cs / A, increased by a factor of about
2 (37 ± 4 nF/cm2), which could be consistent with increased lipid disorder or a
change in the dielectric property towards a less lipophilic character.

14
4
Table 4.4 Estimated values for the fraction damaged (xd/L) and model parameters of the damaged and undamaged skin layers for skin treated with DMSO for 0.25 h
Sample ID
A B C All samples
Parameter Units Beforea After
b Before
a After
b Before
a After
b Before
c After
c
Re A kΩ cm2 0.14 0.16 0.15 0.18 0.16 0.17 0.15± 0.01 0.17 ± 0.01
xd/L 0.71 0.83 0.69 0.74 ± 0.076
Rd A kΩ cm2 2.3 0.9 0.8 1.3 ± 0.8
Cd / A nF/cm2 39 32 39 37 ± 4
αd 0.90 0.89 0.91 0.90 ± 0.01
Qd / A (nF sα)/cm
2 101 104 103 103 ± 2
Damaged layer
fc,d Hz 1790 5670 4990 4150 ± 2070
Rs A kΩ cm
2 313 269 167 144 169 145 216± 84 186 ± 72
Cs / A nF/cm2 23 22 19 18 19 22 20± 2 21 ± 2
αs 0.85 0.77 0.86 0.72 0.88 0.77 0.86± 0.02 0.75 ± 0.03
Qs / A (nF sα)/cm
2 48 72 41 97 37 85 42± 6 84.7 ± 12.5
Undamaged layer
fc,s Hz 22 27 51 60 51 49 41± 17 45 ± 17
a Calculated using the 1-time constant model.
b Calculated parameters, normalized for the fraction damaged, for skin after DMSO treatment assuming Rs/Rs,before = 0.86
c Values are reported as mean ± one standard deviation of values determined in 3 skin samples

145
Values of xd /L were estimated for the 0.25, 0.5 and 0.75 h treatments with
DSMO from the time-course study using Eq. (4.24) where the high frequency
determinations of Zr were used as estimates Rs and sR + dR before and after
DMSO respectively. Estimates of Rs A before DMSO and ( sR + dR ) A after
DMSO treatment for 0.25, 0.5 and 0.75 are listed in Table 4.5. The xd /L for the
time-course study and the three other skin samples treated with DMSO for 0.25 h
listed in Table 4.4 are shown as a function of the square-root of the DMSO
treatment time in Figure 4.9.
Table 4.5 Estimates of the area normalized total skin resistance before and after DMSO treatment for the time-course studya
Treatment time
Before DMSO
After DMSO
Rs A ( )s dˆ ˆR R A+
h (kΩ cm2) (kΩ cm2)
0.25 114.0 23.4 0.50 185.7 4.34 0.75 340.7 1.87
a Values determined from Zr A measured at low frequency.
As discussed earlier, xd/L was essentially 1 for the sample treated with
DMSO for 0.75 h. As expected for a diffusion process, the plot of xd/L from the
time-course study versus the square-root of time forced through the origin is
linear. The slope of the line through the intercept is 1.5 h-1/2, from which it can be
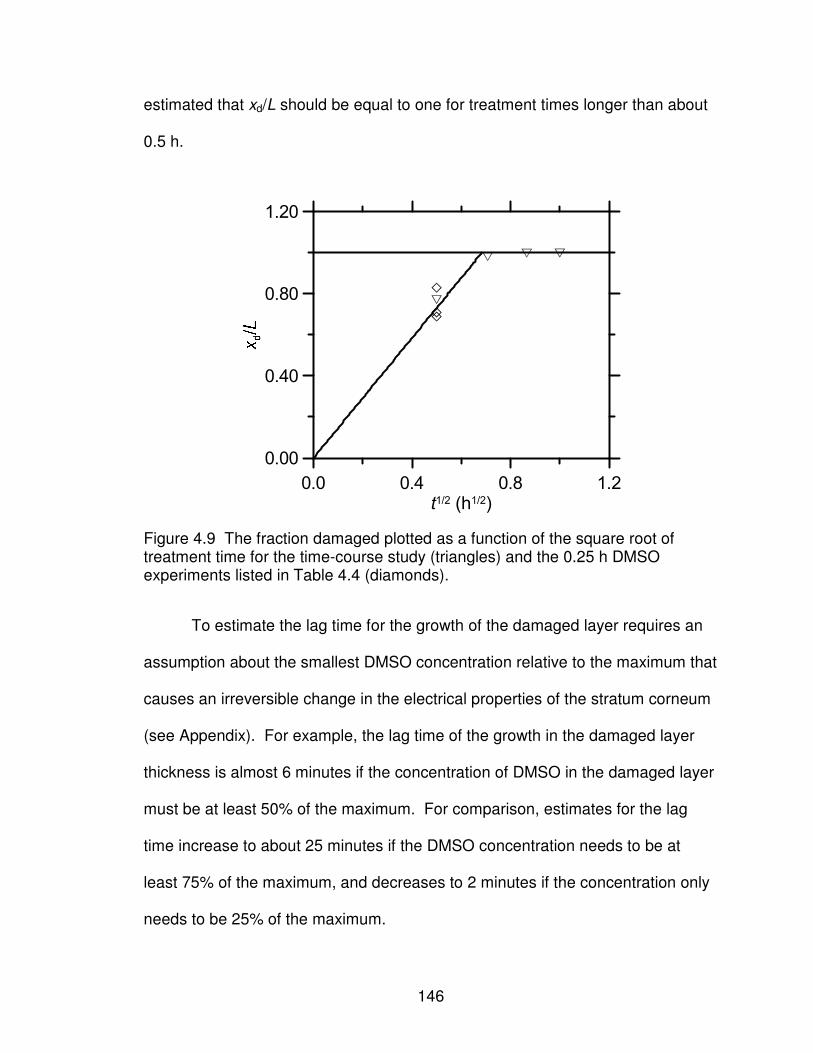
146
estimated that xd/L should be equal to one for treatment times longer than about
0.5 h.
0.0 0.4 0.8 1.2t1/2 (h1/2)
0.00
0.40
0.80
1.20
Figure 4.9 The fraction damaged plotted as a function of the square root of treatment time for the time-course study (triangles) and the 0.25 h DMSO experiments listed in Table 4.4 (diamonds).
To estimate the lag time for the growth of the damaged layer requires an
assumption about the smallest DMSO concentration relative to the maximum that
causes an irreversible change in the electrical properties of the stratum corneum
(see Appendix). For example, the lag time of the growth in the damaged layer
thickness is almost 6 minutes if the concentration of DMSO in the damaged layer
must be at least 50% of the maximum. For comparison, estimates for the lag
time increase to about 25 minutes if the DMSO concentration needs to be at
least 75% of the maximum, and decreases to 2 minutes if the concentration only
needs to be 25% of the maximum.

147
The steady-state flux of PCNB through skin measured before and after
treatments with DMSO and PBS treatment for 0.25 h and 1 h are reported in
Table 4.6. The change in PCNB flux after treatment is also listed. The flux
increased after treatment for all samples except for one sample treated with PBS
for 0.25 h and one sample treated with PBS for 1 h. The average change in flux
after DMSO treatment for 1 h was insignificantly larger than the average change
in flux after DMSO treatment for 0.25 h and PBS treatment for 0.25 h and 1 h
(student t-test, p<0.05). Neither treatment time nor treatment type had a
discernable effect on PCNB flux through skin. Thus, although the impedance of
skin decreased significantly when treated with DMSO, and the change was larger
after 1 h compared to 0.25 h, the flux of PCNB did not change significantly after
DMSO treatment for either 0.25 h or 1 h compared to the PBS control
experiments. This differed from the time course study in which the ratio of the
flux of CP after to before DMSO treatment did increase with increasing treatment
time from almost 2 at 0.25 h to about 4 at 1 h. However, it is difficult to know if
these differences would have been significant if the experiment had been
replicated.
4.4.2 Pinhole Experiments
Values of the parameters determined by regression to the pinhole model
are listed in Table 4.7 for seven skin samples from two subjects before and after
pinhole. For all samples, the impedance response of the skin, both before and
after pinhole, is adequately represented by the 1-time-constant model as
illustrated by the Zr A and -Zj A spectra, and the impedance plane plot shown for

148
sample IV in Figure 4.10. The regression parameters for the control experiment,
in which the skin was treated in the same way as the other samples except that it
was not punctured, are reported in Table 4.8.
Table 4.6 Comparing the steady-state flux of PCNB (µg/cm2/h) measured before and after treatments with DMSO and PBS (control) for 0.25 and 1 h
DMSO treatment PBS Control
Treatment time (h)
Sample ID Before After Changea
Before After Change
0.25 A 4.65 6.24 1.60 7.08 8.81 1.73
B 5.31 5.46 0.15 5.96 4.69 -1.27
C 3.69 4.33 0.64 5.35 5.42 0.07
Meanb,c
4.55+ 5.34 0.80
6.13*
6.31 0.18
Std devd
0.81 0.96 0.74
0.88 2.20 1.50
1 D 4.14 5.55 1.41 5.71 6.87 1.16
E 7.46 8.49 1.03 5.09 4.52 -0.57
F 2.54 3.44 0.90 3.77 3.82 0.05
Meanc
4.71 5.83 1.11 4.86 5.07 0.21
Std devd
2.51 2.53 0.27 0.99 1.60 0.88
a Defined as the value after treatment minus the value before treatment
b Comparing the flux before, the flux after, or the change in flux for a given treatment (either DSMO or PBS control); only the flux values before 0.25 and 1 h PBS control treatments were significantly different from each other.
c Comparing the flux before, the flux after, or the change in flux for a given treatment time (either
0.25 or 1 h); only the flux values before the 0.25 h treatment with DMSO were statistically significantly different from the PBS control.
d Comparing the flux before, the flux after, or the change in flux, the variance for treatment times and treatment types are not statistically different from each other according to single-factor ANOVA.
Because the needle used to puncture the skin was small compared to the
total skin area, the pinhole was expected to have little effect on the impedance
properties of the remaining skin. From the control experimental results, it was
confirmed that the electrical properties of skin did not change during the other
skin handling steps. Therefore, the resistance and the dielectric constant for the

149
skin were assumed to be the same before and after pinhole. Assuming that a
pinhole adds a low frequency shunt resistance (i.e. Rhole) in parallel with the skin,
the values of Rhole listed in Table 4.7 were calculated by rearrangement of Eq.
(4.13) assuming Rs A was equal to the before pinhole value.
The resistance of a hole through a membrane (Rhole) is related to the
solution resistivity (ρ), the hole diameter (dhole) and the length of the hole (Lhole)
as described by Eq. (4.25).
holehole 2
hole hole
4
2
LR
d d
ρρ
π= + (4.25)
where the first term on the right hand side of Eq. (4.25) represents the
constriction of the flux lines from a semi-infinite bulk electrolyte solution to the
hole, and the second term represents the resistance of the electrolyte solution in
the hole assuming the surrounding skin is impermeable to ions (Carslaw and
Jaeger, 1959). Assuming the length of the hole is the total thickness of the skin
sample (i.e., approximately 350 µm for the split-thickness skin used in this study)
and that it is completely filled with PBS solution, dhole for the pinhole in each
sample was estimated from Rhole using the measured resistivity of PBS solution
(ρ = 54.9 Ω cm). The results are listed in Table 4.7. The average resistance of
the pinholes in 7 skin samples corresponds 180 µm for dhole (range from 126 to
241 µm). If the hole resistance of 19.76 kΩ (sample II) is discarded as an outlier,
then the average value for Rhole is 10.25 ± 2.80 kΩ, which corresponds to 189
µm for dhole (range from 150 µm to 241 µm).

15
0
Table 4.7 Parameter values of the 1-time-constant model regressed to skin data before and after pinhole and estimates of the pinhole resistance and diameter
Sample IDa
Parameter Units I II III IV
Before After Before After Before After Before After
Regressed parametersb
Rt A kΩ cm2 141.8± 0.2 9.94± 0.01 93.6± 0.1 24.07± 0.03 93.4± 0.1 15.96± 0.02 55.2± 0.1 11.78± 0.01
αs unitless 0.81± 0.002 0.82± 0.002 0.82± 0.01 0.82± 0.003 0.79± 0.01 0.82± 0.003 0.83± 0.01 0.83± 0.002
Qs / A nF sα/cm
2 79.8± 1.0 67.7± 1.5 68.5± 1.3 73.5± 1.4 99.7± 1.1 83.0± 1.4 66.5± 1.4 63.7± 1.1
Calculated parametersc
Rs Ad
kΩ cm2 141.8± 0.2 141.8 0.2 93.6± 0.1 93.6 0.1 93.4± 0.1 93.4 0.1 55.2± 0.1 55.2 0.1
Cs / A
nF/cm2 27.4± 0.1 14.3 0.8 23.1± 0.2 18.2 1.3 28.8± 0.1 18.9 1.1 20.5± 0.1 14.4 0.8
Rhole Ae
kΩ cm2 10.7± 0.01 32.4± 0.07 19.3± 0.03 15.0± 0.02
Rhole kΩ 6.48± 0.01 19.76± 0.04 11.67± 0.02 8.14± 0.01
dholef
µm 241 126 170 210

15
1
Table 4.7 Continued
Sample IDa
Parameter Units V VI VII All samplesf
Before After Before After Before After Before After
Regressed parametersb
Rt A kΩ cm2 179± 0.3 15.63± 0.02 192± 0.3 21.20± 0.04 69.2± 0.1 14.88± 0.02 118± 54 16.21± 4.96
αs unitless 0.83± 0.01 0.85± 0.003 0.81± 0.01 0.84± 0.004 0.82± 0.01 0.83± 0.003 0.8± 0.01 0.83± 0.01
Qs / A nF sα/cm
2 61.8± 1.2 51.3± 0.9 70.5± 1.2 57.3± 1.3 74.3± 1.7 69.5± 1.3 74.4± 12.5 66.6± 10.5
Calculated parametersc
Rs Ad kΩ cm
2 179± 0.3 179± 0.3 192± 0.3 192± 0.3 69.2± 0.1 69.2± 0.1 118± 54 118± 54
Cs / A nF/cm2 23.8± 0.2 14.1± 0.9 26.4± 0.2 15.7± 1.3 23.6± 0.2 16.5± 1.3 24.8± 2.9 16.0± 1.9
Rhole Ae
kΩ cm2 17.1± 0.02 23.8± 0.05 19.0± 0.03 19.6± 6.9
Rhole (kΩ) 10.38± 0.01 14.54± 0.03 10.30± 0.02 11.6± 4.4
fc,t Hz 37± 1.0 721± 0.9 31± 0 477± 0.8 98± 1 648± 0.8 68.7± 39.4 685± 266
dholef
µm 182 150 183 180± 35
a Samples I to IV are from subject Q; samples V to VII are from subject AS b
Values are reported as the regressed parameters ± the standard parameter error c
Values are reported as the calculated parameter ± the error estimated by propagation of the standard parameter error on the regressed parameters contained in the calculated parameter (Orazem and Tribollet, 2008).
d Rs
A before and after the pinhole is assumed to be unchanged for purposes of calculating Rhole.
e Rhole A is calculated from Rt A and Rs A according to Eq. (4.13)
f Hole diameter was estimated using Eq. (4.25).

152
Figure 4.10 Typical impedance spectra measured before (point-up triangles) and after (point-down triangles) pinhole (subject IV): (a) area normalized real part of the impedance, (b) area normalized imaginary part of the impedance, and (c) impedance plane (Nyquist) plot with characteristic frequencies noted with diamonds.

153
Table 4.8 Parameter values of the 1-time-constant model regressed to skin data for the control sample in the pinhole experimenta
Parameter Units Before After
Regressed parametersb
Rt A kΩ cm2 103.2± 0.2 102.6± 0.16
αs Unitless 0.80± 0.002 0.81± 0.002
Qs / A nF sα/cm
2 85.6± 1 83± 1
Calculated parametersc
Rs A kΩ cm2 103.2± 0.2 102.6± 0.2
Cs / A nF/cm2 26.6± 0.1 26.5± 0.8
Rhole A kΩ cm2
fc,t Hz 58± 0.1 58± 0.1
a Skin sample from subject Q was treated the same as all other skin samples in the pinhole experiment but without puncturing a hole.
b Values are reported as the regressed parameters ± the standard parameter error
c Values are reported as the calculated parameter ± the error estimated by propagation of the standard parameter error on the regressed parameters contained in the calculated parameter (Orazem and Tribollet, 2008)
Overall, these estimates for dhole are a little smaller than half of the needle
diameter (464 µm). This is not surprising since the hole left by pushing a needle
through the skin will certainly be smaller than the needle diameter. Also, if the
hole is not completely filled with PBS, then the resistivity of the material in the
hole would be larger than for PBS, which will lead to a larger estimate for dhole.
Turning now to the effective capacitance, values of Cs / A calculated using
Eq. (4.16) are listed in Table 4.7. Consistently, for all seven skin samples, Cs / A
after the pinhole is about two-thirds the value before pinhole. This result
contradicts the expectation that adding a pinhole does not change the skin

154
properties if the assumption that Cs represents the effective dielectric constant of
skin is correct.
Assuming Cs is related to Rt, Qs and αs as described by Eq. (4.16), then
the characteristic frequency of the skin is represented by Eq. (4.15), and the ratio
of the characteristic frequencies after to before pinhole (fc,t / fc,s) is expressed as:
c,t s s,before
c,s t s,after
f R C
f R C= (4.26)
in which Cs,before and Cs,after designate the effective capacitance before and after
pinhole. In fact, the differences listed in Table 4.7 for Cs before and after are
consistent with the observed change in characteristic frequency. If it is assumed
instead that Cs,before = Cs,after, then the predicted ratio of the characteristic
frequencies is given by the ratio of the resistances, which is about two-thirds the
observed ratio (and consistent with observed two-thirds ratio in Cs); see Table
4.9.
Recently, Hirschorn et al. (2010) proposed a different approach for
estimating the dielectric constant of a material with impedance behavior that is
consistent with an R-CPE circuit model (i.e., with the 1-time-constant and pinhole
models). Under the assumption that the dielectric constant is independent of
position, they demonstrate that the behavior of an R-CPE circuit is consistent
with a power-law decay of skin resistivity through the skin thickness. Based on
their results (cf. Eqs. 28 and 29 in Hirschorn et al., 2010), the following
alternative expression for the effective capacitance can be derived:
( )s ss s 11 1
s,alt s LC g Q Rα αα α −
= (4.27)

155
in which the resistivity of the inner most interface of the dominant resistive layer
(i.e.,the stratum corneum in the case of skin) is equal to RL A/L and the
parameter g is defined as
2.3751 2.88(1 )sg α= + − (4.28)
For αs between 0.8 and 0.7, which are typical values for skin, g is between 1.06
and 1.17. Since RL is a property of the stratum corneum, to satisfy the
assumption that skin properties including Cs,alt do not change after needle
puncture, both Qs and αs in the pinhole model must remain constant. Therefore,
according to Eq. (4.14), the ratio of the characteristic frequencies after-to-before
pinhole is predicted to be related to the after-to-before resistance ratio as:
s1
c,t s
c,s t
f R
f R
α
=
(4.29)
As shown in Table 4.9, Eq. (4.29) is consistent with the experimental
observations. This result supports the hypothesis that values of Cs estimated
using Eq. (4.5) and Eq. (4.16) may not accurately reflect the dielectric constant of
the skin when the skin resistance cannot be attributed solely to the dielectric
properties of the skin.
An additional observation is that the magnitude of the dielectric constant
calculated assuming Cs represents the capacitance of skin according to the
definition given in Eq. (4.30)
s
o
C L
Aε
ε= (4.30)

156
is physically unrealistic. In Eq. (4.30), ε is the dielectric constant, L is the stratum
corneum thickness, εo is the permittivity of vacuum (8.8542 x 10⁻⁵ nF/cm), and A
is the sample area.
Table 4.9 Comparing predictions and experimental values for the ratio of the characteristic frequencies after to before skin is punctured with a needle
Sample ID
Quantitya
I II III IV V VI VII All Samplesb
( )c,t c,sf f 27.2 4.9 8.9 6.7 19.5 15.4 6.6 12.8 ± 8.3
( )s tR R 14.3 3.9 5.9 4.7 11.5 9.1 4.7 7.69 ± 4.0
( ) ( )c,t c,s s tf f R R
0.52 0.79 0.65 0.70 0.59 0.59 0.70 0.65 ± 0.1
( ) s1
s tR R
α
26.1 5.2 9.0 6.4 18.2 14.5 6.4 12.26 ± 7.7
( ) ( ) s1
c,t c,s s tf f R Rα
0.96 1.07 1.00 0.97 0.94 0.94 0.97 0.98 ± 0.04
a For quantities that involve αs, the value used is the average of the value before and after a pinhole was made. Values before pinhole are designated with subscript s; after pinhole are designated with subscript t.
b Values are mean ± one standard deviation of the parameter values for all seven samples.
In this study, the average Cs / A calculated for all skin samples before treatment
with DMSO, PBS or pinhole (i.e., from Tables 4.1 and 4.7) was 20.2 ± 4.5 nF/cm2
(mean ± one standard deviation for 19 samples from two subjects) with a range
of 13.8 to 28.8 nF/cm2, respectively. These results generally agree with 18.6
nF/cm2 reported for heat separated skin in 50 mM buffered CaCl2 (Hirschorn et
al., 2010) and 39.8 nF/cm2 for 145 samples of split-thickness skin in PBS (White
et al., 2011). Assuming L is 15 µm, then the average dielectric constant of the
samples presented in this study is 341 (with standard deviation of 77). This
value for ε is high by a factor of 5 to 10 given the expected range between about

157
2 for several oils and about 76 for water at 32°C (Weast, 1968). According to Eq.
(4.27), Cs,alt would be a factor of 3 to 10-fold smaller than Cs calculated using Eq.
(4.5) if Rs / RL is between 100 and 10000 assuming αs is 0.8. If αs is 0.75, then
Cs,alt is 5 to 10-fold smaller than Cs for Rs / RL between 100 and 1000. Based on
low frequency impedance measurements determined as a function of increasing
amounts of skin removed by tape stripping, Rs / RL between 100 and 1000 and
perhaps 10000 may be reasonable (Yamamoto and Yamamoto, 1976).
The steady-state flux of CP before and after pinhole and the change in CP
flux after pinhole are listed in Table 4.10. Assuming all seven samples belong to
the same population, the CP flux after pinhole is not significantly different than
before pinhole. However samples I-IV (mean flux 113 ± 14 µg/cm2/h) are from a
different subject than samples V-VII (mean flux 55 ± 4 µg/cm2/h). Within each
subject group the mean CP flux after pinhole is significantly larger than the CP
flux before pinhole (student t-test, p<0.05). As an experimental control, one
sample was treated in the same way as the pinhole samples except no pinhole
was made (Table 4.10). The CP flux for the control sample did not change,
suggesting that the observed changes in flux were due only to the hole or to
changes in the skin incurred while making the hole. Despite this, the change in
CP flux was not correlated with either the hole resistance or diameter, perhaps
because the changes were too small relative to the experimental variability.
4.5 Conclusions
Skin impedance measurements are sensitive to irreversible damage
caused by exposure to the polar solvent DMSO or by puncture with a needle.

158
Table 4.10 Steady-state flux of 4-CP (µg/cm2/h) before and after pinhole
Sample IDa
All samplesb
Control I II III IV V VI VII Mean Std dev
Before 0.164 101.8 109.8 134.5 107.6 50.9 58.5 55.4 88.4 33.0
After 0.164 120.0 135.4 149.1 127.2 61.8 62.2 62.0 102.5 38.9 Change
b 0 18.2 25.6 14.5 19.6 10.9 3.7 6.5 14.1 7.7
a Samples I to IV are from subject Q; samples V to VII are from subject AS b
Values are the mean ± one standard deviation of the parameter values for all seven skin samples.
c Change is the value after treatment minus the value before treatment
Moreover, the impedance responses to the two treatments provide insights into
differences in the mechanism of damage for DMSO and needle puncture.
Impedance measurements after DMSO treatment for various times between 0.25
h and 1 h were consistent with a circuit model in which it was assumed that
DMSO progressively damaged a larger fraction of the skin thickness over time
and that the undamaged fraction retained the electric properties of the skin
before DMSO treatment. The skin appeared to be completely damaged after
DMSO treatment times greater than about 0.5 h. Despite changes in skin
impedance, treating skin with DMSO for either 0.25 or 1 h did not change the flux
of the moderately lipophilic molecule PCNB by a statistically significant amount.
This indicates that exposure to DMSO for 1 h or less did not alter significantly the
diffusion pathway for this lipophilic compound, but did affect the pathway of ions
and presumably other hydrophilic molecules. The change in the skin impedance
after DMSO treatment is likely due to changes in the R-CPE parameters of the
skin rather than the creation of low resistance shunt pathways.
The impedance of skin before and after puncture with a needle is
represented by an R-CPE circuit model that is characterized by a single

159
characteristic frequency. The characteristic frequency of the impedance scans
determined after needle puncture increased by an amount that could be
predicted using a theory, recently publish by Hirshorn et al. (2010), which
predicts that the CPE parameters of the skin (αs and Qs) should not change if the
dielectric constant and resistivity do not. After pinhole, flux of CP increased by a
small but significant amount that was not correlated with the hole resistance or
diameter estimated by assuming that the skin resistance was unchanged after
the pinhole.

160
REFERENCES
Agarwal, P., Crisalle, O., Orazem, M.E., Garcia-Rubio, L., 1995a. Application of measurement models to impedance spectroscopy, II. Determination of the stochastic contribution to the error structure. Journal of the Electrochemical Society 142, 4149-4158.
Agarwal, P., Orazem, M.E., Garcia-Rubio, L., 1995b. Application of measurement models to impedance spectroscopy, III. Evaluation of consistency with Kramers-kronig relations. Journal of the Electrochemical Society 142, 4159-4168.
Agarwal, P., Orazem, M.E., Garcia-Rubio, L.H., 1996. The influence of error structure on interpretation of impedance spectra. Electrochim. Acta 41, 1017-1022.
Agarwal, P., Orazem, M. E. & Garcia-Rubio, L. H., 1992. Measurement models for electrochemical impedance spectroscopy I. Demonstration of applicability. Journal of Electrochemical Society 139, 1917-1926.
Allenby, A.C., Fletcher, J., Schock, C., Tees, T.F.S., 1969. The effect of heat, pH and organic solvents on the electrical impedance and permeability of excised human skin. Br. J. Dermatol. 81, 31-39.
Bennett, S.L., Barry, B.W., 1985. Effectiveness of skin penetration enhancers propylene glycol, azone, decylmethylsulphoxide and oleic acid with model polar (mannitol) and nonpolar (hydrocortisone) penetrants. Journal of Pharmacy and Pharmacology 37, 84P.
Bunge, A.L., Cleek , R.L., Vecchia, B.E., 1995. A new method for estimating dermal absorption from chemical exposure. 3. Compared with steady-state methods for prediction and data analysis. Pharm. Res. 12, 972-982.
Carslaw, H.S., Jaeger, J.C., 1959. Conduction of Heat in Solids. Oxford University Press, Oxford, Great Britain.
Crank, J., 1975. The Mathematics of Diffusion, 2nd ed. Oxford Science Publication, Oxford.
Curdy, C., Kalia, Y.N., Falson-Rieg, F., Guy, R.H., 2000. Recovery of human skin impedance in vivo after iontophoresis: Effect of metal ions. AAPS PharmSci 2, article 23.
DeNuzzio, J.D., Berner, B., 1990. Electrochemical and iontophoretic studies of human skin. Journal of Controlled Release 11, 105-112.
Gavin, H., 2011. The Levenberg-Marquardt method for nonlinear least squares curve-fitting problems. Department of Civil and Environmental Engineering, Duke University, p. 15.
161
Hirschorn, B., Orazem, M.E., Tribollet, B., Vivier, V., Frateur, I., Musiani, M., 2010. Determination of effective capacitance and film thickness from constant-phase-element parameters. Electrochim. Acta 55, 6218-6227.
Hsu, C.H., Mansfeld, F., 2001. Technical note: Concerning the conversion of the constant phase element parameter Y0 into a capacitance. Corrosion 57, 747-748.
Jorcin, J.-B., Orazem, M.E., Pebere, N., Tribollet, B., 2006. CPE analysis by local electrochemical impedance spectroscopy. Electrochemica Acta 51, 1473-1479.
Kasting, G.B., Bowman, L.A., 1990. DC electrical properties of frozen, excised human skin. Pharm. Res. 7, 134-143.
Kim, H.S., Oh, S.Y. Effect of nonionic surfactants on the transdermal flux of ketoprofen, American Association of Pharmaceutical Scientists (AAPS) Annual Meeting, Indianapolis, IN, Oct. 29 - Nov. 2, 2000.
Kurihara-Bergstrom, T., Flynn, G.L., Higuchi, W.I., 1986. Physicochemical study of percutaneous absorption enhancement by dimethyl sulfoxide: kinetic and thermodynamic determinants of dimethyl sulfoxide mediated mass transfer of alkanols. J. Pharm. Sci. 75, 479-486.
Oh, S.Y., Leung, L., Bommannan, D., Guy, R.H., Potts, R.O., 1993. Effect of current, ionic strength and temperature on the electrical properties of skin. Journal of Controlled Release 27, 115-125.
Orazem, M.E., 2001. User Manual for the Measurement Model Toolbox for Impedance Spectroscopy. University of Florida, Gainesville, FL.
Orazem, M.E., Moustafid, T.E., Deslouis, C., Tribollet, B., 1996. The Error Structure of Impedance Spectra for Systems with a Large Ohmic Resistance with Respect to the Polarization Impedance. Journal of The Electrochemical Society 143, 3880-3890.
Orazem, M.E., Tribollet, B., 2008. Electrochemical Impedance Spectroscopy. Wiley-Interscience, Hoboken, NJ.
Peck, K.D., Ghanem, A.H., Higuchi, W.I., 1994. Hindered diffusion of polar molecules through and effective pore radii estimates of intact and ethanol treated human epidermal membrane. Pharm. Res. 11, 1306-1314.
Peck, K.D., Ghanem, A.H., Higuchi, W.I., 1995. The effect of temperature upon the permeation of polar and ionic solutes through human epidermal membrane. J. Pharm. Sci. 84, 975-982.
Pratt, K.W., Koch, W.F., Wu, Y.C., Berezansky, P.A., 2001. Molality-based primary standards of electrolytic conductivity - (IUPAC technical report). Pure and Applied Chemistry 73, 1783-1793.
Tang, H., Mitragotri, S., Blankschtein, D., Langer, R., 2001. Theoretical description of transdermal transport of hydrophilic permeants: Application to low-frequency sonophoresis. J. Pharm. Sci. 90, 545-568.

162
Weast, R.C., 1968. Handbook of Chemistry and Physics, 49th ed. CRC Press, Cleveland, OH.
White, E.A., Orazem, M.E., Bunge, A.L., 2011. A critical analysis of single-frequency LCR databridge impedance measurements of human skin. Toxicol. In Vitro.
Yamamoto, T., Yamamoto, Y., 1976. Electrical properties of the epidermal stratum corneum. Med. Biol. Eng. 14, 151-158.

163
APPENDIX
The concentration of a chemical (C) within an initially chemical free
membrane at time (t) soon after it is exposed to a chemical solution at constant
concentration is described by the following expression (Crank, 1975).
2
o
12
C x Lerf
C Dt L
= −
(A.1)
in which Co is the concentration of chemical in the membrane at the surface in
contact with the solution, x is the position in the membrane from the surface in
contact with the solution, L is the membrane thickness, and D is the diffusion
coefficient of the chemical in the membrane. The growth in the thickness of the
damaged layer (xd), defined as the position within the membrane where C is
equal to Cd, defined as the minimum value required to alter the measured
membrane properties, can be written by a rearrangement of Eq. (A.1) as:
( )2 1
d d o2 erf 1x L Dt L C C−= − (A.2)
It follows that the lag time for the growth in the damaged layer thickness (tlag,d)
can be expressed as
( )
2
lag,d 22
1 dd o
1
624 erf 1
Lt
D x LC C
t
−
= =
−
(A.3)
Given Cd/Co, estimates for tlag,d can be calculated by substituting the slope of a
plot of xd/L versus the square-root of time for (xd/L)/ t in Eq. (A.3).

164
CHAPTER 5
SUMMARY OF FINDINGS AND RECOMMENDATIONS FOR
FUTURE WORK
The objective of this work was to develop a quantitative foundation for
evaluating impedance measurements of skin and to relate the results of the
impedance analysis to the skin barrier to chemical transport. To that end,
equivalent circuit models of skin impedance were used to calculate the electrical
properties of intact and intentionally damaged skin. The parameters from the
equivalent circuit models of the impedance were compared with the flux of
tritiated water and two lipophilic compounds: 4-cyanophenol (CP) and
parachloronitrobenzene (PCNB). A summary of the major findings from this work
are described first followed by recommendations for future work.
5.1 Summary of Findings
In this work, numerous impedance spectra were collected from fully
hydrated skin samples that had not been intentionally damaged. These data
were analyzed, as described in the previous chapters, using an R-CPE
equivalent circuit model consisting of a resistor (Re) in series with a parallel
resistor (Rs) and constant phase element (CPE), which is characterized by two
parameters, Q and αs. An effective capacitance (Ceff) was calculated from these
parameters, using the following expression from Hsu and Mansfeld (2001)
( ) ( )( )s s s
1 1
eff s sC A Q A R Aα α α−
= (5.1)

165
As described in Chapter 4 (see discussion related to Eq. 4.5), this expression
was derived by equating the characteristic frequencies for the R-CPE model to
the R-C circuit model, in which the CPE is replaced by a capacitor with
capacitance Ceff.
Estimates of the effective capacitance calculated using Eq. (5.1) were
remarkably similar for all samples studied (see Chapters 2 and 4). For example,
estimates of Ceff for 145 samples from 6 different subjects presented in Chapter 2
had a log mean of 39.8 nF/cm2 with upper and lower bounds at 75.8 nF/cm2 and
20.2 nF/cm2, which correspond to the mean plus and minus one standard
deviation of logCeff. In the experiments described in Chapter 4, Ceff for all skin
samples before treatment with dimethyl sulfoxide (DMSO), phosphate buffered
saline (PBS) or needle puncture was 20.2 ± 4.5 nF/cm2 (mean ± one standard
deviation for 19 samples from two subjects) with a range of 13.8 to 28.8 nF/cm2.
The outermost layer of the skin, called the stratum corneum, is the primary
barrier to the transport of ions. It is a heterogeneous membrane consisting of
keratin-filled corneocytes surrounded by lamellar lipids, which are about 10 to
20% of the mass of dry stratum corneum (Raykar et al., 1988; Romonchuk and
Bunge, 2010). In fully hydrated stratum corneum, the corneocytes contain more
than their dry weight in water (Kasting and Barai, 2003). It is expected then that
the effective dielectric constant (εeff) should depend on the dielectric constants,
and the amounts and geometric configuration of the main components of the
stratum corneum, which are water and lipids. However, because the lipid fraction
of fully hydrated stratum corneum is less than 10%, changes in dielectric

166
constant arising from changes in the lipid composition or configuration may be
difficult to measure.
Values of εeff can be calculated from the definition of Ceff given in Eq. (5.2)
effeff
o
C L
Aε
ε= (5.2)
in which L is the stratum corneum thickness, εo is the permittivity of a vacuum
(8.8542 x 10⁻⁵ nF/cm), and A is the sample area. Consistent with a prior study
(Hirschorn et al., 2010b), estimates of εeff for a typical stratum corneum thickness
of 15 µm are an order of magnitude larger than expected (i.e., 674 and 342 for
Ceff equal to 39.8 and 20.2 nF/cm2, respectively) based on the range of about 2
to 80 for the dielectric constants of the lipids and water in the stratum corneum.
While the reason for this discrepancy remains unknown, Hirschorn et al. (2010a)
suggested that, contrary to the approach used to develop Eq. (5.1), the specific
geometry and composition of the system should be considered in order to obtain
accurate estimates of Ceff. Specifically, they showed that under the assumption
that the dielectric constant does not change with depth in the stratum corneum,
the R-CPE behavior for skin is consistent with a power-law decay of resistivity
with depth in the stratum corneum.
While the model developed by Hircshorn et al. (2010b) was based on
experimental observations, the actual spatial and chemical properties of the skin
that give rise to the R-CPE behavior have not been established. For example,
given the heterogeneity of the stratum corneum, it seems reasonable that the
electrical properties of the stratum corneum would vary over the skin area as well
167
as with the depth of the skin. This could be the subject of future modeling efforts
described in the Section 5.2.
The pinhole experiments in Chapter 4 provide a quantitative test for using
Eq. (5.1) to calculate the Ceff of skin. In the pinhole experiments, the skin
impedance spectrum was measured before and after the skin was punctured with
a needle and in both cases the frequency dependence was determined to be
consistent with an R-CPE circuit. Because the cross-sectional area of the needle
was small compared to the area of the skin sample, the amount of dielectric
material in the punctured skin was essentially unchanged. Despite this, Ceff
calculated by Eq. (5.1) of the punctured skin was about two thirds the value of
Ceff calculated for the skin before puncture. Thus, Ceff calculated using Eq. (5.1)
does not reflect the dielectric constant of the skin when a parallel shunt
resistance is added, although the impedance spectrum is still described by an R-
CPE circuit.
In Chapters 2 and 3 the single frequency impedance measurements made
with an LCR databridge instrument were analyzed. The LCR databridge is a
device that has been used to characterize the skin barrier, though there is
confusion in the literature about the interpretation of these measurements. In
making impedance measurements with the LCR databridge, the user selects
three settings: (1) the reported value, either resistance or capacitance; (2) the
measurement frequency, either 100 or 1000 Hz; and (3) the measurement mode,
either parallel (PAR) or series (SER). In Chapter 2, it was demonstrated that the
resistance and capacitance measured in parallel and series modes (i.e. RPAR,

168
RSER, CPAR and CSER) are representations of the complex impedance and
admittance and which are given in Table 5.1.
Table 5.1 Interpretation of the LCR databridge measurements in terms of the complex impedance (Z) and admittance (Y)
Settings Impedancea
RPAR
1
rY
RSER Zr
CPAR 2
jY
fπ
CSER j
1
2 f Zπ−
a The subscripts r and j designate the real and imaginary part; the symbol f designates the frequency at which the measurement was made in Hz.
From the relationships between the LCR databridge measurements and
the impedance shown in Table 5.1, the frequency dependence for RPAR, RSER,
CPAR and CSER measurements was derived in terms of the R-CPE model
parameters in Chapter 2. Also in Chapter 2, an analysis of a large data set of
impedance spectra from fully hydrated skin revealed that RPAR and CSER
measured at 100 Hz are more sensitive to changes in the DC skin resistance
than LCR databridge measurements made with other settings.
In Chapter 3, a large data set of paired measurements of tritiated water
permeability coefficient and RPAR measured with an LCR databridge at either 100
or 1000 Hz, from three different laboratories, was analyzed. Using the equation
for RPAR derived in Chapter 2 and assuming Ceff = 39.8 nF/cm2 and α = 0.8 for all
skin samples, the DC resistance was estimated from the RPAR measurements.

169
The estimated DC resistance, normalized by the area, was shown to be inversely
proportional to the tritiated water permeability coefficient. This linear relationship
has been demonstrated for molecules that transport through skin by primarily a
polar pathway (Peck et al., 1995). Thus, the observed linear relationship
between the area normalized DC skin resistance and the inverse of the tritiated
water permeability coefficient supports the hypothesis that water transports
through skin via the polar pathway, despite evidence supporting the lipid pathway
for water (Kasting et al., 2003; Peck et al., 1994, 1995; Potts and Guy, 1992)
In Chapter 4, the skin impedance, measured over a range of frequencies,
was shown to be sensitive to damage caused by chemical treatment with the
aprotic, polar solvent DMSO. In these experiments, the skin impedance and the
flux of PCNB, a model lipophilic compound, were measured simultaneously
before and after treatment with DMSO for various amounts of time up to 1 h. The
most significant result from these experiments was that DMSO appeared to
progressively damage a larger fraction of the skin over time. The impedance
spectrum of DMSO treated skin was consistent with a circuit model that
represents a damaged layer in series with an undamaged layer, where the
undamaged layer retains the electrical properties of the skin before DMSO
treatment. Also, the electrical properties of the DMSO damaged layer, while
different than for undamaged layer, did not appear to change with increased
DMSO treatment time, although the thickness of the damaged layer increased at
a rate that was proportional to the square root of the treatment time. When both
sides of the skin were treated with DMSO, the skin was completely damaged

170
after about 0.5 h. Interestingly, the flux of PCNB did not change after DMSO
treatment for up to 1 h. From the impedance and flux experiments combined, it
appears that DMSO treatment changed the pathway for ions through skin, as
indicated by the decreased skin resistance, but did not significantly alter the
lipophilic pathway, as indicated by the insignificant change in PCNB flux.
5.2 Recommendations for Future Work
In this section recommendations for future work are presented that follow
naturally from this work. First, additional experiments are recommended to
clarify the results of the pinhole experiments and to further explore the
mechanism by which skin is damaged by DMSO. Next, further investigations are
recommended of two observations made over the course of this work that were
not explored due to limited time. Finally, future modeling efforts are
recommended that would provide insight into the underlying processes affecting
the impedance response of skin.
In Chapter 4, results of the pinhole experiments are presented for seven
samples taken from two subjects. In these experiments, the flux of 4-
cyanophenol before the skin was punctured was about 2-fold larger for one
subject compared to the other. After the pinhole, the flux increased by an
amount proportional to the flux before the pinhole. If the skin remaining after the
pinhole was unchanged, which was supported by the control experiment, then
the change in flux after the pinhole should depend on the size of the hole, which
was independent of the flux before the pinhole. To resolve this discrepancy, it is
recommended that the pinhole experiment be repeated using many samples

171
from several subjects, to control for variations in skin permeability and
mechanical properties that might affect the pinhole size. Also, the skin thickness
should be measured at the site of the puncture, which will reduce uncertainty in
the pinhole area estimate from the skin resistance measurements.
In the study of DMSO treated skin described in Chapter 4, both sides of
the skin had contact with DMSO. The impedance results of these experiments
indicate that the skin was completely damaged after about 0.5 h treatment with
DMSO. Changes in impedance reflect change in the stratum corneum because it
is the skin layer that primarily limits ion transport. Since the stratum corneum lies
on top of two layers, the viable epidermis and dermis, which are much more
hydrophilic and less restrictive to diffusion, DMSO may not affect both sides of
the stratum corneum at the same rate. Therefore, it is recommended that the
study of DMSO treatment time described in Chapter 4 be repeated with only one
side of the skin in contact with DMSO. Differences in the rate of skin damage for
DSMO contact to the stratum corneum compared to contact with the dermis
would indicate whether one side of the stratum corneum is more susceptible to
DMSO damage than the other.
The first unexplored observation of this study was that skin impedance
increased in the presence of CP. Specifically, the impedance of skin equilibrated
in 0.01 M phosphate buffered saline (PBS, with 0.138 M NaCl, 0.0027 M KCl, pH
7.4) increased when PBS in the donor chamber was replaced with PBS that was
saturated with 4-cyanophenol (CP, MW = 119.1 Da, log Ko/w = 1.6). This change
in impedance was reversed when the donor chamber was again filled with only

172
PBS. In similar experiments with PCNB (MW = 157.56 Da, log Ko/w = 2.4)
saturated PBS, there was no measureable change in impedance from PBS
alone.
One possible explanation for this phenomenon is that CP, with a pKa of
7.97, dissociates in the PBS donor solution (pH = 7.4), while PCNB does not. If
the pH of the saturated CP solution is maintained at pH of 7.4, then
approximately 20% of the dissolved CP is ionized. It is possible, however, that
because of the large CP solubility (18.4 mg/mL from Romonchuk and Bunge
(2010) which corresponds to 0.15 M), the partially dissociated CP acid may have
overwhelmed the buffering capacity of the PBS. The CP ions would carry some
fraction of the charge through the skin. Because the mobility of the CP ions in
skin will be smaller than the mobility of the NaCl ions (which is the primary
electrolyte in PBS), the impedance of the skin in the presence of CP would
appear to increase compared to PBS solution alone.
Though the effect of CP was observed to be reversible, a controlled
experiment designed specifically to observe this phenomenon is recommended.
The recommended experiment would involve measuring impedance of skin after
it has been successively: (1) equilibrated in PBS, (2) equilibrated in CP-saturated
PBS, and (3) thoroughly rinsed to remove all CP and equilibrated in PBS again.
The control experiment would follow the same steps except that in step 2 the CP-
saturated PBS would be replaced with plain PBS. The effect would be
considered reversible if the impedance measured in steps 1 and 3 are the same
or the impedance changes between steps 1 and 3 in the same way as for the

173
control experiment. If the phenomenon is not reversible, then the effect is likely
related to changes in the skin rather than due to the solution chemistry.
If the effect of the CP saturated PBS on the skin impedance is reversible,
the next recommended experiments would examine whether the magnitude of
the increase in skin impedance is related to the concentration of ionized CP. In
these experiments, the concentration of ionized CP would be controlled by
adjusting the CP concentration in PBS solution keeping pH and ionic strength
constant by addition of NaOH and NaCl. First, a baseline would be established
by measuring the impedance of the skin equilibrated in the buffer solution without
CP. Next, the skin would be equilibrated in successively larger concentrations of
CP-buffer solution and the impedance measured. As long as the CP solutions
are maintained at the same pH, the concentration of CP ions is proportional to
the amount of CP dissolved in solution. If the impedance of the skin increases in
proportion to the concentration of CP ions in solution, then the effect is likely due
to the low mobility of the CP ions through the skin compared to the other ions in
solution.
Also recommended is a parallel study that follows the same procedure
except that the CP is dissolved in a pH 6 buffer solution, for which only 1% of the
dissolved CP is ionized. In these experiments increasing the CP concentration
would be expected to have a much smaller effect on the skin impedance.
The second unexplored observation from the work presented here is that
the skin impedance consistently deviated from the simple R-CPE circuit model at
frequencies below about 1 Hz, as shown most clearly in the plot of –Zj A in Figure

174
4.10. This low frequency dispersion was also noted by Hirschorn et al. (2010b)
for heat separated skin, which includes the stratum corneum and part of the
viable epidermis. The impedance over the entire frequency range was consistent
with the Kramers-Kronig relations; therefore, the low frequency dispersion is
most probably a real feature of the skin and not an experimental artifact. Since
this low frequency dispersion was observed for both split-thickness skin and
heat-separated skin, it could be caused by the viable epidermis, perhaps in
combination with the dermis. This could be confirmed experimentally by
measuring the impedance of isolated stratum corneum, which is prepared by
soaking the skin in trypsin, an enzyme solution that dissolves the viable
epidermis and any remaining dermis to leave only the stratum corneum (Liron et
al., 1994a; Liron et al., 1994b). Because isolated stratum corneum is very fragile,
the samples would need to be supported during impedance-diffusion
experiments.
Finally, additional mathematical modeling is recommended. In general, a
simple R-CPE circuit model describes the frequency dependence of skin
impedance under a variety of conditions, such as before and after the skin has
been treated with DMSO or punctured with a needle. It was shown in this
research that equations describing the R-CPE circuit model could be used to
relate single frequency impedance measurements to the DC skin resistance and
for quantifying changes caused by chemical or mechanical insults. However, it is
important to note that the R-CPE circuit model, and equivalent circuits in general,
are not based on specific physical and chemical properties that cause the

175
impedance response to vary with frequency. An alternative approach to
modeling the skin impedance is to develop a model based on the structures and
composition of the skin that control the mass transfer of ions. A number of
questions could be answered with such a model, especially if effects of hydration
could be represented. These include: (1) how is the impedance response related
to the dielectric constants of the individual components of the stratum corneum
(e.g., lipids and corneocytes) and how would this change with hydration? (2)
what would be the effect of ion binding to components of the stratum corneum?
(3) can the variation of skin hydration explain the hypothesized decrease of
resistivity with depth from the stratum corneum surface? and (4) Do the electrical
properties vary across the sample area? Answers to these questions would
inform further experimental efforts and help to establish how the individual
structures of the stratum corneum contribute to the electrical properties
represented by equivalent circuit models of the skin.

176
REFERENCES
Hirschorn, B., Orazem, M.E., Tribollet, B., Vivier, V., Frateur, I., Musiani, M., 2010a. Constant-Phase-Element Behavior Caused by Resistivity Distributions in Films II. Applications. Journal Of The Electrochemical Society 157, C458-C463.
Hirschorn, B., Orazem, M.E., Tribollet, B., Vivier, V., Frateur, I., Musiani, M., 2010b. Determination of effective capacitance and film thickness from constant-phase-element parameters. Electrochim. Acta 55, 6218-6227.
Hsu, C.H., Mansfeld, F., 2001. Technical note: Concerning the conversion of the constant phase element parameter Y0 into a capacitance. Corrosion 57, 747-748.
Kasting, G.B., Barai, N.D., 2003. Equilibrium water sorption in human stratum corneum. J. Pharm. Sci. 92, 1624-1631.
Kasting, G.B., Barai, N.D., Wang, T.-F., Nitsche, J.M., 2003. Mobility of water in human stratum corneum J. Pharm. Sci. 92, 2326-2340.
Liron, Z., Clewell, H.J., McDougal, J.N., 1994a. Kinetics Of Water-Vapor Sorption In Porcine Stratum-Corneum. J. Pharm. Sci. 83, 692-698.
Liron, Z., Wright, R.L., McDougal, J.N., 1994b. Water Diffusivity In Porcine Stratum-Corneum Measured By A Thermal Gravimetric Analysis Technique. J. Pharm. Sci. 83, 457-462.
Peck, K.D., Ghanem, A.H., Higuchi, W.I., 1994. Hindered diffusion of polar molecules through and effective pore radii estimates of intact and ethanol treated human epidermal membrane. Pharm. Res. 11, 1306-1314.
Peck, K.D., Ghanem, A.H., Higuchi, W.I., 1995. The effect of temperature upon the permeation of polar and ionic solutes through human epidermal membrane. J. Pharm. Sci. 84, 975-982.
Potts, R.O., Guy, R.H., 1992. Predicting skin permeability. Pharm. Res. 9, 663-669.
Raykar, P.V., Fung, M.C., Anderson, B.D., 1988. The role of protein and lipid domains in the uptake of solutes by human stratum corneum. Pharm. Res. 5, 140-150.
Romonchuk, W.J., Bunge, A.L., 2010. Mechanism of enhanced dermal permeation of 4-cyanophenol and methyl paraben from saturated aqueous solutions containing both solutes. Skin Pharamcology and Physiology 23, 152-163.

177
APPENDIX
PERMISSIONS TO USE COPYRIGHTED MATERIAL
Chapter 2 was published in the Elsevier journal Toxicology In Vitro.
Chapter 3 has been accepted for publication in the same journal. Authors who
publish in Elsevier journals retain the right “to include the article in full or in part in
a thesis or dissertation … with full acknowledgement of its original publication in
the journal.”

178
I am a co-author on the paper titled, “Single-Frequency Impedance
Measurements as Predictors of Human Skin Permeability to Water and Other
Hydrophilic Compounds Toxicology in Vitro,” which has been accepted for
publication in In Vitro Toxicology
I grant Eric A. White permission to publish this paper as a chapter in his
thesis for the degree Doctor of Philosophy at the Colorado School of Mines.

179
I am a co-author on the paper titled, “Single-Frequency Impedance
Measurements as Predictors of Human Skin Permeability to Water and Other
Hydrophilic Compounds Toxicology in Vitro,” which has been accepted for
publication in In Vitro Toxicology
I grant Eric A. White permission to publish this paper as a chapter in his
thesis for the degree Doctor of Philosophy at the Colorado School of Mines.

180
I am a co-author on the paper titled, “Single-Frequency Impedance
Measurements as Predictors of Human Skin Permeability to Water and Other
Hydrophilic Compounds Toxicology in Vitro,” which has been accepted for
publication in In Vitro Toxicology
I grant Eric A. White permission to publish this paper as a chapter in his
thesis for the degree Doctor of Philosophy at the Colorado School of Mines.