characterization of the dye- sensitized solar cell - worcester
TRANSCRIPT

Project Code: MQPBD4JPD1
1
Characterization of the Dye-Sensitized Solar Cell
A Major Qualifying Project Report
Submitted to the Faculty of
WORCESTER POLYTECHNIC INSTITUTE
In partial fulfillment of the requirements for the
Degree of Bachelor of Science in Chemistry
Written by:
Zijian Xia Chemistry
__________________________
Approved by:
Professor Drew Brodeur. Chemistry Major Advisor
Date: Dec. 2012
Project Code: MQPBD4JPD1
2
Table of Contents Characterization of the Dye-Sensitized Solar Cell .................................................................................. 1
Abstract ............................................................................................................................................... 3
Authorship and Acknowledgement ..................................................................................................... 4
CHAPTER 1. INTRODUCTION ....................................................................................................... 5
CHAPTER 2. Background and Literature Review ........................................................................... 10
2.1 Solar Energy ............................................................................................................................ 10
2.2 Solar Cells ............................................................................................................................... 12
2.3 Dye-Sensitized Solar Cell (DSSC) .......................................................................................... 16
2.4 Organic Dye in DSSC ............................................................................................................. 19
2.5 Dark Current ........................................................................................................................... 24
CHAPTER 3. METHODOLOGY .................................................................................................... 27
3.1 Assembling the Dye-Sensitized Solar Cell .............................................................................. 27
3.2 Preparing the Dye Solution ..................................................................................................... 28
3.3 Control Experiment I: Graphite Layer Thickness Dependence............................................... 31
3.4 Control Experiment II: TiO2 Layer Thickness Dependence .................................................... 31
3.5 Control Experiment III: Temperature Dependence ................................................................. 32
3.6 Dark Current Measurement ..................................................................................................... 33
CHAPTER 4. RESULTS AND DISCUSSION ................................................................................. 34
4.1 Regular Photo-voltage Production .......................................................................................... 34
4.2 Results of Graphite Layer Thickness Dependence .................................................................. 35
4.3 Results of TiO2 Layer Thickness Dependence ........................................................................ 36
4.4 Results of Temperature Dependence ....................................................................................... 39
4.5 Results of Dark Current .......................................................................................................... 42
CHAPTER 5. CONCLUSION AND RECOMMENDAION............................................................ 44
References ......................................................................................................................................... 46

Project Code: MQPBD4JPD1
3
Abstract
Dye-sensitized solar cells which combine the unique properties of both the
organic compound and inorganic compound have attracted the attention of scientists. This
project was designed to characterize several factors which could be potentially changing
the efficiency of the cells. An increase of output potential when the cell was heated over a
short period of time and when thicker TiO2 was applied were observed followed by the
decreasing in efficiency of over-coating and over-heating. The dark current after a long
illumination was also confirmed in this project. The evidence strongly supports the
electron trapping mechanism for generating the dark current.
Project Code: MQPBD4JPD1
4
Authorship and Acknowledgement
Regarding the Characterization of Dye-Sensitized Solar Cell, the goals of this
project could not be achieved without the help from the people whom we are very
grateful.
The primary and only person who carried out the all experiments and finished the
writing is Zijian Xia. And special thanks should be given to Professor Drew Brodeur,
who is the advisor of this project and whose supports and suggestions are the inspiration
and motivation for Zijian to accomplish those experiments. Also, the help in the early
stage from Nhi Vo and Ngoc Do, who were the previous students working in similar area,
clarified the topics of this project.
Project Code: MQPBD4JPD1
5
CHAPTER 1. INTRODUCTION
The growing of population in the world arouses the energy concerns in all kinds
of fields. According to the ExxonMobil report, the required energy in 2005 was about 210
million oil-equivalent barrels per day. This number increased to more than 300 million
oil-equivalent barrels per day nowadays, with an increasing rate of 42.8% compared to
the year of 2005. (ExxonMobil, 2007). It was estimated by the Energy information
Administration that in 2007 primary sources of energy consisted of petroleum 36.0%,
coal 27.4%, and natural gas 23.0%, amounting to an 86.4% share for fossil fuels in
primary energy consumption in the world. (U.S Energy information Administration,
2008). Not only should the non-renewable properties of fossil fuel be taken into account,
the amount of pollution of burning it should be considered as well. In one of the studies
from U.S Environmental Protection Agency, more than 90% of greenhouse gas emissions
come from the combustion of fossil fuels (U.S Environmental Protection Agency, 2009).
But, due to the high cost of renewable energy and technological limits, fossil fuels are
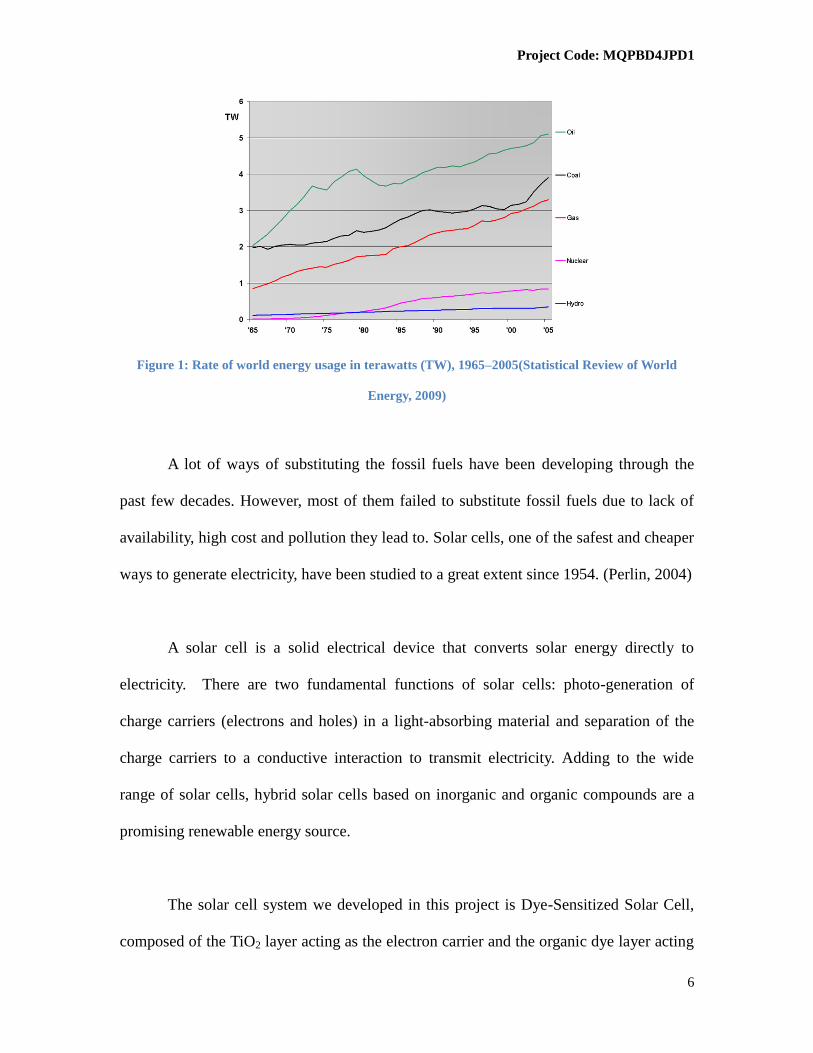
still the most popular energy resources as shown in Figure 1.
Project Code: MQPBD4JPD1
6
Figure 1: Rate of world energy usage in terawatts (TW), 1965–2005(Statistical Review of World
Energy, 2009)
A lot of ways of substituting the fossil fuels have been developing through the
past few decades. However, most of them failed to substitute fossil fuels due to lack of
availability, high cost and pollution they lead to. Solar cells, one of the safest and cheaper
ways to generate electricity, have been studied to a great extent since 1954. (Perlin, 2004)
A solar cell is a solid electrical device that converts solar energy directly to
electricity. There are two fundamental functions of solar cells: photo-generation of
charge carriers (electrons and holes) in a light-absorbing material and separation of the
charge carriers to a conductive interaction to transmit electricity. Adding to the wide
range of solar cells, hybrid solar cells based on inorganic and organic compounds are a
promising renewable energy source.
The solar cell system we developed in this project is Dye-Sensitized Solar Cell,
composed of the TiO2 layer acting as the electron carrier and the organic dye layer acting

Project Code: MQPBD4JPD1
7
as the electron generator, which will recover to its original state by electron donated by
the electrolyte solution. The efficiency of solar cells is one of the greatest limiting factors
for solar cells. In order to become an efficient solar cell, the photo sensitizer, which is the
organic dye layer mentioned above must have characteristics corresponding to the
spectrum of available light. Different photo sensitizers will have different absorption of
available light, thus a different efficiency and cost. Based on the efficiency and cost
information given, we chose the dye sensitized solar cell, which has good quantum
efficiency reported. (Grätzel, 2003) Figure 2 shows the efficiency of different materials.
Figure 2: Solar cell energy conversion efficiencies (National Renewable Energy Laboratory , 2011)
Much research has been devoted to identification and synthesis of photo
sensitized organic dyes matching the requirements. The attachment group of the dye

Project Code: MQPBD4JPD1
8
ensures that it spontaneously assembles as a molecular layer upon exposing the oxide
film to a dye solution. This molecular dispersion ensures a high probability that, once a
photon is absorbed, the excited state of the dye molecule will relax by electron injection
to the semiconductor conduction band. (Grätzel, 2003)
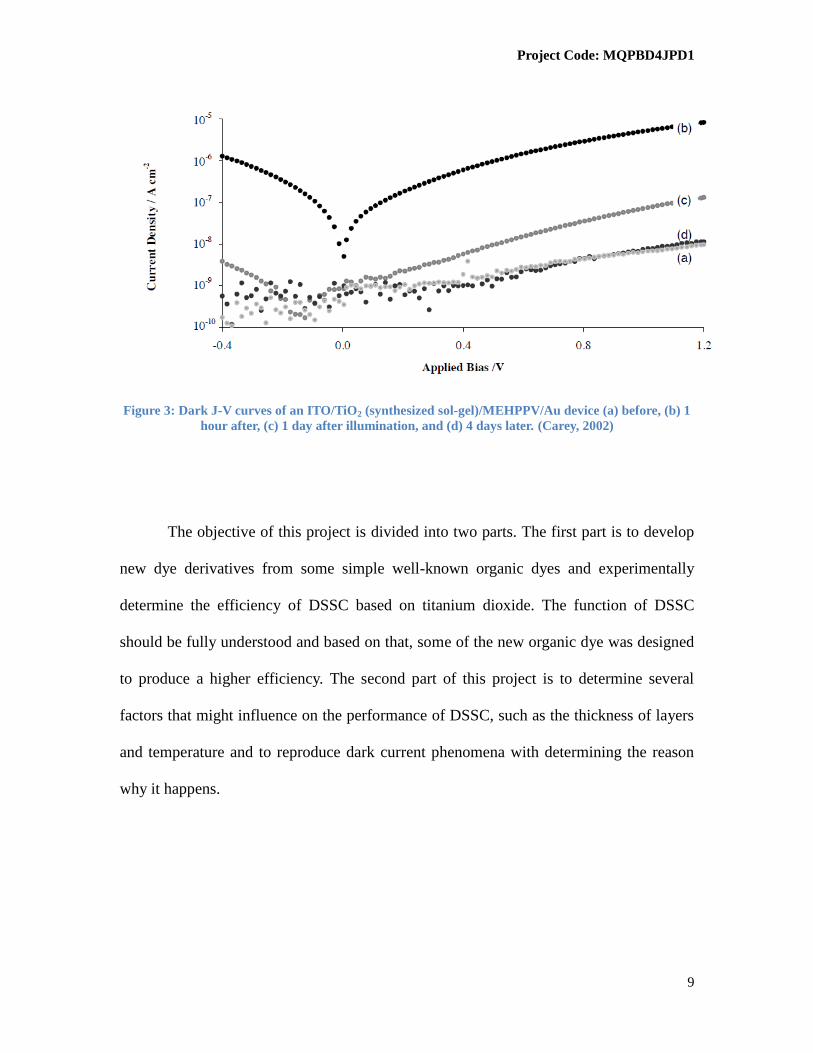
However, not much information has been obtained for the dark current, a recently
discovered phenomena which called our research group’s attention greatly. Defined as the
current produced without illumination, dark current is usually to be considered as the
blank current. However, recently a group of researchers in this area discovered a
thousand fold increase of dark current after a long period of illumination, shown in the
figure 3 below. (Corey, 2002) Although this group has published the paper 10 years ago,
not enough attention has been given to this phenomenon; thus, till now, there is not a
common acceptable explanation. The electron trapped in the TiO2 layer seems to be the
best explanation but this explanation still needs to be verified. (Gregg, 2003)
Project Code: MQPBD4JPD1
9
Figure 3: Dark J-V curves of an ITO/TiO2 (synthesized sol-gel)/MEHPPV/Au device (a) before, (b) 1
hour after, (c) 1 day after illumination, and (d) 4 days later. (Carey, 2002)
The objective of this project is divided into two parts. The first part is to develop
new dye derivatives from some simple well-known organic dyes and experimentally
determine the efficiency of DSSC based on titanium dioxide. The function of DSSC
should be fully understood and based on that, some of the new organic dye was designed
to produce a higher efficiency. The second part of this project is to determine several
factors that might influence on the performance of DSSC, such as the thickness of layers
and temperature and to reproduce dark current phenomena with determining the reason
why it happens.

Project Code: MQPBD4JPD1
10
CHAPTER 2. Background and Literature Review
This chapter will provide the all the background information and literature review
on the main topics discussed in the project, including solar energy, solar cells, dye-
sensitized solar cells and photo sensitized dye. The first section is an introduction to solar
energy and why we want to choose solar energy as the primary green energy resource.
The second and third sections are on the development and history of solar cell and DSSC
which we are interested in. The fourth section is on the function and modification of
organic dye in DSSC. The fifth section is on the central part of this project which is about
the dark current and the characterization of the DSSC.
2.1 Solar Energy
Except fossil fuels, there are still a lot of energy resources we could utilize in the
world, such as nuclear power, wind power and hydro energy. The reason why we choose
solar energy instead of other energy source we could use is because solar energy
possesses some advantage over the others.
Firstly, solar energy does not create greenhouse gases as it generates electricity
(Pentland, 2010). A greenhouse gas can absorb radiation in the infrared range which is the
fundamental cause of the greenhouse effect, the main reason leading to global warming
right now.

Project Code: MQPBD4JPD1
11
Secondly, solar energy is easily available all around the world. Unlike wind power
and hydro energy, solar energy spread out more evenly in the world, as shown in Figure 3;
thus, the geographical location of a country is not likely to prevent the countries from
taking advantage of solar energy. The world solar energy potential clearly indicates that
most part of the world could potentially utilize the solar energy as the primary energy
resources, especially for countries near the equator.
Figure 4: NASA Map of the World Solar Energy Potential (Pentland, 2010)
Thirdly, the solar energy is essentially inexhaustible because it is radiation from
the sun and there is a large quantity of solar radiation accepted on the earth every day.
The total solar energy absorbed by Earth's atmosphere, oceans and land masses is
approximately 3,850,000 exajoules (EJ) per year. (Smil, 2006) From data shown in Table
1, only 0.01% of the solar energy, if used, could provide enough energy for primary
energy use in 2005.

Project Code: MQPBD4JPD1
12
Table 1: Yearly Solar Flux and Human Energy Consumption.
Solar 3,850,000 EJ
Wind 2,250 EJ
Biomass 3,000 EJ
Primary Energy Use (2005) 487 EJ
Electricity (2005) 56.7 EJ
There are also more advantages of solar energy, such as minimum byproduct
compared to other energies, no disposal method necessary, less space required and
relative low cost and high efficiency. (Advantage of Solar Energy, 2011)
From the reason above, solar energy would be a prospective substitution of fossil
fuels due to the reason of wide availability, relative low cost and renewable properties.
2.2 Solar Cells
Solar cells are one type of photovoltaic cells which generate electrical power by
converting energy of light into direct current electricity by using semiconductors that
exhibit the photovoltaic effect. In the photovoltaic effect, electrons are transferred
between different bands (usually from the valence bands to conduction bands) within the
material, resulting in the buildup of voltage between two electrodes.(Brabec & et al, 2001)
In solar cell, the primary energy source is sunlight.

Project Code: MQPBD4JPD1
13
2.2.1 Theories
In order to understand the function of solar cells and to improve the performance
of it, theories behind solar cells should be studied and well understood.
The first step in solar cell function always involves photon absorption by a
semiconducting material. When the photon is absorbed, the energy of photon will be
transferred to valence electrons in crystal, which excite an electron to another band,
called the conduction band, in which, electrons can freely move. Figure 4 shows different
band gap in conducting materials.
Figure 5: Band Diagram of Solar Cell (Carlson, 1985)
Project Code: MQPBD4JPD1
14
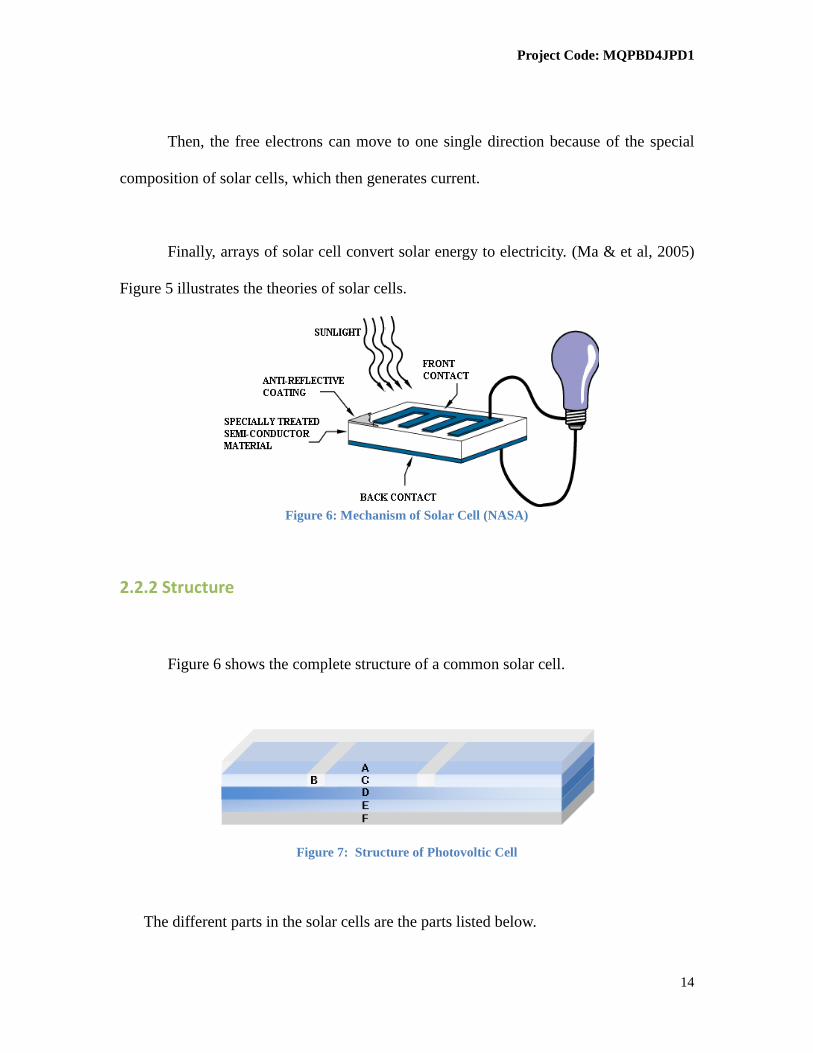
Then, the free electrons can move to one single direction because of the special
composition of solar cells, which then generates current.
Finally, arrays of solar cell convert solar energy to electricity. (Ma & et al, 2005)
Figure 5 illustrates the theories of solar cells.
Figure 6: Mechanism of Solar Cell (NASA)
2.2.2 Structure
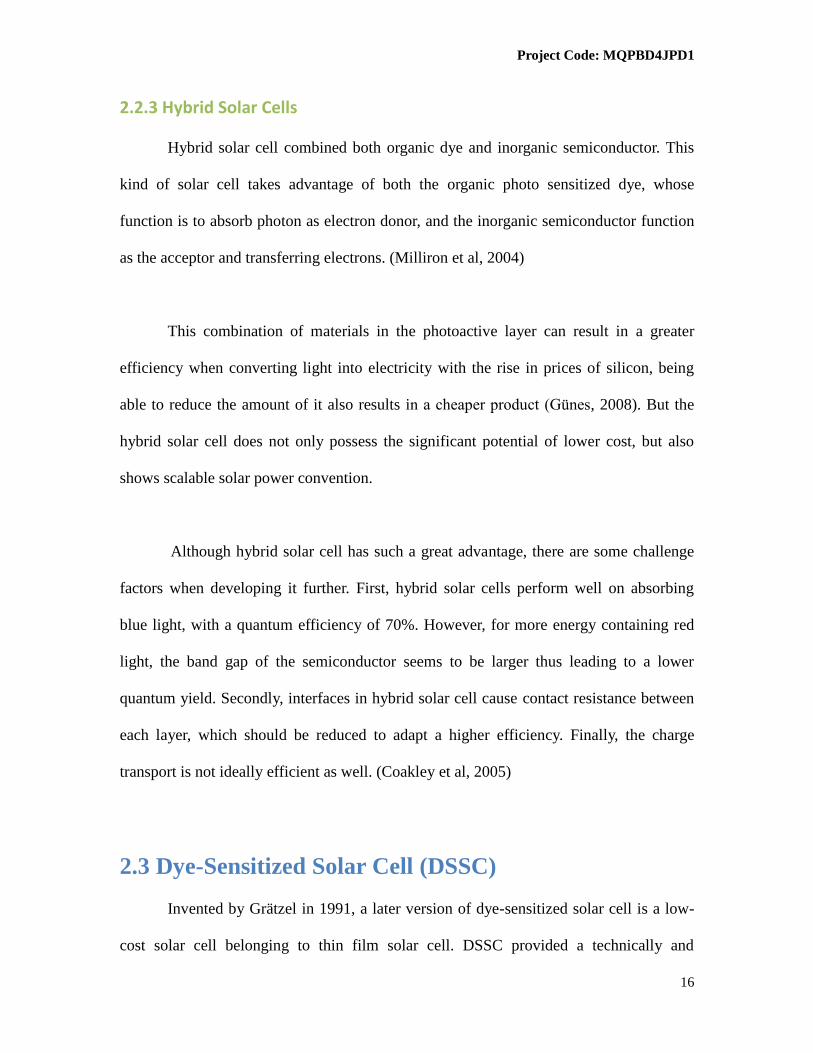
Figure 6 shows the complete structure of a common solar cell.
Figure 7: Structure of Photovoltic Cell
The different parts in the solar cells are the parts listed below.

Project Code: MQPBD4JPD1
15
A. Encapsulate – Encapsulate which is made of glass or other clear material such
clear plastic seals the cell from the external environment.
B. Contact Grid- The contact grid is made of a good conductor, such as a metal,
and it serves as a collector of electrons.
C. The Antireflective Coating (AR Coating) - Through a combination of a
favorable refractive index, and thickness, this layer serves to guide light into the
solar cell. Without this layer, much of the light would simply bounce off the
surface.
D. N-Type Silicon - N-type silicon is created by doping (contaminating) the Si
with compounds that contain one more valence electrons than Si does, such as
with either Phosphorus or Arsenic. Since only four electrons are required to bond
with the four adjacent silicon atoms, the fifth valence electron is available for
conduction.
E. P-Type Silicon- P-type silicon is created by doping with compounds containing
one less valence electrons than Si does, such as with Boron. When silicon (four
valence electrons) is doped with atoms that have one less valence electrons (three
valence electrons), only three electrons are available for bonding with four
adjacent silicon atoms, therefore an incomplete bond (hole) exists which can
attract an electron from a nearby atom. Filling one hole creates another hole in a
different Si atom. This movement of holes is available for conduction.
F. Back Contact - The back contact, made out of a metal, covers the entire back
surface of the solar cell and acts as a conductor. (Specmat, 2009)
Project Code: MQPBD4JPD1
16
2.2.3 Hybrid Solar Cells
Hybrid solar cell combined both organic dye and inorganic semiconductor. This
kind of solar cell takes advantage of both the organic photo sensitized dye, whose
function is to absorb photon as electron donor, and the inorganic semiconductor function
as the acceptor and transferring electrons. (Milliron et al, 2004)
This combination of materials in the photoactive layer can result in a greater
efficiency when converting light into electricity with the rise in prices of silicon, being
able to reduce the amount of it also results in h p p o n , 2008). But the
hybrid solar cell does not only possess the significant potential of lower cost, but also
shows scalable solar power convention.
Although hybrid solar cell has such a great advantage, there are some challenge
factors when developing it further. First, hybrid solar cells perform well on absorbing
blue light, with a quantum efficiency of 70%. However, for more energy containing red
light, the band gap of the semiconductor seems to be larger thus leading to a lower
quantum yield. Secondly, interfaces in hybrid solar cell cause contact resistance between
each layer, which should be reduced to adapt a higher efficiency. Finally, the charge
transport is not ideally efficient as well. (Coakley et al, 2005)
2.3 Dye-Sensitized Solar Cell (DSSC)
Invented by Grätzel in 1991, a later version of dye-sensitized solar cell is a low-
cost solar cell belonging to thin film solar cell. DSSC provided a technically and
Project Code: MQPBD4JPD1
17
economically credible alternative concept to present day p-n junction photovoltaic
devices. Unlike the conventional solar cell systems in which semiconductors function as
both photon absorber and charge carrier, DSSC separate these two functions to two
different materials. (Grätzel, 2003) As mentioned in last section, a light sensitized organic
dye functions as the photon absorber, leaving the charge carrier function to the
semiconductor.
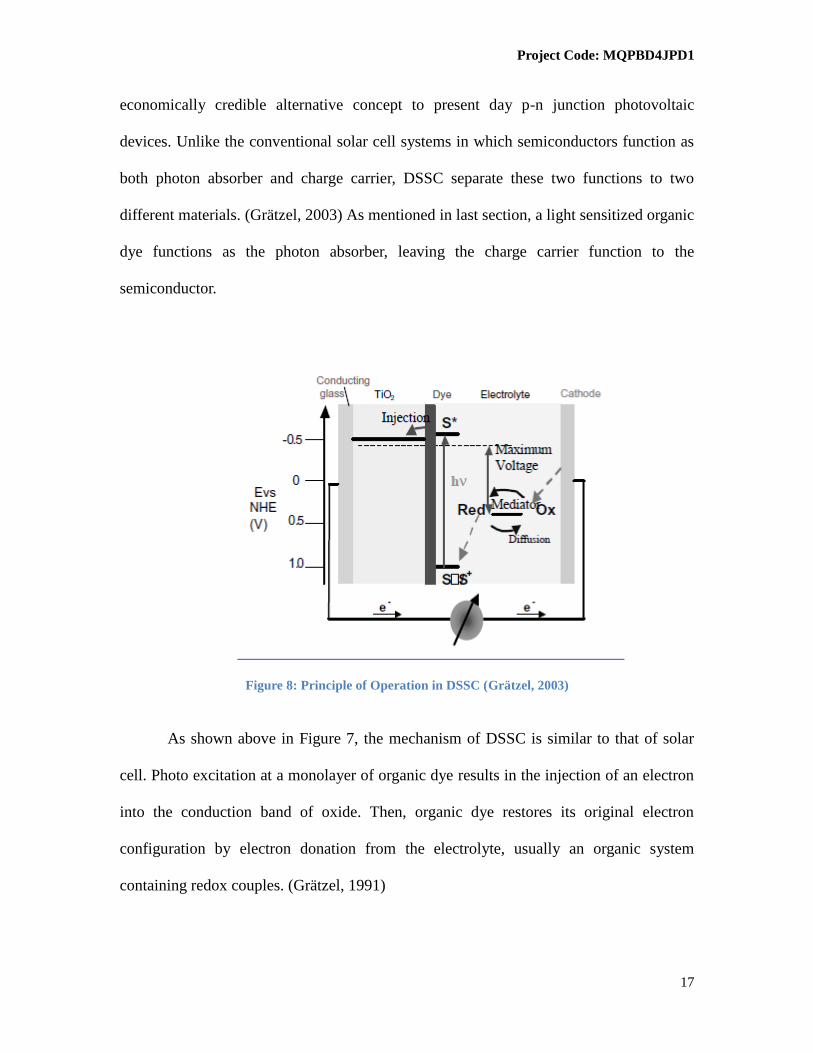
Figure 8: Principle of Operation in DSSC (Grätzel, 2003)
As shown above in Figure 7, the mechanism of DSSC is similar to that of solar
cell. Photo excitation at a monolayer of organic dye results in the injection of an electron
into the conduction band of oxide. Then, organic dye restores its original electron
configuration by electron donation from the electrolyte, usually an organic system
containing redox couples. (Grätzel, 1991)
Project Code: MQPBD4JPD1
18
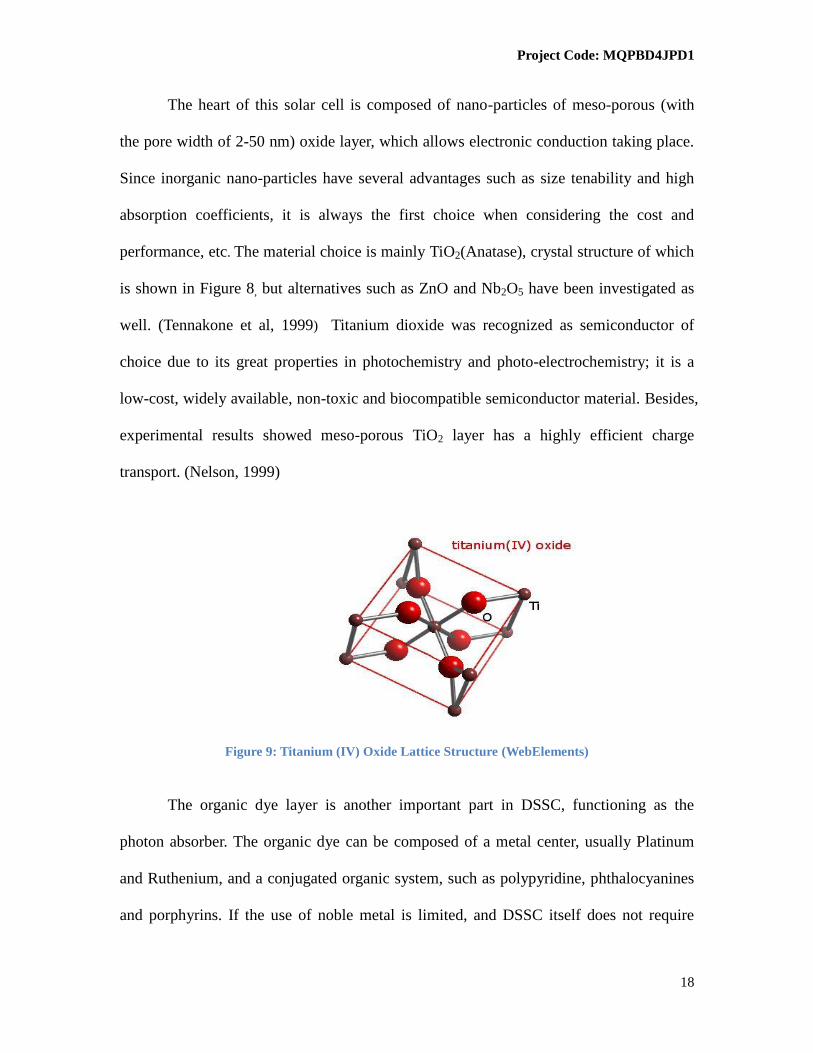
The heart of this solar cell is composed of nano-particles of meso-porous (with
the pore width of 2-50 nm) oxide layer, which allows electronic conduction taking place.
Since inorganic nano-particles have several advantages such as size tenability and high
absorption coefficients, it is always the first choice when considering the cost and
performance, etc. The material choice is mainly TiO2(Anatase), crystal structure of which
is shown in Figure 8, but alternatives such as ZnO and Nb2O5 have been investigated as
well. (Tennakone et al, 1999) Titanium dioxide was recognized as semiconductor of
choice due to its great properties in photochemistry and photo-electrochemistry; it is a
low-cost, widely available, non-toxic and biocompatible semiconductor material. Besides,
experimental results showed meso-porous TiO2 layer has a highly efficient charge
transport. (Nelson, 1999)
Figure 9: Titanium (IV) Oxide Lattice Structure (WebElements)
The organic dye layer is another important part in DSSC, functioning as the
photon absorber. The organic dye can be composed of a metal center, usually Platinum
and Ruthenium, and a conjugated organic system, such as polypyridine, phthalocyanines
and porphyrins. If the use of noble metal is limited, and DSSC itself does not require

Project Code: MQPBD4JPD1
19
elaborate apparatus to manufacture, DSSC is an attractive system we could use. Recently,
organic dye without the metal center is also reported but at a lower electron transfer
efficiency. (Hara et al, 2003)
Like mentioned above, DSSC does not require elaborate apparatus to manufacture.
Materials inside the DSSC are either low cost or could be synthesized easily from natural
products. Although its conversion efficiency is less than the best thin-film cells, in theory
its price/performance ratio (kWh/(m2·annum·dollar)) should be high enough to allow
them to compete with fossil fuel electrical generation by achieving grid parity. (Tributsch,
2004) So, in this project, we choose DSSC as our interested topic to study.
2.4 Organic Dye in DSSC
2.4.1 Porphyrins and Phthalocyanines
Organic dye, functioning as an electron donor via photon excitation, is the
essential part of dye-sensitized solar cells. Generally, sensitizers have the structure of
ML2X2, where L stands for 2,2_-bipyridyl-4,4_-dicarboxylic acid, M is osmium or
ruthenium, and X is halide, cyanide or thiocyanide. Figure 10 shows a commonly used
ruthenium complex in DSSC, called N3 complex, standard dye in DSSC at once. (Grätzel,
1991)

Project Code: MQPBD4JPD1
20
Figure 10: The structure of N3 Ruthenium Complex used as charge transfer sensitizer in
DSSC (Grätzel, 1991)
Considering the price and feasibility in our lab, porphyrins and phthalocyanines
attract particular attention. Porphyrins are the active center of chlorophyll, coordinated
with Mg2+
, with the function of absorbing the photons in photosynthesis. (Petit et al, 1992)
Comparing DSSC with biological photosynthesis, it is interesting how porphyrins will
work in the DSSC. Approximately, 25% of the artificial organic pigment and dye are
derivatives of phthalocyanines. (Löbbert, 2002) Phthalocyanines also show great activity
in photochemistry. (McKeown, 1998) However, both porphyrins and phthalocyanines
cannot compete with N3 dye because porphyrins lack red light and near IR absorption.
Phthalocyanines do show this absorption, but the problem of unsuitable LUMO energy
level, which is too low for electron transfer to TiO2 conduction band, seems to be
intractable so far. (Grätzel, 2003)
One strategy to solve this problem is to develop some new dyes for the DSSC.

Project Code: MQPBD4JPD1
21
Recently, a remarkable improvement on dye performance was made by Hara, using the
coumarine and polyene organic dye, with the high efficiency reaching up to 7.7% in full
sunlight. (Hara et al, 2003) Another strategy to broaden the absorption spectrum is
combining different kinds of organic dyes. Such a dye mixture has been applied to
mesoporous TiO2 films in the form of mixtures of porphyrins and phthalocyanines. The
result was similar to the addition of optical effects of the two sensitizers. (Fang et al,
1997)
The other strategy for this problem is to seek some natural products with the
ability to absorb the photons, such as the chlorophylls mentioned above. The commonly
used natural product is anthocyanins, which is rich in the tissue of plants. The particular
high content of the anthocyanins in raspberry and the accessibility of the fruit offer a
great source of the anthrocyanins, which has the absorbance range complimentary to that
of chlorophyll. (Cherepy, et al, 1997) In literature, the anthocyanins were also used in
dye-sensitized solar cells. (Grätzel, 2003)
For this project in our group, due to the limit of financial support and amount of
time and technique we have, besides the porphyrins and phthalocyanines, the other
options we have is the anthrocyanins in raspberry juice instead of expensive and high-
technique associated ruthenium complexes. The combination of different dyes also opens
a new method to increases efficiency of photon absorption without synthesizing new dyes.
Project Code: MQPBD4JPD1
22
2.4.2 Quantum Dot Dye and Its Problems
Semiconductor quantum dots are another option for panchromatic sensitizers.
These are semiconductor particles whose size is small enough to produce quantum
confinement effects. The absorption spectrum for such quantum dots can be adjusted by
changing the particle size. Thus, the band gap for designed material, such as InAs and
PbS, could be adapted to match the value of 1.35eV, ideal for single junction solar
quantum converter. (Grätzel, 2003)
One problem associated with this method is the photo-corrosion of the quantum
dots could almost certainly happen if the junction contact is a liquid redox electrolyte. On
the other hand, these semiconductor materials show strong resistance to solid photo-
corrosion.(Plass et al, 2002)
The advantage of using this kind of sensitizers is their high extinction coefficient
which allows the use of thinner film of mesoporous oxide, thus increasing the overall
efficiency of DSSC. (Grätzel, 2003)
2.4.3 New Organic Dyes
Recently, more and more research is conducted to decrease the price-efficiency
ratio in the new organic dye synthesis and application in DSSC. A research group led by
Hara in Japan recently achieved the highest efficiency using pure organic dye, structured
as below, as 6% of the photon conversion, with NKX-2311.(Hara, 2001) In addition, the
group also developed other efficient polyene dye photo-sensitizer for nano TiO2 DSSC
Project Code: MQPBD4JPD1
23
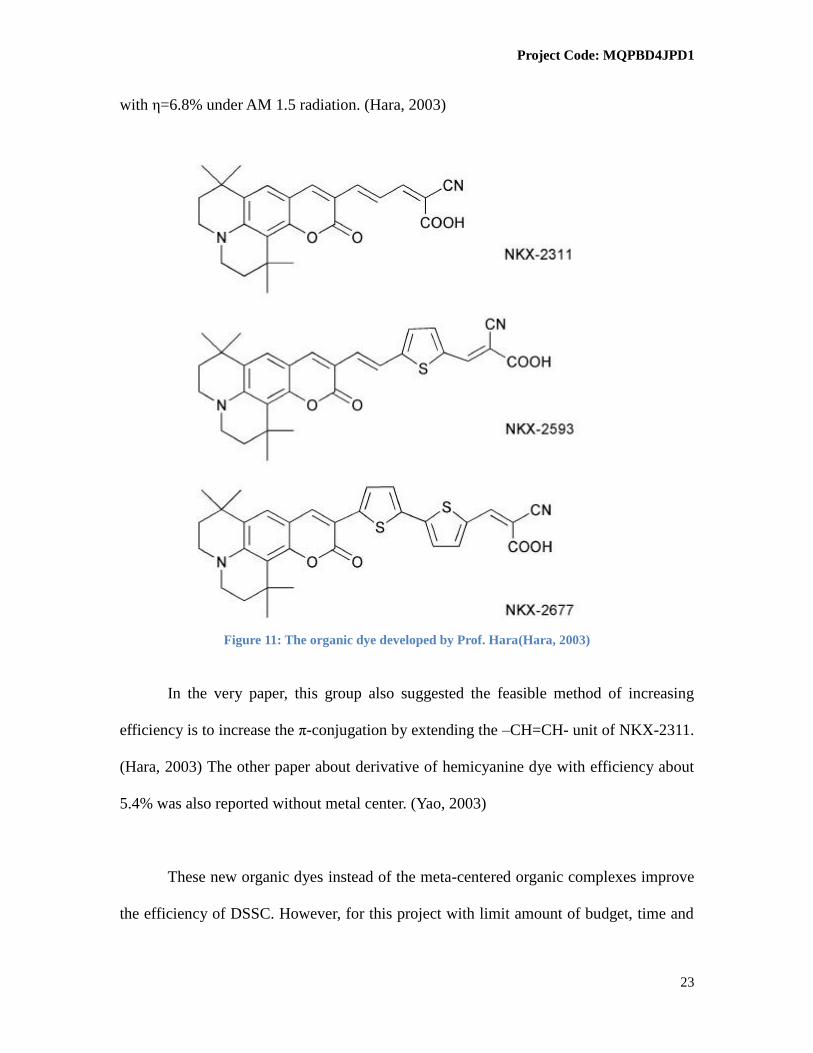
with η=6.8% under AM 1.5 radiation. (Hara, 2003)
Figure 11: The organic dye developed by Prof. Hara(Hara, 2003)
In the very paper, this group also suggested the feasible method of increasing
efficiency is to increase the π-conjugation by extending the –CH=CH- unit of NKX-2311.
(Hara, 2003) The other paper about derivative of hemicyanine dye with efficiency about
5.4% was also reported without metal center. (Yao, 2003)
These new organic dyes instead of the meta-centered organic complexes improve
the efficiency of DSSC. However, for this project with limit amount of budget, time and
Project Code: MQPBD4JPD1
24
technique to synthesize these dyes, we will only discuss in this chapter and if we do have
time, we probably will test this.
2.5 Dark Current
Dark current, defined in physics as the relatively small electric current flowing
out of a system in the b n of h pho on, ll h m’ n ion f g o p of
high school students practiced assembly of the solar cell. Physically, the dark current is
proposed to result from the random generated electrons and holes at the depletion region.
So, when calculating the photon-generated current, the researchers always need to be
concerned about the dark current and during the calculation, the current due to dark
current should be eliminated to produce accurate result.
However, recently, C y’ h g o p Oxfo Univ i y found out the
dark current increases after illumination, under the bias of ITO/TiO2/MEHPPV/Au
devices. Besides, the dark current increases several orders (~1000 times) greater than that
before the illumination. The paper also pointed out that under sufficient illumination and
vacuum (10-2
bar), the dark current turns to the original value in the scale of days. (Carey,
2004)

Project Code: MQPBD4JPD1
25
Figure 12: Dark J-V curves of an ITO/TiO2 (synthesized sol-gel)/MEHPPV/Au device (a) before, (b) 1
hour after, (c) 1 day after illumination, and (d) 4 days later. (Carey, 2002)
The author provided us several probable explanations and the group ruled out
most of them, including increasing of temperature under illumination and photo oxidation
of MEHPPV molecule. The paper reported the only possibility they left over was the
electron trapping in the TiO2, which is proposed by another group studied the same
device using TiO2, but they did not report any dark current results. (Gregg, 2003) Hence,
although it was suggested, there is still a lack of enough experimental data to determine
the reason why dark current increase by unusual amount.
Interestingly though, a group of high school students did the same experiment
with the similar device this summer with our group and surprisingly enough, they got the
similar results with that group who study the dark current in TiO2 for a while, which is
after several days, even under the 1 atm pressure, the cell made by students still shows
readings – although almost nothing, in the absence of the light. The random error was
ruled out by switching several different cells and different multi-meters. This interesting

Project Code: MQPBD4JPD1
26
result was reported and got noticed by the group. Unfortunately, the cells of the students
made were disposed after the result had been recorded. Thus, the report can not be
verified by the group.
Several other possible explanations which were listed below were proposed by the
group. And the group will test these possibilities and try to come out a reasonable
explanation for these phenomena. If time is allowed, the group should also try to
generalize for other solar cell devices.
The lag time before the photoelectric system reach its maximum photon-generated
voltage suggested that the electron might not get enough energy at first. Hence it
is possible after the illumination the energy residue can still excite the electron to
make the dark current increase.
The MEHPPV is a large conjugated molecule. Although from the group’s
suggestion, the photon-oxidation was ruled out. However, the longer MEHPPV,
the easier to excite an electron with lower energy and harder for the free-moving
electrons to get to the end of the chain. Hence, this assumption can be proved or
ruled out by using different molecular weight of MEHPPV or other dye molecules.
Project Code: MQPBD4JPD1
27
CHAPTER 3. METHODOLOGY
Based on the scientific references found in earlier literature chapter, the prototype
of “hyb i dye sensitized ol ll b on TiO2/g phi ” was constructed. In this
chapter, details of procedures to conduct the experiments will be presented. The
preparation of dyes will also be provided in this section. The different techniques will be
demonstrated and discussed in this section as well.
3.1 Assembling the Dye-Sensitized Solar Cell
1. Determine the conductive side of glass in the model kit by touching both of
protruding leads of the multi-meter with one side of the glass. The conductive
side could be identified with average resistance from 20-38 ohms.
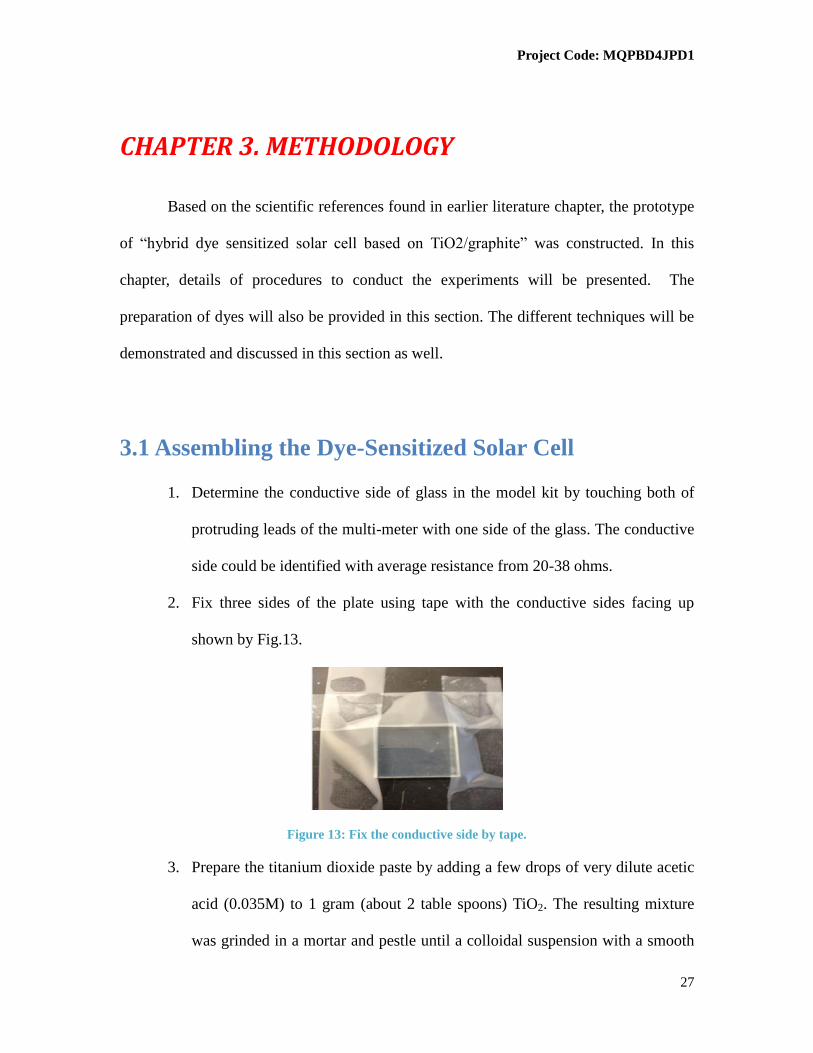
2. Fix three sides of the plate using tape with the conductive sides facing up
shown by Fig.13.
Figure 13: Fix the conductive side by tape.
3. Prepare the titanium dioxide paste by adding a few drops of very dilute acetic
acid (0.035M) to 1 gram (about 2 table spoons) TiO2. The resulting mixture
was grinded in a mortar and pestle until a colloidal suspension with a smooth

Project Code: MQPBD4JPD1
28
consistency (like cake icing) was observed. (Grazel, 2005).
4. Add 2-3 drops of the TiO2 suspension onto the conductive side and spread out
the TiO2 evenly on the surface of the plate with glass rod. Carefully remove
the tape without perturbing the TiO2 layer.
5. Dry the glass with TiO2 under room temperature over 4 hours and then heat to
420 o
C for another 20 min, until the dried TiO2 turns brown and then white
again.
6. While heating, light the candle and coat the conductive side of the other piece
of glass with graphite over 45 sec.
7. Cool both plates to room temperature.
8. Submerge the plate with TiO2 face-down in the dye solution and take out
quickly but carefully without cracking the TiO2.
9. Wash the dye layer with ethanol carefully.
10. Clamp both the plates together and apply 2 drops of KI/I2 electrolyte solution
onto the interface between the two plates.
11. Allow the electrolyte to cover the surface of TiO2 by capillary action.
12. Measure the photo-voltage under the UV and fluorescent light after forming a
circuit using a multimeter.
3.2 Preparing the Dye Solution
3.2.1 Synthesis of Copper Phthalocyanines
Copper Phthalocyanines was the first dye molecule we chose to synthesize
because the easy accessibility of starting material and the simple experiment procedure.

Project Code: MQPBD4JPD1
29
There are two commonly used protocols for synthesizing copper phthalocyanines,
microwave irradiation and direct heating. Although the most commonly used one is the
microwave irradiation with high yield and easier isolation and workup method (Shaabani,
1998), our group decided to use the direct heating method because of the difficulty of
instrumental handling.
Figure 14: synthesis scheme of copper phthalocyanines (Moser and Thomas, 1963)
Reaction apparatus was a test tube (18*125mm) set up in the 320 degree of
centigrade oil bath. The temperature was carefully controlled.
In the test tube, 1.84 g (30.7 mmol) of urea, 0.89 g (6.0 mmol) of phthalic
anhydride and 167 mg (1.67 mmol) of copper (I) chloride was charged. The mixture was
well swirled with a glass rod over 5 min to obtain a thoroughly mixture. Next, 25 mg
(0.02 mmol) of ammonium heptamolybdate was charged to the test tube followed by
another mixing over 3 min. Then, the test tube was heated by the oil bath over 5 min. The
melting of the entire solid was first observed. When the color turned to greenish blue, the

Project Code: MQPBD4JPD1
30
heating apparatus was removed and the mixture was allowed to cool to room temperature.
The work up procedure was composed of two steps. At the first stage, 2.5 mL of
conc. HCl was added to the crude product with 20 mL of water. The mixture was swirled
over 10 min to get rid of the un-reacted starting material. After filtration, the filtrate was
discarded. Then, the solid on the filter was washed with 20 mL of ethanol. Solid was then
removed from the filter paper and allowed to dry under air. (Yield: 0.381 g, 44.1%)
3.2.2 Preparation of the Raspberry Dye Solution
Raspberry juice, rich in anthocyanine, is a great source of dye in our dye-
sensitized solar cell. (Wu, 2004) Smestad developed the nano-TiO2/raspberry DSSC in
1998. (Smestad, 1998) This kind of DSSC provides very stable photo-voltage. Due to the
easy accessibility and stable outcome, the raspberry was among the best choices of the
dyes.
Preparation of the raspberry solution requires some skill of filtration. 4-5 pieces of
frozen raspberry were grinded in a mortar until a crude mixture was observed, usually
about 4-5 min. The crude mixture was then transferred slowly to a pre-assembled
filtration apparatus. If the resulting mixture is very thick, i.e., no filtrate, several drops of
water or acetone was used to wash the mixture and add the total liquid amount. A spatula
or a glass rod can be used to swirl the mixture to give off more solution.
The resulting solution, although might not be chemically pure, is rich of
anthocyanine; thus, it could be used in DSSC.

Project Code: MQPBD4JPD1
31
3.3 Control Experiment I: Graphite Layer Thickness
Dependence
Provided in protocol and other literatures (Grazel, 2005, etc), coating graphite
onto the conductive side is one of crucial steps for making the DSSC. However, few
literatures went into details in the potential influence of graphite layer on the efficiency of
the solar cell. So, our group decided to test the dependence of the thickness of graphite
layer with the performance of the cell.
The experiment was conducted using control experiment. First solar cell was
designed to be a blank experiment, i.e, no graphite layer on the conductive side. Although
it might not provide any useful information now, since it has been already known that the
graphite layer is necessary for cell functioning properly, it is important to have a
complete comparison with this blank control group.
Then, the graphite layer was controlled by manipulating the time over the candle
flame. In order to ensure the minimum random error, the candle used was the same with
minimum perturbation. Difference in thickness of graphite can be tracked by the color of
o ing. Th l f om h ing ov 45 n 90 w omp ov 4 y ’
time scale.
3.4 Control Experiment II: TiO2 Layer Thickness
Dependence

Project Code: MQPBD4JPD1
32
TiO2 layer is the carrier of electron after it is excited by the organic dye. As the
thickness of graphite was recognized, it is necessary to recognize the semiconductor layer
thickness dependency.
This experiment is relatively easier to control than others, because the thickness
of TiO2 in this project was controlled by the tape thickness. Thus, by layering several
pieces of tape on one side and then following the same rolling procedure as used for a
normal cell, we can control the thickness of TiO2 in this simple way. However, it was only
possible to measure several distinctive data point, i.e the integer times of thickness of the
tape, because it is impossible to tape any decimal layer of tapes on the glass. Besides, the
result was not that accurate, but the error was carefully controlled. All of the
measurements were taken at the same temperature, amount of illumination and pressure.
3.5 Control Experiment III: Temperature Dependence
Temperature dependence of the performance of DSSC was proposed in the paper
by the group which tested the dark current. (Carey, 2002) This group disproved this factor
because the increase in temperature was found to have tiny influence on the system
compared to the relative huge increase in dark current they got experimentally. Without
doubt, our group trusts their published result but reproduction was considered necessary
to verify this result.
This control experiment was conducted by the way shown below. For each dye we

Project Code: MQPBD4JPD1
33
used in the cell, we tested at 40-50, 60-70, 80-90 degree of centigrade over 6 min. The
data were recorded every 45 sec. In order to prevent the cell from overheating, the cells
were put onto the heating plate before temperature was increased.
The plot was drawn with the t=0 when the hot plate was turned on. The trend for
different dyes was collected and analyzed.
3.6 Dark Current Measurement
In order to get stable and reliable result, the tested cells were only those cells
which were able to produce stable and large enough voltage.
The test was conducted under 298 K, 1 atm pressure. The tested cells were first
illuminated by the fluorescent light over 12 hours. The reading of multi-meter was
recorded as t=0. Then, the tested cells were kept in a dark cabinet with the protruding
leads of multi-meter attached. The reading was recorded over 4 days, simulating the same
data recording over four days in Carey’s group.

Project Code: MQPBD4JPD1
34
CHAPTER 4. RESULTS AND DISCUSSION
In this section, results from each experiment mentioned in the methodology
chapter are presented and analyzed. Explanations are proposed for each result. If not
mentioned specifically, all of the results were measured under 298K, 1 atm pressure with
the illumination of fluorescent light. Unless specified, all of the measurements in tables
have units of Volts.
4.1 Regular Photo-voltage Production
Results of first several testing cells were shown in the result table below. Two
different dye solutions were applied to the solar cells.
Table 2: Results of regular photo-voltage production (organic dye: phthalocyanines)
Cell No. Electrolyte Dye V1(20
min)
V2(12h) V3(48h) V4(4d)
1 KI/I2 Phthalocyanines 0.209 0.269 0.459 0.121
2 KI/I2 Phthalocyanines 0.090 0.120 0.101 0.062
3 KI/I2 Phthalocyanines 0.216 0.146 0.133 0.086
4 KI/I2 Phthalocyanines 0.080 0.061 0.002 0.002
Note: The cell 1 and 2 were coated with graphite by burning on the Bunsen
burner. The cell 3 and 4 were coated with graphite by burning on the candle. After
measurement, the cells were stored without illumination.
Table 3: Results of regular photo-voltage production (organic dye: raspberry juice)
Cell No. Electrolyte Dye V1(20
min)
V2(12h) V3(4d)
1 KI/I2 Raspberry 0.158 0.143 0.243
2 KI/I2 Raspberry 0.121 0.138 0.078
3 KI/I2 Raspberry 0.143 0.167 0.000
Note: The KI/I2 solution was reapplied to the 3rd cell but still no current was
produced.
The possibility of regeneration of photo-voltage with reapplication of electrolyte
solution was confirmed by the data shown below.

Project Code: MQPBD4JPD1
35
Table 4: Result of reapplication of electrolyte
Cell
No.
Electrolyte Dye V1(20
min)
V2(12h) V3(48h) V4(4d) V5(2
weeks)
1 KI/I2 Phthalocyanines 0.209 0.229 0.459 0.121 0.227
2 KI/I2 Phthalocyanines 0.090 0.120 0.101 0.062 0.118
Note: These two cells were the same with the cell 1 and 2 in table 2. The
reapplication of electrolyte occurred 20 min before the measurement had been taken.
Both of the cells were able to regenerate almost 100% of its capability (compare
to V2, measured after 12h) to produce the photo-voltage after the reapplication of
electrolyte. This fact infers the recycling of DSSC was possible and reproduction of the
current was very feasible.
4.2 Results of Graphite Layer Thickness Dependence
Cell 1, with no graphite coating, served as the control group. Cell 2 and 3, with
different graphite thickness, served as the experimental group.
Table 5: Results of graphite thickness dependence
Cell No. Electrolyte Dye V1(20 min) V2(12h) V3(48h) V4(4d)
1 KI/I2 Raspberry 0.003 0.000 0.002 0.001
2 KI/I2 Raspberry 0.108 0.273 0.266 0.285
3 KI/I2 Raspberry 0.111 0.245 0.213 0.260
Note: Cell 2 was heated by the candle over 45 sec. Cell 3 was heated by the same
candle over 2 min. The TiO2 layer was carefully controlled to be approximately the same
thickness throughout the cell itself and among the 3 cells. The reapplication of electrolyte
solution occurred before the V4 had been measured.
Although the graphite dependence could not be fully determined by this
experiment itself, two conclusions can be made from this table. The graphite layer was
definitely necessary for dye-sensitized solar cell; o h wi i won’ p o ny pho o-
voltage, inferred by the cell 1. However, if the graphite thickness is enough, over-coating
resulting from heating over a longer period of time will not produce conspicuous

Project Code: MQPBD4JPD1
36
increasing voltage for the cell.
If the graphite thickness could be controlled more carefully, a plot of graphite
thickness versus the voltage production can be made. However, the data showed that it is
unlikely that any further increase in graphite thickness will improve the efficiency. More
conclusive result can be made, i.e. what is the minimum amount of graphite necessary for
the solar cell function.
4.3 Results of TiO2 Layer Thickness Dependence
All of the experiments were conducted under 1 atm and 25 °C. The graphite
coating time was about 35-40 sec. Dye solution applied to the cells was saturated
phthalocyanines solution in acetone. Electrolyte solution used was 2% KI/I2 aqueous
solution. The results were listed in the table below.
Table 6: results of TiO2 layer thickness dependency
Thickness(in mm) V1(20 min) V2(12 h) V3(48 h)
0.03 0.194 0.267 0.262
0.09 0.262 0.306 0.296
0.15 0.308 0.332 0.340
0.18 0.321 0.357 0.356
0.21 0.317 0.352 0.343
0.24 0.319 0.327 0.330
0.27 0.303 0.307 0.311

Project Code: MQPBD4JPD1
37
The data showed the optimum thickness of TiO2 was about 5-6 layer of the tape,
which was about 0.15 - 0.18 mm of TiO2. The increasing trend when the TiO2 layer was
thin could be explained in two ways. First, TiO2 serves as the electron carrier in the dye-
sensitized solar cells. It is possible that carriers in our solar cell were not enough when
thickness was too low. Once more TiO2 was applied to the cell; the increasing carrier
increased the efficiency to carry the electrons resulting in the increase of output. The
second rationale was explained by the mini-pores in the TiO2 which served as an
important component for the electron carrying. The possible increase of the number of
mini-pores as increasing the thickness of TiO2 at relatively low thickness improved the
electron carrying ability of this semiconductor.
Explanation of decreasing in output and stable result from relatively large
thickness could also proposed by our group. Because the semiconductor and graphite
were on the different electrode, and the dye solution was in between both of the
electrodes, the photon, in order to excite the electron from the dye molecule, must pass
through the TiO2 layer which received the photons first. Too much TiO2 will obviously
absorb or block the photon to make the way to dye molecules. Based on this data, the
prediction could be made that if the thickness of the TiO2 layer becomes infinity, if it is
achievable, the output of the solar cell will approach 0 because the thickness of TiO2
prevents photon from reaching the dye molecules.
Experiment stopped after 0.27 mm as a result from difficulty of achieving
thickness more than that. Based on the data we obtained and the explanation we proposed,
Project Code: MQPBD4JPD1
38
no further experiment is necessary because it is still not probable that the further increase
of thickness will improve the efficiency of solar cell and it is also obvious that the output
of the infinite thickness of TiO2 will be 0 which also supports the previous prediction.
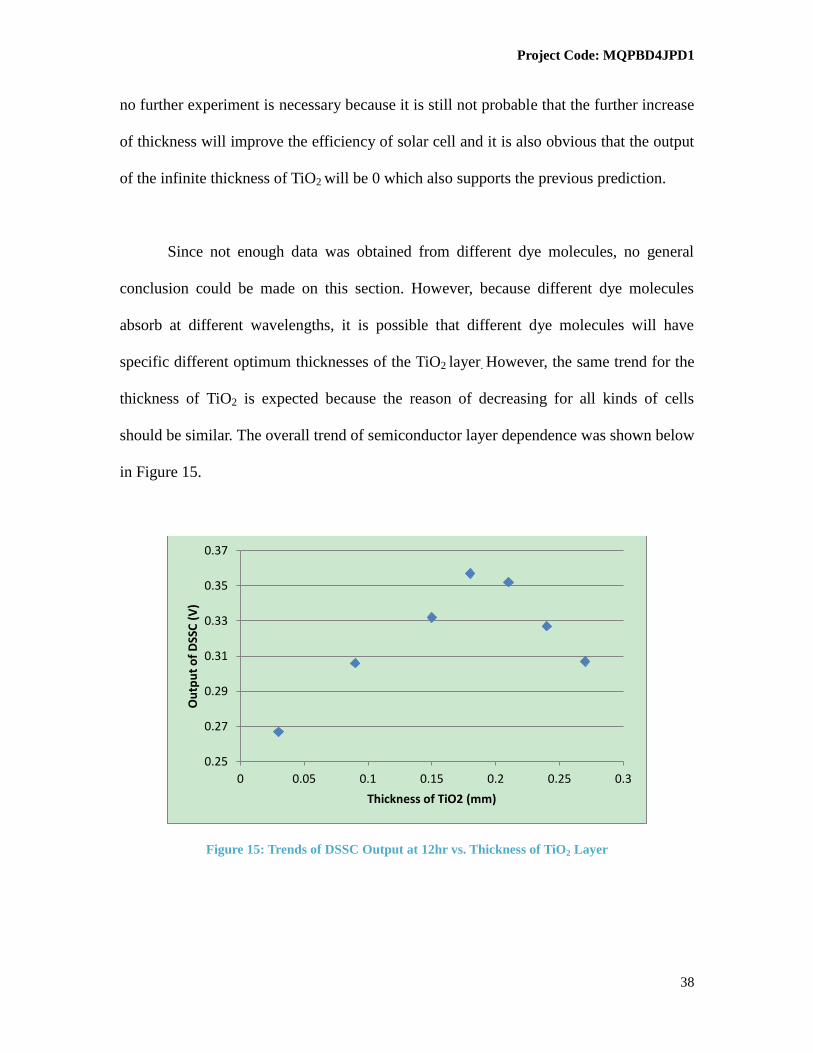
Since not enough data was obtained from different dye molecules, no general
conclusion could be made on this section. However, because different dye molecules
absorb at different wavelengths, it is possible that different dye molecules will have
specific different optimum thicknesses of the TiO2 layer. However, the same trend for the
thickness of TiO2 is expected because the reason of decreasing for all kinds of cells
should be similar. The overall trend of semiconductor layer dependence was shown below
in Figure 15.
Figure 15: Trends of DSSC Output at 12hr vs. Thickness of TiO2 Layer
0.25
0.27
0.29
0.31
0.33
0.35
0.37
0 0.05 0.1 0.15 0.2 0.25 0.3
Ou
tpu
t o
f D
SSC
(V
)
Thickness of TiO2 (mm)

Project Code: MQPBD4JPD1
39
4.4 Results of Temperature Dependence
Table 7: Results of Temperature Dependence
Time(s) V(mV) 40-50 °C V(mV) 60-70 °C V(mV) 80-90 °C
Phthalo-
cyanines
Raspberry Phthalo-
cyanines
Raspberry Phthalo-
cyanines
Raspberry
0 312 458 297 367 216 142
45 314 462 301 372 218 147
90 315 465 303 374 223 160
135 314 466 304 373 209 171
180 310 465 300 369 192 153
225 307 465 297 361 167 131
270 301 460 292 353 154 117
315 298 451 286 344 150 105
360 293 443 279 330 149 101
In the table 7 listed above, when the temperature of the systems varied from 40 °C
to 90 °C, the output of the system changed dramatically, however with a trend of
increasing in a short amount of time and then decreasing at an almost constant rate.
For cells which incorporated raspberry extractions as the organic dye solution, a
sharp increase of output was usually observed in the first several data points, which was
considered as the increase of temperature facilitating electron excitation by increasing the
rate of photon absorption. However, the decrease of output after about 3 min was
considered as breaking the electron cycle by the evaporation of the electrolyte solution so
Project Code: MQPBD4JPD1
40
that no aqueous medium for the redox reaction to take place; thus, electrons could not
regenerate in the organic dye.
For cells which used saturated phthalocyanines solution as the dye, the increase of
output was not that evident, although the temperature increased to 90 °C. This result
could be interpreted as the great efficiency of photon absorbance so that the effect of
temperature increase would not be obvious to observe in this system. Another reason
might be the difference in the viscosity of these two solutions. The raspberry juice has a
higher viscosity compared to phthalocyanine solution; thus, an increase in temperature
might facilitate the permeation of the dye solution into the electron carrier, which
essential will cover a greater surface area and then improve the efficiency of the cell. The
reason of decrease of output would be proposed as the same with that of raspberry cells.
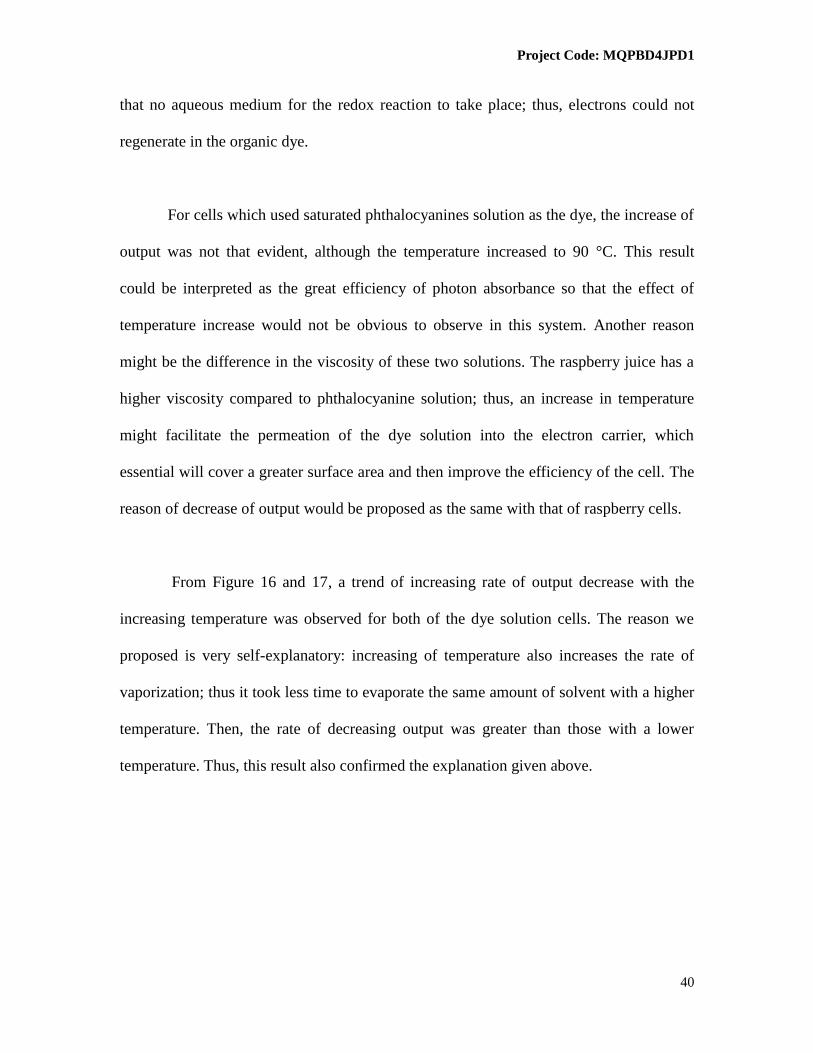
From Figure 16 and 17, a trend of increasing rate of output decrease with the
increasing temperature was observed for both of the dye solution cells. The reason we
proposed is very self-explanatory: increasing of temperature also increases the rate of
vaporization; thus it took less time to evaporate the same amount of solvent with a higher
temperature. Then, the rate of decreasing output was greater than those with a lower
temperature. Thus, this result also confirmed the explanation given above.
Project Code: MQPBD4JPD1
41
Figure 16: The result of Rasberry Cells. Series 1 is 40-50 °C, series 2 is 60-70°C, series 3 is 80-90 °C.
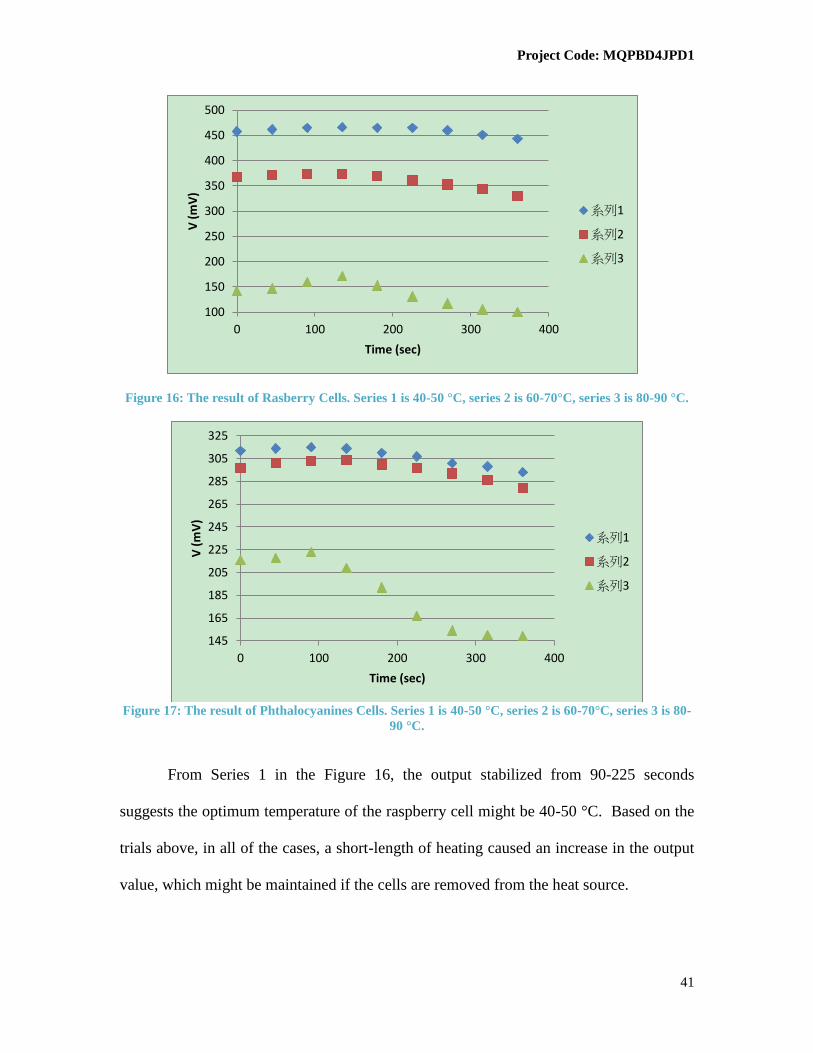
Figure 17: The result of Phthalocyanines Cells. Series 1 is 40-50 °C, series 2 is 60-70°C, series 3 is 80-
90 °C.
From Series 1 in the Figure 16, the output stabilized from 90-225 seconds
suggests the optimum temperature of the raspberry cell might be 40-50 °C. Based on the
trials above, in all of the cases, a short-length of heating caused an increase in the output
value, which might be maintained if the cells are removed from the heat source.
100
150
200
250
300
350
400
450
500
0 100 200 300 400
V (
mV
)
Time (sec)
系列1
系列2
系列3
145
165
185
205
225
245
265
285
305
325
0 100 200 300 400
V (
mV
)
Time (sec)
系列1
系列2
系列3
Project Code: MQPBD4JPD1
42
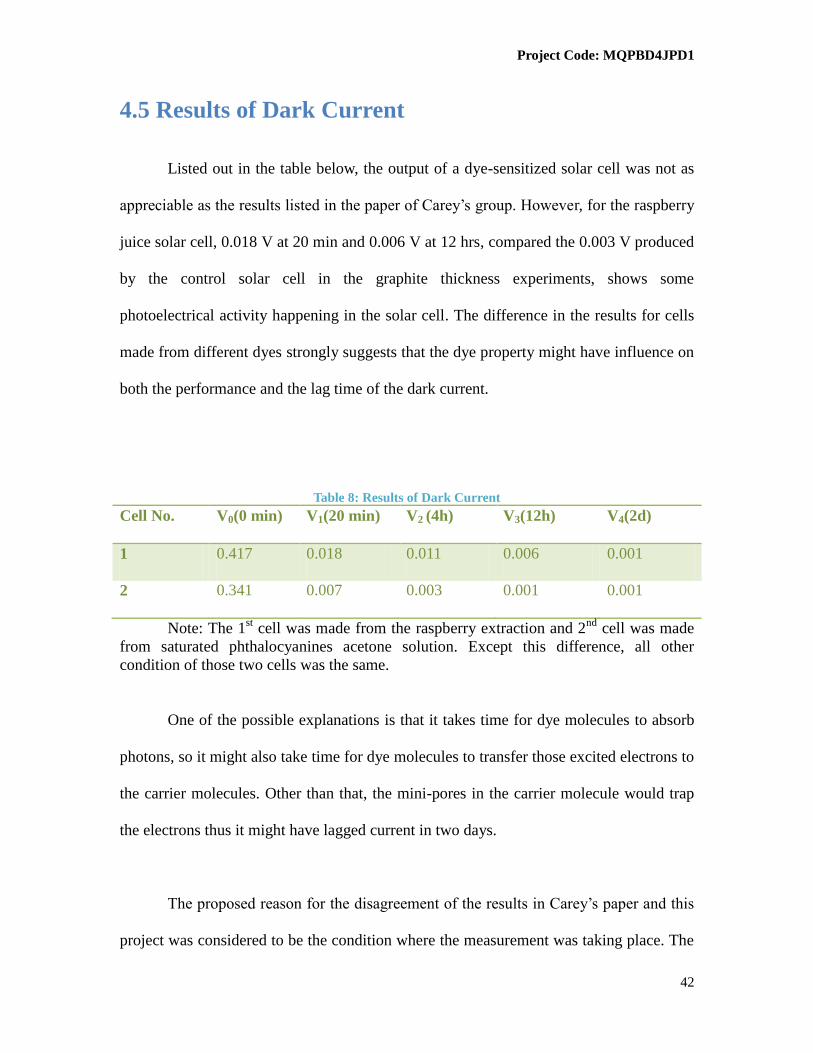
4.5 Results of Dark Current
Listed out in the table below, the output of a dye-sensitized solar cell was not as
pp i bl h l li in h p p of C y’ g o p. How v r, for the raspberry
juice solar cell, 0.018 V at 20 min and 0.006 V at 12 hrs, compared the 0.003 V produced
by the control solar cell in the graphite thickness experiments, shows some
photoelectrical activity happening in the solar cell. The difference in the results for cells
made from different dyes strongly suggests that the dye property might have influence on
both the performance and the lag time of the dark current.
Table 8: Results of Dark Current
Cell No. V0(0 min) V1(20 min) V2 (4h) V3(12h) V4(2d)
1 0.417 0.018 0.011 0.006 0.001
2 0.341 0.007 0.003 0.001 0.001
Note: The 1st cell was made from the raspberry extraction and 2
nd cell was made
from saturated phthalocyanines acetone solution. Except this difference, all other
condition of those two cells was the same.
One of the possible explanations is that it takes time for dye molecules to absorb
photons, so it might also take time for dye molecules to transfer those excited electrons to
the carrier molecules. Other than that, the mini-pores in the carrier molecule would trap
the electrons thus it might have lagged current in two days.
Th p opo on fo h i g m n of h l in C y’ p p n hi
project was considered to be the condition where the measurement was taking place. The
Project Code: MQPBD4JPD1
43
v m w ppli wh n C y’ g o p m h k n . How v , o
limit of technology, time and budget, my group could not afford the vacuum
measurement.

Project Code: MQPBD4JPD1
44
CHAPTER 5. CONCLUSION AND RECOMMENDA-TION
Desired dye-sensitized solar cell system based on TiO2 and raspberry or
phthalocyanines was constructed and characterized after three terms of works. By the
end of the final term, I have successfully accomplished the characterization of graphite
layer dependence, titanium (IV) oxide layer dependence, temperature dependence and
dark current characterization.
My control experiment confirmed the necessity of the graphite layer and
discovered the over-coating of the graphite would not affect the output of the experiment
in an evident amount. My controlled experiment discovered the optimum thickness of
TiO2 layer would be 0.018-0.021 mm to this system and any layer thicker than this would
potentially decrease the output of the cell by blocking the photon transfer, proposed by
me.
In the temperature dependence frontier, I discovered the increase of temperature
to 40 °C results in the optimum temperature of raspberry cells. And the general trend of
the temperature dependence is increase of output over the first several data points and
then sharply decrease after the maxima achieves. Raspberry cells tended to increase more
than phthalocyanine cells.
The dark current was observed in this project with a shorter lasting time and
smaller amount compared to the published result, which was considered due to the

Project Code: MQPBD4JPD1
45
vacuum conditions in the paper and fine technology they used in the project. However,
the existence of dark current was confirmed by this project.
The project overall was considered successful resulting from the data which
agreed with the published results and the trends I have concluded from controlled
experiments. On the other hand, due to the limitation of several factors, the dark current
could not be measured at vacuum condition and different dye solution could not be
incorporated in this project.
In the future project, the dependence and dark current using different dye samples
should be determined to discover any dependence between the last time or the magnitude
of dark current and the identity or character of the dyes. Heating experiment should be
reproduced to confirm the general trend of my results. And any further thoughts on this
project should be considered and turned into control experiment to carry out.

Project Code: MQPBD4JPD1
46
References
1. K. Tennakone, G.R.R. Kumara, I.R.M. Kottegoda, V.S.P. Perera, Chem. Commun.
15 (1999).
2. Exxon Mobil. "2007 Summary Anual Report." Exxon Mobil, 2007. Web. 13 Nov.
2011. <http://www.exxonmobil.com/corporate/files/ news_pub_sar_2007.pdf>.
3. Perlin, John (2004). "The Silicon Solar Cell Turns 50"
4. National Renewable Energy Laboratory. Retrieved 5 October 2010.
5. B. O’R g n, M. Grätzel, Nature 335 (1991) 737;
6. Michael Grätzel, Journal of photochemistry and photobiology, 2003
7. Pentland, William. "Solar-Pow T bl o T g R l S n ”. Fo b . om
LLC. 17 Nov. 2010. Web. 13 Nov. 2011.
<http://www.forbes.com/sites/williampentland/2010/11/17/islate/>.
8. Smil (2006), p. 12
9. Brabec. C. J., Sariciftci. N. S., Hummelen J. C. (2001). Adv. Funct. Mater.
10. Carlson, D., Wronski, C. (1985). Topics in Applied Physics: Amorphous
Semiconductors: Amorphous silicon solar cells
11. Ma, W.L, Yang. C.Y, Gong. X, Lee. K, Heeger. A. J. (2005), Adv. Funct. Mater.
12. Milliron et al., Nature 430, 190 (2004).
13. n , S. & Serdar Saiciftci, N. (2008). Hybrid Solar Cells, Inorganica Chimica
Acta, Vol. 361, pp. 581-588.
14. Coakley, K.M. et al. (2005). "Ordered Organic–Inorganic Bulk Heterojunction
Photovoltaic Cells" MRS Bulletin: 37–40.
15. Nelson, J. Phys. Rev. B 59 (1999) 15374–15380.

Project Code: MQPBD4JPD1
47
16. WebElements. "Titanium Compounds: Titanium Dioxide." WebElements. The U
of Sheffield, 1992. Web. 28 Jan. 2012.
17. Kohjiro Hara, Mitsuhiko Kurashige, Yasufumi Dan-oh, NJC letter, 2003
18. Tributsch, H (2004). "Dye sensitization solar cells: a critical assessment of the
learning curve".Coordination Chemistry Reviews 248 (13–14): 1511.
19. Petit, A.; Loupy, A.; Maiuard, P.; Momenteau, M. (1992). "Microwave Irradiation
in Dry Media: A New and Easy Method for Synthesis of Tetrapyrrolic
Compounds". Synth. Commun. 22 (8): 1137–1142.
20. Gerd Löbbert "Phthalocyanines" in Ullmann's Encyclopedia of Industrial
Chemistry, 2002, Wiley-VCH, Weinheim.
21. "Phthalocyanine Materials - Synthesis, Structure and Function", Neil B.
McKeown, Cambridge University Press 1998
22. J. Fang, L. Su, J. Wu, Y. Shen, Z. Lu, New J. Chem. 270 (1997) 145.
23. R. Plass, S. Pelet, J. Krüger, M. Grätzel, U. Bach, J. Phys. Chem. B 106 (2002)
7578–7580.
24. K. Hara, K. Sayama, Y. Ohga, A. Shinpo, S. Suga and H. Arakawa, Chem.
Commun., 2001, 569–570.
25. K. Hara, Y. Tachibana, Y. Ohga, A. Shinpo, S. Suga, K. Sayama, H. Sugihara and
H. Arakawa, Sol. Energy Mater. Sol. Cells, 2003, 77, 89–103.
26. K. Hara, T. Sato, R. Katoh, A. Furube, Y. Ohga, A. Shinpo, S. Suga, K. Sayama,
H. Sugihara and H. Arakawa, J. Phys. Chem. B, 2003, 107, 597–606.
27. K. Hara, M. Kurashige, S. Ito, A. Shinpo, S. Suga, K. Sayama and H. Arakawa,
Chem. Commun. 2003, 252–253.

Project Code: MQPBD4JPD1
48
28. Carey, M. J, et al. Proceeding of SPIE, 2004 Vol. 5215, pp 32–40.
29. B. A. Gregg, S.-G. Chen and S. Ferrere, "Enhanced dye-sensitized
photoconversion efficiency via reversible production of UV-induced surface states in
nanoporous TiO2", J. Phys. Chem. B, 107, 3019-29, 2003.
30. Gratzel, Michael, Ingo. Chem., 2005, 44, 2012-6841-6851
31. A. Shaabani, J. Chem. Research (S) 1998, 672-673
32. Wu X, Gu L, Prior RL, McKay S. Journal of Agricultural and Food
Chemistry,2004, 52 (26): 7846–56
33. Smestad, G. Institute for Chemical Education, Madison, WI, 1998.
http://ice.chem.wisc.edu/Catalog/SciKits.html
34. F. H. Moser, A. L. Thomas, Phthalocyanine Compounds, Reinhold, New York
1963
35. Cherepy, Nerine J.; Smestad, Greg P.; Grätzel, Michael; Zhang, Jin Z. (1997). J.
Phys. Chem. B 101 (45), 9342–51.